formulation and evaluation of preserved products using an exploited frui1
TRANSCRIPT

FORMULATION AND EVALUATION OF PRESERVED PRODUCTS
USING AN EXPLOITED FRUIT [KIWI FRUIT (ACTINIDIA
DELICIOSA)]
A thesis submitted as partial fulfillment for the award of
BACHELOR OF TECHNOLOGY
In
FOOD TECHNOLOGY
2010-2014
By
S.PRIYANKA
Roll no. 1008-10-804-012
Under the guidance of
DR. JYOTI KIRAN SINGH (Assistant Professor)
And
Co-Guide: Desham Kodandaram Reddy (Assistant Professor)
DEPARTMENT OF FOOD TECHNOLOGY
UNIVERSITY COLLEGE OF TECHNOLOGY,
OSMANIA UNIVERSITY
HYDERABAD –500007.
2010-2014
1

DECLARATION
I declare that the research work in this thesis entitled
“ Formulation and Evaluation of Preserved Products using an Exploited Kiwi
fruit (Actinidia Deliciosa ) ”, is a record of bonofide work carried out by
me independently. The results embodied in this work have not been
submitted to any other University or Institute for the award of any degree
or diploma.
S.PRIYANKA Roll no. 1008-10-804-012
2

CERTIFICATE
This is to certify that the project work entitled “Formulation and
Evaluation of Preserved Products using an Exploited Kiwi fruit
(Actinidia Deliciosa)” is being submitted by S.PRIYANKA for the award
of the degree of Bachelor of Technology in Food Technology as a
record of bonofide work carried out by me independently. This work has
not been submitted in part or in full to this Institution or any other
Institution for the award of any degree or diploma.
Head of Department External Examiner
(Dr. Kavitha Waghray)
3
Principal
(Dr. CHINTA SAILU)
Project Guide
(ASST PROF. JYOTI KIRAN SINGH)

ACKNOWLEDGEMENT
I take immense pleasure in thanking DR.JYOTI KIRAN SINGH
(Assistant Professor), Food Technology, University College of Technology,
for her guidance and cooperation extended to me to enable the completion
of this project work.
I also thank Desham Kodandaram Reddy(Assistant Professor),
Department of food technology, University College of technology for his
continuous guidance and encouragement during the course of project.
I would also like to thank the entire Faculty of Food Technology at
University College of Technology and my Parents (my family) for their
continuous support, which helped me in this endeavour.
4

ABSTARCT
The aim of study is to make preserved product using KIWI FRUIT
(ACTINIDIA DELICIOSA). Kiwi fruit is highly nutritious fruit and it was
decided to preserve for human consumption throughout the year. Kiwifruit
is an excellent source of vitamin C as well as a very good source of
dietary fiber. It is also a good source of the mineral potassium. This
study is focussed on preservation of kiwi fruit as a jam using different
formulations. Using the kiwi fruit, jam is prepared for the production of a
preserved product. Here, along with kiwi fruit, another fruit which is rich
in pectin content is utilised i.e. apple. Apple is incorporated in the
preparation of kiwi jam to set the product easily. Hence, the kiwi apple
jam is developed and the quality parameters have been assessed. Sensory
evaluation, nutritive analysis such as iron, potassium, calcium and vitamin C
(ascorbic acid); and physicochemical properties such as titrable acidity and
pH, total soluble solids, moisture content and ash values are determined
according to the standard methods.
The storage stability was good in jam with respect to flavor and consistency.
The microbial load of Jam was under the limit during storage. Hence, the
prepared Jam was safe and fit for consumption.
5

INDEX
TOPIC NAME PAGE NO.
1. INTRODUCTION 8
1.1 History 8
1.2 Production of kiwi fruit 11
1.3 Nutrition of kiwi fruit 13
1.4 Health benefits of kiwi fruit 14
2. MATERIALS AND METHODS 16
2.1 Essential Ingredients 16
2.2 Preparation method of jam 18
2.3 Testing for the setting point of jam 21
3. PHYSICOCHEMICAL ANALYSIS OF JAM 22
3.1 Determination of moisture content 23
3.2 Determination of titrable acidity 24
3.3 pH value 24
3.4 Determination of ash content 25
3.5 Determination of acid insoluble ash 26
3.6 Total soluble solids 27
3.7 Total sugars and reducing sugars 27
6

4. NUTRIENT ANALYSIS OF JAM 28
4.1 Estimation of iron content 28
4.2 Estimation of calcium content 29
4.3 Estimation of potassium content 30
4.4 Estimation of Vitamin C 32
5. ORGANOLEPTIC PROPERTIES OF JAM 33
5.1Sensory evaluation 33
5.2Quality Control 37
6. RESULTS AND DISCUSSIONS 38
7. CONCLUSIONS 42
8. REFERENCES 43
7

1. INTRODUCTION
The kiwifruit, often shortened to kiwi in many parts of the world, is the
edible berry of a woody vine in the genus Actinidia. The most common
cultivar group of kiwifruit is oval, about the size of a large hen's egg
(5–8 centimetres (2.0–3.1 in) in length and 4.5–5.5 centimetres (1.8–2.2 in)
in diameter). It has a fibrous, dull greenish-brown skin and bright green
or golden flesh with rows of tiny, black, edible seeds. The fruit has a
soft texture and a sweet but unique flavour, and today is a commercial
crop in several countries, such as Italy, New Zealand, Chile, Greece and
France.
1.1 HISTORY:
Kiwifruit is native to southern China where it has been declared a
National Fruit of China. Other species of Actinidia are native to India,
Japan, and South Eastern Siberia. The seeds were planted in 1906 by a
Wanganui nurseryman, Alexander Allison, with the vines first fruiting in
1910. The first commercial planting of Chinese gooseberries occurred in
1937 in New Zealand by the orchardist Jim MacLoughlin. The fruit
proved popular with American servicemen in New Zealand during World
War II . In 1952 MacLoughlin partnered with the New Zealand Fruit
Federation to market and export the fruit in the United States market.
8

Thanks to pioneering research into the transportability of the fruit by
John Pilkington Hudson and others at the agriculture department in
Wellington . This was the first international export of the Kiwifruit.
As the local popularity of this fruit increased, New Zealanders discarded
the local Chinese name for the fruit (yáng táo) in favor of the name
Chinese Gooseberry. After World War II it was marketed under the
name "Melonette". The importer, Ziel & Co, rejected this name because
melons and berries attracted high duties. Jack Turner of produce exporters
Turners and Growers suggested the name "kiwifruit" in 1959 after the
kiwi, New Zealand’s national symbol, as the bird and the fruit share a
similar appearance (small, brown and furry). Kiwifruit has since become
a common name for all commercially grown fruit from the family
Actinidia.
CULTIVARS:
The genus Actinidia contains around 60 species. Though most kiwifruit are
easily recognized as kiwifruit (due to basic shape) their fruit is quite
variable. The skin of the fruit can vary in size, shape, hairiness, and
colour. The flesh can also vary in colour, juiciness, texture, and taste.
Some fruits are unpalatable while others taste considerably better than the
majority of the commercial varieties.
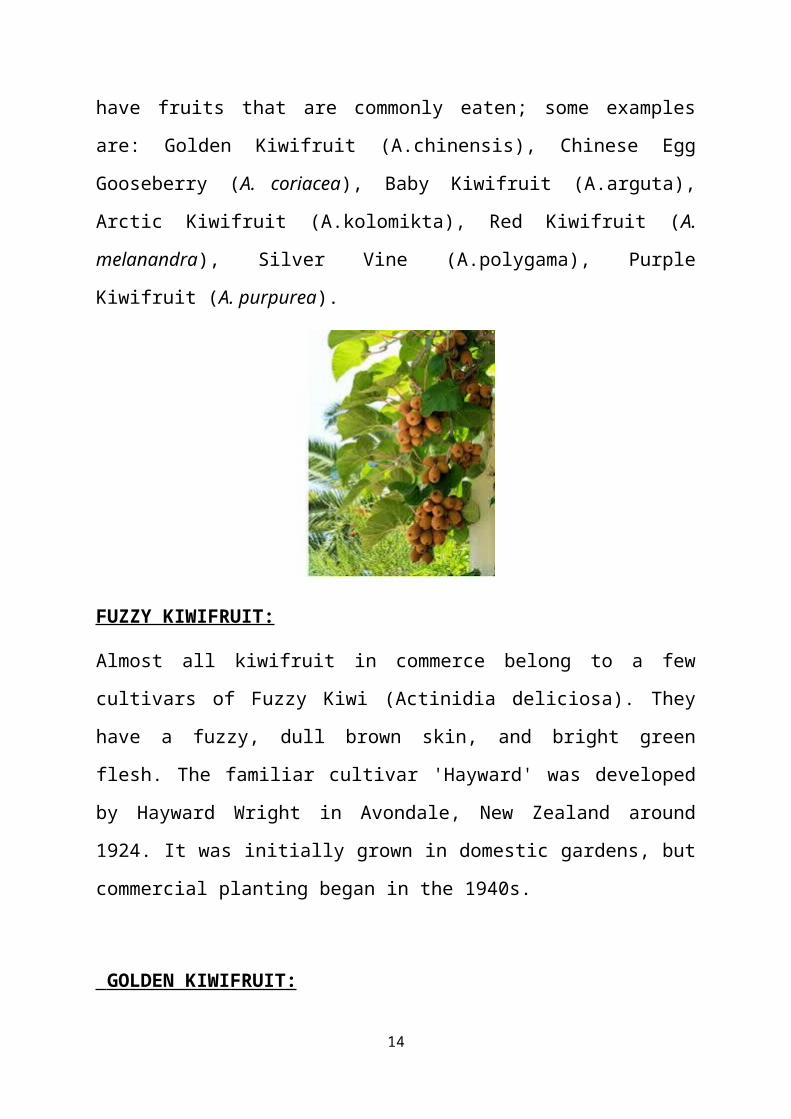
The most common kiwifruit is the Fuzzy Kiwifruit and comes from the species
A.deliciosa. Other species have fruits that are commonly eaten; some examples
are: Golden Kiwifruit (A.chinensis), Chinese Egg Gooseberry (A. coriacea),
Baby Kiwifruit (A.arguta), Arctic Kiwifruit (A.kolomikta), Red Kiwifruit (A.
melanandra), Silver Vine (A.polygama), Purple Kiwifruit (A. purpurea).
9

FUZZY KIWIFRUIT:
Almost all kiwifruit in commerce belong to a few cultivars of Fuzzy Kiwi
(Actinidia deliciosa). They have a fuzzy, dull brown skin, and bright green
flesh. The familiar cultivar 'Hayward' was developed by Hayward Wright in
Avondale, New Zealand around 1924. It was initially grown in domestic
gardens, but commercial planting began in the 1940s.
GOLDEN KIWIFRUIT:
The golden kiwi (Actinidia chinensis) has a smooth bronze skin, with a beak
shape at the stem attachment. Flesh colour varies from bright green to a clear,
intense yellow. This species is sweeter and more aromatic in flavour, the flavour
reminiscent of some subtropical fruit. Its short storage life currently limits its
commercial potential. One of the most attractive varieties has a red 'iris' around
the centre of the fruit and yellow flesh outside. The yellow fruit fetches a higher
market price and, being less hairy than the fuzzy kiwi, is more palatable for
fresh consumption.
10

1.2 PRODUCTION:
Cultivation:
Kiwifruit can be grown in most temperate climates with adequate summer heat.
Where fuzzy kiwi (A. deliciosa) are not hardy, other species can be grown as
substitutes. Kiwifruit is commercially grown on sturdy support structures, as it
can produce several tonnes per hectare, more than the rather weak vines can
support. These are generally equipped with a watering system for irrigation and
frost protection in the spring.
Kiwifruit vines require vigorous pruning, similar to that of grapevines. Fruit is
borne on one-year-old and older canes, but production declines as each cane
ages. Canes should be pruned off and replaced after their third year.
Pollination
Most of the plants require a male plant to pollinate a female plant for the female
plant to produce fruit. For a good yield of fruit one male vine for every three to
eight female vines is required. Other varieties can self pollinate, but they
produce a greater and more reliable yield when pollinated by male kiwifruit
vines.
Kiwifruit is notoriously difficult to pollinate, because the flowers are not very
attractive to bees. Some producers blow collected pollen over the female
flowers. Generally, the most successful approach, though, is saturation
pollination, where the bee populations are made so large (by placing hives in the
11

orchards) that bees are forced to use this flower because of intense competition
for all flowers within flight distance.
Storage
Firm kiwifruit ripen after a few days to a week when stored at room
temperature, but should not be kept in direct sunlight. Faster ripening occurs
when placed in a paper bag with an apple, pear, or banana. Once a kiwifruit is
ripe, however, it is preserved optimally when stored far from other fruits, as it is
very sensitive to the ethylene gas they may emit, thereby tending to over-ripen
even in the refrigerator. If stored appropriately, ripe kiwifruit normally keep for
about one to two weeks.
Pests and diseases
PSA or "Pseudomonas syringae actinidiae" was first identified in Japan in the
1980s. This strain has been controlled and managed successfully in orchards in
Asia. In 1992 it was found in Northern Italy. In 2007/2008 economic losses
started to be observed as a more virulent strain became more dominant (PSA
V). In 2010 it was found in New Zealand's Bay of Plenty kiwifruit orchards in
the North Island.
Scientists looking into the disease reported in February 2013 they had worked
out the strain of PSA affecting New Zealand kiwifruit originated in China, as
did strains in Italy and Chile.
12

1.3 NUTRITION:
13
Kiwifruit is a rich source of vitamin C (1.5 times the United States DRI per
100 grams) and vitamin K, and a good source of dietary fibre and vitamin
E. The fruit and skin contain flavonoids, actinidain, and adhered pollen, which
may produce irritation in the mouth and throat some allergic individuals.
Kiwifruit seed oil contains on average 62% alpha - linolenic acid, an omega 3-
fatty acid. Usually a medium size kiwifruit provides about 46 calories, 0.3 g fat,
1 g protein, 11 g carbohydrates, and 2.6 g dietary fibre found partly in the edible
skin. Kiwifruit is often reported to have mild laxative effects, due to its
significant levels of dietary fibre.
Kiwifruit contains carotenoids, such as provitamin A beta carotene, leutein and
zeaxanthin.
Kiwifruit components, possibly involving vitamin E and omega-3 fatty acids
from its numerous edible seeds, have potential properties of a natural blood
thinner. A study performed at the University of Oslo in Norway reported that
consuming two to three kiwifruit daily for 28 days significantly reduced platelet
aggregation and blood triglyceride levels (similar to popular mainstream aspirin
therapy), potentially reducing the risk of blood clots.
1.4 HEALTH BENEFITS:
Kiwi fruit has a brown hairy peel with white pulp and green flesh. It has tiny
black seeds and green creamy and yummy flesh. Immature fruits are hard while
mature ones are softer and yield to little pressure. They are full of vitamin C
and act as good appetizers in salads, fish, meat dishes, puddings, cakes and
pies. However most of us are unaware about the varied health benefits of this
delicious fruit.
The fruit plays an important role in facilitating weight loss and promotes
general health and wellness.
14

Owing to anti-oxidant properties, kiwi fruit is effective in protecting against
Age-Related Macular Degeneration (ARMD).
Kiwi fruit has more vitamin C than equal amount of oranges. Children fed 5-7
portions of kiwi fruit developed 44 percent less chances of being affected by
wheezing as compared to those who were fed once a week, according to an
Italian study published in the Thorax, an International Journal of Respiratory
Medicine (BMJ group). Another study published in the Asia Pacific Journal of
Clinical Nutrition found that kiwi fruit consumption could significantly
improve sleep quality in adults with sleep problems.
Eat this delicious fruit by peeling and slicing it or add it to a fruit salad. Use it to
make chutney or blend it to prepare a chilled soup – whatever way you use it,
the nutritional benefits remain the same.
Kiwi fruit, with its tangy-sweet refreshing flavour, is ideal for daily
consumption. Cut, scoop out and relish the delicious flesh that bursts with a
tangy, juicy taste. It can be a part of every food course and can be used in fruit
salads, desserts, smoothies, jams, chutneys or curries.
Kiwi fruit stands number one in nutrient content compared to 27 other fruits. It
is packed with twice the amount of Vitamin C — compared to oranges (per 100
mg) — and has twice the amount of nutrients — compared to apples (per 100
mg). Kiwi fruit is an excellent source of Vitamin E, fibre, potassium, folic acid,
carotenoids, antioxidants and trace minerals. The exotic Kiwi fruit jam, popular
in New Zealand, is gaining popularity elsewhere in the world.
15

2. MATERIALS AND METHODS:
Food Preservation has an important role in the conservation and better
utilization of fruits and vegetables. In order to avoid glut and utilize the surplus
during the season, it is necessary to employ methods to extend storage life, for
better distribution, to preserve them for utilization in the off-season both in
large scale and home scale.
Jam is more or less a concentrated fruit processing which has fairly thick
consistency and body. It is also rich in flavour, because ripe fruits which have
developed full flavour are used in its preparation. A great advantage in its
preparation is that it can be prepared in a single operation. Jam is made from
crushed or ground fruit. The end product is less firm than jam, but still holds its
shape.
2.1 Essential Ingredients:
Fruit furnishes the flavour and part of the needed pectin and acid. Some
irregular and imperfect fruit can be used. Do not use spoiled, mouldy or stale
fruit.
Pectin (apple) is the actual gelling substance. The amount of pectin found
naturally in fruits depends upon the kind of fruit and degree of ripeness.
Underripe fruits have more pectin; as fruit ripens the pectin changes to a non-
gelling form. Usually using 1⁄4 underripe fruit to 3⁄4 fully-ripe fruit makes the
best product. Cooking brings out the pectin, but cooking too long destroys it.
High pectin fruits are apples, crab-apples, quinces, red currants, gooseberries,
Eastern Concord grapes, plums and cranberries. Fruits lower in natural pectin
include blueberries, peaches, apricots, pears, raspberries, blackberries and figs.
Here, kiwi fruit, which is low in pectin content, is combined with apple having
high pectin.
16

Through apple pectin is produced. Pectin acts as a carbohydrate that causes
fruit to gel. The advantages of adding pectin are:
1. You can use fully ripen or flavourful fruit.
2. Cooking time is shorter and standardized.
3. You will have more jars on the shelf from the same amount of fruit.
The disadvantage may be that large amount of sugar added with regular pectin
may mask the fruit’s flavour.
Apple
Acid is needed for gel formation and flavour. The amount of acid in fruits also
varies with the fruit and degree of ripeness .When using low-acid fruits in
recipes without commercial pectin, add 1 tablespoon lemon juice or 1/8
teaspoon citric acid for each cup of fruit.
Sugar helps form the gel, serves as a preserving agent, firms the fruit and adds
flavour. Beet or cane sugar can be used. Brown sugar, sorghum and molasses
are not recommended because of their strong flavour and varying degree of
sweetness. Light corn syrup or mild honey can be substituted for part of the
sugar using recipes that specify honey or corn syrup.
17

2.2 PREPARATION OF JAM:
Jam is prepared by boiling the fruit pulp with sufficient quality of sugar to a
reasonably thick consistency, firm enough to hold fruit tissues in position.
The quantity of sugar to be added to the jam in order to attain the desired oBrix
of 68 was calculated as:
Wt of sugar = 0 brix of product – 0 brix of fruit X wt of pulp
100
Ingredients used are:
Kiwi fruit pulp:
Sugar: helps to form the gel, serves as a preserving agent, firms the fruit and
adds flavour. Beet or cane sugar can be used. Brown sugar, sorghum and
18

molasses are not recommended because of their strong flavour and varying
degree of sweetness. Light corn syrup or mild honey can be substituted for part
of the sugar using recipes that specify honey or corn syrup.
Citric acid: is needed for gel formation and flavour. The amount of acid in
fruits also varies with the fruit and degree of ripeness .When using low-acid
fruits in recipes without commercial pectin, add 1 tablespoon lemon juice or 1/8
teaspoon citric acid for each cup of fruit.
2.3 PROCEDURE:
19

Selection and preparation of fruit
Pulp was weighed
Addition of sugar
Cooking the pulp (slow cooking with occasional stirring for 15min)
Addition of citric acid (1tsp) + salt (1pinch)
Judging the end point (TSS-68.5% using refractometer ABBE)
Packing (fill the hot jam into clean, dry sterilized glass container)
Cooling
Stored in refrigerator
2.4 TEST FOR DONENESS:
A big challenge in making jam is to know when it is done.
20

Spoon or Sheet Test: Dip a cool metal spoon in the boiling jam mixture. Lift
the spoon above the kettle out of the steam. Turn the spoon so syrup runs off the
side. If the syrup forms two drops that flow together and fall off the spoon as
one sheet, the jam should be done.
Refrigerator Test: Pour a small amount of boiling jam on a plate. Put it in the
freezing compartment of the refrigerator for a few minutes. If the mixture gels,
it should be done. Remove jam mixture from the heat while conducting this test,
otherwise the mixture will overcook.
Kiwi Apple Jam
3. PHYSICOCHEMICAL PROPERTIES OF JAM:
21

Knowledge of the physicochemical properties of the food is fundamental in
analysing the characteristics of food during its processing. The study of these
food properties and their responses to process conditions is necessary because
they influence the treatment received during the processing and also because
they are good indicators of other properties and qualities of food.
In the present investigation, certain physicochemical characteristics of the
prepared kiwi apple jam such as total solids and soluble solids, acidity and pH
value, moisture, and ash value are to be analysed according to the standard
methods to ensure the quality of the products.
PFA specifies that jam is a product obtained by processing fresh fruits,
canned, dried, fruit pulp with water, sugar, dextrose, invert or liquid glucose
either singly or in combination by boiling to a suitable consistency.
The analysis of jam for various properties was done using an aqueous solution
of the sample. This was prepared by weighing 25gm of sample and dissolving it
in 200ml of water. The aqueous solution was kept on boiling water bath for one
hour. The solution was cooled and diluted to 250ml with distilled water, filtered
and used for analysis.
For the prepared jam, total solids and soluble solids are to be determined.
The figure for soluble solids help in determining the fruit content of the
jam and also helps to prevent the growth of mould and yeast.
Acidity value is a measure of stability and shelf life of jam. It is due to
the organic acids in fruits and those which are added while making the
jam. The setting quality of jam is improved by adequate pH maintenance.
The ash value is mainly due to potassium and phosphorous and the
composition of it. It is the measure of fruits and fruit juice content. A low
value indicates deficiency of fruit or excess of sugar.
3.1 DETERMINATION OF MOISTURE CONTENT:
22

Apparatus:
a) Petriplate dishes.
b) Hot air oven.
c) Weighing balance.
d) Desiccator containing efficient desiccant such as phosphorus
pentoxide or calcium chloride.
Procedure:
Weigh accurately about 5 grams of sample in a previously dried and
tared moisture dish. Place the dish in the hot air oven maintained at 105oC
temperature and dry atleast for 2 hours. Cool in a dessicator and weigh.
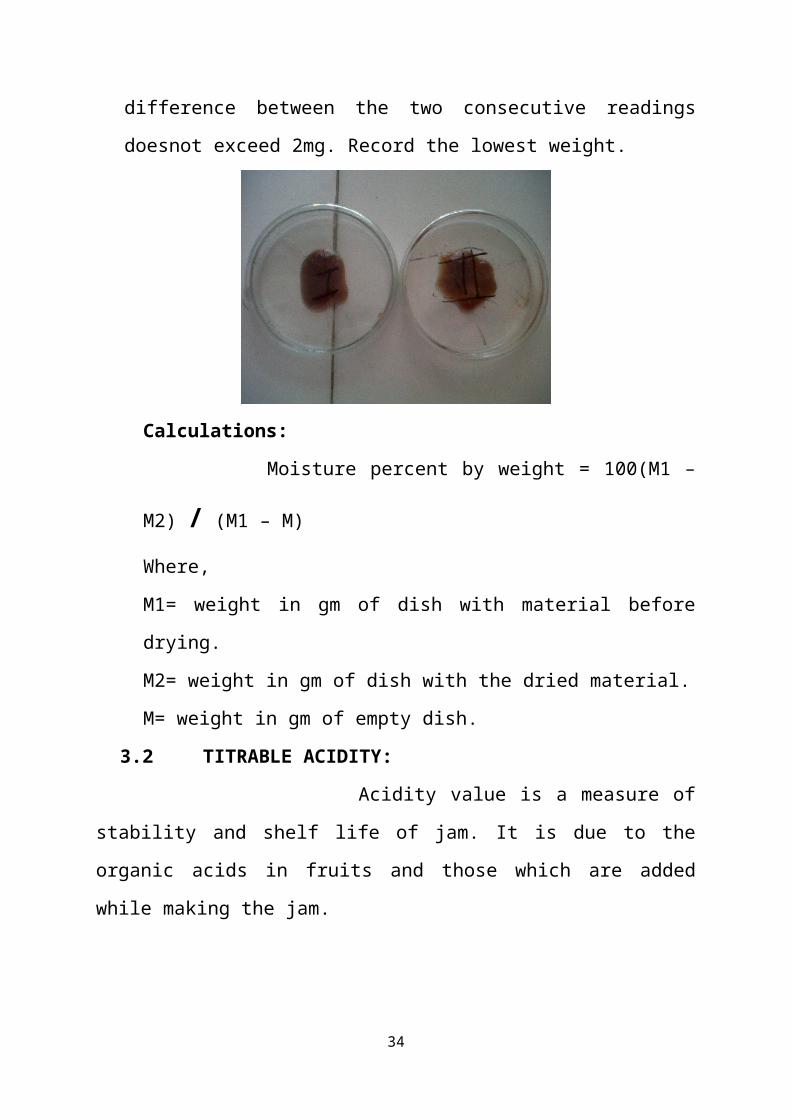
Repeat the process of heating, cooling, and weighing untill the difference
between the two consecutive readings doesnot exceed 2mg. Record the
lowest weight.
Calculations:
Moisture percent by weight = 100(M1 – M2) / (M1 – M)
Where,
M1= weight in gm of dish with material before drying.
M2= weight in gm of dish with the dried material.
M= weight in gm of empty dish.
3.2 TITRABLE ACIDITY:
23

Acidity value is a measure of stability and shelf life of jam. It is due
to the organic acids in fruits and those which are added while making the jam.
Take one g blended jam and dissolve it in 20 ml distilled water, add two to
three drops of phenolphthalein indicator then titrate it with 0.1 N NaOH till
pink colour appears.
Titrable acidity can be calculated as in Equation:
Ta = (B X 0.1 X 0.064 X 100)
W
Where,
Ta is titrable acidity;
B is reading burette;
W is weight of sample.
3.3 pH VALUE:
The setting quality of jam is improved by adequate pH maintenance. pH is a
measure of acidity and the pH scale is calibrated from 1 to 14. Measurements
below 7 indicate an acid solution and measurements above 7 indicate that the
solution is alkaline or basic, while a reading of 7 indicates neutrality.
The pH of foods is used as an indicator of bacterial spoilage. Foods closer to
neutrality are generally more susceptible to microbial spoilage. Fruits are on the
acid side of the scale and therefore slightly more resistant to bacterial spoilage.
24

The pH value of the sample was measured with a digital glass electrode pH
meter at room temperature, which was calibrated prior to sample pH
measurement using buffer solutions of pH value 4.0 and 7.0.
The pH meter was standardized with standard buffer solution 4.0 and 7.0. The
pH was measured by inserting directly the electrodes into 10 ml beaker
containing the sample.
The normal ph range is 3.1-3.2, with extreme values of 3.2-3.4
3.4 DETERMINATION of ASH CONTENT:
Apparatus:
a) Porcelain crucibles.
b) Electric muffle furnace, capable of maintaining a temperature of
625 ± 25 °C. Ensure enough oxygen is admitted to the furnace
chamber to complete removal of the carbonaceous material.
c) Desiccator.
Procedure:
About five grams of the sample was weighed accurately into a
porcelain crucible. This was transferred into a muffle furnace set at 6000C and
left for about 4hours. About this time it had turned into white ash. The crucible
and its content were cooled to about 1000C in air then to room temperature in
desiccators and weighed (A.O.A.C., 1984).The percentage ash was calculated
from the formula below
% Ash content = (weight of Ash / Original weight of sample)*100
25

3.5 ACID INSOLUBLE ASH:
The ash which is insoluble in dilute hydrochloric acid is called acid
insoluble ash. Acid insoluble ash is the measure of sand and other silicon matter
present.
The ash obtained from the above procedure is heated with 25ml of
dilute hydrochloric acid (0.5N) on a hot plate. The obtained solution is filtered
through ash less filter paper (Whatt man filter paper), the residue left in the
filter paper is folded and placed in crucible and transferred into a muffle furnace
set at 6000c and left for 4 hrs to get the acid insoluble ash which is weighed. It
is calculated using the following formulae:
Acid insoluble ash = (W1 / W2) 100
Where,
W1= weight of acid insoluble ash,
W2= initial weight of sample.
3.6 TOTAL SOLUBLE SOLIDS:
For jam total solids and soluble solids are calculated. The figure for soluble
solids help in accessing the fruit content of jam and also helps to prevent the
growth of mould and yeast.
26

The total soluble solids value is defined as the amount of sugar and soluble
minerals present in fruits and vegetables. The method for its determination is by
means of Abbes refractometer.
A hand refractometer is based on the principle of total refraction.
Hand held Refractometer
The refractometer should be checked for accuracy before use for
determining the TSS, a drop of sample is placed on the prism and the
percentage of dry substance is read directly in 0Brix.
3.7 TOTAL SUGARS AND REDUCING SUGARS:
Take 5 g of sample into a beaker and added 100 ml of warm water. The solution
was stirred until all the soluble matters were dissolved and filtered through watt
man filter paper into a 250ml volumetric flask. Pipette 100 ml of the solution
prepared into a conical flask, added 10 ml diluted HCL and boiled for 5 min. On
cooling, neutralize the solution to phenolphthalein with 10% NaOH and make
up to volume in a 250 ml volumetric flask. This solution was used for titration
against Fehling’s solution and readings were calculated using the following
equations:
27

Tt = (4.95 x 250 x 9.5 x 100) / (T x W x 10)
Rs = (T x W x 10 x 100) / 49.5 x 250
Where, Tt is total sugar %; T is titre value; Rs is reducing sugar %.
Non-reducing sugar was estimated as the difference between the total sugar
content and reducing sugar content.
4. NUTRIENT ANALYSIS OF JAM:
Kiwi fruit is rich in vitamins such as vitamin C, and also in dietary fibre.
Some minerals like potassium, calcium and iron. These different nutrients can
be analysed by using the standard methods available.
4.1 Estimation of Iron:
The iron in food is determined by converting the iron into ferric
form using oxidizing agents like potassium per sulfate or hydrogen peroxide
and treating there after with potassium thioxepnate to form the red ferric
thiocyanate which is measured calorimetrically at 540nm.
Procedure:
Take 0.5, 1, 1.5….. upto 3 ml of working standard of iron in different test
tubes and 1ml to 30% H2SO4 , 1ml of potassium per sulfate solution into all test
28

tubes. Add distilled water 6.5, 6, 5.5…… upto 3.5ml from s1 to s6. Then add
1.5ml of 40% KCNS solution to each tube, the red colour that developed is
measured within 20min at 540nm and total volume in tubes should be 10ml.
For sample, take 0.5ml of sample (mineral solution) in triplicates, add 1ml of
30% H2SO4, 1ml of potassium per sulfate solution, and distilled water 6ml and
1.5ml of KCNS solution to read within 20min at 540nm.
Formulae:
Iron (mg/100gm) =
O.D of sample x concentration of standard x total volume of ash solution x 100
O.D of standard x volume of solution taken x Weight of sample taken for ashing
4.2 Estimation of calcium:
Calcium is precipitated as oxalate and is titrated with standard KMnO4.
Procedure:
Sample:
Take 2ml of mineral solution into a 15ml centrifugal tube. Add 2ml of
distilled water and 1ml of 4% ammonium oxalate solution and mix thoroughly
and leave overnight. Again the contents are mixed and centrifuged for 5min at
1500rpm. The supernatant liquid is poured off and the centrifuge tube is drained
by inverting the tube for 5min on a rack (care should be taken not to disturb the
precipitate). The mouth of centrifuge tube is wiped with a piece of filter paper.
The precipitate is stirred and the sides of the tubes are washed with 3ml dilute
ammonia. It is centrifuged again and drained as before. The precipitate is
washed once more with dilute ammonia to ensure complete removal of
29

ammonium oxalate. The precipitate is dissolved in 2ml of 1N H2SO4. The tube
is heated by placing it in a boiling water bath for 1min and titrated against
0.01N KMnO4 solution to a definite pink colour persisting for at least 1min.
Blank:
Take 2ml of 1N H2SO4 heat and titrate against KMnO4 solution till pink
colour is obtained.
Formulae:
1ml of 0.01N KMnO4 is equivalent to 0.2004 mg of Ca.
mg of Ca/100gm of sample =
Titre value x 0.2 x total volume of ash solution x 100
Volume taken for estimation x weight of sample taken for ashing
4.3 Estimation of Potassium:
In acid solution, potassium is precipitated as the yellow double
cobalt – nitrate salt which is dissolved in hot dilute acid and titrated with
standard potassium permanganate. Since the end point is indeterminate, a
standard quantity of sodium oxalate is added at the end of the titration to
produce a sharp end point.
Reagents:
40% Sodium acetate [NaC2H3O2 .3H2O] solution.
30

Sodium cobalt nitrite solution [ Na3CO(NO6)]
12% sulphuric acid (v/v)
acetone – water mixture
dry acetone
0.01N sodium oxalate solution [Na2C2O4]
potassium permanganate
Normality of KMnO4 = ml Na2C2O4x normality of Na2C2O4
ml of KMnO4
Procedure:
Measure one ml of ash solution into a 15ml of centrifuge tube. Add
3ml of water, 1ml sodium acetate solution and 1ml of sodium cobalt nitrate
solution, the last being added drop by drop. Mix and allow to stand for two
hours at 50C. Centrifuge at 1000g for 15min and decant the supernatant liquid.
Add 5 ml of acetone – water mixture, mix, centrifuge for 15 min and decant the
wash solution. Repeat the washing procedure using acetone. Evaporate the
acetone by allowing the precipitate to stand for few minutes. Add a little
standard potassium permanganate from a burette, and then add 2ml of dilute
H2SO4. complete the reaction by adding permanganate from the burette with a
tube set in the container of boiling water and with constant shaking, always
maintaining an excess of permanganate. When the precipitate is completely
dissolved and a permanent pink colour is obtained, add 2 ml of sodium oxalate
solution and titrate to an end point.
True titration value = (ml of 0.01N KMnO4 solution) – (ml of 0.01N Na2C2O4
solution).
31

4.4 Vitamin C:
Fruits are important source of ascorbic acid. The ascorbic acid
content decreased during storage due to oxidation of ascorbic acid to
dehydroascorbic acid.
Ascorbic acid was determined by the 2, 6-dichlorophenol indophenol titration
procedure. Ascorbic acid was extracted using an acetic acid and metaphosphoric
acid solution. The extracts were transferred with distilled water into a 50 ml
volumetric flask and made up to the mark with more water and filtered rapidly.
The filtrate was run from a burette into a test tube containing one drop of dilute
acetic acid and 1ml of the redox dye, 2, 6- dichlorophenol indophenol solution.
The volume of extract required to decolorize the dye was noted. The titration
was repeated using standard ascorbic acid solution (1 mg pure vitamin per 100
ml) in place of the jam and fruit extracts.
Ascorbic acid per 100g of jam or pulp is calculated as:
% ascorbic acid = (w x 100) / 100
w is volume of dye.
5. ORGANOLEPTIC EVALUATION OF JAM :
Sensory evaluation offers the opportunity to obtain a complete analysis of the
various properties of food as perceived by human sense. Sensory evaluation is
an important and best method for evaluating new products developed which
provide quality measure and production control..
32

5.1 Sensory Evaluation:
Sensory evaluation – A scientific discipline used to evoke, measure, analyse and
interpret reactions to those characteristics of foods and materials as they are
perceived by the senses of sight, smell, taste, touch and hearing. Sensory
evaluation was one of the earliest methods of quality control and it its still
widely used in industry. However, the level of application depends on the
situation. Sensory judgement is expressed by the components like stickiness,
firmness and bulkiness. Here, the acceptability of the treatments was evaluated
by a panel of 10 members. They assigned scores for appearance, taste, flavour,
texture, colour, spreadability, after taste. The overall quality score was taken as
the combined score of the above attributes.
Sensory evaluation standards are instrumental in the assessment of
consumer products by the use of the human senses (sight, smell, taste, touch and
hearing). The discipline of sensory analysis requires the use of a panel of human
evaluators, where in test results are recorded based on their responses to the
products under test. Statistical analysis is then employed to generate inferences
and insights regarding the product. These sensory evaluation standards help
consumer goods developers and manufacturers in the evaluation of their goods
to ensure product quality, consumer satisfaction and marketing success.
The human senses in the sensory evaluation:
The sensory properties of foods are related to three major attributes:
1. Appearance - colour, size, shape
2. Flavour – odour, taste and
3. Texture - mouthfeel, spredability.
33
These attributes are expressed as a continuum and not as finite properties. It is
impossible to rate each one individually unless special precautions are taken,
blindfolds, nose clips, coloured lights, purees.
Four variables affect sensory evaluation:
The food
The people
The testing environment
Methods
Sensory evaluation terminology includes:
Sensory evaluation
Sensory analysis
Organoleptic analysis
Taste testing
Psychophysics
Subjective evaluation
Advantages:
Gives real answer regarding consumer quality
Relatively cheap process(depending on how it is done)
Rapid
Many applications
Objective methods are more reliable, accurate and reproducible. How
they must be correlated to sensory evaluation to indicate a consumer
response.
Disadvantages:
Time consuming
34

Expensive to run
Method selection
Analysis
Interpretation
Applications of sensory evaluation:
Product development
Product matching
Product improvement
Human possess about 30 different senses. However, the sensory performance of
foods are perceived through the senses of
Sight
Smell
Taste
Touch
Hearing
Sensory Characteristics:
Appearance-colour being most important (kids)
Colour is exterior surface
Interior appearance –lumps, air cells, etc.
Appearance and colour features should be included on sensory testing
forms
Aroma –second most characteristic
Aroma ‘advertises’ food
Consider proper temperature when evaluating food aroma
Flavour –taste and aroma mix to form flavour
Temperature is critical to extract flavour and aroma
35

Flavour potentiator–compound that enhances flavour without adding a
flavour of its own (MSG)
Flavour inhibitors –substance that blocks perception of a taste (milk
protein or starch on hot pepper)
Texture –mouthfeel–how a food feels in your mouth
–Mouthfeel–must clearly define what panelist is to evaluate
(sticky, smooth, astringent)
Tenderness –amount of chewing action to reach a certain consistency
Types of Tests:
Descriptive –provide information on selected characteristics
Affective -subjective attitude to a product. Acceptability or preference.
Follows discriminative or descriptive testing
Difference –determine whether there are detectable differences between
products
Difference Test:
–detect differences between products
-also called discrimination tests
-Test sensitivity of judges to a certain trait
-Try to match experimental product with control
-New product formulations
There are two types of difference tests:
Paired comparison
Specific characteristic tested: ‘which sample is more sweet”
Simple paired comparison between two different concentrations of kiwi apple
jam is done using a nine – point hedonic scale is carried out by untrained
panelists. The scale ranged from like extremely (9) to dislike extremely (1). The
36

parameters evaluated were colour, taste, flavour, spreadability and overall
acceptability. Hedonic rating relates to pleasurable or unpleasurable
experiences. The hedonic rating test is used to measure the consumer
acceptability of food products. From one to four samples are served to the
panelist at one session. Scales with different ranges and other experienced
phrases can also be used. The results are analysed for preference with data from
large untrained panels.
5.2 Quality Control:
In the United States, food processing regulations require than jams and
jellies are made with 45 parts fruit or juice to 55 parts sugar. The federal Food
and Drug Administration (FDA) mandates that all heat-processed canned foods
must be free of live microorganisms. Therefore, processing plants keep detailed
lists of cooking times and temperatures, which are checked periodically by the
FDA.
Requirements also exist for the cleanliness of the workplace and workers.
Producers install numerous quality control checks at all points in the preparation
process, testing for taste, color and consistency
6. RESULTS AND DISCUSSIONS:
6.1 Physicochemical analyses of kiwi apple jam:
The analyses of jams were made 1 day after processing. The averages of the
duplicate measurements of the analyses of three different samples of jams are
shown in table 1. Jams presented low moisture and had soluble solids mean
values of 69.5, 68.00 and 69.00 °Brix for sample 1(10% apple), sample 2(25%
apple), and sample 3(50% apple), respectively. Sugars in jams contribute to
37

high content of soluble solids, an effect that is essential for the physical,
chemical and microbiological stability and make gelation of pectin possible.
Total sugars and reducing sugars contents of jams ranged between 36.28–42.54
g.100 g-1and 12.38–21.40 g.100 g-1, respectively. Total sugars contents ranged
between 35.00–54.55 g.100 g-1 and reducing sugars ranged between 10.50–
15.50 g.100 g-1for different mixed fruit jams. The total acidity and the pH of
the finished products ranged between 0.87 – 1.19 g.100 g-1 and 3.25-3.48,
respectively. It is known that the acidity and pH of jams should be controlled.
The low acidity (0.3-0.8 g.100 g-1) and low pH (3.2-3.4) contribute to pectin
gelation and increase the stability of the formulated jams. However, the pH
must not be too low (< 3.0) since it could induce deterioration of sensory
quality: excessive acidic flavor, glucose crystallization; granular texture and
exudation phenomenon.
Garcia Martinez et al. (2002) analyzed a commercial traditional kiwifruit jam
and obtained the results of 68.40 °Brix for soluble solids, 0.46 g.100 g-1 for
total acidity and 3.04 for pH and the results of the commercial orange jam
(63.90 °Brix for soluble solids and 3.63 for pH) were similar to the results
obtained for sugar apple jam (63.00 °Brix for soluble solids, and 3.41 for pH).
Table 1:
Parameter Sample 1
(10% apple)
Sample 2
( 25% apple)
Sample 3
(50% apple)
Moisture (%) 18 20 25
Ash value (%) 0.57 0.61 0.55
Acid insoluble ash (%) 0.15 0.21 0.24
38

Titrable acidity (%) 0.92 1.19 0.87
pH value 3.25 3.48 3.40
Total soluble solids
(0Brix)
69.5 68 69
Total sugar and
reducing sugar (g/100g)
39.13
21.40
42.54
19.33
36.28
12.38
6.2 Nutritional analyses of different samples of kiwi fruit jam:
Iron, potassium, and calcium were recorded as 0.38, 2.98, and 0.87 for sample
1, respectively; 0.45, 3.95, and 0.95 for sample 2, respectively; 0.56, 4.79, and
1.54 for sample 3, respectively. Results are presented in Table 2.
Table 2:
Nutrient
(mg/100gm)
Sample 1
(10% apple)
Sample 2
(25% apple)
Sample 3
(50% apple)
Iron (Fe) 0.38 0.45 0.56
Potassium (K) 2.98 3.95 4.79
Calcium (Ca) 1.54 0.95 1.54
Vitamin C
(ascorbic acid)
18.905 15.689 13.987
6.3 Sensory Evaluation of kiwi apple jam:
Mean scores of sensory evaluation are presented in Table 3. Kiwi apple jam had
the highest mean scores for all attributes being compared. The differences in
flavour and spreadability were not statistically significant at the (P > 0.05) 5%
level. The differences in colour, taste and overall acceptability were, however
significant at (P < 0.05) 5% level.
39

Table 3:
Sample Appear-ance
Taste Flavor Texture Color Spread-ability
After
taste
OA
10%apple
7.0 8.0 7.67 8.0 7.0 8.0 6.33 7.0
25%apple
6.17 7.67 7.17 7.35 7.5 8.33 8.0 7.33
50%apple
7.67 7.0 7.0 6.67 7.17 7.0 7.5 7.5
Sensory evaluation indicated that kiwi apple jam with different formulations
(i.e.; change in concentration of apple) was acceptable to consumers. The kiwi
apple jam, however, had the highest mean scores for all attributes being
compared. The differences in flavour and spreadability were not statistically
significant at the (P>0.05) 5% level. The differences in colour, taste and overall
acceptability were, however, significant at (P < 0.05) 5% level. Some assessors
scored kiwi apple jam (sample 1) higher for flavor, texture and spreadability.
The texture of kiwi apple jam (sample 2) had the lowest scores than other
parameters or sensory attributes. Sufficient pectin content contributes to the
spreadability of the kiwi apple jam (sample 2). The color of the product has
been improved with the change in concentration of apple.
40
7. CONCLUSIONS:
Actinidia deliciosa can be used in making jam. The low gel strength of the jam
can be improved by the addition of pectin during processing to attain the
commercially acceptable gel strength or a combination of fruits rich in pectin
(apple) can be used to make up for the deficiency. Optimum gel formation is
reported at pH 3.4 and satisfactory gel formation in tropical fruits is achieved at
41

lower pH range. The combination with other fruits could serve to improve the
flavour and the colour.
8. REFERENCES:
1. Handbook of analysis and quality control for Fruit and Vegetable
products, second edition, by S.Ranganna.
42

2. Grivetti LE Nutritional Success in a Semi-arid Land: Examination of the
Eastern Kalahari, Botswana. Am. J. of Clinical Nutr. 1978; 31: 1204
1220.
3. Ogle BM and LE Grivetti Legacy of the Chameleon: Edible and Wild
Plants in the Kingdom of Swaziland, Southern Africa. A Cultural,
Ecological and Nutritional Study. Part IV Nutritional Analysis and
Conclusions. J. Ecol. Food Nutr. 1985; 17: 41 -64.
4. Humphrey CM, Clegg MS, Keen CL and LE Grivetti Food Diversity and
Drought Survival. The Hausa Example. Int. J. of Food Sci. & Nutr. 1993;
44: 1 16.
5. Smith GC and LE Grivetti Cultural Use of Edible Wild Plants in Burkina
Faso, West Africa. FASEB J. 1994; 8: A183.
6. Aina JO and AA Adesina Suitability of Frozen Indigenous Tropical Fruits
for Jam Processing. Advances in Food Sciences 1999; 2: 15 18.
7. Herzorg F, Farah Z and R Amado Composition and Consumption of
Gathered Wild Fruits in the V-Baoule, Cote D Ivoire. J. Ecol. Food and
Nutr. 1994; 32 (3-4): 181 196.
8. Aina, J.O. and Adesina, A.A. 1991. Quality attributes of jams from low-
usage tropical fruits. Food Chemistry 40 (3): 345-351. A.O.A.C. 1984.
Association of official Analytical chemists official methods, 13th ed,
Washington D.C.
9. Kirk, R.S. and Sawyer, R. 1991. Pearson`s composition and analysis of
food, 9th Ed. Longman, Singapore 221-225.
10.Larmound, E. 1977. Methods for sensory evaluation of foods. Food
Research Central Experimental farm Ottawa Canada.
43

11.Moyls, A.W., Shroclien, C.C. and Atkinson, F.E. 1962. Making jam
commercially. Pub 44, Canada Deprt Agric Pub Ottawa 3-10.
12.Ruck, J.A. 1969. Chemical methods for analysis of fruits and vegetables
products. Station summerland Canadian Research Board, Department of
Agriculture Canada. Woodroof, J.G. and Luh, B.S. 1986.
13.Commercial fruit processing by the AVI Pub Co Inc Westport,
Connecticut 2nd Edition 427-429.
44