fort bowie national historic site visitor studypsu.sesrc.wsu.edu/vsp/reports/243_fobo_rept.pdf ·...
TRANSCRIPT
National Park Service U.S. Department of the Interior Natural Resource Stewardship and Science
Fort Bowie National Historic Site Visitor Study Spring 2011

ON THE COVER Fort Bowie ruins Courtesy of Fort Bowie National Historic Site
Fort Bowie National Historic Site Visitor Study Spring 2011
Mystera Samuelson, Yen Le, Steven J. Hollenhorst Visitor Services Project Park Studies Unit University of Idaho Moscow, ID 83844-1139
December 2011
U.S. Department of the Interior National Park Service Natural Resource Stewardship and Science Fort Collins, Colorado
Fort Bowie National Historic Site – VSP Visitor Survey Study 243 March 1 – May 2, 2011
ii
The National Park Service Natural Resource Stewardship and Science publishes a range of reports that address natural resource topics and applicability to a broad audience in the National Park Service and others in natural resource management, including scientists, conservation and environmental constituencies, and the public.
Data in this report were collected and analyzed using methods based on established, peer-reviewed protocols and were analyzed and interpreted within the guidelines of the protocols.
Views, statements, findings, conclusions, recommendations, and data in this report do not necessarily reflect views and policies of the National Park Service, U.S. Department of the Interior. Mention of trade names or commercial products does not constitute endorsement or recommendation for use by the U.S. Government.
Please cite this publication as:
Samuelson, M., Y. Le, S.J. Hollenhorst. 2011. Fort Bowie National Historic Site Visitor Study Spring 2011. National Park Service, Fort Collins, Colorado.
This report is available from the Park Studies Unit website (http://psu.uidaho.edu).
Visitor Services Project Publications: A complete list of in-depth visitor studies conducted by the VSP can be obtained by visiting the website: www.psu.uidaho.edu/reports.htm or by contacting the VSP office at (208) 885-2269.
NPS 424/111376, December 2011
Fort Bowie National Historic Site – VSP Visitor Survey Study 243 March 1 – May 2, 2011
iii
Contents Executive Summary ......................................................................................................................... v
Acknowledgements .................................................................................................................... vii About the Authors ...................................................................................................................... vii
Introduction ...................................................................................................................................... 1 Organization of the Report .......................................................................................................... 1 Presentation of the Results ......................................................................................................... 2
Methods ............................................................................................................................................. 3 Survey Design and Procedures ................................................................................................... 3
Sample size and sampling plan .................................................................................................. 3 Questionnaire design .................................................................................................................. 3 Survey procedure ........................................................................................................................ 4 Data Analysis .............................................................................................................................. 5 Limitations ................................................................................................................................... 6 Special conditions ....................................................................................................................... 6 Checking Non-response Bias ...................................................................................................... 7
Results .............................................................................................................................................. 9 Group and Visitor Characteristics .............................................................................................. 9
Visitor group size ......................................................................................................................... 9 Visitor group type ........................................................................................................................ 9 Visitors with organized groups .................................................................................................. 10 United States visitors by state of residence .............................................................................. 12 Visitors from Arizona and adjacent states by county of residence ............................................ 13 International visitors by country of residence ............................................................................ 14 Number of visits in past 5 years ................................................................................................ 15 Number of lifetime visits ............................................................................................................ 15 Visitor age ................................................................................................................................. 16 Preferred language to receive information ................................................................................ 17 Visitors with physical conditions ................................................................................................ 18 Household income .................................................................................................................... 19 Household size .......................................................................................................................... 19
Trip/Visit Characteristics and Preferences .............................................................................. 20 Information sources prior to visit ............................................................................................... 20 Information sources for future visit ............................................................................................ 22 Primary reason for visiting the park area .................................................................................. 23 Alternative recreational site ....................................................................................................... 24 Adequacy of directional signs ................................................................................................... 25 Number of vehicles ................................................................................................................... 27 Use of recreational vehicles ...................................................................................................... 27 Number of park entries .............................................................................................................. 28 Overnight stays ......................................................................................................................... 29 Accommodations ....................................................................................................................... 30 Length of park visit .................................................................................................................... 31 Length of stay in the park area .................................................................................................. 32 Sites visited in the park ............................................................................................................. 33 Activities on this visit ................................................................................................................. 34 Most important activities ............................................................................................................ 35 Activities on future visit .............................................................................................................. 36 Use of trail to the fort ................................................................................................................. 37 Ranger-led programs/activities ................................................................................................. 38 Ranger-led programs on future visit .......................................................................................... 39 Interpretive topics ...................................................................................................................... 41
Fort Bowie National Historic Site – VSP Visitor Survey Study 243 March 1 – May 2, 2011
iv
Contents (continued) Ratings of Services, Facilities, Attributes, Resources and Elements ................................... 44
Information services and facilities used .................................................................................... 44 Importance ratings of information services and facilities ........................................................... 45 Quality ratings of information services and facilities ................................................................. 47 Mean scores of importance and quality ratings of information services and facilities ............... 49 Interpretive exhibits along trail/ruins .......................................................................................... 50 Opinions about safety ............................................................................................................... 51
Expenditures ............................................................................................................................... 53 Total expenditures inside and outside the park ......................................................................... 53 Number of adults covered by expenditures ............................................................................... 54 Number of children covered by expenditures ............................................................................ 54 Expenditures inside the park ..................................................................................................... 55 Expenditures outside the park ................................................................................................... 57 Total cost of trip ......................................................................................................................... 63 Amount of unpaid vacation/unpaid time off ............................................................................... 63 Income foregone to make this trip ............................................................................................. 63
Preferences for Future Visits ..................................................................................................... 64 Preferred topics to learn on future visit ..................................................................................... 64 Additional trail ............................................................................................................................ 65
Overall quality ............................................................................................................................. 66 Visitor Comment Summaries ..................................................................................................... 67
Stories requiring emphasis/strengthening ................................................................................. 67 What visitors liked most ............................................................................................................ 69 What visitors liked least ............................................................................................................. 71 Planning for the future ............................................................................................................... 73 Additional comments ................................................................................................................. 75
Visitor Comments ....................................................................................................................... 77
Appendix 1: The Questionnaire .................................................................................................... 79
Appendix 2: Additional Analysis .................................................................................................. 81
Appendix 3: Decision Rules for Checking Non-response Bias ................................................. 82 References .................................................................................................................................. 83
Fort Bowie National Historic Site – VSP Visitor Survey Study 243 March 1 – May 2, 2011
v
Executive Summary This visitor study report profiles a systematic random sample of Fort Bowie National Historic Site (NHS) visitors during March 1 – May 2, 2011. A total of 336 questionnaires were distributed to visitor groups. Of those, 286 questionnaires were returned, resulting in an 85.1% response rate. Group size and type Fifty-eight percent of visitor groups were comprised of two people and
20% were in groups of four or more. Fifty-eight percent of visitor groups consisted of family groups.
State or country of residence
United States visitors were from 42 states and comprised 96% of total visitation during the survey period, with 36% from Arizona and smaller portions from 41 other states. International visitors were from 7 countries and comprised 4% of total visitation.
Frequency of visits Eighty-five percent of visitors had visited the park once in the last 5
years. Eighty-one percent of visitors were visiting the park for the first time in their lifetime.
Age and household income
Fifty-three percent of visitors were ages 56-70 years, 14% were ages 15 years or younger, and 6% were 71 or older. Twenty-three percent of respondents reported a household income of $50,000-$74,999.
Physical conditions Fourteen percent of visitor groups had members with physical
conditions affecting their ability to access or participate in activities and services.
Information sources Most visitors (93%) obtained information about the park prior to their
visit, through maps and brochures (41%), the park website (33%), and friends/relatives/word of mouth (31%); and most (89%) received the information they needed. Sixty-nine percent of visitor groups would use the park website to obtain information for a future visit.
Primary reason for visiting the area
Nine percent of visitor groups were residents of the area (within 75 miles of the park). The most common primary reasons for visiting the park area among non-resident visitor groups were to visit the park (44%) and visit other attractions in the area (35%).
Transportation Seven percent of visitor groups drove a recreational vehicle to the park, and 5% were pulling a trailer or another vehicle.
Overnight stays Sixty-three percent of visitor groups stayed overnight in the area within 75
miles of the park, of which 35% stayed two nights and 31% spent four or more nights. Fifty-six percent of visitor groups stayed in lodges, hotels, motels, vacation rentals, bed and breakfasts, etc., while 25% were RV/trailer camping.
Length of stay Forty percent of visitor groups spent three hours visiting the park. The average length of visit in the park was 3.3 hours. Of those visitor groups that spent less than 24 hours visiting the area within 75 miles of the park, 33% spent four to five hours. Of those that spent 24 hours or more, 54% spent two to three days. The average length of stay to the park area for all visitor groups was 3.6 days.

Fort Bowie National Historic Site – VSP Visitor Survey Study 243 March 1 – May 2, 2011
vi
Executive Summary (continued) Activities on this visit
The most common park activities were visiting the visitor center (96%), general sightseeing (90%), and walking/day hiking (89%). Visitor groups’ most important activities were studying history (98%) and walking/day hiking.
Ranger-led programs
Four percent of visitor groups attended ranger-led programs. Seventy percent were not aware of any ranger-led programs, and 67% would likely attend a program on a future visit. The interpretive topics that most interested visitors on a future visit were events of the Battle of Apache Pass (90%) and natural setting where the events occurred (89%).
Information services and facilities
The information services and facilities most commonly used by visitor groups were the visitor center exhibits (92%), the trailside exhibits (84%), and the park brochure/map (76%).
Interpretive exhibits along the trail
Visitor groups (95%) viewed interpretive exhibits along trails and ruins. Of those who viewed the trailside exhibits, 93% of visitor groups felt the number of exhibits was “about right” and 92% felt the amount of information was “about right”.
Expenditures The average visitor group expenditure (inside and outside the park within 75 miles) was $334. The median group expenditure (50% of groups spent more and 50% of groups spent less) was $135, and the average total expenditure per person (per capita) was $154.
Learning about the park
Ninety percent of visitor groups were interested in ranger-led hikes on a future visit. The most common topic of interest were Apache (84%) and Army/Buffalo Soldiers (%).
Overall quality Most visitor groups (92%) rated the overall quality of facilities, services,
and recreational opportunities at Fort Bowie NHS as “very good” or “good”. Two percent of groups rated the overall quality as “poor.”
For more information about the Visitor Services Project, please contact the Park Studies Unit at the University of Idaho at (208) 885-7863 or the following website http://www.psu.uidaho.edu.

Fort Bowie National Historic Site – VSP Visitor Survey Study 243 March 1 – May 2, 2011
vii
Acknowledgements We thank Mystera Samuelson for compiling the report, Yen Le for overseeing the fieldwork, the staff and volunteers of Fort Bowie National Historic Site for assisting with the survey, and David Vollmer and Matthew Strawn for data processing.
About the Authors Mystera Samuelson is a research assistant with the Visitor Services Project. Dr. Yen Le is Assistant Director of the Visitor Services Project at the University of Idaho, and Dr. Steven Hollenhorst is the Director of the Park Studies Unit, Department of Conservation Social Sciences, University of Idaho.

Fort Bowie National Historic Site – VSP Visitor Survey Study 243 March 1 – May 2, 2011
1
Introduction This report describes the results of a visitor study at Fort Bowie National Historic Site (NHS) in Bowie, AZ, conducted March 1 – May 2, 2011 by the National Park Service (NPS) Visitor Services Project (VSP), part of the Park Studies Unit (PSU) at the University of Idaho.
As described in the National Park Service website for Fort Bowie NHS, “Fort Bowie commemorates the bitter conflict between Chiricahua Apaches and the U.S. military - a lasting monument to the bravery and endurance of U.S. soldiers in paving the way for settlement and the taming of the western frontier.” (www.nps.gov/fobo, retrieved September 2011).
Organization of the Report This report is organized into three sections. Section 1: Methods. This section discusses the procedures, limitations, and special conditions that
may affect the study results. Section 2: Results. This section provides a summary for each question in the questionnaire and
includes visitor comments to open-ended questions. The presentation of the results of this study does not follow the order of questions in the questionnaire.
Section 3: Appendices
Appendix 1: The Questionnaire. A copy of the questionnaire distributed to visitor groups. Appendix 2: Additional Analysis. A list of sample questions for cross-references and cross
comparisons. Comparisons can be analyzed within a park or between parks. Results of additional analyses are not included in this report.
Appendix 3: Decision rules for checking non-response bias. An explanation of how the non-
response bias was determined.

Fort Bowie National Historic Site – VSP Visitor Survey Study 243 March 1 – May 2, 2011
2
Presentation of the Results Results are represented in the form of graphs (see example below), scatter plots, pie charts, tables or text. SAMPLE
1. The figure title describes the graph’s information.
2. Listed above the graph, the “N” shows the
number of individuals or visitor groups responding to the question. If “N” is less than 30, “CAUTION!” is shown on the graph to indicate the results may be unreliable.
* appears when the total percentages do not
equal 100 due to rounding. ** appears when total percentages do not
equal 100 because visitors could select more than one answer choice.
3. Vertical information describes the response
categories. 4. Horizontal information shows the number or
proportions of responses in each category. 5. In most graphs, percentages provide
additional information.
0 200 400 600
Number of respondents
1
2
3 or more
87%
9%
5%
N=604 individuals*
Numberof visits
1Figure 14. Number of visits to the park in
past 12 months
2
3
4
5
Fort Bowie National Historic Site – VSP Visitor Survey Study 243 March 1 – May 2, 2011
3
Methods Survey Design and Procedures Sample size and sampling plan All VSP questionnaires follow design principles outlined in Don A. Dillman’s book Mail and Internet Surveys: The Tailored Design Method (2007). Using this method, the sample size was calculated based on the park visitation statistics of previous years.
Brief interviews were conducted with a systematic, random sample of visitor groups that arrived at Fort Bowie NHS during March 1 – May 2, 2011. Visitors were surveyed between the hours of 8:00 a.m. and 4:30 p.m. Surveys were distributed at the visitor center. During this survey, 354 visitor groups were contacted and 336 of these groups (95%) accepted questionnaires. (The average acceptance rate for 286 VSP visitor studies conducted from 1988 through 2010 is 91.5%.) Questionnaires were completed and returned by 286 visitor groups, resulting in an 85.1% response rate for this study. (The average response rate for the 228 VSP visitor studies is 72.6%.)
Questionnaire design The Fort Bowie NHS questionnaire was developed at a workshop held with park staff to design and prioritize questions. Some of the questions were comparable with VSP studies conducted at other parks while others were customized for Fort Bowie NHS. Many questions asked visitors to choose answers from a list of responses, often with an open-ended option, while others were completely open-ended. No pilot study was conducted to test the Fort Bowie NHS questionnaire. However, all questions followed Office Management and Budget (OMB) guidelines and/or were used in previous surveys; thus, the clarity and consistency of the survey instrument have been tested and supported.
Fort Bowie National Historic Site – VSP Visitor Survey Study 243 March 1 – May 2, 2011
4
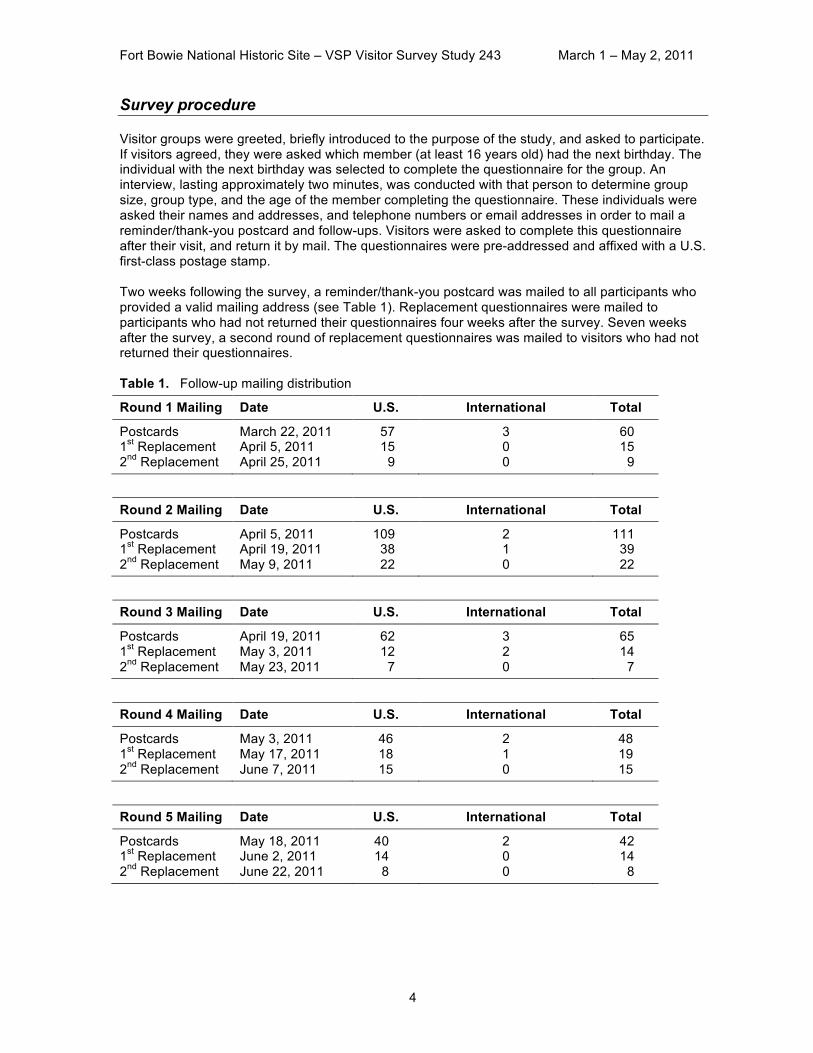
Survey procedure Visitor groups were greeted, briefly introduced to the purpose of the study, and asked to participate. If visitors agreed, they were asked which member (at least 16 years old) had the next birthday. The individual with the next birthday was selected to complete the questionnaire for the group. An interview, lasting approximately two minutes, was conducted with that person to determine group size, group type, and the age of the member completing the questionnaire. These individuals were asked their names and addresses, and telephone numbers or email addresses in order to mail a reminder/thank-you postcard and follow-ups. Visitors were asked to complete this questionnaire after their visit, and return it by mail. The questionnaires were pre-addressed and affixed with a U.S. first-class postage stamp. Two weeks following the survey, a reminder/thank-you postcard was mailed to all participants who provided a valid mailing address (see Table 1). Replacement questionnaires were mailed to participants who had not returned their questionnaires four weeks after the survey. Seven weeks after the survey, a second round of replacement questionnaires was mailed to visitors who had not returned their questionnaires. Table 1. Follow-up mailing distribution
Round 1 Mailing Date U.S. International Total
Postcards March 22, 2011 57 3 60 1st Replacement April 5, 2011 15 0 15 2nd Replacement April 25, 2011 9 0 9
Round 2 Mailing Date U.S. International Total
Postcards April 5, 2011 109 2 111 1st Replacement April 19, 2011 38 1 39 2nd Replacement May 9, 2011 22 0 22
Round 3 Mailing Date U.S. International Total
Postcards April 19, 2011 62 3 65 1st Replacement May 3, 2011 12 2 14 2nd Replacement May 23, 2011 7 0 7
Round 4 Mailing Date U.S. International Total
Postcards May 3, 2011 46 2 48 1st Replacement May 17, 2011 18 1 19 2nd Replacement June 7, 2011 15 0 15
Round 5 Mailing Date U.S. International Total
Postcards May 18, 2011 40 2 42 1st Replacement June 2, 2011 14 0 14 2nd Replacement June 22, 2011 8 0 8
Fort Bowie National Historic Site – VSP Visitor Survey Study 243 March 1 – May 2, 2011
5
The 2-minute interview was conducted with 336 visitors to Fort Bowie NHS. This resulted in 11.2 hours of visitor time dedicated to the interviews. A total of 286 visitors completed and returned their questionnaire. It is estimated that each questionnaire takes an average of 20 minutes to complete. This resulted in a total of 95.33 hours of visitor time dedicated to completing the questionnaire. Visitors dedicated a total of approximately 107 hours of time to provide the data in this report. Data Analysis Returned questionnaires were coded and the visitor responses were processed using custom and standard statistical software applications—Statistical Analysis Software® (SAS), and a custom designed FileMaker Pro® application. Descriptive statistics and cross-tabulations were calculated for the coded data; responses to open-ended questions were categorized and summarized. Double-key data entry validation was performed on numeric and text entry variables and the remaining checkbox (bubble) variables were read by optical mark recognition (OMR) software.
Fort Bowie National Historic Site – VSP Visitor Survey Study 243 March 1 – May 2, 2011
6
Limitations Like all surveys, this study has limitations that could be considered when interpreting the results.
1. This was a self-administered survey. Respondents completed the questionnaire after the visit, which may have resulted in poor recall. Thus, it is not possible to know whether visitor responses reflected actual behavior.
2. The data reflect visitor use patterns at the selected sites during the study period of March 1 – May 2, 2011. The results present a ‘snapshot in time’ and do not necessarily apply to visitors during other times of the year.
3. Caution is advised when interpreting any data with a sample size of less than 30, as the results may be unreliable. Whenever the sample size is less than 30, the word “CAUTION!” is included in the graph, figure, table, or text.
4. Occasionally, there may be inconsistencies in the results. Inconsistencies arise from missing data or incorrect answers (due to misunderstood directions, carelessness, or poor recall of information). Therefore, refer to both the percentage and N (number of individuals or visitor groups) when interpreting the results.
Special conditions The weather during the survey period ranged from cool and sunny to warm with occasional high winds. No special events occurred in the area, which would have affected the type and amount of visitation to the park. Surveys were not distributed on 4/21/11 due to a lack of trained interviewers.
Fort Bowie National Historic Site – VSP Visitor Survey Study 243 March 1 – May 2, 2011
7
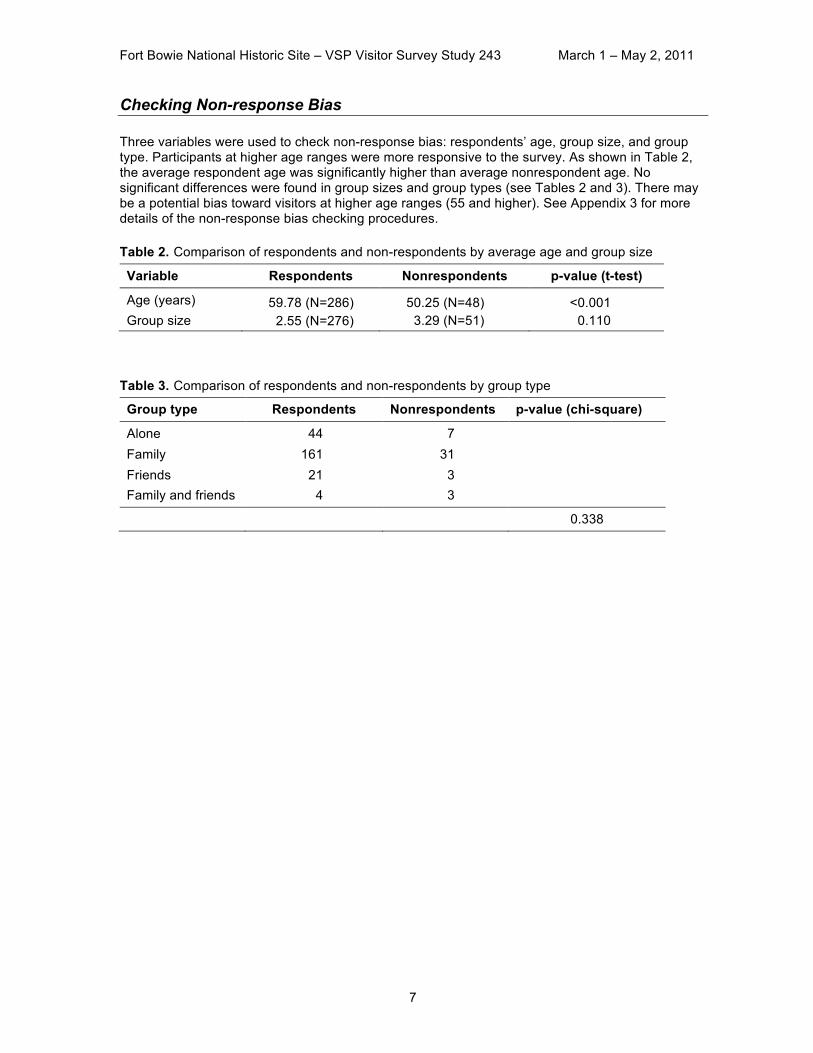
Checking Non-response Bias Three variables were used to check non-response bias: respondents’ age, group size, and group type. Participants at higher age ranges were more responsive to the survey. As shown in Table 2, the average respondent age was significantly higher than average nonrespondent age. No significant differences were found in group sizes and group types (see Tables 2 and 3). There may be a potential bias toward visitors at higher age ranges (55 and higher). See Appendix 3 for more details of the non-response bias checking procedures. Table 2. Comparison of respondents and non-respondents by average age and group size
Variable Respondents Nonrespondents p-value (t-test)
Age (years) 59.78 (N=286) 50.25 (N=48) <0.001 Group size 2.55 (N=276) 3.29 (N=51) 0.110
Table 3. Comparison of respondents and non-respondents by group type
Group type Respondents Nonrespondents p-value (chi-square)
Alone 44 7 Family 161 31 Friends 21 3 Family and friends 4 3 0.338


Fort Bowie National Historic Site – VSP Visitor Survey Study 243 March 1 – May 2, 2011
9
Results
Group and Visitor Characteristics Visitor group size Question 23b
On this visit, how many people were in your personal group, including yourself?
Results • 58% of visitor groups consisted of
two people (see Figure 1).
• 22% were in groups of three or four.
Figure 1. Visitor group size
Visitor group type Question 23a
On this visit, what kind of personal group (not guided tour/school/other organized group) were you with?
Results • 58% of visitor groups consisted of
family members (see Figure 2).
• “Other” group types (1%) were:
Colleagues RV singles group
Figure 2. Visitor group type
0 50 100 150 200
Number of respondents
1
2
3
4
5 or more
13%
58%
9%
13%
7%
N=276 visitor groups
GroupSize
0 45 90 135 180Number of respondents
Other
Family andfriends
Alone
Friends
Family
1%
8%
16%
17%
58%
N=276 visitor groups
Grouptype
Fort Bowie National Historic Site – VSP Visitor Survey Study 243 March 1 – May 2, 2011
_______________ *total percentages do not equal 100 due to rounding **total percentages do not equal 100 because visitors could select more than one answer 10
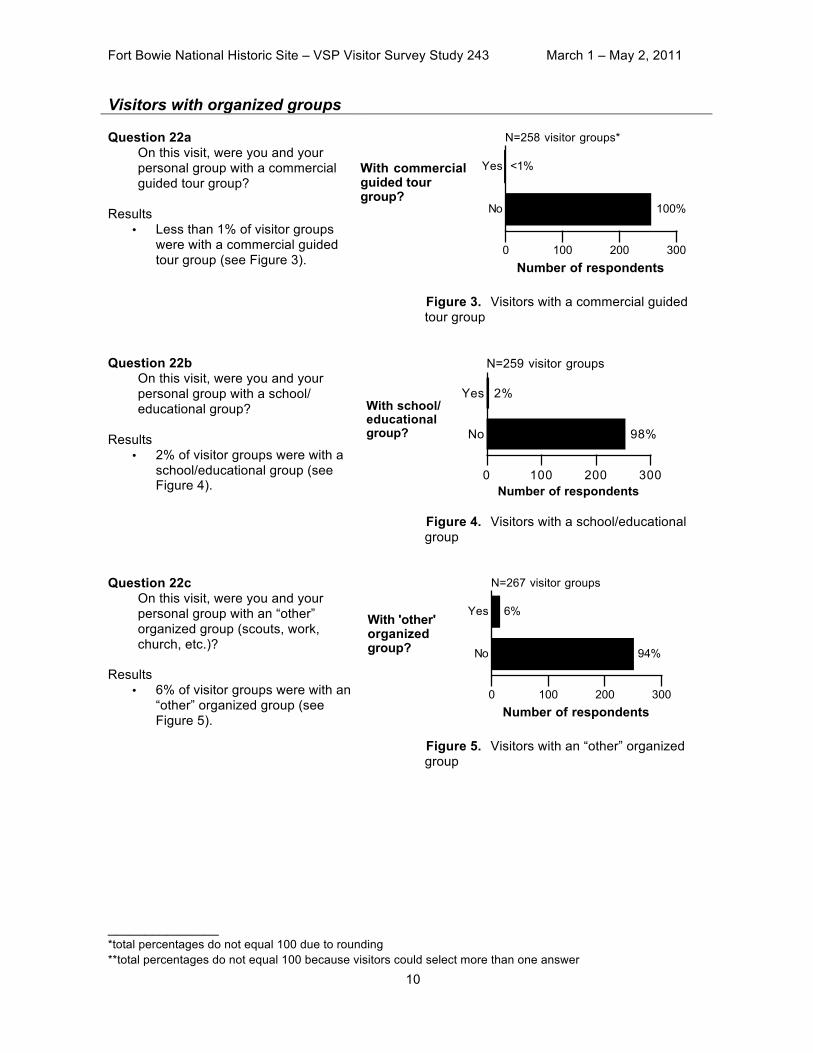
Visitors with organized groups Question 22a
On this visit, were you and your personal group with a commercial guided tour group?
Results
• Less than 1% of visitor groups were with a commercial guided tour group (see Figure 3).
Figure 3. Visitors with a commercial guided tour group
Question 22b
On this visit, were you and your personal group with a school/ educational group?
Results
• 2% of visitor groups were with a school/educational group (see Figure 4).
Figure 4. Visitors with a school/educational group
Question 22c
On this visit, were you and your personal group with an “other” organized group (scouts, work, church, etc.)?
Results
• 6% of visitor groups were with an “other” organized group (see Figure 5).
Figure 5. Visitors with an “other” organized group
0 100 200 300Number of respondents
No
Yes
100%
<1%
N=258 visitor groups*
With commercialguided tourgroup?
0 100 200 300
Number of respondents
No
Yes
98%
2%
N=259 visitor groups
With school/educationalgroup?
0 100 200 300
Number of respondents
No
Yes
94%
6%
N=267 visitor groups
With 'other'organizedgroup?

Fort Bowie National Historic Site – VSP Visitor Survey Study 243 March 1 – May 2, 2011
_______________ *total percentages do not equal 100 due to rounding **total percentages do not equal 100 because visitors could select more than one answer 11
Question 22d If you were with one of these organized groups, how many people, including yourself, were in this group?
Results – Interpret with CAUTION!
• Not enough visitor groups responded to this question to provide reliable results (see Figure 6).
Figure 6. Organized group size
0 5 10
Number of respondents
1-10
11-20
21 or more
35%
35%
29%
N=17 visitor groups*
Numberof people
CAUTION!

Fort Bowie National Historic Site – VSP Visitor Survey Study 243 March 1 – May 2, 2011
_______________ *total percentages do not equal 100 due to rounding **total percentages do not equal 100 because visitors could select more than one answer 12
United States visitors by state of residence Question 24b
For you and your personal group on this visit, what is your state of residence?
Note: Response was limited to
seven members from each visitor group.
Results
• U.S. visitors were from 42 states and comprised 96% of total visitation to the park during the survey period.
• 36% of U.S. visitors came from Arizona (see Table 4 and Figure 7).
• 8% came from
California, 5% were from Colorado, and 5% were from Washington.
• Smaller proportions
came from 38 other states.
Table 4. United States visitors by state of residence
State
Number of visitors
Percent of U.S. visitors
N=610 individuals
Percent of total visitors
N=637 individuals
Arizona 221 36 35 California 51 8 8 Colorado 32 5 5 Washington 32 5 5 Texas 26 4 4 Oregon 24 4 4 Minnesota 18 3 3 Illinois 17 3 3 New Mexico 16 3 3 Ohio 15 2 2 Pennsylvania 13 2 2 Wisconsin 13 2 2 Florida 11 2 2 New York 11 2 2 Michigan 10 2 2 Missouri 10 2 2 26 other states 90 15 14
Figure 7. United States visitors by state of residence
Alaska
American SamoaGuam
Puerto Rico
Hawaii
Fort BowieNational Historic Site
10% or more
4% to 9%
2% to 3% less than 2% N=610 individuals

Fort Bowie National Historic Site – VSP Visitor Survey Study 243 March 1 – May 2, 2011
_______________ *total percentages do not equal 100 due to rounding **total percentages do not equal 100 because visitors could select more than one answer 13
Visitors from Arizona and adjacent states by county of residence Note: Response was limited to
seven members from each visitor group.
Results
• Visitors from Arizona and adjacent states were from 43 counties and comprised 53% of the total U.S. visitation to the park during the survey period.
• 36% came from Pima County (see Table 5).
• 15% came from Cochise
County and 13% from Maricopa County.
• Smaller proportions of
visitors came from 40 other counties in Arizona and adjacent states.
Table 5. Visitors from Arizona and adjacent states by
county of residence
County, State
Number of visitors N=323 individuals
Percent*
Pima, AZ 117 36 Cochise, AZ 50 15 Maricopa, AZ 42 13 Los Angeles, CA 10 3 Orange, CA 8 2 La Plata, CO 6 2 San Diego, CA 5 2 Sandoval, NM 5 2 Clark, NV 4 1 Denver, CO 4 1 El Dorado, CA 4 1 El Paso, TX 4 1 Montrose, CO 4 1 Santa Fe, NM 4 1 Adams, CO 3 1 Arapahoe, CO 3 1 Grant, NM 3 1 La Paz, AZ 3 1 Nevada, CA 3 1 Placer, CA 3 1 Siskiyou, CA 3 1 Ventura, CA 3 1 Washoe, NV 3 1 20 other counties in
Arizona and adjacent states
29 9
Fort Bowie National Historic Site – VSP Visitor Survey Study 243 March 1 – May 2, 2011
_______________ *total percentages do not equal 100 due to rounding **total percentages do not equal 100 because visitors could select more than one answer 14
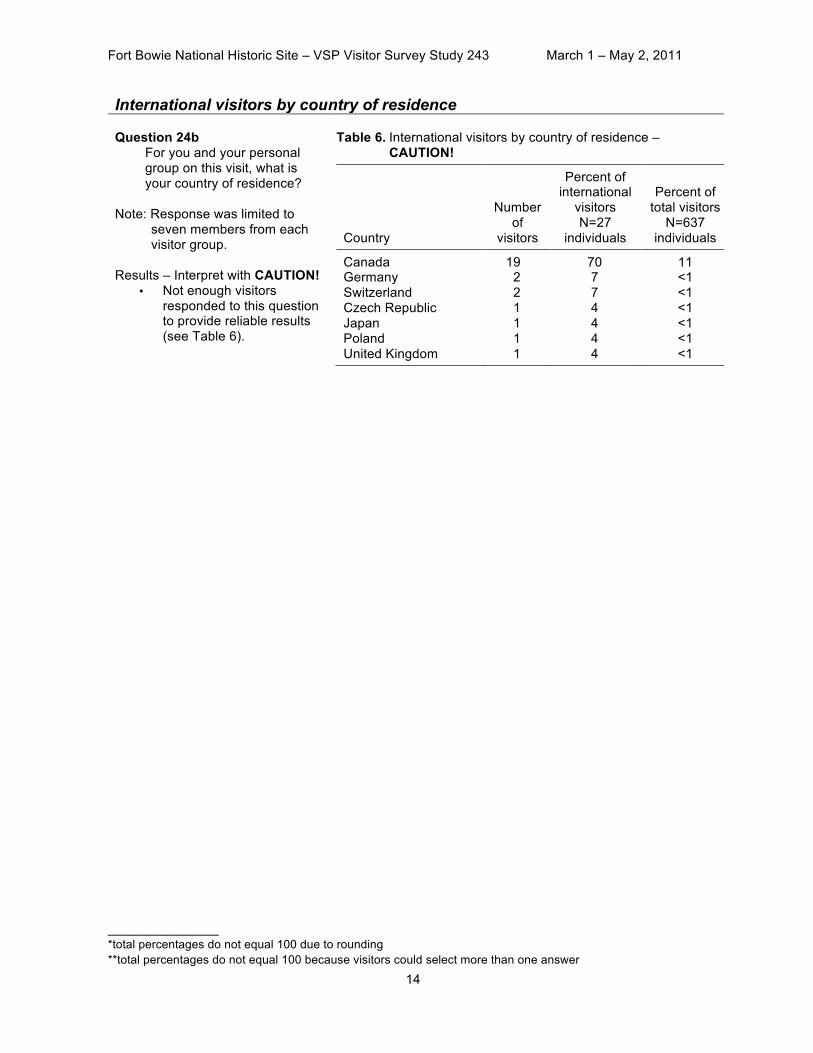
International visitors by country of residence Question 24b
For you and your personal group on this visit, what is your country of residence?
Note: Response was limited to
seven members from each visitor group.
Results – Interpret with CAUTION!
• Not enough visitors responded to this question to provide reliable results (see Table 6).
Table 6. International visitors by country of residence –
CAUTION!
Country
Number of
visitors
Percent of international
visitors N=27
individuals
Percent of total visitors
N=637 individuals
Canada 19 70 11 Germany 2 7 <1 Switzerland 2 7 <1 Czech Republic 1 4 <1 Japan 1 4 <1 Poland 1 4 <1 United Kingdom 1 4 <1

Fort Bowie National Historic Site – VSP Visitor Survey Study 243 March 1 – May 2, 2011
_______________ *total percentages do not equal 100 due to rounding **total percentages do not equal 100 because visitors could select more than one answer 15
Number of visits in past 5 years Question 24c
For you and your personal group on this visit, how many times have you visited Fort Bowie NHS in the past 5 years (including this visit)?
Note: Response was limited to seven
members from each visitor group. Results
• 85% of visitors visited the park once in the past 5 years (see Figure 8).
Figure 8. Number of visits to park in past 5 years
Number of lifetime visits Question 24d
For you and your personal group on this visit, how many times have you visited Fort Bowie NHS in your lifetime (including this visit)?
Note: Response was limited to seven members from each visitor group.
Results
• 81% of visitors visited the park once in the their lifetime (see Figure 9).
Figure 9. Number of visits to park in lifetime
0 200 400 600
Number of respondents
1
2
3
4 or more
85%
9%
3%
3%
N=622 individuals
Numberof visits
0 100 200 300 400 500
Number of respondents
1
2
3
4 or more
81%
9%
3%
6%
N=528 individuals*
Number of visits
Fort Bowie National Historic Site – VSP Visitor Survey Study 243 March 1 – May 2, 2011
_______________ *total percentages do not equal 100 due to rounding **total percentages do not equal 100 because visitors could select more than one answer 16
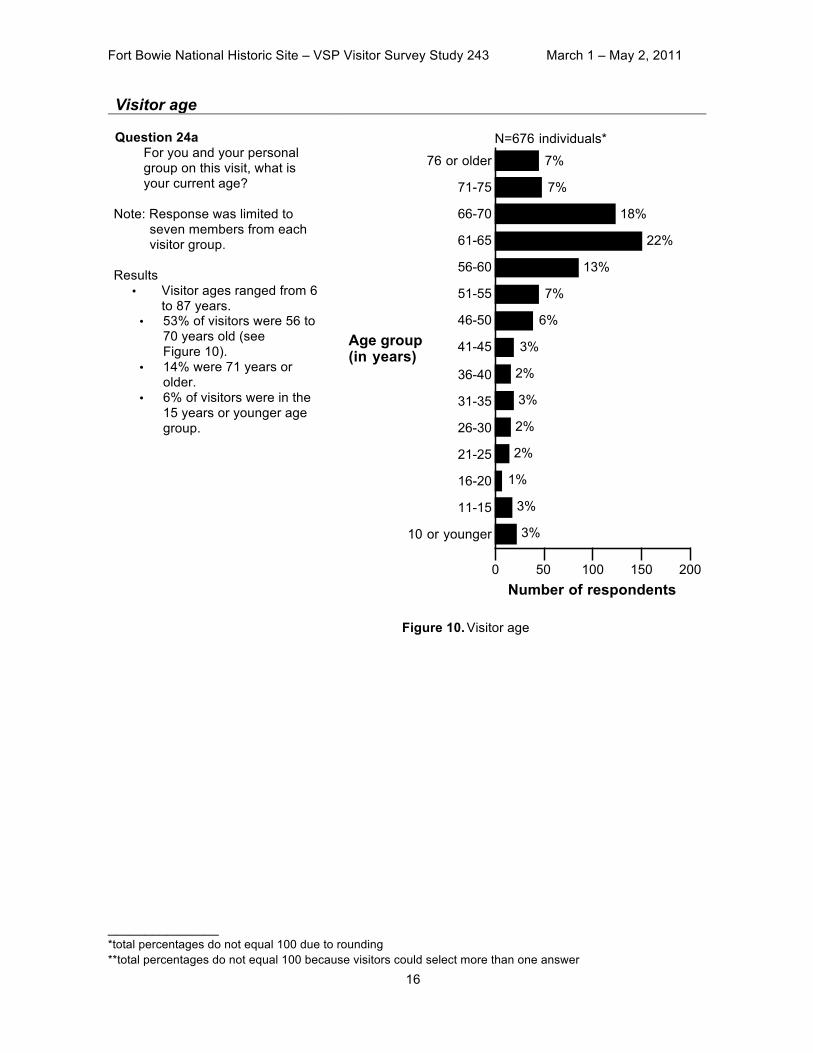
Visitor age Question 24a
For you and your personal group on this visit, what is your current age?
Note: Response was limited to
seven members from each visitor group.
Results
• Visitor ages ranged from 6 to 87 years.
• 53% of visitors were 56 to 70 years old (see Figure 10).
• 14% were 71 years or older.
• 6% of visitors were in the 15 years or younger age group.
Figure 10. Visitor age
0 50 100 150 200Number of respondents
10 or younger
11-15
16-20
21-25
26-30
31-35
36-40
41-45
46-50
51-55
56-60
61-65
66-70
71-75
76 or older
3%
3%
1%
2%
2%
3%
2%
3%
6%
7%
13%
22%
18%
7%
7%
N=676 individuals*
Age group(in years)

Fort Bowie National Historic Site – VSP Visitor Survey Study 243 March 1 – May 2, 2011
_______________ *total percentages do not equal 100 due to rounding **total percentages do not equal 100 because visitors could select more than one answer 17
Preferred language to receive information Question 2a
Would you or any member of your personal group prefer to receive information about Fort Bowie NHS in languages other than English?
Results
• 2% of visitor groups preferred to receive information in languages other than English (see Figure 11).
Figure 11. Visitor groups that preferred to receive information in languages other then English
Question 2b
If YES, which language(s)?
Results – Interpret with CAUTION!
• Not enough visitor groups responded to this question to provide reliable results (see Table 7).
Table 7. Languages in which visitor groups preferred to receive information
(N=6 comments) – CAUTION!
Language
Number of times mentioned
Spanish 3 French 2 Apache 1
0 100 200 300
Number of respondents
No
Yes
98%
2%
N=283 visitor groups
Prefer languageother thanEnglish?

Fort Bowie National Historic Site – VSP Visitor Survey Study 243 March 1 – May 2, 2011
_______________ *total percentages do not equal 100 due to rounding **total percentages do not equal 100 because visitors could select more than one answer 18
Visitors with physical conditions Question 17a
Does anyone in your personal group have a physical condition that made it difficult to access or participate in park activities or services?
Results • 14% of visitor groups had
members with physical conditions (see Figure 12).
Figure 12. Visitor groups that had members with physical conditions
Question 17b
If YES, which services or activities were difficult to access/participate in? (Open-ended)
Results
• 34 visitor groups commented services or activities that were difficult to access or participate in (see Table 8).
Table 8. Services/activities that were difficult to access/participate in (N=35 comments; one visitor group made more than one comment)
Service/activity
Number of times mentioned
Walking/hiking 25 All services/activities 1 Most services/activities 1 Overlook trail 1 Ruin trail 1 Stair access 1 Trail benches are too low 1 Trail is not suitable for handicap access 1 Viewing the ruins - boardwalks would be nice 1 Walk to the fort 1 Walking uphill 1
0 50 100 150 200 250Number of respondents
No
Yes
86%
14%
N=283 visitor groups
Havephysicalcondition?
Fort Bowie National Historic Site – VSP Visitor Survey Study 243 March 1 – May 2, 2011
_______________ *total percentages do not equal 100 due to rounding **total percentages do not equal 100 because visitors could select more than one answer 19
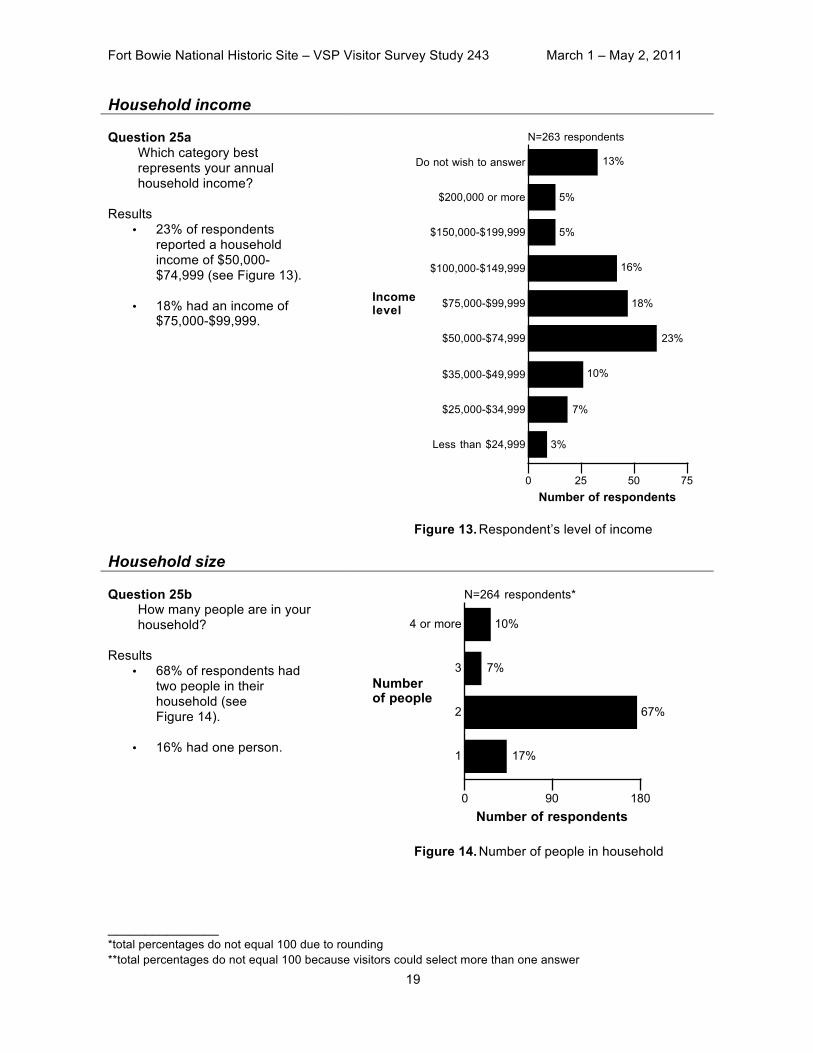
Household income Question 25a
Which category best represents your annual household income?
Results
• 23% of respondents reported a household income of $50,000-$74,999 (see Figure 13).
• 18% had an income of $75,000-$99,999.
Figure 13. Respondent’s level of income
Household size Question 25b
How many people are in your household?
Results
• 68% of respondents had two people in their household (see Figure 14).
• 16% had one person.
Figure 14. Number of people in household
0 25 50 75Number of respondents
Less than $24,999
$25,000-$34,999
$35,000-$49,999
$50,000-$74,999
$75,000-$99,999
$100,000-$149,999
$150,000-$199,999
$200,000 or more
Do not wish to answer
3%
7%
10%
23%
18%
16%
5%
5%
13%
N=263 respondents
Incomelevel
0 90 180Number of respondents
1
2
3
4 or more
17%
67%
7%
10%
N=264 respondents*
Numberof people
Fort Bowie National Historic Site – VSP Visitor Survey Study 243 March 1 – May 2, 2011
_______________ *total percentages do not equal 100 due to rounding **total percentages do not equal 100 because visitors could select more than one answer 20
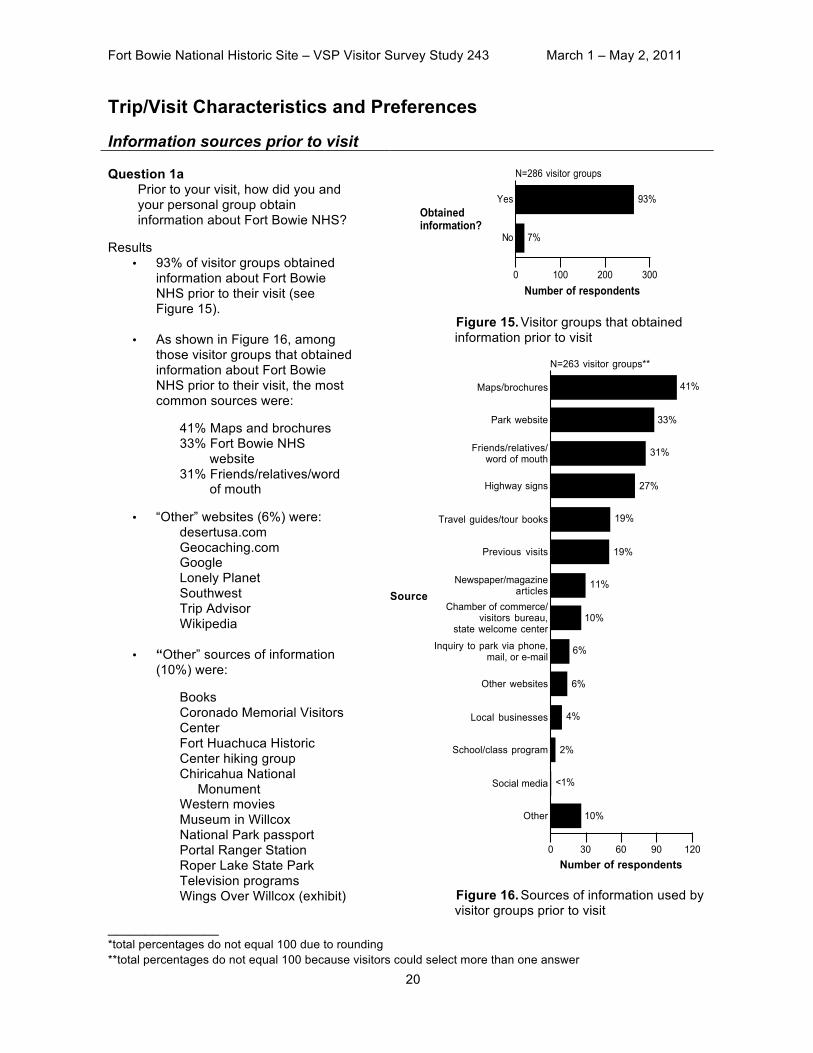
Trip/Visit Characteristics and Preferences Information sources prior to visit Question 1a
Prior to your visit, how did you and your personal group obtain information about Fort Bowie NHS?
Results
• 93% of visitor groups obtained information about Fort Bowie NHS prior to their visit (see Figure 15).
• As shown in Figure 16, among those visitor groups that obtained information about Fort Bowie NHS prior to their visit, the most common sources were:
41% Maps and brochures 33% Fort Bowie NHS
website 31% Friends/relatives/word
of mouth
• “Other” websites (6%) were: desertusa.com Geocaching.com Google Lonely Planet Southwest Trip Advisor Wikipedia
• “Other” sources of information (10%) were:
Books Coronado Memorial Visitors Center Fort Huachuca Historic Center hiking group Chiricahua National
Monument Western movies Museum in Willcox National Park passport Portal Ranger Station Roper Lake State Park Television programs Wings Over Willcox (exhibit)
Figure 15. Visitor groups that obtained information prior to visit
Figure 16. Sources of information used by visitor groups prior to visit
0 100 200 300Number of respondents
No
Yes
7%
93%
N=286 visitor groups
Obtainedinformation?
0 30 60 90 120
Number of respondents
Other
Social media
School/class program
Local businesses
Other websites
Inquiry to park via phone,mail, or e-mail
Chamber of commerce/visitors bureau,
state welcome center
Newspaper/magazinearticles
Previous visits
Travel guides/tour books
Highway signs
Friends/relatives/word of mouth
Park website
Maps/brochures
10%
<1%
2%
4%
6%
6%
10%
11%
19%
19%
27%
31%
33%
41%
N=263 visitor groups**
Source

Fort Bowie National Historic Site – VSP Visitor Survey Study 243 March 1 – May 2, 2011
_______________ *total percentages do not equal 100 due to rounding **total percentages do not equal 100 because visitors could select more than one answer 21
Question 1c From the sources you used prior to this visit, did you and your personal group receive the type of information about the park that you needed?
Results
• 89% of visitor groups received needed information prior to their visit (see Figure 17).
Figure 17. Visitor groups that received needed information prior to their visit
Question 1d
If NO, what type of park information did you and your personal group need that was not available? (Open-ended)
Results
• 20 visitor groups listed information they needed but was not available (see Table 9).
Table 9. Needed information that was not available (N=31 comments; some visitor groups made more than one comment)
Type of information Number of times
mentioned
Information on handicap access 5 Programs/talks/tours 3 Directions/road situation 2 Information on trails 2 Current news on website 1 Distance from highway 1 Guessed it dealt with Apache war 1 History 1 How long is the trail 1 How to avoid driving on dirt roads 1 Information about the return trail hike 1 Information on the 1.5 mile walk-in 1 Maps and brochures 1 Paved roads in the park 1 Photos 1 Restrooms 1 Road map and signs clearly marked 1 Security at parking lot 1 Services at visitor center 1 Size of the property 1 Visitor center hours of operation 1 Water availability 1 Website is not up-to-date 1
0 50 100 150 200 250Number of respondents
No
Yes
11%
89%
N=254 visitor groups
Receivedneededinformation?
Fort Bowie National Historic Site – VSP Visitor Survey Study 243 March 1 – May 2, 2011
_______________ *total percentages do not equal 100 due to rounding **total percentages do not equal 100 because visitors could select more than one answer 22
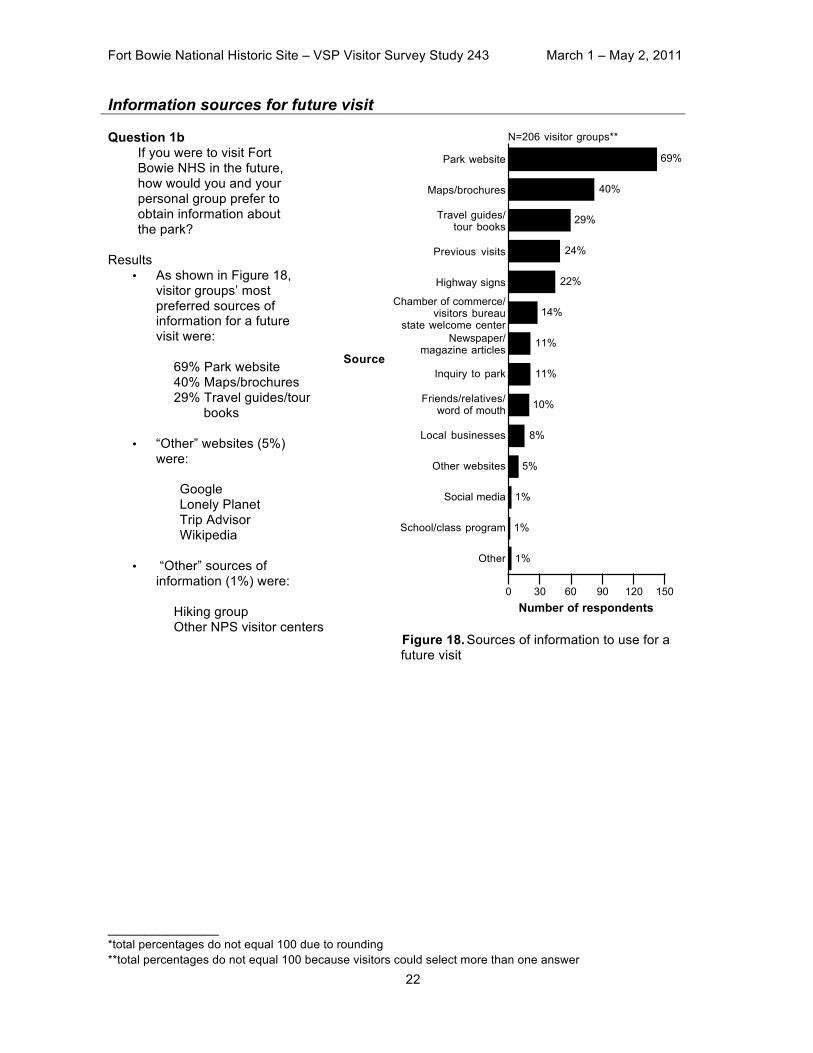
Information sources for future visit Question 1b
If you were to visit Fort Bowie NHS in the future, how would you and your personal group prefer to obtain information about the park?
Results • As shown in Figure 18,
visitor groups’ most preferred sources of information for a future visit were:
69% Park website 40% Maps/brochures 29% Travel guides/tour
books
• “Other” websites (5%) were:
Google Lonely Planet Trip Advisor Wikipedia
• “Other” sources of information (1%) were:
Hiking group Other NPS visitor centers
Figure 18. Sources of information to use for a future visit
0 30 60 90 120 150Number of respondents
Other
School/class program
Social media
Other websites
Local businesses
Friends/relatives/word of mouth
Inquiry to park
Newspaper/magazine articles
Chamber of commerce/visitors bureau
state welcome center
Highway signs
Previous visits
Travel guides/tour books
Maps/brochures
Park website
1%
1%
1%
5%
8%
10%
11%
11%
14%
22%
24%
29%
40%
69%
N=206 visitor groups**
Source
Fort Bowie National Historic Site – VSP Visitor Survey Study 243 March 1 – May 2, 2011
_______________ *total percentages do not equal 100 due to rounding **total percentages do not equal 100 because visitors could select more than one answer 23
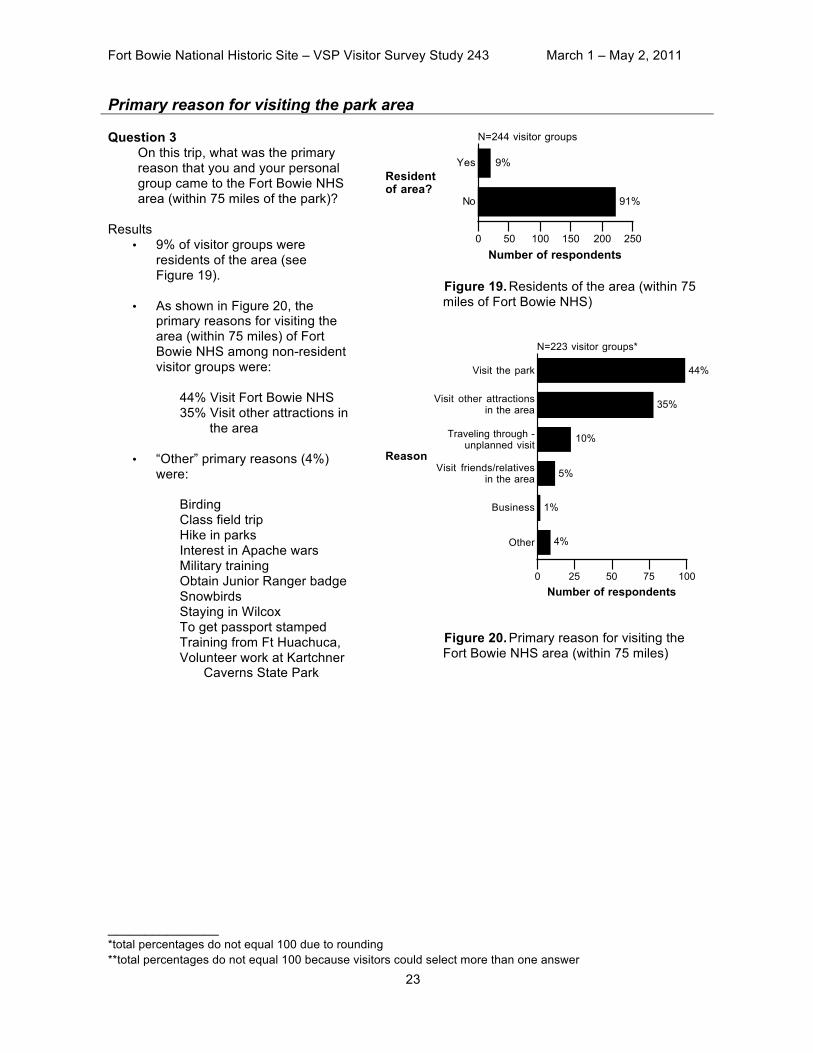
Primary reason for visiting the park area Question 3
On this trip, what was the primary reason that you and your personal group came to the Fort Bowie NHS area (within 75 miles of the park)?
Results
• 9% of visitor groups were residents of the area (see Figure 19).
• As shown in Figure 20, the primary reasons for visiting the area (within 75 miles) of Fort Bowie NHS among non-resident visitor groups were:
44% Visit Fort Bowie NHS 35% Visit other attractions in
the area
• “Other” primary reasons (4%) were:
Birding Class field trip Hike in parks Interest in Apache wars Military training Obtain Junior Ranger badge Snowbirds Staying in Wilcox To get passport stamped Training from Ft Huachuca, Volunteer work at Kartchner
Caverns State Park
Figure 19. Residents of the area (within 75 miles of Fort Bowie NHS)
Figure 20. Primary reason for visiting the Fort Bowie NHS area (within 75 miles)
0 50 100 150 200 250Number of respondents
No
Yes
91%
9%
N=244 visitor groups
Residentof area?
0 25 50 75 100Number of respondents
Other
Business
Visit friends/relativesin the area
Traveling through -unplanned visit
Visit other attractionsin the area
Visit the park
4%
1%
5%
10%
35%
44%
N=223 visitor groups*
Reason
Fort Bowie National Historic Site – VSP Visitor Survey Study 243 March 1 – May 2, 2011
_______________ *total percentages do not equal 100 due to rounding **total percentages do not equal 100 because visitors could select more than one answer 24
Alternative recreational site Question 21a
On this trip, if you and your personal group had not chosen to visit Fort Bowie NHS, what other recreation site would you have visited instead?
Results
• 166 visitor groups listed alternative recreational sites they would have visited if they had not visited Fort Bowie NHS (see Table 10).
Table 10. Sites that visitor groups would visit instead of Fort Bowie NHS (N=166 comments) Site
Number of times mentioned
Chiricahua National Monument 54 None 25 Cochise Stronghold 12 Don't know 11 Other national park sites 8 Kartchner Caverns 5 Tombstone 4 Amerind Museum 3 Saguaro National Park 3 Amerind Foundation 2 Bisbee 2 Grand Canyon National Park 2 White Sands National Monument 2 Willcox 2 Other 31
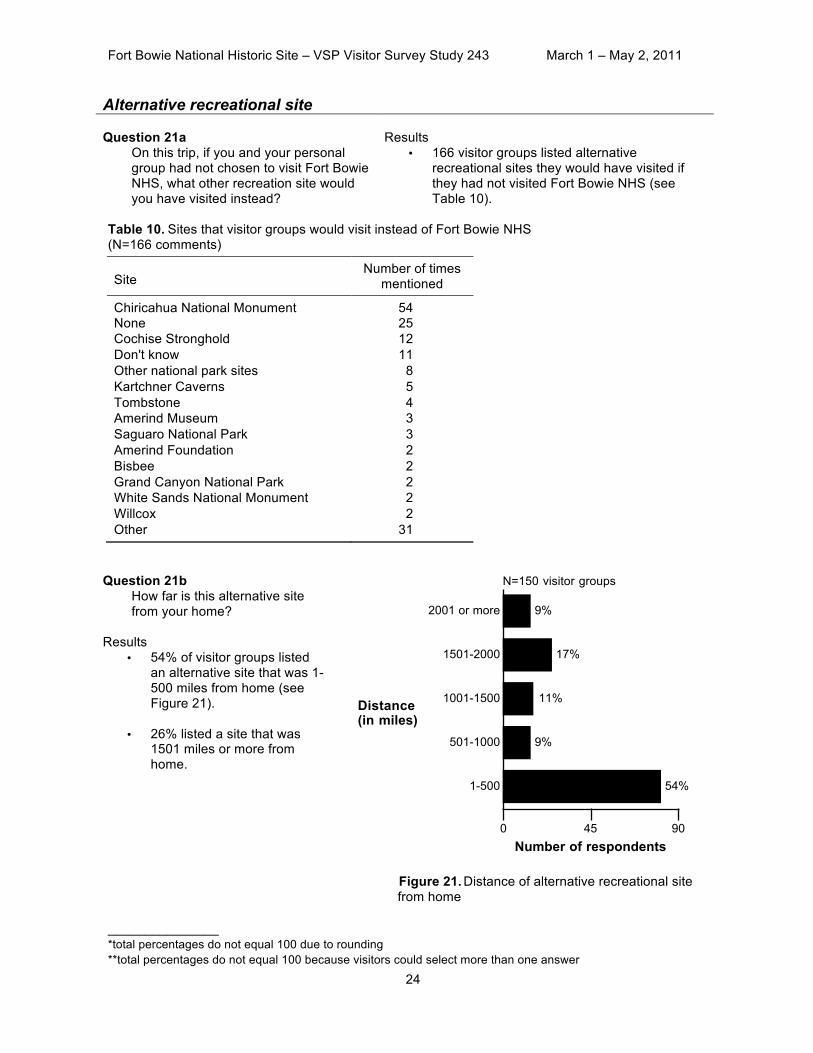
Question 21b How far is this alternative site from your home?
Results • 54% of visitor groups listed
an alternative site that was 1-500 miles from home (see Figure 21).
• 26% listed a site that was 1501 miles or more from home.
Figure 21. Distance of alternative recreational site from home
0 45 90
Number of respondents
1-500
501-1000
1001-1500
1501-2000
2001 or more
54%
9%
11%
17%
9%
N=150 visitor groups
Distance(in miles)
Fort Bowie National Historic Site – VSP Visitor Survey Study 243 March 1 – May 2, 2011
_______________ *total percentages do not equal 100 due to rounding **total percentages do not equal 100 because visitors could select more than one answer 25
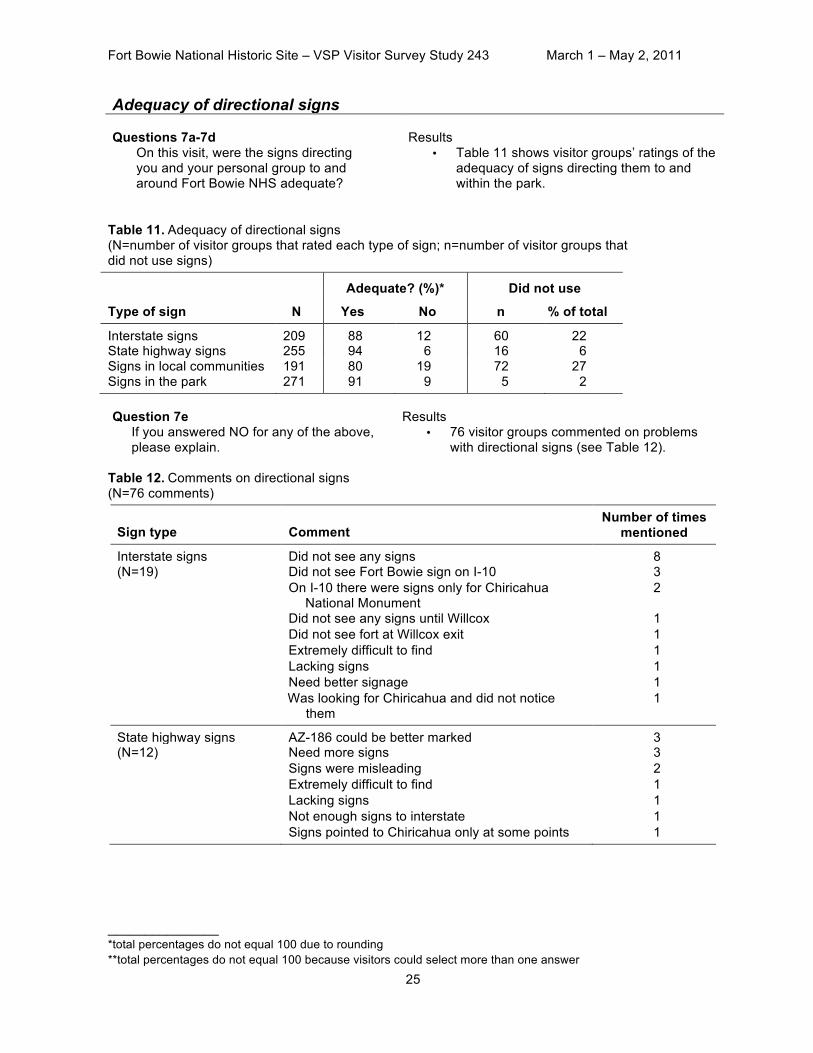
Adequacy of directional signs Questions 7a-7d
On this visit, were the signs directing you and your personal group to and around Fort Bowie NHS adequate?
Results
• Table 11 shows visitor groups’ ratings of the adequacy of signs directing them to and within the park.
Table 11. Adequacy of directional signs (N=number of visitor groups that rated each type of sign; n=number of visitor groups that did not use signs)
Adequate? (%)* Did not use
Type of sign N Yes No n % of total
Interstate signs 209 88 12 60 22 State highway signs 255 94 6 16 6 Signs in local communities 191 80 19 72 27 Signs in the park 271 91 9 5 2 Question 7e
If you answered NO for any of the above, please explain.
Results • 76 visitor groups commented on problems
with directional signs (see Table 12). Table 12. Comments on directional signs (N=76 comments)
Sign type Comment Number of times
mentioned
Interstate signs Did not see any signs 8 (N=19) Did not see Fort Bowie sign on I-10 3 On I-10 there were signs only for Chiricahua
National Monument 2
Did not see any signs until Willcox 1 Did not see fort at Willcox exit 1 Extremely difficult to find 1 Lacking signs 1 Need better signage 1 Was looking for Chiricahua and did not notice
them 1
State highway signs AZ-186 could be better marked 3 (N=12) Need more signs 3 Signs were misleading 2 Extremely difficult to find 1 Lacking signs 1 Not enough signs to interstate 1 Signs pointed to Chiricahua only at some points 1

Fort Bowie National Historic Site – VSP Visitor Survey Study 243 March 1 – May 2, 2011
_______________ *total percentages do not equal 100 due to rounding **total percentages do not equal 100 because visitors could select more than one answer 26
Table 12. Comments on directional signs (continued)
Sign type Comment Number of times
mentioned
Signs in local communities There were none at Wilcox 9 (N=27) Did not see any 6 Need more signs 3 No signs in local communities 2 Sign in Willcox only listed Chiricahua 2 Confusing signs 1 Extremely difficult to find 1 Need more signs at the point that I changed
directions on the rural dirt roads 1
The park sign was green, not the traditional brown/white, which is used for national parks
1
We were on the right route 1
Signs in the park All were confusing and not exact 2 (N=18) Confusing "handicapped access only" implied
not used for other access caused missed turn
1
Hard to find handicap parking and access areas 1 I did not realize that there is a return loop trail 1 Instead of a sign that says "Ruins Trail," have
"Fort" sign 1
Need clearer signs for people with disabilities 1 Need large overall map of buildings 1 Need more information about trail to visitor
center 1
No directions to road leading to visitor center 1 No mention of water availability 1 No signage showing direction to visitor center 1 One major trail split had no directional sign 1 Several signs from previous visits were not in
evidence on this trip 1
Signs along the hike could be better 1 Signs were for hikers and not for car visitors 1 Too far from main road 1 We weren't sure that the display area/bathrooms
was the actual trailhead 1
Fort Bowie National Historic Site – VSP Visitor Survey Study 243 March 1 – May 2, 2011
_______________ *total percentages do not equal 100 due to rounding **total percentages do not equal 100 because visitors could select more than one answer 27
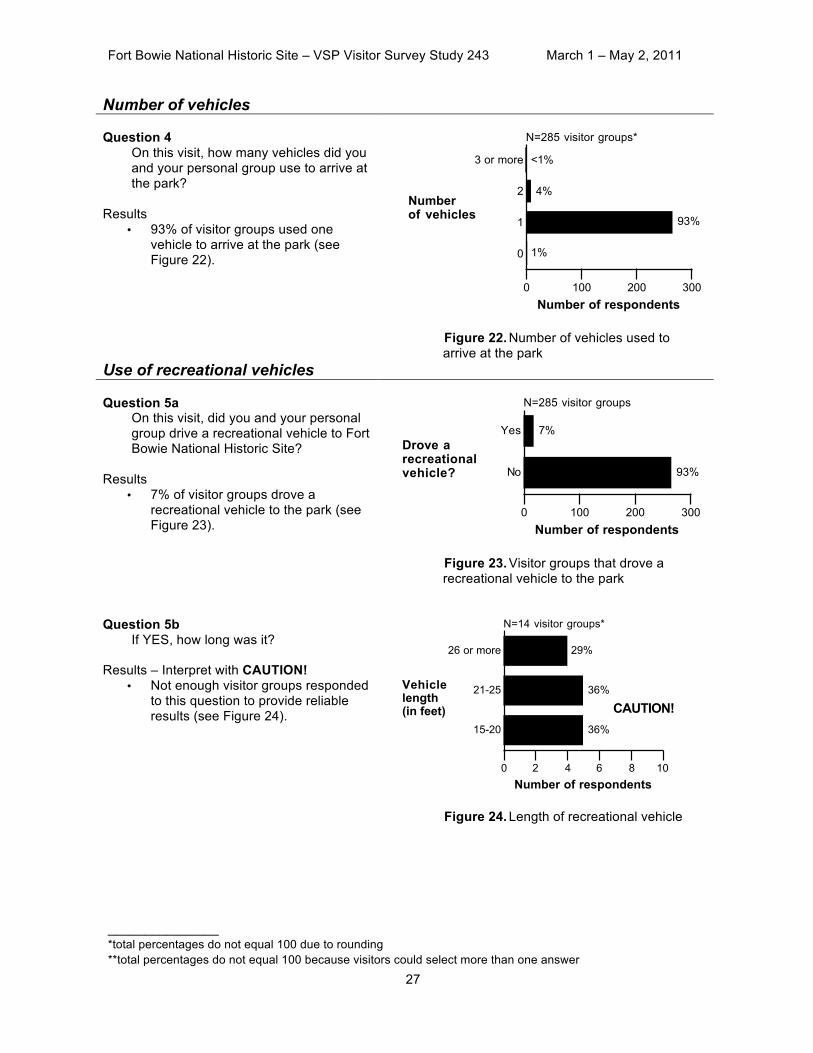
Number of vehicles Question 4
On this visit, how many vehicles did you and your personal group use to arrive at the park?
Results
• 93% of visitor groups used one vehicle to arrive at the park (see Figure 22).
Figure 22. Number of vehicles used to arrive at the park
Use of recreational vehicles Question 5a
On this visit, did you and your personal group drive a recreational vehicle to Fort Bowie National Historic Site?
Results • 7% of visitor groups drove a
recreational vehicle to the park (see Figure 23).
Figure 23. Visitor groups that drove a recreational vehicle to the park
Question 5b
If YES, how long was it?
Results – Interpret with CAUTION! • Not enough visitor groups responded
to this question to provide reliable results (see Figure 24).
Figure 24. Length of recreational vehicle
0 100 200 300Number of respondents
0
1
2
3 or more
1%
93%
4%
<1%
N=285 visitor groups*
Numberof vehicles
0 100 200 300Number of respondents
No
Yes
93%
7%
N=285 visitor groups
Drove arecreationalvehicle?
0 2 4 6 8 10Number of respondents
15-20
21-25
26 or more
36%
36%
29%
N=14 visitor groups*
Vehiclelength(in feet) CAUTION!

Fort Bowie National Historic Site – VSP Visitor Survey Study 243 March 1 – May 2, 2011
_______________ *total percentages do not equal 100 due to rounding **total percentages do not equal 100 because visitors could select more than one answer 28
Question 5c On this visit, were you and your personal group in a vehicle or recreational vehicle pulling a trailer or another vehicle?
Results • 5% of visitor groups were in a
vehicle or recreational vehicle pulling a trailer or another vehicle (see Figure 25).
Figure 25. Visitor groups in a vehicle pulling a trailer or another vehicle
Question 5d
If YES, how long was it?
Results – Interpret with CAUTION! • Not enough visitor groups responded
to this question to provide reliable results (see Figure 26).
Figure 26. Length of pulled vehicle
Number of park entries Question 12e
On this trip, how many times did you and your personal group enter the park?
Results • 96% of visitor groups entered the
park one time (see Figure 27).
Figure 27. Number of park entries
0 100 200 300Number of respondents
No
Yes
95%
5%
N=276 visitor groups
Pulled trailer/other vehicle?
0 1 2 3 4 5Number of respondents
1-10
11-20
21-30
31 or more
8%
23%
31%
38%
N=13 visitor groups
Trailer/vehiclelength(in feet)
CAUTION!
0 25 50 75 100
Proportion of respondents
1
2
3 or more
96%
3%
1%
N=255 visitor groups
Numberof entries
Fort Bowie National Historic Site – VSP Visitor Survey Study 243 March 1 – May 2, 2011
_______________ *total percentages do not equal 100 due to rounding **total percentages do not equal 100 because visitors could select more than one answer 29
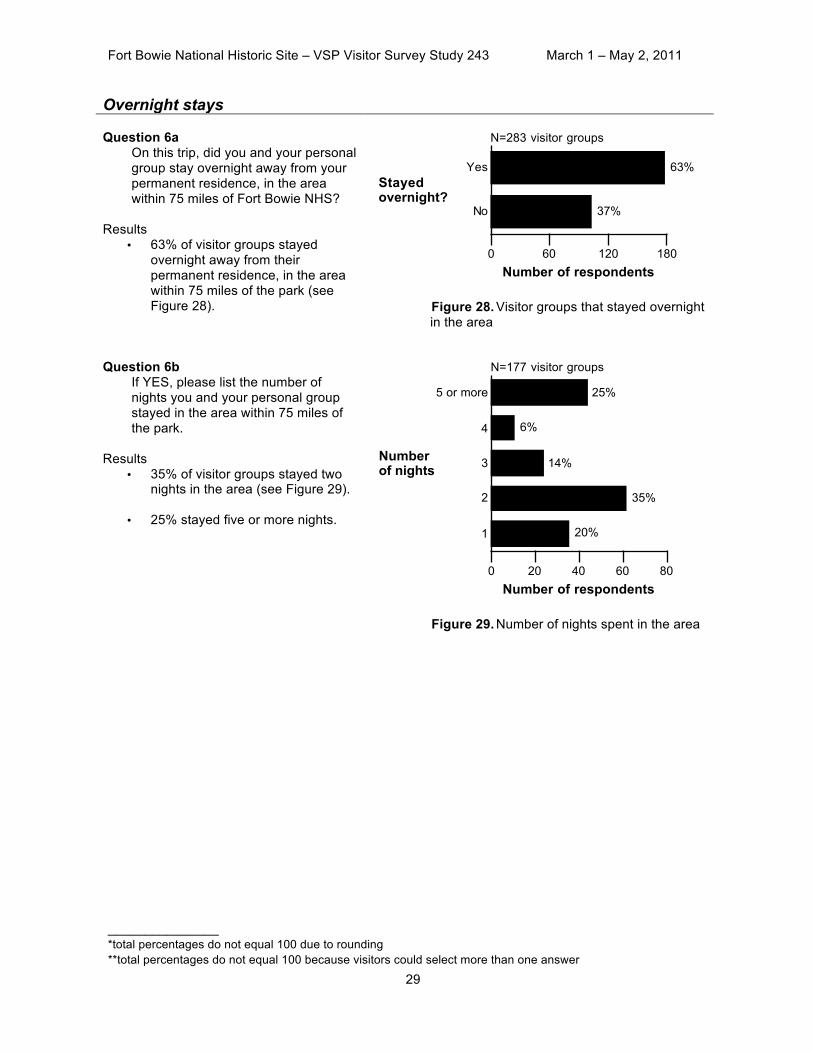
Overnight stays Question 6a
On this trip, did you and your personal group stay overnight away from your permanent residence, in the area within 75 miles of Fort Bowie NHS?
Results • 63% of visitor groups stayed
overnight away from their permanent residence, in the area within 75 miles of the park (see Figure 28).
Figure 28. Visitor groups that stayed overnight in the area
Question 6b
If YES, please list the number of nights you and your personal group stayed in the area within 75 miles of the park.
Results
• 35% of visitor groups stayed two nights in the area (see Figure 29).
• 25% stayed five or more nights.
Figure 29. Number of nights spent in the area
0 60 120 180Number of respondents
No
Yes
37%
63%
N=283 visitor groups
Stayedovernight?
0 20 40 60 80Number of respondents
1
2
3
4
5 or more
20%
35%
14%
6%
25%
N=177 visitor groups
Numberof nights
Fort Bowie National Historic Site – VSP Visitor Survey Study 243 March 1 – May 2, 2011
_______________ *total percentages do not equal 100 due to rounding **total percentages do not equal 100 because visitors could select more than one answer 30
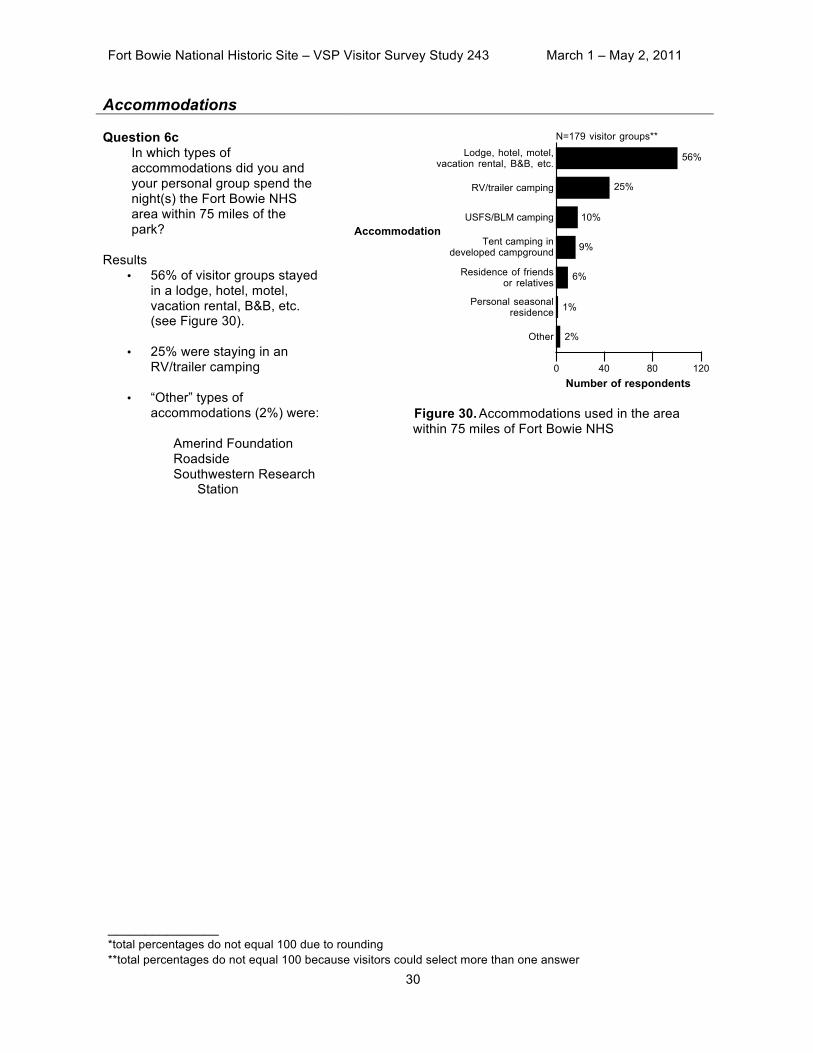
Accommodations Question 6c
In which types of accommodations did you and your personal group spend the night(s) the Fort Bowie NHS area within 75 miles of the park?
Results
• 56% of visitor groups stayed in a lodge, hotel, motel, vacation rental, B&B, etc. (see Figure 30).
• 25% were staying in an RV/trailer camping
• “Other” types of
accommodations (2%) were:
Amerind Foundation Roadside Southwestern Research
Station
Figure 30. Accommodations used in the area within 75 miles of Fort Bowie NHS
0 40 80 120Number of respondents
Other
Personal seasonalresidence
Residence of friendsor relatives
Tent camping indeveloped campground
USFS/BLM camping
RV/trailer camping
Lodge, hotel, motel,vacation rental, B&B, etc.
2%
1%
6%
9%
10%
25%
56%
N=179 visitor groups**
Accommodation

Fort Bowie National Historic Site – VSP Visitor Survey Study 243 March 1 – May 2, 2011
_______________ *total percentages do not equal 100 due to rounding **total percentages do not equal 100 because visitors could select more than one answer 31
Length of park visit Question 12b
On this visit, did you and your personal group visit Fort Bowie NHS on more than one day?
Results • 1% of visitor groups visited the park
on more than one day (see Figure 31).
Question 12c
If YES, on how many days did you visit the park?
Results – Interpret with CAUTION! • Not enough visitor groups
responded to this question to provide reliable results (see Figure 32).
Question 12a
On this visit, how many hours in total did you and your personal group spend visiting Fort Bowie NHS?
Results • 40% of visitor groups spent three
hours visiting the park (see Figure 33).
• 24% spent four hours.
• The average length of stay in the park for all visitor groups was 3.3 hours.
Figure 31. Visitor groups that visited the park on more than one day
Figure 32. Number of days spent at the park
Figure 33. Number of hours spent visiting the park
0 100 200 300Number of respondents
No
Yes
99%
1%
N=284 visitor groups
Visited onmore thanone day?
0 1 2Number of respondents
1
2
3
0%
67%
33%
N=3 visitor groups
Numberof days
CAUTION!
0 40 80 120Number of respondents
1
2
3
4
5 or more
6%
12%
40%
24%
18%
N=282 visitor groups
Numberof hours
Fort Bowie National Historic Site – VSP Visitor Survey Study 243 March 1 – May 2, 2011
_______________ *total percentages do not equal 100 due to rounding **total percentages do not equal 100 because visitors could select more than one answer 32
Length of stay in the park area
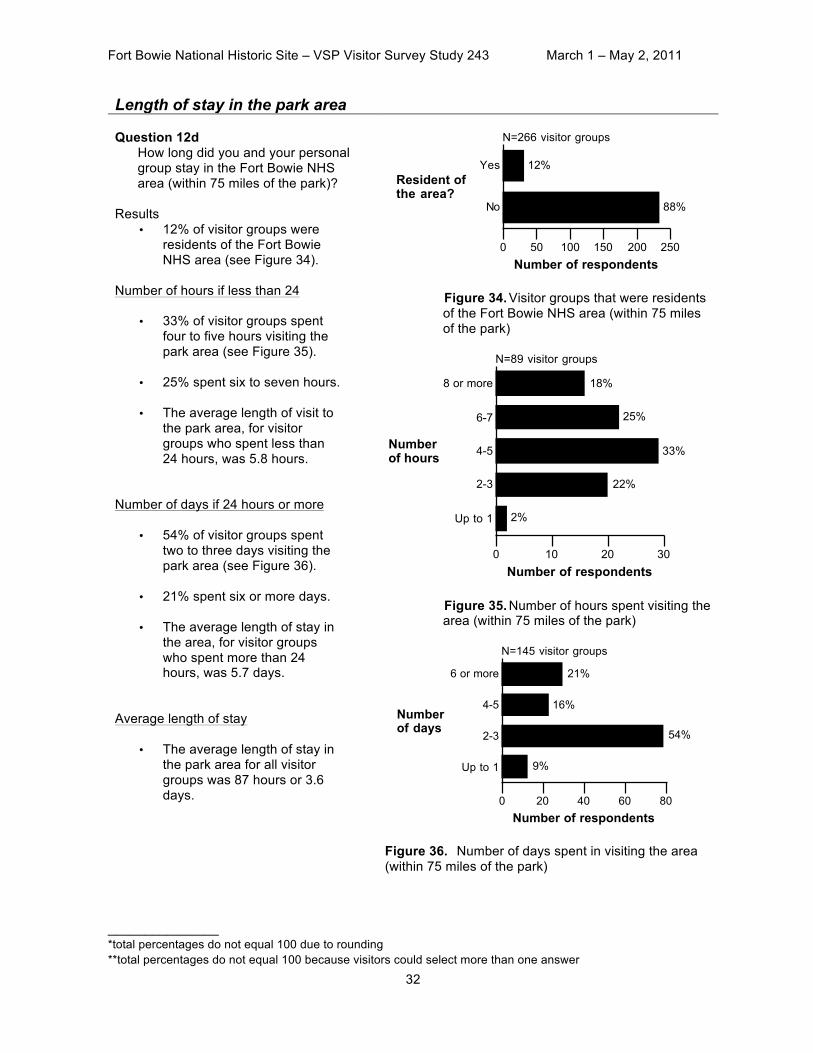
Question 12d How long did you and your personal group stay in the Fort Bowie NHS area (within 75 miles of the park)?
Results
• 12% of visitor groups were residents of the Fort Bowie NHS area (see Figure 34).
Number of hours if less than 24
• 33% of visitor groups spent four to five hours visiting the park area (see Figure 35).
• 25% spent six to seven hours.
• The average length of visit to the park area, for visitor groups who spent less than 24 hours, was 5.8 hours.
Number of days if 24 hours or more
• 54% of visitor groups spent two to three days visiting the park area (see Figure 36).
• 21% spent six or more days.
• The average length of stay in the area, for visitor groups who spent more than 24 hours, was 5.7 days.
Average length of stay
• The average length of stay in the park area for all visitor groups was 87 hours or 3.6 days.
Figure 34. Visitor groups that were residents of the Fort Bowie NHS area (within 75 miles of the park)
Figure 35. Number of hours spent visiting the area (within 75 miles of the park)
Figure 36. Number of days spent in visiting the area (within 75 miles of the park)
0 50 100 150 200 250Number of respondents
No
Yes
88%
12%
N=266 visitor groups
Resident ofthe area?
0 10 20 30
Number of respondents
Up to 1
2-3
4-5
6-7
8 or more
2%
22%
33%
25%
18%
N=89 visitor groups
Numberof hours
0 20 40 60 80Number of respondents
Up to 1
2-3
4-5
6 or more
9%
54%
16%
21%
N=145 visitor groups
Numberof days

Fort Bowie National Historic Site – VSP Visitor Survey Study 243 March 1 – May 2, 2011
_______________ *total percentages do not equal 100 due to rounding **total percentages do not equal 100 because visitors could select more than one answer 33
Sites visited in the park Question 8
On this visit to Fort Bowie NHS, which park sites did you and your personal group visit?
Results • As shown in Figure 37, the most
commonly visited sites by visitor groups at Fort Bowie NHS were:
96% Ranger Station/Visitor Center 86% Cemetery 85% Apache Springs
• The least visited site was:
23% Accessible entrance
• “Other” sites (9%) visited are shown
in Table 13.
Figure 37. Sites visited Table 13. “Other” sites visited in the park (N=31 comments)
Site Number of times
mentioned
Second Fort Bowie 6 Site of Wagon Train Massacre 6 Stage Station 5 Chiricahua Apache Agency ruins 5 Apache Pass Battle Site 2 Bascom Affair 1 Butterfield Stage Station Ruins 1 Chiricahua Apache Indian Agency Ruins 1 Explored several sites of dry river beds 1 Howitzer 1 Siphon Canyon 1 Trailhead (unspecified) 1
0 100 200 300Number of respondents
Other
Accessibleentrance
Butterfield OverlandTrail
Overlook RidgeTrail
First Fort Bowie
Fort BowieRuins Trail
Apache Springs
Cemetery
Ranger Station/Visitor Center
9%
23%
44%
51%
62%
82%
85%
86%
96%
N=282 visitor groups**
Sitesvisited
Fort Bowie National Historic Site – VSP Visitor Survey Study 243 March 1 – May 2, 2011
_______________ *total percentages do not equal 100 due to rounding **total percentages do not equal 100 because visitors could select more than one answer 34
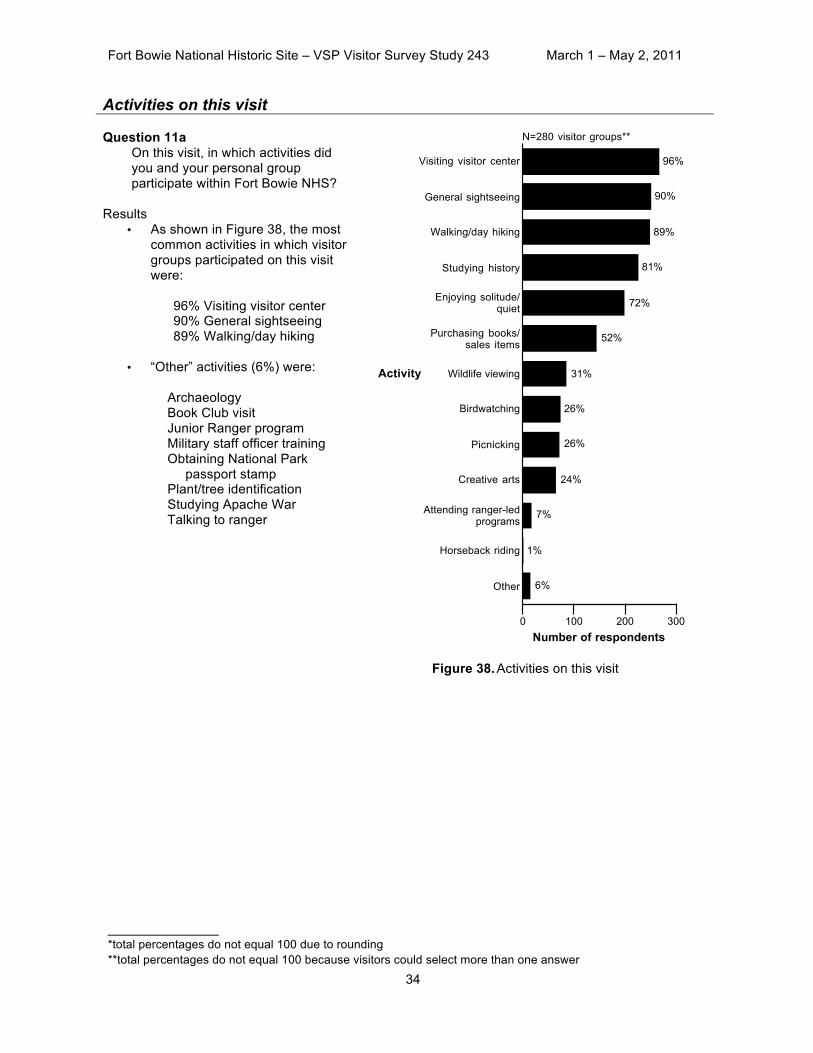
Activities on this visit Question 11a
On this visit, in which activities did you and your personal group participate within Fort Bowie NHS?
Results
• As shown in Figure 38, the most common activities in which visitor groups participated on this visit were:
96% Visiting visitor center 90% General sightseeing 89% Walking/day hiking
• “Other” activities (6%) were:
Archaeology Book Club visit Junior Ranger program Military staff officer training Obtaining National Park
passport stamp Plant/tree identification Studying Apache War Talking to ranger
Figure 38. Activities on this visit
0 100 200 300
Number of respondents
Other
Horseback riding
Attending ranger-ledprograms
Creative arts
Picnicking
Birdwatching
Wildlife viewing
Purchasing books/sales items
Enjoying solitude/quiet
Studying history
Walking/day hiking
General sightseeing
Visiting visitor center
6%
1%
7%
24%
26%
26%
31%
52%
72%
81%
89%
90%
96%
N=280 visitor groups**
Activity

Fort Bowie National Historic Site – VSP Visitor Survey Study 243 March 1 – May 2, 2011
_______________ *total percentages do not equal 100 due to rounding **total percentages do not equal 100 because visitors could select more than one answer 35
Table 14. Most important activity (N=number of times mentioned)
Importance (%)*
Activity N 1st 2nd 3rd
Studying history 191 47 36 17
Walking/day hiking 169 43 31 27
General sightseeing 104 31 39 30
Enjoying solitude/quiet 62 37 23 40
Visiting visitor center 96 11 46 43
Attending ranger-led programs 18 50 1 26
Creative arts (photography/drawing/ painting/writing) 19 37 32 32
Birdwatching 16 31 19 50
Picnicking 6 0 67 33
Wildlife viewing (other than birds) 15 0 13 87
Purchasing books/sales items 8 0 13 88
Other 23 35 35 30
Most important activities Question 11c
Which three of the above activities were most important to you and your personal group?
Results
• As shown in Table 14, the “most important activities” most commonly listed as first by visitor groups were:
Studying history Walking/day hiking General sightseeing

Fort Bowie National Historic Site – VSP Visitor Survey Study 243 March 1 – May 2, 2011
_______________ *total percentages do not equal 100 due to rounding **total percentages do not equal 100 because visitors could select more than one answer 36
Activities on future visit Question 11b
If you were to visit the park in the future, in which activities would you and your personal group prefer to participate within the park?
Results • As shown in Figure 39, the most
common activities in which visitor groups would prefer to participate on a future visit were:
81% Visiting visitor center 78% Walking/day hiking 75% Studying history
• “Other” activities (7%) were:
Archaeology Camping Geology Military staff officer training Plant/tree identification Program led by Native
Americans Take an audio-tour of the ruins Talking to ranger
Figure 39. Activities on a future visit
0 100 200Number of respondents
Other
Horseback riding
Creative arts
Birdwatching
Picnicking
Purchasing books/sales items
Attending ranger-ledprograms
Wildlife viewing
Enjoying solitude/quiet
General sightseeing
Studying history
Walking/day hiking
Visiting visitor center
7%
12%
28%
36%
41%
52%
52%
53%
66%
74%
75%
78%
81%
N=232 visitor groups**
Activity

Fort Bowie National Historic Site – VSP Visitor Survey Study 243 March 1 – May 2, 2011
_______________ *total percentages do not equal 100 due to rounding **total percentages do not equal 100 because visitors could select more than one answer 37
Use of trail to the fort Question 9a
On this visit to Fort Bowie NHS, did you and/or anyone in your personal group walk the 1.5 mile trail between the parking area and the fort?
Results • 91% of visitor groups walked the 1.5
mile trail to the fort (see Figure 40).
Figure 40. Visitor groups that walked the 1.5 mile trail to the fort
Question 9b
On this visit to Fort Bowie NHS, did you and/or anyone in your personal group walk around the Fort Bowie ruins?
Results • 85% of visitor groups walked around the
Fort Bowie ruins (see Figure 41).
Figure 41. Visitor groups that walked around the ruins
0 100 200 300Number of respondents
No
Yes
9%
91%
N=283 visitor groups
Walked tothe fort?
0 50 100 150 200 250Number of respondents
No
Yes
15%
85%
N=284 visitor groups
Walk aroundFort Bowieruins?
Fort Bowie National Historic Site – VSP Visitor Survey Study 243 March 1 – May 2, 2011
_______________ *total percentages do not equal 100 due to rounding **total percentages do not equal 100 because visitors could select more than one answer 38
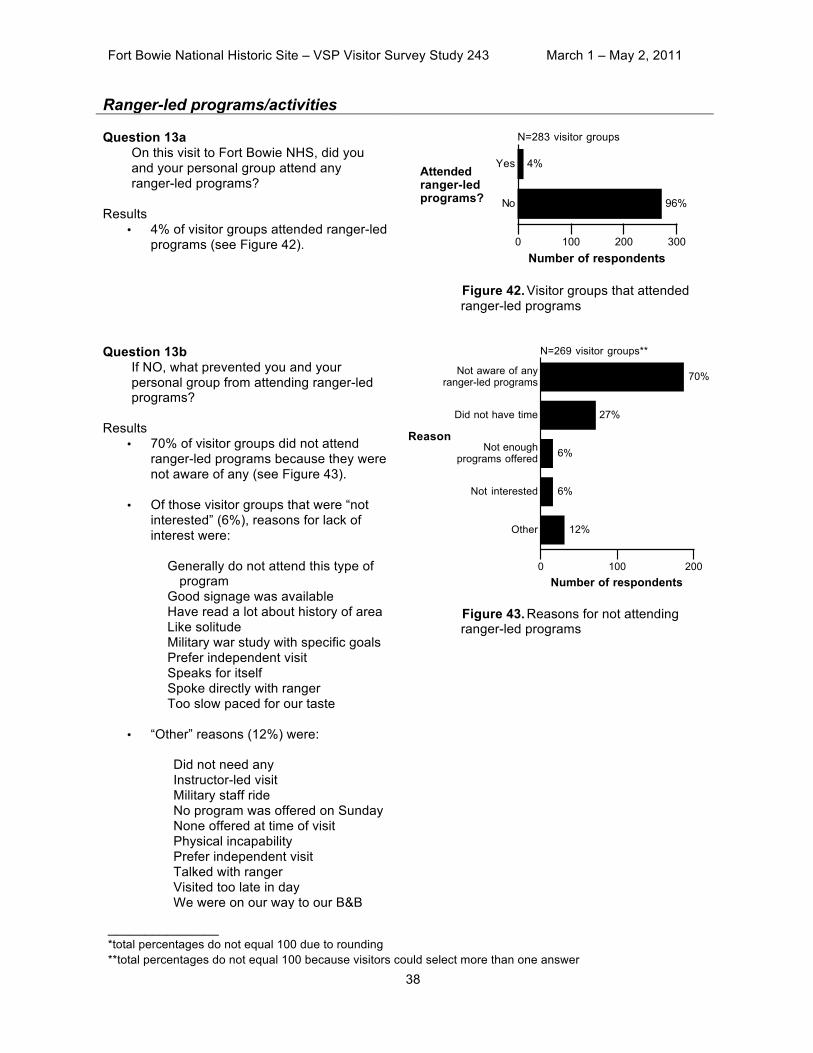
Ranger-led programs/activities Question 13a
On this visit to Fort Bowie NHS, did you and your personal group attend any ranger-led programs?
Results
• 4% of visitor groups attended ranger-led programs (see Figure 42).
Figure 42. Visitor groups that attended ranger-led programs
Question 13b
If NO, what prevented you and your personal group from attending ranger-led programs?
Results
• 70% of visitor groups did not attend ranger-led programs because they were not aware of any (see Figure 43).
• Of those visitor groups that were “not interested” (6%), reasons for lack of interest were:
Generally do not attend this type of program
Good signage was available Have read a lot about history of area Like solitude Military war study with specific goals Prefer independent visit Speaks for itself Spoke directly with ranger Too slow paced for our taste
Figure 43. Reasons for not attending ranger-led programs
• “Other” reasons (12%) were:
Did not need any Instructor-led visit Military staff ride No program was offered on Sunday None offered at time of visit Physical incapability Prefer independent visit Talked with ranger Visited too late in day We were on our way to our B&B
0 100 200 300Number of respondents
No
Yes
96%
4%
N=283 visitor groups
Attendedranger-ledprograms?
0 100 200Number of respondents
Other
Not interested
Not enoughprograms offered
Did not have time
Not aware of anyranger-led programs
12%
6%
6%
27%
70%
N=269 visitor groups**
Reason
Fort Bowie National Historic Site – VSP Visitor Survey Study 243 March 1 – May 2, 2011
_______________ *total percentages do not equal 100 due to rounding **total percentages do not equal 100 because visitors could select more than one answer 39
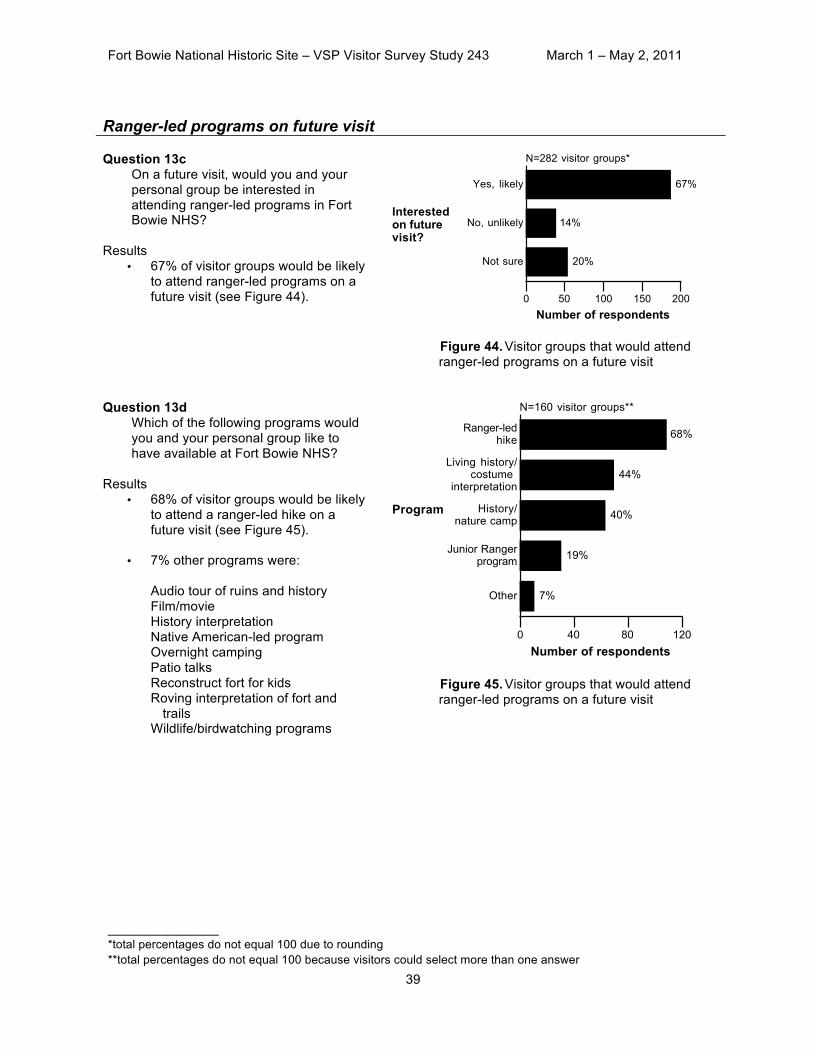
Ranger-led programs on future visit Question 13c
On a future visit, would you and your personal group be interested in attending ranger-led programs in Fort Bowie NHS?
Results
• 67% of visitor groups would be likely to attend ranger-led programs on a future visit (see Figure 44).
Figure 44. Visitor groups that would attend ranger-led programs on a future visit
Question 13d
Which of the following programs would you and your personal group like to have available at Fort Bowie NHS?
Results
• 68% of visitor groups would be likely to attend a ranger-led hike on a future visit (see Figure 45).
• 7% other programs were:
Audio tour of ruins and history Film/movie History interpretation Native American-led program Overnight camping Patio talks Reconstruct fort for kids Roving interpretation of fort and
trails Wildlife/birdwatching programs
Figure 45. Visitor groups that would attend ranger-led programs on a future visit
0 50 100 150 200Number of respondents
Not sure
No, unlikely
Yes, likely
20%
14%
67%
N=282 visitor groups*
Interestedon futurevisit?
0 40 80 120Number of respondents
Other
Junior Rangerprogram
History/nature camp
Living history/costume
interpretation
Ranger-ledhike
7%
19%
40%
44%
68%
N=160 visitor groups**
Program
Fort Bowie National Historic Site – VSP Visitor Survey Study 243 March 1 – May 2, 2011
_______________ *total percentages do not equal 100 due to rounding **total percentages do not equal 100 because visitors could select more than one answer 40
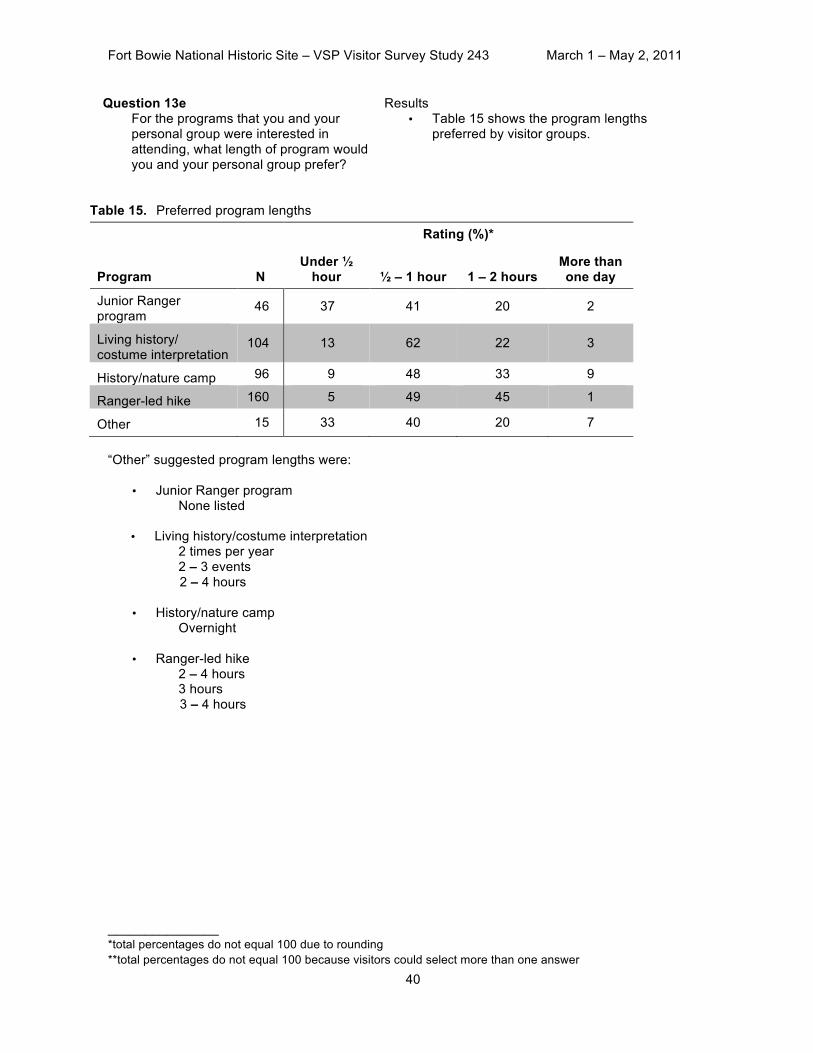
Table 15. Preferred program lengths
Rating (%)*
Program
N
Under ! hour ! – 1 hour 1 – 2 hours
More than one day
Junior Ranger program
46 37 41 20 2
Living history/ costume interpretation
104 13 62 22 3
History/nature camp 96 9 48 33 9
Ranger-led hike 160 5 49 45 1
Other 15 33 40 20 7
“Other” suggested program lengths were:
• Junior Ranger program None listed
• Living history/costume interpretation 2 times per year 2 – 3 events 2 – 4 hours
• History/nature camp Overnight
• Ranger-led hike 2 – 4 hours 3 hours 3 – 4 hours
Question 13e For the programs that you and your personal group were interested in attending, what length of program would you and your personal group prefer?
Results • Table 15 shows the program lengths
preferred by visitor groups.

Fort Bowie National Historic Site – VSP Visitor Survey Study 243 March 1 – May 2, 2011
_______________ *total percentages do not equal 100 due to rounding **total percentages do not equal 100 because visitors could select more than one answer 41
Interpretive topics Question 14a
One of the purposes of Fort Bowie NHS is to present multiple viewpoints on the impacts of the Apache Wars on both the Apache and American cultures. Please indicate all the topics that you and your personal group learned about via park films/exhibits/ranger programs during this visit to Fort Bowie NHS.
Results
• As shown in Figure 46, the most common topics that visitor groups learned about were: 90% Events of the Battle of
Apache Pass 89% Natural setting where
events occurred 81% Events of the Apache Wars
Figure 46. Topics that visitor groups learned about via park films/exhibits/ranger programs
0 50 100 150 200 250
Number of respondents
Apache culture priorto the battle
Impact of the ApacheWars on Apache History
Impact of theApache Wars onAmerican History
Events of theApache Wars
Natural setting whereevents occurred
Events of the Battleof Apache Pass
63%
65%
70%
81%
89%
90%
N=224 visitor groups**
Topic

Fort Bowie National Historic Site – VSP Visitor Survey Study 243 March 1 – May 2, 2011
_______________ *total percentages do not equal 100 due to rounding **total percentages do not equal 100 because visitors could select more than one answer 42
Question 14b For only those topics that you learned about, please rate their importance in presenting different viewpoints of the Apache Wars.
Results
• Figure 47 shows the combined proportions of “extremely important” and “very important” ratings of topics that were rated by 30 or more visitor groups.
• The topics receiving the highest combined proportions of “extremely important” and “very important” ratings were:
76% Impact of the Apache
Wars on Apache History 74% Natural setting where
events occurred 74% Events of the Apache
Wars
• Table 16 shows how visitor groups rated the importance of each topic learned.
Figure 47. Combined proportions of “extremely important” and “very important” ratings of topics learned
Table 16. Importance ratings of topics learned (N=number of visitor groups that rated each topic)
Rating (%)*
Topic
N
Not important
Somewhat important
Moderately important
Very important
Extremely important
Events of the Battle of Apache Pass 224 1 4 22 38 35
Apache culture prior to the battle 170 2 10 24 35 30
Events of the Apache Wars 200 1 5 21 46 28
Impact of the Apache Wars on American history
183 1 5 22 37 34
Impact of the Apache Wars on Apache history
172 2 6 16 37 39
Natural setting where events occurred 217 2 4 19 38 36
0 20 40 60 80 100
Proportion of respondents
Apache culture priorto the battle
Impact of theApache Wars onAmerican History
Events of the Battleof Apache Pass
Events of theApache Wars
Natural setting whereevents occurred
Impact of the ApacheWars on Apache History
65%, N=170
71%, N=183
73%, N=224
74%, N=200
74%, N=217
76%, N=172
N=number of visitor groupsthat rated each item
Topic

Fort Bowie National Historic Site – VSP Visitor Survey Study 243 March 1 – May 2, 2011
_______________ *total percentages do not equal 100 due to rounding **total percentages do not equal 100 because visitors could select more than one answer 43
Question 14c For only those topics that you learned about, please rate the amount of information that you received.
Results
• Table 17 shows how visitor groups rated the quantity of information for each topic
Table 17. Ratings of quantity of information of topics learned (N=number of visitor groups that rated each topic)
Rating (%)*
Topic
N
Almost none
Some but not enough
About right
Too much
Events of the Battle of Apache Pass 211 2 21 76 1
Apache culture prior to the battle 162 10 36 52 1
Events of the Apache wars 193 2 26 70 2
Impacts of the Apache Wars on American history
171 6 32 61 1
Impacts of the Apache Wars on Apache history
161 9 35 54 1
Natural setting where events occurred 211 3 20 75 1
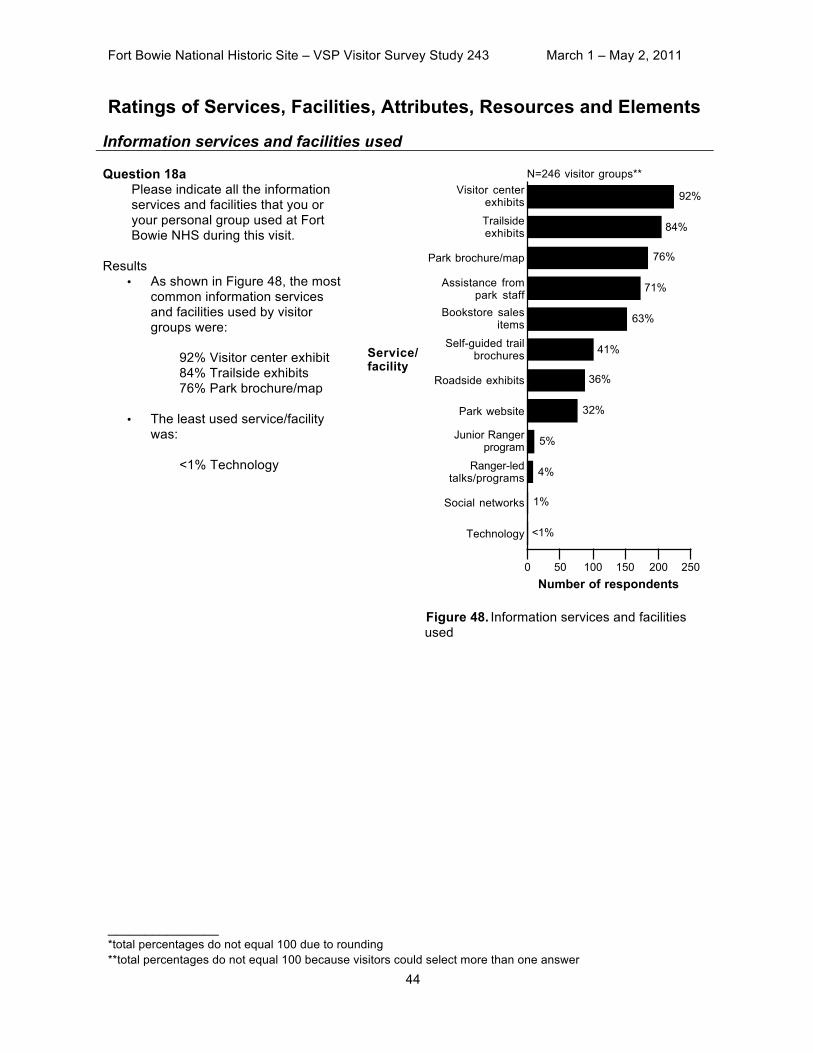
Fort Bowie National Historic Site – VSP Visitor Survey Study 243 March 1 – May 2, 2011
_______________ *total percentages do not equal 100 due to rounding **total percentages do not equal 100 because visitors could select more than one answer 44
Ratings of Services, Facilities, Attributes, Resources and Elements
Information services and facilities used Question 18a
Please indicate all the information services and facilities that you or your personal group used at Fort Bowie NHS during this visit.
Results
• As shown in Figure 48, the most common information services and facilities used by visitor groups were:
92% Visitor center exhibit 84% Trailside exhibits 76% Park brochure/map
• The least used service/facility
was: <1% Technology
Figure 48. Information services and facilities used
0 50 100 150 200 250Number of respondents
Technology
Social networks
Ranger-ledtalks/programs
Junior Rangerprogram
Park website
Roadside exhibits
Self-guided trailbrochures
Bookstore salesitems
Assistance frompark staff
Park brochure/map
Trailsideexhibits
Visitor centerexhibits
<1%
1%
4%
5%
32%
36%
41%
63%
71%
76%
84%
92%
N=246 visitor groups**
Service/facility
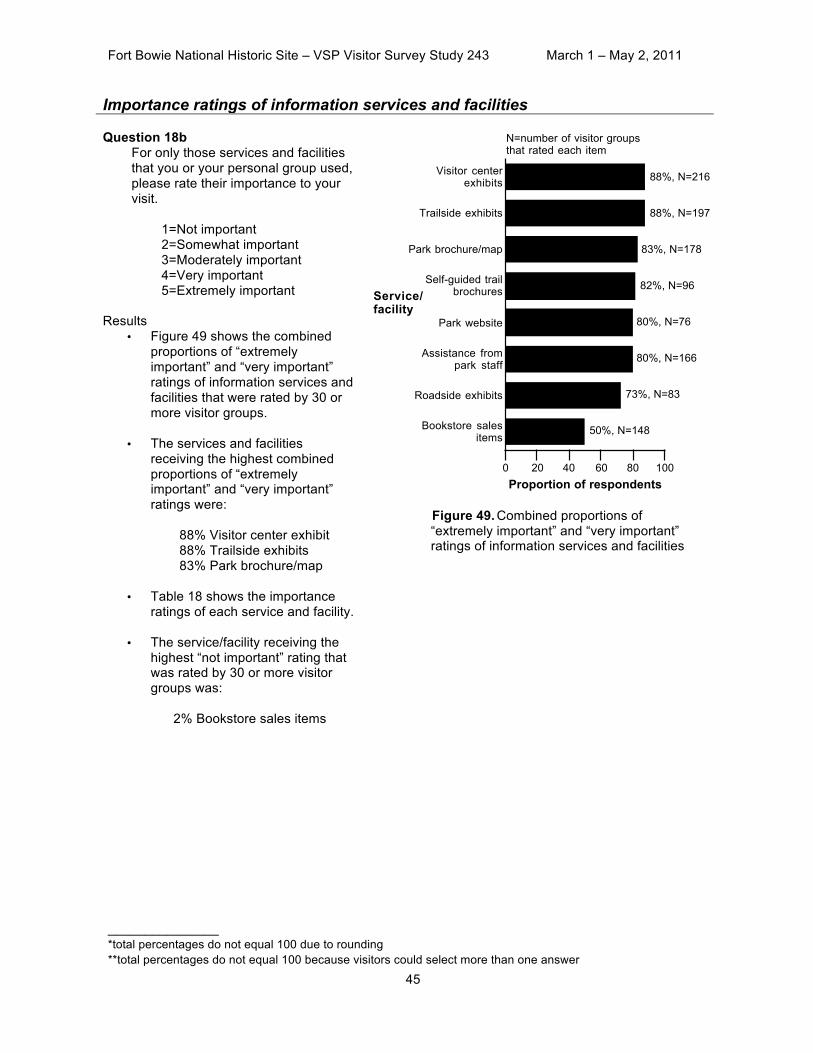
Fort Bowie National Historic Site – VSP Visitor Survey Study 243 March 1 – May 2, 2011
_______________ *total percentages do not equal 100 due to rounding **total percentages do not equal 100 because visitors could select more than one answer 45
Importance ratings of information services and facilities Question 18b
For only those services and facilities that you or your personal group used, please rate their importance to your visit.
1=Not important 2=Somewhat important 3=Moderately important 4=Very important 5=Extremely important
Results
• Figure 49 shows the combined proportions of “extremely important” and “very important” ratings of information services and facilities that were rated by 30 or more visitor groups.
• The services and facilities receiving the highest combined proportions of “extremely important” and “very important” ratings were:
88% Visitor center exhibit 88% Trailside exhibits 83% Park brochure/map
• Table 18 shows the importance
ratings of each service and facility.
• The service/facility receiving the highest “not important” rating that was rated by 30 or more visitor groups was:
2% Bookstore sales items
Figure 49. Combined proportions of “extremely important” and “very important” ratings of information services and facilities
0 20 40 60 80 100
Proportion of respondents
Bookstore salesitems
Roadside exhibits
Assistance frompark staff
Park website
Self-guided trailbrochures
Park brochure/map
Trailside exhibits
Visitor centerexhibits
50%, N=148
73%, N=83
80%, N=166
80%, N=76
82%, N=96
83%, N=178
88%, N=197
88%, N=216
N=number of visitor groupsthat rated each item
Service/facility
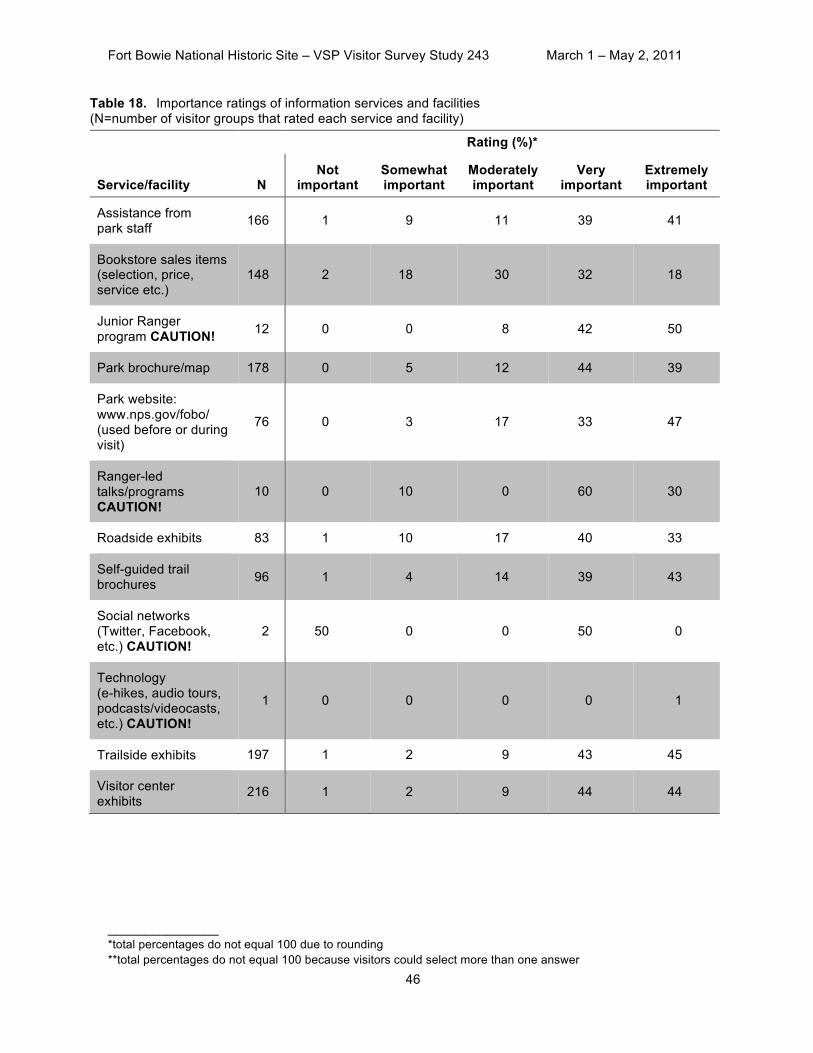
Fort Bowie National Historic Site – VSP Visitor Survey Study 243 March 1 – May 2, 2011
_______________ *total percentages do not equal 100 due to rounding **total percentages do not equal 100 because visitors could select more than one answer 46
Table 18. Importance ratings of information services and facilities (N=number of visitor groups that rated each service and facility)
Rating (%)*
Service/facility
N
Not important
Somewhat important
Moderately important
Very important
Extremely important
Assistance from park staff 166 1 9 11 39 41
Bookstore sales items (selection, price, service etc.)
148 2 18 30 32 18
Junior Ranger program CAUTION! 12 0 0 8 42 50
Park brochure/map 178 0 5 12 44 39
Park website: www.nps.gov/fobo/ (used before or during visit)
76 0 3 17 33 47
Ranger-led talks/programs CAUTION!
10 0 10 0 60 30
Roadside exhibits 83 1 10 17 40 33
Self-guided trail brochures 96 1 4 14 39 43
Social networks (Twitter, Facebook, etc.) CAUTION!
2 50 0 0 50 0
Technology (e-hikes, audio tours, podcasts/videocasts, etc.) CAUTION!
1 0 0 0 0 1
Trailside exhibits 197 1 2 9 43 45
Visitor center exhibits
216 1 2 9 44 44
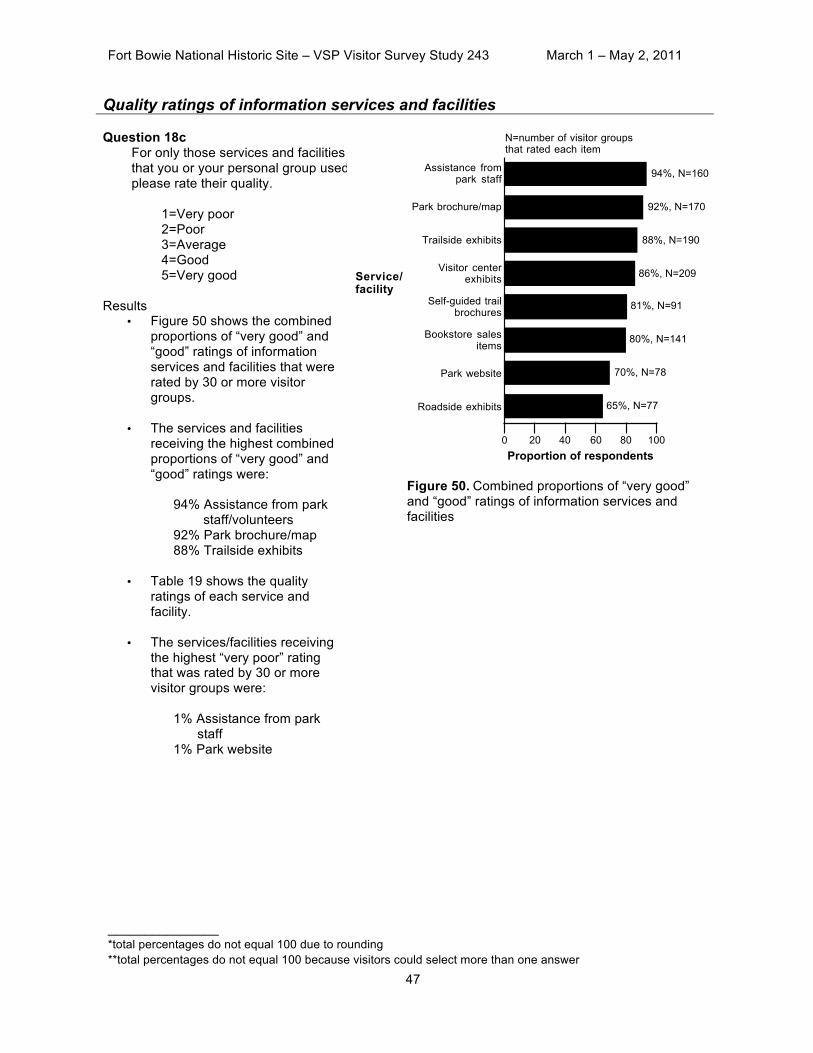
Fort Bowie National Historic Site – VSP Visitor Survey Study 243 March 1 – May 2, 2011
_______________ *total percentages do not equal 100 due to rounding **total percentages do not equal 100 because visitors could select more than one answer 47
Quality ratings of information services and facilities Question 18c
For only those services and facilities that you or your personal group used, please rate their quality.
1=Very poor 2=Poor 3=Average 4=Good 5=Very good
Results
• Figure 50 shows the combined proportions of “very good” and “good” ratings of information services and facilities that were rated by 30 or more visitor groups.
• The services and facilities receiving the highest combined proportions of “very good” and “good” ratings were:
94% Assistance from park
staff/volunteers 92% Park brochure/map 88% Trailside exhibits
• Table 19 shows the quality
ratings of each service and facility.
• The services/facilities receiving the highest “very poor” rating that was rated by 30 or more visitor groups were:
1% Assistance from park
staff 1% Park website
Figure 50. Combined proportions of “very good” and “good” ratings of information services and facilities
0 20 40 60 80 100
Proportion of respondents
Roadside exhibits
Park website
Bookstore salesitems
Self-guided trailbrochures
Visitor centerexhibits
Trailside exhibits
Park brochure/map
Assistance frompark staff
65%, N=77
70%, N=78
80%, N=141
81%, N=91
86%, N=209
88%, N=190
92%, N=170
94%, N=160
N=number of visitor groupsthat rated each item
Service/facility
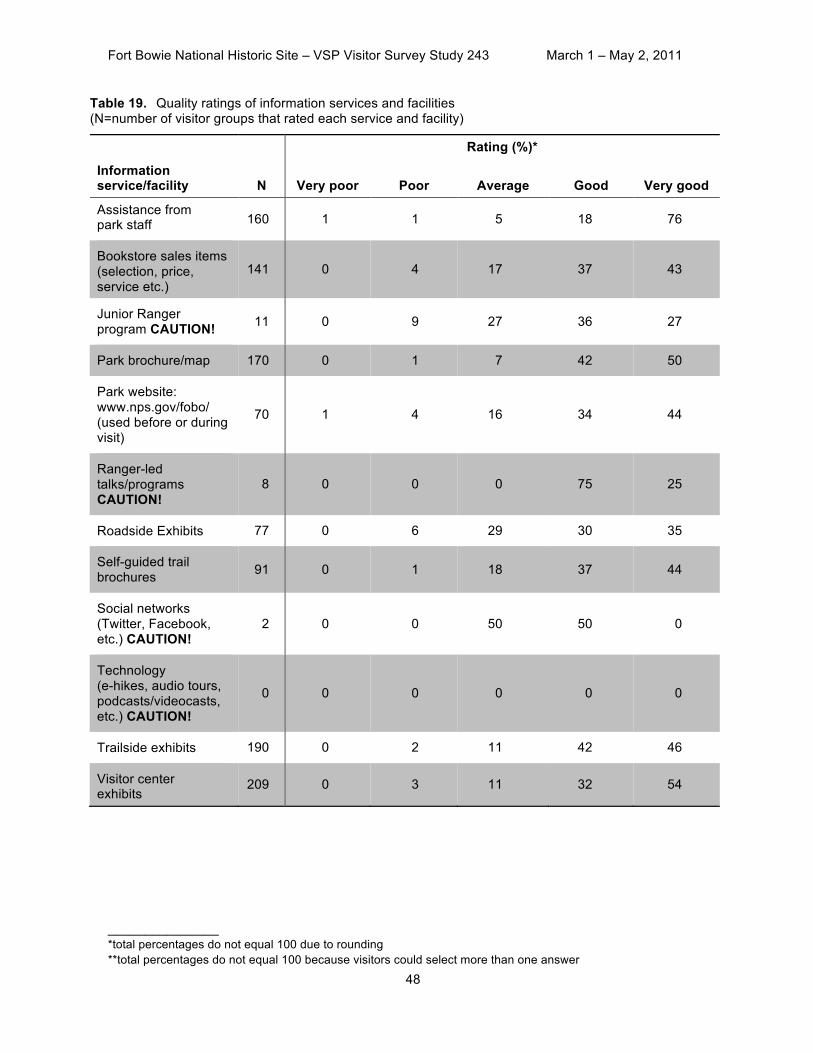
Fort Bowie National Historic Site – VSP Visitor Survey Study 243 March 1 – May 2, 2011
_______________ *total percentages do not equal 100 due to rounding **total percentages do not equal 100 because visitors could select more than one answer 48
Table 19. Quality ratings of information services and facilities (N=number of visitor groups that rated each service and facility)
Rating (%)*
Information service/facility N Very poor Poor Average Good Very good
Assistance from park staff 160 1 1 5 18 76
Bookstore sales items (selection, price, service etc.)
141 0 4 17 37 43
Junior Ranger program CAUTION! 11 0 9 27 36 27
Park brochure/map 170 0 1 7 42 50
Park website: www.nps.gov/fobo/ (used before or during visit)
70 1 4 16 34 44
Ranger-led talks/programs CAUTION!
8 0 0 0 75 25
Roadside Exhibits 77 0 6 29 30 35
Self-guided trail brochures 91 0 1 18 37 44
Social networks (Twitter, Facebook, etc.) CAUTION!
2 0 0 50 50 0
Technology (e-hikes, audio tours, podcasts/videocasts, etc.) CAUTION!
0 0 0 0 0 0
Trailside exhibits 190 0 2 11 42 46
Visitor center exhibits
209 0 3 11 32 54
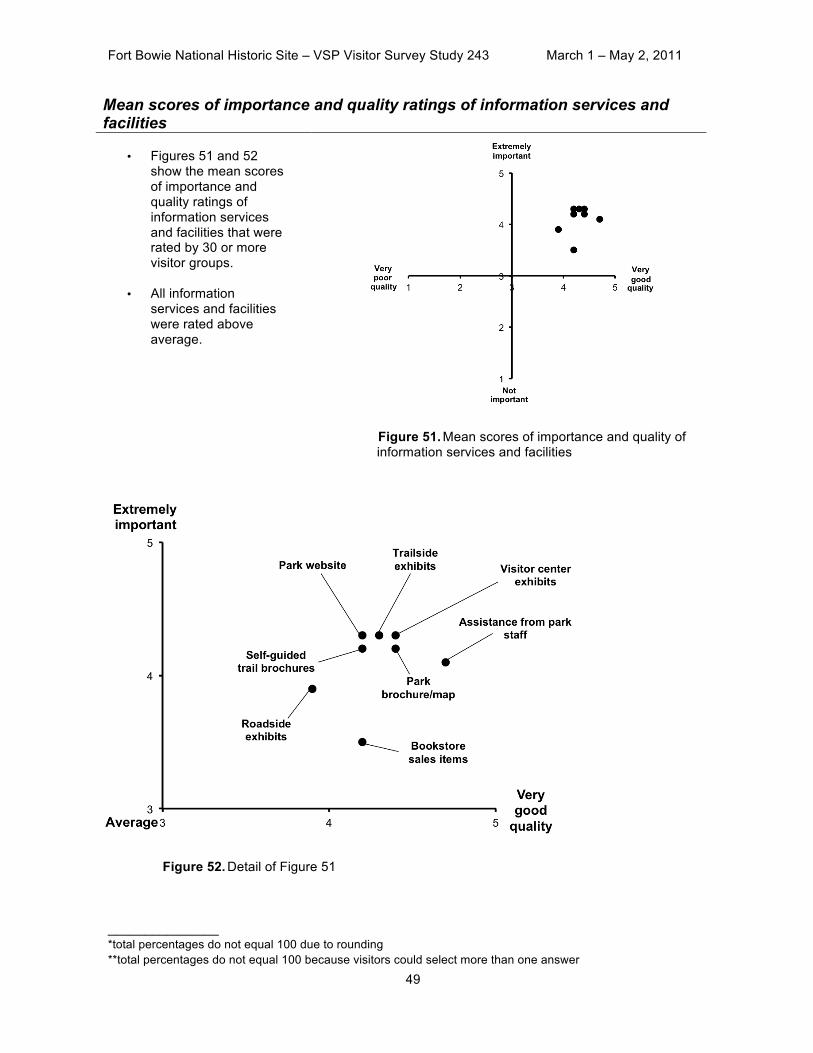
Fort Bowie National Historic Site – VSP Visitor Survey Study 243 March 1 – May 2, 2011
_______________ *total percentages do not equal 100 due to rounding **total percentages do not equal 100 because visitors could select more than one answer 49
Mean scores of importance and quality ratings of information services and facilities
• Figures 51 and 52 show the mean scores of importance and quality ratings of information services and facilities that were rated by 30 or more visitor groups.
• All information services and facilities were rated above average.
Figure 51. Mean scores of importance and quality of information services and facilities
Figure 52. Detail of Figure 51
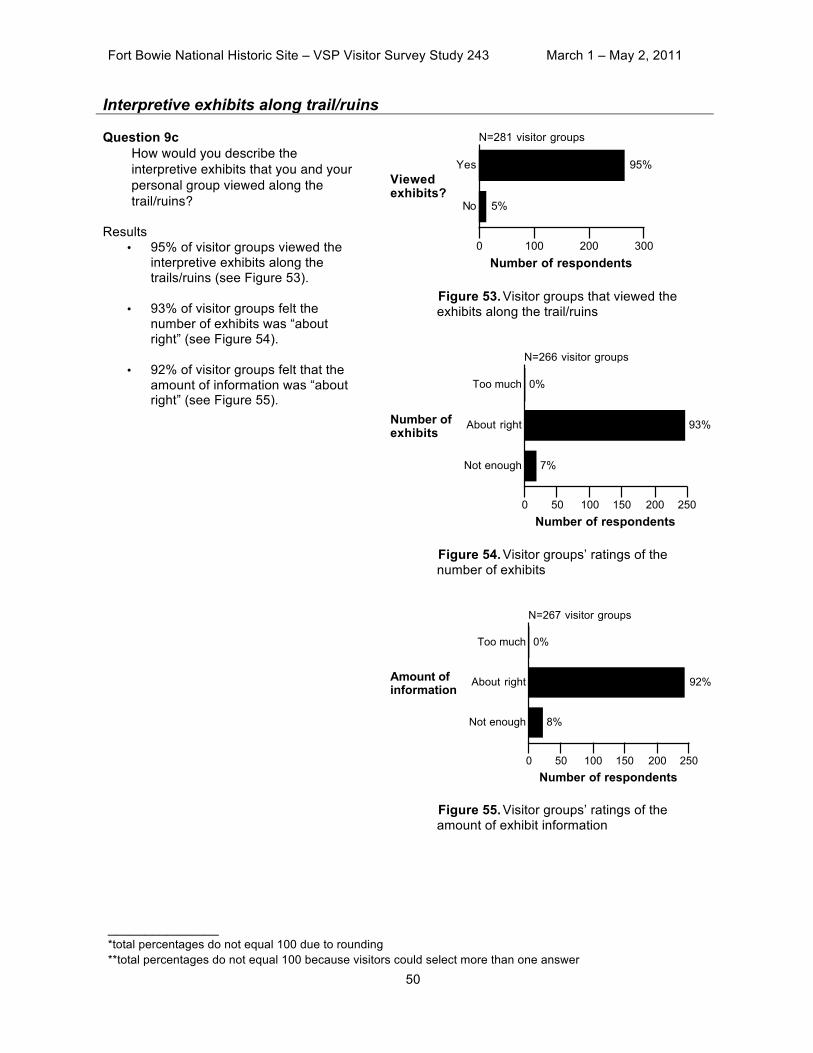
Fort Bowie National Historic Site – VSP Visitor Survey Study 243 March 1 – May 2, 2011
_______________ *total percentages do not equal 100 due to rounding **total percentages do not equal 100 because visitors could select more than one answer 50
Interpretive exhibits along trail/ruins Question 9c
How would you describe the interpretive exhibits that you and your personal group viewed along the trail/ruins?
Results • 95% of visitor groups viewed the
interpretive exhibits along the trails/ruins (see Figure 53).
• 93% of visitor groups felt the number of exhibits was “about right” (see Figure 54).
• 92% of visitor groups felt that the amount of information was “about right” (see Figure 55).
Figure 53. Visitor groups that viewed the exhibits along the trail/ruins
Figure 54. Visitor groups’ ratings of the number of exhibits
Figure 55. Visitor groups’ ratings of the amount of exhibit information
0 100 200 300Number of respondents
No
Yes
5%
95%
N=281 visitor groups
Viewedexhibits?
0 50 100 150 200 250Number of respondents
Not enough
About right
Too much
7%
93%
0%
N=266 visitor groups
Number ofexhibits
0 50 100 150 200 250
Number of respondents
Not enough
About right
Too much
8%
92%
0%
N=267 visitor groups
Amount ofinformation
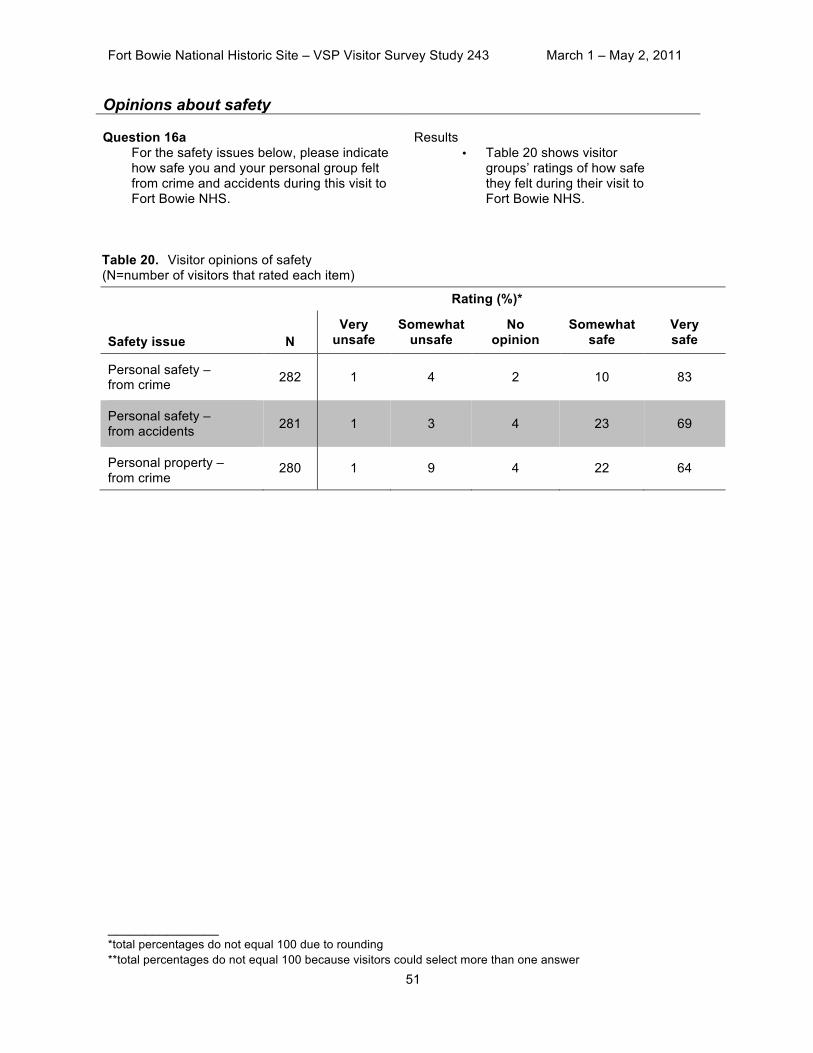
Fort Bowie National Historic Site – VSP Visitor Survey Study 243 March 1 – May 2, 2011
_______________ *total percentages do not equal 100 due to rounding **total percentages do not equal 100 because visitors could select more than one answer 51
Opinions about safety Question 16a
For the safety issues below, please indicate how safe you and your personal group felt from crime and accidents during this visit to Fort Bowie NHS.
Results
• Table 20 shows visitor groups’ ratings of how safe they felt during their visit to Fort Bowie NHS.
Table 20. Visitor opinions of safety (N=number of visitors that rated each item)
Rating (%)*
Safety issue
N
Very unsafe
Somewhat unsafe
No opinion
Somewhat safe
Very safe
Personal safety – from crime 282 1 4 2 10 83
Personal safety – from accidents 281 1 3 4 23 69
Personal property – from crime
280 1 9 4 22 64

Fort Bowie National Historic Site – VSP Visitor Survey Study 243 March 1 – May 2, 2011
_______________ *total percentages do not equal 100 due to rounding **total percentages do not equal 100 because visitors could select more than one answer 52
Question 16b If you indicated that you felt “very unsafe” or “somewhat unsafe” for any safety issues, please explain why.
Results • 52 visitor groups provided
reasons for feeling “very unsafe” or “somewhat unsafe” during their visit to Fort Bowie NHS (see Table 21).
Table 21. Reasons for not feeling safe N=56 comments; some visitor groups made more than one comment.)
Safety concern
Comment
Number of times mentioned
Personal safety – from crime
Illegal activity in the area 3
Border troubles 2 Isolated areas along the trails 1 Quite isolated and few others around 1
The issue of crime was a part of my decision not to hike
1
Personal safety – from No cell phone reception on trail 2 accidents Some trail areas were rocky/rustic 2
Encounters with poisonous snakes 1
It was not well-traveled that day - I'd just had surgery
1
Need more rangers present 1
Need better signage for handicap access 1
No handrails 1
Old people could slip 1
Parking next to the road makes an easy target 1
The overlook trail could have been marked as steep or rocky
1
Unable to walk on uneven ground 1
Personal property – from crime
Concerned about leaving the car in an isolated parking lot
24
Unattended parking lot (no cameras or patrol) 6
Illegal aliens and drug smugglers were in the area
2
Always concerned when away from home 1 Isolated areas along trails would allow attacks 1 Thief at trailheads 1
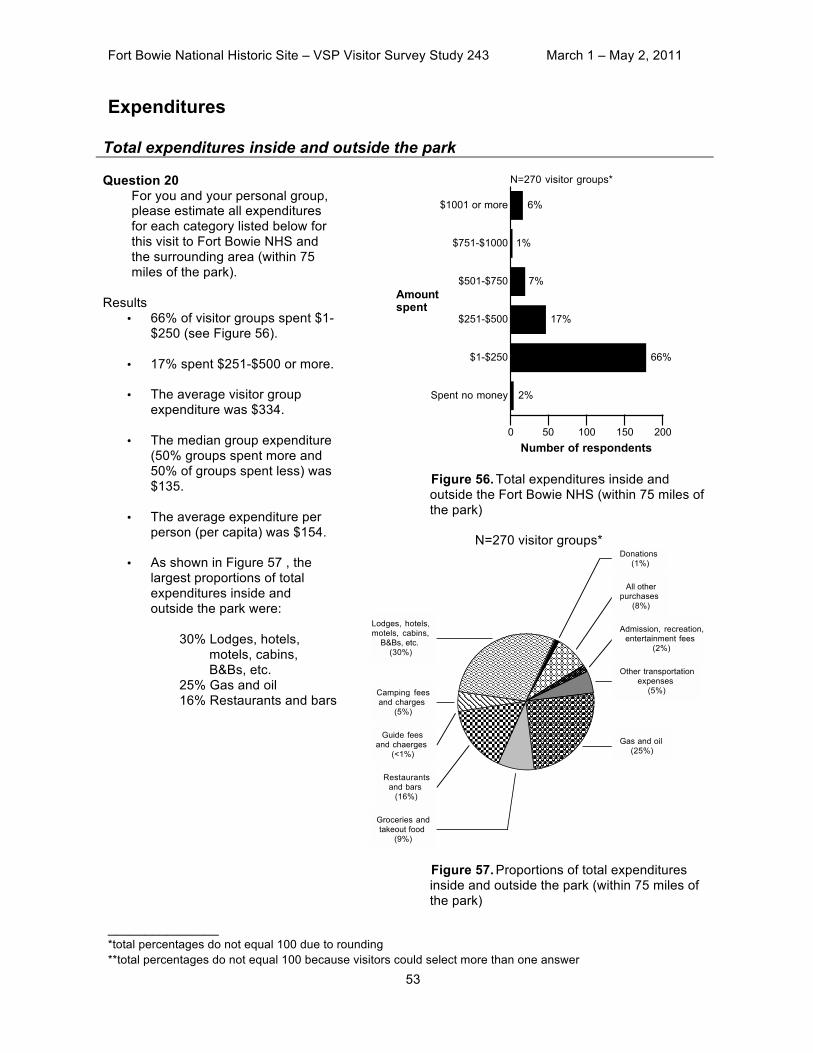
Fort Bowie National Historic Site – VSP Visitor Survey Study 243 March 1 – May 2, 2011
_______________ *total percentages do not equal 100 due to rounding **total percentages do not equal 100 because visitors could select more than one answer 53
Expenditures
Total expenditures inside and outside the park Question 20
For you and your personal group, please estimate all expenditures for each category listed below for this visit to Fort Bowie NHS and the surrounding area (within 75 miles of the park).
Results
• 66% of visitor groups spent $1-$250 (see Figure 56).
• 17% spent $251-$500 or more.
• The average visitor group expenditure was $334.
• The median group expenditure
(50% groups spent more and 50% of groups spent less) was $135.
• The average expenditure per
person (per capita) was $154.
• As shown in Figure 57 , the largest proportions of total expenditures inside and outside the park were:
30% Lodges, hotels,
motels, cabins, B&Bs, etc.
25% Gas and oil 16% Restaurants and bars
Figure 56. Total expenditures inside and outside the Fort Bowie NHS (within 75 miles of the park)
N=270 visitor groups*
Figure 57. Proportions of total expenditures inside and outside the park (within 75 miles of the park)
0 50 100 150 200Number of respondents
Spent no money
$1-$250
$251-$500
$501-$750
$751-$1000
$1001 or more
2%
66%
17%
7%
1%
6%
N=270 visitor groups*
Amountspent
Donations (1%)
All otherpurchases
(8%)
Admission, recreation,entertainment fees
(2%)
Other transportationexpenses
(5%)
Gas and oil (25%)
Groceries andtakeout food
(9%)
Restaurantsand bars
(16%)
Guide feesand chaerges
(<1%)
Camping feesand charges
(5%)
Lodges, hotels,motels, cabins,
B&Bs, etc. (30%)
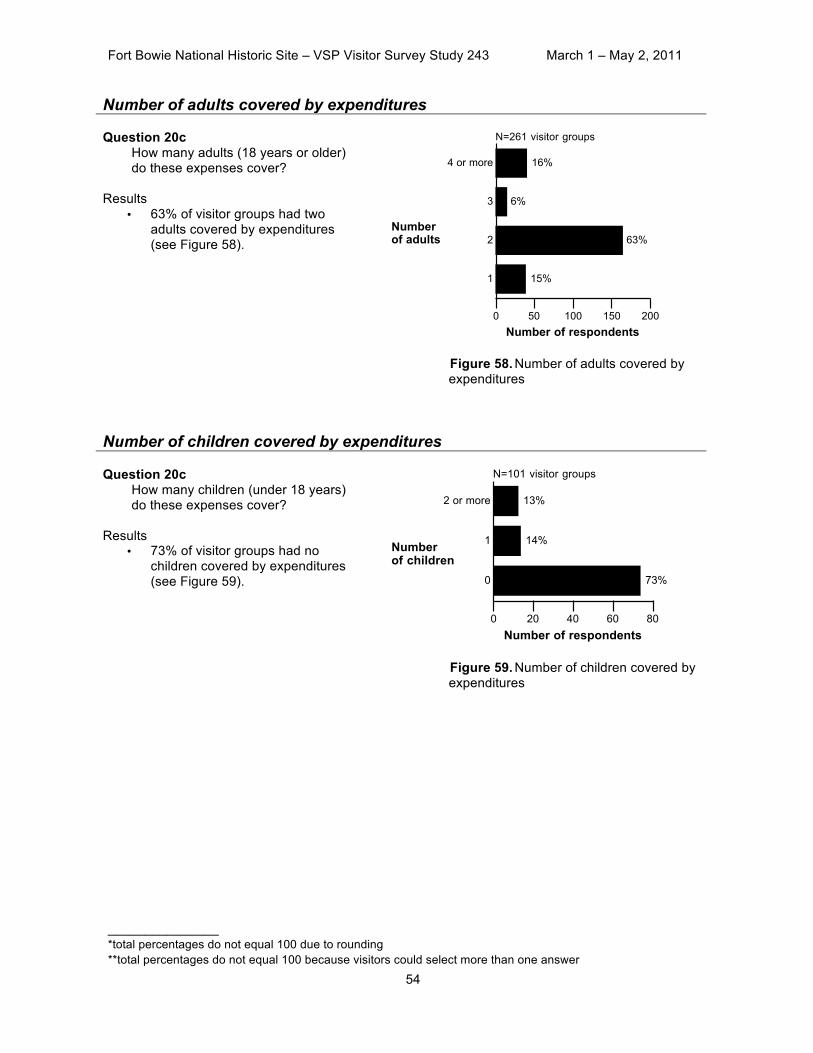
Fort Bowie National Historic Site – VSP Visitor Survey Study 243 March 1 – May 2, 2011
_______________ *total percentages do not equal 100 due to rounding **total percentages do not equal 100 because visitors could select more than one answer 54
Number of adults covered by expenditures Question 20c
How many adults (18 years or older) do these expenses cover?
Results
• 63% of visitor groups had two adults covered by expenditures (see Figure 58).
Figure 58. Number of adults covered by expenditures
Number of children covered by expenditures Question 20c
How many children (under 18 years) do these expenses cover?
Results
• 73% of visitor groups had no children covered by expenditures (see Figure 59).
Figure 59. Number of children covered by expenditures
0 50 100 150 200Number of respondents
1
2
3
4 or more
15%
63%
6%
16%
N=261 visitor groups
Numberof adults
0 20 40 60 80Number of respondents
0
1
2 or more
73%
14%
13%
N=101 visitor groups
Numberof children
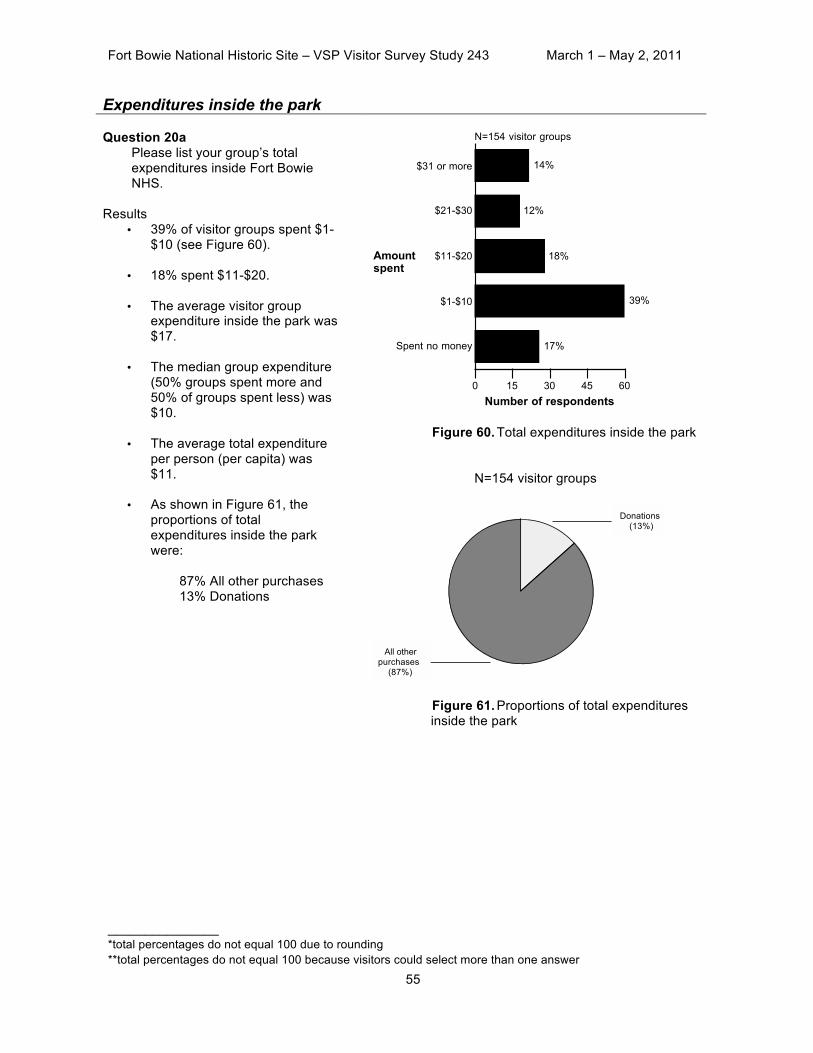
Fort Bowie National Historic Site – VSP Visitor Survey Study 243 March 1 – May 2, 2011
_______________ *total percentages do not equal 100 due to rounding **total percentages do not equal 100 because visitors could select more than one answer 55
Expenditures inside the park Question 20a
Please list your group’s total expenditures inside Fort Bowie NHS.
Results
• 39% of visitor groups spent $1-$10 (see Figure 60).
• 18% spent $11-$20.
• The average visitor group expenditure inside the park was $17.
• The median group expenditure
(50% groups spent more and 50% of groups spent less) was $10.
• The average total expenditure
per person (per capita) was $11.
• As shown in Figure 61, the
proportions of total expenditures inside the park were:
87% All other purchases 13% Donations
Figure 60. Total expenditures inside the park
N=154 visitor groups
Figure 61. Proportions of total expenditures inside the park
0 15 30 45 60
Number of respondents
Spent no money
$1-$10
$11-$20
$21-$30
$31 or more
17%
39%
18%
12%
14%
N=154 visitor groups
Amountspent
Donations (13%)
All otherpurchases
(87%)
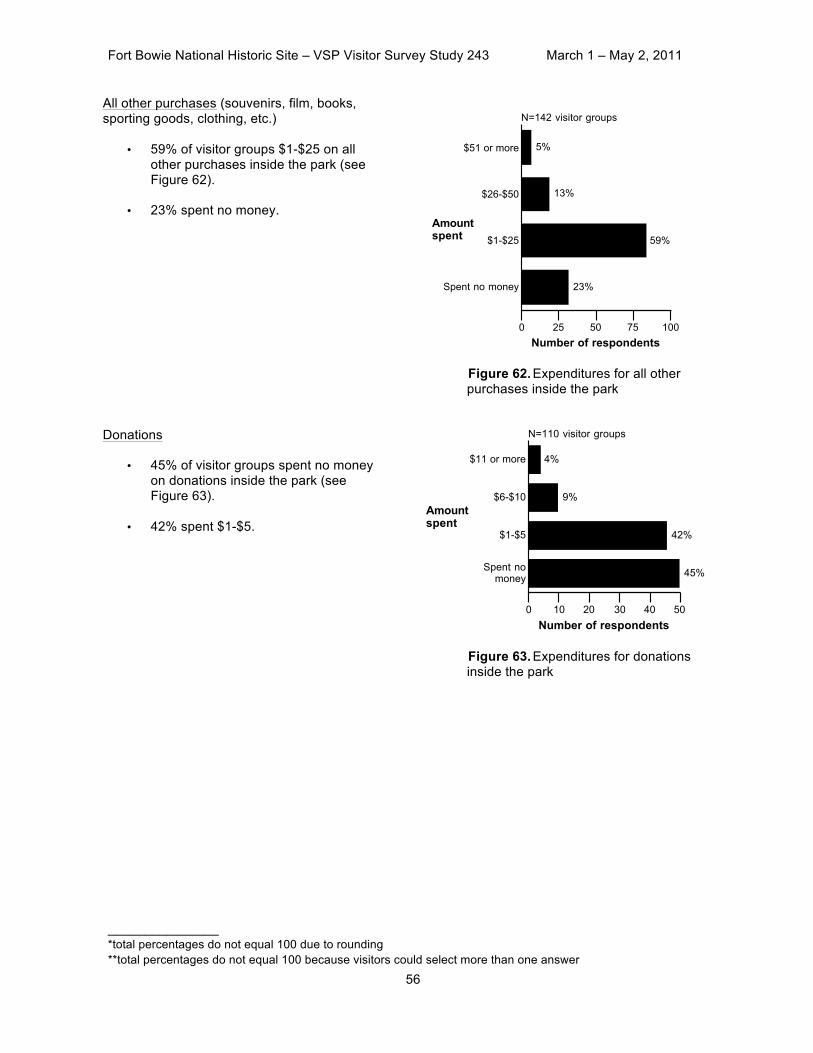
Fort Bowie National Historic Site – VSP Visitor Survey Study 243 March 1 – May 2, 2011
_______________ *total percentages do not equal 100 due to rounding **total percentages do not equal 100 because visitors could select more than one answer 56
All other purchases (souvenirs, film, books, sporting goods, clothing, etc.)
• 59% of visitor groups $1-$25 on all other purchases inside the park (see Figure 62).
• 23% spent no money.
Figure 62. Expenditures for all other purchases inside the park
Donations
• 45% of visitor groups spent no money on donations inside the park (see Figure 63).
• 42% spent $1-$5.
Figure 63. Expenditures for donations inside the park
0 25 50 75 100Number of respondents
Spent no money
$1-$25
$26-$50
$51 or more
23%
59%
13%
5%
N=142 visitor groups
Amountspent
0 10 20 30 40 50Number of respondents
Spent nomoney
$1-$5
$6-$10
$11 or more
45%
42%
9%
4%
N=110 visitor groups
Amountspent
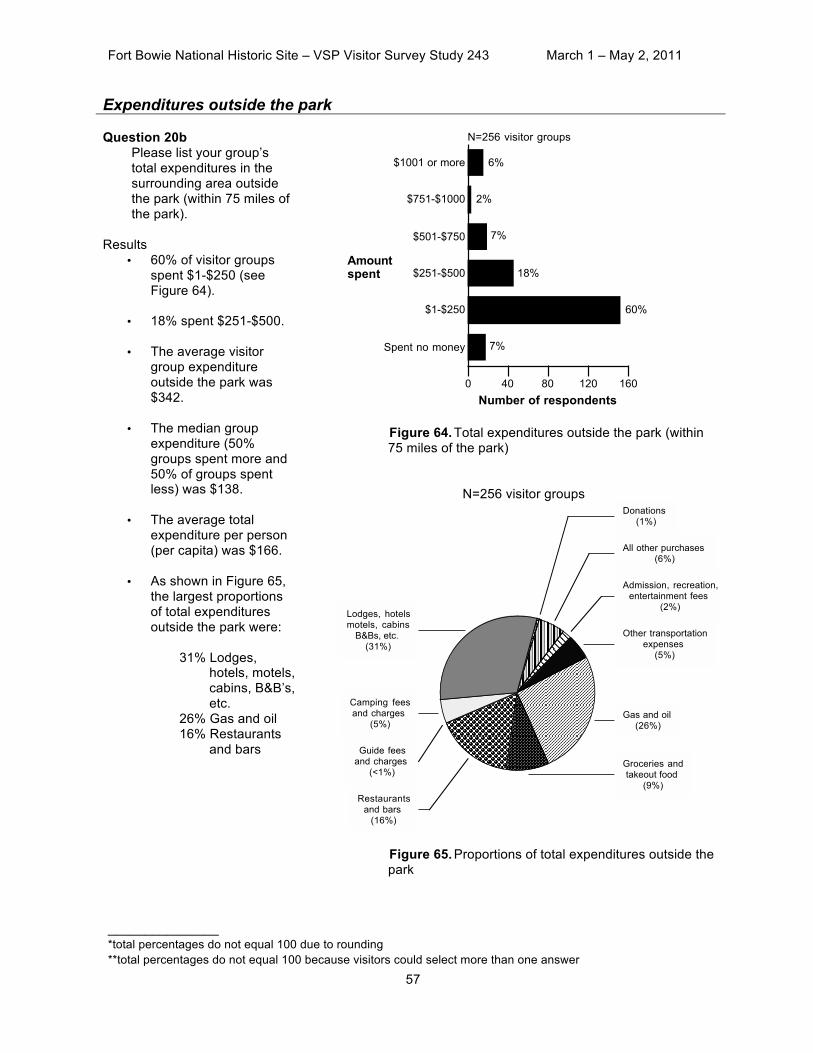
Fort Bowie National Historic Site – VSP Visitor Survey Study 243 March 1 – May 2, 2011
_______________ *total percentages do not equal 100 due to rounding **total percentages do not equal 100 because visitors could select more than one answer 57
Expenditures outside the park Question 20b
Please list your group’s total expenditures in the surrounding area outside the park (within 75 miles of the park).
Results
• 60% of visitor groups spent $1-$250 (see Figure 64).
• 18% spent $251-$500.
• The average visitor group expenditure outside the park was $342.
• The median group
expenditure (50% groups spent more and 50% of groups spent less) was $138.
• The average total
expenditure per person (per capita) was $166.
• As shown in Figure 65,
the largest proportions of total expenditures outside the park were:
31% Lodges,
hotels, motels, cabins, B&B’s, etc.
26% Gas and oil 16% Restaurants
and bars
Figure 64. Total expenditures outside the park (within 75 miles of the park)
N=256 visitor groups
Figure 65. Proportions of total expenditures outside the park
0 40 80 120 160Number of respondents
Spent no money
$1-$250
$251-$500
$501-$750
$751-$1000
$1001 or more
7%
60%
18%
7%
2%
6%
N=256 visitor groups
Amountspent
Donations (1%)
All other purchases (6%)
Admission, recreation,entertainment fees
(2%)
Other transportationexpenses
(5%)
Gas and oil (26%)
Groceries andtakeout food
(9%)
Restaurantsand bars
(16%)
Guide feesand charges
(<1%)
Camping feesand charges
(5%)
Lodges, hotelsmotels, cabins
B&Bs, etc. (31%)

Fort Bowie National Historic Site – VSP Visitor Survey Study 243 March 1 – May 2, 2011
_______________ *total percentages do not equal 100 due to rounding **total percentages do not equal 100 because visitors could select more than one answer 58
Lodges, hotels, motels, cabins, B&Bs, etc.
• 45% of visitor groups spent no money on lodging outside the park (see Figure 66).
• 21% spent $1-$100 or more.
Figure 66. Expenditures for lodging outside the park
Camping fees and charges
• 55% of visitor groups spent no money on camping fees and charges outside the park (see Figure 67).
• 31% spent $1-$50.
Figure 67. Expenditures for camping fees and charges outside the park
0 20 40 60 80
Number of respondents
Spentno money
$1-$100
$101-$200
$201-$300
$301 or more
45%
21%
14%
8%
12%
N=177 visitor groups
Amountspent
0 25 50 75 100
Number of respondents
Spentno money
$1-$50
$51-$100
$101 or more
55%
31%
6%
7%
N=148 visitor groups*
Amountspent
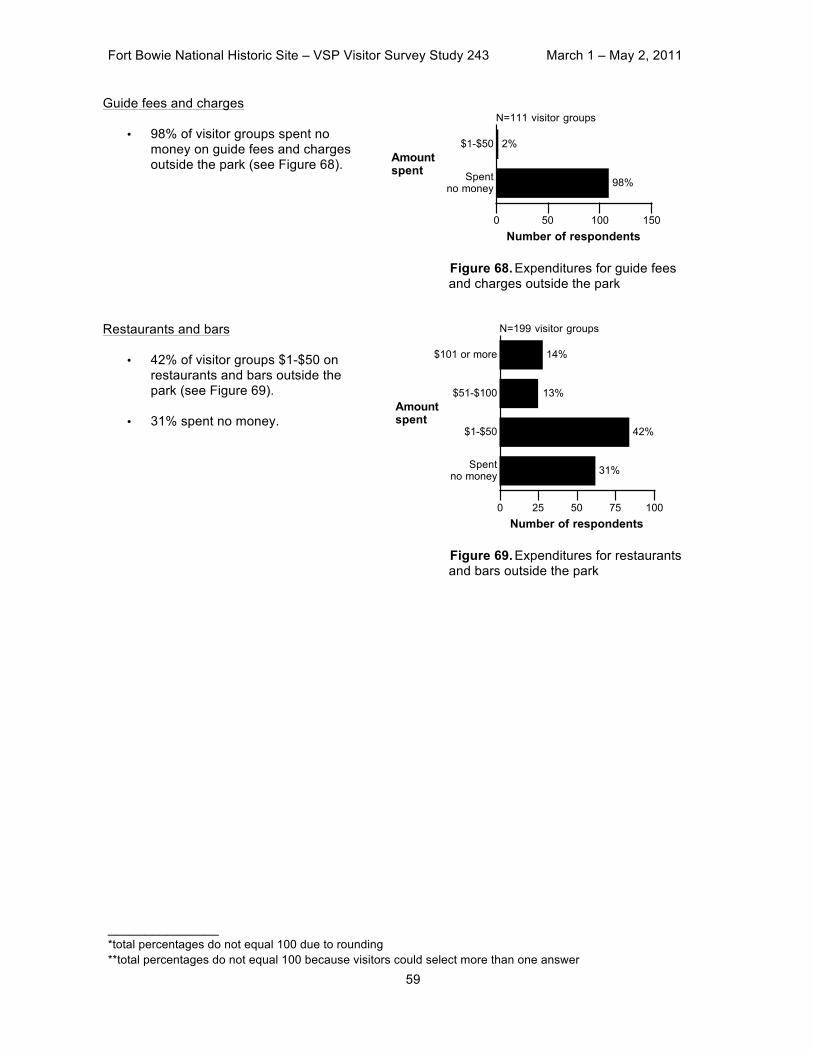
Fort Bowie National Historic Site – VSP Visitor Survey Study 243 March 1 – May 2, 2011
_______________ *total percentages do not equal 100 due to rounding **total percentages do not equal 100 because visitors could select more than one answer 59
Guide fees and charges
• 98% of visitor groups spent no money on guide fees and charges outside the park (see Figure 68).
Figure 68. Expenditures for guide fees and charges outside the park
Restaurants and bars
• 42% of visitor groups $1-$50 on restaurants and bars outside the park (see Figure 69).
• 31% spent no money.
Figure 69. Expenditures for restaurants and bars outside the park
0 50 100 150Number of respondents
Spentno money
$1-$50
98%
2%
N=111 visitor groups
Amountspent
0 25 50 75 100Number of respondents
Spentno money
$1-$50
$51-$100
$101 or more
31%
42%
13%
14%
N=199 visitor groups
Amountspent
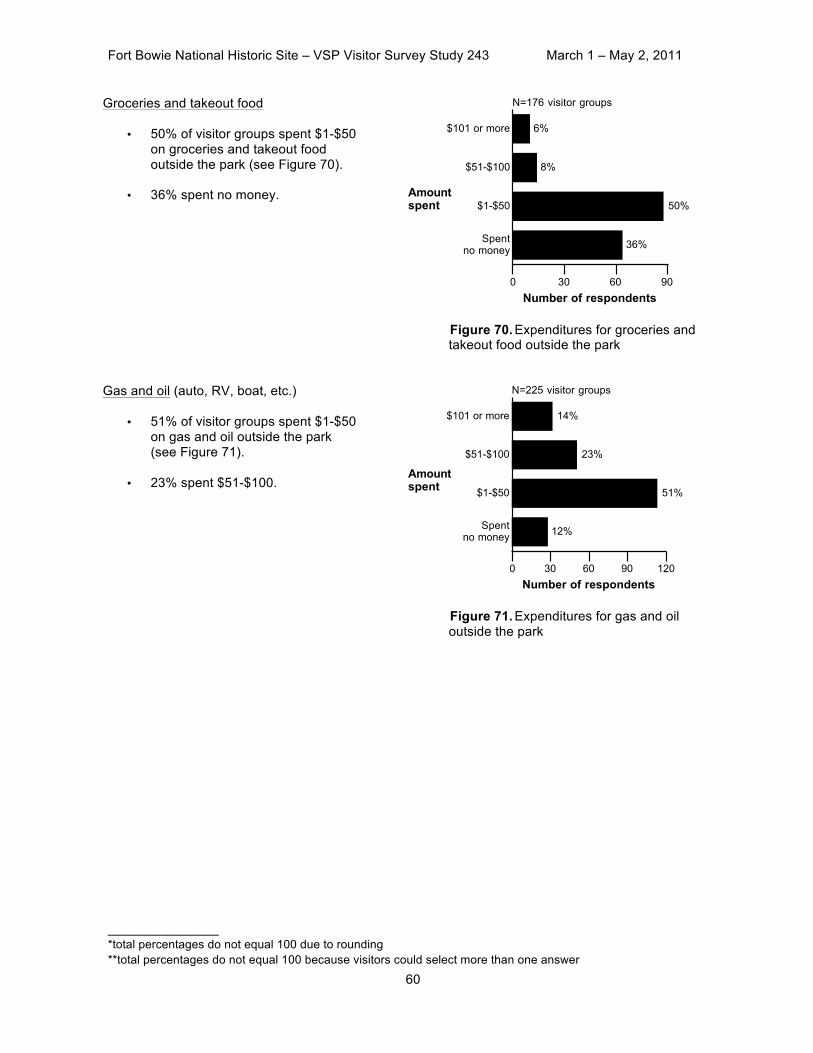
Fort Bowie National Historic Site – VSP Visitor Survey Study 243 March 1 – May 2, 2011
_______________ *total percentages do not equal 100 due to rounding **total percentages do not equal 100 because visitors could select more than one answer 60
Groceries and takeout food
• 50% of visitor groups spent $1-$50 on groceries and takeout food outside the park (see Figure 70).
• 36% spent no money.
Figure 70. Expenditures for groceries and takeout food outside the park
Gas and oil (auto, RV, boat, etc.)
• 51% of visitor groups spent $1-$50 on gas and oil outside the park (see Figure 71).
• 23% spent $51-$100.
Figure 71. Expenditures for gas and oil outside the park
0 30 60 90Number of respondents
Spentno money
$1-$50
$51-$100
$101 or more
36%
50%
8%
6%
N=176 visitor groups
Amountspent
0 30 60 90 120Number of respondents
Spentno money
$1-$50
$51-$100
$101 or more
12%
51%
23%
14%
N=225 visitor groups
Amountspent
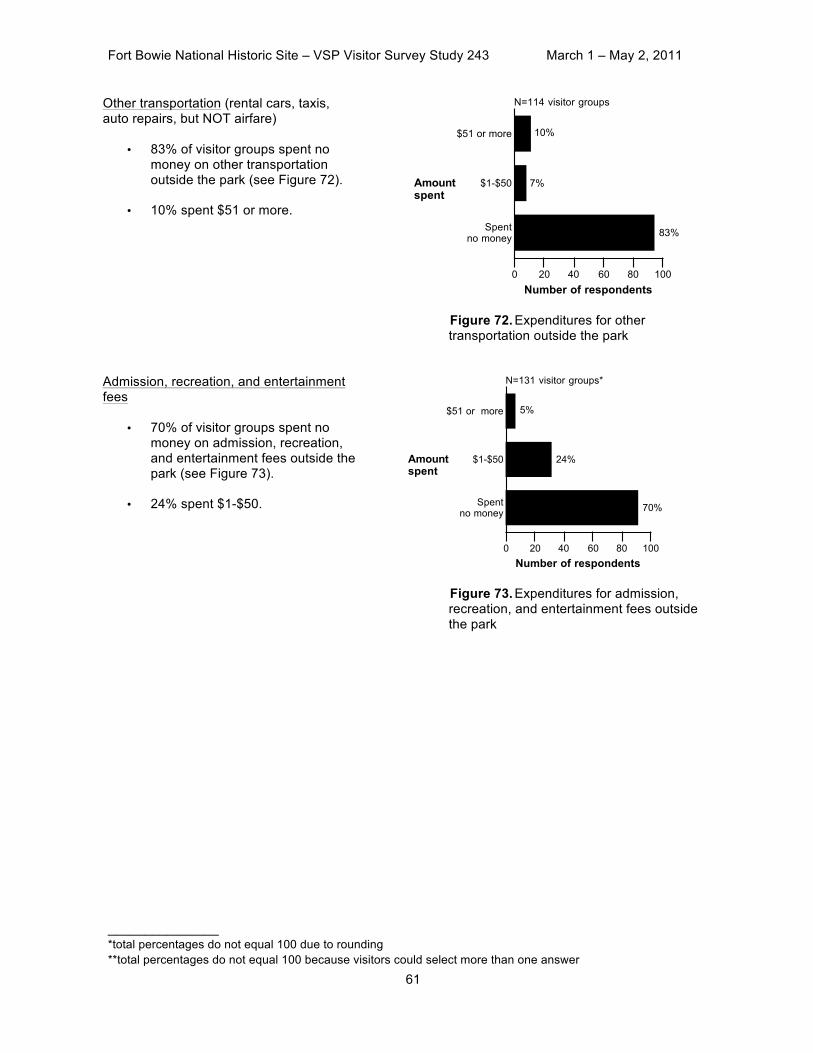
Fort Bowie National Historic Site – VSP Visitor Survey Study 243 March 1 – May 2, 2011
_______________ *total percentages do not equal 100 due to rounding **total percentages do not equal 100 because visitors could select more than one answer 61
Other transportation (rental cars, taxis, auto repairs, but NOT airfare)
• 83% of visitor groups spent no money on other transportation outside the park (see Figure 72).
• 10% spent $51 or more.
Figure 72. Expenditures for other transportation outside the park
Admission, recreation, and entertainment fees
• 70% of visitor groups spent no money on admission, recreation, and entertainment fees outside the park (see Figure 73).
• 24% spent $1-$50.
Figure 73. Expenditures for admission, recreation, and entertainment fees outside the park
0 20 40 60 80 100Number of respondents
Spentno money
$1-$50
$51 or more
83%
7%
10%
N=114 visitor groups
Amountspent
0 20 40 60 80 100Number of respondents
Spentno money
$1-$50
$51 or more
70%
24%
5%
N=131 visitor groups*
Amountspent
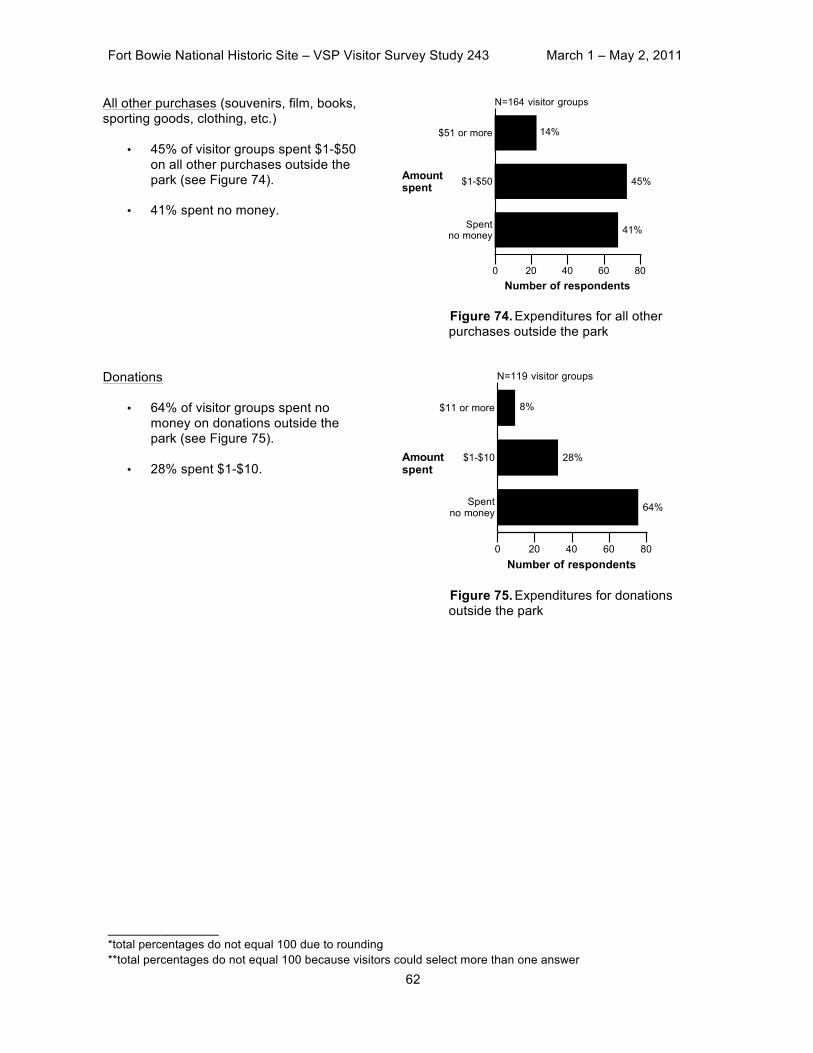
Fort Bowie National Historic Site – VSP Visitor Survey Study 243 March 1 – May 2, 2011
_______________ *total percentages do not equal 100 due to rounding **total percentages do not equal 100 because visitors could select more than one answer 62
All other purchases (souvenirs, film, books, sporting goods, clothing, etc.)
• 45% of visitor groups spent $1-$50 on all other purchases outside the park (see Figure 74).
• 41% spent no money.
Figure 74. Expenditures for all other purchases outside the park
Donations
• 64% of visitor groups spent no money on donations outside the park (see Figure 75).
• 28% spent $1-$10.
Figure 75. Expenditures for donations outside the park
0 20 40 60 80Number of respondents
Spentno money
$1-$50
$51 or more
41%
45%
14%
N=164 visitor groups
Amountspent
0 20 40 60 80Number of respondents
Spentno money
$1-$10
$11 or more
64%
28%
8%
N=119 visitor groups
Amountspent
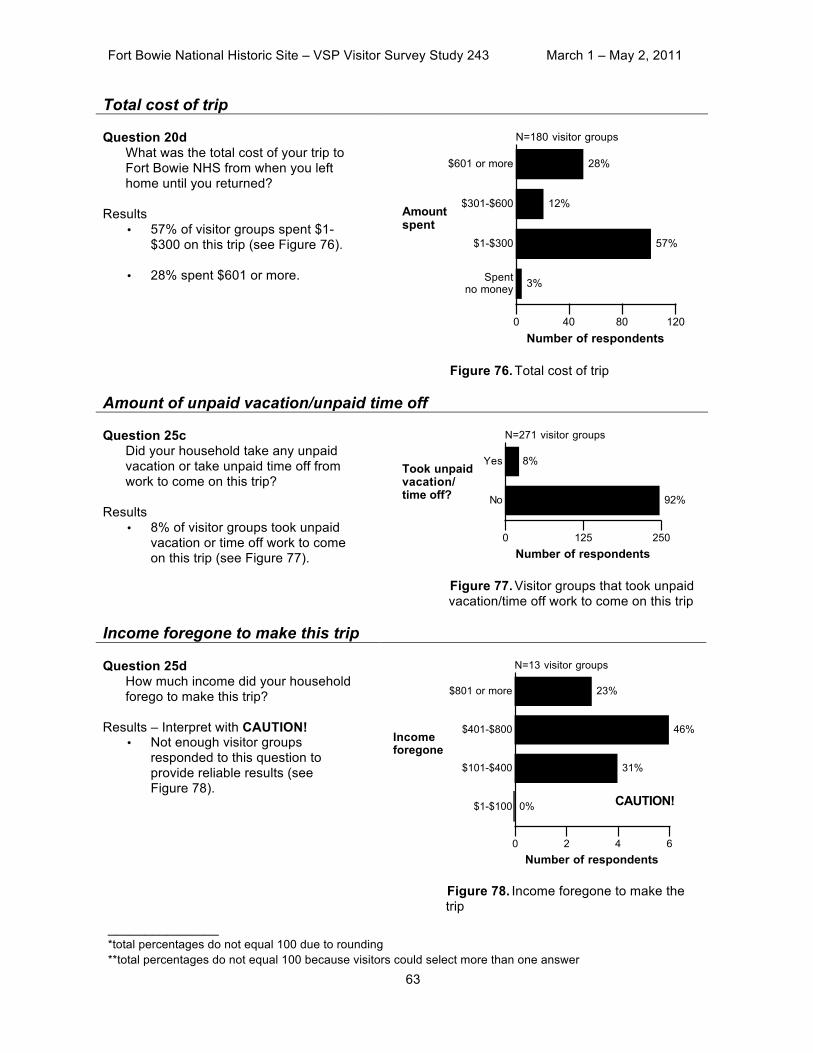
Fort Bowie National Historic Site – VSP Visitor Survey Study 243 March 1 – May 2, 2011
_______________ *total percentages do not equal 100 due to rounding **total percentages do not equal 100 because visitors could select more than one answer 63
Total cost of trip Question 20d
What was the total cost of your trip to Fort Bowie NHS from when you left home until you returned?
Results
• 57% of visitor groups spent $1-$300 on this trip (see Figure 76).
• 28% spent $601 or more.
Figure 76. Total cost of trip
Amount of unpaid vacation/unpaid time off Question 25c
Did your household take any unpaid vacation or take unpaid time off from work to come on this trip?
Results
• 8% of visitor groups took unpaid vacation or time off work to come on this trip (see Figure 77).
Figure 77. Visitor groups that took unpaid vacation/time off work to come on this trip
Income foregone to make this trip Question 25d
How much income did your household forego to make this trip?
Results – Interpret with CAUTION! • Not enough visitor groups
responded to this question to provide reliable results (see Figure 78).
Figure 78. Income foregone to make the trip
0 40 80 120
Number of respondents
Spentno money
$1-$300
$301-$600
$601 or more
3%
57%
12%
28%
N=180 visitor groups
Amountspent
0 125 250Number of respondents
No
Yes
92%
8%
N=271 visitor groups
Took unpaidvacation/time off?
0 2 4 6
Number of respondents
$1-$100
$101-$400
$401-$800
$801 or more
0%
31%
46%
23%
N=13 visitor groups
Incomeforegone
CAUTION!
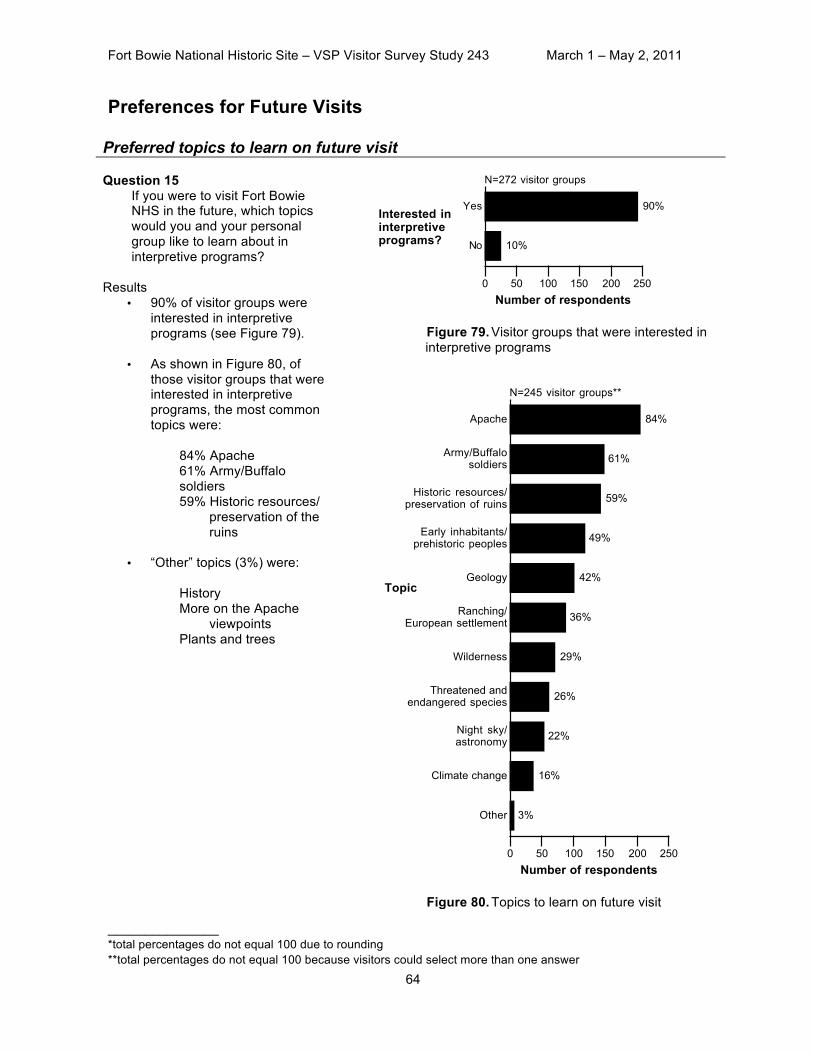
Fort Bowie National Historic Site – VSP Visitor Survey Study 243 March 1 – May 2, 2011
_______________ *total percentages do not equal 100 due to rounding **total percentages do not equal 100 because visitors could select more than one answer 64
Preferences for Future Visits
Preferred topics to learn on future visit Question 15
If you were to visit Fort Bowie NHS in the future, which topics would you and your personal group like to learn about in interpretive programs?
Results
• 90% of visitor groups were interested in interpretive programs (see Figure 79).
• As shown in Figure 80, of those visitor groups that were interested in interpretive programs, the most common topics were:
84% Apache 61% Army/Buffalo soldiers 59% Historic resources/
preservation of the ruins
• “Other” topics (3%) were:
History More on the Apache
viewpoints Plants and trees
Figure 79. Visitor groups that were interested in interpretive programs
Figure 80. Topics to learn on future visit
0 50 100 150 200 250
Number of respondents
No
Yes
10%
90%
N=272 visitor groups
Interested ininterpretiveprograms?
0 50 100 150 200 250Number of respondents
Other
Climate change
Night sky/astronomy
Threatened andendangered species
Wilderness
Ranching/European settlement
Geology
Early inhabitants/prehistoric peoples
Historic resources/preservation of ruins
Army/Buffalosoldiers
Apache
3%
16%
22%
26%
29%
36%
42%
49%
59%
61%
84%
N=245 visitor groups**
Topic
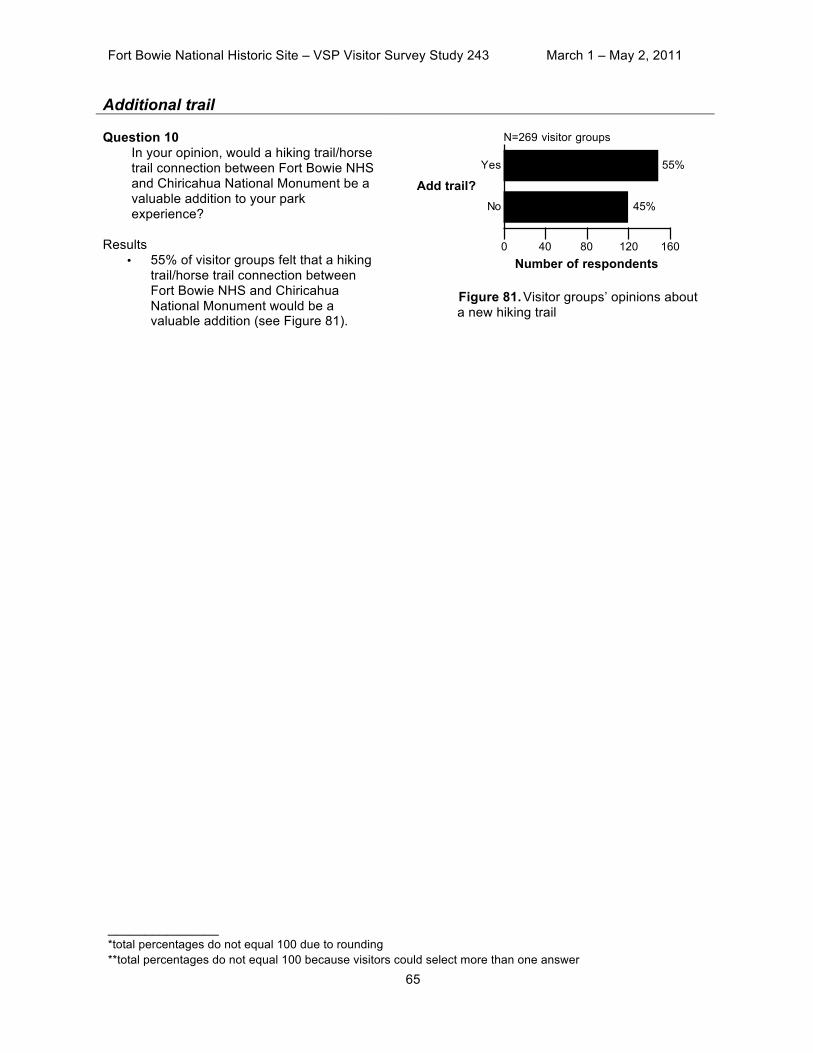
Fort Bowie National Historic Site – VSP Visitor Survey Study 243 March 1 – May 2, 2011
_______________ *total percentages do not equal 100 due to rounding **total percentages do not equal 100 because visitors could select more than one answer 65
Additional trail Question 10
In your opinion, would a hiking trail/horse trail connection between Fort Bowie NHS and Chiricahua National Monument be a valuable addition to your park experience?
Results • 55% of visitor groups felt that a hiking
trail/horse trail connection between Fort Bowie NHS and Chiricahua National Monument would be a valuable addition (see Figure 81).
Figure 81. Visitor groups’ opinions about a new hiking trail
0 40 80 120 160Number of respondents
No
Yes
45%
55%
N=269 visitor groups
Add trail?
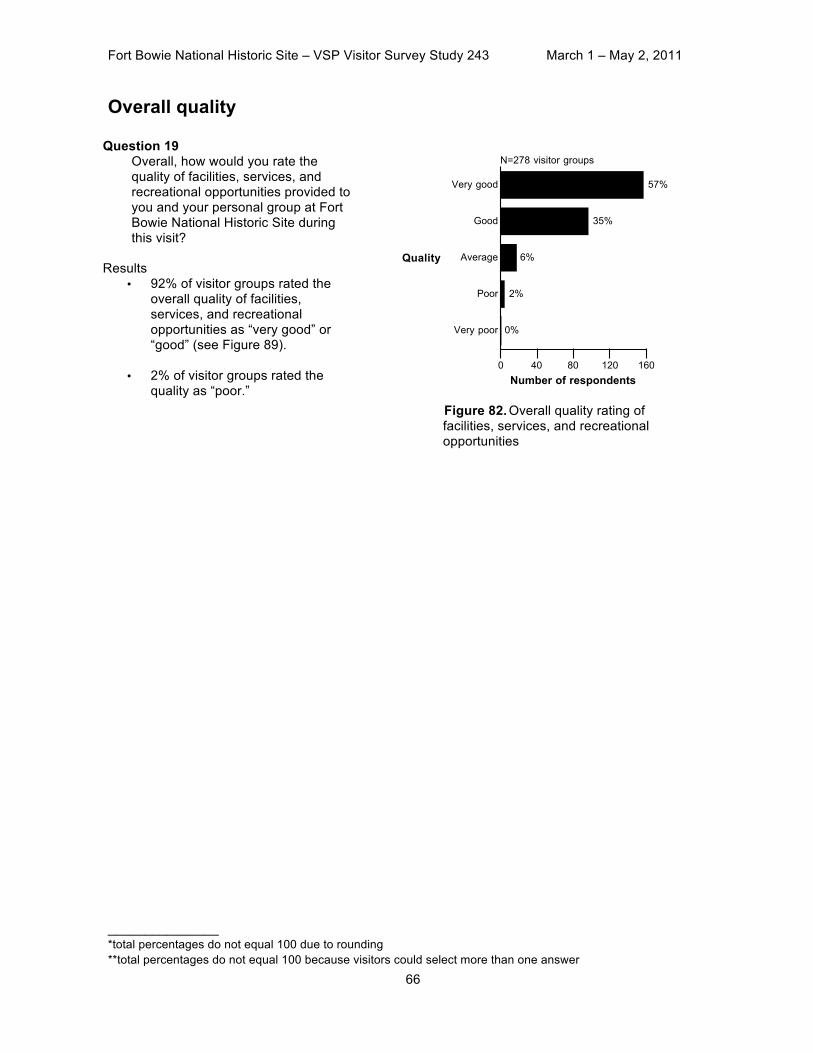
Fort Bowie National Historic Site – VSP Visitor Survey Study 243 March 1 – May 2, 2011
_______________ *total percentages do not equal 100 due to rounding **total percentages do not equal 100 because visitors could select more than one answer 66
Overall quality
Question 19 Overall, how would you rate the quality of facilities, services, and recreational opportunities provided to you and your personal group at Fort Bowie National Historic Site during this visit?
Results
• 92% of visitor groups rated the overall quality of facilities, services, and recreational opportunities as “very good” or “good” (see Figure 89).
• 2% of visitor groups rated the quality as “poor.”
Figure 82. Overall quality rating of facilities, services, and recreational opportunities
0 40 80 120 160Number of respondents
Very poor
Poor
Average
Good
Very good
0%
2%
6%
35%
57%
N=278 visitor groups
Quality
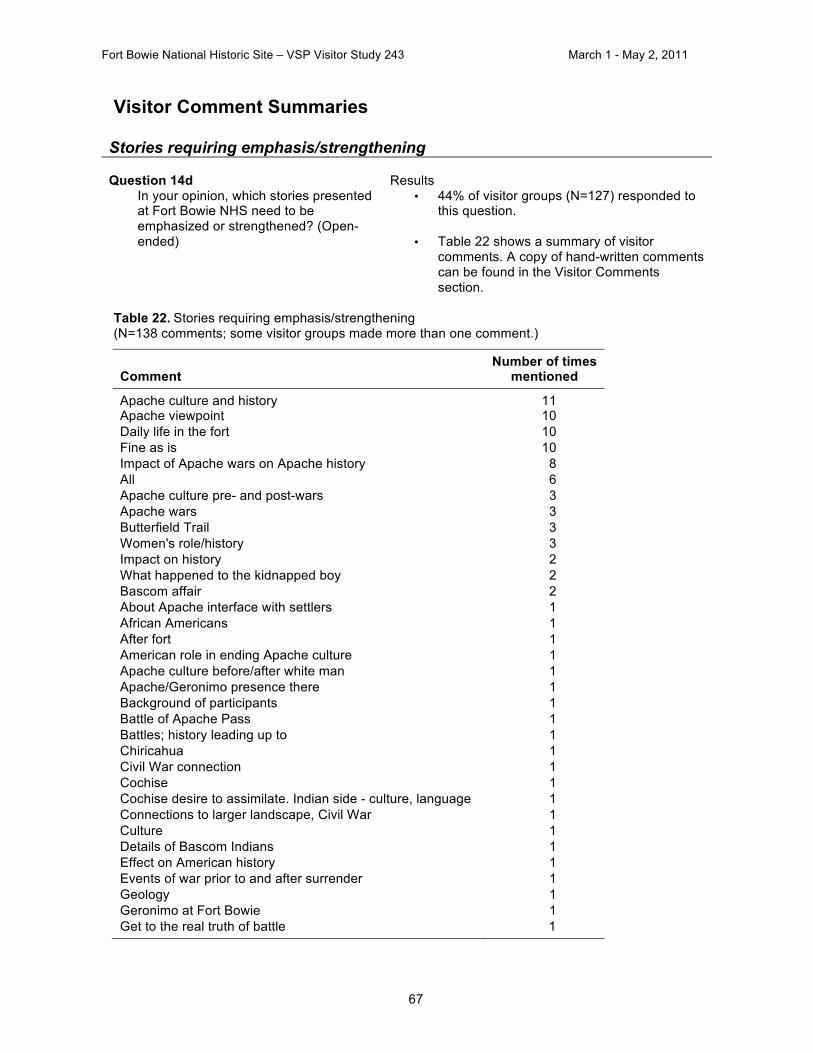
Fort Bowie National Historic Site – VSP Visitor Study 243 March 1 - May 2, 2011
67
Visitor Comment Summaries
Stories requiring emphasis/strengthening Question 14d
In your opinion, which stories presented at Fort Bowie NHS need to be emphasized or strengthened? (Open-ended)
Results
• 44% of visitor groups (N=127) responded to this question.
• Table 22 shows a summary of visitor comments. A copy of hand-written comments can be found in the Visitor Comments section.
Table 22. Stories requiring emphasis/strengthening (N=138 comments; some visitor groups made more than one comment.)
Comment
Number of times mentioned
Apache culture and history 11 Apache viewpoint 10 Daily life in the fort 10 Fine as is 10 Impact of Apache wars on Apache history 8 All 6 Apache culture pre- and post-wars 3 Apache wars 3 Butterfield Trail 3 Women's role/history 3 Impact on history 2 What happened to the kidnapped boy 2 Bascom affair 2 About Apache interface with settlers 1 African Americans 1 After fort 1 American role in ending Apache culture 1 Apache culture before/after white man 1 Apache/Geronimo presence there 1 Background of participants 1 Battle of Apache Pass 1 Battles; history leading up to 1 Chiricahua 1 Civil War connection 1 Cochise 1 Cochise desire to assimilate. Indian side - culture, language 1 Connections to larger landscape, Civil War 1 Culture 1 Details of Bascom Indians 1 Effect on American history 1 Events of war prior to and after surrender 1 Geology 1 Geronimo at Fort Bowie 1 Get to the real truth of battle 1
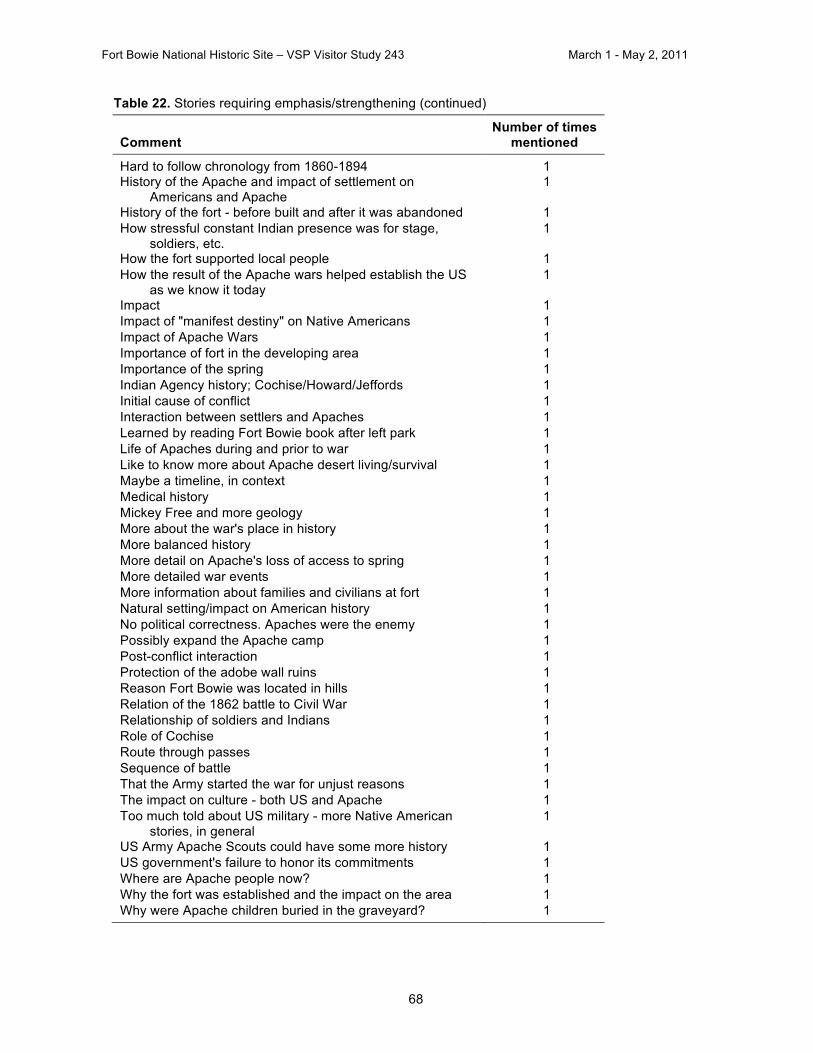
Fort Bowie National Historic Site – VSP Visitor Study 243 March 1 - May 2, 2011
68
Table 22. Stories requiring emphasis/strengthening (continued)
Comment
Number of times mentioned
Hard to follow chronology from 1860-1894 1 History of the Apache and impact of settlement on
Americans and Apache 1
History of the fort - before built and after it was abandoned 1 How stressful constant Indian presence was for stage,
soldiers, etc. 1
How the fort supported local people 1 How the result of the Apache wars helped establish the US
as we know it today 1
Impact 1 Impact of "manifest destiny" on Native Americans 1 Impact of Apache Wars 1 Importance of fort in the developing area 1 Importance of the spring 1 Indian Agency history; Cochise/Howard/Jeffords 1 Initial cause of conflict 1 Interaction between settlers and Apaches 1 Learned by reading Fort Bowie book after left park 1 Life of Apaches during and prior to war 1 Like to know more about Apache desert living/survival 1 Maybe a timeline, in context 1 Medical history 1 Mickey Free and more geology 1 More about the war's place in history 1 More balanced history 1 More detail on Apache's loss of access to spring 1 More detailed war events 1 More information about families and civilians at fort 1 Natural setting/impact on American history 1 No political correctness. Apaches were the enemy 1 Possibly expand the Apache camp 1 Post-conflict interaction 1 Protection of the adobe wall ruins 1 Reason Fort Bowie was located in hills 1 Relation of the 1862 battle to Civil War 1 Relationship of soldiers and Indians 1 Role of Cochise 1 Route through passes 1 Sequence of battle 1 That the Army started the war for unjust reasons 1 The impact on culture - both US and Apache 1 Too much told about US military - more Native American
stories, in general 1
US Army Apache Scouts could have some more history 1 US government's failure to honor its commitments 1 Where are Apache people now? 1 Why the fort was established and the impact on the area 1 Why were Apache children buried in the graveyard? 1

Fort Bowie National Historic Site – VSP Visitor Study 243 March 1 - May 2, 2011
69
What visitors liked most Question 26a
What did you and your personal group like most about your visit to Fort Bowie NHS? (Open-ended)
Results
• 93% of visitor groups (N=265) responded to this question.
• Table 23 shows a summary of visitor comments. A copy of hand-written comments can be found in the Visitor Comments section.
Table 23. What visitors liked most (N=465 comments; some visitor groups made more than one comment.)
Comment
Number of times mentioned
PERSONNEL (7%) The park rangers 7 Rangers were helpful 4 Rangers were knowledgeable 3 Rangers were friendly 2 Other comments 3 INTERPRETIVE SERVICES (55%) Experiencing history on site 15 Interpretive signs 14 Learning about history 14 The visitor center 13 Trailside exhibits/signs 13 The historical information 12 The exhibits 10 Talking with rangers 10 Apache history/information 9 The interpretive trail 7 Learning about the site 4 Ranger-led talks/tours 3 Living history 3 Information 2 Junior Ranger program 2 The sites along the trails 2 Old photos 2 The historical stops 2 The museum 2 The unrestored presentation 2 Touring the fort 2 Other comments 4
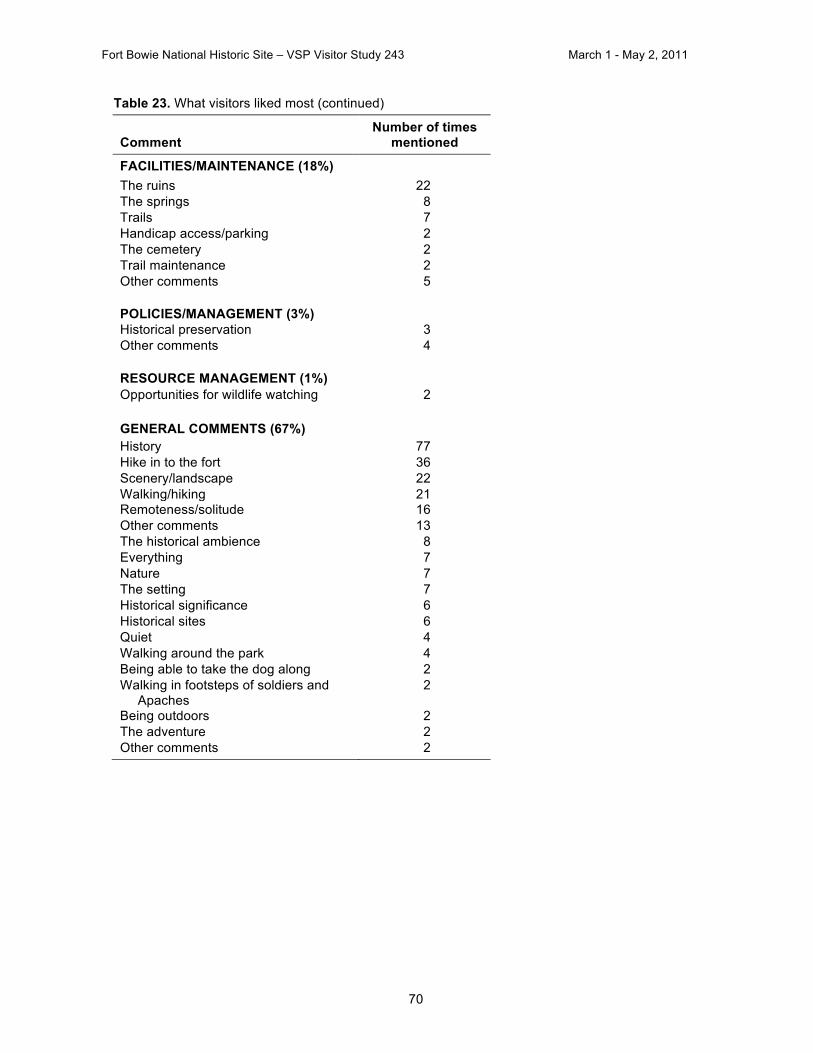
Fort Bowie National Historic Site – VSP Visitor Study 243 March 1 - May 2, 2011
70
Table 23. What visitors liked most (continued)
Comment Number of times
mentioned
FACILITIES/MAINTENANCE (18%) The ruins 22 The springs 8 Trails 7 Handicap access/parking 2 The cemetery 2 Trail maintenance 2 Other comments 5 POLICIES/MANAGEMENT (3%) Historical preservation 3 Other comments 4 RESOURCE MANAGEMENT (1%) Opportunities for wildlife watching 2 GENERAL COMMENTS (67%) History 77 Hike in to the fort 36 Scenery/landscape 22 Walking/hiking 21 Remoteness/solitude 16 Other comments 13 The historical ambience 8 Everything 7 Nature 7 The setting 7 Historical significance 6 Historical sites 6 Quiet 4 Walking around the park 4 Being able to take the dog along 2 Walking in footsteps of soldiers and
Apaches 2
Being outdoors 2 The adventure 2 Other comments 2
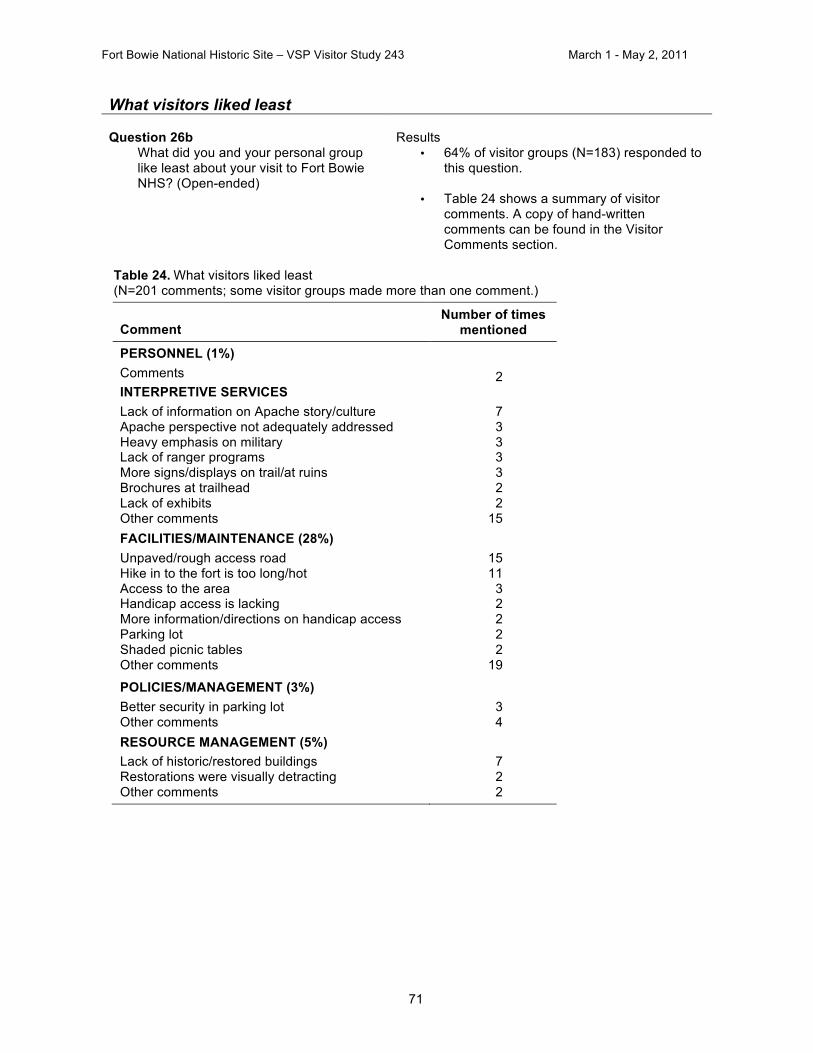
Fort Bowie National Historic Site – VSP Visitor Study 243 March 1 - May 2, 2011
71
What visitors liked least Question 26b
What did you and your personal group like least about your visit to Fort Bowie NHS? (Open-ended)
Results
• 64% of visitor groups (N=183) responded to this question.
• Table 24 shows a summary of visitor comments. A copy of hand-written comments can be found in the Visitor Comments section.
Table 24. What visitors liked least (N=201 comments; some visitor groups made more than one comment.)
Comment Number of times
mentioned
PERSONNEL (1%) Comments 2
INTERPRETIVE SERVICES Lack of information on Apache story/culture 7
Apache perspective not adequately addressed 3 Heavy emphasis on military 3 Lack of ranger programs 3 More signs/displays on trail/at ruins 3 Brochures at trailhead 2 Lack of exhibits 2 Other comments 15 FACILITIES/MAINTENANCE (28%)
Unpaved/rough access road 15 Hike in to the fort is too long/hot 11 Access to the area 3 Handicap access is lacking 2 More information/directions on handicap access 2 Parking lot 2 Shaded picnic tables 2 Other comments 19
POLICIES/MANAGEMENT (3%) Better security in parking lot 3
Other comments 4 RESOURCE MANAGEMENT (5%)
Lack of historic/restored buildings 7 Restorations were visually detracting 2 Other comments 2

Fort Bowie National Historic Site – VSP Visitor Study 243 March 1 - May 2, 2011
72
Table 24. What visitors liked least (continued)
Comment Number of times
mentioned
GENERAL (43%) Flies 25
Nothing to dislike 22 High wind 11 Heat 7 Lack of food/beverages 4 Hike in to the fort 4 Not enough time 2 Other comments 14
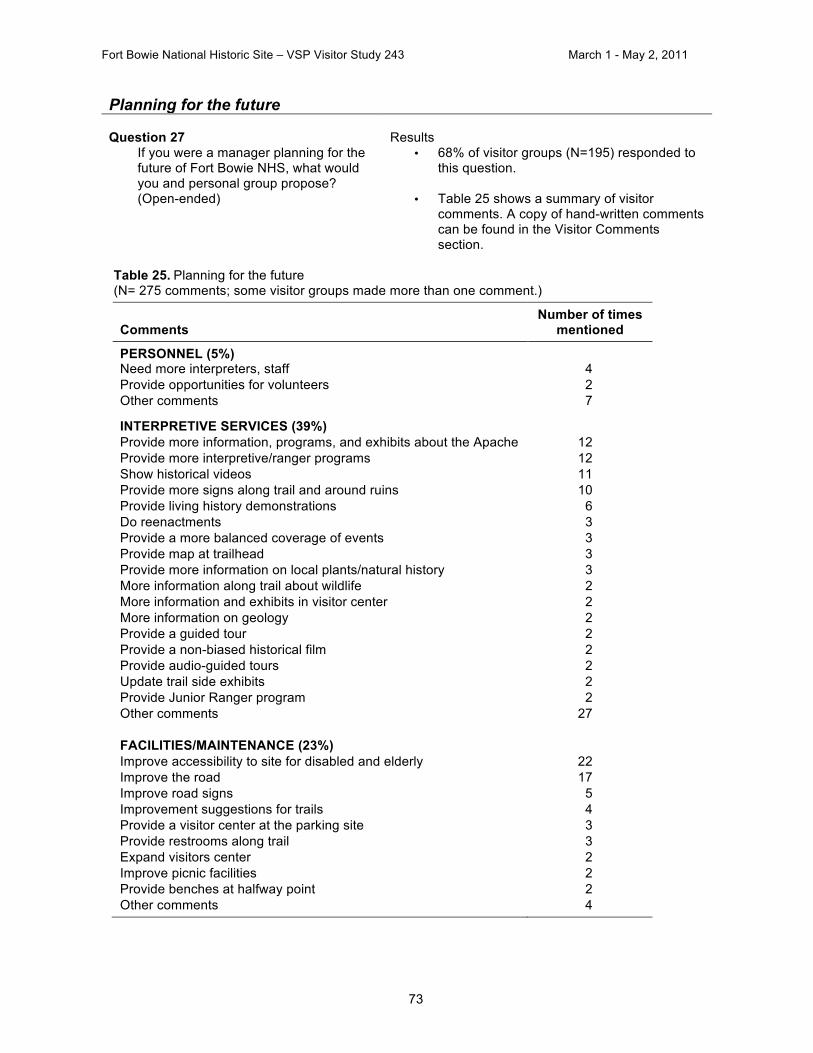
Fort Bowie National Historic Site – VSP Visitor Study 243 March 1 - May 2, 2011
73
Planning for the future Question 27
If you were a manager planning for the future of Fort Bowie NHS, what would you and personal group propose? (Open-ended)
Results
• 68% of visitor groups (N=195) responded to this question.
• Table 25 shows a summary of visitor comments. A copy of hand-written comments can be found in the Visitor Comments section.
Table 25. Planning for the future (N= 275 comments; some visitor groups made more than one comment.)
Comments
Number of times mentioned
PERSONNEL (5%) Need more interpreters, staff 4 Provide opportunities for volunteers 2 Other comments 7 INTERPRETIVE SERVICES (39%) Provide more information, programs, and exhibits about the Apache 12 Provide more interpretive/ranger programs 12 Show historical videos 11 Provide more signs along trail and around ruins 10 Provide living history demonstrations 6 Do reenactments 3 Provide a more balanced coverage of events 3 Provide map at trailhead 3 Provide more information on local plants/natural history 3 More information along trail about wildlife 2 More information and exhibits in visitor center 2 More information on geology 2 Provide a guided tour 2 Provide a non-biased historical film 2 Provide audio-guided tours 2 Update trail side exhibits 2 Provide Junior Ranger program 2 Other comments 27 FACILITIES/MAINTENANCE (23%) Improve accessibility to site for disabled and elderly 22 Improve the road 17 Improve road signs 5 Improvement suggestions for trails 4 Provide a visitor center at the parking site 3 Provide restrooms along trail 3 Expand visitors center 2 Improve picnic facilities 2 Provide benches at halfway point 2 Other comments 4

Fort Bowie National Historic Site – VSP Visitor Study 243 March 1 - May 2, 2011
74
Table 25. Planning for the future (continued)
Comments
Number of times mentioned
POLICY/MANAGEMENT (24%) Restore or reconstruct some of the forts/ruins 9 Rebuild or improve at least one structure or exhibit 7 Retain limited access 5 Provide camping in area 4 Provide security 4 Provide information about disability accommodations at parking lot 3 Needs more publicity 3 Allow driving to site for everyone 3 Open disability entrance to all 3 Keep the site from being too commercial 2 Provide additional hikes 2 Provide trail rides 2 Link up to Chiricahua Monument by road from one to the other 2 Provide an easy way to contact rangers from parking area 2 Provide hiking trails to some of the nearby areas 2 Other comments 12 CONCESSION SERVICES (2%) Provide a food/beverage service 5 GENERAL COMMENTS (8%) No changes needed 17 Other comments 6
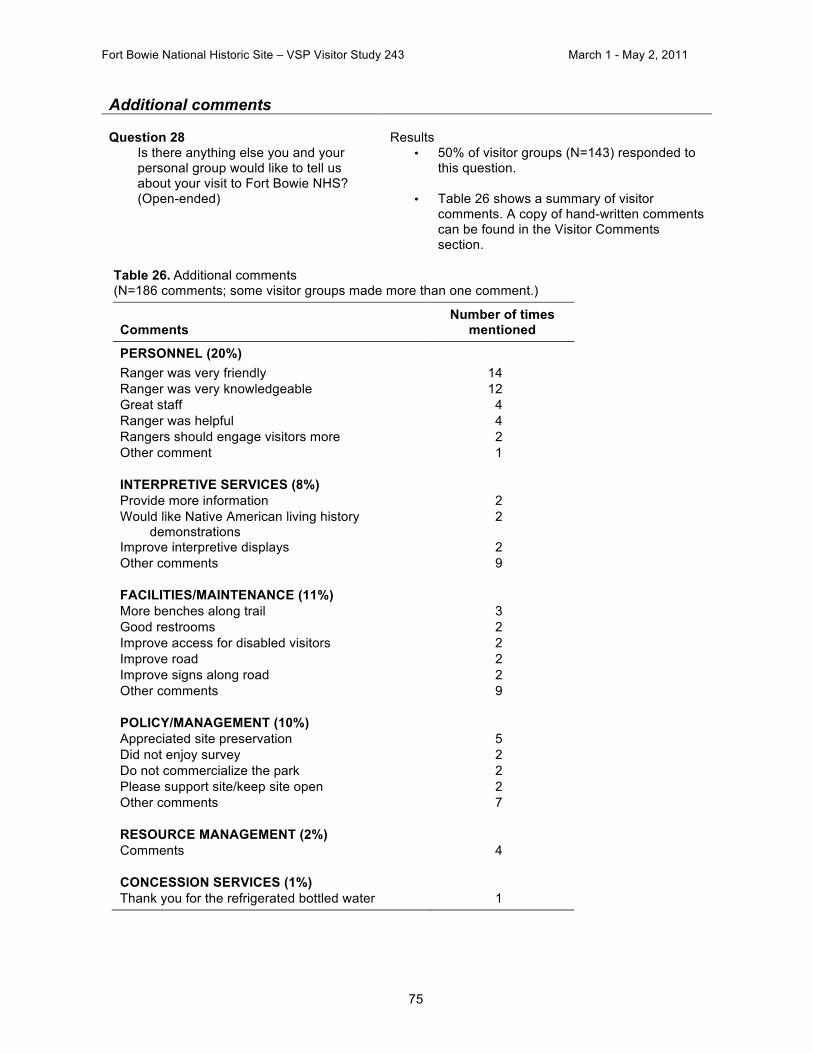
Fort Bowie National Historic Site – VSP Visitor Study 243 March 1 - May 2, 2011
75
Additional comments Question 28
Is there anything else you and your personal group would like to tell us about your visit to Fort Bowie NHS? (Open-ended)
Results
• 50% of visitor groups (N=143) responded to this question.
• Table 26 shows a summary of visitor comments. A copy of hand-written comments can be found in the Visitor Comments section.
Table 26. Additional comments (N=186 comments; some visitor groups made more than one comment.)
Comments
Number of times mentioned
PERSONNEL (20%) Ranger was very friendly 14
Ranger was very knowledgeable 12 Great staff 4 Ranger was helpful 4 Rangers should engage visitors more 2 Other comment 1 INTERPRETIVE SERVICES (8%) Provide more information 2 Would like Native American living history
demonstrations 2
Improve interpretive displays 2 Other comments 9
FACILITIES/MAINTENANCE (11%) More benches along trail 3 Good restrooms 2 Improve access for disabled visitors 2 Improve road 2 Improve signs along road 2 Other comments 9
POLICY/MANAGEMENT (10%) Appreciated site preservation 5 Did not enjoy survey 2 Do not commercialize the park 2 Please support site/keep site open 2 Other comments 7
RESOURCE MANAGEMENT (2%) Comments 4 CONCESSION SERVICES (1%) Thank you for the refrigerated bottled water 1
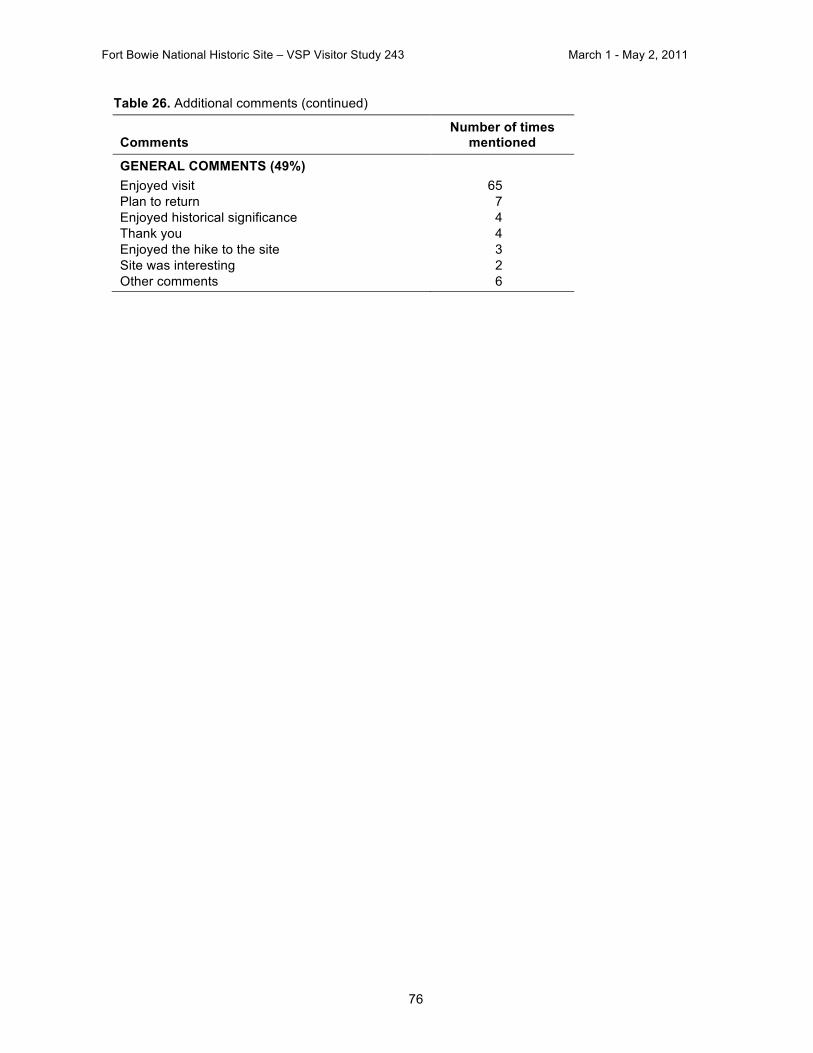
Fort Bowie National Historic Site – VSP Visitor Study 243 March 1 - May 2, 2011
76
Table 26. Additional comments (continued)
Comments
Number of times mentioned
GENERAL COMMENTS (49%) Enjoyed visit 65
Plan to return 7 Enjoyed historical significance 4 Thank you 4 Enjoyed the hike to the site 3 Site was interesting 2 Other comments 6

Fort Bowie National Historic Site – VSP Visitor Study 243 March 1 - May 2, 2011
77
Visitor Comments This section contains visitor responses to open-ended questions.

Fort Bowie National Historic Site – VSP Visitor Study 243 March 1 - May 2, 2011
79
Appendix 1: The Questionnaire

Fort Bowie National Historic Site – VSP Visitor Study 243 March 1 - May 2, 2011
81
Appendix 2: Additional Analysis The Visitor Services Project (VSP) offers the opportunity to learn from VSP visitor study data through additional analysis. Two-way and three-way cross tabulations can be made with any questions. Below are some examples of the types of cross tabulations that can be requested. To make a request, please use the contact information below, and include your name, address and phone number in the request.
1. What proportion of family groups with children attend interpretive programs?
2. Is there a correlation between visitors ages and their preferred sources of information about the park?
3. Are highly satisfied visitors more likely to return for a future visit?
4. How many international visitors participate in hiking?
5. What ages of visitors would use the park website as a source of information on a future visit?
6. Is there a correlation between visitor groups’ rating of the overall quality of their park
experience, and their ratings of individual services and facilities?
7. Do larger visitor groups (e.g. four or more) participate in different activities than smaller groups?
8. Do frequent visitors rate the overall quality of their park experiences differently than less
frequent visitors? The VSP database website (http://vsp.uidaho.edu) allows data searches for comparisons of data from one or more parks. For more information please contact: Visitor Services Project, PSU College of Natural Resources P.O. Box 441139 University of Idaho Moscow, ID 83843-1139 Phone: 208-885-7863 Fax: 208-885-4261 Email: [email protected] Website: http://www.psu.uidaho.edu
Fort Bowie National Historic Site – VSP Visitor Study 243 March 1 - May 2, 2011
82
Appendix 3: Decision Rules for Checking Non-response Bias There are several methods for checking non-response bias. However, the most common way is to use some demographic indicators to compare between respondents and non-respondents (Dey 1997; Salant and Dillman 1994; Dillman and Carley-Baxter 2000; Dillman, 2007; Stoop 2004). In this study, group type, group size and age of the group member (at least 16 years old) completing the survey were three variables that were used to check for non-response bias.
A Chi-square test was used to detect the difference in the response rates among different group types. The hypothesis was that group types are equally represented. If p-value is greater than 0.05, the difference in group type is judged to be insignificant.
Two independent-sample T-tests were used to test the differences between respondents and non-respondents. The p-values represent the significance levels of these tests. If p-value is greater than 0.05, the two groups are judged to be insignificantly different.
Therefore, the hypotheses for checking non-response bias are:
1. Respondents from different group types are equally represented 2. Average age of respondents – average age of non-respondents = 0 3. Average group size of respondents – average group size of non-respondents = 0
As shown in Table 2, the p-value for respondent/non-respondent group size test is greater than 0.05, indicating insignificant differences between respondents and non-respondents. Table 3 shows no significant difference in group type. Thus, non-response bias for group structure is judged to be insignificant. However, the p-value for respondent/non-respondent age test is less than 0.05 indicating significant age differences between respondents and non-respondents. In regard to age difference, various reviews of survey methodology (Dillman and Carley-Baxter 2000; Goudy 1976, Filion 1976, Mayer and Pratt Jr. 1967) have consistently found that in public opinion surveys, average respondent ages tend to be higher than average non-respondent ages. This difference is often caused by other reasons such as availability of free time rather than problems with survey methodology. In addition, because unit of analysis for this study is a visitor group, the group member who received the questionnaire may be different than the one who actually completed it after the visit. Sometimes the age of the actual respondent is higher than the age of the group member who accepted the questionnaire at the park. The different in ages indicate demographic data may need to be interpreted with caution.
Fort Bowie National Historic Site – VSP Visitor Study 243 March 1 - May 2, 2011
83
References Dey, E. L. (1997). Working with Low Survey Response Rates: The Efficacy of Weighting Adjustment.
Research in Higher Education, 38(2): 215-227. Dillman, D. A. (2007). Mail and Internet Surveys: The Tailored Design Method, Updated version with
New Internet, Visual, and Mixed-Mode Guide, 2nd Edition, New York: John Wiley and Sons, Inc. Dillman, D. A. and Carley-Baxter, L. R. (2000). Structural determinants of survey response rate over a
12-year period, 1988-1999, Proceedings of the section on survey research methods, 394-399, American Statistical Association, Washington, D.C.
Filion, F. L. (Winter 1975-Winter 1976). Estimating Bias due to Non-response in Mail Surveys. Public Opinion Quarterly, Vol 39 (4): 482-492.
Goudy, W. J. (1976). Non-response Effect on Relationships Between Variables. Public Opinion Quarterly. Vol 40 (3): 360-369.
Mayer, C. S. and Pratt Jr. R. W. (Winter 1966-Winter 1967). A Note on Non-response in a Mail Survey. Public Opinion Quarterly. Vol 30 (4): 637-646.
Salant, P. and Dillman, D. A. (1994). How to Conduct Your Own Survey. U.S.: John Wiley and Sons, Inc.
Stoop, I. A. L. (2004). Surveying Non-respondents. Field Methods, 16 (1): 23.


The Department of the Interior protects and manages the nation’s natural resources and cultural heritage; provides scientific and other information about those resources; and honors its special responsibilities to American Indians, Alaska Natives, and affiliated Island Communities. NPS 424/111376, December 2011

National Park Service U.S. Department of the Interior Natural Resource Stewardship and Science
Natural Resource Stewardship and Science 1201 Oakridge Drive, Suite 150 Fort Collins, CO 80525 www.nature.nps.gov