forthcoming, journal of politics - vanderbilt university · ♣i would like to particularly thank...
TRANSCRIPT
Testing Pendleton’s Premise: Do Political Appointees Make Worse Bureaucrats?♣
Forthcoming, Journal of Politics
David E. Lewis Princeton University
Woodrow Wilson School of Public and International Affairs 311 Robertson Hall Princeton, NJ 08540
[email protected](609) 258-0089 (o) (609) 258-5014 (f)
♣ I would like to particularly thank Joshua Clinton and John Gilmour for ongoing feedback and
advice on this project. I also thank Chris Achen, John Geer, Bob Hutchings, George Krause,
Nolan McCarty, Jennifer Seidel, several anonymous reviewers, and the Breakfast Club at
Princeton University for helpful comments.
1
Abstract
In this paper I use the Bush Administration’s Program Assessment Rating Tool (PART)
scores—a numerical measure of federal program performance—to analyze the relationship
between political appointees and management. I find that federal programs administered by
politically appointed bureau chiefs get systematically lower PART evaluations than programs
run by bureau chiefs drawn from the civil service. I find that career managers have more direct
bureau experience and longer tenures and these characteristics are significantly related to
performance. Political appointees have higher education levels, more private or not-for-profit
management experience, and more varied work experience than careerists but these
characteristics are uncorrelated with performance. I conclude that reducing the number of
appointees or increased sensitivity to appointee selection based upon certain background
characteristics could improve federal bureau management.
2
In the aftermath of Hurricane Katrina major national newspapers and numerous public
officials questioned whether the large number of political appointees in the Federal Emergency
Management Agency (FEMA) contributed to the poor handling of this natural disaster.1 By
almost any count, the agency has a large number of appointees for its size and critics have argued
that FEMA’s appointee-laden management structure created numerous management problems.
The FEMA example raises the important question of how political appointments influence
management not only in FEMA but across the federal government. Questions about whether
appointees or careerists are best for government performance go back at least to the late 1800s in
the United States. One of the primary motivations for the 1883 passage of the Pendleton Act was
to ensure competent administration of federal programs by creating a merit-based civil service
system (Skowronek 1982; Theriault 2003; Van Riper 1958). Reformers like Woodrow Wilson
believed that federal program administration would improve if it was inhabited by professional
civil servants hired, fired, and promoted on the basis of merit rather than political appointment.
Those objecting to its passage lamented not only the loss of valuable patronage but also worried
that those employees covered under the system would become less responsive to political
direction either because civil service would entrench opposition party workers or create an
unresponsive aristocratic class (Skowronek 1982; U.S. Office of Personnel Management 2003).
Apart from helping us understand FEMA’s disastrous response to Hurricane Katrina and
resolve historical debates about civil service versus political appointments, there are two
additional reasons for studying the relationship between appointees and performance. First,
scholars have noted an increase in the number of political appointees not only in the United
States (Light 1995; National Commission on the Public Service 1989, 2003) but also in a number
of different countries including Australia, Britain, Finland, France, Germany, Japan, and Spain
3
(Derlien 1996; Suleiman 2003). Research on the relationship between appointees and
performance can inform debates about reducing the number of appointees and the likely impact
of increases in appointments in different contexts.2
Second, a widely cited literature shows how different strategies for political control hurt
agency performance. For example, when preferences between legislatures and agencies diverge,
legislatures generally reduce agency discretion by writing more specific statutes, strengthening
administrative procedures, and monitoring more carefully (see, e.g., Epstein and O’Halloran
1999; Huber and Shipan 2002; McCubbins, Noll, and Weingast 1987). Efforts to restrict
discretion can reduce incentives for bureaucrats to develop and use expertise (Gailmard and
Patty 2006; Huber and Shipan 2002; Epstein and O’Halloran 1999).3 Studying the relationship
between appointees and performance can test whether another means of securing
responsiveness—political appointees—also diminishes performance.
Despite the importance and the duration of this topic, no consensus exists on whether
appointees or careerists (or some combination of the two) are best for federal management. This
is partly due to difficulties defining and measuring performance across agencies. In this paper I
use a new numerical measure of federal program performance—the Bush Administration’s
Program Assessment Rating Tool (PART) scores—to analyze the relationship between political
appointees and management. I find that programs administered by politically appointed bureau
chiefs get systematically lower PART evaluations than programs run by bureau chiefs drawn
from the civil service. I find that career managers have more direct bureau experience and longer
tenures and these characteristics are significantly related to performance. Political appointees
have higher education levels, more private or not-for-profit management experience, and more
varied work experience than careerists but these characteristics are uncorrelated with
4
performance. I argue that concerns about the relationship between appointees and performance
articulated in the original debates about civil service reform and illustrated in FEMA’s poor
response to Hurricane Katrina are justified. Efforts to enhance political control can sometimes
reduce overall bureaucratic competence. I conclude that reducing the number of appointees or
increased sensitivity to appointee selection based upon certain background characteristics could
improve federal bureau management.
Competing Views about Appointees and Management Performance
There are competing views about whether presidential appointees or career executives are
better for performance. On the one hand, a long tradition argues that political appointees drawn
from outside the civil service bring needed energy and responsiveness to federal management
(see, e.g., Bok 2003; Maranto 1998, 2001, 2005; Moe 1985). According to this view, low public
sector wages and the lack of pay-for-performance salary structures push the best and the
brightest workers into the private sector (National Commission on the Public Service 1989; see,
however, Crewson 1995). Civil service rules and regulations that stymie efforts to recruit, train,
and retain good managers only lessen the attractiveness of federal work for potential employees
(Bilmes and Neal 2003). As a consequence of these factors, appointees drawn from the private
sector arguably have higher levels of human capital than their careerist counterparts.
The distinct means of appointment and prior background experience create systematic
differences between the two populations of federal executives. Appointees and careerists have
different perspectives on the policy world (generalist vs. specialist) and a different relationship to
political stakeholders (superior vs. inferior knowledge of political stakeholders’ preferences).
Career executives are more likely to start low in a bureau’s hierarchy, work a significant portion
5

of their career in that agency, and be a substantive expert in the policy area they manage.
Appointees are less likely to be specialists, less likely to see the world through the bureau’s eyes,
be more attuned to the preferences of elected stakeholders, and better able to do the political
work necessary for successful program implementation (Maranto 1998, 2001, 2005; Moe 1985).
On the other hand, an impressive literature has lauded the management advantages of
career executives. Indeed, the historical intellectual motivation for the career merit system itself
was to establish a more competent, professional administration of government (Kaufman 1965,
Simon et al. 1950 [1991]). According to this view, career executives have subject area expertise,
public management skills, and longer tenure (see, e.g., Cohen 1998; Heclo 1975, 1977; Kaufman
1965; National Commission on the Public Service 1989, 2003; Suleiman 2003). Each of these
characteristics are said to improve management. Subject area expertise and experience with the
bureau being administered reduces information asymmetries between the manager and staff and
facilitates monitoring and program implementation. Careerists are more likely to have public
management experience. Many generic management skills are difficult to transfer from the
private sector due to the important differences between the two work environments. Even in
cases where political appointees have comparable experience and expertise, agencies
administered by appointees experience higher turnover. Increased turnover creates leadership
vacuums, mixed signals about agency goals, an inability to credibly commit to reform, and
generally poorer performance (Boylan 2004; Heclo 1977). Turnover also disrupts working
relationships among functionally related agencies and programs.
Related to the question of whether appointees or careerists are better for management is
the question of whether some combination of appointees and careerists in a management team is
best for performance (see, e.g., Dunn 1997; Golden 2000; Heclo 1977). A number of works
6

examine how appointees and careerists can work creatively and productively together. Indeed,
the right balance of appointees and careerists may allow appointees to correct the biases that
characterize careerist decision making and vice versa (Bok 2003; Krause, Lewis, and Douglas
2006; Suleiman 2003).
Testing Competing Views
It has been difficult to evaluate competing views about the relationship between
appointments and performance empirically and as a consequence we know strikingly little about
this important issue systematically (Boyne 2003; Brewer and Selden 2000). A number of
excellent works detail how appointees in specific administrations did or did not influence
administrative policy and performance in specific agencies (see, e.g., Durant 1992; Goldenberg
1984; Harris and Milkis 1996; Heclo 1977; Lane 1992; Nathan 1975; Randall 1979; Wood and
Waterman 1994). Research which examines a broader set of agencies and isolates the influence
of appointee management on performance, however, is scarce. One major difficulty is that it is
hard to define good performance objectively and in a manner acceptable to different
stakeholders. Is a count of enforcement actions a good measure of performance? How about the
number of patents issued or the number of lawsuits filed per dollar? For administration officials a
definition of good performance must include responsiveness to the president’s policy agenda.
For members of Congress, clients of the agency, or other interested parties, the definition of good
performance is likely to differ.
A second difficulty is that it is hard to compare executives and agencies against each
other since agencies have different mandates, operating environments, and constraints. Doing a
comparative study of executive performance is an awesome task. It requires an acceptable
7
definition of good performance, an identification of the universe of federal bureau chiefs, an
acceptable grading scheme, willingness on the part of federal executives to participate, and an
approach that is sensitive to differences among federal programs. Given these constraints, it is no
surprise that large-N evaluations of comparative management performance have been difficult to
execute.
The large-N evidence that seeks to examine objective performance focuses primarily on
agencies engaged in macroeconomic forecasting or does not adequately distinguish appointees
from careerists. The literature examining macroeconomic forecasting finds at the state level that
forecasting agencies with either appointed directors and careerist employees or careerist directors
and at-will employees produce the most accurate forecasts (Krause, Lewis, and Douglas 2006).
At the federal level the evidence suggests that there is no difference in current year forecast
performance among agencies based upon differences in agency design (Krause and Douglas
2005, 2006). There is, however, some evidence which suggests that the more politicized Office
of Management and Budget is systematically more optimistic in some of its future year forecasts
than the less politicized Social Security Administration although the optimism appears unrelated
to changing politicization levels within each agency over time (Krause and Corder 2007). It is
unclear, however, whether the findings are generalizable to other types of agencies.
Gilmour and Lewis (2006a) use the Program Assessment Rating Tool (PART) scores
described below to compare the performance of federal programs run by managers in the Senior
Executive Service (SES) with programs administered by Senate-confirmed appointees. They find
that federal programs administered by Senate-confirmed appointees get systematically lower
PART scores but do not distinguish between appointed and careerist members of the SES or
explain what it is about Senate confirmed appointees that leads to poorer program performance.
8

Using the PART for Evaluating Management Performance
The Bush Administration’s PART system provides a useful means of overcoming the
substantial difficulties described above with measuring performance. The PART system is a
grading scheme used by the Office of Management and Budget (OMB) to evaluate the
performance of federal programs numerically. It was developed through the Federal Advisory
Commission Act process in cooperation with the President’s Management Council, the National
Academy of Public Administration, and other interested parties from the administration,
Congress, and the non-profit sector. Four categories of performance receive grades from 0 to
100 based upon a series of 25-30 yes/no questions filled out jointly by agencies and OMB
examiners.4 The four categories are:
• Program Purpose & Design (weight= 20%): to assess whether the program
design and purpose are clear and defensible
• Strategic Planning (weight= 10%): to assess whether the agency sets valid
annual and long-term goals for the program
• Program Management (weight=20%): to rate agency management of the
program, including financial oversight and program improvement efforts
• Program Results (weight=50%): to rate program performance on goals
reviewed in the strategic planning section and through other evaluations5
These raw scores are weighted and combined for a total numerical score (0-100) and overall
categorical grade—ineffective, results not demonstrated, adequate, moderately effective, and
effective.6 The Bush Administration graded 234 programs (20%) for the FY 2004 budget, 176
more for the FY 2005 budget, and 206 programs for FY 2006. The remaining federal programs
were scheduled to be graded in the FY 2007-8 budgets.7 There is quite a bit of variation in the
9

total scores. For the cohort graded in the FY 2006 budget, the average score is 62.78 and the
minimum and maximum are 13.82 and 96.7, respectively. The lowest scoring programs for FY
2006 were programs in the Bureau of Indian Affairs (Department of the Interior), the Office of
Elementary and Secondary Education (Department of Education), and the Office of
Postsecondary Education (Department of Education).8 The highest scoring programs were in the
Secret Service (Department of Homeland Security), National Science Foundation, and the
Bureau of Educational and Cultural Affairs (Department of State).9
The PART is a measure of program performance and is useful for comparing
management performance for two reasons. First, as indicated above, the way that program
performance is evaluated is largely through the presence or absence of good management
practices and performance. Second, good program performance is partly a product of
management performance. If one controls for program-specific characteristics, then the impact
of appointee or careerist management on program performance can be isolated.
Potential Problems with Using PART Scores
There are a number of potential objections to the use of PART scores to make inferences
about management performance. First, there are different definitions of good management and
PART scores may not measure all of the aspects these different definitions that we care about.
No measure of program or management performance—including PART—is going to be able to
account for all of these definitions. The PART comprises only one measure of good
performance but it has a number of advantages. Specifically, the evaluations are subject to
public scrutiny, the PART is applied across more than 600 federal programs, and the instrument
is comprised of generally agreed upon aspects of good performance.
10

A second potential difficulty with using PART scores is that there may be irregularities in
the way that PART is applied across programs since programs face different legal, budgetary,
and resource constraints, examiners vary in competence and experience, and data availability and
quality varies. Even if there is error in the application of the PART, however, the scores can still
be useful for evaluating program performance provided that the grades correlate somewhat with
real performance and statistical analysis is conducted carefully.10
Evaluated program performance is a function of factors (both program-specific and
manager-specific) that add up to true performance and some error, either a little or a lot. This
error is not a problem for making comparisons between different types of managers unless the
error is non-random and not only non-random, but also correlated with whether or not a program
is run by a political appointee or careerist. If the error in PART scores is purely random, say a
few extra points here and a few less there for all the grades, this will increase the size of standard
errors (increase inefficiency). This makes it less likely that any statistically significant
relationship between appointment authority and performance emerges and implies that the
statistical tests using PART scores will be relatively conservative.
Of course, there is still the possibility of a third problem, that the grades are biased, that the
errors in applying PART occur in non-random and pernicious ways. For example, it is possible
that all programs created by Democratic presidents or all programs administered by small
bureaus are graded systematically worse than programs created by Republican presidents or
programs in large bureaus. While not an admirable grading scheme, this would not cause
problems for inference so long as Democratic and Republican programs and programs in large
and small bureaus were equally likely to be run by political appointees or careerists. That is, if
the errors in grading are uncorrelated with the variable of interest (political appointee vs.
11
careerist) we are on solid ground using the PART evaluations to make inferences about program
performance and, thus, management performance.
In the worst case scenario for inference, there is error in the grading of federal programs
that is correlated with whether the program is administered by a careerist or appointee. If this is
the case one can prevent inferential errors by controlling for the source of bias. For example, if
our concern is that all programs created by Democratic presidents or all programs in small
bureaus are being graded down, we can estimate statistical models that allow us to control for
precisely these program-specific and bureau-specific factors.
It is important to note that if such bias in the grading existed, the errors would likely
favor political appointees. If the administration wanted to favor one group of managers over
another, they would favor appointees over careerists since appointees were selected by the
administration and their performance can more directly be tied to the president. In total, if used
thoughtfully and with the appropriate caveats, the PART scores provide a unique opportunity to
analyze the relationship between appointees and federal program performance.
Comparing the Backgrounds and Work Environments of Appointees and Careerists
For each of the 614 programs graded, OMB has produced a worksheet that lists both a
department and bureau administering the program. I found the names and appointment
authorities of agency heads for each bureau using the Federal Yellow Book and the Plum Book.11
In the federal government the bulk of federal bureau chiefs are either Senate-confirmed political
appointees (PAS) or members of the Senior Executive Service (SES). The SES is a corps of
7,000 - 8,000 federal managers that serve in management positions between PAS appointees and
the traditional civil service. It is comprised of a mixture of career managers and political
12

appointees. I obtained background information on the bureau chiefs using publicly available
biographies either from the web or through direct contact with the bureau.
In total, there are 245 different bureau chiefs administering the 614 graded federal
programs. Appointment status information was available for 242 of the 245 managers. Of these,
62 percent were Senate-confirmed political appointees, 11 percent were politically appointed
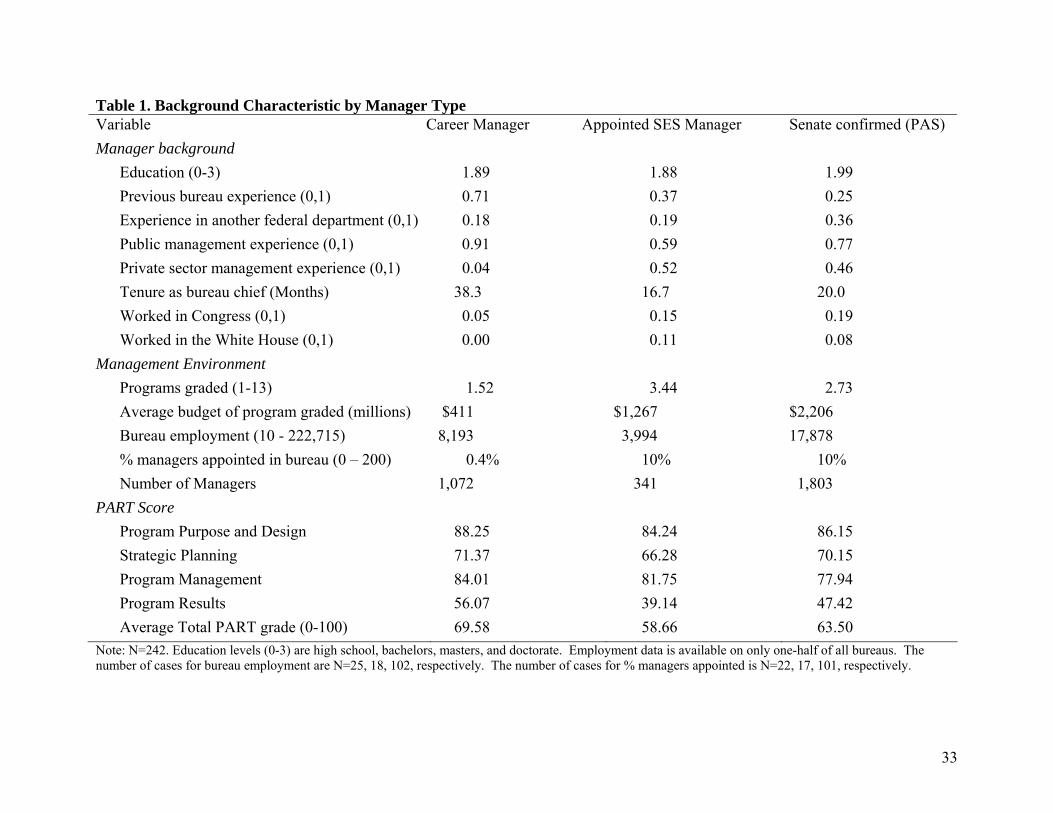
members of the SES, and 25 percent were career SES managers.12 A summary of the differences
in background characteristics between careerists and appointees of different types is included in
Table 1.
Insert Table 1 here.
There are significant differences between appointed and career bureau chiefs.
Appointees have more private or non-profit management experience and are significantly more
likely to have worked in Congress or the White House before they accepted their current post.
Appointees have slightly higher average levels of education and are more likely to be generalists,
having worked in other departments prior to their current job. Careerists are the most likely to
have worked in the bureau they manage, have the most public management experience, and they
have the longest tenures in their current position. The fact that career managers have longer
tenures implies that appointee-run federal programs experience more managerial turnover than
programs administered by careerists.
The work environments of these managers also differ significantly. Appointees manage
the largest bureaus in terms budgets and number of programs although not necessarily
employment. Appointees in the SES manage bureaus with the smallest average employment and
the fewest managers. Not surprisingly, appointees work in the most politicized bureaus. While
13
only 0.41% of the SES executives in careerist-run bureaus are appointed, 10% of executives are
appointed in appointee-run bureaus.13
Insert Figure 1 here.
The differences between appointed and career bureau chiefs appear at first glance to
matter for performance. Figure 1 includes histograms of total PART scores by manager type.
Programs administered by appointees have significantly lower average PART scores than career
managers (p<0.00).
Do Appointees Influence Program Performance? Econometric Models
Of course, the difference in PART scores may be due to other factors such as the
possibility that appointees administer bureaus that are harder to manage. Appointee-run bureaus
tend to be larger and the programs they administer are more expensive. The only way to
disentangle whether differences in performance between appointees and careerists is due to
characteristics of the two populations or other factors is to estimate models with appropriate
controls.
Controls
There are significant differences across federal programs that make comparative
evaluation difficult. One of the biggest differences among programs is the basic purpose of the
program. Some programs like Supplemental Security Income (Social Security Administration)
are direct federal programs providing services or benefits to the population directly. Other
programs like the Acid Rain program in the Office of Air and Radiation at the Environmental
Protection Agency are regulatory programs. To account for this the models include indicators of
14
primary program type—block/formula grant (16.3%), capital assets and service acquisition
(9.6%), competitive grant (18.1%), credit (3.8%), direct federal (30.5%), mixed (1.0%),
regulatory (6.8%), and research and development (14.1%) programs. The models also control for
program size-- natural log of the program budget--since larger programs may be harder to
manage and the size of the programs administered differed by type of manager.14
Differences among bureaus can also make management harder or easier. Some bureau
chiefs are insulated from political pressure by fixed terms (7% of obs.). Others administer
programs as chair of a commission (3% of obs.).15 To account for these differences I include
indicators for fixed terms and bureaus organized as commissions. Bureaus also vary by the
number of programs they manage so I include a count of the number of programs a bureau has
had evaluated as a control.16
If PART scores are politicized, the policy content of a program could influence the grade
the program receives. For example, programs such as social welfare or environmental programs
typically identified with the Democratic Party might be graded lower. There is no perfect way to
measure the policy content of specific programs. The models partly control for this by including
indicators of program type which include information about function (e.g., regulatory, credit,
research and development). I also include an indicator for whether a program was created under
a Democratic president as a rough measure of a program’s policy content (50% of obs.).17
Similarly, since PART scores are generated by a Republican Administration, I loosely expect
that programs created under Democratic presidents will get systematically lower grades.18
Some of the difficulty or ease of managing a program may be due to the politics at the
time the agency was created. Moe (1989) argues that federal program design is the result of a
struggle among political actors and that this struggle may result in structures and processes that
15

are not effective. To test for this I include an indicator for divided government at the time a
program was created (59%). My rough expectation is that programs created during periods of
divided government will get systematically lower PART scores.
Methods
There are three immediate difficulties in model estimation. First, whether or not a
program is administered by a careerist or an appointee may be endogenous. In other words, the
same variables that predict the PART score could also predict whether or not a bureau is headed
by a careerist or an appointee. For example, it is possible that appointees are selected to run all
programs that are difficult to manage and careerists are chosen to lead all programs that are easy
to manage. If this is the case, any relationship between appointment status (appointee or
careerist) and PART score could be spurious because the ultimate cause of the low PART score
would be the inherent difficulty of the program itself not whether the manager is an appointee or
a careerist. While it is not clear why appointees would be more likely to be chosen to administer
the most difficult programs, this concern must be taken seriously. All models attempt to control
for the management environment, including program and bureau characteristics that would make
them hard or easy to manage. I also estimated a set of instrumental variables regressions where
the appointment authority of the bureau chief is estimated along with the impact of appointment
authority on PART score. In these regressions I could not reject the null hypothesis that the
original OLS coefficients were consistent. As such, I report the OLS estimates here.19
Second, there are multiple observations on each bureau chief meaning that the
observations are not independent, a violation of the traditional Gauss-Markov assumptions. To
account for this I report robust standard errors clustered on each bureau chief. I have also
16

estimated models using each bureau chief as one observation and the average score of the bureau
chief as the dependent variable. The results are generally stronger than what is reported here.20
Finally, there is some missing data for a few of the control variables. The missing data
stem almost exclusively from the lack of employment, budget, or start year data (i.e., information
about the politics at the time the program was created). The reason for this is that what the Office
of Management and Budget (OMB) considers an agency does not always coincide with what the
Office of Personnel Management (OPM) decides is an agency. For example, OMB identifies
PART scores and budgets for programs and bureaus in the Department of Energy (DOE) but
OPM does not collect employment data for DOE at the bureau level. This means I have PART
scores for programs in DOE but I do not have employment data. The other primary reason for
missing data is that there was no clear identifiable start date for some programs evaluated in the
PART process. For these cases I could not get data on the politics at the time the program was
created (i.e., created under divided government, created under Democratic president). This
means that cases with missing data are likely to be smaller than other cases, at a level in the
bureaucracy where programs are more likely to be headed by career managers, and less likely to
have clear political origins. As such, I have more confidence making inferences about programs
with their own line the in budget, programs that are managed by agencies that have data
collected by both OMB and OPM, and programs that have clear start dates. Some care should be
taken in making inferences about the impact of appointee management on smaller, less well-
known programs and agencies.21 I also estimate multiple models including or excluding the
controls to show that the results are generally robust.
17
Results
Table 2 includes estimates from 3 models regressing a program’s total PART score on
whether or not the bureau chief is an appointee or careerist, controlling for characteristics of the
program themselves, the bureaus that implement the program, and the policy or political content
embedded in the program. 22 The results of these regressions confirm what was demonstrated in
Figure 1, namely that programs administered by appointees get systematically lower
management grades than careerists even when controlling for differences among programs,
substantial variation in management environment, and the policy content of programs
themselves. The coefficients are significant in two-tailed tests and point estimates indicate that
programs administered by appointed managers get grades 5-6 points lower than those
administered by careerists. These effects are most robust for Senate-confirmed appointees.23 To
put this in perspective, if there were two comparable programs, one managed by an appointee
and the other by a careerist, the performance bonus due to the careerist would be the equivalent
of moving from the 5th percentile in PART scores to the 10th or from the 90th percentile to the
95th. These models will actually underestimate the true benefits of career management if the
administration has biased the grades in favor of appointees.
Insert Table 2 here.
The finding that programs administered by appointees get systematically lower grades
than programs run by career managers is important for several reasons. First, these results are
some of the first systematic evidence we have across multiple contexts that appointee-run federal
programs do not perform as well as careerist-run programs. They confirm the underlying logic
for the creation of the merit system and reinforce the claims of recent major public commissions
on the public service about the relationship between appointees and performance (National
18

Commission on the Public Service 1989, 2003). They also confirm the claims of a number of
authors who argue that increases in the number of appointees have hurt federal program
management (Cohen 1998; Dunn 1997; Gilmour and Lewis 2006a; Heclo 1975, 1977; Kaufman
1965; Light 1995; Suleiman 2003). These findings suggest that while appointees may have
certain benefits for performance as some authors suggest (Bok 2003; Maranto 1998, 2001, 2005;
Moe 1985), their overall impact on program management appears to be negative as measured by
PART scores. Second, these grades are important in the current budgetary process. The Bush
Administration has used this performance information to make budget determinations and
programs administered by appointees may be at a slight disadvantage (Gilmour and Lewis
2006b,c).
A number of other estimates are worth mentioning. First, research and development
programs (the base category) get the highest grades while grant programs get the lowest. One
possible explanation is that research and development programs are more insulated from politics
than other programs since it is harder for political overseers to understand their processes and
outputs. Second, programs administered by bureau chiefs who serve for fixed terms get
systematically higher PART scores, almost 11-12 points higher than other programs. This
suggests that some insulation from presidential control may enhance traditional management.
Third, programs created during periods of divided government score about 4 points lower than
programs created during a period of unified government. This suggests that political conflict
during periods of divided government might hurt program design as Moe (1989) argues. A
program’s opponents may be successful adding features to its design that will make it less
effective. This finding suggests that the benefits of political moderation stemming from our
separation of powers system may be offset by difficulties generated by managing programs that
19

are the product of compromise. Finally, programs created under Democratic presidents score
about 3.5 points lower than programs created during the tenure of a Republican president.
Similar to the findings of Gilmour and Lewis (2006a), this result suggests that evaluations of
policy content may be working their way into the administration’s evaluation of program
performance.
Explaining the Appointee-Careerist Gap
While the regression estimates in Table 2 tell us that programs administered by
appointees get lower grades, they do not tell us why. The descriptive statistics in Table 1 indicate
a number of important differences between appointees and careerists. Appointed managers have
higher levels of education, more private or non-profit management experience, and have
significantly more public affairs experience. Appointed managers are more likely to be
generalists, having worked in the federal government outside the bureau they currently manage.
Careerists are more likely to be specialists and have work experience in the bureau they manage
and they are more likely to have public (as opposed to private) management experience.
Careerists serve longer tenures on average so that programs administered by appointees
experience more executive turnover.
In Table 3 I estimate models that include characteristics of the managers themselves in
place of the indicator for whether or not the bureau chief is an appointee. I include education
indicators for the highest level of education achieved where a high school education is the base
category. The models include indicators for whether the bureau chief has worked outside the
bureau in another federal department (0,1), has private management experience (0,1), and has
worked in either Congress (0,1) or the White House (0,1). I also code each manager according to
20

whether they have worked in the bureau before (0,1), how long they have served in their current
position (20--mean, 0--min, 182--max), and whether they have had public management
experience (0,1). The models in Table 3 include the same controls as in Table 2.
Insert Table 3 here.
The model estimates help explain why careerist-run programs get higher PART scores
and also illuminate where previous public affairs experience might help bureau chiefs.24 The
background characteristics that favor appointees such as higher education levels or business
experience do not appear to matter for program performance. Two of the background
characteristics that favor careerists do appear to matter: previous bureau experience and length of
tenure.
The estimated coefficient for previous bureau experience is significant and positive in
both models in Table 3. Bureau chiefs who worked in the bureau before they assumed their
management position are estimated to score 4 to 5 points higher on a program’s total PART
score. Presumably, their knowledge of programs, processes, structures, and personnel facilitates
monitoring, reduces the startup costs associated with a new management position, and helps
them know better how to measure and manage performance. Previous bureau experience may
also indicate specialized policy knowledge that helps facilitate management oversight. One
implication of this finding is that it is prudent to either recruit managers from the career service
or select appointees who have served in previous administrations in similar positions (Mackenzie
1987).
Of course, after a period of time all managers can learn how the bureau and its programs
operate, although not perhaps at the level of intimacy of a person who came up through a
bureau’s ranks. The longer a bureau chief has been at the head of a bureau, the better their
21
program’s performance.25 Increasing management tenure by 10 months increases the PART
score of a program by 2 to 2.5 points. The benefits of longer tenure appear to diminish over time.
That is, once a manager has served 85 to 115 months, more experience does not appear to help
her performance. For most bureau chiefs, longer tenure can only improve performance.
Interestingly, previous public management experience or work experience in another
department does not significantly improve PART performance. There are three possible
explanations. First, and most obvious, generalists who move in and out of different positions are
no better than specialists at managing. General experience does not make up for a lack of
specific bureau knowledge. Second, it is possible that generalists do perform better but that this
measure of work history also captures the influence of those managers who have been shifted
around to different positions because of past failures. Third, it is possible that generalist
managers are appointed to run the toughest programs. It is impossible to disentangle these three
explanations with this data but these results provide no evidence that generalists are better
managers on average.
Two of the primary advantages of political appointees are higher levels of education and
previous experience working in the political branches. Neither of these characteristics improved
performance on PART. I could not reject the null that education had no influence on
management performance except for the evidence that managers with a bachelors degree perform
better than those with only a high school education. Of course, it is possible that only the very
most talented people from the set of employees with low levels of education make it into these
management positions. This would dampen the influence of education on performance.
Managers with higher levels of education may be able to get management positions without the
same type of screening mechanism that applies to those without degrees. Private management
22
was also uncorrelated with PART performance. It was not significant in any specification. This
bolsters the claim of public management scholars that private management experience does not
necessarily transfer to the public sector due to significant differences between the two
management environments.
In total, the evidence on the causes of the appointee-careerist gap suggests that the
existing literature on the advantages of career employees is partly right. Previous bureau
experience and longer tenure are positively correlated with performance. This confirms the
claims of authors such as Cohen (1998) and Heclo (1975, 1977) on the benefits of previous
experience and Boylan (2004) and Heclo (1977) on the benefits of longer tenure. More generally,
it suggests that a career professional civil service can improve federal performance to the extent
that it cultivates site-specific expertise and longer tenure. Interestingly, however, previous public
management experience, even in other federal departments, was not related to performance. Not
only are there significant differences between private and public sector management, but
important differences may exist within jobs in the public sector that make it hard for managers to
translate experience and expertise from one public sector job to another. The results demonstrate
that the measurable advantages of appointed managers in terms of education, private sector
experience, and political experience do not translate directly into program performance. As such,
this research provides very little evidence to support the claims of authors such as Bok (2003),
Maranto (1998, 2001, 2005), or Moe (1985) that appointee-run federal programs should perform
better than careerist-run programs. It is possible that some harder to measure features of
appointees does improve performance although it should be remembered that appointee-run
programs do consistently worse across the board.
Insert Table 4 here.
23
One area where appointees should have a clear advantage is in responsiveness to elected
officials. In the main models, previous work in Congress or the White House or any public
administrative position was uncorrelated with management performance. In Table 4 I regressed
the raw program purpose and design scores from the PART evaluation on the variables I describe
above.26 This subsection of the PART evaluation that asks questions such as “Is the program
purpose clear?” and “Is the program optimally designed to address the national interest, problem
or need?” What is interesting in these regressions is that previous public management
experience, work in Congress, or work in the White House does significantly improve the
manager’s ability to craft a program purpose and design that is clear and acceptable to OMB.
Previous experience of this type is estimated to increase a program’s raw program and purpose
score by 8.5 to 14 points, almost one standard deviation in some cases. Political experience does
appear to have some benefits in managing in a political environment. Unfortunately, however,
this experience does not carry over to strategic planning, program management, and generating
program results, the nuts and bolts of bureau management.
Discussion and Conclusion
This research has used the Bush Administration’s Program Assessment Rating Tool
(PART) scores to evaluate relationship between appointees and federal program performance.
The use of PART scores and the collection of biographical information on bureau chiefs provides
a useful way of evaluating systematically two important questions in political science, namely
Are appointees or careerists better for federal management? What differences between
appointees and careerists matter for management performance? This analysis demonstrates that
appointees get systematically lower performance grades than careerists. Previous bureau
24

experience and longer tenure in management positions explain why careerist-run programs get
higher grades. The advantages that appointees tend to have over careerist bureau chiefs such as
higher levels of education, private management experience, and work in other departments
outside the bureau are not significantly related to total PART score. Public affairs experience,
however, does seem to help on one aspect of public management which is translating political
wishes into a clear program purpose and design.
The systematic results demonstrating the appointee-careerist management gap have
implications for our understanding the federal government’s response to Hurricane Katrina, the
historical justification for the merit system, current debates about reducing the number of
appointees, and democratic theory. They suggest that the negative influence of appointees on
FEMA performance is generalizable to other programs and agencies. These results add weight to
what civil service reformers like George Pendleton believed, namely that a merit-based civil
service system would lead to lower turnover in the federal workforce and the cultivation of
useful administrative expertise.
One implication of this research is that reducing the number of political appointees or
stemming the increase in the US and other countries may be one means of improving
performance (see, e.g., National Commission on the Public Service 1989, 2003). It appears that
the need for bureaucratic control and historical demands for patronage appear to have pushed the
number of appointees beyond the numbers optimal for performance in the United States. Putting
federal program management in the hands of careerist managers might help remedy that
imbalance. Generally, finding the right mix of appointees and careerist can improve performance
and more research needs to be conducted to find this “sweet spot” in the balance between
appointee and careerist management.
25
Short of reducing the number of appointees, this research suggests other means of
improving performance. Presidents could keep or increase the number of appointees provided
they ensure the competence of the people they select or focus on selecting people who are
willing to serve longer than most appointees do. The president and Congress could improve
performance as measured by PART by recruiting managers from the career service and
recruiting appointees who are “in-and-outers,” executives who have served in previous
administrations in similar positions.
In total, the research highlights how securing democratic control of the bureaucracy can
erode competence. To be effective the modern administrative state needs a corps of professional,
continuing personnel who are competent at what they do. Creating a corps of professional
administrative officials, however, can make administrative officials more autonomous. Making
government democratic requires solving the difficult problem of both establishing a competent
government and reining in the autonomy that comes from making it competent.
26

References
Bilmes, Linda J. and Jeffrey R. Neal. 2003. "The People Factor: Human Resources Reform in
Government." In John D. Donahue and Joseph S. Nye Jr., Eds. For the People: Can We
Fix Public Service? (Washington, DC: Brookings).
Bok, Derek. 2003. "Government Personnel Policy in Comparative Perspective." In John D.
Donahue and Joseph S. Nye Jr., Eds. For the People: Can We Fix Public Service?
(Washington, DC: Brookings).
Boylan, Richard T. 2004. "Salaries, Turnover, and Performance in the Federal Criminal Justice
System." Journal of Law and Economics XLVII: 75-92.
Boyne, George A. 2003. “Sources of Public Service Improvement: A Critical Review and
Research Agenda.” Journal of Public Administration Research and Theory 13 (3):367-
394.
Brewer, Gene A., and Sally Coleman Selden. 2000. “Why Elephants Gallop: Assessing and
Predicting Organizational Performance in Federal Agencies.” Journal of Public
Administration Research and Theory 10 (4):685-711.
Cohen, David M. 1998 "Amateur Government." Journal of Public Administration Research and
Theory 8: 450-97.
Crewson, Philip E. 1995. “A Comparative Analysis of Public and Private Sector Entrant
Quality.” American Journal of Political Science 39(August): 628-639.
Derlien, Hans-Ulrich. 1996. “The Politicization of Bureaucracies in Historical Perspective.” In
Agenda for Excellence 2: Administering the State, edited by B. G. Peters and B. A.
Rockman. Chatham, NJ: Chatham House Publishers, Inc.
27

Dunn, Delmer D. 1997. Politics and Administration at the Top: Lessons from Down Under.
Pittsburgh, PA: University of Pittsburgh Press.
Durant, Robert F. 1992. The Administrative Presidency Revisited: Public Lands, the BLM, and
the Reagan Revolution. Albany, NY: State University of New York Press.
Epstein, David, and Sharyn O'Halloran. 1999. Delegating Powers. New York, NY: Cambridge
University Press.
Gailmard, Sean, and John W. Patty. 2006. “Slackers and Zealots: Civil Service, Policy
Discretion, and Bureaucratic Expertise.” Manuscript, Northwestern University.
Gilmour, John B. 2006. Implementing OMB’s Program Assessment Rating Tool (PART):
Meeting the Challenges of Integrating Budget and Performance. IBM Center for the
Business of Government (www.businessofgovernment.org/pdfs/GilmourReport.pdf).
Gilmour, John, and David E. Lewis. 2006a. “Political Appointees and the Competence of Federal
Program Management.” American Politics Research 34 (1):22-50.
Gilmour, John, and David E. Lewis. 2006b. “Assessing Performance Assessment for Budgeting:
The Influence of Politics, Performance, and Program Size in FY 2005.” Journal of Public
Administration Research and Theory 16 (2):169-86.
Gilmour, John, and David E. Lewis. 2006c. “Does Performance Budgeting Work? An
Examination of OMB's PART Scores.” Public Administration Review 66(5):742-52.
Golden, Marissa Martino. 2000. What Motivates Bureaucrats? Politics and Administration
During the Reagan Years. New York, NY: Columbia University Press.
Goldenberg, Edie N. 1984. “The Permanent Government in an Era of Retrenchment and
Redirection.” In The Reagan Presidency and the Governing of America, edited by L. M.
Salamon and M. S. Lund. Washington, DC: The Urban Institute Press.
28

Harris, Richard A., and Sidney M. Milkis. 1996. The Politics of Regulatory Change: A Tale of
Two Agencies, 2nd ed. New York, NY: Oxford University Press.
Heclo, Hugh. 1975. “OMB and the Presidency--the problem of ‘neutral competence’.” The
Public Interest 38 (Winter):80-98.
Heclo, Hugh. 1977. A Government of Strangers: Executive Politics in Washington. Washington,
DC: Brookings Institution.
Honaker, James, Anne Joseph, Gary King, Kenneth Scheve, and Naunihal Singh. 2001. Amelia:
A Program for Missing Data (Windows version) Cambridge, MA: Harvard University,
http://Gking.Harvard.edu/.
Huber, John D., and Charles R. Shipan. 2002. Deliberate Discretion? New York, NY:
Cambridge University Press.
Huber, John D., and Nolan McCarty. 2004. “Bureaucratic Capacity, Delegation, and Political
Reform.” American Political Science Review 98(3):481-94.
Kaufman, Herbert. 1965. "The Growth of the Federal Personnel System." In The Federal
Government Service, edited by Wallace S. Sayre, 7-69. Englewood Cliffs, NJ: Prentice-
Hall, Inc.
King, Gary, James Honaker, Anne Joseph, and Kenneth Scheve. 2001. “Analyzing Incomplete
Political Science Data: An Alternative Algorithm for Multiple Imputation.” American
Political Science Review 95(1):49-69.
King, Gary, Michael Tomz, and Jason Wittenberg. 2000. “Making the Most of Statistical
Analyses: Improving Interpretation and Presentation.” American Journal of Political
Science 44(2):347-61.
29

Krause, George A., and J. Kevin Corder. 2007. “Explaining Bureaucratic Optimism: Theory and
Evidence from U.S. Federal Executive Agency Macroeconomic Forecasts.” American
Political Science Review 101(February). Forthcoming.
Krause, George A., and James W. Douglas. 2005. “Institutional Design versus Reputational
Effects on Bureaucratic Performance: Evidence from U.S. Government Macroeconomic
and Fiscal Projections.” Journal of Public Administration Research and Theory 15
(2):281-306.
Krause, George A., and James W. Douglas. 2006. “Does Agency Competition Improve the
Quality of Policy Analysis? Evidence from OMB and CBO Current Year Fiscal
Projections.” Journal of Policy Analysis and Management 25(Winter):53-74.
Krause, George A., David E. Lewis, and James W. Douglas. 2006. “Political Appointments,
Civil Service Systems, and Bureaucratic Competence: Organizational Balancing and
Gubernatorial Revenue Forecasts in the American States.” American Journal of Political
Science 50 (3):770-87.
Lane, Larry M. 1992. “The Office of Personnel Management: Values, Policies, and
Consequences.” In The Promise and Paradox of Civil Service Reform, edited by P. W.
Ingraham and D. H. Rosenbloom. Pittsburgh, PA: University of Pittsburgh Press.
Light, Paul. 1995. Thickening Government: Federal Hierarchy and the Diffusion of
Accountability. Washington, DC: Brookings.
Mackenzie, G. Calvin, ed. 1987. The In-and-Outers: Presidential Appointees and Transient
Government in Washington. Baltimore: The Johns Hopkins University Press.
Maranto, Robert. 1998. “Thinking the Unthinkable in Public Administration: A Case for Spoils
in the Federal Bureaucracy.” Administration and Society 29 (6):623-42.
30
Maranto, Robert. 2001. “Why the President Should Ignore Calls to Reduce the Number of
Political Appointees.” The Heritage Foundation Backgrounder (1413).
Maranto, Robert. 2005. Beyond a Government of Strangers. Lanham, MD: Lexington Books.
McCubbins, Mathew D., Roger Noll, and Barry Weingast. 1987. “Administrative Procedures as
Instruments of Political Control.” Journal of Law, Economics, and Organization 3:243-
277.
Moe, Terry M. 1985. “The Politicized Presidency.” In The New Direction in American Politics,
edited by J. E. Chubb and P. E. Peterson. Washington, DC: Brookings.
Moe, Terry M. 1989. “The Politics of Bureaucratic Structure.” In Can the Government Govern?
Edited by J. E. Chubb and P. E. Peterson. Washington, DC: Brookings.
Nathan, Richard P. 1975. The Plot that Failed: Nixon and the Administrative Presidency. New
York, NY: John Wiley.
National Commission on the Public Service. 1989. Leadership for America: Rebuilding the
Public Service. Washington, DC.
National Commission on the Public Service. 2003. Urgent Business for America: Revitalizing the
Federal Government for the 21st Century. Washington, DC: Brookings.
Randall, Ronald. 1979. “Presidential Powers versus Bureaucratic Intransigence: The Influence
of the Nixon Administration on Welfare Policy.” American Political Science Review 73
(3):795-810.
Simon, Herbert A., Victor A. Thompson, and Donald W. Smithburg. 1991 [1950]. Public
Administration. New Brunswick, NJ: Transaction Publishers.
Skowronek, Stephen. 1982. Building a New American State: The Expansion of National
Administrative Capacities, 1877-1920. New York, NY: Cambridge University Press.
31

32
Suleiman, Ezra. 2003. Dismantling Democratic States. Princeton, NJ: Princeton University
Press.
Theriault, Sean M. 2003. “Patronage, the Pendleton Act, and the Power of the People.” Journal
of Politics 65 (1):50-68.
Tomz, Michael, Jason Wittenberg, and Gary King. 2003. Clarify: Software for Interpreting and
Presenting Statistical Results. Version 2.1. Stanford University, University of Wisconsin,
and Harvard University. January 5. Available at http: //gking.havard.edu/.
U.S. Office of Management and Budget. 2002. Instructions for the Program Assessment Ratings
Tool. Washington, DC, July 12, 2002.
U.S. Office of Management and Budget. 2003. Budget of the United States Government FY
2004: Performance Management and Assessments. Washington, DC: U.S. Government
Printing Office.
U.S. Office of Management and Budget. 2005. Budget of the United States Government,
FY2006. Program Assessment Rating Tool. Washington, DC: Government Printing
Office, FY 2004-6 (http://www. whitehouse.gov/omb/budget/fy2006/part.html).
U.S. Congress. Senate. Committee on Governmental Affairs, 106th Cong., 2d Sess. 2000. Policy
and Supporting Positions. Washington, DC: Government Printing Office;
U.S. Congress. House. Committee on Government Reform, 108th Cong., 2d Sess. 2004. Policy
and Supporting Positions. Washington, DC: Government Printing Office.
Van Riper, Paul P. 1958. History of the United States Civil Service. Evanston, IL: Row, Peterson
and Company.
Wood, B. Dan, and Richard W. Waterman. 1994. Bureaucratic Dynamics: The Role of
Bureaucracy in a Democracy. Boulder, CO: Westview Press.
33
Table 1. Background Characteristic by Manager Type Variable Career Manager Appointed SES Manager Senate confirmed (PAS) Manager background
Education (0-3) 1.89 1.88 1.99 Previous bureau experience (0,1) 0.71 0.37 0.25 Experience in another federal department (0,1) 0.18 0.19 0.36 Public management experience (0,1) 0.91 0.59 0.77 Private sector management experience (0,1) 0.04 0.52 0.46 Tenure as bureau chief (Months) 38.3 16.7 20.0 Worked in Congress (0,1) 0.05 0.15 0.19 Worked in the White House (0,1) 0.00 0.11 0.08
Management Environment Programs graded (1-13) 1.52 3.44 2.73 Average budget of program graded (millions) $411 $1,267 $2,206 Bureau employment (10 - 222,715) 8,193 3,994 17,878 % managers appointed in bureau (0 – 200) 0.4% 10% 10% Number of Managers 1,072 341 1,803
PART Score Program Purpose and Design 88.25 84.24 86.15 Strategic Planning 71.37 66.28 70.15 Program Management 84.01 81.75 77.94 Program Results 56.07 39.14 47.42 Average Total PART grade (0-100) 69.58 58.66 63.50
Note: N=242. Education levels (0-3) are high school, bachelors, masters, and doctorate. Employment data is available on only one-half of all bureaus. The number of cases for bureau employment are N=25, 18, 102, respectively. The number of cases for % managers appointed is N=22, 17, 101, respectively.

Table 2. Federal Program PART Score by Manager Type (Appointed v. Career)
Appointment Authority Appointee (0,1) -5.64**
(2.09) -5.35** (2.12)
--
Senate confirmed appointee (PAS) -- -- -5.84** (2.22)
SES appointee (NA) -- -- -2.84 (2.71)
Program Characteristics Ln(Program Budget) 0.58
(0.51) 0.52 (0.53)
0.54 (0.53)
Block/Formula Grant (0,1) -15.28** (3.42)
-16.71** (3.69)
-16.69** (3.66)
Capital Assets and Service Acquisition (0,1) -11.15** (3.26)
-11.92** (3.89)
-11.91** (3.82)
Competitive Grant (0,1) -15.78** (3.10)
-17.19** (3.22)
-17.61** (3.12)
Credit (0,1) -7.06 (5.34)
-8.50 (5.83)
-8.99 (5.63)
Direct Federal (0,1) -6.69** (3.05)
-10.31** (3.22)
-10.25** (3.21)
Mixed (0,1) -12.57** (4.87)
-16.42** (5.10)
-16.76** (5.04)
Regulatory (0,1) -4.90 (3.59)
-6.45* (3.77)
-6.57* (3.81)
Bureau Characteristics Fixed Term (0,1) 11.17**
(3.70) 11.77** (3.58)
12.16** (3.64)
Commission (0,1) 2.74 (4.44)
1.35 (5.01)
1.31 (5.01)
# Programs Evaluated -0.57* (0.32)
-0.50 (0.33)
-0.56* (0.28)
Political Characteristics Created Under Divided Government (0,1) -- -4.17**
(2.10) -4.20** (2.05)
Created Under Democratic President (0,1) -- -3.51* (2.10)
-3.60* (2.09)
Constant 74.10** (3.89)
79.23** (4.82)
79.40** (4.66)
N (Observations, Managers) 558, 229 467, 210 467, 210 F (14, 209; 15, 209) 6.28** 5.50** 6.04** Note: **significant at the p<0.05 level; *significant at the p<0.10 level in two-tailed test. Robust standard errors adjusted for clustering on managers reported.
34

Table 3. Federal Program PART Score by Background Bureau Chief Characteristics
Bachelors (0,1) 6.51* (3.89)
10.67** (3.94)
Masters (0,1) 0.49 (3.70)
3.80 (3.94)
PhD (0,1) 0.13 (4.64)
1.27 (4.75)
Worked in Another Department (0,1) 2.03 (2.17)
1.81 (2.28)
Private Management Experience (0,1) -0.95 (1.99)
-0.49 (2.10)
Worked in White House (0,1) -0.70 (3.38)
2.27 (4.13)
Worked in Congress (0,1) 0.54 (2.37)
0.35 (2.02)
Bureau Experience (0,1) 4.43** (2.18)
5.60** (2.23)
Months Serving as Bureau Chief (0 to 182) 0.24** (0.11)
0.20* (0.11)
Months Serving as Bureau Chief^2 -0.002* (0.001)
-0.002* (0.001)
Previous Public Management Experience (0,1) 0.36 (2.49)
-0.85 (2.56)
Bureau Characteristics Fixed Term (0,1) 12.33**
(3.87) 13.06** (3.91)
Commission (0,1) 3.63 (4.26)
1.03 (4.82)
# Programs Evaluated -0.57** (0.28)
-0.53* (0.30)
Political and Program Characteristics Created Under Divided Government (0,1) -- -4.33**
(2.00) Created Under Democratic President (0,1) -- -3.69*
(2.04) Ln (Program Budget)
0.65 (0.50)
0.66 (0.51)
Constant 63.28** (5.23)
67.54** (5.75)
N (Observations, Managers) 549, 219 460, 202 F (22, 218; 24,201; 26, 123) 5.70** 6.33** Note: **significant at the 0.05 level, *significant at the 0.10 level in two tailed test. Robust standard errors adjusted for clustering on managers reported. Program type indicator estimates omitted.
35
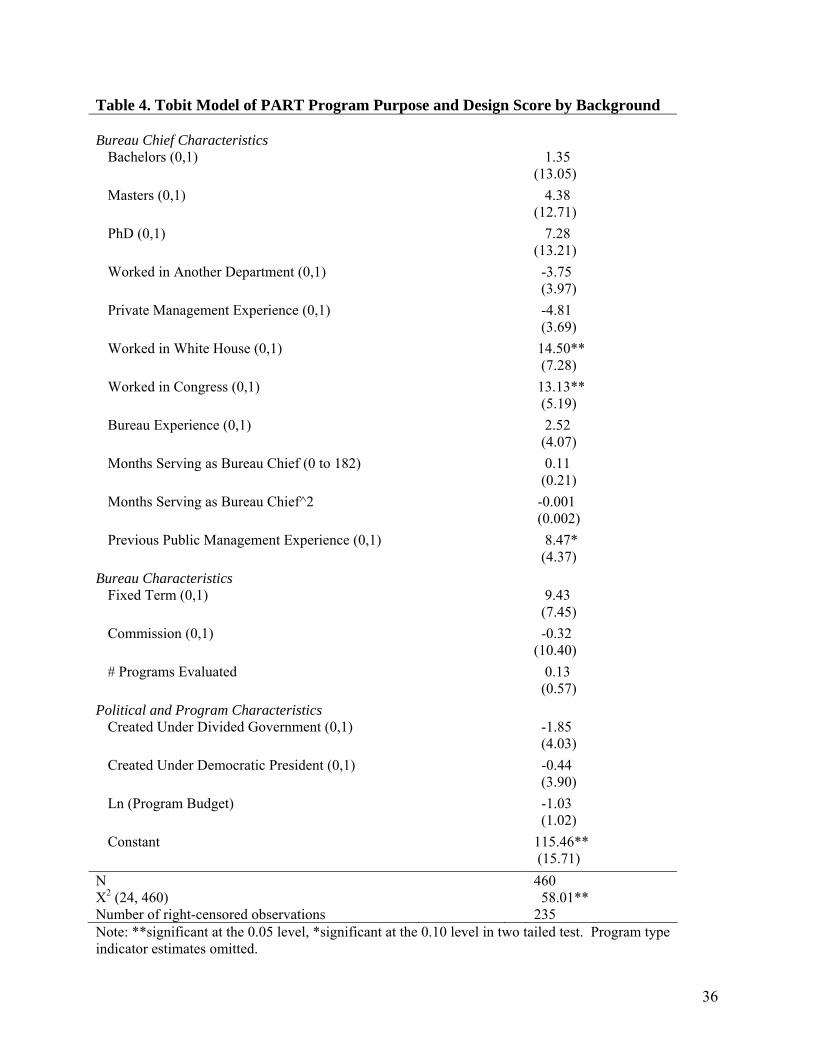
Table 4. Tobit Model of PART Program Purpose and Design Score by Background Bureau Chief Characteristics
Bachelors (0,1) 1.35 (13.05)
Masters (0,1) 4.38 (12.71)
PhD (0,1) 7.28 (13.21)
Worked in Another Department (0,1) -3.75 (3.97)
Private Management Experience (0,1) -4.81 (3.69)
Worked in White House (0,1) 14.50** (7.28)
Worked in Congress (0,1) 13.13** (5.19)
Bureau Experience (0,1) 2.52 (4.07)
Months Serving as Bureau Chief (0 to 182) 0.11 (0.21)
Months Serving as Bureau Chief^2 -0.001 (0.002)
Previous Public Management Experience (0,1) 8.47* (4.37)
Bureau Characteristics Fixed Term (0,1) 9.43
(7.45) Commission (0,1) -0.32
(10.40) # Programs Evaluated 0.13
(0.57) Political and Program Characteristics
Created Under Divided Government (0,1) -1.85 (4.03)
Created Under Democratic President (0,1) -0.44 (3.90)
Ln (Program Budget) -1.03 (1.02)
Constant 115.46** (15.71)
N 460 Χ2 (24, 460) 58.01** Number of right-censored observations 235 Note: **significant at the 0.05 level, *significant at the 0.10 level in two tailed test. Program type indicator estimates omitted.
36

Figure 1. Total PART Score by Manager Type
37
1 Hsu, Spencer S. 2005. “Leaders Lacking Disaster Experience,” Washington Post, September 9,
2005, p. A1; James, Frank, and Andrew Martin. 2005. “Ex-officials say Weakened FEMA
botched response,” Chicago Tribune, September 3, 2005 (on-line edition).
2 For calls to reduce the number of appointees see Gruber, Amelia, “Three Former Officials Call
for Fewer Political Appointees,” Government Executive Magazine, March 6, 2003 (on-line
edition); Feingold, Kenneth, “Deficit Reduction - Reducing the Number of Political Appointees,”
(http://feingold.senate.gov/issues_appointees.html); National Commission on the Public Service
(2003), Suleiman (2003).
3 Efforts at political control can also make it less likely that bureaucrats will do what politicians
want if bureaucracies cannot do what politicians ask and will be punished in any case (Huber and
McCarty 2004).
4 The instrument is adjusted for the type of program (regulatory, block grant, research and
development, etc.). See U.S. Office of Management and Budget (2002, 2003). Some examples of
PART questions can be found at www.whitehouse.gov/omb/expectmore/partquestions.html.
5 U.S. Office of Management and Budget (2002, 2003).
6 Disagreements between OMB and agencies are resolved by appeals up the OMB hierarchy.
Appeals first go to the OMB branch chief then to the division director and program associate
director, if necessary.
7 The administration claims a loosely stratified sampling scheme was used to select the first
cohort. When asked to describe the initial sampling scheme, Marcus Peacock, Program Associate
Director, Office of Management and Budget, called the approach a stratified sampling scheme.
He said OMB tried to get a diverse group of programs, large and small, programs with a history
of good management and bad management, and programs with different missions and functions.
38
Comments made at Program Performance and the FY 2004 Budget Process, June 13, 2003,
2247 Rayburn House Office Building, Washington, DC.
8 The programs are the LWCF Land Acquisition program (13.82), Impact Aid Payments for
Federal Property (22), and the B.J. Stupak Olympic Scholarship Program (23).
9 The programs are Protective Intelligence (95.18), Polar Tools, Facilities, and Logistics (95.29),
and the Global and Cultural Exchanges program (96.17)
10 Evidence from interviews with OMB and agency officials involved in the PART process
indicates that both the bureau chiefs being evaluated and budget examiners doing the evaluating
believe that the scores measure variance in true management quality (Gilmour 2006).
11 Federal Yellow Book. New York, NY: Leadership Directories, Inc., various issues. The Plum
Book is formally titled Policy and Supporting Positions and is published every presidential
election year alternately by the House or the Senate. U.S. Congress (2000, 2004).
12 Of the 242 bureau chiefs 2 had atypical appointment authorities (i.e., Schedule C, presidential
appointee without Senate confirmation (PA)). In this analysis I exclude these 2 managers. When
models were estimated including these managers, the results confirm what is reported here.
13 By law political appointees cannot exceed 10% of the entire SES and cannot exceed 25% of
the total SES allocations in any given agency. In bureaus with smaller numbers of SES
managers, however, the percentage of appointed SES managers sometimes exceeds 25%.
14 Source: U.S. Office of Management and Budget (2005).
15 Source: U.S. Congress (2000, 2004). I have also estimated models using other measures of
structural sources of presidential influence. These models are included in a web appendix and
confirm what is reported here.
39

16 In addition, bureaus vary by employment, the thickness of the management hierarchy (number
of managers), and the degree of politicization (number of appointees/number of managers). I
have also estimated models controlling for these factors and the results confirm what is reported
here.
17 I have also estimated a model that includes an indicator for whether or not a program was
created under unified Democratic control (0,1) and models that include department fixed effects.
These results generally confirm what is reported here.
18 It is possible that appointees want programs to fail. This would drive PART scores down but
not because of a lack of competence. To account for this possibility I control for program content
using indicators for program type (regulatory, block grant, etc.), department, and partisanship of
the Congress and president at the time the program was created (Tables 2-3). I have also
estimated models excluding programs created under unified Democratic control to see whether
the coefficient on appointee management gets smaller. Since PART scores are produced by a
Republican administration, political appointees should be more likely to want to run down or
eliminate programs created by Democrats. This implies that the coefficient on appointee
management will be larger and negative when programs created under unified Democratic
control are included. I find just the opposite. When I exclude these programs, the coefficient on
appointee management is much larger and negative.
19 I include a full discussion of endogeneity, the possibility that appointees want programs to fail,
and different specifications in a web appendix.
20 Specifically, appointees get systematically lower management grades (p<0.05) and the other
coefficients look very similar to those reported in Table 2.
40

21 I have also estimated the models from Tables 2-3 after imputing missing values using Amelia
(King et al. 2001; Honaker et al. 2001) and Clarify (King et al. 2000; Tomz et al. 2003). The
results are slightly less dramatic but substantively similar. A full discussion of missing data is
included in a web appendix.
22 All models were estimated using Stata 9.0. I used standard regression diagnostics to test for
any of the usual problems with OLS and find none that are not mentioned in the text. I have also
replicated this analysis with program categorical grades. I do not include estimates of categorical
grades in main text since they provide less information than the numerical scores and they are
more prone to political manipulation. While appointees get lower average program grades in
simple comparisons, I cannot reject the null hypothesis in full models that federal programs run
by appointees get the same categorical grades as those run by careerists. These estimates are
included in a web appendix.
23 In models where managers are the unit of analysis, however, the coefficients on both types of
appointees are large and significant.
24 The estimates reported in Table 3 are somewhat less robust than those reported in Table 2.
Specifically, when department indicators are included in these models, the coefficients on bureau
experience and tenure are smaller and estimated less precisely. They are included in a web
appendix.
25 One difficulty here is that tenure could be endogenous. If a program is very difficult to
manage, this could influence both how long a manager serves but also its PART score. If this is
the case, it can be difficult to parse out the distinct influence of tenure on PART score. I
estimated a model where tenure was instrumented and could not reject the null that the original
41

OLS estimates were consistent. A description of the models and the results are included in a web
appendix.
26 Table 4 includes estimates from a Tobit model since the dependent variable, raw program
purpose and design scores, is bounded at 100 and a number of programs received grades of 100
on the PART evaluation.
42