forty-third annual report and statement of …
TRANSCRIPT

FORTY-THIRD ANNUAL REPORTAND
STATEMENT OF ACCOUNTS2010

© Central Bank of Malta, 2011
AddressPjazza KastiljaValletta VLT 1060Malta
Telephone(+356) 2550 0000
Fax(+356) 2550 2500
Website http://www.centralbankmalta.org
E-mail [email protected]
Printed byGutenberg Press LtdGudja RoadTarxien GXQ 2902Malta
All rights reserved. Reproduction is permitted provided that the source is acknowledged.
The cut-off date for information published in this Report is 25 February 2011 except where otherwise indicated. Figures in tables may not add up due to rounding.
ISSN 0577-0653 (print)ISSN 1811-1262 (online)

THE MISSION AND OBJECTIVES OF THE CENTRAL BANK OF MALTA
Our Mission
The Central Bank of Malta is an independent institution which seeks to carry out its statutory responsibili-ties in the public interest. As a member of the Eurosystem, the Bank’s primary objective is to maintain price stability, thereby contributing to sustainable economic development.
Our Objectives
We seek to achieve this mission by:-
Promoting price stability in the euro areaThe Bank promotes price stability in the euro area through participation by the Governor in the Govern-ing Council of the European Central Bank (ECB). For this purpose the Bank conducts economic analysis and research. The Bank is also responsible for the implementation in Malta of the Governing Council’s monetary policy decisions.
Contributing to the stability of the financial systemThe Bank contributes to the stability of the financial system through ongoing macro surveillance of the infrastructure, financial institutions and markets and by monitoring and assessing the implications for financial stability of economic and financial developments, both domestically and in the euro area. As part of its early warning system, the Bank analyses data to identify sources of risk and tests the resilience of the financial sector to withstand eventual shocks. This approach is supported by the development of a sound framework for the management of crisis situations and of contingency procedures. Ultimately, in order to safeguard financial stability, the Bank acts as lender of last resort.
Promoting, regulating and overseeing sound and efficient payment and securities settlement systems The Bank promotes, oversees and regulates the operation of, and the participation in, domestic payment systems as well as any form of cash or security transactions, whether domestic or cross-border. This role relates both to retail and wholesale payment systems, including the instruments used, and involves the establishment of policy and the monitoring of payment and securities settlement developments. In exercising its oversight role, the Bank promotes a competitive, safe and efficient payment services envi-ronment.
Supporting the development of financial markets The Bank promotes and supports the further development of the domestic financial market with the aim of facilitating its smooth and effective integration into the Pan-European market.
Providing and promoting efficient currency servicesThe Bank issues euro banknotes and coins in accordance with the Treaty establishing the European Community and in line with the Statute of the European System of Central Banks (ESCB) and of the ECB. The Bank is responsible for providing notes and coins to meet demand from the public. The Bank also ensures the authenticity and quality of currency in circulation through the withdrawal of counterfeit and damaged notes and coins.

Optimising the returns on financial assets through prudent investment practicesThe Bank holds and manages a portfolio of foreign and domestic financial assets. It seeks to maximise the return on financial assets subject to prudent investment practices. The Bank is also responsible for managing its share of the pooled portion of the ECB’s own foreign reserves.
Collecting, compiling, disseminating and publishing statisticsThe Bank compiles economic and financial statistics in accordance with international standards. These are provided to the ESCB and other international and domestic users. Statistics are made available through the Bank’s regular publications, its website, the publications of the ECB and other international organisations.
Advising the Government generally on financial and economic matters The Bank acts as an advisor to the Government on financial and economic matters. In offering indepen-dent advice, the Bank contributes to sound policy-making. The Bank is able to do this on the strength of its expertise, its reputation and its independent status. The Bank also acts as banker and agent to the Government.
In support of the above objectives, the Bank commits itself:
(a) to actively participate in the Eurosystem, the ESCB and other relevant European Union bodies, including their sub-structures, and in meetings of international organisations; and
(b) to maintain effective support and control functions, which include:• Motivating and developing skilled staff. To this end the Bank adopts appropriate recruitment
and reward strategies and provides its staff with opportunities for training and development. • Procuring the necessary resource inputs and maintaining the organisation’s physical infra-
structure in a cost-effective manner to ensure a congenial and secure working environment.• Maintaining a sound financial control system capable of delivering accurate and timely statu-
tory and management information and designed to ensure that the Bank’s needs are effec-tively met within established budgets.
• Enhancing the flow of information both within and outside the Bank. This is made possible through the sustained development of information and document-handling systems, and of the appropriate information technology infrastructure.
• Maintaining a risk management framework which provides a common methodology for the identification, assessment, reporting, monitoring and treatment of risks. This is complemented by a sound business continuity management programme.
• Operating an independent and objective assurance and consultancy function designed to add value and improve the Bank’s operations.
The Bank also seeks to be transparent and publicly accountable. This is achieved through the publication of its financial statements, effective communications and announcements through its website, other publica-tions and regular reporting to Parliament on its policies and operations.
As a member of the Eurosystem, the Bank subscribes to the Eurosystem’s Mission, Strategic Intents and Organisational Principles.
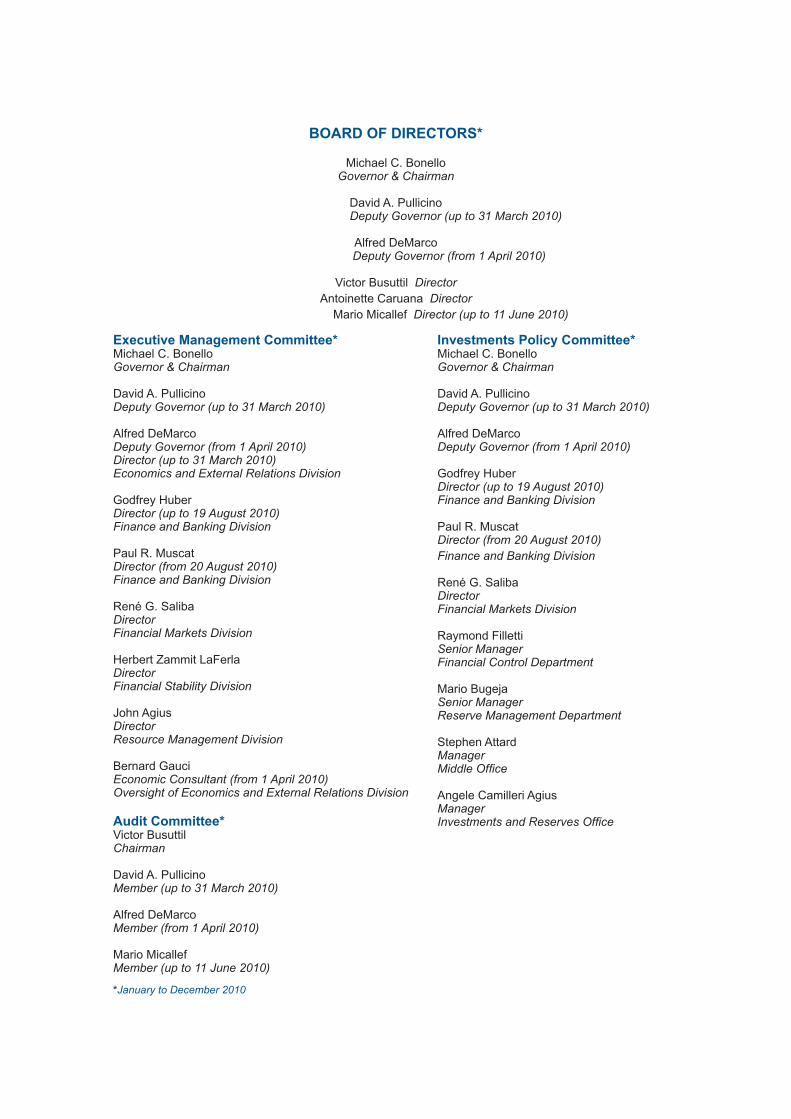
BOARD OF DIRECTORS*
Michael C. BonelloGovernor & Chairman
David A. Pullicino Deputy Governor (up to 31 March 2010)
Alfred DeMarco Deputy Governor (from 1 April 2010)
Victor Busuttil DirectorAntoinette Caruana Director
Mario Micallef Director (up to 11 June 2010)
Executive Management Committee*Michael C. BonelloGovernor & Chairman
David A. PullicinoDeputy Governor (up to 31 March 2010)
Alfred DeMarcoDeputy Governor (from 1 April 2010)Director (up to 31 March 2010)Economics and External Relations Division
Godfrey HuberDirector (up to 19 August 2010)Finance and Banking Division
Paul R. MuscatDirector (from 20 August 2010)Finance and Banking Division
René G. SalibaDirectorFinancial Markets Division
Herbert Zammit LaFerlaDirectorFinancial Stability Division
John AgiusDirectorResource Management Division
Bernard GauciEconomic Consultant (from 1 April 2010)Oversight of Economics and External Relations Division
Investments Policy Committee*Michael C. BonelloGovernor & Chairman
David A. PullicinoDeputy Governor (up to 31 March 2010)
Alfred DeMarcoDeputy Governor (from 1 April 2010)
Godfrey HuberDirector (up to 19 August 2010)Finance and Banking Division
Paul R. MuscatDirector (from 20 August 2010)Finance and Banking Division
René G. SalibaDirectorFinancial Markets Division
Raymond FillettiSenior ManagerFinancial Control Department
Mario BugejaSenior ManagerReserve Management Department
Stephen AttardManagerMiddle Office
Angele Camilleri AgiusManagerInvestments and Reserves OfficeAudit Committee*
Victor BusuttilChairman
David A. PullicinoMember (up to 31 March 2010)
Alfred DeMarcoMember (from 1 April 2010)
Mario MicallefMember (up to 11 June 2010)
*January to December 2010

THE BOARD OF DIRECTORS*
(left to right) Josef Bonnici (Director), Bernadette Muscat (Secretary), Michael C. Bonello (Governor & Chairman), Alfred DeMarco (Deputy Governor), Victor Busuttil (Director), Antoinette Caruana (Director).
*as at 30 March 2011
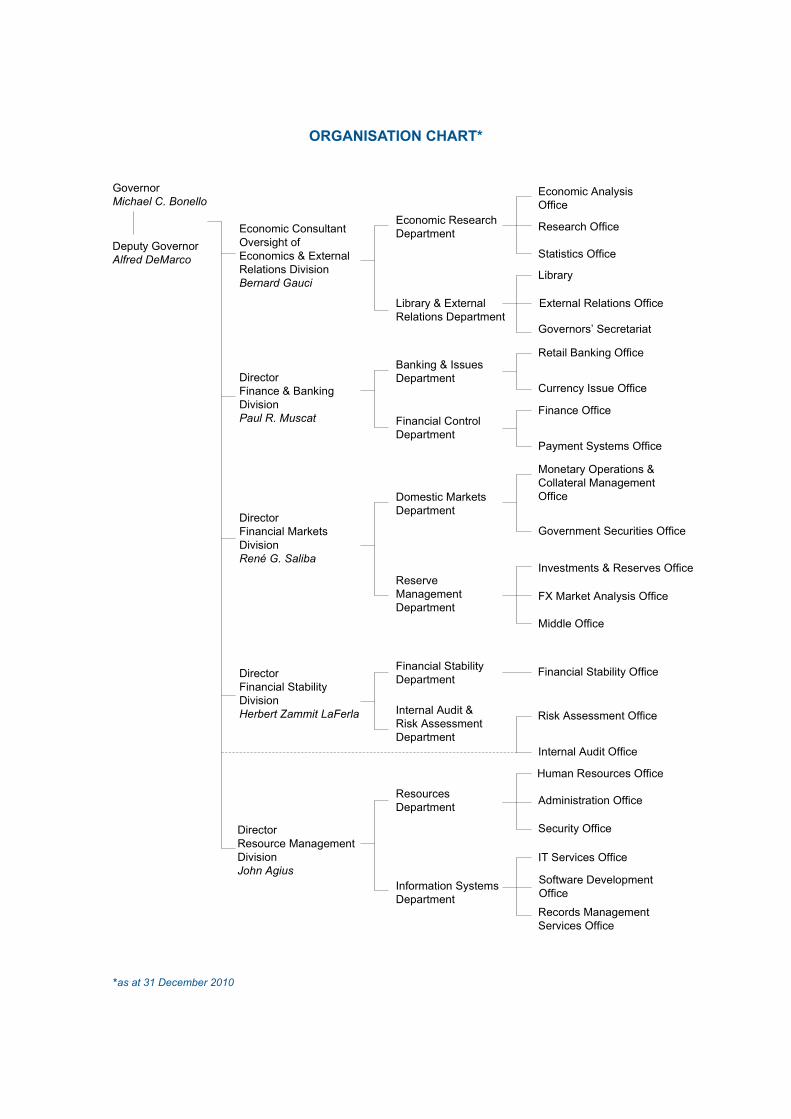
ORGANISATION CHART*
*as at 31 December 2010

10
CENTRAL BANK OF MALTA Annual Report 2010
CONTENTS
13
I 17
1 18 The international economy Commodities
The euro area 2 28 Residents' deposits Credit
Net claims on non-residents of the euro area The money market
The capital market
3 Output, Employment and Prices 36Gross domestic productIndustrial productionTourismConstructionThe labour marketConsumer prices Costs and competitivenessEconomic projections for 2011 and 2012
4 61The current accountThe capital and financial accountInternational investment position
5 67 General government official projections
General government balance outcomeConsolidated Fund Central government debt
Government Finance
Balance of Payments
GOVERNOR'S STATEMENT
FINANCIAL AND ECONOMIC DEVELOPMENTS
International Economic Developments and the Euro Area Economy
Monetary and Financial Developments
Box 1: Business and Consumer Surveys

11
CENTRAL BANK OF MALTA Annual Report 2010
II 71
1 72 Monetary policy operations
Reserve management Market-making operations
2 77 3 79 Currency operations
Payment and securities settlement systems Banker to the public sector Banker to the banking system
Other financial services 4 83 Administration
Legal issuesEconomic analysis and researchStatisticsInternal audit
Risk assessment Human resources Information technology Information and public relations
LibraryVisit of the PresidentEthical and social commitmentsCultural activities
5 93 European System of Central Banks
European Systemic Risk Board Other EU institutions
International Monetary FundWorld Bank GroupEuropean Bank for Reconstruction and DevelopmentOther matters
ECONOMIC & FINANCIAL POLICY CALENDAR 2010 97
III A-1
FINANCIAL STATEMENTS FOR THE YEAR ENDED 31 DECEMBER 2010
BANK POLICIES, OPERATIONS AND ACTIVITIES
The Conduct of Monetary Policy
Financial Stability
Currency, Payment Systems and Banking Services
Internal Management
International Relations
Box 2: The Bank's New Organisation Structure
Statement of Directors' responsibilities in respect of the financial statements
Profit and loss accountBalance sheet
Notes to the financial statements
Independent auditors' report
Directors' report

ABBREVIATIONS
BIS Bank for International SettlementsEBRD European Bank for Reconstruction and DevelopmentECB European Central BankEONIA Euro OverNight Index AverageERM II exchange rate mechanism IIESCB European System of Central BanksETC Employment and Training CorporationEU European UnionEURIBOR Euro Interbank Offered RateGDP gross domestic productHICP Harmonised Index of Consumer PricesIMF International Monetary FundLFS Labour Force SurveyMFEI Ministry of Finance, the Economy and InvestmentMFI Monetary Financial InstitutionMFSA Malta Financial Services AuthorityMGS Malta Government Stock MRO Main Refinancing OperationMSE Malta Stock ExchangeNACE Statistical classification of economic activities in the European CommunityNCB national central bankNPISH Non-Profit Institutions Serving HouseholdsNSO National Statistics OfficeOMFI Other Monetary Financial InstitutionRPI Retail Price IndexTARGET Trans-European Automated Real-time Gross settlement Express Transfer systemULC Unit Labour Costs

13
CENTRAL BANK OF MALTA Annual Report 2010
GOVERNOR’S STATEMENT
In 2010 the world economy started to recover from the recession that came in the aftermath of the financial crisis. As the year drew to a close, however, earlier signs of a dichotomy in the global scenario became more entrenched. In the advanced economies activity moderated and remains subdued, unemployment is stuck at a high level and risks to growth are on the downside, mainly on account of the sovereign debt cri-sis. The emerging economies, in contrast, continued to experience buoy-ant activity levels, with signs of overheating in some cases. Both country groupings meanwhile were faced with a resurgence of commodity price inflation, compounding domestic price pressures in the emerging coun-tries and creating a challenge for monetary policy in the slower-growing advanced countries.
The events of the past year have served to reinforce the view, based on historical experience, that the reper-cussions of a financial crisis are more pervasive and long-lasting, and therefore more damaging, than those of other causes of recession.
In the euro area the recovery has become more broad-based and increasingly self-sustained, but is less vig-orous than during previous upturns. This is partly because many countries are burdened with long-standing structural weaknesses, such as large fiscal imbalances and loss of competitiveness, that were accentuated by the crisis. The growth rate of 1.7% and the 10% unemployment rate registered in 2010 in fact mask sig-nificant cross-country differences.
As it is, economic growth in the euro area is expected to remain moderate, between 1.3% and 2.1% this year and 0.8% - 2.8% next year, in an environment characterized by continuing balance sheet adjustment in the household, corporate and financial sectors. Fiscal austerity measures, moreover, which have been rendered more urgent by the reassessment of sovereign risk by investors, will also weigh on the recovery in several countries. The outlook, therefore, is subject to a very high level of uncertainty.
Inflation presents another policy challenge for the euro area. During 2010 the accommodative monetary policy stance of the ECB, together with its enhanced credit support measures and the programme of sterilised intervention in public and private debt markets designed to ensure the effective functioning of the monetary transmission mechanism, were instrumental in limiting the negative repercussions of the sovereign debt problem. It is not sufficiently well understood, however, that this stance is subject to two important caveats: that the ECB’s primary objective is the maintenance of price stability, and this in the euro area as a whole; and that the non-standard measures it has taken are temporary solutions to extraordinary developments that will be phased out as economic and financial market conditions permit. The purview of ECB monetary policy does not include responsibility for repairing the pervasive harmful consequences of excessive government borrowing.
It is against this background that price developments must be viewed. The strong upward movement in energy prices during 2010 pushed the average inflation rate in the euro area up to 1.6%, and this is expected to rise further to 2.0% – 2.6% during the current year, before easing slightly thereafter. Given the price sig-nals from commodity futures markets and the incipient feed through of higher input prices further along the production chain, however, the risks to the projections are on the upside. Thus, while inflation expectations still appear to be well anchored and there is as yet no concrete evidence of second-round effects, any mate-rial change in these conditions would call for an appropriate policy response.
In these circumstances, it is vital that public finances be put on a sustainable footing without delay. This requires the timely implementation of commitments contained in National Reform and Stability Programmes

14
CENTRAL BANK OF MALTA Annual Report 2010
and the strengthening of national budgetary rules. In addition, the new fiscal and macroeconomic gover-nance framework envisaged for the euro area needs to be endowed with faster and more automatic surveil-lance procedures, a broader range of enforcement tools, including financial sanctions, and more ambitious policy requirements. The effective availability of the full lending potential of the European Financial Stability Facility would also contribute in this regard by helping to restore financial market confidence.
The challenges facing the euro area apply in large measure to Malta. Thus, while the economy experienced a strong cyclical upswing in 2010, with GDP growing by 3.7% after a contraction of 3.4% in 2009, this momentum is likely to slow down. A closer analysis of these developments suggests that while the economy has proved to be quite resilient to external shocks, its openness is a source of vulnerability. Indeed, the recovery in 2010 owed much to a sharp rebound in exports, particularly in the electronic com-ponents and tourism industries, both of which were hard hit by the recession. Given the uncertain prospects for external demand, however, which have since been further clouded by events in neighbouring countries with which Malta has substantial economic relations, it cannot be assumed that current growth rates will be sustained without determined efforts to further diversify the economy and thus increase its resilience.
On the basis of available information, the Bank’s latest macroeconomic projections point to a smaller con-tribution of net exports to growth in 2011 and 2012 in the context of a moderating pace of activity, with the growth rate decelerating to 2.5% this year before picking up slightly to 2.9% in 2012. The risks to these forecasts, moreover, are on the downside. Apart from the economic consequences of the regional political tensions and the natural disaster in Japan, the winding down in the face of overheating pressures of the monetary stimulus that has driven the recovery in a number of emerging economies, and the aggressive fiscal tightening underway in many euro area countries could also have a dampening effect on Malta’s external demand.
In this scenario, even more ambitious efforts are required if the country is to converge to the higher liv-ing standards enjoyed elsewhere in Europe, and thus continue to afford its generous social model. In this respect, there is considerable potential for improvement given that Malta’s GDP per capita in PPS terms has hovered around 78% of the EU average since 2003.
In order to bridge the gap it is necessary to address the structural weaknesses that act as a drag on the economy’s international competitiveness. These include a positive inflation differential with the euro area in every year but one since 2005. Going forward, moreover, the Bank forecasts a rise in the inflation rate from 2.0% in 2010 to 2.5% this year and 2.4% in 2012, in both cases again probably higher than in the euro area.
In a currency union such a persistent divergence in inflation causes domestic producers to gradually price themselves out of the market. This applies particularly for countries like Malta where wages are indexed to past inflation. For while translating relatively faster inflation into higher wages, this mechanism ignores the importance of compensatory productivity improvements. This is reflected in the fact that during the past decade annual increases in productivity have generally fallen short of those in annual wages by a wide mar-gin. As a result, the cumulative growth in unit labour costs in Malta has exceeded that of the euro area. As might have been expected, these trends have contributed to a persistent current account deficit.
It is a law of economics that the adjustment necessary to regain competitiveness inside a currency union must take place in the real economy by ensuring that prices and wages increase less than the average in the union over time. In Malta’s case, this requires the adoption of productivity-enhancing measures, more com-petition in the product and labour markets and a wage setting process in which increases in compensation reflect efficiency gains rather than past inflation. To defend wage indexation on the grounds that it ensures stable industrial relations is to take a short-term view because it increases the probability of less wealth and fewer jobs being created in the future than would have otherwise been the case.
Relatively low as it is, Malta’s per capita income level, moreover, is unaffordable, having been artificially sup-ported by government deficit spending for the past fifteen years. This, too, is a structural weakness. Though

15
CENTRAL BANK OF MALTA Annual Report 2010
smaller than that of most other euro area countries, the fiscal deficit in 2010, at an estimated 3.8% of GDP, was broadly unchanged from the previous year, although smaller shortfalls of 2.8% and 2.2% are targeted for this year and 2012, respectively. The achievement of these reductions could, however, prove difficult if, given the downside risks, economic growth does not match the rates assumed in the official projections.
The importance of fiscal consolidation is highlighted by the pressing need to reduce the debt ratio to below 60% at least at the pace required by the proposed new EU rules on economic governance. This will require additional fiscal measures because, on the Bank’s current projections, the debt ratio is likely to rise from an estimated 68.3% in 2010 to around 69% this year and next.
The need to achieve a balanced budget over the cycle responds to a clear economic logic. For only through the achievement of surpluses during a cyclical upswing can there be room for counter-cyclical deficits in a downturn without further additions to the debt stock. In Malta’s case, moreover, improving the long-term sustainability of public finances is especially urgent because age-related public spending is expected to increase much faster than the EU average in the years ahead. The next step in pension reform, the introduc-tion of a mandatory and privately-funded second pillar, must not, therefore, be delayed.
As for the quality of fiscal consolidation, this should be based on further expenditure restraint and on improving spending efficiency so as to release resources for investment in the physical infrastructure, education and other growth-enhancing activities. The challenge of achieving a higher level of investment while reducing the budget deficit without raising taxes implies that recurrent spending must be cut. And since it is the welfare system that absorbs most of this type of spending, a durable fiscal correction requires a fundamental reappraisal of the role of the state, especially in the provision of tertiary education, health services, pensions and other social benefits. The dispensing of free goods and services to all irrespective of income is a wasteful and unaffordable practice in a country that has been living beyond its means for years on end. The priority of the state should be to provide equal opportunities for all, but a safety net only for those who need it most.
Addressing structural weaknesses and imbalances is but one, albeit important aspect of the challenge. Par-ticularly at this time of uncertain global growth prospects, the generation of wealth on a sustainable basis in Malta’s small open economy, which is the key to closing the income gap with our European peers, also depends on the creation of an operating environment conducive to the production of goods and services for which there is a market abroad and at prices that buyers are willing to pay. Apart from the continued pursuit of fiscal consolidation and market reforms, therefore, policies at the sectoral level should be designed to converge on this unique strategic objective, that is to remain internationally competitive.
Bank policies and operations In 2010 the Central Bank of Malta contributed to the formulation and implementation of Eurosystem mon-etary policy through its participation in the decisions of the Governing Council and the provision of liquidity. During the year the ECB kept official interest rates unchanged at historic lows as it did not perceive a threat to its price stability objective and inflation expectations remained well anchored. It also continued to use non-standard policy measures to provide ample liquidity to the banking system and began to carry out sterilised intervention in securities markets, as explained earlier. In this context, the Bank conducted open market operations with eligible domestic credit institutions injecting almost EUR20 billion in 2010, an increase over the previous year that partly reflected the higher number of banks taking part. In this way banks in Malta were able to fully satisfy their liquidity needs.
Financial stability issues continued to be at the forefront of attention worldwide in the aftermath of the financial crisis. In Europe, a major step forward was taken in 2010 with the establishment of a new EU-wide supervisory framework consisting of a micro- and a macro-prudential pillar. In this regard, the Bank began to participate in the work of the second pillar, the European Systemic Risk Board and its sub-structures. It also continued to take an active part in the ESCB’s work related to financial stability.

16
CENTRAL BANK OF MALTA Annual Report 2010
At the same time, the Bank maintained a close watch over the domestic financial system to assess poten-tial risks to financial stability. As part of an EU-wide exercise, it carried out a stress test on a Maltese credit institution in liaison with the MFSA. The bank concerned passed the test, as did the foreign parent banks of other credit institutions in Malta that were included in the exercise. In general, the domestic banking system continued to maintain high levels of capital and liquidity, implying a robust defence against possible shocks. In view of the concentration risk occasioned by their high exposure to the property-related sectors and the perceptible increase in non-performing corporate loans during 2010, however, any setback in the economic recovery could accentuate the implied credit risk carried by the banks. It, therefore, remains imperative that banks further strengthen their capital buffers, particularly at a time of relatively favourable funding conditions and profitability levels. An early start would also enable them to satisfy the new Basel III capital requirements by the target date.
Efficient payment and settlement systems are a central part of the basic infrastructure underpinning a mod-ern financial sector. In the euro area, the smooth functioning of such systems is vital for the development of integrated area-wide financial markets and facilitates trade in goods and services. In this respect, the Bank continued to regulate and oversee domestic payment and securities settlement systems during the year. On an operational level, the value of payments processed in Malta through TARGET2, which is an automated, real-time settlement system for large-value payments in euro, fell to EUR76.4 billion as a result of a reduc-tion in the volume of overnight deposits placed by credit institutions with the Bank.
In 2010 the Bank also continued to issue euro banknotes and coins in Malta and to ensure their integrity. At the same time the collection and destruction of Maltese lira banknotes progressed further, while the legacy currency coins ceased to be exchangeable in February. The Bank’s activity in the numismatic field during the year included the issue of a coin under the Europa programme in gold and silver versions.
In line with its international obligations and in order to meet user needs, the Bank continued to publish a wide range of statistics as well as regular analyses of economic and financial developments in Malta and abroad. In connection with its contribution to the ESCB’s macroeconomic projection exercises, the Bank documented and published its econometric model and carried out a number of research projects, notably on wage and price setting in Malta.
The past year was also characterised by major internal organisational changes. During 2009 the Bank had launched a review designed to better align its structures and working methods with the requirements of Eurosystem membership. In 2010 the changes that resulted from this consultative process began to be implemented, and the new organisational structure came fully into effect in January 2011. The Bank now has three distinct levels of management: governance and strategic direction; policy development; and operation-al management. At the same time, five Directorates have been created to better reflect the Bank’s strategic roles and to more effectively align resources and expertise with core tasks. As a result of these changes the Bank should be better equipped to fulfil its changing responsibilities.
The Bank’s operating profit for the year amounted to EUR57.6 million, as against EUR58.6 million in 2009.
On behalf of the Board of Directors, I would like to thank the Bank’s staff for their dedication and hard work, which contributed to the Bank’s achievements during the year.
Michael C. Bonello

FINANCIAL AND
ECONOMIC DEVELOPMENTS
PART I
18
CENTRAL BANK OF MALTA Annual Report 2010
1. INTERNATIONAL ECONOMIC DEVELOPMENTS AND THE EURO AREA ECONOMY
During 2010 global economic activity started to recover as the major industrial countries experienced posi-tive output growth following the recession and growth in the emerging economies accelerated. Inflationary pressures worldwide generally moderated during the first two quarters of the year, but then started to build up, propelled by higher commodity prices.
Following the contraction of the previous year, growth resumed in the euro area economy in 2010, mainly driven by higher domestic demand. In turn, labour market conditions stabilised, as attested by both employ-ment and unemployment figures, after the marked deterioration observed in 2009. Meanwhile, euro area HICP inflation picked up in 2010, mainly owing to higher energy prices, though inflation accelerated across all other HICP components except services.
The ECB’s Governing Council left its key interest rates unchanged throughout 2010, as price developments were expected to remain subdued over the policy relevant horizon and inflation expectations appeared to be contained. During the first four months of the year, the ECB continued the gradual phasing out of non-standard monetary policy measures. In May, however, in response to the intensification of financial market tensions, several such measures were reintroduced and a new programme was launched to permit interven-tion in the debt securities markets.
The international economy
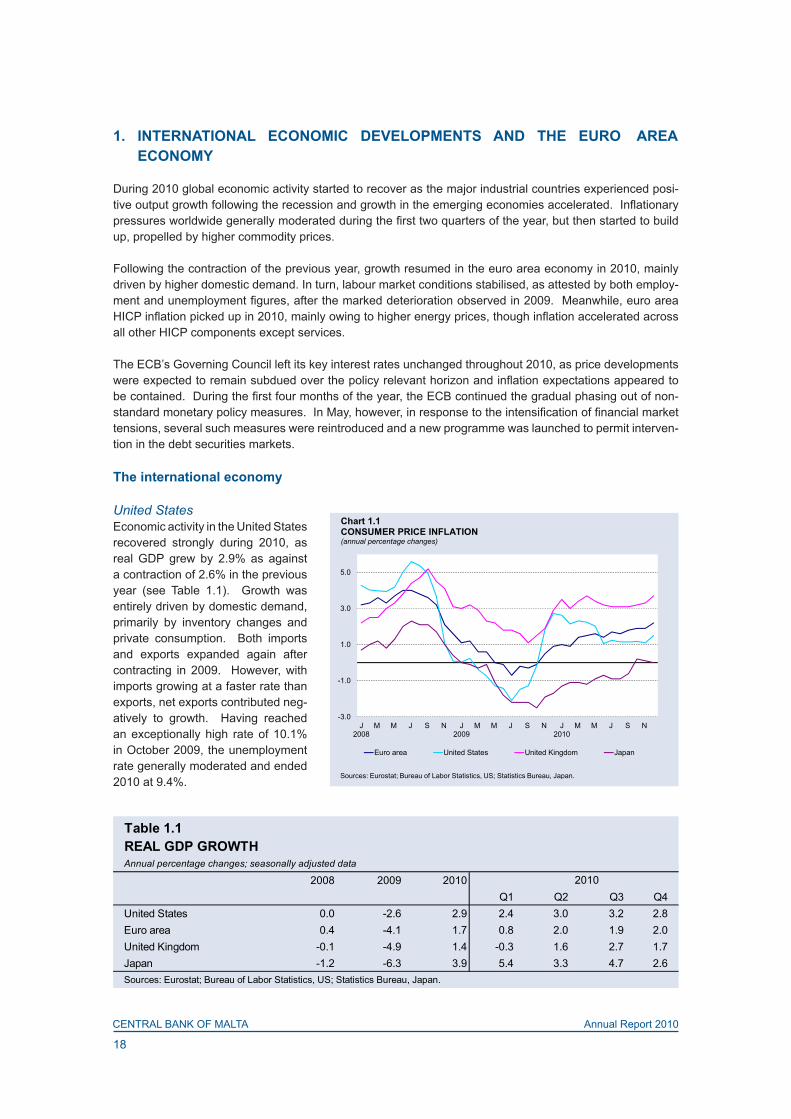
United StatesEconomic activity in the United States recovered strongly during 2010, as real GDP grew by 2.9% as against a contraction of 2.6% in the previous year (see Table 1.1). Growth was entirely driven by domestic demand, primarily by inventory changes and private consumption. Both imports and exports expanded again after contracting in 2009. However, with imports growing at a faster rate than exports, net exports contributed neg-atively to growth. Having reached an exceptionally high rate of 10.1% in October 2009, the unemployment rate generally moderated and ended 2010 at 9.4%.
-3.0
-1.0
1.0
3.0
5.0
J2008
M M J S N J2009
M M J S N J2010
M M J S N
Euro area United States United Kingdom Japan
Chart 1.1CONSUMER PRICE INFLATION (annual percentage changes)
Sources: Eurostat; Bureau of Labor Statistics, US; Statistics Bureau, Japan.
Table 1.1REAL GDP GROWTHAnnual percentage changes; seasonally adjusted data
2008 2009 2010Q1 Q2 Q3 Q4
United States 0.0 -2.6 2.9 2.4 3.0 3.2 2.8Euro area 0.4 -4.1 1.7 0.8 2.0 1.9 2.0United Kingdom -0.1 -4.9 1.4 -0.3 1.6 2.7 1.7Japan -1.2 -6.3 3.9 5.4 3.3 4.7 2.6Sources: Eurostat; Bureau of Labor Statistics, US; Statistics Bureau, Japan.
2010
19
CENTRAL BANK OF MALTA Annual Report 2010
The rise in consumer price inflation that began midway in 2009 was part-ly reversed during 2010 (see Chart 1.1). The annual inflation rate gen-erally fell during the first half of the year, declining by 1.6 percentage points to 1.1% in June. The slow-down was initially driven by lower price pressures on items such as housing in the context of substantial economic slack, and subsequently reflected lower consumer energy prices. Inflation remained relatively stable during the third and going into the fourth quarter, before rising to 1.5% in December, for a net drop of 1.2 percentage points during 2010.
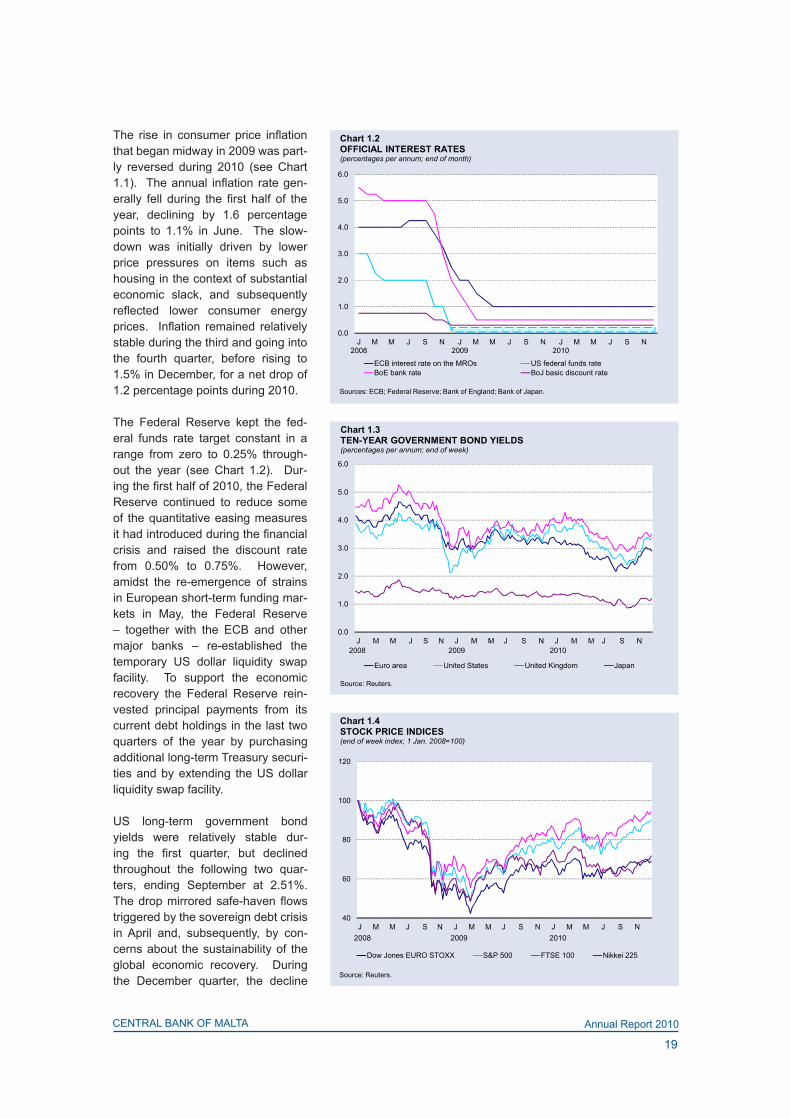
The Federal Reserve kept the fed-eral funds rate target constant in a range from zero to 0.25% through-out the year (see Chart 1.2). Dur-ing the first half of 2010, the Federal Reserve continued to reduce some of the quantitative easing measures it had introduced during the financial crisis and raised the discount rate from 0.50% to 0.75%. However, amidst the re-emergence of strains in European short-term funding mar-kets in May, the Federal Reserve – together with the ECB and other major banks – re-established the temporary US dollar liquidity swap facility. To support the economic recovery the Federal Reserve rein-vested principal payments from its current debt holdings in the last two quarters of the year by purchasing additional long-term Treasury securi-ties and by extending the US dollar liquidity swap facility.
US long-term government bond yields were relatively stable dur-ing the first quarter, but declined throughout the following two quar-ters, ending September at 2.51%. The drop mirrored safe-haven flows triggered by the sovereign debt crisis in April and, subsequently, by con-cerns about the sustainability of the global economic recovery. During the December quarter, the decline
0.0
1.0
2.0
3.0
4.0
5.0
6.0
J2008
M M J S N J2009
M M J S N J2010
M M J S N
ECB interest rate on the MROs US federal funds rateBoE bank rate BoJ basic discount rate
Chart 1.2OFFICIAL INTEREST RATES (percentages per annum; end of month)
Sources: ECB; Federal Reserve; Bank of England; Bank of Japan.
0.0
1.0
2.0
3.0
4.0
5.0
6.0
Euro area United States United Kingdom Japan
Chart 1.3TEN-YEAR GOVERNMENT BOND YIELDS (percentages per annum; end of week)
Source: Reuters.
2008 2009 2010
40
60
80
100
120
Dow Jones EURO STOXX S&P 500 FTSE 100 Nikkei 225
Chart 1.4STOCK PRICE INDICES(end of week index; 1 Jan. 2008=100)
2008 2009 2010
Source: Reuters.
20
CENTRAL BANK OF MALTA Annual Report 2010
was partly reversed as bond yields were influenced by positive macroeconomic data and by the extension of US fiscal stimulus measures and the consequent increase in the borrowing requirement. The ten-year yield ended the year at 3.30%, for a 54 basis point drop over 2010 as a whole (see Chart 1.3).
Following a sharp rebound of around 23% in 2009, Standard & Poor’s 500 equity price index gained a further 13% during 2010 (see Chart 1.4). Equity prices generally rose during the first quarter, in line with an improved global macroeconomic outlook. However, these gains were lost in the following quarter amid renewed financial market tensions. In the second half of the year, equity prices generally rose, partly driven by positive macroeconomic news and favourable data on company earnings.
United KingdomIn the United Kingdom, real GDP expanded by 1.4% during 2010 following a decline of 4.9% in the previous year. Economic activity was mainly driven by private consumption, followed by government consumption and investment. Both exports and imports expanded, after having contracted in 2009. However, as imports grew faster, net exports contributed negatively to growth. After reaching 7.8% in June 2009, the unemploy-ment rate remained stable at the same elevated level until the end of the following year.
HICP inflation remained above 2% throughout 2010, reflecting the restoration of the standard VAT rate to 17.5% in January, the depreciation of the pound sterling and higher energy costs. After having ended 2009 at 2.9%, the annual rate of inflation generally rose during the first four months of the year, going up to 3.7% in April, before declining to 3.1% during the third quarter. However, price pressures started to mount again in the last quarter driven by higher commodity prices, with the inflation rate reaching 3.7% in December.
Throughout the year under review, the Bank of England maintained the official bank rate at 0.50%, unchanged since March 2009. It also continued with its asset purchase programme, with the stock of asset purchases financed by the programme remaining constant during the year. Additionally, together with other central banks, the UK central bank reinstated the US dollar liquidity swap facilities with the Federal Reserve.
UK long-term government bond yields generally fell during the first three quarters of 2010, as fiscal sustain-ability concerns elsewhere in Europe boosted demand for British government debt, pushing up prices and lowering yields. These reached historical lows in August. Subsequently, bond yields recovered, driven by positive macroeconomic news and developments in the US bond market, and ended the year at 3.40%, or 62 basis points lower than at the end of the previous year. In line with the US stock market, UK equity prices measured by the FTSE 100 rose during 2010, gaining around 9%.
JapanIn Japan, economic activity rebounded, with real GDP rising by 3.9% in 2010, after having declined by 6.3% in the previous year. Economic expansion was primarily driven by net exports, reflecting strong export growth during the year. Private consumption, inventories and government expenditure also contributed positively, whereas investment declined marginally. The unemployment rate rose in the first two quarters of 2010, but generally declined thereafter, reaching 4.9% in December, down by 0.3 percentage points from the same month in the previous year.
Japan’s inflation rate remained negative throughout the first three quarters of 2010, but increased by 1.1 per-centage points to -0.6% by September. In the following two months, consumer price inflation turned slightly positive, but fell to zero by December.
The Bank of Japan maintained an accommodative monetary policy stance throughout 2010 by keeping the basic discount rate unchanged at 0.3%, and by providing funds through several liquidity programs. Addi-tionally, in May, the Japanese central bank re-established temporary US dollar swap agreements with the Federal Reserve. In October it reduced its targeted uncollateralised overnight call rate from around 0.1% to a range between zero and 0.1%. In December, the Bank of Japan extended the US dollar swap agreement.

21
CENTRAL BANK OF MALTA Annual Report 2010
Ten-year Japanese government bond yields generally fell during the first three quarters of the year and reached historical lows in early October. Subsequently, bond yields recovered, ending December at 1.12%, 18 basis points lower than a year earlier. Equity prices, as measured by the Nikkei 225, broadly declined in the first two quarters of the year, but subsequently recovered part of earlier losses. The Japanese stock market ended December around 3% lower than a year earlier.
Emerging AsiaEconomic activity in the main emerging Asian countries grew at a faster pace in 2010 than in the previous year. In China, economic growth accelerated to 10.4% from 8.7% in 2009. After rising by 11.9% on an annu-al basis in the first quarter, real GDP growth later slowed down slightly due to the withdrawal of fiscal stimuli; it continued to be supported by private investment and external demand. In India, real GDP expanded by 9.8%, up from 5.6% in the previous year.1
After turning positive in the last quarter of 2009, consumer price inflation in China accelerated during 2010, reaching 4.6% in December, compared with 1.9% a year earlier, mainly due to higher food prices. In India, wholesale price inflation, which remained high during 2010, was also supported by rising food prices. Con-sumer inflation reached 9.9% in March before moderating slightly for the rest of the year, ending December at 8.4%, compared with 7.3% a year earlier.
Commodities
OilThe price of Brent crude oil extended the upward trend seen during 2009, rising by 20.4% over 2010 (see Chart 1.5). Initially, the hike was driven by higher demand and escalating tensions in the Middle East. In May, the price of Brent crude fell considerably, to a low of USD66.94, reportedly as a result of the intensifi-cation of financial market instability, but generally rose throughout the rest of the year, sustained by higher demand pressures. Brent crude ended the year at USD94.23 per barrel.
Other commoditiesFollowing strong increases in 2009, prices of non-energy commodities, as measured by the Reuters Com-modity Index, remained relatively stable during the first half of the year (see Chart 1.5).2 Subsequently, however, commodity prices climbed sharply, with the Index reaching historical highs towards the end of the year. The rise in the index reflected higher prices of food crops, such as maize, wheat and sugar, which were supported by strong demand and a fall in supply due to adverse weath-er conditions. Concurrently, metal prices also increased, while cotton reached record highs. As a result, non-energy commodity prices rose by 36.7% during the year as a whole.
GoldAfter rising by around 25% during 2009, the price of gold continued on a steep upward trend in 2010 (see Chart 1.6). During the first two quarters of the year, the price was mainly driven by concerns about European sovereign debt, as gold 1 The cut-off date for GDP in India was extended to 10 March 2011.2 The Reuters Commodity Index is a weighted index of the prices of 17 commodities that include food, beverages, vegetable oils, agri-cultural raw materials and metals but exclude oil and gold.
1,700
1,950
2,200
2,450
2,700
2,950
3,200
30
50
70
90
110
130
150
2008 2009 2010
Brent crude Reuters Commodity Index (right scale)
Chart 1.5COMMODITY PRICES (end of week)
(1) US dollars per barrel.Source: Reuters.
(1)
22
CENTRAL BANK OF MALTA Annual Report 2010
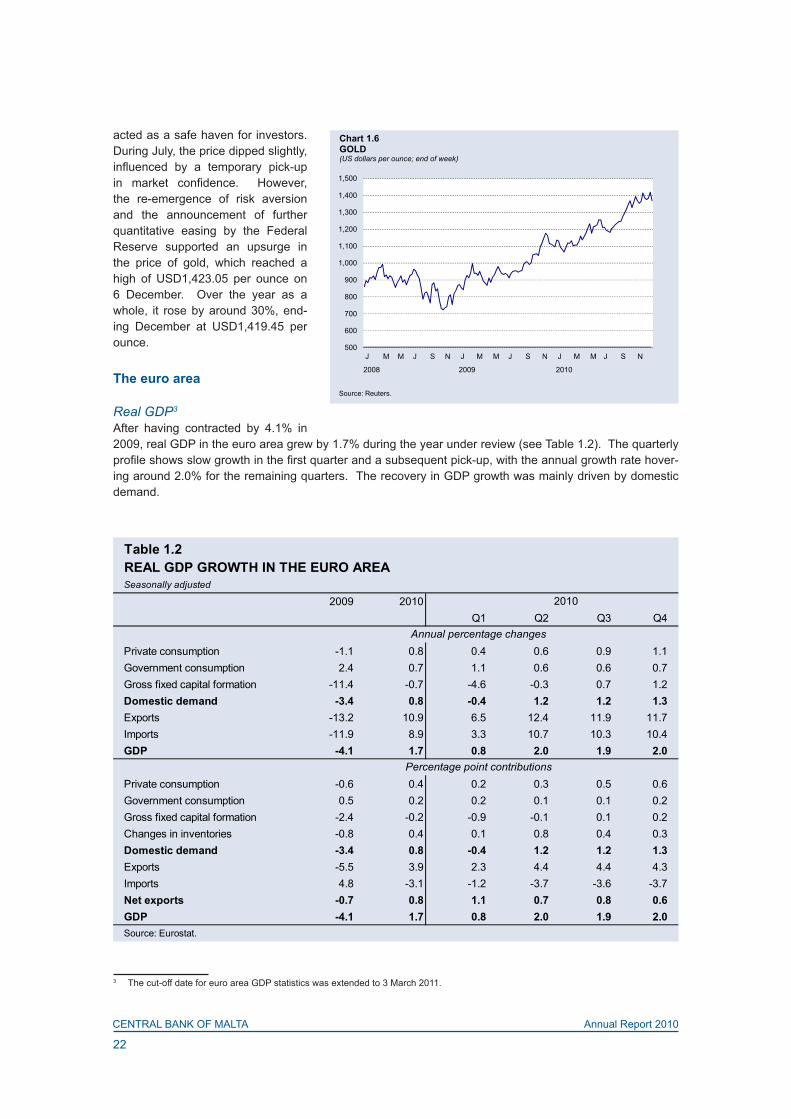
acted as a safe haven for investors. During July, the price dipped slightly, influenced by a temporary pick-up in market confidence. However, the re-emergence of risk aversion and the announcement of further quantitative easing by the Federal Reserve supported an upsurge in the price of gold, which reached a high of USD1,423.05 per ounce on 6 December. Over the year as a whole, it rose by around 30%, end-ing December at USD1,419.45 per ounce.
The euro area
Real GDP3 After having contracted by 4.1% in 2009, real GDP in the euro area grew by 1.7% during the year under review (see Table 1.2). The quarterly profile shows slow growth in the first quarter and a subsequent pick-up, with the annual growth rate hover-ing around 2.0% for the remaining quarters. The recovery in GDP growth was mainly driven by domestic demand.
3 The cut-off date for euro area GDP statistics was extended to 3 March 2011.
500
600
700
800
900
1,000
1,100
1,200
1,300
1,400
1,500
2008 2009 2010
Chart 1.6GOLD(US dollars per ounce; end of week)
Source: Reuters.
Table 1.2REAL GDP GROWTH IN THE EURO AREASeasonally adjusted
2009 2010Q1 Q2 Q3 Q4
Private consumption -1.1 0.8 0.4 0.6 0.9 1.1Government consumption 2.4 0.7 1.1 0.6 0.6 0.7Gross fixed capital formation -11.4 -0.7 -4.6 -0.3 0.7 1.2Domestic demand -3.4 0.8 -0.4 1.2 1.2 1.3Exports -13.2 10.9 6.5 12.4 11.9 11.7Imports -11.9 8.9 3.3 10.7 10.3 10.4GDP -4.1 1.7 0.8 2.0 1.9 2.0
Private consumption -0.6 0.4 0.2 0.3 0.5 0.6Government consumption 0.5 0.2 0.2 0.1 0.1 0.2Gross fixed capital formation -2.4 -0.2 -0.9 -0.1 0.1 0.2Changes in inventories -0.8 0.4 0.1 0.8 0.4 0.3Domestic demand -3.4 0.8 -0.4 1.2 1.2 1.3Exports -5.5 3.9 2.3 4.4 4.4 4.3Imports 4.8 -3.1 -1.2 -3.7 -3.6 -3.7Net exports -0.7 0.8 1.1 0.7 0.8 0.6GDP -4.1 1.7 0.8 2.0 1.9 2.0Source: Eurostat.
2010
Annual percentage changes
Percentage point contributions

23
CENTRAL BANK OF MALTA Annual Report 2010
Domestic demand expanded by 0.8% during the year, aided by private and government consumption, which grew by 0.8% and 0.7%, respectively. This was however counteracted by a contraction of 0.7% in invest-ment, which was much smaller than the fall registered in 2009. With reference to the external sector, both exports and imports grew in 2010, whereas they had contracted in the previous year. As exports grew by 10.9%, faster than the 8.9% annual growth rate of imports, the contribution of net exports to growth was positive.
Inflation The annual rate of euro area HICP inflation generally rose throughout 2010, going up from 0.9% in Decem-ber 2009 to 2.2% a year later (see Chart 1.7). The pick-up mainly resulted from higher energy prices, which increased by 11.0% year-on-year. At the same time, the annual rate of food price inflation went up to 2.1% by the end of the year, while prices of non-energy industrial goods increased by 0.7%. In contrast, services price inflation moderated slightly. Following these developments, core inflation, measured by excluding energy and unprocessed food from the HICP, remained relatively stable and stood at a much lower level than the overall HICP. In fact, the annual rate of core inflation edged up by just 0.1 of a percentage point during 2010 to end the year at 1.1%. On average, HICP inflation went up to 1.6% in 2010 from 0.3% in 2009.
Labour marketAfter a marked deterioration observed in 2009, conditions in the euro area labour markets improved and stabilised in 2010 as economic activity recuperated. This is attested by both employment and unemploy-ment figures. Quarter-on-quarter employment growth rates were stable, while the year-on-year rates edged up in each quarter. Mean-while, during the first quarter of 2010, the area-wide unemployment rate remained constant at 9.9% as in December 2009. It then rose by 0.1 percentage points to 10.0% in April and remained at that level for the rest of the year, barring October, when it edged up to 10.1% (see Chart 1.8). Although the jobless rate levelled off during 2010, it remained high by his-torical standards.
Monetary policy The ECB kept its key interest rates unchanged throughout 2010, with the MRO remaining constant at 1.00%. The Governing Council considered that interest rates remained appro-priate, given that price developments were expected to be subdued over the policy relevant horizon and infla-tion expectations appeared to be well anchored.
-2.0
-1.0
0.0
1.0
2.0
3.0
4.0
5.0
J2008
M M J S N J2009
M M J S N J2010
M M J S N
Services (overall index excluding goods) Unprocessed foodProcessed food including alcohol and tobacco Non-energy industrial goodsEnergy All-items HICP
Source: Eurostat.
Chart 1.7CONTRIBUTIONS TO YEAR-ON-YEAR HICP INFLATION IN THE EURO AREA(percentage points; annual percentage change)
`
7
7.5
8
8.5
9
9.5
10
10.5
-150
-50
50
150
250
350
450
550
J2008
M M J S N J2009
M M J S N J2010
M M J S N
monthly change in thousands % of labour force (right scale)
Chart 1.8UNEMPLOYMENT IN THE EURO AREA(monthly data; seasonally adjusted)
Source: Eurostat.

24
CENTRAL BANK OF MALTA Annual Report 2010
In the first four months of the year, the ECB continued the gradual phasing out of non-standard measures it had introduced in response to the financial crisis.4 In March, the Governing Council decided to return to a variable rate tender procedure in the regular three-month long-term refinancing operation (LTRO) and to fix the rate in the six-month LTRO at the average minimum bid rate of the MROs over the life of the operation.
In May, however, the ECB announced measures to address severe tensions observed in some market seg-ments which were hampering the monetary policy transmission mechanism. In particular, the ECB reverted to fixed rate tender procedures and reactivated the temporary liquidity swap lines with the Federal Reserve, and resumed US dollar liquidity-providing operations. Moreover, the Securities Markets Programme was introduced to enable the Eurosystem to conduct sterilised purchases of euro area public and private debt securities in order to ensure depth and liquidity in the securities markets.
Money and creditBroad money growth in the euro area was weak during 2010. On average, over the year M3 expanded by just 0.6%, as against 3.0% in 2009 (see Table 1.3). However, M3 growth recovered as the year progressed with the annual growth rate rising from -0.3% in December 2009 to 1.7% a year later. The pick-up in M3 took place despite declining M1 growth, which fell consistently throughout 2010, after the very high figures registered in the preceding year. The annual growth rate of M1 decreased to an average of 8.3% in 2010 from 9.9% in 2009, moderating considerably as the year went on. Meanwhile, short-term deposits other than overnight deposits (M2-M1) contracted by 5.2%, a faster rate of decline than in the previ-ous year.
Among other factors, subdued monetary growth reflects the impact of relatively low interest rates on mon-etary assets. Moreover, the moderate pick-up in M3 partly reflects a flatter yield curve, which discourages shifts away from broad money into less liquid but higher-yielding assets.
On the counterparts’ side, credit in the euro area expanded at a slower pace during the first half of 2010, only to recuperate in the second half of the year. Indeed, annual credit growth to euro area residents fell from 2.4% in December 2009 to 1.5% in June, before recovering to 3.5% by the end of 2010.
The recovery in credit mirrored developments in MFI loans to the private sector, which, after having fol-lowed a steady downward trend since the beginning of 2008, generally rose during 2010. The annual
4 More detailed information on the conduct of monetary policy can be found in Chapter 1 of Part 2 of this Annual Report, which deals with the Bank’s policies, operations and activities.
Table 1.3EURO AREA MONETARY AGGREGATES Annual percentage changes, seasonally adjusted. Annual data are averages.
2009 2010 2009Dec. Mar. June Sep.
M1 9.9 8.3 12.4 10.8 9.2 6.2Currency in circulation 11.5 6.1 6.1 6.8 6.9 6.0Overnight deposits 9.6 8.7 13.8 11.7 9.6 6.2M2-M1 (Other short-term deposits) -0.5 -5.2 -9.1 -8.0 -7.0 -2.8Deposits with an agreed maturity of up to two years -7.6 -16.5 -24.3 -21.9 -19.4 -12.1Deposits redeemable at notice of up to three months 9.1 8.3 15.1 11.8 9.1 7.9M2 4.6 1.8 1.6 1.6 1.4 2.0M3 3.0 0.6 -0.3 -0.1 0.2 1.1Source: ECB.
2010

25
CENTRAL BANK OF MALTA Annual Report 2010
growth rate of lending to the private sector increased by 2.0 percentage points to 1.9% between Decem-ber 2009 and 2010 (see Chart 1.9). The rise mostly resulted from MFI loans to non-financial corporations, whose annual rate of change, though remaining negative, edged up by 2.1 percentage points to -0.1% over the year. MFI loans to households also expanded more rapidly, with their annual growth rate putting on 1.7 percentage points to 3.0% during 2010. These developments are con-sistent with patterns seen over the business cycle as household lending tends to pick up early in the cycle, while that to non-financial corpora-tions generally lags behind.
The money market Following steep declines in the previous year, unsecured money market interest rates in the euro area, as measured by EURIBOR, generally increased during 2010 (see Chart 1.10).5 At the three-month and 12-month maturities, EURIBOR rates rose by 31 basis points and 26 basis points, to end 2010 at 1.01% and 1.51%, respectively.
EURIBOR rates dropped in the first quarter of the year, as a result of the easing of tensions in money markets stemming from the ECB’s non-standard enhanced credit support measures. They subsequently recovered, as excess liquidity in financial markets diminished.
The spread between the unsecured EURIBOR and secured rates, such as those derived from the EONIA swap index, generally widened over the course of the year. Such spreads are a measure of market confidence in the soundness of the banking sys-tem.6 By the end of 2010, the spread at the three-month maturity had increased to 41 basis points from 32 basis points a year earlier.
Bond yieldsTen-year German government bond yields, which serve as a benchmark for the euro area, generally declined during the first eight months of 2010, before recovering over the remain-der of the year (refer to Chart 1.3). The decline of 127 basis points to the
5 EURIBOR refers to the rates at which a prime bank is willing to lend funds to another prime bank in euro on an unsecured basis.6 EONIA is a measure of the effective interest rate prevailing in the euro interbank overnight market. The EONIA swap rate is the fixed rate that banks are willing to pay in exchange for receiving the average EONIA rate over the lifetime of a swap contract.
-4
-2
0
2
4
6
8
10
12
14
16
J2008
M M J S N J2009
M M J S N J2010
M M J S N
Loans to households Loans to non-financial corporationsMFI loans to the non-financial private sector
Chart 1.9MFI LOANS TO THE NON-FINANCIAL PRIVATE SECTOR IN THE EURO AREA(annual percentage changes)
Source: ECB.
0.0
1.0
2.0
3.0
4.0
5.0
6.0
EURIBOR 3-month EONIA 3-month swap rate EURIBOR 1-weekEURIBOR 12-month Interest rate on the MROs
Chart 1.10KEY INTEREST RATES (percentages per annum; daily data)
Sources: ECB; Euribor FBE.
2008 2009 2010

26
CENTRAL BANK OF MALTA Annual Report 2010
historical low of 2.11% by end-August took place amid rising financial market concerns about the sustain-ability of fiscal positions in some euro area countries. In particular, the intensification of the sovereign debt crisis, downgrades of various sovereign credit ratings and concern about the negative impact on economic activity of austerity measures announced by several euro area governments, triggered a large-scale flight to quality, and thereby exerted downward pressure on benchmark yields.
In contrast, ten-year German government bond yields increased by 86 basis points to 2.97% between end-August and end-December. This rise appears to reflect the market’s reaction to the favourable underlying momentum of the economic recovery in the euro area. In sum, over the year as a whole, ten-year German bond yields declined by 41 basis points.
While the intensifying market concerns about the sustainability of sovereign debt in some euro area coun-tries exerted downward pressure on German bond yields they pushed up sovereign yields elsewhere in the euro area. As a result, for example, Greek bond yields doubled during 2010, implying a considerable widen-ing in spreads over the benchmark.
Equity prices Euro area equity prices fluctuated considerably during 2010. After declining in January, stock prices gener-ally recovered in the following three months owing to some positive data releases (refer to Chart 1.4). Prices then fell sharply in May in line with heightened risk aversion stemming from concerns about the sustainability of public finances in some euro area countries. In July markets recovered, aided by improving risk appetite following the publication of the EU bank stress tests results and by the revised proposals for financial regula-tion. Renewed worries about sovereign debt in some euro area countries, however, weighed down again on equity prices in August. Against a backdrop of positive economic releases, they recuperated in September and generally rose during the last three months of the year as the economic recovery gained momentum. This rally was, nevertheless, dampened by the intensification of tensions in some euro area sovereign debt markets in autumn, by concerns about the exposure of euro area banks to sovereign debt holdings, and by increasing long-term interest rates. Overall, euro area equity prices, as measured by the Dow Jones EURO STOXX index, dropped by just 0.1% during 2010.
Exchange ratesDuring 2010 the euro depreciated by 7.2% against the US dollar, more than reversing the appreciation which had taken place in 2009 (see Chart 1.11). In the first half of the year, the euro generally weakened against the US currency, as a result of a widening in the long-term US dollar/euro interest rate differential and of bet-ter than expected US economic data. In contrast, the euro then generally strengthened in the second half of the year, as worse than expected data for the US economy suggest-ing some slowing down of the US recovery weighed significantly on the dollar.
The euro also weakened consider-ably against the Japanese yen in 2010, falling by 18.4%. This depre-ciation took place in an environment of uncertainty surrounding fiscal sus-tainability in some countries as well as financial market concerns that the economic expansion in the euro area would lag behind that of the United States and Japan.
60
70
80
90
100
110
120
130
J2008
M M J S N J2009
M M J S N J2010
M M J S N
USD JPY GBP
Chart 1.11EXCHANGE RATE MOVEMENTS OF THE EURO AGAINST OTHER MAJOR CURRENCIES(index of end of month rates; Jan. 2008=100; an increase in the index implies euro appreciation)
Source: Eurostat.

27
CENTRAL BANK OF MALTA Annual Report 2010
Similarly, the euro depreciated against the pound sterling, losing 3.1% of its value during 2010. Apart from the uncertainty surrounding the fiscal situation in some euro area countries, better than expected data concerning the British economy also weighed on the euro. Nevertheless, the weakening of the euro against British currency was more contained than that vis-à-vis other major cur-rencies, owing to the relatively weak economic environment in the United Kingdom as well as the uncertainty surrounding the British general elec-tions during the first half of the year.
The nominal effective exchange rate (NEER) of the euro, as measured against the currencies of 21 of the euro area’s main trading partners, depreciated during the year under review, falling to 8.2% below the level at the end of 2009 (see Chart 1.12). Developments in the NEER in 2010 can be split into two phases: a significant weakening which took place in the first half of 2010, when the NEER lost 10.3%, and the volatile period in the second half of the year, when the NEER partially recovered some of its previous losses.
95
100
105
110
115
120
2008 2009 2010
Chart 1.12EURO NOMINAL EFFECTIVE EXCHANGE RATE(index of daily effective exchange rate; Q1 1999=100)
Source: ECB.

28
CENTRAL BANK OF MALTA Annual Report 2010
2. MONETARY AND FINANCIAL DEVELOPMENTS
Following a contraction in 2009, growth in residents’ deposits resumed during 2010 and resulted in a higher contribution of Maltese MFIs to the euro area’s broad money stock.1 Credit to residents continued to expand, though at a decelerating pace. While official interest rates were unchanged throughout the year, domestic money market yields fell. In the capital market, a decline in yields on five-year and ten-year Maltese govern-ment securities was accompanied by a rise in the MSE equity price index.
Residents’ deposits The contribution of resident MFIs to the euro area broad money stock (M3) stood at EUR9.4 billion at the end of December 2010. This was EUR487.8 million, or 5.5%, more than at the end of the previous year (see Table 2.1). Growth was driven by the narrow money component of M3, which expanded by 14.6%, up from 13.2% in 2009. In contrast, deposits with an agreed maturity of up to two years, which, together with narrow money, make up the intermediate money (M2) component, continued to fall, contracting by 5.1% on a year earlier and thus restraining broad money growth.
During 2010 residents’ overnight deposits continued to grow strongly, expanding by EUR591.5 million, or 16.3%, compared with 16.5% a year earlier (see Table 2.2). The preference for such deposits reflected the reduced opportunity cost of holding liquid monetary assets in an environment of low interest rates. Growth was driven by higher balances belonging to private non-financial companies (NFCs) and to households.
At the same time, deposits redeemable at up to three months’ notice accelerated significantly, with their growth rate reaching 10.7% during 2010. Nonetheless, such deposits account for a small proportion of the total, and the rise in absolute terms amounted to a mere EUR12.0 million.
After declining by 13.1% in 2009, deposits with an agreed maturity of up to two years contracted at a more moderate pace during the period reviewed, falling by EUR207.1 million, or 5.1%. This was mainly driven by a sizeable drop in holdings belonging to households. Apart from a shift into more liquid monetary assets, the sharp decline in deposits with an agreed maturity of up to two years was also boosted by investors’ prefer-ence for longer-term assets outside M3 in search of a higher return.
In fact, deposits with terms to maturity of over two years, which do not form part of M3, expanded by EUR208.6 million during the year, reflecting several new saving schemes launched by resident banks that
1 Unless otherwise specified, the term “residents” in this section refers to residents of Malta only. “Other euro area residents” include residents of all euro area countries except Malta.
Table 2.1
EUR millions; annual percentage changes2008 2009 2010Dec. Dec. Dec. Amount %
Narrow money (M1) 3,849.6 4,359.5 4,997.6 638.1 14.6Intermediate money (M2) 8,824.5 8,671.1 9,129.5 458.4 5.3Broad money (M3)(2) 8,861.8 8,883.3 9,371.1 487.8 5.5
Source: Central Bank of Malta.
Change
(1) Figures show the contribution of Maltese MFIs to the euro area totals. Data on monetary aggregates include deposit liabilities to both residents of Malta and other euro area residents.
CONTRIBUTION OF RESIDENT MFIs TO EURO AREA MONETARY AGGREGATES(1)
(2) The difference between M3 and M2 comprises repurchase agreements and debt securities with up to two years' maturity issued by MFIs in Malta less holdings by MFIs in Malta of such securities issued by MFIs anywhere in the euro area. Figures also include MMFs' shares/units issued less holdings of such units by MMFs and credit institutions resident in the euro area. The difference between M3 and M2 is relatively small.
29
CENTRAL BANK OF MALTA Annual Report 2010
entailed an increase in the interest rates offered. Considerable bond issues on the primary market also played a role in diverting funds away from monetary assets.
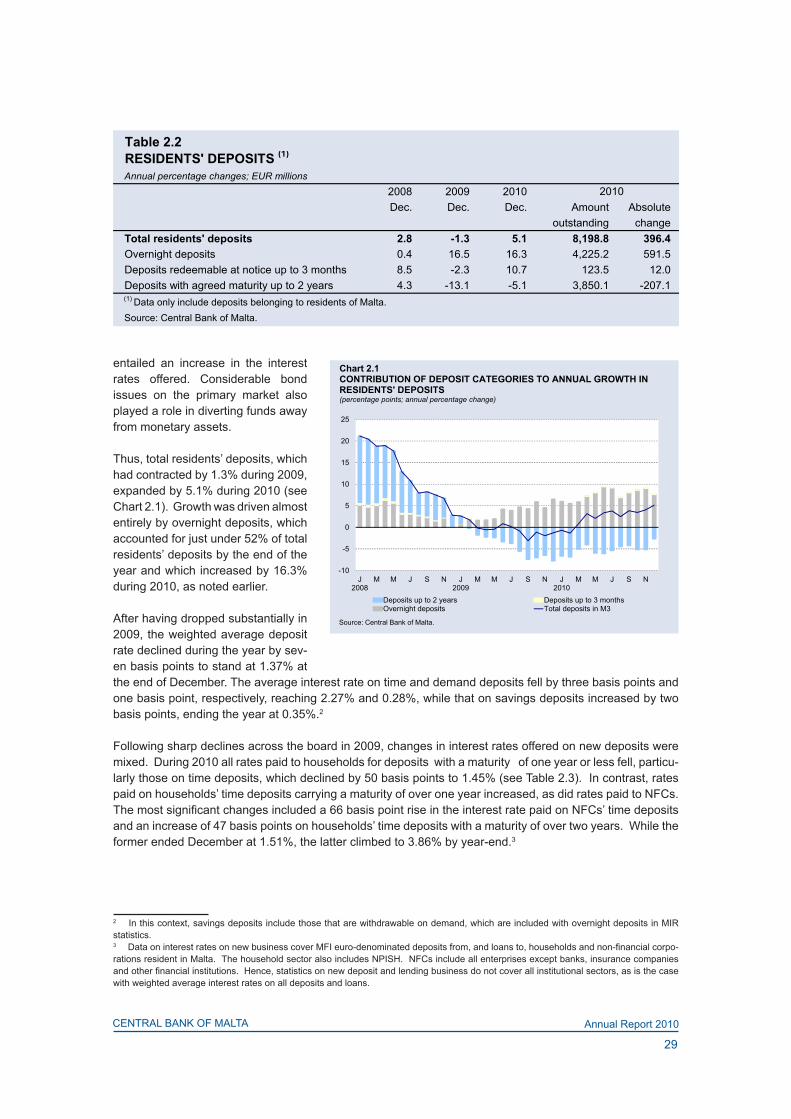
Thus, total residents’ deposits, which had contracted by 1.3% during 2009, expanded by 5.1% during 2010 (see Chart 2.1). Growth was driven almost entirely by overnight deposits, which accounted for just under 52% of total residents’ deposits by the end of the year and which increased by 16.3% during 2010, as noted earlier.
After having dropped substantially in 2009, the weighted average deposit rate declined during the year by sev-en basis points to stand at 1.37% at the end of December. The average interest rate on time and demand deposits fell by three basis points and one basis point, respectively, reaching 2.27% and 0.28%, while that on savings deposits increased by two basis points, ending the year at 0.35%.2
Following sharp declines across the board in 2009, changes in interest rates offered on new deposits were mixed. During 2010 all rates paid to households for deposits with a maturity of one year or less fell, particu-larly those on time deposits, which declined by 50 basis points to 1.45% (see Table 2.3). In contrast, rates paid on households’ time deposits carrying a maturity of over one year increased, as did rates paid to NFCs. The most significant changes included a 66 basis point rise in the interest rate paid on NFCs’ time deposits and an increase of 47 basis points on households’ time deposits with a maturity of over two years. While the former ended December at 1.51%, the latter climbed to 3.86% by year-end.3
2 In this context, savings deposits include those that are withdrawable on demand, which are included with overnight deposits in MIR statistics.3 Data on interest rates on new business cover MFI euro-denominated deposits from, and loans to, households and non-financial corpo-rations resident in Malta. The household sector also includes NPISH. NFCs include all enterprises except banks, insurance companies and other financial institutions. Hence, statistics on new deposit and lending business do not cover all institutional sectors, as is the case with weighted average interest rates on all deposits and loans.
-10
-5
0
5
10
15
20
25
J2008
M M J S N J2009
M M J S N J2010
M M J S N
Deposits up to 2 years Deposits up to 3 monthsOvernight deposits Total deposits in M3
Chart 2.1CONTRIBUTION OF DEPOSIT CATEGORIES TO ANNUAL GROWTH IN RESIDENTS' DEPOSITS(percentage points; annual percentage change)
Source: Central Bank of Malta.
Table 2.2RESIDENTS' DEPOSITS (1)
Annual percentage changes; EUR millions2008 2009 2010Dec. Dec. Dec. Amount Absolute
outstanding changeTotal residents' deposits 2.8 -1.3 5.1 8,198.8 396.4Overnight deposits 0.4 16.5 16.3 4,225.2 591.5Deposits redeemable at notice up to 3 months 8.5 -2.3 10.7 123.5 12.0Deposits with agreed maturity up to 2 years 4.3 -13.1 -5.1 3,850.1 -207.1
Source: Central Bank of Malta.
(1) Data only include deposits belonging to residents of Malta.
2010

30
CENTRAL BANK OF MALTA Annual Report 2010
Credit During 2010 credit to residents expanded at a moderate pace, rising by 5.8% as opposed to 9.4% during 2009, and extending the slowdown that began in mid-2008 (see Chart 2.2). Growth stemmed primarily from substantial, though decelerating, increases in credit to NFCs, households and general government (see Table 2.4). The slowdown in part reflected an increased tendency on the part of corporate borrowers to resort to the capital market.
Credit to general government expanded by 8.5% during 2010, driven by increased bank holdings of Malta Government Stocks (see Chart 2.2). This represents a marked slowdown compared with 2009, when there was a sharp increase in the banks’ holdings of Treasury bills.
Similarly, credit to other residents, which include mainly households and non-financial corporations, expand-ed at a slower pace during 2010, with the annual growth rate falling to 5.1%, mainly because of a decelera-tion in credit to the non-bank private sector.4 At the same time, the rate of growth of credit to the non-bank pub-lic sector slowed down sharply, fall-ing to 1.4% in December from 13.8% a year earlier as one public corpora-tion repaid bank debt.5 4 The term “other residents” represents all economic sectors that are residents of Malta but do not form part of general government.5 The non-bank public sector includes public companies that do not form part of the general government sector.
0
5
10
15
20
25
30
35
J2008
M M J S N J2009
M M J S N J2010
M M J S N
Total Credit to general government Credit to other residents
Chart 2.2CREDIT TO RESIDENTS(annual percentage changes)
Source: Central Bank of Malta.
Table 2.3
Percentages per annum; weighted average rates for the period
2008 2009 2010Dec. Dec. Dec.
New businessHouseholds and NPISHOvernight deposits(2),(3) 0.57 0.30 0.28Savings deposits redeemable at notice up to 3 months(2),(4) 2.09 1.70 1.69Time deposits with agreed maturityUp to 1 year 3.06 1.95 1.45Over 1 and up to 2 years 4.60 3.00 3.19Over 2 years 4.77 3.39 3.86Non-financial corporationsOvernight deposits(2),(3) 0.64 0.23 0.24Time deposits with agreed maturity 2.60 0.85 1.51
Source: Central Bank of Malta.
MFI INTEREST RATES ON DEPOSITS BELONGING TO RESIDENTS OF MALTA(1)
(4) Households and non-financial corporations are merged, since deposits in this category held by non-financial corporations are negligible.
(1) Annualised agreed rates (AAR) on euro-denominated deposits belonging to households and non-financial corporations held with credit institutions resident in Malta. (2) For these instrument categories, interest rates are compiled on outstanding amounts but treated as new business indicators due to the large number of inflows and outflows.(3) Overnight deposits include current accounts and savings withdrawable on demand.
31
CENTRAL BANK OF MALTA Annual Report 2010
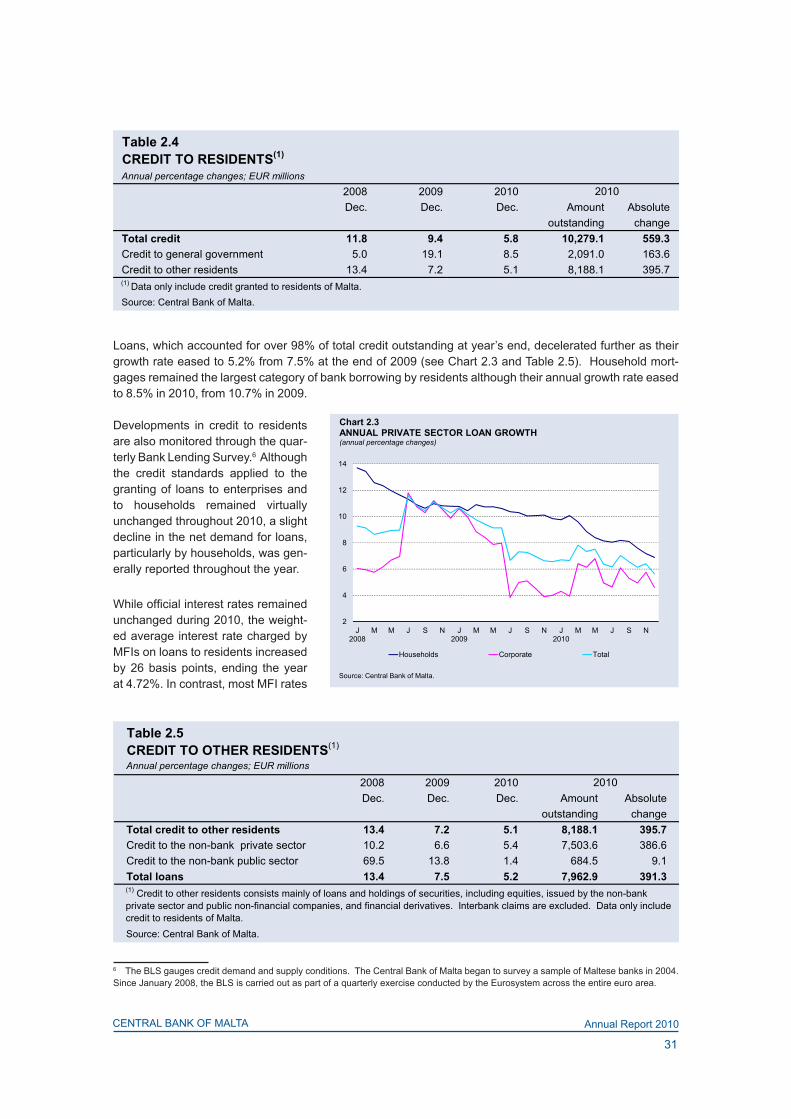
Loans, which accounted for over 98% of total credit outstanding at year’s end, decelerated further as their growth rate eased to 5.2% from 7.5% at the end of 2009 (see Chart 2.3 and Table 2.5). Household mort-gages remained the largest category of bank borrowing by residents although their annual growth rate eased to 8.5% in 2010, from 10.7% in 2009.
Developments in credit to residents are also monitored through the quar-terly Bank Lending Survey.6 Although the credit standards applied to the granting of loans to enterprises and to households remained virtually unchanged throughout 2010, a slight decline in the net demand for loans, particularly by households, was gen-erally reported throughout the year.
While official interest rates remained unchanged during 2010, the weight-ed average interest rate charged by MFIs on loans to residents increased by 26 basis points, ending the year at 4.72%. In contrast, most MFI rates
6 The BLS gauges credit demand and supply conditions. The Central Bank of Malta began to survey a sample of Maltese banks in 2004. Since January 2008, the BLS is carried out as part of a quarterly exercise conducted by the Eurosystem across the entire euro area.
2
4
6
8
10
12
14
J2008
M M J S N J2009
M M J S N J2010
M M J S N
Households Corporate Total
Chart 2.3ANNUAL PRIVATE SECTOR LOAN GROWTH(annual percentage changes)
Source: Central Bank of Malta.
Table 2.5
Annual percentage changes; EUR millions
2008 2009 2010Dec. Dec. Dec. Amount Absolute
outstanding changeTotal credit to other residents 13.4 7.2 5.1 8,188.1 395.7Credit to the non-bank private sector 10.2 6.6 5.4 7,503.6 386.6Credit to the non-bank public sector 69.5 13.8 1.4 684.5 9.1Total loans 13.4 7.5 5.2 7,962.9 391.3
Source: Central Bank of Malta.
(1) Credit to other residents consists mainly of loans and holdings of securities, including equities, issued by the non-bank private sector and public non-financial companies, and financial derivatives. Interbank claims are excluded. Data only include credit to residents of Malta.
CREDIT TO OTHER RESIDENTS(1)
2010
Table 2.4
Annual percentage changes; EUR millions 2008 2009 2010Dec. Dec. Dec. Amount Absolute
outstanding changeTotal credit 11.8 9.4 5.8 10,279.1 559.3Credit to general government 5.0 19.1 8.5 2,091.0 163.6Credit to other residents 13.4 7.2 5.1 8,188.1 395.7
Source: Central Bank of Malta.
CREDIT TO RESIDENTS(1)
2010
(1) Data only include credit granted to residents of Malta.

32
CENTRAL BANK OF MALTA Annual Report 2010
on new loans, considered much more volatile, declined. For instance, rates charged on overdrafts granted to households fell by 69 basis points to 5.75%, while those charged on consumer credit to households dropped by 21 points to 5.81% (see Table 2.6). Rates charged on new loans and overdrafts to firms also edged down during the year, as did rates on loans for house purchases.
Meanwhile, credit granted by resident MFIs to other residents of the euro area expanded during the year, rising by EUR675.8 million to EUR4.2 billion. This mainly reflected a further increase in MFI holdings of government securities issued elsewhere in the euro area.
Net claims on non-residents of the euro areaDuring 2010 the external counterpart of resident MFIs’ contribution to euro area broad money, which con-sists of their net claims on non-residents of the euro area, expanded by EUR1.7 billion, or 25.6% (see Table 2.7). The operations of a newly-licensed credit institution in March 2010 had a major impact on these devel-opments. Claims on non-residents of the euro area increased significantly, mainly on account of a rise in deposits held outside the euro area coupled with larger holdings of non-euro area government securities.
Table 2.7
EUR millions; percentage changes on the previous quarter 2009 2010Dec. Dec. Amount %
External counterparts 6,646.9 8,348.0 1,701.1 25.6Claims on non-residents of the euro area 24,843.9 30,383.5 5,539.7 22.3Liabilities to non-residents of the euro area 18,197.0 22,035.5 3,838.5 21.1Other counterparts (net)(2) 10,995.6 13,280.8 2,285.2 20.8
Source: Central Bank of Malta.
(1) Figures show the contribution of Maltese MFIs to the euro area totals.
EXTERNAL AND OTHER COUNTERPARTS(1)
(2) Includes net interbank claims/liabilities.
Change
Table 2.6
Percentages per annum; weighted average rates for the period
2008 2009 2010Dec. Dec. Dec.
New businessHouseholds and NPISHOverdrafts(2) 7.16 6.44 5.75LoansLending for house purchases 3.84 3.52 3.43Consumer credit(3) 6.12 6.02 5.81Other lending 6.44 5.56 5.86Non-financial corporationsOverdrafts(2) 5.30 5.08 5.03Loans 5.50 4.95 4.86
(3) Excludes bank overdrafts.Source: Central Bank of Malta.
MFI INTEREST RATES ON LOANS TO RESIDENTS OF MALTA(1)
(1) Annualised agreed rates (AAR) on euro-denominated loans taken up by households and non-financial corporations from credit institutions resident in Malta. (2) For these instrument categories, interest rates are compiled on outstanding amounts but treated as new business indicators due to the large number of inflows and outflows.

33
CENTRAL BANK OF MALTA Annual Report 2010
Meanwhile, resident MFIs’ liabilities to non-residents of the euro area also went up, though to a lesser extent than their external assets, boosted by higher time deposits belonging to customers resident outside the euro area.
Other counterparts (net), which are generally heavily influenced by inter-bank transactions within the euro area, expanded by EUR2.3 billion, or 20.8%, during 2010. This resulted predominantly from an increase in banks’ longer-term financial liabili-ties, mostly in the form of equity fol-lowing the inclusion of the above-mentioned newly-licensed credit institution.
The money market During 2010 the Treasury issued EUR1.2 billion worth of bills, down from EUR1.6 billion in the previous year, implying a decline in net issuance. Three-month bills accounted for 43% of total issues, with the rest consist-ing mainly of six-month bills. Meanwhile, domestic banks took up 79% of total issues, a higher proportion than in 2009, while money market funds (MMF) and insurance companies bought most of the remainder. Investors resident elsewhere in the euro area increased their participation in Treasury bill purchases by around three percentage points from the previous year, to almost 5% in 2010. At 0.99% at the end of 2010, the primary market yield on three-month Treasury bills decreased by 41 basis points from the end-2009 level.
Turnover in the secondary market for Treasury bills declined to EUR203.5 million from EUR263.4 million in the previous year. Around three-quarters of all trades involved the Central Bank of Malta in its role as market-maker, with Bank purchases and sales amounting to EUR116.0 million and EUR39.8 million, respectively.
Secondary market yields followed the downward trend in the primary market, with the yield on three-month bills falling by 46 basis points to 0.94% in December. This mirrored a similar but smaller drop in the three-month benchmark euro area yield.7 As a result, the differential between the two, which stood at 105 basis points at the end of 2009, narrowed to 69 basis points a year later (see Chart 2.4).
Resident banks continued to borrow and lend short-term funds to each other although the turnover in the domestic interbank market fell significantly from EUR1.2 billion in 2009 to EUR0.5 billion in 2010, reflecting increased recourse to Eurosystem open market operations as a source of funds.
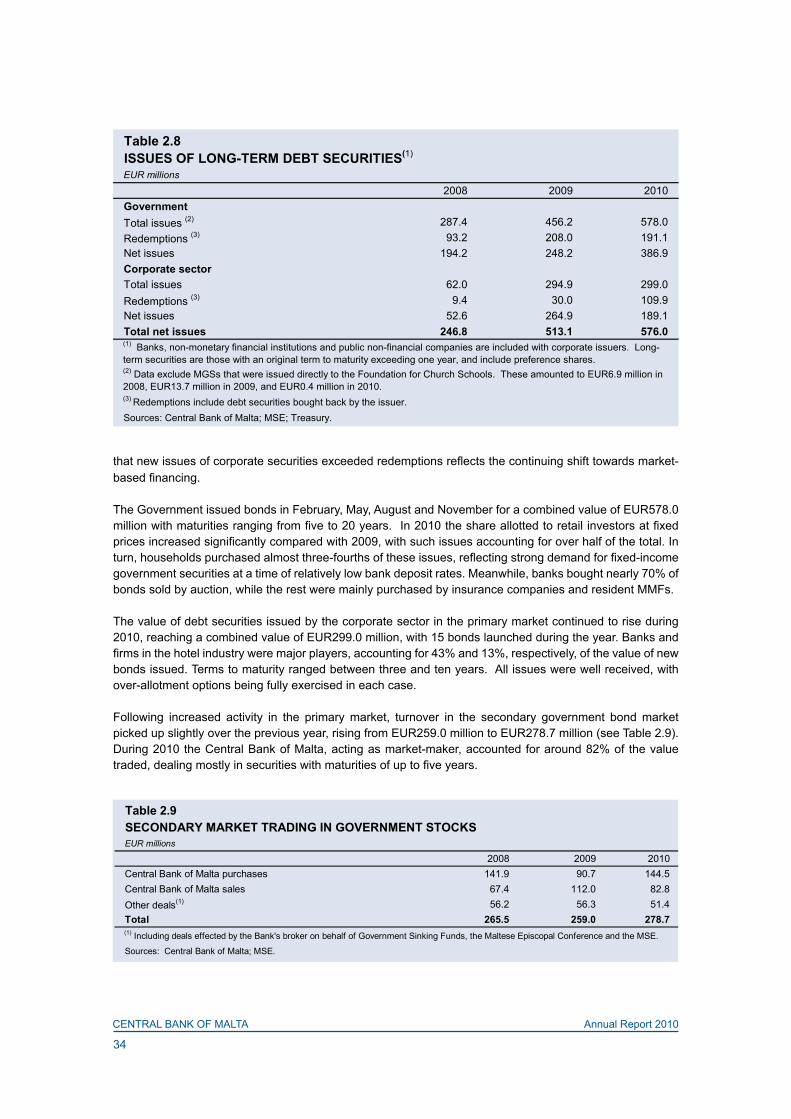
The capital market Net issues of long-term debt securities on the primary market amounted to EUR576.0 million, up from EUR492.1 million in the previous year (see Table 2.8). On a net basis, issues of long-term government debt increased by EUR138.7 million. Together with the reduced issuance of Treasury bills mentioned above, this implies a shift towards long-term debt, in an environment of comparatively low yields. On the other hand, whereas new issues by the corporate sector rose further, on account of a significant rise in redemptions, net issuance was smaller than in 2009. Although the latter decreased compared with the previous year, the fact
7 The benchmark for the euro area is the secondary market rate on the three-month securities issued by the French government, which is also shown in Chart 2.4.
0.0
0.5
1.0
1.5
2.0
2.5
3.0
3.5
4.0
4.5
5.0
J2008
M M J S N J2009
M M J S N J2010
M M J S N
ECB MRO rate 3-month Treasury bill 3-month benchmark euro
Chart 2.4MONEY MARKET INTEREST RATES(percentages per annum; end of month)
Source: Central Bank of Malta.
34
CENTRAL BANK OF MALTA Annual Report 2010
that new issues of corporate securities exceeded redemptions reflects the continuing shift towards market-based financing.
The Government issued bonds in February, May, August and November for a combined value of EUR578.0 million with maturities ranging from five to 20 years. In 2010 the share allotted to retail investors at fixed prices increased significantly compared with 2009, with such issues accounting for over half of the total. In turn, households purchased almost three-fourths of these issues, reflecting strong demand for fixed-income government securities at a time of relatively low bank deposit rates. Meanwhile, banks bought nearly 70% of bonds sold by auction, while the rest were mainly purchased by insurance companies and resident MMFs.
The value of debt securities issued by the corporate sector in the primary market continued to rise during 2010, reaching a combined value of EUR299.0 million, with 15 bonds launched during the year. Banks and firms in the hotel industry were major players, accounting for 43% and 13%, respectively, of the value of new bonds issued. Terms to maturity ranged between three and ten years. All issues were well received, with over-allotment options being fully exercised in each case.
Following increased activity in the primary market, turnover in the secondary government bond market picked up slightly over the previous year, rising from EUR259.0 million to EUR278.7 million (see Table 2.9). During 2010 the Central Bank of Malta, acting as market-maker, accounted for around 82% of the value traded, dealing mostly in securities with maturities of up to five years.
SECONDARY MARKET TRADING IN GOVERNMENT STOCKS
2008 2009 2010Central Bank of Malta purchases 141.9 90.7 144.5Central Bank of Malta sales 67.4 112.0 82.8Other deals(1) 56.2 56.3 51.4Total 265.5 259.0 278.7
Sources: Central Bank of Malta; MSE.
Table 2.9
EUR millions
(1) Including deals effected by the Bank's broker on behalf of Government Sinking Funds, the Maltese Episcopal Conference and the MSE.
2008 2009 2010GovernmentTotal issues (2) 287.4 456.2 578.0Redemptions (3) 93.2 208.0 191.1Net issues 194.2 248.2 386.9Corporate sectorTotal issues 62.0 294.9 299.0Redemptions (3) 9.4 30.0 109.9Net issues 52.6 264.9 189.1Total net issues 246.8 513.1 576.0
(2) Data exclude MGSs that were issued directly to the Foundation for Church Schools. These amounted to EUR6.9 million in 2008, EUR13.7 million in 2009, and EUR0.4 million in 2010.
Table 2.8ISSUES OF LONG-TERM DEBT SECURITIES(1)
EUR millions
(1) Banks, non-monetary financial institutions and public non-financial companies are included with corporate issuers. Long-term securities are those with an original term to maturity exceeding one year, and include preference shares.
(3) Redemptions include debt securities bought back by the issuer.Sources: Central Bank of Malta; MSE; Treasury.

35
CENTRAL BANK OF MALTA Annual Report 2010
Domestic government bond yields moved very much in line with bench-mark yields in the euro area.8 Yields on five-year government securities followed a downward path, drop-ping by 34 basis points, and ended the year at 3.16% (see Chart 2.5). Similarly, five-year euro area govern-ment bond yields declined but at a faster pace, falling by 49 basis points and ending the year at 2.15%. As a result, the spread increased by 15 basis points to 101 points.
On the other hand, while yields on ten-year domestic government bonds declined in the first nine months of 2010, ending September at 3.79%, they then rose during the last three months, ending the year at 4.44%. Over the year as a whole yields decreased by 13 basis points. These developments mirrored those in the euro area, where ten-year gov-ernment bond yields declined during the first eight months, but rose there-after. Benchmark ten-year yields in the euro area ended the year at 3.36%, or 40 basis points below their level at end-December 2009. Thus, the sovereign spread on ten-year debt widened by 27 points to 108 points.
Meanwhile, activity in the second-ary market for corporate bonds increased during 2010, with turnover rising by EUR6.2 million to EUR40.4 million. Trading was concentrated in 13 bonds (out of a total of 54 listed securities), which contributed to more than two-thirds of total turnover. On average, corporate bond yields declined over the year.
Turnover in the equity market, which had fallen in 2009, increased to EUR36.2 million in 2010 from EUR25.4 million in 2009, with bank shares accounting for most of the transactions. The MSE share index lost 2.5% of its value in the first ten months of the year. However, the losses were recovered towards the end of 2010 with bank equity prices leading the recovery. The index ended December at 3,781.24, a gain of 9.3% over the year as a whole (see Chart 2.6).
8 Euro area benchmark yields are computed on the basis of AAA-rated central government bonds.
1.0
1.5
2.0
2.5
3.0
3.5
4.0
4.5
5.0
5.5
J M M J S N J M M J S N J M M J S N
5-year (domestic) 5-year (euro area)10-year (domestic) 10-year (euro area)
Chart 2.5 GOVERNMENT BOND YIELDS(percentages per annum; end of month)
Sources: Central Bank of Malta; ECB.
2008 2009 2010
2500
3000
3500
4000
4500
5000
5500
J M M J S N J M M J S N J M M J S N
Chart 2.6MSE SHARE INDEX(end of month)
Source: MSE.
2008 2009 2010

36
CENTRAL BANK OF MALTA Annual Report 2010
3. OUTPUT, EMPLOYMENT AND PRICES1
In 2010 the Maltese economy recovered from the sharp contraction of the previous year. Real GDP growth was largely driven by net external demand, as exports outpaced imports, although investment also contrib-uted. The recovery was accompanied by improving labour market conditions and an acceleration in inflation largely driven by energy and fuel prices.
Gross value added (GVA) in nominal terms increased in most sectors of the economy and was particularly buoyant in financial services. Although it recovered in both tourism and manufacturing, the losses recorded in 2009 were not fully reversed. At the same time, GVA in the construction sector declined somewhat from the previous year’s level.
Gross Domestic ProductAfter having contracted by 3.4% in real terms in 2009, the economy expanded at a faster rate of 3.7% in 2010. The pace of the recovery, which at 4.1% was strongest in the first quarter of the year, moderated in the next six months, before pick-ing up to 3.9% in the last quarter (see Chart 3.1).
Growth stemmed from net exports, which turned positive in absolute terms in 2010. Domestic demand, which had fallen sharply in 2009, edged down marginally and once again contributed negatively to GDP growth (see Chart 3.2 and Table 3.1).
Domestic demand Private consumption, the largest component of domestic demand, rose in the first quarter on a year-on-year basis but dropped sharply in the second and third quarters. In the last quarter, it was only moder-ately higher than a year earlier. As a result, private consumption con-tracted by 0.7% over the year as a whole, as against a drop of 1.4% in the previous year. Consequently, its contribution to GDP growth, at -0.5 percentage points, was less negative than in 2009. The continued drop in consumption, although at a decelerating rate, is in line with weak growth in employment income, and is consistent with the
1 The cut-off date for data included in this Chapter is 16 March 2011.
-7-6-5-4-3-2-101234567
Q12007
Q2 Q3 Q4 Q12008
Q2 Q3 Q4 Q12009
Q2 Q3 Q4 Q12010
Q2 Q3 Q4
Chart 3.1REAL GDP GROWTH(annual percentage change)
Source: NSO.
-4.0
-3.0
-2.0
-1.0
0.0
1.0
2.0
3.0
4.0
5.0
6.0
-10.0
-7.5
-5.0
-2.5
0.0
2.5
5.0
7.5
10.0
12.5
15.0
2006 2007 2008 2009 2010Private consumption Government consumptionInvestment InventoriesNet exports GDP growth in % (RHS)
Chart 3.2REAL GDP GROWTH AND ITS COMPONENTS(percentage point contributions; annual percentage change)
Source: NSO.
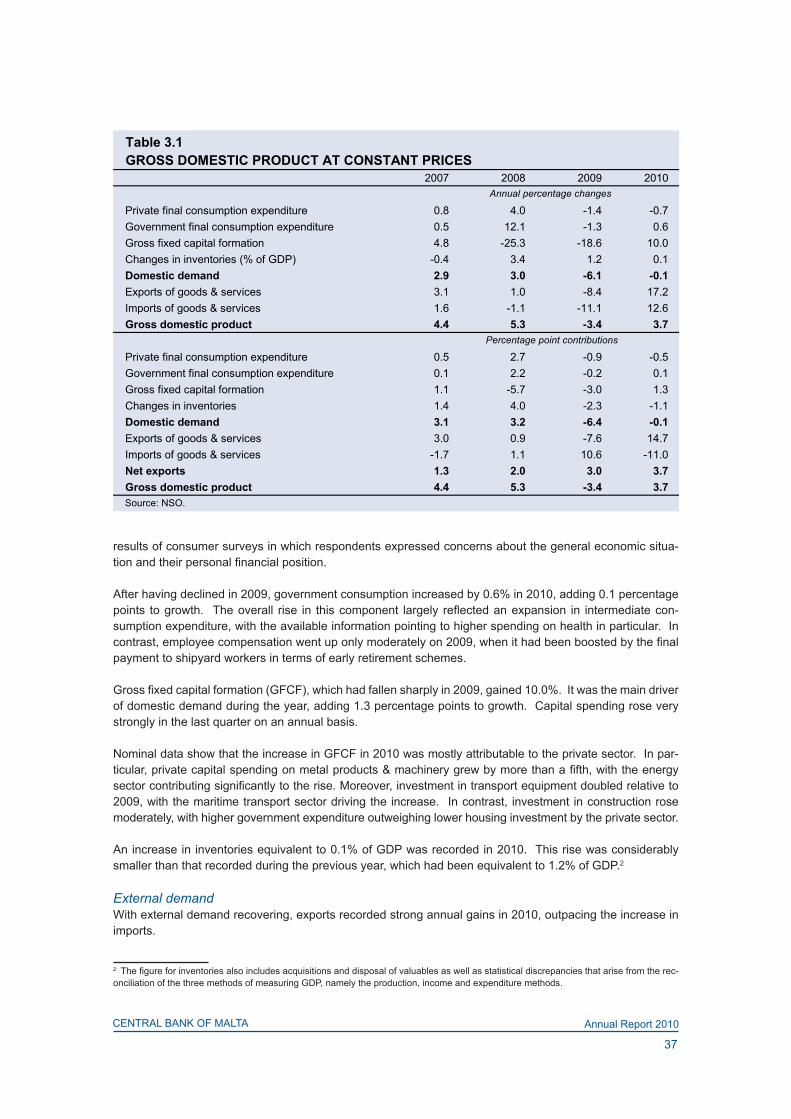
37
CENTRAL BANK OF MALTA Annual Report 2010
results of consumer surveys in which respondents expressed concerns about the general economic situa-tion and their personal financial position.
After having declined in 2009, government consumption increased by 0.6% in 2010, adding 0.1 percentage points to growth. The overall rise in this component largely reflected an expansion in intermediate con-sumption expenditure, with the available information pointing to higher spending on health in particular. In contrast, employee compensation went up only moderately on 2009, when it had been boosted by the final payment to shipyard workers in terms of early retirement schemes.
Gross fixed capital formation (GFCF), which had fallen sharply in 2009, gained 10.0%. It was the main driver of domestic demand during the year, adding 1.3 percentage points to growth. Capital spending rose very strongly in the last quarter on an annual basis.
Nominal data show that the increase in GFCF in 2010 was mostly attributable to the private sector. In par-ticular, private capital spending on metal products & machinery grew by more than a fifth, with the energy sector contributing significantly to the rise. Moreover, investment in transport equipment doubled relative to 2009, with the maritime transport sector driving the increase. In contrast, investment in construction rose moderately, with higher government expenditure outweighing lower housing investment by the private sector.
An increase in inventories equivalent to 0.1% of GDP was recorded in 2010. This rise was considerably smaller than that recorded during the previous year, which had been equivalent to 1.2% of GDP.2
External demand With external demand recovering, exports recorded strong annual gains in 2010, outpacing the increase in imports.
2 The figure for inventories also includes acquisitions and disposal of valuables as well as statistical discrepancies that arise from the rec-onciliation of the three methods of measuring GDP, namely the production, income and expenditure methods.
2007 2008 2009 2010
Private final consumption expenditure 0.8 4.0 -1.4 -0.7Government final consumption expenditure 0.5 12.1 -1.3 0.6Gross fixed capital formation 4.8 -25.3 -18.6 10.0Changes in inventories (% of GDP) -0.4 3.4 1.2 0.1Domestic demand 2.9 3.0 -6.1 -0.1Exports of goods & services 3.1 1.0 -8.4 17.2Imports of goods & services 1.6 -1.1 -11.1 12.6Gross domestic product 4.4 5.3 -3.4 3.7
Private final consumption expenditure 0.5 2.7 -0.9 -0.5Government final consumption expenditure 0.1 2.2 -0.2 0.1Gross fixed capital formation 1.1 -5.7 -3.0 1.3Changes in inventories 1.4 4.0 -2.3 -1.1Domestic demand 3.1 3.2 -6.4 -0.1Exports of goods & services 3.0 0.9 -7.6 14.7Imports of goods & services -1.7 1.1 10.6 -11.0Net exports 1.3 2.0 3.0 3.7Gross domestic product 4.4 5.3 -3.4 3.7Source: NSO.
Table 3.1GROSS DOMESTIC PRODUCT AT CONSTANT PRICES
Annual percentage changes
Percentage point contributions

38
CENTRAL BANK OF MALTA Annual Report 2010
An increase of 17.2% in exports of goods and services followed a sharp drop in 2009, with the annual rate of growth moderating progressively from one quarter to the next. Nominal data indicate that the tourism and manufacturing sectors accounted for most of the gain, with the electronics, food and chemicals sub-sectors registering significant additions.
Imports also rose sharply, adding 12.6% during the year as a whole. Nominal trade data suggest that industrial supplies, fuel and capital goods, in that order, accounted for most of the increase. Imports of consumer goods, on the other hand, were only 1.2% higher on a year earlier.
Accordingly, with exports rising faster than imports, net exports contributed positively to economic activity, add-ing 3.7 percentage points to GDP growth (see Chart 3.2 and Table 3.1). The contribution of net exports was positive in all quarters.
Gross value addedAn analysis of the income side of the GDP shows that GVA rose by 7.3% in nominal terms. This was mainly driven by a 21.1% increase in oper-ating surplus, which recovered after having contracted in the previous year, and, to a lesser extent, by a rise of 0.5% in employee compen-sation.
-20
-15
-10
-5
0
5
10
15
20
25
30
Q12007
Q2 Q3 Q4 Q12008
Q2 Q3 Q4 Q12009
Q2 Q3 Q4 Q12010
Q2 Q3 Q4
Gross value added Employment income Operating surplus
Chart 3.3GROSS VALUE ADDED, EMPLOYMENT INCOME AND OPERATING SURPLUS(annual percentage changes)
Source: NSO.
Table 3.2
Percentage points
2007 2008 2009 2010Agriculture, hunting & forestry -0.1 0.0 0.2 0.0Manufacturing 1.1 1.0 -2.2 0.9Electricity, gas & water supply 0.1 -0.3 0.6 0.7Construction 0.1 0.6 -0.4 0.0Wholesale & retail trade 0.5 0.2 -0.8 0.2Hotels & restaurants 0.3 0.3 -0.5 0.4Transport, storage & communication 0.6 0.3 -0.8 0.1Financial intermediation -0.6 0.0 1.4 2.2Real estate, renting & business activities 1.4 1.4 0.9 0.7Public administration 0.4 0.3 0.3 0.0Education 0.2 0.3 0.2 0.4Health & social work 0.3 0.6 0.4 0.4Other community, social & personal services 2.7 3.6 -0.7 0.3Other (1 ) 0.1 -0.3 0.0 0.0Gross value added 7.0 8.0 -1.5 6.4Net taxation on products 0.8 0.1 0.6 0.4Annual nominal GDP growth (%) 7.8 8.1 -0.9 6.8
Source: NSO.
CONTRIBUTION OF SECTORAL GROSS VALUE ADDED TO NOMINAL GDP GROWTH
(1) Includes fishing, mining & quarrying and private households with employed persons.

39
CENTRAL BANK OF MALTA Annual Report 2010
GVA was higher in 2010 across most sectors of the economy. However, a closer look at the data reveals that this expansion partly reflected a rebound after the 2009 contraction. Moreover, in some sectors, includ-ing agriculture and construction, GVA declined marginally from 2009 levels, such that their impact on overall GDP growth was negative.
The manufacturing sector contributed positively to growth. GVA in this sector expanded by 8.0%, adding 0.9 percentage points to nominal GDP growth. Given the decline recorded in 2009, however, GVA remained around 9% below the corresponding level of 2008.
GVA in the electricity, gas & water supply sector also expanded strongly, adding a further 0.7 percentage points to growth. The increase in electricity tariffs at the beginning of the year boosted the value of output, which rose faster than the sector’s intermediate consumption.
Within the services sector, the wholesale & retail and transport sectors made 0.2 and 0.1 percentage point contributions to nominal GDP growth, respectively. In the hotels & restaurants sector, GVA expanded by 11.5%, adding 0.4 percentage points to growth, with the hotel industry being the main contributor. Both arriv-als and expenditure increased robustly but, as in manufacturing, following the sharp fall in the previous year, the GVA of this sector also remained below its 2008 level.
The fastest growing sector in services was financial intermediation, where GVA expanded robustly for the second year in a row, going up by 45.6%. The sector contributed 2.2 percentage points to nominal GDP growth. The annual rate of increase in GVA was particularly strong in the first half of the year, as lower inter-est costs boosted the sector’s profitability.
GVA in the real estate, renting and business activities sector also grew strongly, by 4.6%, adding 0.7 per-centage points to growth. The “other business activities” segment – which includes legal, accounting and other professional services – was the main driver behind the sector’s expansion, although real estate activity segment also contributed significantly.
Education, health & social work and other community, social & personal services also expanded, each con-tributing between 0.3 and 0.4 percentage points to nominal GDP growth. Within services, public administra-tion recorded the smallest annual increase in nominal GVA. As a result, it made a negligible contribution to growth in 2010.
Industrial production3 The improvement in GVA in the manufacturing sector during 2010 is reflected in an increase in statistics on industrial production, which show a partial recovery from the losses posted in the previous two years. Total industrial production registered an average annual growth rate of 6.6% in volume terms (see Table 3.3). Manufacturing, which constitutes just over nine-tenths of total industrial production, was the only source of expansion, with production expanding by 7.6% on the previous year. In turn, this followed a drop of 15.6% in 2009 and a smaller decrease in 2008. In contrast, production levels declined in both the energy and quarry-ing sectors. In particular, the volume produced by the energy sector fell by 2.4% on a year earlier. This was a smaller fall than that recorded in 2009.
Industrial production data, while exhibiting a high degree of volatility, provide further insight into develop-ments across various sub-sectors of manufacturing in particular. Production of semiconductors (included under computer, electronic & optical products in Table 3.3), rubber & plastic products, pharmaceuticals and textiles all reported a strong recovery. In contrast, production in other large sub-sectors, such as wearing apparel and repair & installation of machinery and equipment, fell during the year but at a slower pace than in 2009. In addition, food production, which makes up approximately a tenth of the total, declined further in 2010, falling by 11.6% over the previous year.
3 Industrial production data are based on a sample of firms engaged in quarrying, manufacturing and energy production. The share of these activities in total industrial production is estimated at 0.6%, 91.4% and 8.0%, respectively.

40
CENTRAL BANK OF MALTA Annual Report 2010
The recovery in manufacturing was also reflected in a pick-up in statistics on orders. After having declined in the previous two years, new orders expanded strongly in 2010, rising by 21.6% on a year earlier. This was also in line with the positive sentiment expressed by manufacturing firms in periodic business expectations surveys throughout the year (see Box 1).
Data on sales, employment and wages similarly point to an upturn in manufacturing activity.4 In fact, sales increased by an average of 14.2% during 2010, after having contracted for three consecutive years. The growth in sales was driven entirely by exports, which rose by 21.0%, as domestic sales fell by 1.7%. Con-sequently, the pace of the ongoing job losses in the sector slowed down in 2010. Although the reduction in employment lowered the manufacturing sector’s overall wage bill, compensation per employee increased by 1.1%. This rise, although moderate when compared with recent years, followed a decline of 3.1% in 2009.
TourismDuring 2010 the Maltese tourism industry recovered from the downturn observed since mid-2008, with a substantial increase in both arrivals and expenditures.
Overall, tourist arrivals increased by 12.7% during 2010, reversing the drop of 8.4% in the previous year and reaching the highest level since survey inception.5 The recovery was especially strong between May and October, following a marginal decline in April when air transport in Europe was disrupted by a cloud of volcanic ash.
The recovery during 2010 was stronger than that observed in the Southern/Mediterranean Europe region, where tourist arrivals were, on average, 2.2% higher than in 2009, in parallel with the contraction
4 Eurostat statistics on industrial sales, employment and wages & salaries are compiled from a representative sample of approximately 400 enterprises, which is then grossed up to represent the entire industrial population. 5 The NSO introduced a survey of inbound tourists in April 2004.
INDUSTRIAL PRODUCTION Percentages; annual average percentage changes
Shares 2008 2009 2010Industrial production 100.0 -7.5 -14.8 6.6
Manufacturing 91.4 -7.8 -15.6 7.6Of which:Computer, electronic & optical products 18.5 -7.2 -16.0 27.8Food products 10.2 6.1 -5.5 -11.6Wearing apparel 6.5 -8.9 -30.2 -12.3Rubber & plastic products 6.2 -3.6 -26.5 17.3Basic pharmaceutical products & pharmaceutical preparations 5.5 -44.8 -8.3 17.7Textiles 5.2 2.0 -1.8 37.2Repair & installation of machinery and equipment 5.0 -22.7 -39.4 -16.6Beverages 4.6 -5.1 -8.4 1.0
Energy 8.0 -0.8 -4.8 -2.4Electricity, gas, steam & air conditioning supply 7.4 -0.9 -4.8 -2.5Water collection, treatment and supply 0.6 0.0 -5.1 -1.6
Mining and quarrying 0.6 -35.9 -5.0 -23.3Sources: NSO and Eurostat.
Table 3.3
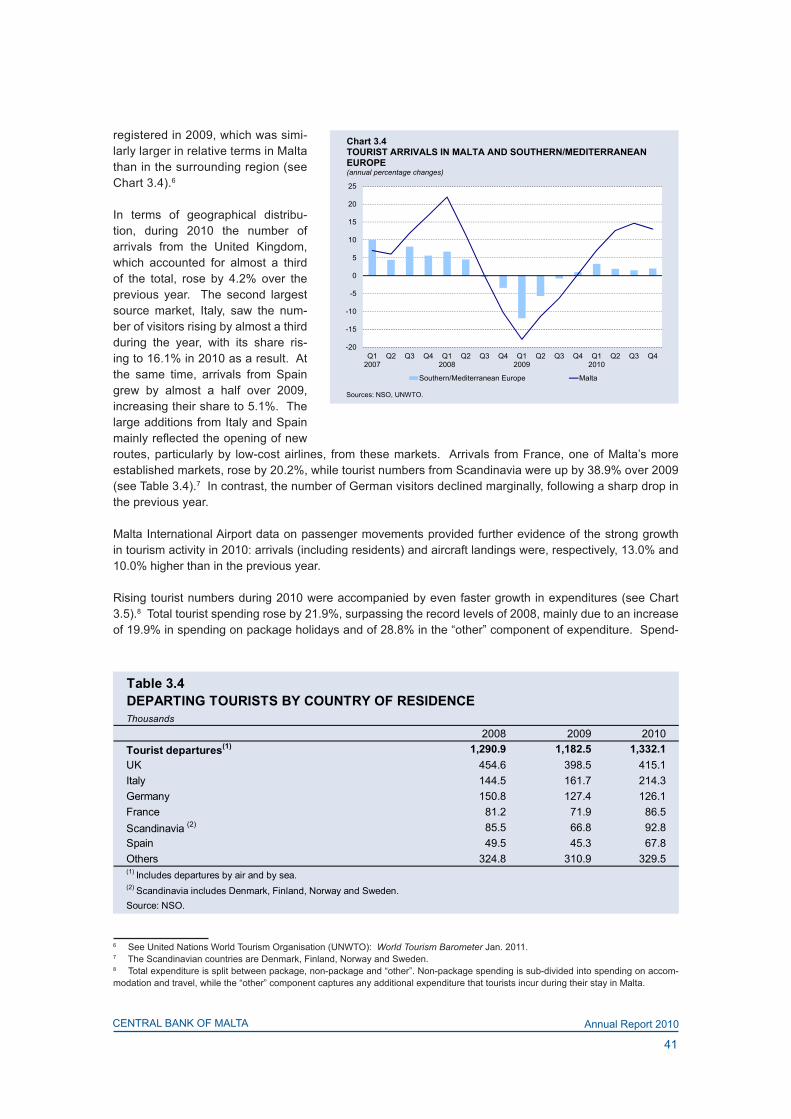
41
CENTRAL BANK OF MALTA Annual Report 2010
registered in 2009, which was simi-larly larger in relative terms in Malta than in the surrounding region (see Chart 3.4).6
In terms of geographical distribu-tion, during 2010 the number of arrivals from the United Kingdom, which accounted for almost a third of the total, rose by 4.2% over the previous year. The second largest source market, Italy, saw the num-ber of visitors rising by almost a third during the year, with its share ris-ing to 16.1% in 2010 as a result. At the same time, arrivals from Spain grew by almost a half over 2009, increasing their share to 5.1%. The large additions from Italy and Spain mainly reflected the opening of new routes, particularly by low-cost airlines, from these markets. Arrivals from France, one of Malta’s more established markets, rose by 20.2%, while tourist numbers from Scandinavia were up by 38.9% over 2009 (see Table 3.4).7 In contrast, the number of German visitors declined marginally, following a sharp drop in the previous year.
Malta International Airport data on passenger movements provided further evidence of the strong growth in tourism activity in 2010: arrivals (including residents) and aircraft landings were, respectively, 13.0% and 10.0% higher than in the previous year.
Rising tourist numbers during 2010 were accompanied by even faster growth in expenditures (see Chart 3.5).8 Total tourist spending rose by 21.9%, surpassing the record levels of 2008, mainly due to an increase of 19.9% in spending on package holidays and of 28.8% in the “other” component of expenditure. Spend-
6 See United Nations World Tourism Organisation (UNWTO): World Tourism Barometer Jan. 2011.7 The Scandinavian countries are Denmark, Finland, Norway and Sweden. 8 Total expenditure is split between package, non-package and “other”. Non-package spending is sub-divided into spending on accom-modation and travel, while the “other” component captures any additional expenditure that tourists incur during their stay in Malta.
-20
-15
-10
-5
0
5
10
15
20
25
Q12007
Q2 Q3 Q4 Q12008
Q2 Q3 Q4 Q12009
Q2 Q3 Q4 Q12010
Q2 Q3 Q4
Southern/Mediterranean Europe Malta
Chart 3.4TOURIST ARRIVALS IN MALTA AND SOUTHERN/MEDITERRANEAN EUROPE(annual percentage changes)
Sources: NSO, UNWTO.
Table 3.4
Thousands2008 2009 2010
Tourist departures(1) 1,290.9 1,182.5 1,332.1UK 454.6 398.5 415.1Italy 144.5 161.7 214.3Germany 150.8 127.4 126.1France 81.2 71.9 86.5Scandinavia (2) 85.5 66.8 92.8Spain 49.5 45.3 67.8Others 324.8 310.9 329.5(1) Includes departures by air and by sea.(2) Scandinavia includes Denmark, Finland, Norway and Sweden.Source: NSO.
DEPARTING TOURISTS BY COUNTRY OF RESIDENCE

42
CENTRAL BANK OF MALTA Annual Report 2010
ing on non-package holidays, which is split between accommodation and travel, rose by 15.8%, with the bulk of the increase coming from spend-ing on accommodation.
Higher accommodation income was partly attributable to the increase of 11.8% in the number of nights stayed, slightly below the growth in tourist numbers. This implied a reduction in the average length of stay from 8.4 nights in 2009 to 8.3 in 2010.
An industry survey covering the first three quarters of 2010 also reported more guest nights and additional income from accommodation, partly driven by rising room rates, over the corresponding period of 2009.9 This, in turn, generated higher gross operating profits. According to the survey, 5-star hotels reported the fastest rise in average achieved room rates, while the increase in rates at 4 and 3-star hotels was more contained. These developments corroborated, to some extent, changes in the related components of the HICP, which showed an average annual increase of 22.2% in accommodation prices during 2010, particularly in the summer.
Given an almost unchanged supply of beds available, the increase in nights stayed during the year translated into improved occupancy rates across all hotel categories. NSO data indicate that overall hotel occupancy rates in 2010 rose by 6.3 percentage points compared with a year earlier, to 55.5%. In particular, those in 4 and 3-star hotels each rose by 6.9 percentage points, partly reversing the sharp drops in 2009 (see Chart 3.6). The 4-star category registered the highest overall occupancy rate at 64.6%. Occupancy at 5-star hotels, which account for almost a quarter of the total hotel bed stock, was up by 5.4 percentage points over 2009, to 56.0%. On the other hand, occupancy in the “other” cat-egory fell slightly.10 These data are largely supported by findings of the industry survey referred to earlier, which indicated improved occupancy in all hotel categories, with the larg-est rise at 3-star hotels and the high-est occupancy rates at 4-star hotels.
Cruise passenger arrivals, too, ben-efitted from the recovery from the global economic downturn. Cruise passenger traffic increased by 13.0% to just below 475,000. The number of port calls by cruise ships, at 275,
9 See BOV MHRA Survey – Q3 2010. 10 The “other” category consists of guesthouses, holiday complexes and hostels.
15
20
25
30
35
40
45
50
55
60
65
70
5-Star 4-Star 3-Star 2-Star Other
2007 2008 2009 2010
Chart 3.6AVERAGE OCCUPANCY RATES (per cent)
Source: NSO.
(1) Includes guesthouses, hostels & holiday complexes.
(1)
-35-30-25-20-15-10-505
101520253035
J2008
M M J S N J2009
M M J S N J2010
M M J S N
Nights stayed Expenditure
Chart 3.5TOURISM INDICATORS (annual percentage changes)
Source: NSO.
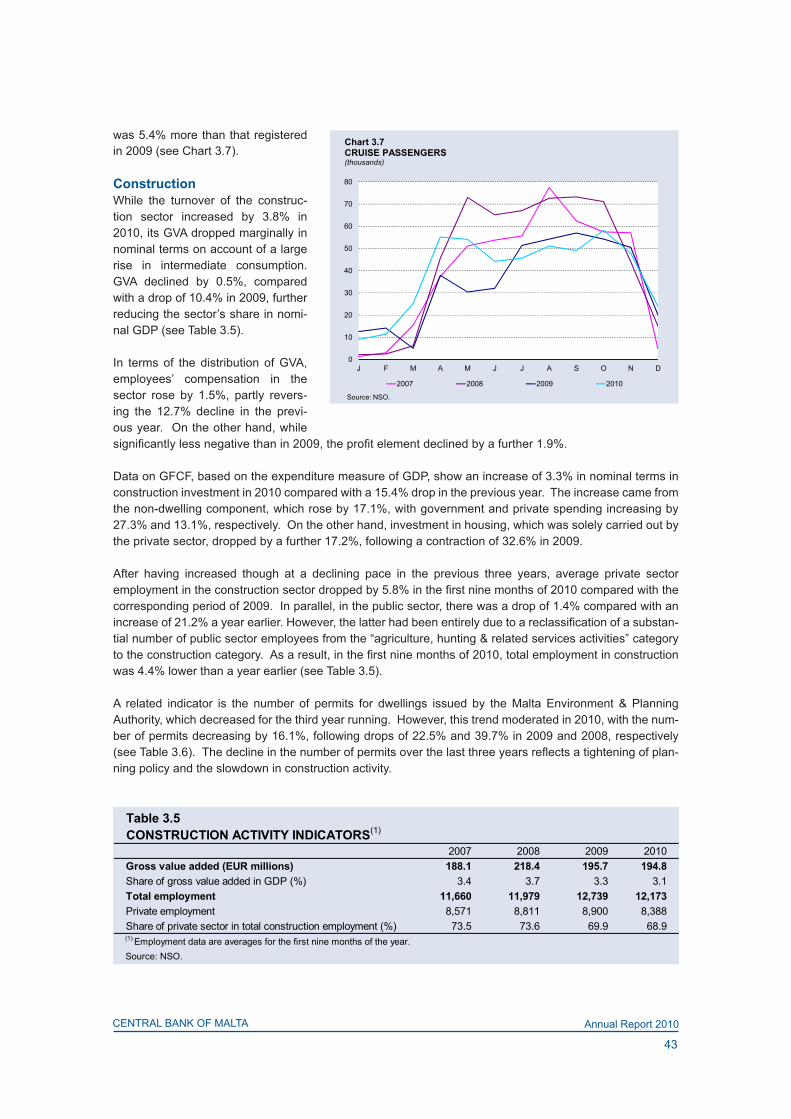
43
CENTRAL BANK OF MALTA Annual Report 2010
was 5.4% more than that registered in 2009 (see Chart 3.7).
Construction While the turnover of the construc-tion sector increased by 3.8% in 2010, its GVA dropped marginally in nominal terms on account of a large rise in intermediate consumption. GVA declined by 0.5%, compared with a drop of 10.4% in 2009, further reducing the sector’s share in nomi-nal GDP (see Table 3.5).
In terms of the distribution of GVA, employees’ compensation in the sector rose by 1.5%, partly revers-ing the 12.7% decline in the previ-ous year. On the other hand, while significantly less negative than in 2009, the profit element declined by a further 1.9%. Data on GFCF, based on the expenditure measure of GDP, show an increase of 3.3% in nominal terms in construction investment in 2010 compared with a 15.4% drop in the previous year. The increase came from the non-dwelling component, which rose by 17.1%, with government and private spending increasing by 27.3% and 13.1%, respectively. On the other hand, investment in housing, which was solely carried out by the private sector, dropped by a further 17.2%, following a contraction of 32.6% in 2009.
After having increased though at a declining pace in the previous three years, average private sector employment in the construction sector dropped by 5.8% in the first nine months of 2010 compared with the corresponding period of 2009. In parallel, in the public sector, there was a drop of 1.4% compared with an increase of 21.2% a year earlier. However, the latter had been entirely due to a reclassification of a substan-tial number of public sector employees from the “agriculture, hunting & related services activities” category to the construction category. As a result, in the first nine months of 2010, total employment in construction was 4.4% lower than a year earlier (see Table 3.5).
A related indicator is the number of permits for dwellings issued by the Malta Environment & Planning Authority, which decreased for the third year running. However, this trend moderated in 2010, with the num-ber of permits decreasing by 16.1%, following drops of 22.5% and 39.7% in 2009 and 2008, respectively (see Table 3.6). The decline in the number of permits over the last three years reflects a tightening of plan-ning policy and the slowdown in construction activity.
0
10
20
30
40
50
60
70
80
J F M A M J J A S O N D
2007 2008 2009 2010
Chart 3.7CRUISE PASSENGERS(thousands)
Source: NSO.
Table 3.5
2007 2008 2009 2010Gross value added (EUR millions) 188.1 218.4 195.7 194.8Share of gross value added in GDP (%) 3.4 3.7 3.3 3.1Total employment 11,660 11,979 12,739 12,173Private employment 8,571 8,811 8,900 8,388Share of private sector in total construction employment (%) 73.5 73.6 69.9 68.9
Source: NSO.
CONSTRUCTION ACTIVITY INDICATORS(1)
(1) Employment data are averages for the first nine months of the year.

44
CENTRAL BANK OF MALTA Annual Report 2010
Permits for the largest residential category, apartments, which account for more than four-fifths of the total issued, fell by 19.1% in 2010. Moreover, permits for the construction of maisonettes, the second largest cat-egory, dropped by 6.3%. However, permits for the construction of ter-raced houses and the “other” cate-gory increased by almost 24.7% and 6.0%, respectively, although from a low base.
Residential property prices11
The Bank’s index of advertised resi-dential property prices increased by 1.1% on average in 2010, after hav-ing fallen by 2.7% and 5.0% in 2008 and 2009, respectively. From the trough reached in the first quarter of 2009, property price inflation fol-lowed a generally upward path to a peak of 4.5% in the first quarter of 2010 (see Chart 3.8). It then mod-erated in the following two quarters, before turning negative in the fourth quarter, when the Bank’s index was 2.0% lower on a year-on-year basis.
The rise in property prices over the year as a whole was due to higher asking prices for apartments and for dwellings in the “other” category, which consists of town houses, hous-es of character and villas (see Chart 3.9). Prices of apartments, both fin-ished and in shell form, which together made up 57% of the sampled proper-ties, were up by an average of 2.6% over 2009, and contributed about 0.8 percentage points to overall prop-erty price inflation during 2010. The “other” category, which accounts for
11 This analysis of property price movements is based on the Central Bank of Malta’s residential property price index, which tracks movements in advertised residential property prices compiled from newspaper advertisements sampled each month. The NSO publishes a separate quarterly index based on monthly information obtained from contracts of sale registered with the Inland Revenue Department. The Bank’s index is divided into eight dwelling categories, while properties are sorted into three categories in the NSO statistics. The latest data available from the NSO relate to the first quarter of 2010.
Table 3.6
2007 2008 2009 2010Flats 10,252 6,184 4,616 3,736Maisonettes 696 361 400 375Terraced houses 257 164 182 227Other 138 127 100 106Total 11,343 6,836 5,298 4,444Source: Malta Environment & Planning Authority.
PERMITS ISSUED FOR THE CONSTRUCTION OF DWELLING UNITS BY TYPE
-12
-10
-8
-6
-4
-2
0
2
4
6
Q12007
Q2 Q3 Q4 Q12008
Q2 Q3 Q4 Q12009
Q2 Q3 Q4 Q12010
Q2 Q3 Q4
Chart 3.8RESIDENTIAL PROPERTY PRICE INFLATION(1)
(annual percentage change)
Source: Central Bank of Malta.
(1) Based on advertised prices.
-15
-10
-5
0
5
10
15
20
25
Q12007
Q2 Q3 Q4 Q12008
Q2 Q3 Q4 Q12009
Q2 Q3 Q4 Q12010
Q2 Q3 Q4
Apartments Maisonettes Terraced houses Other
Chart 3.9RESIDENTIAL PROPERTY PRICES BY CATEGORY(annual percentage changes)
Source: Central Bank of Malta.
(1)(1)
(1) Includes both units in shell form and finished units.
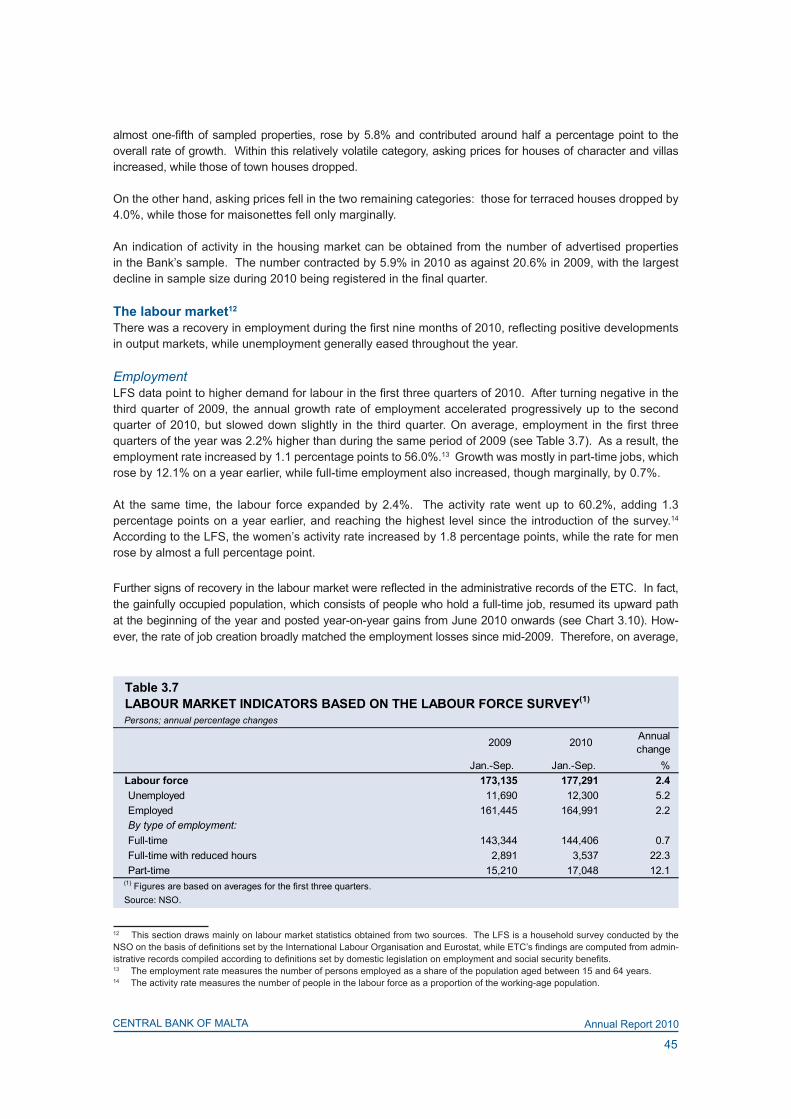
45
CENTRAL BANK OF MALTA Annual Report 2010
almost one-fifth of sampled properties, rose by 5.8% and contributed around half a percentage point to the overall rate of growth. Within this relatively volatile category, asking prices for houses of character and villas increased, while those of town houses dropped.
On the other hand, asking prices fell in the two remaining categories: those for terraced houses dropped by 4.0%, while those for maisonettes fell only marginally.
An indication of activity in the housing market can be obtained from the number of advertised properties in the Bank’s sample. The number contracted by 5.9% in 2010 as against 20.6% in 2009, with the largest decline in sample size during 2010 being registered in the final quarter.
The labour market12
There was a recovery in employment during the first nine months of 2010, reflecting positive developments in output markets, while unemployment generally eased throughout the year.
EmploymentLFS data point to higher demand for labour in the first three quarters of 2010. After turning negative in the third quarter of 2009, the annual growth rate of employment accelerated progressively up to the second quarter of 2010, but slowed down slightly in the third quarter. On average, employment in the first three quarters of the year was 2.2% higher than during the same period of 2009 (see Table 3.7). As a result, the employment rate increased by 1.1 percentage points to 56.0%.13 Growth was mostly in part-time jobs, which rose by 12.1% on a year earlier, while full-time employment also increased, though marginally, by 0.7%.
At the same time, the labour force expanded by 2.4%. The activity rate went up to 60.2%, adding 1.3 percentage points on a year earlier, and reaching the highest level since the introduction of the survey.14 According to the LFS, the women’s activity rate increased by 1.8 percentage points, while the rate for men rose by almost a full percentage point.
Further signs of recovery in the labour market were reflected in the administrative records of the ETC. In fact, the gainfully occupied population, which consists of people who hold a full-time job, resumed its upward path at the beginning of the year and posted year-on-year gains from June 2010 onwards (see Chart 3.10). How-ever, the rate of job creation broadly matched the employment losses since mid-2009. Therefore, on average,
12 This section draws mainly on labour market statistics obtained from two sources. The LFS is a household survey conducted by the NSO on the basis of definitions set by the International Labour Organisation and Eurostat, while ETC’s findings are computed from admin-istrative records compiled according to definitions set by domestic legislation on employment and social security benefits.13 The employment rate measures the number of persons employed as a share of the population aged between 15 and 64 years. 14 The activity rate measures the number of people in the labour force as a proportion of the working-age population.
LABOUR MARKET INDICATORS BASED ON THE LABOUR FORCE SURVEY(1)
Persons; annual percentage changes
Jan.-Sep. Jan.-Sep. %Labour force 173,135 177,291 2.4Unemployed 11,690 12,300 5.2Employed 161,445 164,991 2.2By type of employment:Full-time 143,344 144,406 0.7Full-time with reduced hours 2,891 3,537 22.3Part-time 15,210 17,048 12.1
(1) Figures are based on averages for the first three quarters.
Table 3.7
2009 2010 Annual change
Source: NSO.

46
CENTRAL BANK OF MALTA Annual Report 2010
full-time employment remained almost unchanged in both the private and public sector compared with the first nine months of 2009 (see Table 3.8).
Full-time jobs in the private sector increased by 0.2%, whereas public sector employment contracted by 0.4% compared with the correspond-ing period of 2009.
The increase in full-time private sec-tor employment reflected job creation in market services. Within the latter category, the largest gains were recorded in “other business activi-ties”. While this category comprises a broad range of business and pro-fessional services, the areas that recorded the largest increases included accountancy and security services. These gains pushed up employ-ment in the real estate, renting and business activities sector by 7.5%. In contrast, employment in the hotels & restaurants category declined by 3.4% over the same period of 2009, but there were signs that the decline was bottoming out as the tourism industry recovered. Other significant job losses occurred in postage & telecommunication, captured under transport, storage & communication, which fell by 3.2%.
135,000
137,500
140,000
142,500
145,000
147,500
150,000
-2,000
-1,000
0
1,000
2,000
3,000
4,000
J2008
M M J S N J2009
M M J S N J2010
M M J S
Annual changes Gainfully occupied population (right scale)
Chart 3.10GAINFULLY OCCUPIED POPULATION BASED ON ETC RECORDS(annual changes; persons)
Source: NSO.
Table 3.8
Persons; annual percentage changes
2009 2010 Annual change
Jan.- Sep. Jan.- Sep. %Labour supply 152,512 152,379 -0.1Registered unemployed(2) 7,267 7,186 -1.1Gainfully occupied 145,245 145,193 0.0 Public sector 40,578 40,417 -0.4 Private sector 103,961 104,144 0.2
Private direct production(3) 32,165 31,404 -2.4 Manufacturing 20,629 20,464 -0.8 Construction 8,900 8,388 -5.8
Private market services 71,797 72,740 1.3 Wholesale & retail 22,096 22,139 0.2 Hotels & restaurants 9,734 9,406 -3.4 Transport, storage & communication 9,265 8,973 -3.2 Financial intermediation 5,200 5,211 0.2 Real estate, renting & business activities 13,167 14,160 7.5
Other 12,335 12,851 4.2Temporary employed 706 632 -10.5Part-time employees 48,276 50,876 5.4
Part-time as a primary job 27,205 28,861 6.1 Part-time holding a full-time job 21,071 22,015 4.5
(1) Figures are based on averages for the first nine months.
(3) This also includes employment in agriculture, fishing, mining & quarrying and electricity, gas & water supply.Source: NSO.
LABOUR MARKET INDICATORS BASED ON ADMINISTRATIVE RECORDS(1)
(2) Statistics for all of 2010 are available for the number of registered unemployed. The average number declined by 3.8% between 2009 and 2010.

47
CENTRAL BANK OF MALTA Annual Report 2010
Meanwhile, employment in direct production was down by 2.4%, mainly reflecting job shedding in the con-struction industry. Manufacturing employment stabilised in line with the higher level of industrial production registered in 2010.
ETC data also show that while full-time employment remained almost unchanged, part-time workers contin-ued to increase steadily. The latter rose by 5.4% on a year earlier, with almost two-thirds declaring part-time employment as their only job.
UnemploymentAfter having increased in 2009, the number of job seekers registered with the ETC declined almost uninter-ruptedly throughout the year, reflecting gains in employment. It fell by an average of 3.8% during 2010 as a whole (see Chart 3.11).
The number of registered unemployed decreased across all age brackets except in the over 45-year cat-egory, where it remained almost unchanged. In terms of duration of registration, short-term unemployment declined on a year earlier, while long-term unemployment increased. How-ever, the rate of growth in the latter slowed down and turned negative as the year progressed.
A further positive development was the rise in vacancies and placements in 2010. In fact, during the first half of the year vacancies registered with the ETC increased by 843, or 23%, on a year earlier, after having fallen by around 35% in 2009. Furthermore, a total of 1,874 persons, up by 19% over the previous year, were placed in employment during the year.
In contrast, LFS data, which record-ed a substantial expansion in the labour force in the first nine months of 2010, also show an increase in unemployment (see Table 3.8). The corresponding unemployment rate averaged 6.9%, or 0.2 percentage points above the level recorded in the same period of 2009. In line with other indicators, the unemployment rate obtained from LFS data also declined as the year progressed.
Over the year as a whole, on a sea-sonally-adjusted basis, Eurostat data show the unemployment rate fol-lowing a downward path (see Chart 3.12). This measure of unemploy-ment averaged 6.7% in 2010, 0.3 percentage points below the previ-ous year’s level, though still above the 2008 average.
5,000
5,500
6,000
6,500
7,000
7,500
8,000
8,500
-1,500
-1,000
-500
0
500
1,000
1,500
2,000
J2008
M M J S N J2009
M M J S N J2010
M M J S N
Annual changes Registered unemployed (right scale)
Chart 3.11REGISTERED UNEMPLOYED(annual changes; persons)
Source: NSO.
5.0
5.5
6.0
6.5
7.0
7.5
J2008
M M J S N J2009
M M J S N J2010
M M J S N
Chart 3.12UNEMPLOYMENT RATE(seasonally adjusted; percent)
Source: Eurostat.

48
CENTRAL BANK OF MALTA Annual Report 2010
Consumer prices
HICP15 After having followed a mostly down-ward path during 2009, annual HICP inflation turned positive at the start of 2010 and accelerated as it pro-gressed, reaching 4.0% in Decem-ber, up from -0.4% a year earlier. As a result, the annual average rate rose to 2.0% in 2010 from 1.8% in the previous year.
Although Malta’s annual inflation rate was below that of the euro area dur-ing the first few months of the year under review, it exceeded it from May onwards (see Chart 3.13). For the year as a whole, Malta’s aver-age inflation rate was 0.4 percentage points higher than that of the entire euro area.
The acceleration in Malta during 2010 was influenced by energy price trends. Whereas falling energy prices had lowered overall inflation during 2009, rising prices were the largest contributor in 2010, adding 1.2 per-centage points to the average inflation rate over the year as a whole (see Table 3.9). Prices of services also had a substantial impact, with a contribution of 0.6 points, marginally less than in the previous year. While their contribution was significantly lower than in 2009, food prices still added 0.3 points to the average inflation rate in 2010, with this share arising solely from processed food items.16 In contrast, unprocessed food had a neutral impact on overall inflation, while the decline in the prices of non-energy industrial goods dampened it marginally.
Energy price inflation in Malta was high and persistent in 2010, reversing the downward movement that occurred in the second half of 2009, and ending the year at an annual rate of 21.7% (see Chart 3.14). Energy price inflation was influenced by an upward revision of electricity tariffs in January, which was partly
15 As from January 2010 the HICP weighting scheme was updated to reflect changes in household consumption patterns. The combined weight of processed and unprocessed food was reduced by about three percentage points to 20.5%. In contrast, shares of non-energy industrial goods and services rose by one point and around two points, respectively to 31.7% and 41.5%. Within the services category, the weights given to restaurants and postal services were halved, while that of air transport doubled. The share allotted to energy remained almost unchanged at 6.3%. 16 The processed food category includes alcohol and tobacco.
-1.5-1.0-0.50.00.51.01.52.02.53.03.54.04.55.05.56.0
J2008
M M J S N J2009
M M J S N J2010
M M J S N
Malta annual change Malta 12-month moving averageEuro area annual change Euro area 12-month moving average
Chart 3.13HICP INFLATION RATES IN MALTA AND THE EURO AREA(annual percentage changes; annual average percentage changes)
Sources: NSO; Eurostat.
Table 3.9CONTRIBUTIONS TO HICP INFLATION (1)
Percentage points
2008 2009 2010Unprocessed food 0.5 0.8 0.0Processed food including alcohol and tobacco 1.0 0.6 0.3Energy 0.9 -0.1 1.2Non-energy industrial goods 0.6 -0.1 -0.1Services (overall index excluding goods) 1.8 0.7 0.6HICP (annual average inflation rate) 4.7 1.8 2.0(1) Totals may not add up due to rounding.

49
CENTRAL BANK OF MALTA Annual Report 2010
based on the projected impact of higher international oil prices on fuel costs over the entire year. More-over, during the course of the year rising oil prices pushed up prices of transport fuels. In addition, gas pric-es increased markedly, though their impact on overall energy prices was small. As a result of these develop-ments, energy prices in Malta rose faster than those in the euro area as a whole, contributing to the diver-gence between the two headline inflation rates. Food prices, which account for just over a fifth of the HICP, registered an annual growth rate of 5.2% in December. Chart 3.14 also outlines the gradual decline in food prices during most of the first six months of the year. These resumed an upward path thereafter. Although domestic and euro area food prices followed a similar path during the year, local food inflation was higher than in the euro area.
The processed and unprocessed food components showed an annual average growth of 2.3% and 0.5%, respectively, in 2010. As can be seen in Chart 3.15, processed food prices rose consistently throughout the year, with milk, cheese & eggs and bread & cereals being the main contributors to food inflation. At the same time, prices of meat and fish & seafood, which are included in the unprocessed food category, also increased while those of fruit and vegetables declined.
Whereas inflation in services, which account for two-fifths of the HICP, remained moderate during the first six months of 2010, prices rose significantly thereafter, ending the year at an annual growth rate of 3.1% (see Chart 3.16). This mainly reflected an acceleration in prices charged for accommodation services and for services related to package holidays. To a large extent, these
-16
-12
-8
-4
0
4
8
12
16
20
24
J2008
M M J S N J2009
M M J S N J2010
M M J S N
Food - Malta Food - Euro area Energy - Malta Energy - Euro area
Chart 3.14FOOD AND ENERGY PRICE INFLATION IN MALTA AND THE EURO AREA(annual percentage changes)
Sources: NSO; Eurostat.
-3-2-10123456789
10
J2008
M M J S N J2009
M M J S N J2010
M M J S N
Processed food including alcohol and tobaccoUnprocessed foodFood including alcohol and tobacco
Source: Eurostat.
Chart 3.15CONTRIBUTIONS TO YEAR-ON-YEAR CHANGES IN FOOD PRICES (percentage points; annual percentage change)
-8
-4
0
4
8
12
16
-4
-2
0
2
4
6
8
J2008
M M J S N J2009
M M J S N J2010
M M J S N
ServicesServices related to package holidays and accommodation (right scale)Communication (right scale)
Chart 3.16INFLATION IN SERVICES (annual percentage changes)
Sources: NSO; Eurostat.

50
CENTRAL BANK OF MALTA Annual Report 2010
developments reflected the upturn in the tourism sector, which resulted in increased room rates. Higher prices were also charged for recreational and sporting activities. On the other hand, the drop in prices of commu-nication services seen in 2009 per-sisted throughout 2010.
RPI and core inflation Although RPI inflation generally moves in line with its HICP coun-terpart, the annual average infla-tion rate as gauged by the former dropped to 1.5% from 2.1% in 2009 even as the corresponding HICP rate rose (see Table 3.10).17 The diver-gence widened during the second half of the year, particularly because of developments in accommodation prices, which are included only in the HICP. Nevertheless, the year-on-year RPI inflation rate climbed to 3.3% in December (see Chart 3.17).
The water, electricity, gas & fuels component remained the main driver of RPI inflation, contributing 0.8 percentage points to the annual average rate. Moreover, the transport & communications category, which includes vehicle fuel, switched from a negative contribution of 0.9 percentage points during 2009 to a posi-tive 0.1 in 2010.18 On the other hand, although food prices also rose, their contribution to RPI inflation fell considerably to 0.2 points, while the clothing & footwear category contributed negatively to overall RPI infla-tion. There was little or no change in the other categories monitored.
17 Diverse patterns in inflation as measured by the HICP and the RPI reflect differences in the methodologies underlying the compilation of the two indices. For instance, whereas RPI weights are based on expenditure by Maltese households, HICP weights also reflect tourist expenditure in Malta. Thus, while the RPI excludes hotel accommodation prices, these have a significant weight in the HICP. The RPI also allocates a larger weight to the food component.18 In the RPI, vehicle fuel prices are included only in the transport & communications component, whereas they form part of the energy component in the HICP.
Table 3.10CONTRIBUTIONS TO RPI INFLATION (1)
Percentage points
Weights 2008 2009 2010Food 21.23 1.9 1.5 0.2Beverages & tobacco 6.09 0.2 0.3 0.1Clothing & footwear 7.41 0.4 0.0 -0.3Housing 7.61 0.3 0.2 0.2Water, electricity, gas & fuels 3.36 0.4 0.4 0.8Household equipment & house maintenance costs 6.59 0.0 0.0 0.0Transport & communications 22.76 0.6 -0.9 0.1Personal care & health 8.57 0.1 0.2 0.2Recreation & culture 9.28 0.1 0.1 0.2Other goods & services 7.10 0.1 0.1 0.1RPI (annual average inflation rate) 100.00 4.3 2.1 1.5(1) Totals may not add up due to rounding.
-1.0-0.50.00.51.01.52.02.53.03.54.04.55.05.56.0
J2008
M M J S N J2009
M M J S N J2010
M M J S N
RPI (year-on-year) RPI (12-month moving average) Core (year-on-year)
Chart 3.17RPI AND CORE INFLATION(annual percentage changes; annual average percentage change)
Sources: Central Bank of Malta estimates; NSO.

51
CENTRAL BANK OF MALTA Annual Report 2010
The annual RPI inflation rate is heavily influenced by a number of relatively volatile components, including food and water & electricity charges.19 Underlying price pressures are tracked in the Bank’s core RPI infla-tion index, which excludes such components. On this basis, the annual rate of underlying inflation rose to a peak of 2.0% in May from 1.7% in December 2009. Subsequently, despite the continuing increase in RPI inflation, core inflation dropped to 0.7% in December 2010.
Costs and competitiveness
Producer prices20
The industrial producer price index (PPI), which measures the prices of goods at the factory gate, is com-monly used to monitor inflationary pressures at production stage. Producer price inflation is usually more volatile than consumer price inflation.
Industrial producer price inflation rose to 5.8% in December 2010 from a negative rate of 8.3% a year earlier. The annual rate of price change was negative in the first quarter of 2010, but then turned positive in April and generally increased until December. As a result, the 12-month moving average rate rose to 1.3% in December 2010 from -1.2% during the previous year (see Chart 3.18).
Turning to the components of the PPI, energy price inflation rose to 22.4% in April 2010 from -10.4% at the end of the previous year, reflecting the tariff increase referred to earlier. It then remained constant for the remainder of 2010. Capital goods inflation turned positive in May and rose gradually to 0.9% in December. Consumer goods inflation also turned positive during the year, reaching a high of 4.8% in August before fluc-tuating within a narrow band during the remaining months, and closing the year at 4.2%. On the other hand, intermediate goods prices fell over the year and continued to have a dampening effect on overall producer price inflation, though to a lesser degree than in 2009.
Labour costsThe available information provides mixed signals on developments in labour costs.
Central Bank of Malta estimates, based on collectively agreed wage settlements, point to a decline in wage inflation to 3.5% in 2010, from 4.1% in 2009 and 4.7% in 2008 (see Table 3.11).21 The overall moderation reflects a slowdown in public sector wages to 4.2% from 7.2% in 2009, when wages in the sector had risen sharply following increases granted to civil servants and to University of
19 The core inflation rate, as measured by the Bank, excludes one-off fluctuations and reflects developments only in those sub-indices of the RPI that show persistent price changes. Currently, these are: housing, durable household goods, personal care & health, transport & communications and clothing & footwear. 20 The Producer Price Index monitors the ex-works sale prices of leading products as reported by a sample of 77 large enterprises ac-counting for over 80% of total industrial turnover. The index covers three areas of economic activity: mining & quarrying, manufacturing and the supply of electricity, gas & water. Products are divided into five main groupings: intermediate goods, capital goods, consumer durables, non-durable consumer goods and energy. In turn, producer prices are divided between export and domestic markets for each of the groupings, with the bulk of the weight given to the export index. The energy category covers the domestic market only, since Malta does not export water or electricity.21 These figures include only unionised work employees covered by collective agreements. Since such employment constitutes less than half of the gainfully occupied population, these estimates may not be representative of developments in the overall economy. Wage esti-mates incorporate cost-of-living adjustments (COLA) but exclude overtime pay, production bonuses and all other allowances and income in kind.
-55
-44
-33
-22
-11
0
11
22
33
44
55
-20
-16
-12
-8
-4
0
4
8
12
16
20
J2007
M M J S N J2008
M M J S N J2009
M M J S N J2010
M M J S N
Total industry (annual average percentage change) Total industryCapital goods Consumer goodsIntermediate goods Energy (right scale)
Chart 3.18INDUSTRIAL PRODUCER PRICE INFLATION(annual percentage changes; annual average percentage change)
Source: NSO.

52
CENTRAL BANK OF MALTA Annual Report 2010
Malta academic staff. Meanwhile, wage growth in the private sector accelerated marginally to 3.3% from 3.1% in the previous year.
National accounts data show overall compensation per employee declining in 2010, falling by 1.7% on a year earlier as against an increase of 2.9% in 2009.22 However, these figures are to be interpreted with cau-tion given that data for 2009 include payments made to shipyard workers under early retirement schemes.
Meanwhile, Labour Force Survey results for the first three quarters, which are subject to a sampling error, revealed an increase in average annual salary per employee of 4.6% in 2010, a further rise on the 2.2% increase registered in the same period of 2009.
External competitivenessTwo major indicators of external competitiveness are the harmonised competitiveness indicator (HCI) and unit labour costs (ULC). During the first half of 2010 both the trade-weighted exchange rate, as measured by the nominal HCI, and its real counterpart extended the downward trend that began towards the end of 2009.23 By June, both indices had fallen to levels last seen in 2006. The subsequent increase in the nominal index is explained by the general appreciation of the euro, whereas the more rapid growth in the real HCI reflects the additional impact of relatively higher inflation in Malta. The rise in both indices was partly reversed by December, so that at year’s end the nominal HCI had depreciated by 5.7% on a year earlier. The real HCI fell by less than its nominal counterpart, dropping by 4.5% because Malta’s inflation rate exceeded the average in its trading partners. The drop in the real HCI still implies an overall improvement in Malta’s external price competitive-ness (see Chart 3.19).
22 Compensation of employees includes overtime payments. 23 The ECB computes and publishes HCI data. A higher (or lower) score in the HCI indicates a deterioration (or improvement) in a country’s international competitiveness. The nominal HCI tracks movements in the country’s exchange rate against the currencies of its main trading partners, while the real HCI incorporates both exchange rate changes and the relative inflation of a country vis-à-vis its main trading partners. In the computation of the indices, exchange rate and price changes are weighted according to the direction of trade in manufactured goods only. Therefore, the HCI should only be considered as a partial measure of Malta’s international competitiveness. Changes in the HCI should be interpreted with caution.
Table 3.11ESTIMATED CHANGE IN AVERAGE NEGOTIATED WAGES (1)
Annual percentage changes
2007 2008 2009 2010Private sector 4.1 4.6 3.1 3.3Public sector 3.6 5.0 7.2 4.2Overall 4.0 4.7 4.1 3.5(1) The average wage is computed as a weighted mean of the minimum average wage and the maximum average wage.Sources: Central Bank of Malta; Department of Employment & Industrial Relations; Ministry of Finance, the Economy and Investment.
96
98
100
102
104
106
108
J2007
M M J S N J2008
M M J S N J2009
M M J S N J2010
M M J S N
Nominal HCI Real HCI
Chart 3.19HARMONISED COMPETITIVENESS INDICATORS(May 2005 = 100)
Source: ECB.

53
CENTRAL BANK OF MALTA Annual Report 2010
Data published by Eurostat show that Malta’s ULC, based on four-quarter moving averages, dropped by 3.2% during 2010, compared with an increase of 6.3% in 2009 (see Chart 3.20). In fact, the gap between the paths followed by its two components, compensation per employee and labour productivity, narrowed (see Chart 3.21).24 The former declined by 1.7%, as men-tioned earlier, while labour productiv-ity increased by 1.4% over 2009. The productivity increase reflected buoy-ant GDP growth that was accompa-nied by a smaller relative increase in employment. As Chart 3.20 shows, however, although the difference between ULCs in Malta and the euro area diminished during 2010, domestic ULCs have increased more rapidly than the area-wide average since 2000.
Economic projections for 2011 and 2012After having rebounded strongly in 2010, real GDP growth is projected to ease in 2011, before picking up again in 2012. In both years growth is expected to be driven mainly by final domestic demand, though net exports are also set to contribute positively. The Bank projects infla-tion to rise in 2011, reflecting higher price pressures across most com-ponents, before stabilising in 2012. The projected GDP growth and infla-tion rates for 2011 have been revised upwards since the Bank’s previous projections.25
AssumptionsIn preparing these forecasts, a number of assumptions have been made about key international indicators such as exchange rates, oil prices, interest rate spreads and external demand conditions.
More specifically, the exchange rates of the US dollar and the pound sterling against the euro are assumed to remain constant at their mid-February 2011 levels of USD1.37 and GBP0.85 per euro, respectively, throughout the forecast horizon. The average price of oil is expected to rise from about USD80 per barrel in 2010 to USD101.3 in 2011 and to above USD102 in 2012. Spreads between long-term bond yields in Malta and the euro area are assumed to remain constant throughout the projection horizon.
24 Unit labour costs capture the labour costs of producing a unit of output. They are measured as the ratio of the nominal compensation per employee and labour productivity. The latter is defined as real GDP per person in employment. A drop in the ULC indicates an im-provement in competitiveness. Unless otherwise indicated, ULC and their components are measured on the basis of a four-quarter moving average to dampen volatility in the data.25 These projections were published in the Quarterly Review 2010:4 pp. 58-61.
95
100
105
110
115
120
125
130
135
Q42000
Q22001
Q4 Q22002
Q4 Q22003
Q4 Q22004
Q4 Q22005
Q4 Q22006
Q4 Q22007
Q4 Q22008
Q4 Q22009
Q4 Q22010
Q4
Malta Euro area
Chart 3.20UNIT LABOUR COSTS IN MALTA AND IN THE EURO AREA(four-quarter moving average indices; 2000 Q4 = 100)
Sources: ECB; Eurostat.
95
100
105
110
115
120
125
130
135
140
Q42000
Q22001
Q4 Q22002
Q4 Q22003
Q4 Q22004
Q4 Q22005
Q4 Q22006
Q4 Q22007
Q4 Q22008
Q4 Q22009
Q4 Q22010
Q4
Compensation per employee Labour productivity
Chart 3.21COMPENSATION AND PRODUCTIVITY IN MALTA(four-quarter moving average indices; 2000 Q4 = 100)
Source: Eurostat, Central Bank of Malta estimates.

54
CENTRAL BANK OF MALTA Annual Report 2010
Demand conditions in Malta’s main trading partners are expected to continue to improve in 2011, with private consumption strengthening from the low levels registered in 2010.26 On the basis of projections prepared by other institutions, it is assumed that external trade growth in the larger euro area countries, in the United Kingdom and in the United States will slow down slightly in 2011, partly reflecting base effects following the rapid improvement in 2010. In 2012 economic growth in these countries is generally expected to gain more traction, with private consumption expected to pick up further. Euro area imports are set to continue growing at virtually unchanged rates compared with 2011, while the external trade of the United Kingdom and United States is expected to grow at marginally higher rates than in the previous year.
Consumer price inflation in Malta’s main trading partners is projected to pick up in 2011 before slowing down slightly in 2012. Export prices of these countries in 2011 and 2012 are seen to increase at a slower pace compared with the rates registered in 2010.
Economic growthAfter having rebounded to 3.7% in 2010 driven by exports, real GDP growth is projected to ease to 2.5% in 2011, before picking up to 2.9% in 2012 (see Table 3.12). In both years growth is expected to be pro-pelled mainly by final domestic demand, though both net exports and inventories are also set to contribute positively.
Investment spending is likely to be the most important driver of final domestic demand in both years spanned by the projections. After having contracted significantly during the previous two years, GFCF rebounded in 2010, and is expected to continue expanding. In 2011 GFCF is projected to grow by 6.7%, boosted by a strong rise in government investment and, to a lesser extent, an increase in non-dwelling investment. On the other hand, investment in dwellings is expected to continue to fall, although at a more moderate pace.
GFCF growth is projected to accelerate to 7.3% in 2012, when stronger growth in private investment is expected to outweigh a slowdown in government investment. More specifically, the slight acceleration in export growth is set to push up non-dwelling investment, while activity in the housing market is anticipated to recover, leading to a moderate rise in dwelling investment.
Private consumption is expected to increase moderately following the small drop in 2010, largely as a result of a more favourable labour market outlook and related developments in disposable income. Thus, private consumption is projected to rise by 1.0% in 2011 and by 1.6% in the following year. This relatively modest pick-up over the forecast horizon principally reflects the absence of strong growth in employee compensa-tion in real terms.
Public consumption is expected to remain subdued over the forecast horizon. In 2011, it is projected to remain at its 2010 level, reflecting the Government’s commitment to reduce the fiscal deficit below 3% of GDP in that year. In 2012, public consumption growth is expected to rise only marginally to 0.1%, in line with the continued pursuit of expenditure restraint.
Export growth is projected to moderate to 5.0% in 2011 from the high rate recorded in 2010 that, in turn, largely reflected a recovery from the previous year. The rise in exports in 2011 is in line with developments in import demand foreseen in Malta’s main trading partners. Exports are seen as rising across manufacturing, tourism and other service industries.
In 2012 export growth is projected to edge up slightly to 5.3%, largely on account of an expected higher global demand for semiconductors, which account for a large share of Malta’s external merchandise trade.
26 For the purposes of the Bank’s projections, Malta’s main trading partners are taken to be France, Germany, Italy, the United Kingdom and the United States.

55
CENTRAL BANK OF MALTA Annual Report 2010
Similarly, import growth is expected to decline significantly in 2011, falling to 4.3%. Slower growth in imported inputs, which mirrors the slowdown in exports, still outweighs the impact of the projected acceleration in domestic demand. In 2012, growth in imports is projected to rise to 5.1%, reflecting higher demand for imported inputs as the volume of exports expands, increased investment by the private sector and faster growth in private consumption.
External accountThe export-driven rebound in activity during 2010 brought with it a significant improvement in the goods and services account of the balance of payments, with a surplus of 2.4% of GDP being registered in nominal terms. In 2011, the pick-up in private consumption along with the slowdown in export growth are expected to contribute to a smaller trade surplus of 2.0% of GDP.
Table 3.12PROJECTIONS FOR THE MAIN MACROECONOMIC AGGREGATES FOR MALTA
2010 2011(1) 2012(1)
Real economic activity (% change) GDP 3.7 2.5 2.9Private consumption expenditure -0.7 1.0 1.6Government consumption expenditure 0.6 0.0 0.1Gross fixed capital formation 10.0 6.7 7.3Inventories (% of GDP) 0.1 0.3 0.8Exports of goods and services 17.2 5.0 5.3Imports of goods and services 12.6 4.3 5.1
Contribution to real GDP growth (in percentage pts) Final domestic demand 1.0 1.6 2.1Net exports 3.7 0.7 0.3Inventories -1.1 0.2 0.5
Balance of payments (% of GDP) Goods and services balance 2.4 2.0 1.7Current account balance -4.1 -5.1 -5.3
Labour market (% change) Total employment 2.2 1.9 1.4Unemployment rate (% of labour supply) 6.8 6.2 6.1
Prices and costs (% change) Overall HICP 2.0 2.5 2.4HICP excluding energy 1.0 2.0 2.1RPI 1.5 2.5 2.1Compensation per employee -1.7 2.1 3.0ULC -3.2 1.4 1.4
Public finances (% of GDP) General government balance(1) -3.8 -2.9 -2.3Government debt(1) 68.3 69.0 68.9
Technical assumptionsEUR/USD exchange rate 1.3 1.4 1.4Oil price (USD per barrel) 79.6 101.3 102.4Ten-year euro area bond yield 3.6 4.0 4.3
(1) Central Bank of Malta projections

56
CENTRAL BANK OF MALTA Annual Report 2010
The surplus is anticipated to narrow further to 1.7% of GDP in 2012 as GFCF and consumption are expected to grow at stronger rates. Another factor contributing to the narrowing of the trade balance is a deterioration in the terms of trade, as import prices are expected to rise faster than export prices.
The deficit on the current account of the balance of payments is expected to be just above 5% of GDP in both 2011 and 2012, as net outflows on current transfers and income combined will continue to offset the positive trade balance.27
The labour marketThe labour market showed signs of recovery during 2010, with a gradual increase in employment levels and lower unemployment. The outlook for jobs is seen to improve further in 2011 and 2012 with employment increasing by 1.9% and 1.4%, respectively.28 At the same time, the unemployment rate should ease further, falling to 6.1% by 2012 and returning to 2008 levels.29
InflationAfter rising to 2.0% in 2010, annual average HICP inflation is projected to accelerate to 2.5% in 2011, reflect-ing increased price pressures in almost all major components. The pick-up in 2011 is partly due to projected trends in international commodity prices and some domestic price pressures. In contrast, with electricity tariffs set to remain unchanged, as officially announced in autumn 2010, energy price inflation is expected to moderate. In 2012, inflation is forecast to stabilise, falling marginally to 2.4%, since it is envisaged that declines in processed food and energy inflation will only slightly outweigh increases in the remaining com-ponents.
ULCAfter falling by 3.2% in 2010, ULC are expected to grow over the forecast horizon, going up by 1.4% in both 2011 and 2012. Improved labour market conditions are projected to lead to faster growth in compensation per employee, which is set to increase by 2.1% in 2011. In contrast, productivity is forecast to rise by only 0.7%. In 2012 compensation per employee is expected to rise by 3.0% reflecting further increases in private sector wages. At the same time, the pick-up in output growth coupled with slower employment growth are likely to boost productivity by 1.5%. This will partly offset the impact of higher employee compensation on ULC developments.
Public finance30
In 2011 the general government deficit-to-GDP ratio is projected to edge below the 3% threshold, as revenue outpaces expenditure. This is in line with Malta’s obligation to correct the excessive deficit under the terms of the Stability and Growth Pact. Fiscal consolidation efforts are set to continue in 2012, leading to a further fall in the deficit to 2.3% of GDP.
The expected increase in general government revenue reflects higher current receipts, mainly arising from growth in economic activity. Capital revenue in both years is anticipated to benefit from a high take-up of EU funds in order to finance public investment. Overall growth in current expenditure is set to be contained. Spending on compensation of employees and on intermediate consumption is assumed to increase by less than the rate of GDP growth. However, outlays on social benefits, especially on retirement pensions, are set to grow strongly.
The Bank is projecting a significant increase in government investment during 2011, followed by a smaller, though still notable rise in 2012. Most of this increase is assumed to be co-financed by EU funds.27 The current account balance for 2010 shown in the Table is based on information published on 22 March 2011. 28 Employment data are compatible with the definitions used in the national accounts and the historical series published by Eurostat.29 The unemployment rate used in the projection exercise is defined on the basis of LFS data regarding the number of unemployed. The latter are added to the employment level derived from the national accounts to compute the labour force. 30 The Bank’s fiscal projections are largely based on those presented in the Quarterly Review 2010:4, though the balance and debt ratios are adjusted for the change in GDP projections. These fiscal projections may differ from the official forecasts partly owing to differences between the macroeconomic projections on which they are based. In addition, the Bank’s projections include an independent assessment of revenue and expenditure developments in the light of measures announced by the Government.

57
CENTRAL BANK OF MALTA Annual Report 2010
The debt-to-GDP ratio is set to stabilise at around 69% over the projected horizon as a result of a declining shortfall in public finances and rising nominal GDP.
Risks to the projectionsThe Bank’s projections are surrounded by significant uncertainty. Risks to economic growth over the projec-tion horizon are judged to be on the downside. The main downside risk is posed by political developments affecting North Africa and the Middle East and, more widely, by the negative impact on the global economy of the natural disaster in Japan. The Maltese economy has ongoing trade and investment links with the North African region and, more broadly, remains exposed to the risk of weaker-than-expected external demand. The recent developments mentioned above may also push up oil prices, which would have an adverse impact on Malta’s production costs. The fragility of financial markets overseas and the possible apprecia-tion of the euro represent further downside risks. On the upside, consumption may be less sluggish than projected, particularly if household disposable income is more buoyant than envisaged, while private invest-ment may be higher, particularly in 2011.
Risks to the inflation projections are seen to be broadly balanced. Further increases in prices of internation-ally traded commodities, notably oil, are viewed as upside risks. However, these are countered by downside risks that could arise from weaker-than-expected external demand or an appreciation of the euro.

58
CENTRAL BANK OF MALTA Annual Report 2010
BOX 1: BUSINESS AND CONSUMER SURVEYS1
Industrial confidence surveys2
The recovery in industrial confi-dence observed in the second half of 2009 extended into 2010 (see Chart 1). Sentiment among manu-facturers improved almost uninter-ruptedly as the year progressed, with most sectors reporting a more positive outlook. The seasonally-adjusted industrial confidence indicator added nine percentage points over the course of the year, reaching eight in December. For the year as a whole, its average value stood at one, as against -18 in 2009.
The increase in confidence was pri-marily attributable to improved production expectations, which were up by 22 percentage points over the year. To a much lesser extent, it also reflected a rundown of stocks of finished goods, which, after a series of moderate changes for most of the year, fell significantly in December. Meanwhile, the number of respon-dents reporting insufficient order book levels, which had declined during the second half of 2009, fluctuated throughout the year.
Survey responses also show that employment growth expectations were higher in December 2010 com-pared with the same period of 2009. Respondents also anticipated an increase in their selling prices, in particular during the last quarter of the year. As in 2009 they still considered insufficient demand as the main factor limiting business expansion.
A breakdown of seasonally-unadjusted data illustrates that, on a net basis, confidence levels among produc-ers of consumer and investment goods improved over the year, though they remained negative. Meanwhile, the confidence indicator for manufacturers of intermediate goods showed strong gains, with the balance of replies turning positive. Additional detail points to improved sentiment in various sub-sectors, including food and semiconductors. In contrast, sentiment in the non-metallic mineral products sector, which produces items used in construction, worsened.
Construction industry confidence surveys3
Seasonally-unadjusted data show that sentiment among construction firms, which is subject to a relatively large degree of volatility, generally deteriorated during the course of the year and remained in negative ter-ritory throughout (Chart 2). As a result, the confidence indicator stood at -34 in December, 16 percentage points lower than the level prevailing a year earlier. As with industrial firms, the majority of operators consid-ered insufficient demand as the main factor inhibiting activity.
1 Since May 2010, survey data for industry, construction and services are being compiled according to the NACE Revision 2 classifica-tion. However, aggregates for each category are unlikely to be affected by this change in methodology. The compilation of the consumer survey remained unchanged.2 The industrial confidence indicator is the arithmetic average of the seasonally-adjusted balances (in percentage points) of replies to a subset of survey questions relating to expectations about production over the subsequent three months, current levels of order books and stocks of finished products.3 The construction confidence indicator is the arithmetic average of the balances (in percentage points) of replies to two survey questions, namely those relating to order books and employment expectations over the subsequent three months. Balances are not seasonally adjusted.
-40
-30
-20
-10
0
10
20
J2008
M M J S N J2009
M M J S N J2010
M M J S N
Production expectations Stocks of finished goods Order books Confidence indicator
Chart 1INDUSTRIAL CONFIDENCE INDICATOR(seasonally adjusted; percentage points)
Source: European Commission.
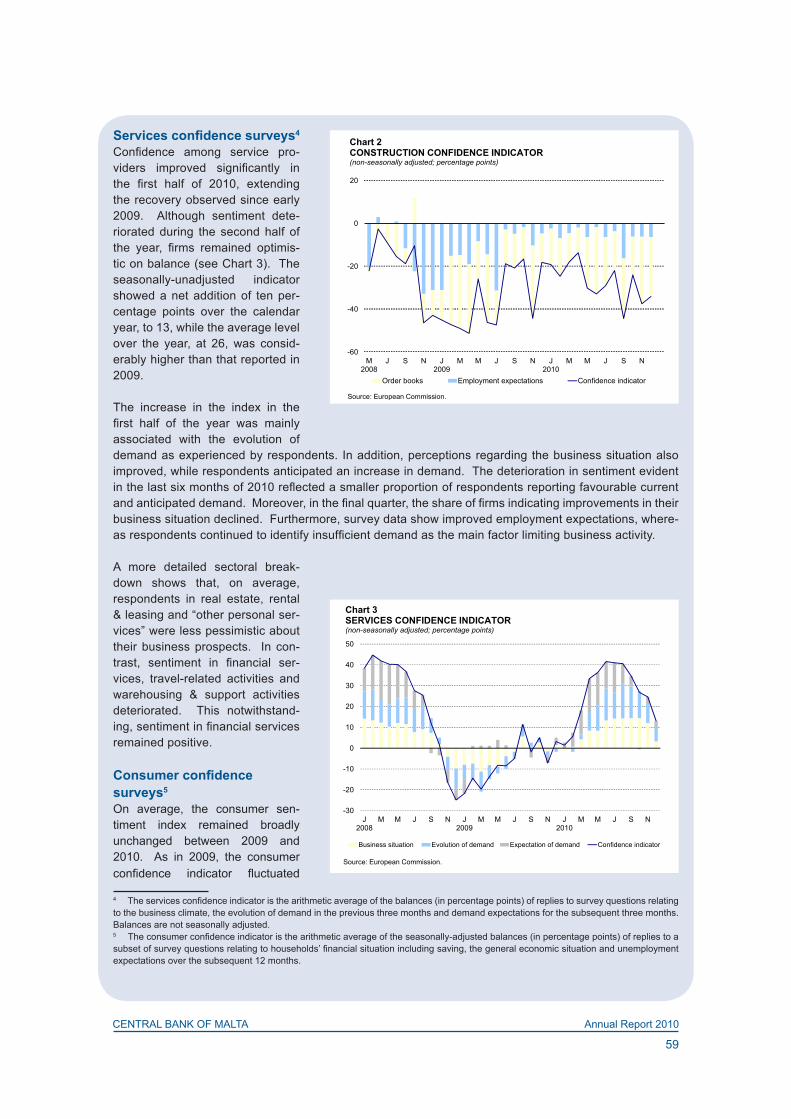
59
CENTRAL BANK OF MALTA Annual Report 2010
Services confidence surveys4
Confidence among service pro-viders improved significantly in the first half of 2010, extending the recovery observed since early 2009. Although sentiment dete-riorated during the second half of the year, firms remained optimis-tic on balance (see Chart 3). The seasonally-unadjusted indicator showed a net addition of ten per-centage points over the calendar year, to 13, while the average level over the year, at 26, was consid-erably higher than that reported in 2009.
The increase in the index in the first half of the year was mainly associated with the evolution of demand as experienced by respondents. In addition, perceptions regarding the business situation also improved, while respondents anticipated an increase in demand. The deterioration in sentiment evident in the last six months of 2010 reflected a smaller proportion of respondents reporting favourable current and anticipated demand. Moreover, in the final quarter, the share of firms indicating improvements in their business situation declined. Furthermore, survey data show improved employment expectations, where-as respondents continued to identify insufficient demand as the main factor limiting business activity.
A more detailed sectoral break-down shows that, on average, respondents in real estate, rental & leasing and “other personal ser-vices” were less pessimistic about their business prospects. In con-trast, sentiment in financial ser-vices, travel-related activities and warehousing & support activities deteriorated. This notwithstand-ing, sentiment in financial services remained positive.
Consumer confidence surveys5
On average, the consumer sen-timent index remained broadly unchanged between 2009 and 2010. As in 2009, the consumer confidence indicator fluctuated
4 The services confidence indicator is the arithmetic average of the balances (in percentage points) of replies to survey questions relating to the business climate, the evolution of demand in the previous three months and demand expectations for the subsequent three months. Balances are not seasonally adjusted.5 The consumer confidence indicator is the arithmetic average of the seasonally-adjusted balances (in percentage points) of replies to a subset of survey questions relating to households’ financial situation including saving, the general economic situation and unemployment expectations over the subsequent 12 months.
-60
-40
-20
0
20
M2008
J S N J2009
M M J S N J2010
M M J S N
Order books Employment expectations Confidence indicator
Chart 2CONSTRUCTION CONFIDENCE INDICATOR(non-seasonally adjusted; percentage points)
Source: European Commission.
-30
-20
-10
0
10
20
30
40
50
J2008
M M J S N J2009
M M J S N J2010
M M J S N
Business situation Evolution of demand Expectation of demand Confidence indicator
Chart 3SERVICES CONFIDENCE INDICATOR(non-seasonally adjusted; percentage points)
Source: European Commission.

60
CENTRAL BANK OF MALTA Annual Report 2010
within a relatively narrow range, ending 2010 at -34, two percentage points below the level prevailing one year before (see Chart 4).
Relative to a year earlier, consum-ers were more pessimistic about their financial situation, the general economic situation and their abil-ity to save over the subsequent 12 months. On the other hand, expec-tations regarding the labour market improved. On balance, compared with December 2009, a larger number of consumers expected prices to rise in the subsequent 12 months.
-40
-30
-20
-10
0
10
J2008
M M J S N J2009
M M J S N J2010
M M J S N
Savings Unemployment outlook Economic situationFinancial situation Confidence indicator
Chart 4CONSUMER CONFIDENCE INDICATOR(seasonally adjusted; percentage points)
Source: European Commission.

61
CENTRAL BANK OF MALTA Annual Report 2010
4. BALANCE OF PAYMENTS
After having expanded to 5.1% of GDP in the year to September 2009, the deficit on the current account of the balance of payments narrowed to 4.1% of GDP in the four quarters to September 2010 (see Chart 4.1). This improvement was spurred by higher net receipts on services and by a sizeable contraction in the vis-ible trade gap. Together, these offset a shift to net outward flows on the current transfers component and a rise in net income outflows.
Meanwhile, partly reflecting the con-traction in the current account deficit, net inflows on the capital and finan-cial account stood at 0.4% of GDP, down by over six percentage points compared with the year to Septem-ber 2009. This drop was entirely attributable to a shift to net outflows on the financial account, since the surplus on the capital account increased. On a four-quarter cumulative basis, positive net errors and omis-sions were recorded.1
The current account Turning to developments in the first three quarters of 2010, the current account stood at a surplus of EUR23.8 million as against a deficit of EUR132.6 million in the same period of 2009 (see Table 4.1). This reflected
1 Positive net errors and omissions imply an overestimation of the current account deficit and/or underestimation of the net inflows on the capital and financial account.
-15.0
-12.0
-9.0
-6.0
-3.0
0.0
3.0
6.0
9.0
12.0
15.0
Q12005
Q3 Q12006
Q3 Q12007
Q3 Q12008
Q3 Q12009
Q3 Q12010
Q3
Chart 4.1COMPOSITION OF BALANCE OF PAYMENTS(four-quarter moving sums as a percentage of GDP)
Current account Capital account Financial account Net errors and omissions
Source: NSO.
Table 4.1BALANCE OF PAYMENTSEUR millions
2007 2008 2009 2009 2010Q1-Q3 Q1-Q3
Current account -304.2 -328.3 -406.2 -132.6 23.8 Goods -981.5 -1,230.1 -973.9 -752.4 -651.6 Services 925.7 1,059.0 980.9 825.5 945.8 Income -191.0 -204.6 -369.7 -296.3 -276.9 Current transfers -57.4 47.4 -43.5 90.7 6.5Capital and financial account 357.0 376.2 203.7 34.0 -147.7 Capital account 51.7 28.5 70.4 13.1 33.8
Financial account 305.3 347.7 133.2 20.9 -181.5Direct investment 726.5 429.5 562.9 442.0 592.5Portfolio investment 367.8 367.3 -1,908.2 -1,069.2 -2,656.2Financial derivatives 120.2 -343.0 -70.4 -77.2 66.3Other investment -582.7 -214.8 1,551.4 703.6 1,856.6Reserve assets -326.5 108.7 -2.4 21.6 -40.8
Errors and omissions -52.8 -47.9 202.6 98.6 123.9Source: NSO.

62
CENTRAL BANK OF MALTA Annual Report 2010
a substantial improvement on the goods and services balance and, to a lesser extent, lower net income outflows. These favourable developments were partly offset by a reduction in net inflows on the current transfers component. More recent GDP data point towards a surplus on external trade in goods and ser-vices for 2010 as a whole.
Merchandise tradeBalance of payments data indicate that in the first three quarters of 2010 merchandise trade flows increased substantially on the same period of 2009.2 During the period under review, both imports and exports rose considerably, largely reversing the contraction experienced a year earlier and reflecting the impact of the upturn in world trade.
Since the rise in the value of exports outpaced that of imports, the merchandise trade deficit narrowed by EUR100.8 million. The improvement was primarily driven by a rise in sales of semiconductors and a sharp increase in fuel re-exports. Similarly, import growth was heavily influenced by higher foreign purchases of electronic components and by a considerable rise in the fuel import bill.
As a result, on a four-quarter moving sum basis the visible trade gap also contracted markedly (see Chart 4.2). In fact, when compared with the four quarters ending in September 2009, the goods deficit declined by EUR97.9 million, or 10.1%. This reduction reflected an expansion of 20.4% in exports, which outweighed a 9.7% increase in imports. Nevertheless, as the Chart shows, in contrast to the decline that had been evident since the last quarter of 2008 the cumulative trade deficit widened slightly between June and September of 2010.
Meanwhile, Customs data for the entire year reveal that the merchandise trade gap rose by 2.5% in 2010, as against a narrowing of 9.1% in the previous year.3 A marked increase in imports of a broad range of com-modities marginally exceeded a strong expansion in exports (see Table 4.2).
During 2010, the value of imported goods rose by EUR585.2 million, or 19.0%. Almost 60% of this increase was attributable to a surge in industrial supply purchases, with imports of fuel and capital goods also con-tributing.
Imports of industrial supplies increased by 28.0% on 2009, driven by electrical machinery, particularly electronic components, which domi-nate this category. In addition, the fuel import bill was up by 44.6% mainly on account of steeper inter-national oil prices, while imports of capital goods rose by 15.0% from the year-ago level, reflecting substantial-ly higher imports of sea craft. Mean-while, imports of consumer goods also rose marginally. The value of exports during 2010 increased by EUR550.7 million, or 33.1%, on the previous year. The surge was spurred by a rise of 22.0% in foreign sales of semiconductors,
2 In the compilation of balance of payments statistics Customs data on merchandise trade are adjusted for coverage, valuation and tim-ing. In particular, during recent periods, the Customs data showed significant imports of aircraft, which were not recorded in the balance of payments statistics since no transfer of ownership was involved. 3 Provisional Customs data are as published by NSO on 4 February 2011.
0
800
1,600
2,400
3,200
4,000
0
300
600
900
1,200
1,500
Q12005
Q3 Q12006
Q3 Q12007
Q3 Q12008
Q3 Q12009
Q3 Q12010
Q3
Chart 4.2GOODS BALANCE (four-quarter moving sums in EUR millions)
Deficit Goods exports (right scale) Goods imports (right scale)
Source: NSO.
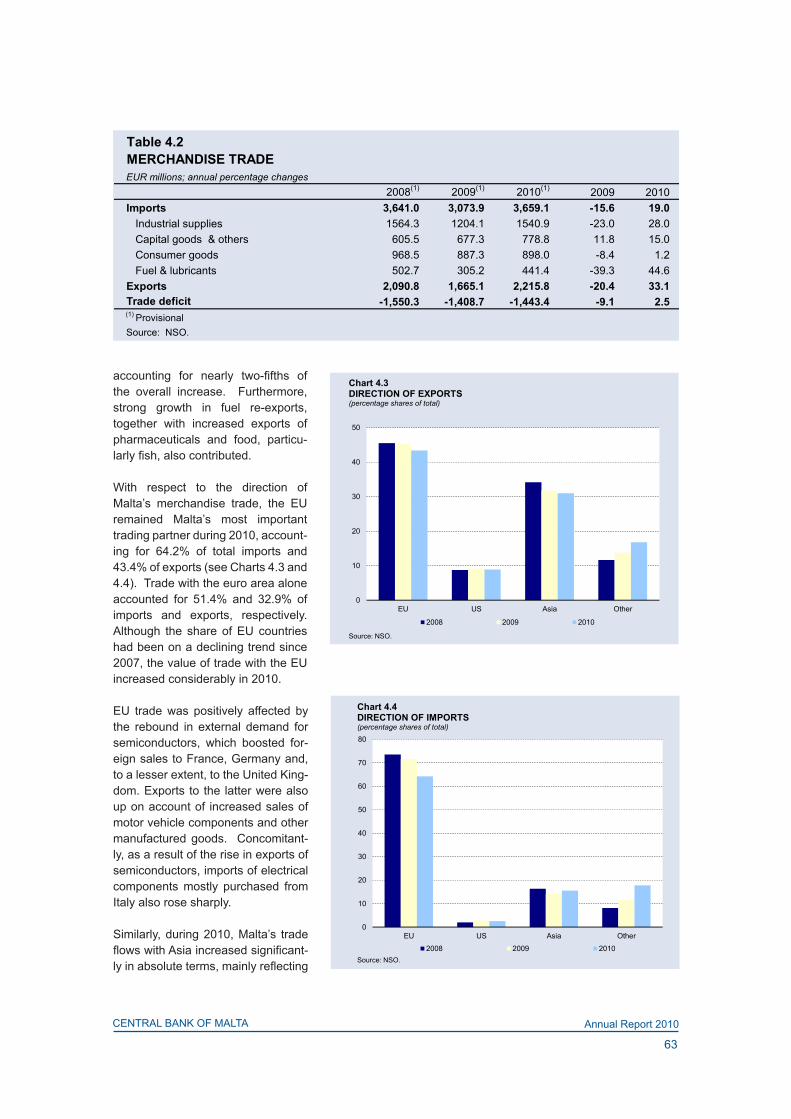
63
CENTRAL BANK OF MALTA Annual Report 2010
accounting for nearly two-fifths of the overall increase. Furthermore, strong growth in fuel re-exports, together with increased exports of pharmaceuticals and food, particu-larly fish, also contributed. With respect to the direction of Malta’s merchandise trade, the EU remained Malta’s most important trading partner during 2010, account-ing for 64.2% of total imports and 43.4% of exports (see Charts 4.3 and 4.4). Trade with the euro area alone accounted for 51.4% and 32.9% of imports and exports, respectively. Although the share of EU countries had been on a declining trend since 2007, the value of trade with the EU increased considerably in 2010.
EU trade was positively affected by the rebound in external demand for semiconductors, which boosted for-eign sales to France, Germany and, to a lesser extent, to the United King-dom. Exports to the latter were also up on account of increased sales of motor vehicle components and other manufactured goods. Concomitant-ly, as a result of the rise in exports of semiconductors, imports of electrical components mostly purchased from Italy also rose sharply.
Similarly, during 2010, Malta’s trade flows with Asia increased significant-ly in absolute terms, mainly reflecting
0
10
20
30
40
50
EU US Asia Other
Chart 4.3DIRECTION OF EXPORTS(percentage shares of total)
2008 2009 2010
Source: NSO.
0
10
20
30
40
50
60
70
80
EU US Asia Other
Chart 4.4DIRECTION OF IMPORTS(percentage shares of total)
2008 2009 2010Source: NSO.
Table 4.2MERCHANDISE TRADEEUR millions; annual percentage changes
2008(1) 2009(1) 2010(1) 2009 2010Imports 3,641.0 3,073.9 3,659.1 -15.6 19.0 Industrial supplies 1564.3 1204.1 1540.9 -23.0 28.0 Capital goods & others 605.5 677.3 778.8 11.8 15.0 Consumer goods 968.5 887.3 898.0 -8.4 1.2 Fuel & lubricants 502.7 305.2 441.4 -39.3 44.6Exports 2,090.8 1,665.1 2,215.8 -20.4 33.1Trade deficit -1,550.3 -1,408.7 -1,443.4 -9.1 2.5(1) ProvisionalSource: NSO.

64
CENTRAL BANK OF MALTA Annual Report 2010
higher imports of electronic components and exports of semiconductors, as well as a remarkable rise in sales of fish to Japan. At the same time, trade flows with the United States increased in absolute terms but dropped as a proportion of the total. On the other hand, as can be seen in Charts 4.3 and 4.4, the proportion of trade with “other” countries rose notably, driven primarily by higher oil imports from North Africa that were partly re-exported to ships & aircraft stores. In addition, imports of marine vessels from Australia and the Caribbean also contributed to the import bill.
Trade in servicesThe surplus on services during the first nine months of 2010 stood at EUR945.8 million, increasing by EUR120.3 million, or 14.6%, on the comparable period of 2009. The improvement stemmed from a 6.9% rise in receipts that was only partly offset by a rise of 1.2% in payments.
Developments in the services balance were mainly driven by growth in net travel earnings, which expanded by EUR129.3 million, or 41.1%, on the corresponding months of 2009. This surge, reflecting the buoyant performance of the tourism industry, was directly related to a gain of 27.3% in travel receipts, which was only partly offset by an increase of 5.7% in payments by outbound tourists. At the same time, an increase in net inflows of EUR44.1 million on the “other services” component mainly reflected higher net receipts from financial services as well as increased net inflows from merchanting and operational leasing services.
In contrast, net receipts from transportation stood at EUR39.8 million during the first three quarters of 2010, down by EUR53.1 million on the previous year’s level. The drop was mainly due to a considerable rise in freight payments, which in turn reflected the expansion in merchandise trade flows referred to earlier. In addition, payments for passenger transport services also increased.
These developments had an impact on the services balance, as reflected in the four-quarter moving sum, which exceeded pre-recession levels (see Chart 4.5). Indeed, during the year to September 2010 the posi-tive balance on the services account increased by EUR103.5 million, or 10.4%, compared with a year earlier.
Income accountDuring the first three quarters of 2010, net outflows on the income component of the current account dropped by EUR19.4 million, or 6.6%, compared with the same period a year earlier. This decline was mainly driven by a contraction of EUR69.5 million in profits recorded by foreign-owned firms in Malta, including banks and manufacturers. In addition, an increase of EUR53.0 million in interest earnings on residents’ portfo-lio investment abroad also dampened net outflows. In contrast, payments on foreign loans increased by EUR98.8 million on the correspond-ing quarters of 2009.
On a four-quarter moving sum basis, the decline in net income outflows observed during the first three quarters of 2010 did not offset the increase registered during the final quarter of 2009. As a result, over the 12 months to September 2010, net outflows on the income account increased by EUR6.9 mil-lion on a year earlier. This was attributable to an increase in pay-ments on foreign borrowings com-bined with lower net earnings on portfolio investment abroad. Banks engaged predominantly in interna-tional business accounted for most of these flows.
0
700
1400
2100
2800
0
300
600
900
1200
Q12005
Q3 Q12006
Q3 Q12007
Q3 Q12008
Q3 Q12009
Q3 Q12010
Q3
Chart 4.5SERVICES BALANCE(four-quarter moving sums in EUR millions)
Other services TravelTransportation Service exports (right scale)Services imports (right scale)
Source: NSO.
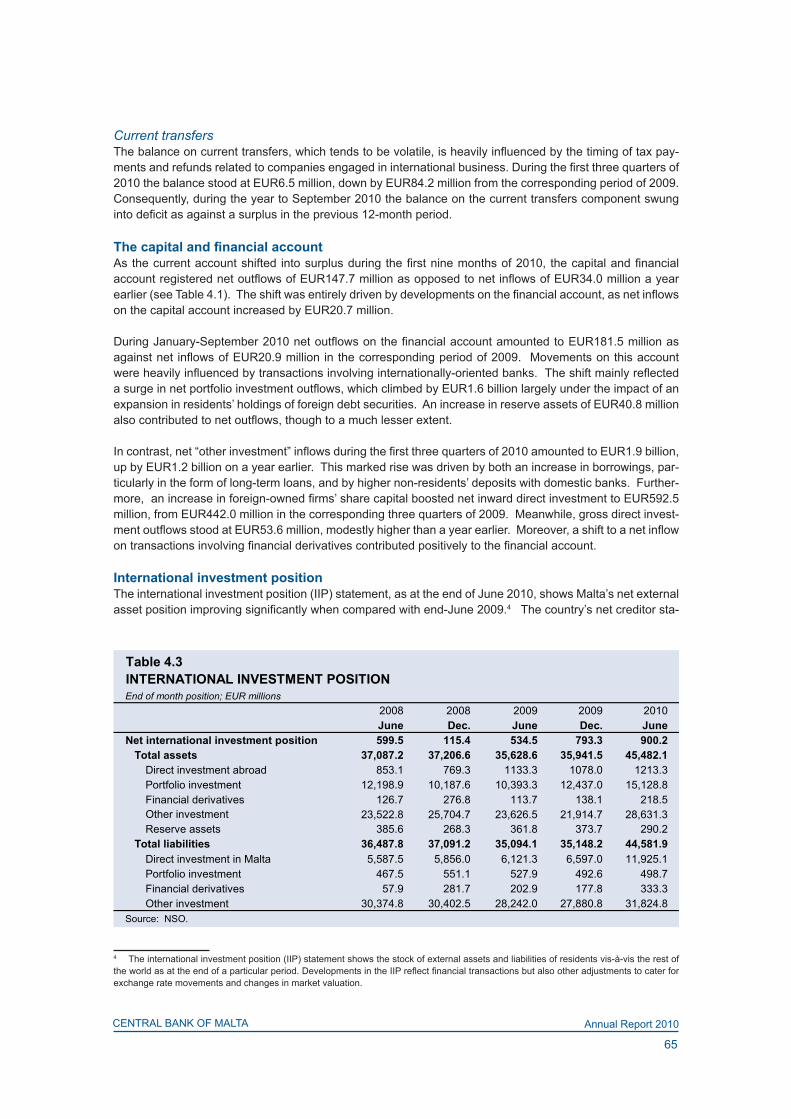
65
CENTRAL BANK OF MALTA Annual Report 2010
Current transfersThe balance on current transfers, which tends to be volatile, is heavily influenced by the timing of tax pay-ments and refunds related to companies engaged in international business. During the first three quarters of 2010 the balance stood at EUR6.5 million, down by EUR84.2 million from the corresponding period of 2009. Consequently, during the year to September 2010 the balance on the current transfers component swung into deficit as against a surplus in the previous 12-month period.
The capital and financial accountAs the current account shifted into surplus during the first nine months of 2010, the capital and financial account registered net outflows of EUR147.7 million as opposed to net inflows of EUR34.0 million a year earlier (see Table 4.1). The shift was entirely driven by developments on the financial account, as net inflows on the capital account increased by EUR20.7 million.
During January-September 2010 net outflows on the financial account amounted to EUR181.5 million as against net inflows of EUR20.9 million in the corresponding period of 2009. Movements on this account were heavily influenced by transactions involving internationally-oriented banks. The shift mainly reflected a surge in net portfolio investment outflows, which climbed by EUR1.6 billion largely under the impact of an expansion in residents’ holdings of foreign debt securities. An increase in reserve assets of EUR40.8 million also contributed to net outflows, though to a much lesser extent. In contrast, net “other investment” inflows during the first three quarters of 2010 amounted to EUR1.9 billion, up by EUR1.2 billion on a year earlier. This marked rise was driven by both an increase in borrowings, par-ticularly in the form of long-term loans, and by higher non-residents’ deposits with domestic banks. Further-more, an increase in foreign-owned firms’ share capital boosted net inward direct investment to EUR592.5 million, from EUR442.0 million in the corresponding three quarters of 2009. Meanwhile, gross direct invest-ment outflows stood at EUR53.6 million, modestly higher than a year earlier. Moreover, a shift to a net inflow on transactions involving financial derivatives contributed positively to the financial account.
International investment positionThe international investment position (IIP) statement, as at the end of June 2010, shows Malta’s net external asset position improving significantly when compared with end-June 2009.4 The country’s net creditor sta-
4 The international investment position (IIP) statement shows the stock of external assets and liabilities of residents vis-à-vis the rest of the world as at the end of a particular period. Developments in the IIP reflect financial transactions but also other adjustments to cater for exchange rate movements and changes in market valuation.
Table 4.3INTERNATIONAL INVESTMENT POSITIONEnd of month position; EUR millions
2008 2008 2009 2009 2010June Dec. June Dec. June
Net international investment position 599.5 115.4 534.5 793.3 900.2 Total assets 37,087.2 37,206.6 35,628.6 35,941.5 45,482.1
Direct investment abroad 853.1 769.3 1133.3 1078.0 1213.3Portfolio investment 12,198.9 10,187.6 10,393.3 12,437.0 15,128.8Financial derivatives 126.7 276.8 113.7 138.1 218.5Other investment 23,522.8 25,704.7 23,626.5 21,914.7 28,631.3Reserve assets 385.6 268.3 361.8 373.7 290.2
Total liabilities 36,487.8 37,091.2 35,094.1 35,148.2 44,581.9Direct investment in Malta 5,587.5 5,856.0 6,121.3 6,597.0 11,925.1Portfolio investment 467.5 551.1 527.9 492.6 498.7Financial derivatives 57.9 281.7 202.9 177.8 333.3Other investment 30,374.8 30,402.5 28,242.0 27,880.8 31,824.8
Source: NSO.

66
CENTRAL BANK OF MALTA Annual Report 2010
tus stood at EUR900.2 million, strengthening by EUR365.7 million in the year to June (see Table 4.3). This was propelled by an expansion of EUR9.9 billion in foreign assets that was partly offset by a rise of EUR9.5 billion in foreign liabilities. Substantial movements in both foreign assets and liabilities largely reflect growth in the financial sector, with internationally-oriented financial institutions expanding their operations in Malta.
The overall year-on-year improvement in the net IIP reflected increases in net portfolio and net “other invest-ment” assets, which rose by EUR4.8 billion and EUR1.4 billion, respectively. The former was almost entirely driven by a surge in foreign holdings of debt securities by the banking sector. Meanwhile, an upturn in banks’ short-term lending to non-residents led to a marked rise in “other investment” assets, which was only partly offset by a smaller increase in outstanding deposits (including loans) belonging to non-residents. On the other hand, by end June 2010 the country’s reserve assets stood at EUR290.2 million, decreasing by EUR71.6 million in the period under review.
In contrast, following an upswing in the equity capital of internationally-oriented banks, driven by the reclassi-fication of one institution, the stock of net foreign direct investment in Malta rose by EUR5.7 billion compared with the end-June 2009 position. Furthermore, an increase of EUR25.6 million in net outflows on financial derivatives also boosted foreign liabilities.

67
CENTRAL BANK OF MALTA Annual Report 2010
5. GOVERNMENT FINANCE1
The latest official projections suggest that the general government deficit rose slightly to 3.9% of GDP in 2010, from 3.7% in the previous year.2 For 2011 the Government foresees a reduction in the deficit ratio to 2.8%, as efforts aimed at fiscal consolidation get under way. The general government debt-to-GDP ratio is estimated to have peaked at 69.1% in 2010 and is expected to decline in the coming years.
The outcome for the first three quarters of 2010 indicates a narrowing of the general government deficit, as revenue growth exceeded an increase in public expenditure.
According to the latest Financial Estimates, the deficit in the Consolidated Fund in 2010 remained at the same level as in the previous year, as revenue and expenditure increased by similar amounts. Actual data for the first 11 months indicate a reduction in the Consolidated Fund deficit from the same period of 2009.
General government official projectionsThe general government deficit, computed on the basis of four-quarter sums, stood at 2.9% of GDP in the third quarter of 2010, while the general government debt ratio stood at 69.1% in September (see Table 5.1). By the end of the year the deficit is projected to increase to 3.9% of GDP, while the debt ratio is expected to remain the same.
After having widened in 2010 the deficit is set to be reduced as growth in public expenditure is restrained. In the Budget for 2011 the Government announced that it intends to take measures in order to boost spend-ing efficiency. For instance, where possible, only one person will be employed for every two who retire from public service. Efforts to clamp down on abuse of the tax and social security systems will be stepped up. These measures are planned to be supported by an underlying rate of nominal GDP growth of 5.6% in 2011 and 5.0% in 2012 (see Chart 5.1).
1 The general government balance captures all transactions of the central government including extra-budgetary units and local councils, on an accrual basis. In contrast, the Consolidated Fund captures most transactions of the central government only, on a cash basis.2 The latest official projections regarding developments in general government finances can be found in Budget Speech 2011 and in Financial Estimates 2011, published by the MFEI in October 2010.
GENERAL GOVERNMENT FISCAL INDICATORSPercentage of GDP
2009 2010 2009 2010 (2) 2011 (2)
Q3 (1) Q3 (1)
Deficit 4.4 2.9 3.7 3.9 2.8Debt 68.0 69.1 67.7 69.1 68.8(1) Four-quarter moving sums(2) Official Government forecastSources: NSO; MFEI.
Table 5.1
51.0
54.0
57.0
60.0
63.0
66.0
69.0
72.0
75.0
0.0
1.0
2.0
3.0
4.0
5.0
6.0
7.0
8.0
2004 2005 2006 2007 2008 2009 2010 2011 2012GDP Growth (%) Deficit Debt (right scale)
Chart 5.1GENERAL GOVERNMENT BALANCE AND DEBT TRENDS(percentage of GDP)
(1) Official Government forecastSources: NSO; MFEI
(1) (1) (1)
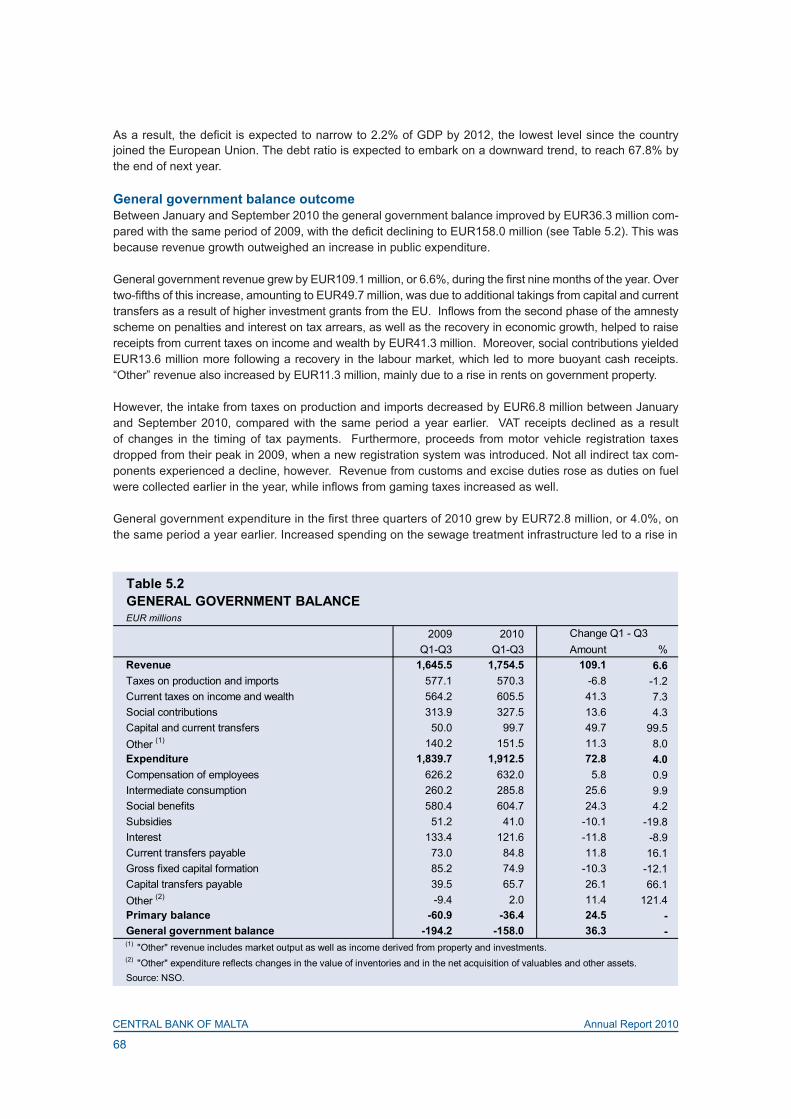
68
CENTRAL BANK OF MALTA Annual Report 2010
As a result, the deficit is expected to narrow to 2.2% of GDP by 2012, the lowest level since the country joined the European Union. The debt ratio is expected to embark on a downward trend, to reach 67.8% by the end of next year.
General government balance outcome Between January and September 2010 the general government balance improved by EUR36.3 million com-pared with the same period of 2009, with the deficit declining to EUR158.0 million (see Table 5.2). This was because revenue growth outweighed an increase in public expenditure. General government revenue grew by EUR109.1 million, or 6.6%, during the first nine months of the year. Over two-fifths of this increase, amounting to EUR49.7 million, was due to additional takings from capital and current transfers as a result of higher investment grants from the EU. Inflows from the second phase of the amnesty scheme on penalties and interest on tax arrears, as well as the recovery in economic growth, helped to raise receipts from current taxes on income and wealth by EUR41.3 million. Moreover, social contributions yielded EUR13.6 million more following a recovery in the labour market, which led to more buoyant cash receipts. “Other” revenue also increased by EUR11.3 million, mainly due to a rise in rents on government property.
However, the intake from taxes on production and imports decreased by EUR6.8 million between January and September 2010, compared with the same period a year earlier. VAT receipts declined as a result of changes in the timing of tax payments. Furthermore, proceeds from motor vehicle registration taxes dropped from their peak in 2009, when a new registration system was introduced. Not all indirect tax com-ponents experienced a decline, however. Revenue from customs and excise duties rose as duties on fuel were collected earlier in the year, while inflows from gaming taxes increased as well.
General government expenditure in the first three quarters of 2010 grew by EUR72.8 million, or 4.0%, on the same period a year earlier. Increased spending on the sewage treatment infrastructure led to a rise in
Table 5.2GENERAL GOVERNMENT BALANCEEUR millions
2009 2010Q1-Q3 Q1-Q3 Amount %
Revenue 1,645.5 1,754.5 109.1 6.6Taxes on production and imports 577.1 570.3 -6.8 -1.2Current taxes on income and wealth 564.2 605.5 41.3 7.3Social contributions 313.9 327.5 13.6 4.3Capital and current transfers 50.0 99.7 49.7 99.5Other (1) 140.2 151.5 11.3 8.0Expenditure 1,839.7 1,912.5 72.8 4.0Compensation of employees 626.2 632.0 5.8 0.9Intermediate consumption 260.2 285.8 25.6 9.9Social benefits 580.4 604.7 24.3 4.2Subsidies 51.2 41.0 -10.1 -19.8Interest 133.4 121.6 -11.8 -8.9Current transfers payable 73.0 84.8 11.8 16.1Gross fixed capital formation 85.2 74.9 -10.3 -12.1Capital transfers payable 39.5 65.7 26.1 66.1Other (2) -9.4 2.0 11.4 121.4Primary balance -60.9 -36.4 24.5 -General government balance -194.2 -158.0 36.3 -(1) "Other" revenue includes market output as well as income derived from property and investments.(2) "Other" expenditure reflects changes in the value of inventories and in the net acquisition of valuables and other assets.Source: NSO.
Change Q1 - Q3
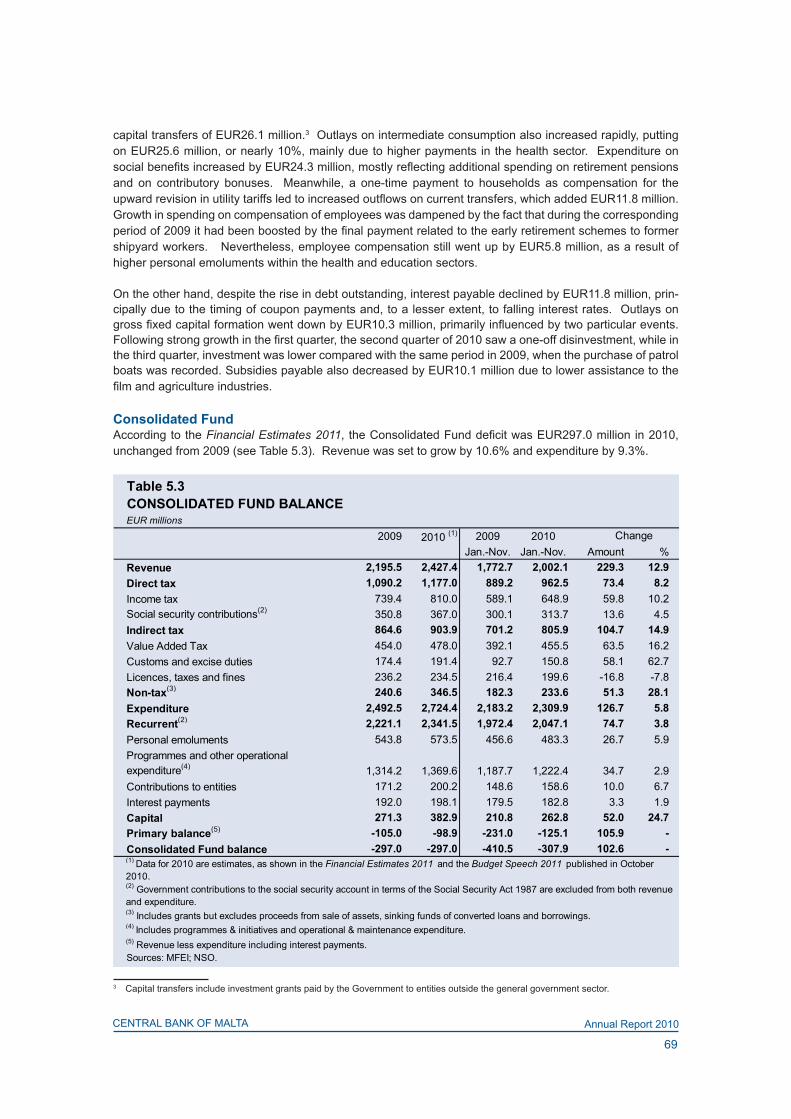
69
CENTRAL BANK OF MALTA Annual Report 2010
capital transfers of EUR26.1 million.3 Outlays on intermediate consumption also increased rapidly, putting on EUR25.6 million, or nearly 10%, mainly due to higher payments in the health sector. Expenditure on social benefits increased by EUR24.3 million, mostly reflecting additional spending on retirement pensions and on contributory bonuses. Meanwhile, a one-time payment to households as compensation for the upward revision in utility tariffs led to increased outflows on current transfers, which added EUR11.8 million. Growth in spending on compensation of employees was dampened by the fact that during the corresponding period of 2009 it had been boosted by the final payment related to the early retirement schemes to former shipyard workers. Nevertheless, employee compensation still went up by EUR5.8 million, as a result of higher personal emoluments within the health and education sectors.
On the other hand, despite the rise in debt outstanding, interest payable declined by EUR11.8 million, prin-cipally due to the timing of coupon payments and, to a lesser extent, to falling interest rates. Outlays on gross fixed capital formation went down by EUR10.3 million, primarily influenced by two particular events. Following strong growth in the first quarter, the second quarter of 2010 saw a one-off disinvestment, while in the third quarter, investment was lower compared with the same period in 2009, when the purchase of patrol boats was recorded. Subsidies payable also decreased by EUR10.1 million due to lower assistance to the film and agriculture industries.
Consolidated FundAccording to the Financial Estimates 2011, the Consolidated Fund deficit was EUR297.0 million in 2010, unchanged from 2009 (see Table 5.3). Revenue was set to grow by 10.6% and expenditure by 9.3%.
3 Capital transfers include investment grants paid by the Government to entities outside the general government sector.
Table 5.3CONSOLIDATED FUND BALANCE EUR millions
2009 2010 (1) 2009 2010Jan.-Nov. Jan.-Nov. Amount %
Revenue 2,195.5 2,427.4 1,772.7 2,002.1 229.3 12.9Direct tax 1,090.2 1,177.0 889.2 962.5 73.4 8.2Income tax 739.4 810.0 589.1 648.9 59.8 10.2Social security contributions(2) 350.8 367.0 300.1 313.7 13.6 4.5Indirect tax 864.6 903.9 701.2 805.9 104.7 14.9Value Added Tax 454.0 478.0 392.1 455.5 63.5 16.2Customs and excise duties 174.4 191.4 92.7 150.8 58.1 62.7Licences, taxes and fines 236.2 234.5 216.4 199.6 -16.8 -7.8Non-tax(3) 240.6 346.5 182.3 233.6 51.3 28.1Expenditure 2,492.5 2,724.4 2,183.2 2,309.9 126.7 5.8Recurrent(2) 2,221.1 2,341.5 1,972.4 2,047.1 74.7 3.8Personal emoluments 543.8 573.5 456.6 483.3 26.7 5.9Programmes and other operational expenditure(4) 1,314.2 1,369.6 1,187.7 1,222.4 34.7 2.9Contributions to entities 171.2 200.2 148.6 158.6 10.0 6.7Interest payments 192.0 198.1 179.5 182.8 3.3 1.9Capital 271.3 382.9 210.8 262.8 52.0 24.7Primary balance(5) -105.0 -98.9 -231.0 -125.1 105.9 -Consolidated Fund balance -297.0 -297.0 -410.5 -307.9 102.6 -
(5) Revenue less expenditure including interest payments.Sources: MFEI; NSO.
(4) Includes programmes & initiatives and operational & maintenance expenditure.
Change
(1) Data for 2010 are estimates, as shown in the Financial Estimates 2011 and the Budget Speech 2011 published in October 2010.(2) Government contributions to the social security account in terms of the Social Security Act 1987 are excluded from both revenue and expenditure.(3) Includes grants but excludes proceeds from sale of assets, sinking funds of converted loans and borrowings.

70
CENTRAL BANK OF MALTA Annual Report 2010
Actual data up to November 2010 show revenue growth of 12.9%, and more modest expenditure growth of 5.8%. The deficit amounted to EUR307.9 million between January and November 2010, a fall of EUR102.6 million compared with the same period a year earlier.
Strong growth was recorded across all revenue components. Indirect tax receipts rose by 14.9%, driven by higher VAT receipts due to the above-mentioned changes in the timing of tax payments. Inflows from customs and excise duties also increased. Direct tax proceeds went up by 8.2%, boosted by the amnesty scheme and the acceleration in income growth during 2010. Non-tax revenue surged by 28.1%, due to increased inflows from grants and rents.
The rise in recurrent expenditure, which added 3.8%, stemmed principally from higher spending on personal emoluments, retirement pensions and the one-off support scheme related to the utility tariffs, as explained above. Meanwhile, capital expenditure went up by 24.7% including spending on sewage treatment.
Central government debtGross government debt between January and November 2010 increased by EUR323.0 million (see Table 5.4). This is a smaller amount than the net amount borrowed during the first 11 months of 2009, when Gov-ernment needed to finance a larger Consolidated Fund deficit.
By November 2010 the stock of debt outstanding reached EUR4,210.0 million, while its composition changed in favour of more medium to long-term securities, that is, Malta Government Stocks (MGS) and away from short-term instruments in the form of Treasury bills, in an environment of comparatively low interest rates. The latter declined by EUR58.7 million to account for 9.9% of total debt, down from 13.5% a year earlier. Meanwhile, MGS outstanding went up by EUR387.3 million, which increased their share in the total by 4.2 percentage points to 85.7%. Over the same period, foreign loans decreased by EUR10.0 million, while the value of euro coins, which represent a liability for the Government, increased by EUR3.2 million.
CHANGES IN CENTRAL GOVERNMENT DEBTEUR millions
2009 2009 2010Jan.-Nov. Jan.-Nov.
Gross government debt(1) 361.8 425.8 323.0Euro coins issued in name of the Treasury 6.0 5.5 3.2Treasury bills 108.3 168.8 -58.7Malta Government Stocks 262.1 262.1 387.3Local loans -1.2 0.0 1.2Foreign loans -13.4 -10.7 -10.0
Source: Central Bank of Malta.
Table 5.4
(1) Excluding government debt held by Sinking Funds.

BANK POLICIES,
OPERATIONS AND ACTIVITIES
PART II
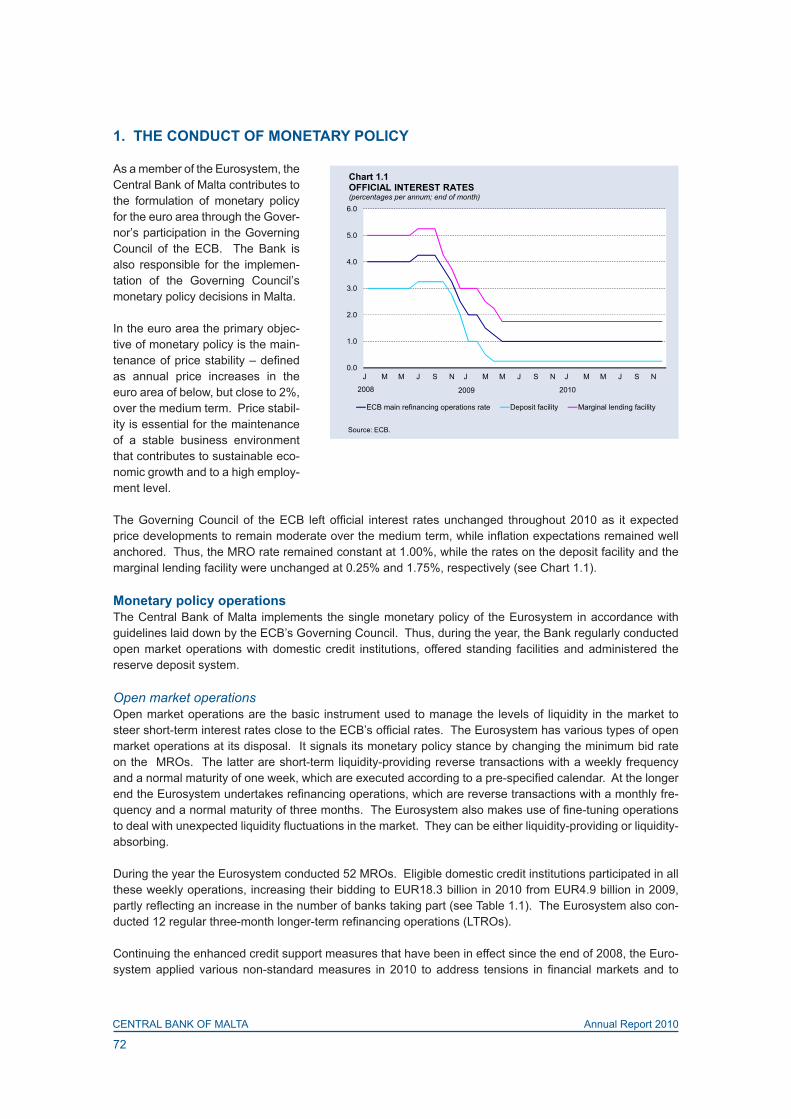
72
CENTRAL BANK OF MALTA Annual Report 2010
1. THE CONDUCT OF MONETARY POLICY
As a member of the Eurosystem, the Central Bank of Malta contributes to the formulation of monetary policy for the euro area through the Gover-nor’s participation in the Governing Council of the ECB. The Bank is also responsible for the implemen-tation of the Governing Council’s monetary policy decisions in Malta.
In the euro area the primary objec-tive of monetary policy is the main-tenance of price stability – defined as annual price increases in the euro area of below, but close to 2%, over the medium term. Price stabil-ity is essential for the maintenance of a stable business environment that contributes to sustainable eco-nomic growth and to a high employ-ment level.
The Governing Council of the ECB left official interest rates unchanged throughout 2010 as it expected price developments to remain moderate over the medium term, while inflation expectations remained well anchored. Thus, the MRO rate remained constant at 1.00%, while the rates on the deposit facility and the marginal lending facility were unchanged at 0.25% and 1.75%, respectively (see Chart 1.1).
Monetary policy operationsThe Central Bank of Malta implements the single monetary policy of the Eurosystem in accordance with guidelines laid down by the ECB’s Governing Council. Thus, during the year, the Bank regularly conducted open market operations with domestic credit institutions, offered standing facilities and administered the reserve deposit system.
Open market operationsOpen market operations are the basic instrument used to manage the levels of liquidity in the market to steer short-term interest rates close to the ECB’s official rates. The Eurosystem has various types of open market operations at its disposal. It signals its monetary policy stance by changing the minimum bid rate on the MROs. The latter are short-term liquidity-providing reverse transactions with a weekly frequency and a normal maturity of one week, which are executed according to a pre-specified calendar. At the longer end the Eurosystem undertakes refinancing operations, which are reverse transactions with a monthly fre-quency and a normal maturity of three months. The Eurosystem also makes use of fine-tuning operations to deal with unexpected liquidity fluctuations in the market. They can be either liquidity-providing or liquidity-absorbing.
During the year the Eurosystem conducted 52 MROs. Eligible domestic credit institutions participated in all these weekly operations, increasing their bidding to EUR18.3 billion in 2010 from EUR4.9 billion in 2009, partly reflecting an increase in the number of banks taking part (see Table 1.1). The Eurosystem also con-ducted 12 regular three-month longer-term refinancing operations (LTROs).
Continuing the enhanced credit support measures that have been in effect since the end of 2008, the Euro-system applied various non-standard measures in 2010 to address tensions in financial markets and to
0.0
1.0
2.0
3.0
4.0
5.0
6.0
J M M J S N J M M J S N J M M J S N
ECB main refinancing operations rate Deposit facility Marginal lending facility
Chart 1.1OFFICIAL INTEREST RATES(percentages per annum; end of month)
Source: ECB.
2008 2009 2010
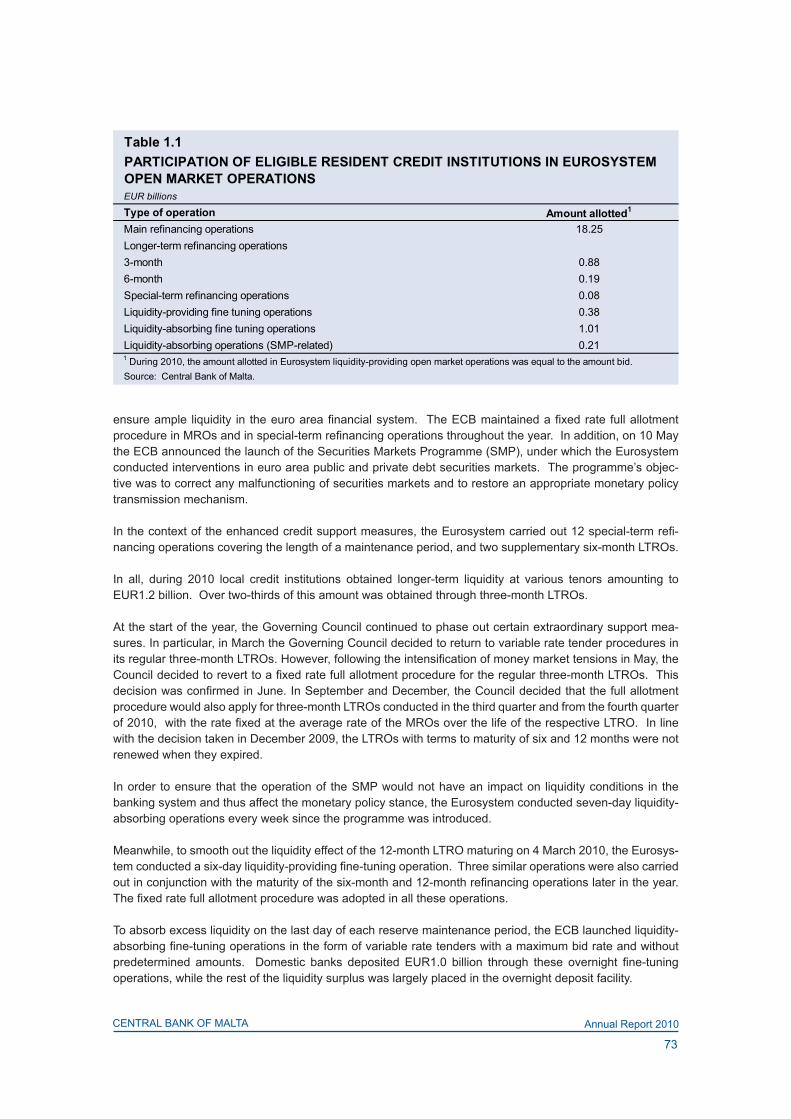
73
CENTRAL BANK OF MALTA Annual Report 2010
ensure ample liquidity in the euro area financial system. The ECB maintained a fixed rate full allotment procedure in MROs and in special-term refinancing operations throughout the year. In addition, on 10 May the ECB announced the launch of the Securities Markets Programme (SMP), under which the Eurosystem conducted interventions in euro area public and private debt securities markets. The programme’s objec-tive was to correct any malfunctioning of securities markets and to restore an appropriate monetary policy transmission mechanism.
In the context of the enhanced credit support measures, the Eurosystem carried out 12 special-term refi-nancing operations covering the length of a maintenance period, and two supplementary six-month LTROs.
In all, during 2010 local credit institutions obtained longer-term liquidity at various tenors amounting to EUR1.2 billion. Over two-thirds of this amount was obtained through three-month LTROs.
At the start of the year, the Governing Council continued to phase out certain extraordinary support mea-sures. In particular, in March the Governing Council decided to return to variable rate tender procedures in its regular three-month LTROs. However, following the intensification of money market tensions in May, the Council decided to revert to a fixed rate full allotment procedure for the regular three-month LTROs. This decision was confirmed in June. In September and December, the Council decided that the full allotment procedure would also apply for three-month LTROs conducted in the third quarter and from the fourth quarter of 2010, with the rate fixed at the average rate of the MROs over the life of the respective LTRO. In line with the decision taken in December 2009, the LTROs with terms to maturity of six and 12 months were not renewed when they expired.
In order to ensure that the operation of the SMP would not have an impact on liquidity conditions in the banking system and thus affect the monetary policy stance, the Eurosystem conducted seven-day liquidity-absorbing operations every week since the programme was introduced.
Meanwhile, to smooth out the liquidity effect of the 12-month LTRO maturing on 4 March 2010, the Eurosys-tem conducted a six-day liquidity-providing fine-tuning operation. Three similar operations were also carried out in conjunction with the maturity of the six-month and 12-month refinancing operations later in the year. The fixed rate full allotment procedure was adopted in all these operations.
To absorb excess liquidity on the last day of each reserve maintenance period, the ECB launched liquidity-absorbing fine-tuning operations in the form of variable rate tenders with a maximum bid rate and without predetermined amounts. Domestic banks deposited EUR1.0 billion through these overnight fine-tuning operations, while the rest of the liquidity surplus was largely placed in the overnight deposit facility.
Type of operation Amount allotted1
Main refinancing operations 18.25Longer-term refinancing operations3-month 0.886-month 0.19Special-term refinancing operations 0.08Liquidity-providing fine tuning operations 0.38Liquidity-absorbing fine tuning operations 1.01Liquidity-absorbing operations (SMP-related) 0.21
Table 1.1PARTICIPATION OF ELIGIBLE RESIDENT CREDIT INSTITUTIONS IN EUROSYSTEM OPEN MARKET OPERATIONSEUR billions
1 During 2010, the amount allotted in Eurosystem liquidity-providing open market operations was equal to the amount bid.Source: Central Bank of Malta.

74
CENTRAL BANK OF MALTA Annual Report 2010
In the beginning of 2010, the ECB decided to discontinue the temporary swap lines with the Federal Reserve and to stop conducting US dollar liquidity-providing operations. However, following renewed tensions in the markets, in May the Governing Council decided to reactivate US dollar liquidity-providing operations in agreement with the Federal Reserve. Demand for these facilities remained limited, however, and no domes-tic credit institutions made use of them. In view of declining demand and improved conditions in funding markets, the ECB decided, in agreement with the Swiss National Bank, to discontinue the one-week Swiss franc liquidity-providing swap operations after 31 January 2010.
Standing facilitiesDuring 2010 the Eurosystem also continued to offer standing facilities. Credit institutions with temporary liquidity needs may use the marginal lending facility on their own initiative to obtain overnight liquidity from their NCB against eligible assets. Conversely, institutions with surplus liquidity may use the deposit facility to place overnight deposits with their NCB. Standing facilities are used to steer market rates and to regulate liquidity in the banking system. They are administered in a decentralised manner by euro area NCBs.
Domestic banks continued to place excess liquidity with the Eurosystem through the overnight deposit facil-ity, despite the relatively low rate of interest, though to a lesser degree than in 2009: EUR49.3 billion against EUR72.7 billion. At the same time, domestic banks borrowed EUR0.7 billion in 2010 through the marginal lending facility, less than the EUR1.1 billion borrowed in 2009.
The interest rates on the marginal lending facility and on the deposit facility form a corridor, providing an upper and lower boundary, respectively, for euro area interbank overnight rates. Since the rate on the mar-ginal lending facility stood at 1.75% throughout 2010 while that on overnight deposits was kept unchanged at 0.25%, the width of the interest rate corridor was maintained at 150 basis points.
The Eurosystem requires the presentation of collateral for all its liquidity-providing operations. To ensure the equal treatment of counterparties and to enhance operational efficiency and transparency, the collateral framework sets out certain criteria. On 8 April 2010, the ECB announced that it would keep the minimum credit threshold for marketable and non-marketable assets in the Eurosystem collateral framework at BBB-/Baa3 beyond the end of 2010, except in the case of asset-backed securities. Moreover, graduated valuation haircuts would be applied to assets rated in the BBB+ to BBB- range.
On 28 July, the ECB disclosed the results of the review of risk control measures related to the collateral framework. Following the review, graduated valuation haircuts were applied from 1 January 2011 depending on the maturity, liquidity and credit quality of the assets presented as collateral. In addition, the definition of liquidity categories for marketable assets and the application of additional valuation markdowns for certain categories of assets were also fine-tuned.
In December, the ECB announced that fixed-term deposits would be acceptable as collateral for Eurosys-tem operations. It also specified further provisions relating to the treatment of certain categories of covered bonds. The ECB stated that it would establish loan-by-loan information requirements for asset-backed secu-rities in the Eurosystem collateral framework.
The Central Bank of Malta is responsible for assessing the eligibility of domestically-issued debt instru-ments and for reporting them to the ECB for inclusion in the Eurosystem’s Eligible Assets Database. As at end-December 2010, the nominal amount outstanding of eligible domestic marketable assets amounted to EUR4.0 billion, entirely in the shape of Malta Government securities.
The market value, after haircuts, of securities that eligible domestic counterparties pledged in their pool of collateral with the Central Bank of Malta stood at EUR1.7 billion as at end-December 2010. This amount consisted of both domestic and cross-border securities.
75
CENTRAL BANK OF MALTA Annual Report 2010
During 2010 the Bank continued to contribute to the determination of the Eurosystem’s liquidity needs through daily forecasts of autonomous factors.1
Reserve requirementsThe ECB requires credit institutions established in the euro area to hold reserve deposits with NCBs. The objective of the Eurosystem’s minimum reserve system is to stabilise money market interest rates and to help ensure that it operates efficiently as a liquidity supplier. Indeed, this requirement increases the demand for central bank refinancing which, in turn, makes it easier for the ECB to steer money market rates to the desired level through its open market operations.
Each credit institution established in Malta is accordingly obliged to hold minimum reserve deposits with the Central Bank of Malta. The requirement for each bank is calculated as a proportion of its reserve base. The reserve ratio, which is applied to certain categories of deposits and debt securities issued by banks, remained unchanged at 2% throughout 2010. The minimum reserve framework enables credit institutions to apply averaging techniques. Thus, compliance is determined on the basis of average closing balances in the relevant accounts over the maintenance period of approximately one month. The remuneration paid on holdings of required reserves is linked to the interest rate charged on the MROs and stood at 1.00% at the end of December 2010.
Reserve managementThe Central Bank of Malta owns and manages reserve assets and other financial assets denominated in euro.2 The reserve asset component forms part of the Eurosystem’s reserves. As for the Bank’s own port-folio, the primary investment objective is to preserve the value of the assets and only then to maximise the return on them. The portfolio is managed within the parameters approved by the Bank’s Board of Directors and the Investment Policy Committee (IPC).
Furthermore, under the foreign currency specialisation framework, the Bank managed an amount of US dol-lar reserves on behalf of the ECB through a pooling mechanism administered jointly with the Central Bank of Ireland. During the year, the Bank’s dealers worked closely with their Irish counterparts to review strategy, discuss operational modalities and analyse the portfolio’s performance.
The IPC is responsible for the formulation of strategic policies and directives related to reserve manage-ment. The committee is chaired by the Governor and includes the Deputy Governor and senior officials of the Bank. The IPC met monthly during 2010 while one ad hoc meeting was convened to discuss strategic asset allocation and benchmarking of the Bank’s portfolio. Throughout the year, the IPC monitored the per-formance of the Bank’s financial assets, evaluated the implementation of investment strategies, reviewed the operational and risk framework underpinning reserve management practices and assessed the overall investment policy.
As the global financial crisis evolved during the year, the Bank used extensive quantitative and qualitative techniques to limit the risk of possible losses from market and credit risk exposures. The Board and the IPC also approved a new credit risk framework to strengthen prudential guidelines and control systems. This measure reflects the stance taken by the IPC to manage the Bank’s risk-return profile in line with changing market realities.
During 2010, the Bank provided advisory services to Government and to public corporations on external financing and debt management.
1 Autonomous factors are items on the Eurosystem’s balance sheet that are not related to monetary policy instruments and are not normally under the direct control of the Eurosystem’s liquidity management. These include banknotes in circulation, government deposits with the NCBs and net foreign assets.2 The Bank’s reserve assets consist of claims on non-euro area residents denominated in foreign currencies.

76
CENTRAL BANK OF MALTA Annual Report 2010
In terms of the ERM II agreement, and as an NCB acting on behalf of the ECB, the Bank is authorised to conduct interventions in currencies participating in ERM II. However, no such interventions were necessary during the year.3
During 2010 the Central Bank of Malta effected foreign currency spot purchases amounting to EUR580 mil-lion, as opposed to EUR590 million in 2009. Meanwhile, spot foreign currency sales declined to EUR575 million from EUR645 million in the previous year. These transactions mainly related to the management of the Bank’s own portfolio. Similarly, swap sales declined to EUR803 million, significantly below the EUR1.9 billion recorded in 2009 as the Bank reduced its foreign currency exposure and, hence, its need to hedge positions using these instruments. The Bank also continued to transmit to the ECB information on its own foreign exchange transactions and holdings, as well as on the euro-denominated portion of its investment portfolio.
The Bank also participated in the Securities Markets Programme, which was introduced in May, as described above, and conducted the required interventions on behalf of the Eurosystem.
The Bank monitors developments in the foreign exchange market in Malta. During the year foreign exchange transactions effected locally between domestic credit and financial institutions amounted to EUR77.7 mil-lion, with the former accounting for most of these transactions. This represents a significant pick-up from EUR21.1 million in 2009, with the increase being driven by transactions related to merchandise trade flows. At the same time, the value of foreign exchange transactions between resident credit and financial institu-tions and unrelated third parties stood at EUR23.8 billion, up from EUR15.9 billion. This turnover largely stemmed from spot transactions and transactions in financial derivatives, in broadly equal levels, with credit institutions resident outside the euro area. Less than half of the spot deals were carried out by banks with resident firms and households and largely reflected sales relating to current account payments in connection with trade, tourism and personal transfers, as well as financial portfolio flows.
Throughout the year the Bank published reference rates of exchange for the euro that are established daily by the ECB, as well as other, indicative exchange rates.
Market-making operationsDuring 2010 the Central Bank of Malta continued to act as market-maker in the secondary market for MGS and Treasury bills. The Bank ensured adequate market liquidity and enhanced investor confidence in mar-ket trading. In line with the Central Bank of Malta Act, and with the provisions of the Treaty on the Function-ing of the European Union,4 the Bank did not participate in the primary market for government securities and did not provide any other form of financing to government.
The Bank continued to publish daily opening bid prices and yields of all listed MGS as well as daily buying and selling rates of Treasury bills. Additionally, the Bank quoted International Securities Market Association (ISMA) redemption yields on MGS on a daily basis.5
The Financial Markets Committee (FMC), which provides a forum for a regular exchange of views and infor-mation between the Bank and all credit institutions operating in Malta on various market-related issues, met on five occasions during 2010. The discussions centred on developments in the Eurosystem’s monetary policy operational framework, which were designed to address renewed tensions in financial markets. Other topics included Basle III and the Capital Requirements Directive, and the Euro Money Market Survey con-ducted by the ECB. In October, the FMC held a special session to discuss various aspects of the European sovereign debt market.
3 ERM II is an exchange arrangement that provides the framework for exchange rate policy cooperation between the euro area countries and those EU Member States that have not adopted the euro. Non-euro area Member States participating in ERM II peg their currencies to the euro at a central exchange rate, limiting exchange rate volatility.4 Articles 123 and 124 of the Treaty prohibit the monetary financing of governments, EU bodies and institutions as well as their privileged access to finance. 5 ISMA yields are annualised yields-to-maturity. ISMA yields on MGS, which pay interest semi-annually, are comparable with those on bonds that pay interest annually.

77
CENTRAL BANK OF MALTA Annual Report 2010
2. FINANCIAL STABILITY
In line with its statutory obligations for ensuring the stability of the financial system in Malta, the Central Bank of Malta continued to monitor the financial system during 2010 to identify any potential risks and vulnerabili-ties to which it may be exposed. The financial health of the corporate and household sectors and structural developments are also closely observed to detect, in a timely manner, possible signs of stress that may negatively affect the financial system. Credit institutions are further subject to stress tests to evaluate the resilience of the banking system to extreme, yet plausible, shocks. The Bank consults other relevant authori-ties to discuss its findings and to identify appropriate measures to address identified weaknesses.
As in previous years, through the Standing Committee established by the Memorandum of Understand-ing (MoU) between the Bank and the MFSA in 2003, the two institutions met regularly to discuss financial stability matters. The MoU was reviewed during 2010 to take into account recent monetary and regulatory developments.1 Also, within the context of cooperation and sharing of information, the Bank periodically meets with the MFEI and the MFSA through the Domestic Standing Group (DSG) to discuss matters relating to management of crisis situations.2 In the light of the ongoing global financial crisis, the DSG held various meetings throughout 2010 to review implications for the domestic financial system. The DSG also met jointly with the High Level Executive Committee (HLEC),3 which is the decision-making body in case of a domestic financial crisis situation, to test the institutional ability of the domestic structure to deal with crisis situations.
The Financial Stability Committee (FSC) of the Bank, which is chaired by the Governor and includes the Deputy Governor and the Divisional Directors responsible for Financial Stability, Financial Markets and Eco-nomics, met throughout 2010. Apart from discussing the ongoing financial stability analyses and studies on specific topics, the FSC also approved changes to the Bank’s methodological approach to broaden the financial stability assessments in the context of both domestic and international developments. The FSC also approved the annual assessment of the financial stability environment, which is published on the Bank’s website through the annual Financial Stability Report and the complementary mid-year update.
To enhance its regular surveillance and assessments, the Bank carried out various ad hoc surveys during the year, supplemented by a number of meetings with financial institutions. Research was also undertaken on the corporate and household sectors to assess implications on the financial sector, particularly through credit exposures.
During the year, the Bank also continued to upgrade its existing stress-test tools by developing more elabo-rate models which, however, require further testing and validation. In addition, the Bank, together with the MFSA, carried out a series of bottom-up stress tests in collaboration with selected institutions to assess the stress-testing capacity of the industry. This process is still ongoing and both institutions will work together throughout 2011 to enhance the capacity of the industry to undertake such tests in line with the provisions of the Capital Requirements Directive.
Together with the relevant authorities, the Bank continued to review possible improvements to the financial stability framework. In line with international work and as a result of the global financial crisis, the authorities are reviewing the resolution regime for banks, including the current insolvency regime, to be able to take more effective measures to prevent systemic contagion.
Moreover, in liaison with the MFSA, the Bank participated in the EU-wide stress test during 2010 by carrying out the relevant test on a Maltese bank that was included within the sample of European banks.4 The results confirmed the resilience of that bank to the shocks assumed in the exercise, which was coordinated by the 1 The full text of the 2003 MoU as amended can be accessed on the Bank’s website at www.centralbankmalta.org.2 The Domestic Standing Group is chaired by the Deputy Governor of the Bank and includes senior officials from the Bank, the MFSA and the MFEI. The DSG forms part of the domestic structure under the crisis management framework, which was developed by the authorities to enhance national arrangements for the prevention, management and resolution of crisis situations. 3 The High Level Executive Committee is composed of the Minister responsible for Finance, the Governor of the Central Bank of Malta and the Chairman of the MFSA.4 Further information is available on http://www.centralbankmalta.org/site/stress_tests.html

78
CENTRAL BANK OF MALTA Annual Report 2010
ECB and the EU Committee of Banking Supervisors (CEBS). It is expected that a similar assessment will be undertaken across the EU in the first half of 2011. The Bank, together with the MFSA, is taking part in the preparatory work for the exercise through its participation in the European Banking Authority (EBA), the successor of the CEBS. At national level, the Bank is extending the 2010 test to the majority of banks oper-ating in Malta, with aggregate results expected to be published in the forthcoming Financial Stability Report.
At international level, there are ongoing discussions that address the weaknesses identified during the financial crisis. The Bank contributed to various international financial stability-related fora, including those related to crisis management.
As part of its international obligations, the Bank takes an active part in the ESCB structures in the field of financial stability. The EU financial stability, regulatory and supervisory architecture was restructured during 2010 with the establishment of the European Systemic Risk Board (ESRB) and the European Supervisory Authorities. The ESRB has been created to monitor and assess systemic risks and is responsible for the macro-prudential oversight of the European financial system. The Governor is a member of the General Board of the ESRB, which met for the first time in January 2011. Senior staff members of the Bank par-ticipate in the Advisory Technical Committee of the ESRB and in the Financial Stability Committee of the ESCB, which replaced the Banking Supervision Committee. As from 2011 the Bank will also take part as an observer in the EBA, with the MFSA as the primary Maltese participant.

79
CENTRAL BANK OF MALTA Annual Report 2010
3. CURRENCY, PAYMENT SYSTEMS AND BANKING SERVICES
The Central Bank of Malta issues euro currency in accordance with the legal framework governing the ESCB and ECB in order to satisfy public demand. The Bank is also responsible for ensuring that banknotes and coins in circulation are genuine and fit for use. The Bank is also responsible for issuing numismatic coins. It made such an issue in 2010. No commemorative coins were issued during 2010.
As the authority responsible for the regulation and oversight of the payment and securities settlement system in Malta, the Bank continued to participate in TARGET2. The Bank also maintained its role as banker to the public sector and to the banking system by providing various services to them. The Bank continued to pro-vide portfolio management services to the Investor Compensation and Depositor Compensation Schemes and retained its role as the designated custodian of assets held abroad under the Insurance Business Act.
Currency operationsThe Bank provided currency to the banking system. It also examined banknotes and coins regularly to safeguard the integrity of the currency and to ensure that only fit and genuine notes were in circulation. All banknotes and coins that were deemed unfit were destroyed.
Collection and disposal of the Maltese liraDuring 2010 the Bank continued to collect and destroy Maltese lira banknotes and coins. In all, just over a quarter of a million banknotes denominated in Maltese lira with a face value of Lm2.6 million (equivalent to EUR6.0 million) were collected during the year (see Table 3.1). In addition, around 1.5 million pieces of Maltese lira coins with a face value of nearly Lm0.2 million (equivalent to EUR0.4 million) were returned up to 2 February, when these coins ceased to be exchangeable. The value of Maltese lira coins that remained uncollected and, therefore, ceased to have any monetary value on that date was Lm11.1 million, equivalent to EUR25.9 million.1 In addition, by the end of the year, Maltese lira banknotes still in circulation amounted to Lm21.4 million, equivalent to EUR49.9 million.2
1 Between March and October 2010, the Bank disposed of 94.7 million Maltese lira coins, by selling them for their intrinsic metal value.2 It is relevant to note that on 13 September 2010, the Lm10 banknote 4th series ceased to be exchangeable. From the beginning of the year until then, the Bank had collected Lm45,820 worth of these banknotes.
Lm thousands
Collected Outstanding Collected Outstanding Collected OutstandingJan. 366.0 24,606 182.0 11,132 548.0 35,738Feb. 154.0 24,452 10.0 11,122 164.0 35,574Mar. 238.0 24,214 0.0 0 238.0 24,214Apr. 235.0 23,979 0.0 0 235.0 23,979May 195.0 23,784 0.0 0 195.0 23,784June 146.0 23,638 0.0 0 146.0 23,638July 175.0 23,463 0.0 0 175.0 23,463Aug. 322.0 23,141 0.0 0 322.0 23,141Sep. 322.0 21,852 0.0 0 322.0 21,852Oct. 121.0 21,731 0.0 0 121.0 21,731Nov. 151.0 21,580 0.0 0 151.0 21,580Dec. 160.0 21,420 0.0 0 160.0 21,4202010 2,585.0 21,420 192.0 0 2,777 32,5172010 (EUR thousands) 6,021.4 49,895 447.2 0 6,468.7 75,744
Source: Central Bank of Malta.
Table 3.1
Coins(2) TotalNotes(1)
(1) The notes are of the following denominations: Lm20, Lm10, Lm5, and Lm2.(2) The coins are of the following denominations: Lm1, 50c (cents), 25c, 10c, 5c, 2c, 1c, 5m (mills), 3m, and 2m.
MALTESE LIRA CURRENCY COLLECTED AND OUTSTANDING

80
CENTRAL BANK OF MALTA Annual Report 2010
Circulation of notes and coinsEuro currency in issue increased by 5.1% to EUR846.6 million during 2010, less than the 15% rise in the previous year (see Table 3.2). During the year net issuance followed a seasonal pattern similar to that of 2009, with contractions in January and during the summer, and an increase in December.
During 2010 the Bank examined a total of 78.0 million euro banknotes with a value of EUR1.6 billion, less than the 85.1 million banknotes with a face value of EUR1.7 billion examined in 2009. Out of the total num-ber of banknotes examined, slightly more than 13% were deemed unfit for reissue and destroyed, similar to the previous year’s proportion.
In addition to banknotes, 7.0 million euro coins with a face value of EUR4.6 million were examined during 2010. This is significantly higher than the corresponding figures for 2009, 2.7 million coins and a value of EUR1.6 million. This was mainly because, for the first time, all euro denomination coins were examined before being reissued to banks.
The Bank regularly updated the ECB with local circulation statistics through the Eurosystem’s Currency Information System. It switched from monthly to daily reporting in May 2010.
During the year the Bank used forecasting techniques to estimate the number of euro banknotes, by denomi-nation, which would be required over a two-year horizon. The Bank is enhancing its forecasting model in order to predict banknote circulation volumes more accurately, thereby minimising the risk of excessive shortfalls or surpluses in stock levels.
Numismatic coinsIn September, the Bank issued a numismatic coin in gold and silver versions with the theme “Auberge d’Italie” as part of the Europa Programme 2010 - Cultural Heritage. The obverse of the coin shows the emblem of Malta with the year of issue, while the reverse depicts a detail from the façade of the Auberge as well as the Europa Star, which is the official logo of the programme.
CURRENCY NOTES AND COINS ISSUED BY AND PAID INTO THE BANK IN 2010
Issued andIssued Paid in Net issue outstanding
Jan. 108,886 117,960 -9,074 796,505Feb. 120,160 111,859 8,301 804,806Mar. 153,196 132,650 20,546 825,352Apr. 138,139 134,223 3,916 829,268May 140,925 138,374 2,551 831,819June 148,345 133,462 14,883 846,702July 155,746 159,406 -3,660 843,042Aug. 146,255 164,071 -17,816 825,226Sep. 138,498 147,808 -9,310 815,916Oct. 140,473 140,637 -164 815,752Nov. 149,903 147,076 2,827 818,579Dec. 184,003 155,941 28,062 846,6412010 1,724,529 1,683,467 41,062 846,641
Table 3.2
Notes and coins
Source: Central Bank of Malta.
EUR thousands

81
CENTRAL BANK OF MALTA Annual Report 2010
Anti-counterfeit measuresDuring 2010 the Bank’s Currency Surveillance Unit, which is responsible for promoting counterfeit aware-ness and for analysing any suspected counterfeit currency, continued to examine banknotes and coins. The findings were reported to the ECB and the Unit also gave expert advice in court cases related to coun-terfeit currency.
Payment and securities settlement systems In terms of the Central Bank of Malta Act, the Bank is responsible for the regulation and oversight of the pay-ment and securities settlement system in Malta. In this context, during 2010 the Bank continued to manage the Malta Clearing House, through which most cheques issued in Malta are settled. The use of cheques by the public declined further, with the number of cleared cheques decreasing by 1.0% to 5.5 million since 2009. However, the total value of processed cheques increased by 3.2% to EUR7.4 billion.
With regard to the operation of electronic payments, during 2010 the Bank continued to participate in TAR-GET2, which is the payment system used in the Eurosystem for the settlement of central bank operations, large-value interbank transfers and other euro payments.
During the year no new participants joined the TARGET2 system. The value of payments processed through TARGET2 in Malta fell to EUR76.4 billion in 2010 from EUR90.0 billion the previous year. The decline primarily reflected improved confidence in financial markets and the resulting reduction in the volume of overnight deposits placed by credit institutions with the Bank.
Furthermore, the Bank was engaged in a number of ongoing projects related to TARGET2. As a member of the ESCB, the Bank continued to work on the design of the TARGET2-Securities (T2S) project, whose objective is to maximise safety and efficiency in the settlement of euro-denominated securities transactions.
The Bank also participated in the Single Euro Payments Area (SEPA) project, which aims to increase the efficiency of payments in the euro area through the adoption of a single standard for credit transfer, direct debits and payment cards. The project’s target is also to make retail cross-border payments as safe as domestic payments and with similar charges. Local banks continued to offer SEPA credit transfer facilities to consumers and businesses. During 2010 the Bank enhanced its SEPA payment processing operations and continued to analyse system requirements for the implementation of SEPA direct debits.
During 2010 the Bank began work on the development of the Correspondent Central Banking Model (CCBM2) system, which is designed to set up a shared platform for the management of collateral across the Eurosystem. Work on the implementation of this system in Malta will start during 2011.
Banker to the public sector The Bank acts as banker to the Government, maintaining accounts for the Treasury, for other government departments and for a number of public sector corporations. It also provides various foreign exchange ser-vices to government departments and public sector organisations.
During 2010 the number of government cheques drawn on the Bank and presented for settlement by the rest of the banking system increased by 4.0% from the 2009 level. The upsurge was driven by a one-time pay-ment to households as compensation for the rise in energy prices. Conversely, the total value of cheques continued to drop, falling by 10.6% from the previous year’s level, to EUR804.5 million. The Bank continued to cash government cheques drawn on the Bank and presented by the general public.
In contrast, the number of payments effected by direct credit rose by 7.1%, with their value increasing by 11.1% over the 2009 level. Dividends on Malta Government Stocks accounted for most of the increase in value, followed by pensions, other social security payments and salaries.

82
CENTRAL BANK OF MALTA Annual Report 2010
The Bank continued to offer foreign exchange services to the government and public sector entities. The services included documentary letters of credit, inward and outward bills for collection, guarantees and inter-bank transfers. Additionally, the Bank continued to buy and sell foreign exchange and to purchase foreign cheques. Foreign exchange transactions were carried out using SEPA and SWIFT transfers.
The value of foreign exchange receipts processed by the Bank on behalf of the Government and public sec-tor entities decreased to EUR337.2 million in 2010 from EUR391.0 million the previous year. Similarly, the value of foreign exchange payments effected on behalf of the Government and public sector entities fell to EUR315.3 million in 2010 from EUR354.2 million in 2009.
Throughout 2010 the Bank continued to effect payments in connection with the servicing of the Govern-ment’s external debt. Capital repayments amounted to EUR13.1 million, slightly higher than in the previous year, with the associated interest totalling EUR4.5 million.3
Banker to the banking systemThe Bank acts as banker to the rest of the banking system by providing deposit facilities to credit institutions. As described in more detail elsewhere in this Annual Report, credit institutions maintain balances at the Bank to meet their reserve deposit requirements and to carry out transactions.
Other financial servicesDuring 2010 the Bank continued to provide portfolio management services to the Investor Compensation and Depositor Compensation Schemes on the basis of parameters set by their Management Committees, which are appointed by the MFSA.4 The Bank also performs financial accounting and other support services in connection with activities of the schemes. During the year the Bank started to hold margin call accounts and accounts pledged in favour of the Depositor Compensation Scheme and reported regularly on the asset positions of the two schemes.
As the custodian of assets held abroad under the Insurance Business Act, the Bank also held in its name, on behalf of insurance companies, certain specified assets representing guaranteed funds. The Bank, as in previous years, reported regularly on the position of such holdings to the competent authorities.
3 Data include a relatively small amount of capital and interest repayments in a variety of currencies other than the euro, which were converted into euro at the respective average exchange rate over the year. 4 The Investor Compensation Scheme protects clients of licensed investment service providers that are unable to satisfy their obligations towards investors, while the Depositor Compensation Scheme compensates depositors in the event of a bank failure. These two schemes were established by Legal Notice 7 of 2003, which designated the Bank as investments manager for both schemes.

83
CENTRAL BANK OF MALTA Annual Report 2010
4. INTERNAL MANAGEMENT
Administration
Board of Directors The Board of Directors is responsible for the policy and general administration of the Bank, except for certain functions carried out directly by the Bank in terms of the provisions of the Treaty on the Functioning of the European Union and the Statute of the ESCB.
Until 31 March 2010 the Board was composed of Michael C Bonello, Governor and Chairman, David A Pul-licino, Deputy Governor, and Victor Busuttil, Antoinette Caruana and Mario Micallef as non-executive Direc-tors. Mr Pullicino resigned from his position as Deputy Governor at the end of March. He was replaced by Alfred DeMarco who was appointed Deputy Governor for a period of five years with effect from 1 April. Mr DeMarco was previously the Director responsible for the Economics and External Relations Division. Mr Micallef occupied his position on the Board until 11 June and was replaced on 10 January 2011 by Profes-sor Josef Bonnici. Bernadette Muscat was reappointed Board Secretary in March after Stephanie Sciberras resigned from the Bank during that month.
The Board met 12 times during the year.
Audit Committee The Audit Committee of the Board, which is established in terms of the Central Bank of Malta Act, reports and makes recommendations to the Board on financial reporting, internal audit and control, external audit and risk management. It was chaired during 2010 by Victor Busuttil. The other members were Alfred DeMar-co, who replaced David A Pullicino from April, and Mario Micallef, who held the post until June. The latter was replaced by Professor Josef Bonnici in January 2011.
During 2010 the Committee met on nine occasions and addressed various topics, which included the quar-terly internal audit reports, the six-monthly risk assessment reports and the appointment of external auditors. The Committee also authorised the annual internal audit plan and its mid-year review, together with revisions and amendments to internal-audit-related policy documents. During the year the Committee took an active role in the implementation of recommendations made by both internal and external auditors. The Committee also met the Bank’s external auditors to review statutory audit procedures for the Bank for 2010.
Management The Executive Management Committee (EMC) continued to be responsible for the day-to-day management of the Bank in accordance with policies established by the Board. The Committee included the Governor as Chairman, the Deputy Governor and the five Division Directors.
In August the Director of the Finance and Banking Division, Godfrey Huber, retired from the Bank on reach-ing pensionable age. He was replaced as Director by Paul Muscat.
Governor’s activities in Malta During the year the Governor participated at a number of official events in Malta. In April he delivered a speech at a seminar organised by the European Federation of Ethical and Alternative Banks and Financiers on financing constraints and opportunities for the small business sector and gave a presentation on the Bank’s Annual Report 2009 at a press conference. In May he delivered a speech at a Council of Europe con-ference on the Maltese economy’s experience in the recession and on future challenges. He also took part in a conference for members of the Association Cambiste Internationale (ACI) Malta, where he spoke about the lessons learnt from the financial crisis. In November he was once again the main speaker at the annual dinner of the Institute of Financial Services, when he focused on Malta’s recent economic performance and the policy challenges ahead.

84
CENTRAL BANK OF MALTA Annual Report 2010
In the course of the year, the Governor also gave a number of interviews to the local media and to business organisations.
Governor’s activities overseasApart from regular participation in meetings of the ECB’s Governing Council and General Council, the Gov-ernor also attended the informal ECOFIN meetings in April and September. The Governor also attended the annual meetings of the BIS in June and of the IMF/World Bank in October. During the course of the year, he also attended three high-level central bank seminars organised by the ECB in collaboration with other central banks.
In May the Governor attended a colloquium organised by the ECB in Frankfurt on the financial crisis, while in June he participated at a conference organised by the Italian and Finnish central banks on challenges to macroeconomic theory and international finance posed by the global crisis. He also spoke at a conference held in China by the World Investment Forum in September and paid an official visit to the People’s Bank of China where he had talks with the Governor.
Legal issues The Central Bank of Malta Act empowers the Bank to issue directives governing activities falling under its responsibility. During 2010 the Bank repealed two directives: Directive No. 3 on cross-border credit trans-fers, which was superseded by Regulation EC No. 924/2009, and Directive No. 4 on electronic payment services, which was superseded by Directive 2007/64/EC.
The Bank amended Directive No. 6 on harmonised conditions for participation in TARGET2-Malta, to imple-ment changes made in ECB Guideline 2010/12, reflecting a number of technology-related and technical changes. Also, various definitions were amended while new ones were added. Similar amendments were made to Directive No. 7 on the provision of intraday credit.
The Bank also amended Directive No. 8 on documentation in connection with monetary policy instruments and procedures. The changes reflected two related guidelines issued by the ECB: ECB/2010/1 amended rating requirements for asset-backed securities and introduced other changes to restore the proper function-ing of the asset-backed securities market, while ECB/2010/13 amended Eurosystem procedures along with other minor changes to fine-tune the general documentation on monetary policy. In addition, minor amend-ments were made to Bank Directives No.1, No.5 and No.9.
During 2010, work was carried out to amend Directive No. 10 under the Central Bank of Malta Act to reflect ECB Decision 2010/14 on the authentication, fitness-checking and recirculation of euro banknotes. The amended Directive, which entered into force on 1 January 2011, binds credit institutions to submit timely data about the recirculation of banknotes. If a credit institution fails to comply, the Bank is authorised to apply administrative measures. In addition, the Bank is also responsible for monitoring the credit institu-tions’ banknote handling machines, concerning which a preliminary meeting was held with the relevant stakeholders.
Economic analysis and researchBank staff monitor and assess on a regular basis the economic and financial situation in Malta and abroad. They also provide inputs into the monetary policy process by briefing the Governor on developments in the euro area prior to his participation in both the Governing Council and the General Council of the ECB.
The Bank publishes an analysis of economic developments in its Quarterly Review and Annual Report and also issues a regular commentary on monetary statistics.
During the year the Bank contributed to a Eurosystem study on the distributive trades sector, focusing on the sector’s structure and performance in Malta. The Bank also participated in ECB studies on competitiveness in the euro area and on the transmission of monetary policy. The Bank continued to take part in a harmon-

85
CENTRAL BANK OF MALTA Annual Report 2010
ised survey of bank lending conditions, which is carried out on a quarterly basis across the euro area. Other analytical work was carried out on a number of economic and financial issues.
In 2010 the Bank finalised work on updating the documentation of its econometric model of the Maltese economy, which was then published on the Bank’s website in early 2011. Further work was carried out on the forecasting of non-performing loans and on the incorporation of credit growth in the Bank’s macroeconomic model. Moreover, the Bank engaged in further research on the measurement of core inflation using a persistence-based approach, and a presentation in this regard was made during a workshop organised by the ECB in December. In late 2010, the Bank continued work on the development of a small-scale dynamic stochastic general equilibrium model.
The Bank regularly provides inputs into the process of preparing euro area wide macroeconomic projections. This includes participation in the Eurosystem’s Broad Macroeconomic Projection Exercise on a bi-annual basis and in the Narrow Inflation Projection Exercise on a quarterly basis. The Bank also engages in the regular preparation of fiscal forecasts for the General Council as part of ESCB forecasting exercises and in 2010 took steps to enhance its capability to produce short-term forecasts.
StatisticsThe Bank collects and compiles a wide range of monetary, financial and other economic statistics for inter-nal policy and for analytical, research and advisory purposes, particularly in connection with the Governor’s participation in the Governing Council and General Council of the ECB. At the same time, the Bank fulfils its obligations by transmitting statistics on a regular basis to the ECB, IMF, NSO and other institutions, and publishes a wide range of statistics in its publications and on its website.
The Bank stepped up its efforts to broaden its statistical coverage and to contribute to the development of euro area statistics in line with the ESCB’s statistical work programme, especially in the area of security-by-security statistics. It also continued to meet its obligations in terms of the IMF’s Special Data Dissemination Standard. After technical consultation with the MFSA and the NSO, the Bank revised the reporting require-ments for monetary statistics under Directive No. 5 applicable to credit institutions, mainly to bring them in line with amended ECB regulations. To reduce the reporting obligations of credit institutions, the Bank integrated the balance of payments returns within the monetary returns and eased its reporting deadlines. The revised reporting requirements came into effect in June 2010.
The Bank also decided to include money market fund statistics with those of the other MFIs in all published data, while past statistics were revised to reflect this inclusion back to December 2008. Moreover, as from June, the Bank adopted NACE Rev. 2 instead of NACE Rev. 1.1 in the classification of OMFI loans to resi-dents by economic activity. Meanwhile, the Bank started publishing an aggregate statement of assets and liabilities of resident insurance corporations.
As part of the Wage Dynamics Network project, a collaborative research programme between the ECB and the NCBs, a survey was conducted over a period of six weeks between May and June. The survey, which was carried out by the Bank in conjunction with the Malta Chamber of Commerce, Enterprise and Industry and a private firm, identifies features of domestic wage setting and labour cost dynamics and explores labour market flexibility, the relationship between wages, corporate costs and prices, and the reaction of firms to unanticipated shocks. A summary of the findings was published in the Quarterly Review 2010:4.
In autumn the Bank commissioned a private firm to conduct a survey related to the ESCB’s Household Finance and Consumption Network, in order to collect information on local households’ consumption behav-iour, as well as on their financial assets and liabilities. The survey was completed by early 2011, and the final results will be made available towards the end of the year.
Bank officials also participated in the workings of the EU’s Committee on Monetary, Financial and Balance of Payment Statistics. At national level, the Bank was represented on a Steering Committee, which also
86
CENTRAL BANK OF MALTA Annual Report 2010
includes officials from the NSO and MFEI and an external expert, and which oversees a number of domestic projects related to the national accounts and other economic statistics.
The Technical Committee on Financial Statistics, which continued to meet during the year, is chaired by the Bank and includes representatives from credit and financial institutions, the MFSA, the NSO and the Malta Bankers’ Association. It coordinates the smooth transition to new reporting systems and seeks to enhance the operation of existing ones.
On 20 October, on the occasion of World Statistics Day, a United Nations initiative to highlight the achieve-ments of official statistics, the Bank and the NSO signed a revised cooperation agreement to further strengthen the consultation and cooperation between the two parties in the area of statistics, especially in the implementation of new statistical methods and adherence to new statistical standards.
Internal auditGoverned by the Internal Audit Charter, the Bank’s internal audit function provides an independent assur-ance and consultancy role to the Bank’s senior management, the Audit Committee and, ultimately, to the Board of Directors. The assurance is provided on the basis of findings of internal audit assignments and covers the efficiency and effectiveness of governance, risk management and control processes deployed by the Bank.
The Internal Audit Charter requires periodic internal reporting to the Audit Committee throughout the year. The internal audit function is also responsible for undertaking assignments on behalf of the ESCB Internal Auditors Committee, consequently providing the necessary assurances to the ECB Governing Council.
In accordance with the Internal Audit Plan for 2010, the Bank’s internal auditors concluded 14 risk-based audit engagements during the year, while another nine engagements carried forward from 2009 were final-ised in 2010. Several procedural and ad hoc audits were also undertaken. In consultation with the Bank’s respective Divisions, the internal auditors concluded an assessment of the external auditors’ Management Report for 2009 and presented recommendations to the Audit Committee to further strengthen the Bank’s operational and governance framework. In addition, the internal auditors continued to advise on issues related to data protection, freedom of information and aspects of the Bank’s core accounting system. At policy level, during 2010 the Bank finalised its new Audit Manual and revised its Internal Audit Charter.
To ensure that recommendations made during audit assignments at local and ESCB level are implemented satisfactorily, the internal auditors carried out a Bank-wide follow-up exercise during 2010. The Bank also conducted five additional audit assignments on behalf of the ESCB. In this regard, the Bank undertook an internal quality self-assessment review of its activities to ensure compliance with the standards set by the International Institute of Internal Auditors and with the Institute’s code of ethics. The Director responsible for internal audit continued to report to the Audit Committee on internal operation and policy matters.
Risk assessmentDuring 2010 the Bank enhanced its work on the setting up of a new operational risk management (ORM) framework that will introduce a new risk tolerance policy and new risk reporting mechanisms. This frame-work, which is generally aligned to the ESCB’s ORM framework, was approved by the Board of Directors and is expected to be implemented across all business areas during 2011.
As part of its ongoing business continuity management process, the Bank reviewed and tested several conti-nuity plans for critical business processes during the year. Furthermore, it tested its internal communications policy, which establishes procedures through which the Bank can reach line management and staff in the event of an operational crisis.
The Bank also contributed to the development of risk management processes at ESCB level, by assigning a senior official on a three-month attachment with the ECB to work specifically on business continuity man-

87
CENTRAL BANK OF MALTA Annual Report 2010
agement issues. Furthermore, to extend its collaboration with other NCBs on operational risk and business continuity management, the Bank participated at the annual conference of the International Operational Risk Working Group of the ESCB/Eurosystem.
Data Protection and Freedom of InformationThe Bank was identified as a public authority for the purpose of implementing the Freedom of Information (FOI) Act. As a result, the Bank appointed an FOI Officer and integrated his role with that of the Data Pro-tection Officer, to create the position of Information and Data Protection Officer (IDPO). During 2010, the new officer drew up the necessary Bank procedures as part of the preparatory work required to implement regulations of the Act, which came into force in January 2011.
The Bank also carried out its annual verification and update of the data protection register, which includes all personal data processing operations within the Bank. The IDPO advised the Bank on several issues relating to the processing of personal data, while various information notices and induction courses were organised to raise staff awareness of the importance of data protection.
Human resources By end-2010 the Bank employed a total of 328 full-timers, six more than a year earlier, while the number of part-timers stood at eight, two fewer than at end-2009. The staff complement in terms of full-time equiva-lents increased to 314 from 302 a year earlier. This temporary build-up in staff workers was decided in anticipation of the departure of several staff workers during 2011 under a voluntary severance scheme.
During 2010 the Bank recruited three Economic Officers, a Legal Officer, and 14 clerks. At the same time, seven employees resigned from the Bank and seven retired. In 2010 the Bank again seconded a number of staff to external entities. In all, three employees were seconded to other institutions: one to the Office of the Prime Minister and two to the MFEI. In addition, two employees were given permission to take up short to medium-term contracts with the ECB in areas related to risk management and administration services.
During the summer the Bank offered temporary employment to ten university students majoring in econom-ics, mathematics, statistics, law and architecture. In addition, it participated in a scheme administered by the Malta College of Arts Science and Technology by offering a four-week work placement to five students. The Bank continued the Internship Scheme in 2010 that was initially introduced in 2009 to encourage young graduates from Malta and other EU countries to obtain practical experience at the Bank and to enhance their analytical skills. In this respect, the Bank granted ten-month internships to two Italian nationals and an eight-week bursary to a French national.
The Bank hosted two ESCB common training activities in leadership designed to help participants identify their leadership styles, deal with conflict, manage performance and develop teamwork skills.
Training and developmentDuring the year the Bank continued to invest in staff training, both within the Bank and through external courses organised by local and foreign institutions.
Table 4.1
Type of training 2009 2010 2009 2010
In-house 43 32 781 521External 151 197 282 336 Local 91 125 218 262 Overseas 60 72 64 74Source: Central Bank of Malta
STAFF TRAINING Number of courses/seminars Number of participants

88
CENTRAL BANK OF MALTA Annual Report 2010
An active in-house training programme covered 32 courses, mainly in areas of finance, IT, leadership and planning, and also including staff well-being and induction programmes for new employees. These includ-ed sessions on financial instruments and financial markets databases as well as advanced report writing. Courses that were offered after office hours had a number of sessions on parenting skills. Throughout the year managers attended several leadership development programmes to prepare for the introduction in 2011 of the Bank’s new organisation structure (see Box 2).
As Table 4.1 shows, the number of staff members who participated in external courses increased consider-ably on 2009. Topics ranged from central banking, financial stability, risk and economics to IT and account-ing. Courses were available both locally and abroad, the latter including training offered by the ECB.
The Bank’s Learning, Research and Development Study Programme provides financial support to staff members wishing to pursue professional development at foreign universities in areas of interest to it. One staff member continued with his studies under this programme during 2010.
A number of employees benefited from the Bank’s various study programmes during the year (see Table 4.2). A total of 14 beneficiaries successfully completed their studies, while 22 were enrolled in approved courses, mostly at postgraduate level.
Sexual harassment policyIn 2010 the Bank carried out work on a policy on sexual harassment to ensure that appropriate procedures were readily available for staff in the event that such harassment occurs at the workplace.
Health and safetyThe Bank continued to address its obligations related to various health and safety issues. Thus, works were carried out in the Currency Examination Room to reduce noise levels and refresher courses were delivered to fire marshals.
SecurityDuring 2010 the Bank participated in a number of international fora, both within and outside the ESCB, to enhance overall security practices by sharing knowledge and anti-criminal/terrorism intelligence. The Bank also participated in the informal “Cross-Border Transports” forum, aimed at fostering cooperation among NCBs in the European Union on cross-border transportation of euro currency.
Information technologyDuring the year work continued to develop in-house software solutions in line with user requirements and to maintain operational and support services for the IT infrastructure.
The Bank also focused on improving the efficacy and dissemination of knowledge through the use of a col-laborative infrastructure. Consequently, most of the software upgrades installed during 2010 established the basic components to enable the smooth adoption of such an infrastructure. Upgrades initiated by the
Table 4.2ACADEMIC AND PROFESSIONAL COURSES
2009 2010 2009 2010Postgraduate courses 12 11 14 (1) 13 (1)
Honours first degree courses 2 3 6 8Diploma courses 1 2 1
Number of employees
(1) Includes two employees on unpaid study leave abroad to pursue doctoral programmes, and one employee under the Bank's newly introduced Learning, Research and Development Study Programme.
Courses completed Courses being pursued Type of programme
89
CENTRAL BANK OF MALTA Annual Report 2010
ESCB of new versions relating to several infrastructure components and systems were also introduced. In particular, the market information and dealing system was upgraded, while the SWIFT system was updated to accommodate requirements for the deployment of the SEPA project.
In the course of the year, various applications were developed or enhanced in line with internal and ECB requirements. Thus, software was developed for a survey on household finances and consumption and for a database related to portfolio management. Furthermore, the Bank carried out preparatory work for the upgrade of its website.
Information and public relations The Bank seeks to inform the public about its operations and activities through press and statistical releases, publications and its website.
During 2010 a new brochure on the Bank’s role and functions was finalised and euro-related information material was distributed. Early in the year, the Bank continued its media campaign on the final withdrawal from circulation of all Maltese lira coins.
Apart from participating in the Eurosystem structures and sub-structures relating to communications, the Bank also took part in a meeting of communications directors organised by the European Commission.
The Bank hosted five ESCB meetings in 2010 and co-hosted a meeting of the Economic and Financial Com-mittee of the European Commission in May.
The Bank also organised a number of meetings in collaboration with the Malta National SWIFT User Group Members for banks and other financial institutions on security settlements and corporate actions.
During the year the Bank continued to develop its corporate identity guidelines and the content of its website. As in previous years, various requests for information and interviews from both local and international media were handled.
LibraryDuring 2010 the Bank’s library continued to offer its services and facilities to the Bank’s staff, with selected services made available to external users involved in economic and financial research. The library also serves as a depository for publications issued by the World Bank Group.
The Bank participated in the first meeting of the ESCB Information Management Network and the ESCB Legal Information System project. The latter is a portal designed to provide access to multiple sources of information that are relevant to activities of ESCB lawyers.
Visit of the President His Excellency the President of Malta, Dr George Abela, visited the Bank on 20 January. During a tour of the premises, the President was introduced by the Governors and Directors to the management and staff.
Ethical and social commitmentsThe Bank pursued its internal strategy of encouraging waste separation, energy efficiency, water consump-tion reduction and environment-friendly procurement, including, among others, the installation of catalysers to purify emissions from generators.
As in past years, the Bank supported various philanthropic organisations through donations and sponsor-ships. The Bank continued to support the Arka Foundation in Gozo through the secondment of one of its employees. A number of trees were donated to the 34U campaign, which were then planted at the Salina Afforestation Park in December. Also in December, the Bank organised a dress-down day in aid of L-Istrina.

90
CENTRAL BANK OF MALTA Annual Report 2010
Cultural activities Various cultural events and exchanges featured on the calendar during 2010. In October, the Bank took part in the ECB’s cultural days programme, which was hosted by the Netherlands. In March, the Bank hosted the football team of the National Bank of Belgium to reciprocate a visit by the Bank’s team in 2009.
Educational visits continued to be organised throughout the year during which staff members made audio-visual presentations on the Eurosystem’s and Bank’s role and functions, and provided tours of the currency museum. A session on career opportunities at the Bank was organised for secondary school students in February.
In September the Bank participated for the first time in the Notte Bianca, a night-time cultural event held in Valletta. On this occasion, a quarter dinar coin dating from the medieval Fatimid period was exhibited for the first time in the Coin Museum. A seminar on this coin was also held in November.

91
CENTRAL BANK OF MALTA Annual Report 2010
BOX 2: THE BANK’S NEW ORGANISATION STRUCTURE
New Organisation StructureDuring 2009 the Bank had launched an internal review exercise to better align its structures and working methods with the requirements of Eurosystem membership. The changes which resulted from this consulta-tive process, including the creation of a project planning mechanism designed to set priorities and to ensure a more effective use of resources, began to be implemented during 2010. The new organisational structure came into effect in January 2011.
The Bank’s structure now provides for three distinct levels of management, specifically governance and stra-tegic direction, policy, and operational management. At the same time, five Directorates have been created to better reflect the Bank’s strategic roles and to more effectively align resources and expertise with core tasks. Each Directorate is composed of two departments, with four other departments reporting directly to the Governor and Deputy Governor (see Figure 1).
The Directorates are:
1. Directorate Financial Stability and Information Systems (IS), which is composed of the Financial Stability Department and the IS & Knowledge Management Department;
2. Market Operations Directorate, which comprises the Reserves Management Department and the Mon-etary Operations and Government Securities Department;
3. Directorate Financial Services, which is composed of the Currency Services & Security Department and the Payments & Banking Department;
4. Directorate Economics and Statistics, which is made up of the Economics & Research Department and the Statistics Department; and
5. Corporate Services Directorate, which comprises the Financial Control Department and the Human Resources & Administration Department.
The four departments reporting to the Governors are Internal Audit, Strategy, Planning & Risk, Communica-tions & Legal, and EU & International Relations.
Partly as a result of the new organisational set-up, a number of appointments were made in the second half of 2010, with more to follow in the early months of 2011. These included the appointment of a Senior Direc-tor, Financial Systems Development, responsible for overseeing the effective implementation of the major policy decisions in the areas of financial services, markets and financial stability. During the year, the Bank also launched a voluntary severance scheme open to employees who satisfy eligibility criteria relating to length of service and age.
Finally, in order to reflect the separation of policy direction from operational management embedded in the new structure, the Executive Management Committee has been replaced by two new committees: the Policy Committee and the Management Committee. The former focuses on governance, strategic direction, policy articulation and operational oversight; it is chaired by the Governor and includes the Deputy Governor, the Senior Director and the five Directors. The Management Committee, composed of Heads of Department, is currently chaired by the Director, Corporate Services, and is responsible for the day-to-day management of the Bank’s operations.
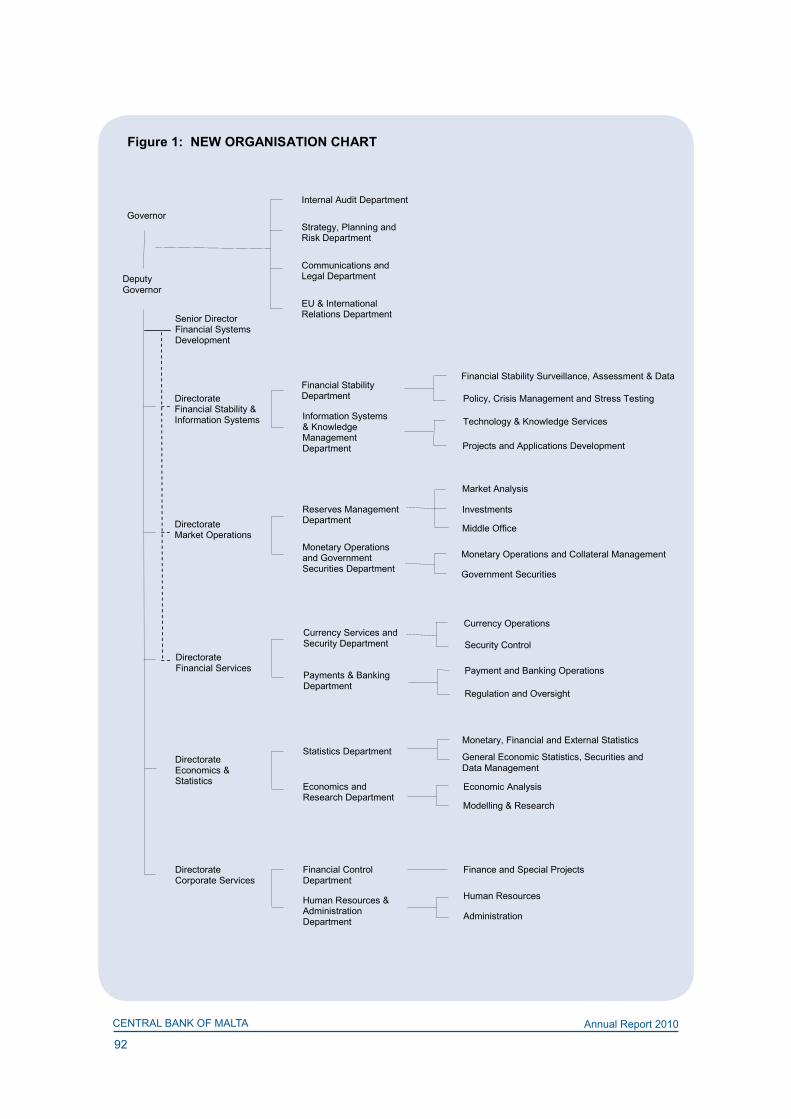
92
CENTRAL BANK OF MALTA Annual Report 2010
Governor
Directorate Financial Services Payment and Banking Operations
Regulation and Oversight
Currency Operations
Security Control Currency Services and Security Department
Payments & Banking Department
Deputy Governor
Internal Audit Department
Strategy, Planning and Risk Department
Communications and Legal Department
EU & International Relations Department Senior Director
Financial Systems Development
Directorate Economics & Statistics
Monetary, Financial and External Statistics
Economic Analysis
General Economic Statistics, Securities and Data Management
Modelling & Research
Statistics Department
Economics and Research Department
Directorate Corporate Services
Finance and Special Projects
Human Resources
Administration
Financial Control Department
Human Resources & Administration Department
Directorate Market Operations
Monetary Operations and Collateral Management
Government Securities
Investments
Middle Office
Market Analysis
Reserves Management Department
Monetary Operations and Government Securities Department
Directorate Financial Stability & Information Systems
Financial Stability Surveillance, Assessment & Data
Technology & Knowledge Services
Policy, Crisis Management and Stress Testing
Projects and Applications Development
Financial Stability Department
Information Systems & Knowledge Management Department
Figure 1: NEW ORGANISATION CHART

93
CENTRAL BANK OF MALTA Annual Report 2010
5. INTERNATIONAL RELATIONS
As a national central bank in the Eurosystem, which is responsible for monetary policy in the euro area, the Central Bank of Malta contributes to the implementation of tasks and activities of the Eurosystem and the ESCB. In particular, the Governor participates in meetings of the Governing Council, the high-est organ of the ECB. In 2010 the Governor joined the General Board of the European Systemic Risk Board (ESRB), which is a newly created EU body responsible for the macro-prudential oversight of the EU financial system.
During the year the Bank continued to adapt its procedures and operating systems in line with developments in the Eurosystem and to strengthen the relationship with the ECB and the NCBs of the ESCB. It also col-laborated with the IMF in the implementation of its crisis response package and developed further relations with the World Bank Group and the EBRD.
European System of Central Banks During 2010 the Governor participated in the proceedings of the Governing Council of the ECB, which is composed of the ECB’s Executive Board and the Governors of the NCBs of the euro area Member States. The Council formulates monetary policy and decides on the implementation of tasks entrusted to the Euro-system across the euro area. The Governor also continued to perform duties as member of the General Council of the ECB, which includes the President and Vice-President of the ECB and the central bank Gov-ernors of all EU Member States. The General Council mainly performs an advisory role.
The Governing Council and the General Council are assisted by a number of committees and working groups. Bank officials participate in activities of the Eurosystem/ESCB committees, which are listed in Table 5.1. Technical experts contribute to the work of 72 working groups and task forces that provide support to these committees.
In 2010 the Governor signed a num-ber of agreements that regulate the operations of the ESCB, including one providing for the entry of the Bank of Estonia in the Eurosystem following the adoption of the euro by that coun-try on 1 January 2011. The Governor also attended two high-level Eurosys-tem seminars with governors of the central banks of the Mediterranean and Latin American countries.
As in previous years, Bank officials attended seminars and conferences organised by the ESCB. In 2010 the Bank’s participation in these events mainly focused on international rela-tions, financial stability issues, econo-metric modelling and statistics.
On 16 December the Governing Council decided to increase the subscribed capital of the ECB to EUR10.76 billion in three annual instalments. As a result, the Bank’s share of the subscribed capital went
Table 5.1EUROSYSTEM/ESCB COMMITTEESAccounting and Monetary Income Committee (AMICO) Banknote Committee (BANCO)Banking Supervision Committee (BSC)(1)
Budget Committee (BUCOM) Committee on Cost Methodology (COMCO) Eurosystem/ESCB Communications Committee (ECCO) Eurosystem IT Steering Committee (EISC) Financial Stability Committee (FSC)(2)
Human Resources Conference (HRC) Information Technology Committee (ITC) Internal Auditors Committee (IAC)International Relations Committee (IRC) Legal Committee (LEGCO) Market Operations Committee (MOC) Monetary Policy Committee (MPC) Payment and Settlement Systems Committee (PSSC) Risk Management Committee (RMC)(2)
Statistics Committee (STC)
(2) The FSC and the RMC were established in 2010 to assist the decision-making bodies of the ECB in the fulfilment of its financial stability related tasks and to ensure an appropriate level of protection for the Eurosystem by managing and controlling the risks originating from its market operations.
(1) The BSC was dissolved in December 2010 following the establishment of the ESRB.

94
CENTRAL BANK OF MALTA Annual Report 2010
up from EUR3.6 million to EUR6.8 million. On 29 December the Bank paid the first instalment (EUR1.1 million) of its contribution to the increase, so that its paid-in capital in the ECB rose to EUR4.7 million. The remaining two instalments will be paid at the end of 2011 and 2012.
European Systemic Risk BoardDuring the year the Bank closely monitored developments related to the reform of the institutional arrange-ments for financial supervision in the EU, which included the establishment of the ESRB and of three Euro-pean Supervisory Authorities (ESAs).1
The ESRB, which was legally established on 16 December 2010, is responsible for the macro-pruden-tial oversight of the financial system. The ESRB can issue warnings and recommendations that may be addressed to one or more Member States, one or more ESAs or one or more national supervisory authori-ties. Where appropriate, such warnings and recommendations are made public. Although these warnings and recommendations are not binding, the ESRB will monitor their implementation and request a justification in cases of non-compliance.
The ECB President chairs the General Board, which is the decision-making body of the ESRB, while the Governors of all EU NCBs are voting members on the Board in a personal capacity. The ECB hosts the Secretariat of the ESRB, thereby providing it with the necessary support, as foreseen in the legislation establishing the ESRB.
In 2010 a team of experts from the ESRB Preparatory Secretariat visited the Bank to inform the Governor and senior management on preparations relating to the operations of the ESRB. The Governor also partici-pated in the election of the first Vice-Chair of the ESRB by the General Council. In January 2011 he attended the inaugural meeting of the ESRB.
Other EU institutions During the year the Governor attended two infor mal meetings of the ECOFIN Council. As in previ ous years, the Deputy Governor and other senior Bank officials took part in meetings of the Economic and Financial Committee (EFC) and of its sub-committees on issues relevant to central banks.
In particular, the Bank participated in EFC discus sions on policy proposals addressing weaknesses unveiled by the financial crisis, including the reform of the IMF and of EU governance. It also monitored the discus-sions in EU fora on the latest Stability Programme for Malta prepared by the MFEI, covering the period 2009-2012. The Bank discussed projections for the Maltese economy with the European Commission as part of the latter’s economic forecasting process. Senior Bank officials attended meetings of the European Anti-Fraud Office of the European Com mission (OLAF) on anti-counterfeiting measures.
The Bank also continued its collaboration with the MFSA, the MFEI and the Ministry of Foreign Affairs to ensure the timely transposition into Maltese law of EU financial sector legislation and prompt notification of the corresponding national implementation provisions to the ECB and the European Commission.
In January the ECB and the European Commission signed an agreement to implement a technical assis-tance programme for EU candidate and potential candidate countries aimed at strengthening prudential supervision there. The Eurosystem is organising this programme, which is financed by the EU, for the relevant central banks and supervisory authorities. The Bank is participating in the programme and during 2010 a senior official delivered a number of presentations in this context.
1 The three European Supervisory Authorities are the European Banking Authority (EBA), the European Insurance and Occupational Pensions Authority (EIOPA) and the European Securities and Markets Authority (ESMA). These three authorities were officially established on 1 January 2011.
95
CENTRAL BANK OF MALTA Annual Report 2010
International Monetary Fund The Governor continued to serve as Governor for Malta on the Board of Governors of the IMF, while the Deputy Governor acted as Alternate Governor. In this capacity, and in consultation with the MFEI, the Gov-ernors voted on resolutions proposed by the Fund’s Executive Board.
The Bank’s SDR holdings declined marginally from SDR96.0 million at the end of 2009 to SDR95.9 million at the end of December, as interest receipts were offset by the Bank’s contribution to the IMF’s Poverty Reduction and Growth Trust (PRGT). In 2009 the Bank had undertaken to make a new grant contribution of SDR0.2 million in subsidy resources to the PRGT as part of IMF efforts to assist low income countries.
As in previous years, the Bank also carried out transactions related to the IMF’s operational budget. In this regard, the amount received in repayment of previous loans exceeded the amount extended by the Bank in new lending. As a result, the Fund’s holdings of the national currency with the Bank rose from SDR68.9 million to SDR81.2 million by the end of the year. Malta’s reserve tranche declined from SDR33.1 million to around SDR20.8 million.
As part of an EU agreement to strengthen the lending capacity of the Fund, the Central Bank of Malta also provided financing in terms of a bilateral loan agreement signed in February 2010. As at the end of the year, the Bank had lent a total of EUR11.7 million in terms of this agreement.
In November an Article IV Consultation Mission visited Malta to carry out the Fund’s regular assessment of the economy. The Mission met the Minister of Finance, the Economy and Investment, the Governor, the Chairman of the MFSA and other senior officials, as well as representatives of the public and the private sec-tors and trade unions. The concluding statement of the Mission was published on 22 November.
During 2010 the Bank continued its collaboration with the IMF on statistical matters.
The Bank monitored discussions on the 14th general review of quotas and additional reforms to the Fund’s governance, including an amendment to the IMF Articles of Agreement to facilitate the transition to an elect-ed Executive Board. These reforms, which built on those agreed in 2008, were approved by the Board of Governors of the IMF in December. In terms of the quota review, Malta’s quota in the IMF will increase from SDR102.0 million to SDR168.3 million once the ratification process is completed.
World Bank Group The Bank assists the MFEI in monitoring developments at the World Bank Group. As in past years, it advised the MFEI and the Ministry of Foreign Affairs on relevant proposals from the Group, particularly on reforms to its governance.
The Bank also continued to provide administrative support to the Small States Network for Economic Devel-opment and to act as fiduciary agent for the account of the Network’s Board of Trustees.
European Bank for Reconstruction and Development The Bank monitors developments at the EBRD and collaborates with the MFEI on issues related to Malta’s membership of this institution. In conjunction with the Ministry, it examined a number of project proposals and resolutions that required a decision by the EBRD’s Board of Governors and advised the Government on Malta’s possible participation in the increase in the institution’s capital.
In fact, in 2010 the Board of Governors of the EBRD decided to increase the Bank’s capital from EUR20 billion to EUR30 billion. The increase consists of a temporary rise in callable capital of EUR9 billion and a transfer from reserves to paid-in capital of EUR1 billion. As a result, Malta’s capital in the EBRD increased from EUR2.0 million to EUR2.1 million. As the paid-in component of the capital increase was funded from reserves, shareholders were not required to make any cash payments.

96
CENTRAL BANK OF MALTA Annual Report 2010
In May the Deputy Governor and a senior official from the MFEI represented Malta at the annual meeting of the EBRD in Zagreb.
Other matters The Bank monitored developments related to initiatives endorsed by the Financial Stability Board and the Bank for International Settlements (BIS). It also took part in seminars organised by the Financial Stability Institute, which is a joint institution of the BIS and the Basel Committee on Banking Supervision.
A senior Bank official attended meetings of the Council of Europe Select Committee of Experts on the evaluation of Anti-Money Laundering Measures and the Financing of Terrorism (MONEYVAL) as part of the Maltese delegation. During 2010 he participated in the Fourth Round evaluation of the Czech Republic.
Another senior official of the Bank contributed to the work of MONEYVAL as a scientific expert, providing advice on preventive and financial sector matters. During 2010 he delivered training for evaluators organ-ised by MONEYVAL and hosted by Andorra and also formed part of a team appointed by MONEYVAL to carry out a horizontal review of the findings of the Third Round evaluation process. The review can be accessed on the MONEYVAL website. He also formed part of the team of experts that evaluated Cyprus under the Fourth Round evaluation.

97
CENTRAL BANK OF MALTA Annual Report 2010
ECONOMIC AND FINANCIAL POLICY CALENDAR 2010 This calendar lists important policy developments in the monetary,
fiscal and financial fields during the year.
Central Bank of Malta announcements
12 January: The Bank announces the withdrawal of its Directive No.3 on Cross-Border Credit Transfers as this is superseded by EC Regulation 924/2009 of the European Parliament on the introduction of measures facilitating the automation of payments.
20 January: The Bank issues a final reminder to the public to exchange Maltese lira, cent and mil coins by 1 February 2010. These ceased to be legal tender after 31 January 2008. 8 July: The MFSA and the Bank announce the EU Committee of European Banking Supervisors stress test exercise that is being undertaken by all EU Member States in close cooperation with the ECB. In Malta, Bank of Valletta is selected to undergo the test as it represents at least 50% of assets of the banking sector as a whole. The results of the stress tests are made public on 23 July. In the case of Bank of Valletta, these confirm the bank’s resilience to the shocks assumed in the exercise.
24 August: The Bank reminds the public that the Lm10 banknote of the Fourth Series, which ceased to be legal tender after 13 September 2000, would not remain exchangeable after 13 September 2010.
6 September: The Bank announces the issue of silver and gold coins featuring the “Auberge d’Italie” as part of the Europa Programme 2010 - Cultural Heritage.
4 October: The Bank announces that it will conduct a survey on household finance and consumption between October 2010 and January 2011 as part of a statistical and analytical project being carried out throughout the euro area.
20 October: The Bank, together with various national and international statistical agencies, marks World Statistics Day.
27 December: The Bank announces that it will exchange without charge kroon banknotes, the national cur-rency of Estonia, for euro during January and February 2011, at the irrevocably fixed conversion rate up to the limit of EUR1,000 per transaction.
Cooperation with the International Monetary Fund
1 February: The Bank signs an agreement with the IMF through which Malta makes available to the Fund an SDR-denominated loan, up to the equivalent of EUR120 million, over a maximum of four renewable one-year periods.
4 October: Parliament ratified two amendments to the Articles of Agreement of the IMF with regard to the increase in voice and participation and to expand the investment authority of the Fund.
22 November: An IMF Article IV Consultation Mission visited Malta during November and issued a conclud-ing statement.

98
CENTRAL BANK OF MALTA Annual Report 2010
Fiscal policy
Budget Estimates for 2011
25 October: The Minister of Finance, the Economy and Investment presents the Budget for 2011 to Parlia-ment.
The main measures include:
Taxes
• An increase in excise duty on cigarettes and tobacco of 3% and 4%, respectively; • an increase in tax on a 25cl bottle of beer by slightly less than 1c and a 13% rise in tax on spirits; and• an increase in the VAT rate on collective and private accommodation from 5% to 7%.
Assistance and incentives to companies
• A 150% tax cut, up to a limit of EUR10,000, on investment to improve the quality of products or services;• the creation of a fund to help firms team up with foreign companies for research and development pro-
grammes;• the allocation of space in the Kordin Industrial Estate to accommodate 66 small and medium-sized
enterprises;• a reduction in company tax equivalent to 125% on amounts spent on the purchase of electric cars;• an exemption from VAT registration for companies with an annual turnover of under EUR7,000;• the creation of a fund to help businesses develop their product; and• the provision of soft loans to hotels and restaurants for projects that reduce dependence on traditional
energy sources.
Social welfare assistance
• Self-employed women who work on a part-time basis will be able to pay a weekly National Insurance rate of 15% of their income if it amounts to less than the current obligatory contribution of EUR26.37.
• Part of the income to be earned by persons who receive social assistance will be excluded from the means test calculation used in assessing the eligibility of families for such assistance, in order to encour-age married women, who may be members of such families, to seek paid work.
• Tax deductions for parents of children in private schools are increased up to a maximum of EUR1,200 for primary school children and EUR1,600 for secondary school students.
• Supplementary assistance is increased to a maximum of EUR4.57 weekly for single persons and EUR8.13 for married couples.
• Adjustments are made to the means test level of income so that an increase in the level due to the cost-of-living allowance does not result in a loss of benefits.
• The full cost-of-living allowance is awarded to pensioners.
Labour market
• A cost-of-living allowance of EUR1.16 per week; and• a weekly allowance of EUR25 to persons on a minimum wage undertaking a training programme.
Measures related to the infrastructure and the environment
• The continuation of the programme of new roads in residential and arterial zones;• the implementation of the public transport reform;• incentives for cleaner private vehicles;
99
CENTRAL BANK OF MALTA Annual Report 2010
• investment in the extension of the Delimara power station; and• investment in maritime infrastructure projects.
Excessive Deficit Procedure
16 February: The Council issues a new recommendation to Malta on measures to be taken to correct its excessive government deficit. Malta is called upon to reduce its deficit to below 3% of GDP by 2011 instead of 2010.
Issue of Malta Government Stocks
2 February: The Government, through Legal Notice 62 of 2010, launches EUR100 million MGS, subject to an over-allotment option for an additional EUR50 million, comprising 3.75% MGS 2015(VI), 4.6% MGS 2020(II) (Fungibility Issue) and Floating Rate MGS 2013(V) linked to the six-month EURIBOR.
7 May: The Government, through Legal Notice 275 of 2010, launches EUR100 million MGS comprising an over-allotment option of an additional sum of EUR50 million. The issue consists of 3.75% MGS 2015(VI) Fungibility Issue, 4.6% MGS 2020(II) Fungibility Issue and 5.25% MGS 2030(I), or any combination thereof.
11 June: The Government, through Legal Notice 327 of 2010, launches EUR430,700 7% MGS 2020(III) in accordance with the Agreement entered into on 28 November 1991 between the Holy See and Malta.
16 July: The Government, through Legal Notice 361 of 2010, launches EUR30 million Floating Rate MGS 2013(VI) linked to the six-month EURIBOR.
16 July: The Government, through Legal Notice 362 of 2010, launches EUR100 million MGS, subject to an over-allotment option of EUR50 million, comprising 3.75% MGS 2015(VI) Fungibility Issue and 5.25% MGS 2030(I) Fungibility Issue or any combination thereof.
26 October: The Government, through Legal Notice 465 of 2010 launches EUR100 million MGS comprising 3.75% MGS 2015(VI) Fungibility Issue and 5.25% MGS 2030(I) Fungibility Issue.
Contributions to EU financial support package to Greece
8 May: A Loan Facility Agreement is signed between the euro area Member States regarding financial sup-port to Greece worth up to EUR80 billion. In terms of the associated Intercreditor Agreement, Malta’s com-mitment is set at up to EUR74.5 million.
18 May: Act No. III of 2010 authorises and regulates the raising of loans and the entry into re-lending agree-ments with Greece. It authorises the Government of Malta to borrow up to EUR30 million for this purpose through the issue of stock in Malta. Additional amounts may be raised as the House of Representatives authorises by resolution. The provisions of the Act entered into force on 13 July 2010.
By the end of 2010 the amount lent by the Maltese Government to its Greek counterpart totals EUR19.8 million.
Participation in the European Financial Stability Facility
20 July: Act No. XIV of 2010 authorises and regulates Malta’s participation in the European Financial Stabil-ity Facility. The Act facilitates or provides financing to Member States in financial difficulties through the rais-ing of money by the issue of financial instruments or through entering into financial arrangements with the shareholders or third parties. The Act also empowers the Government to issue guarantees for the payment of financial instruments or agreements issued, or entered into, by the European Financial Stability Facility.

100
CENTRAL BANK OF MALTA Annual Report 2010
Government assistance to Air Malta
19 November: Parliament approves Act No. XVIII of 2010, which permits the Government to raise a loan for the purpose of entering into a re-lending agreement with Air Malta plc. The Act provides for the borrowing of funds in Malta for an amount which in total would not exceed EUR52 million, and such sums of money as the House of Representatives may authorise from time to time by parliamentary resolution. The funds borrowed are to be used to support the rescue and restructuring of the airline in accordance with European state aid rules.
26 November: The Committee for the Restructuring of Air Malta, chaired by the Minister of Finance, the Economy and Investment, holds its first meeting. The Committee agrees that a restructuring plan accept-able to the European Commission will be presented within the established time frame to ensure the airline’s viability. The Committee will also monitor the implementation of the plan.
Double taxation relief agreements
5 February: Legal Notice 65 of 2010 brings into effect the double taxation relief agreement between Malta and Georgia and provides for such relief on taxes on profits, incomes and property following the relevant Convention between the two countries that came into force on 30 December 2009.
9 February: Legal Notice 69 of 2010 brings into effect an agreement between Malta and Qatar providing relief from double taxation on income following the relevant Convention that came into force on 9 December 2009.
18 March: Legal Notice 162 of 2010 brings into effect an agreement between Malta and the Isle of Man providing for relief from tax on income and profits as set out in a Convention that came into force on 26 February 2010.
30 March: Legal Notice 192 of 2010 brings into effect amendments to the principal order of 2006 regarding double taxation relief between Malta and the Republic of San Marino specified in the Schedule attached to that order which entered into force on 15 February 2010. The amendments are designed to ensure better procedures for the exchange of information between the two jurisdictions in relation to taxation.
27 April: Legal Notice 242 of 2010 brings into effect amendments to the double taxation relief agreement between Malta and Lebanon and declares that the protocol specified in the relative Schedule entered into force on 23 March 2010.
11 June: Legal Notice 328 of 2010 brings into effect double taxation relief between Malta and Libya and declares that arrangements specified in the Convention set out in the relative Schedule entered into force on 20 May 2010.
11 June: Legal Notice 329 of 2010 brings into effect amendments to the double taxation relief legislation between Malta and France and declares that the protocol specified in the relative Schedule entered into force on 1 June 2010.
14 September: Legal Notice 431 of 2010 brings into effect double taxation relief for corporate and personal income tax between Malta and the Republic of Serbia. The Convention entered into force on 16 June 2010.
14 September: Legal Notice 432 of 2010 brings into effect double taxation relief for income tax between Malta and Jersey. The Convention entered into force on 19 July 2010.
26 November: Legal Notice 501 of 2010 brings into effect a double taxation relief agreement for income tax between Malta and the Hashemite Kingdom of Jordan. The Convention entered into force on 13 October 2010.

101
CENTRAL BANK OF MALTA Annual Report 2010
28 December: Legal Notice 560 of 2010 brings into effect double taxation relief in relation to US federal income taxes imposed by the Internal Revenue Code (but excluding social security and unemployment taxes) and federal excise taxes imposed on private foundations. The agreement entered into force on 23 November 2010.
Other fiscal developments
Privatisation
3 June: The Government signs an agreement, which includes the renting of the ship repair facilities formerly part of Malta Shipyards, with the Italian company Palumbo against payment of EUR18 million and the pay-ment of rent over a 30-year period which reaches EUR72.6 million. The agreement also includes a commit-ment by the company to invest a total of EUR31.6 million in the enterprise.
8 July: The Government signs an agreement with the Manoel Island Yacht Yard (MIYY) consortium through which it concedes the yacht repair facilities for the forthcoming 30 years against an offer amounting to EUR18.8 million. The consortium is also expected to invest around EUR6 million more in the facility.
15 December: A contract is signed between the Government and Creek Foundation Consortium for a 25-year concession of the Imsida and Ta’ Xbiex Marinas against an immediate payment of EUR3.9 million and a further payment of EUR7.9 million during the time of the concession. The Foundation will also invest EUR5.7 million for general upgrading.
Tax amnesty
7 July: The Inland Revenue Department announces the second phase of a tax amnesty scheme first intro-duced in September 2009, through which taxpayers facing penalties for non-payment of income tax and social security contributions are offered a reduction of up to 90% on such penalties subject to a number of conditions.
Subsidy scheme
13 October: The Government launches a subsidy scheme on the rate of interest of between 1% and 3% on loans provided by banks and other financial institutions to encourage hotels, restaurants and holiday accommodations to effect upgrading works, offer new services and improve existing ones. The loans must be taken up between June 2010 and December 2013.
Financial sector
Legislation related to banking and finance
Acts
7 May: Act No. II of 2010 is enacted to amend various laws on Financial Institutions and other Financial Ser-vices and to implement Directive 2007/64/EC regarding payment services in the internal market.
26 November: Act No. XIX of 2010 is enacted to amend various financial laws, namely the Malta Financial Services Act, the Financial Markets Act, the Companies Act, the Insurance Business Act, the Investment Services Act, the Duty on Documents and Transfers Act and the Income Tax Act.

102
CENTRAL BANK OF MALTA Annual Report 2010
21 December: Act No. XXV of 2010 is enacted to provide for the protection of the European Communities’ financial interests and to make provision for the criminal prosecution of fraudulent conduct injuring those interests.
Legal Notices
5 March: Legal Notice 109 of 2010 amends the Regulations governing the Depositor Compensation Scheme as regards the operation of the reserve funds set up under the Scheme. It also amends the Second Sched-ule with regard to the accumulated supplementary contributions and the reserve of each participant.
30 April: Legal Notice 243 of 2010 sets the rules for the establishment and operation of cells and cell com-panies in the insurance business.
18 May: Legal Notice 294 of 2010 amends the Prevention of Financial Markets Abuse (Disclosure and Notification) Regulations, 2005, and provides for the competent authority to publish information on specific transactions on its website.
3 August: Legal Notice 377 of 2010 establishes 3 August 2010 as the date when the provisions of Act No. XIV of 2010 come into force. 28 September: Legal Notice 443 of 2010 establishes 30 September 2010 as the date when the regulations on designated financial instruments come into force. These regulations specify shares in companies and other securities, as well as bonds or other forms of securitised debt, as designated financial instruments for the purposes of Part IV of the Financial Markets Act (Cap. 345), which deals with the Central Securities Depository.
26 November: Legal Notice 498 of 2010 issued under the Financial Markets Act (Cap. 345) revokes the Appointment of Listing Authority Order S.L. 345.02.
21 December: Legal Notice 530 of 2010 implements the provisions of the EU Regulation, which entered into force on 7 June 2010, on credit rating agencies.
21 December: Legal Notice 531 of 2010 enables Malta Enterprise to subsidise the rate of interest payable on loans which an undertaking may take out to finance costs to be incurred as part of an eligible investment project. These regulations came into force on 1 October 2010.
28 December: Legal Notice 558 of 2010 provides for the establishment, operation, administration and wind-ing up of cell companies with regard to the business of insurance.
28 December: Legal Notice 559 of 2010 provides for the establishment, operation, administration and wind-ing up of SICAV incorporated cell companies.
MFSA signs agreements with Chinese financial services regulators
26 January: The MFSA announces that it signed a Memorandum of Understanding (MoU) with the China Securities Regulatory Commission to protect and promote the development of the securities markets by providing a framework for cooperation, increased mutual understanding and the exchange of information between the two agencies.
2 February: The MFSA announces that it signed an MoU with the China Banking Regulatory Commission establishing an arrangement for the sharing of information to enhance cooperation on banking supervision.

103
CENTRAL BANK OF MALTA Annual Report 2010
Redomiciliation of offshore funds to Malta
8 January: The MFSA publishes guidelines regarding the redomiciliation of offshore funds to Malta under the Companies Act, Continuation of Companies Regulations, 2002, which provide a simple, one-stop procedure for funds to be redomiciled to Malta.
Shariah fund guidance note
24 March: The MFSA publishes a Guidance Note for Shariah Compliant Funds, explaining how the legal and regulatory framework under the Investment Services Act applies to Shariah-compliant funds established under Maltese law.
International ratings
3 February: Moody’s Investors Service says that Malta’s A1 government ratings reflect the country’s high economic resilience and its very high financial robustness. The outlook for Malta’s government ratings is stable.
12 August: Moody’s confirms Malta’s government debt credit rating at A1 and its outlook as stable, citing Malta’s relatively high GDP per capita and EU and euro area membership as positive factors.
5 October: Standard and Poor’s affirms Malta’s “A/A-1” long and short-term sovereign credit ratings, saying that Malta’s economy weathered the global economic crisis relatively well and predicts positive growth in 2010.
29 October: Fitch Ratings affirm the Republic of Malta’s long-term foreign currency and local currency Issuer Default Ratings at “A+”, respectively. Both ratings have stable outlooks. Fitch affirms Malta’s short-term IDR at “F1” and country ceiling at “AAA”, which is the common country ceiling for the euro area.


FINANCIAL STATEMENTS
FOR THE YEAR ENDED
31 DECEMBER 2010
PART III

A-2
Financial Statements for the year ended 31 December 2010CENTRAL BANK OF MALTA
Directors’ report
The Directors present their report and the audited financial statements of the Central Bank of Malta (“the Bank”) for the year ended 31 December 2010.
Presentation of the financial statementsThese financial statements have been prepared so as to give a true and fair view of the state of affairs of the Bank as at 31 December 2010, and of its profit for the year then ended. The financial statements have been prepared in accordance with the provisions established by the Governing Council of the European Central Bank under Article 26.4 of the Statute of the European System of Central Banks and of the European Central Bank and in accordance with the requirements of the Central Bank of Malta Act (Cap. 204). The provisions established by the Governing Council are outlined in the Accounting Guideline (ECB/2010/20 recast) on the legal framework for accounting and financial reporting in the European System of Central Banks adopted by the Governing Council on 11 November 2010.
Financial resultsThe Bank’s financial statements for the year ended 31 December 2010 are set out on pages A-6 to A-41 and disclose an operating profit of €57.6 million (2009: €58.6 million). The amount payable to the Government of Malta is €48.0 million (2009: €45.6 million).
Board of DirectorsThe members of the Board of Directors during the year ended 31 December 2010 and up to the date of authorisation for issue of the financial statements were:
Mr Michael C. Bonello - GovernorMr David A. Pullicino - Deputy Governor (up to 31 March 2010) Mr Alfred DeMarco - Deputy Governor (appointed on 1 April 2010) Mr Victor Busuttil Ms Antoinette CaruanaMr Mario Micallef (up to 11 June 2010)Professor Josef Bonnici (appointed on 10 January 2011)
During the financial year under review, Dr Bernadette Muscat was Secretary to the Board.
AuditorsKPMG have been appointed as the Bank’s auditors with effect from the financial year ending 31 December 2009 and have signified their willingness to continue in office.
By order of the Board
M. C. Bonello A. DeMarcoGovernor Deputy Governor
Pjazza KastiljaValletta VLT 1060Malta28 March 2011

A-3
CENTRAL BANK OF MALTA Financial Statements for the year ended 31 December 2010
Statement of Directors’ responsibilities in respect of the financial statements
The Board of Directors is responsible for ensuring that the financial statements are drawn up in accordance with the requirements of the Central Bank of Malta Act (Cap. 204). The Bank is required to prepare financial statements in accordance with the requirements of the Accounting Guideline (ECB/2010/20 recast) on the legal framework for accounting and financial reporting in the European System of Central Banks adopted by the Governing Council of the European Central Bank on 11 November 2010.
The Board of Directors is responsible for ensuring that these financial statements give a true and fair view of the state of affairs of the Bank as at 31 December 2010 and of the profit for the year then ended.
In preparing the financial statements, the Directors are responsible for selecting and applying appropriate accounting policies and making accounting estimates that are reasonable in the circumstances.
The Directors are also responsible for designing, implementing and maintaining internal controls relevant to the preparation and the fair presentation of the financial statements that are free from material misstatement, whether due to fraud or error, and that comply with the requirements set out above. They are also respon-sible for safeguarding the assets of the Bank and hence for taking reasonable steps for the prevention and detection of fraud and other irregularities.

A-4
Financial Statements for the year ended 31 December 2010CENTRAL BANK OF MALTA
Independent auditors’ report
To the Board of Directors of the Central Bank of Malta
Report on the financial statementsWe have audited the financial statements of the Central Bank of Malta (“the Bank”) as set out on pages A-6 to A-41, which comprise the balance sheet as at 31 December 2010, the Profit and Loss account for the year then ended, and a summary of significant accounting policies and other explanatory notes.
The responsibility of the Central Bank of Malta’s Board of Directors for the financial statementsAs explained more fully in the Directors’ Responsibilities Statement set out on page A-3, the Directors are responsible for the preparation and fair presentation of these financial statements in accordance with the provisions established by the Governing Council of the European Central Bank, which are set out in Guide-line ECB/2010/20 (recast) issued on 11 November 2010 and the requirements of Central Bank of Malta Act (Chapter 204, Laws of Malta) and for such internal control as the Directors determine are necessary to enable the preparation of financial statements that are free from material misstatement whether due to fraud or error.
Auditors’ responsibilityOur responsibility is to express an opinion on these financial statements based on our audit. This report, including the opinion, has been prepared for and only for the Bank’s Directors in accordance with article 20 of the Central Bank of Malta Act (Chapter 204, Laws of Malta), and in terms of Article 27.1 of the Statute of the European System of Central Banks (ESCB) and of the European Central Bank.
In addition, we read the Directors’ Report and consider the implications for our report if we become aware of any apparent material misstatements of fact.
We conducted our audit in accordance with International Standards on Auditing. Those standards require that we comply with relevant ethical requirements and plan and perform the audit to obtain reasonable assurance whether the financial statements are free from material misstatement.
An audit involves performing procedures to obtain audit evidence about the amounts and disclosures in the financial statements. The procedures selected depend on our judgement, including the assessment of the risks of material misstatement of the financial statements, whether due to fraud or error. In making those risk assessments, we consider internal control relevant to the entity’s preparation and fair presentation of the financial statements in order to design audit procedures that are appropriate in the circumstances, but not for the purpose of expressing an opinion on the effectiveness of the entity’s internal control. An audit also includes evaluating the appropriateness of accounting policies used and the reasonableness of accounting estimates made by the Directors, as well as evaluating the overall presentation of the financial statements.
We believe that the audit evidence we have obtained is sufficient and appropriate to provide a basis for our audit opinion.

A-5
CENTRAL BANK OF MALTA Financial Statements for the year ended 31 December 2010
Opinion on the financial statementsIn our opinion, the financial statements:• give a true and fair view of the financial position of the Bank as at 31 December 2010 and of its
financial performance for the year then ended in accordance with the provisions established by the Governing Council, which are set out in Guideline ECB/2010/20 (recast); and
• have been properly prepared in accordance with the Central Bank of Malta Act (Chapter 204, Laws of Malta).
Noel Mizzi (Partner) for and on behalf of
KPMGRegistered AuditorsPortico BuildingMarina StreetPieta’ PTA 9044Malta
28 March 2011

A-6
Financial Statements for the year ended 31 December 2010CENTRAL BANK OF MALTA
Balance sheet as at 31 December 2010
2010 2009 Assets €'000 €'000
A 1 Gold and gold receivables 3,713 5,174 A 2 Claims on non-euro area residents denominated in foreign currency 399,036 375,025 A 2.1 Receivables from the IMF 146,723 140,528 A 2.2 Balances with banks and security investments, external loans and other
external assets 252,313 234,497 A 3 Claims on euro area residents denominated in foreign currency 250,804 237,965 A 4 Claims on non-euro area residents denominated in euro 104,620 95,666 A 4.1 Balances with banks, security investments and loans 104,620 95,666 A 4.2 Claims arising from the credit facility under ERM II - - A 5 Lending to euro area credit institutions related to monetary policy
operations denominated in euro 1,074,500 1,252,500 A 5.1 Main refinancing operations 384,000 319,000 A 5.2 Longer-term refinancing operations 686,000 933,500 A 5.3 Fine-tuning reverse operations 4,500 - A 5.4 Structural reverse operations - - A 5.5 Marginal lending facility - - A 5.6 Credits related to margin calls - - A 6 Other claims on euro area credit institutions denominated in euro 554 625 A 7 Securities of euro area residents denominated in euro 1,056,271 626,196 A 7.1 Securities held for monetary policy purposes 119,453 - A 7.2 Other securities 936,818 626,196 A 8 General government debt denominated in euro - - A 9 Intra-Eurosystem claims 49,351 48,297 A 9.1 Participating interest in ECB 12,944 11,890 A 9.2 Claims equivalent to the transfer of foreign reserves 36,407 36,407 A 9.3 Claims related to the issuance of ECB debt certificates * - - A 9.4 Net claims related to the allocation of euro banknotes within the Eurosystem - - A 9.5 Other claims within the Eurosystem (net) - - A 10 Items in course of settlement 6,632 5,212 A 11 Other assets 698,261 597,032 A 11.1 Coins of euro area 189 378 A 11.2 Tangible and intangible fixed assets 19,924 20,557 A 11.3 Other financial assets 527,823 448,143 A 11.4 Off-balance sheet instruments revaluation differences 6,311 7,969 A 11.5 Accruals and prepaid expenses 38,429 29,407 A 11.6 Sundry 105,585 90,578
3,643,742 3,243,692
_______________________
Total Assets
* Only an ECB balance sheet item

A-7
CENTRAL BANK OF MALTA Financial Statements for the year ended 31 December 2010
2010 2009 Liabilities €'000 €'000
L 1 Banknotes in circulation 701,151 673,353L 2 Liabilities to euro area credit institutions related to monetary
policy operations denominated in euro 501,197 584,599L 2.1 Current accounts (covering the minimum reserve system) 470,397 447,596L 2.2 Deposit facility 30,800 137,000L 2.3 Fixed-term deposits - - L 2.4 Fine-tuning reverse operations - - L 2.5 Deposits related to margin calls - 3L 3 Other liabilities to euro area credit institutions denominated in euro - - L 4 Debt certificates issued* - - L 5 Liabilities to other euro area residents denominated in euro 410,881 397,690L 5.1 General government 389,659 392,912L 5.2 Other liabilities 21,222 4,778L 6 Liabilities to non-euro area residents denominated in euro 96,962 86,785L 7 Liabilities to euro area residents denominated in foreign currency 96,523 71,582L 8 Liabilities to non-euro area residents denominated in foreign
currency 27 9L 8.1 Deposits, balances and other liabilities 27 9L 8.2 Liabilities arising from the credit facility under ERM II - - L 9 Counterpart of special drawing rights allocated by the IMF 110,399 103,854L 10 Intra-Eurosystem liabilities 1,329,739 908,761L 10.1 Liabilities equivalent to the transfer of foreign reserves* - - L 10.2 Liabilities related to the issuance of ECB debt certificates - - L 10.3 Net liabilities related to the allocation of euro banknotes within the
Eurosystem 104,533 95,073L 10.4 Other liabilities within the Eurosystem (net) 1,225,206 813,688L 11 Items in course of settlement - - L 12 Other liabilities 68,164 98,259L 12.1 Off-balance sheet instruments revaluation differences - - L 12.2 Accruals and income collected in advance 52,035 67,397L 12.3 Sundry 16,129 30,862L 13 Provisions 1,970 3,579L 14 Revaluation accounts 12,265 16,545L 15 Capital and reserves 266,464 253,042L 15.1 Capital 20,000 20,000L 15.2 Reserves 246,464 233,042L 16 Profit for the year 48,000 45,634
3,643,742 3,243,692Total Liabilities

A-8
Financial Statements for the year ended 31 December 2010CENTRAL BANK OF MALTA
Profit and Loss account for the year ended 31 December 2010
The financial statements on pages A-6 to A-41 were approved for issue by the Board of Directors on 28 March 2011 and were signed on its behalf by:
M. C. Bonello A. DeMarco P. R. Muscat* R. Filletti*Governor Deputy Governor Director Director Financial Services Market Operations
* As at 31 December 2010, Mr P. R. Muscat occupied the post of Director Finance and Banking Division and Mr R. Filletti occupied the post of Financial Controller.
2010 2009 €’000 €’000
1.1 Interest income 71,573 69,917 1.2 Interest expense (16,005) (10,521)1 Net interest income 55,568 59,396 2.1 Realised gains / (losses) arising from financial operations 11,688 5,168 2.2 Write-downs on financial assets and positions (5,459) (1,498)2.3 Transfer (to) / from provisions for foreign exchange rate, interest rate, credit and
gold price risks2 Net result of financial operations, write-downs and risk provisions 6,229 3,670 3.1 Fees and commissions income 96 80 3.2 Fees and commissions expense (559) (511)3 Net income / (expense) from fees and commissions (463) (431)4 Income from equity shares and participating interests 1,328 817 5 Net result of pooling of monetary income (1,013) 803 6 Other income 12,158 9,443
Total net income 73,807 73,698 7 Staff costs (10,934) (8,790)8 Administrative expenses (3,879) (3,440)9 Depreciation of tangible and intangible fixed assets (1,067) (1,386)10 Banknote production services (306) (1,069)11 Other expenses (3) (379)
Profit for the year 57,618 58,634
Transfer to reserves for risks and contingencies (9,618) (13,000)
Payable to the Government of Malta in terms of article 22(2) of the Central Bank of Malta Act (Cap. 204)
-
45,634 48,000
-

A-9
CENTRAL BANK OF MALTA Financial Statements for the year ended 31 December 2010
Notes to the financial statements for the year ended 31 December 2010
General notes to the financial statements
1 Introduction of the euroMalta introduced the euro as the new legal tender on 1 January 2008. As of that date, the Bank became part of the Eurosystem and took over joint responsibility for monetary policy and for exercising the common strategic goals of the European System of Central Banks (ESCB).1
2 Basis of preparation The Central Bank of Malta is required under article 21(5) of the Central Bank of Malta Act (Cap. 204) to prepare its financial statements in accordance with the provisions established by the Governing Council of the European Central Bank (the “ECB”) under Article 26.4 of the Statute of the European System of Central Banks and of the European Central Bank (the “Statute”). These provisions are outlined in the Accounting Guideline (ECB/2010/20 recast) on the legal framework for accounting and financial reporting in the Euro-pean System of Central Banks adopted by the Governing Council of the ECB on 11 November 2010. In the absence of requirements and guidance provided by the Accounting Guideline that specifically apply to transactions, other events or conditions, the requirements of International Financial Reporting Standards as adopted by the EU are applied.
These financial statements have been drawn up so as to give a true and fair view of the state of affairs of the Bank as at 31 December 2010 and of its profit for the year then ended. The accounts have been prepared on a historical cost basis, modified to include market valuation of marketable securities classified as other than held-to-maturity, gold and all instruments, on-balance sheet and off-balance sheet.
3 Accounting policies
(a) Basic accounting principlesThe following accounting principles have been applied in the preparation of these financial statements:- economic reality and transparency- prudence- post-balance sheet events- materiality- going concern basis- accruals principle- consistency and comparability.
(b) Recognition of assets and liabilitiesAn asset or liability is only recognised in the Balance sheet when it is probable that any associated future economic benefit will flow to or from the Bank, substantially all of the associated risks and rewards have been transferred to the Bank, and the cost or value of the asset or the amount of the obligation can be mea-sured reliably.
1 The ESCB comprises the ECB and the national central banks (NCBs) of all EU Member States (Article 107.1 of the Treaty) whether they have adopted the euro or not. The “Eurosystem” comprises the ECB and the NCBs of those countries that have adopted the euro. The Eurosystem and the ESCB will co-exist as long as there are EU Member States outside the euro area.

A-10
Financial Statements for the year ended 31 December 2010CENTRAL BANK OF MALTA
(c) Recording of transactionsForeign exchange transactions, comprising spot and forward transactions in gold and foreign currencies, are recorded off-balance sheet on trade date at the prevailing spot exchange rate for ascertaining the average acquisition costs and the realised gains and losses. Accordingly, purchases and sales of foreign currency affect the net foreign currency position on the trade date and realised gains and losses arising from the net reduction in foreign currency positions are calculated on trade date. On-balance sheet recording of these transactions is carried out on settlement date at the original spot exchange rates. In the case of foreign exchange swaps, spot and forward amounts are translated to euro at the same exchange rate, and accord-ingly these contracts do not affect foreign currency positions.
All securities transactions are recorded on-balance sheet on settlement date at the applicable exchange rate. Accrued interest, premiums and discounts related to financial assets and liabilities are calculated and booked daily from the settlement date at daily exchange rates, as applicable, and the foreign currency posi-tion is affected daily by these accruals denominated in foreign currency.
All other transactions are recorded in the Balance sheet at market exchange rates prevailing on the day of the transaction.
(d) Balance sheet valuation rulesFinancial assets and liabilities denominated in foreign currency, including off-balance sheet positions, are revalued at the prevailing mid-market exchange rates at the balance sheet date. Securities and Treasury bills other than those classified as held-to-maturity are revalued at the prevailing mid-market prices at the balance sheet date.
Gold balances are valued at market prices prevailing at the year end. No distinction is made between price and currency revaluation differences for gold, but a single gold revaluation difference is accounted for on the basis of the euro price per defined unit of weight of gold derived from the euro-US dollar exchange rate at the balance sheet date.
Foreign currency positions (including off-balance sheet transactions) are revalued on a currency-by-currency basis. For the purpose of this accounting policy, holdings of SDR currency, including designated individual foreign exchange holdings underlying the SDR basket, shall be treated as one holding. In the case of securi-ties, revaluation is carried out on a code-by-code basis (same ISIN number / type) and is treated separately from exchange rate revaluation.
All other assets and liabilities are presented at purchase price or, where applicable, at their nominal value. The Bank’s participating interest in the ECB is measured at cost.
(e) Cost of transactionsThe average cost method is used on a daily basis for calculating the acquisition cost in the case of assets and liabilities that are subject to price and / or exchange rate movements. The average cost price of securi-ties and / or the average rate of the foreign currency position is adjusted by unrealised losses taken to the Profit and Loss account at the end of the year.
All securities are initially recorded at acquisition cost. For the purpose of calculating the average purchase cost of a security, all purchases made during the day are added to the cost of the previous day’s holding to produce a new weighted average price before applying the sales for the same day.
In the case of long foreign currency or gold positions, net inflows made during the day are added at the aver-age cost of the inflows for each respective currency or gold, to the previous day’s holding to produce a new

A-11
CENTRAL BANK OF MALTA Financial Statements for the year ended 31 December 2010
weighted average cost. Where a short position exists, the reverse treatment applies whereby the average cost is affected by net outflows.
(f) Income recognitionIncome and expenses are recognised in the period in which they are earned or incurred.
(i) Interest income and expenseInterest income and expense are recognised in the Profit and Loss account for all interest-bearing assets and liabilities. Premiums or discounts arising from the difference between the average acquisition cost and the redemption price on securities are presented as part of interest income and are amortised over the remaining term of the security using either the straight-line method or the internal rate of return method. The internal rate of return method is used in the case of discounted securities with a remaining maturity of more than one year at the time of acquisition. Interest accruals on foreign currency assets and liabilities are converted at the mid-market rate on each business day and are included in the respective foreign currency position to determine the average book value, as applicable.
Accordingly, interest income includes coupons earned on securities and amortised premiums or discounts on Treasury bills and other instruments. In respect of forward exchange contracts, the difference between the deemed spot exchange rate of the forward contract and the deal rate is considered as interest income or expense and is amortised on a straight-line basis from the trade date to settlement date.
(ii) Gains and losses arising from foreign exchange, gold and securitiesRealised gains and realised losses can only arise in the case of transactions leading to a reduction in foreign currency positions or on the sale of securities.
In the case of foreign currency or gold positions, any inflows and outflows are compared against each other to determine any realised gains or losses. The resulting net inflow or outflow, apart from changing the posi-tion in that currency, will give rise to a change in the average cost of that currency or to the realisation of a further profit or loss depending on whether the Bank has a long or short position in that currency respectively. Every day, a weighted average price is calculated, firstly on inflows and secondly on outflows. The realised gain / loss is calculated by applying the difference between these average prices to the lower of the day’s inflows or outflows.
For long positions, where outflows exceed inflows, a second realised gain / loss is calculated, equating to the difference between the net outflows of the day valued at the average outflow price and at the average cost of the day’s opening position. Where inflows exceed outflows, the net inflow is added to the position held at the beginning of the day, thus changing the average cost of the position. For short positions, the reverse accounting treatment is applied.
In the case of securities, realised gains or losses are derived by comparing the transaction value with the average book value using the average cost method.
Realised gains and losses are taken to the Profit and Loss account.
Unrealised revaluation gains and unrealised revaluation losses arise as a result of the revaluation of assets and liabilities by comparing the market value with the average book value. Unrealised gains are not recog-nised as income but are transferred directly to a revaluation account within the Bank’s liabilities. Unrealised losses, except as explained in Note (h) (ii), are taken to the Profit and Loss account when they exceed previ-ous unrealised gains registered in the corresponding revaluation account. Unrealised losses recorded in the Profit and Loss account in previous years are not reversed against new unrealised gains in subsequent years. Unrealised losses in any one security or in any foreign currency (including gold holdings) are not net-ted against unrealised gains in other securities or foreign currency.

A-12
Financial Statements for the year ended 31 December 2010CENTRAL BANK OF MALTA
(g) Off-balance sheet instrumentsSpot and forward foreign exchange contracts are included in the net foreign currency position for the purpose of calculating the average cost of currencies and determining realised foreign exchange gains and losses.
Gains and losses arising from spot and forward foreign exchange contracts are recognised and treated in a similar manner to on-balance sheet instruments. Realised and unrealised gains and losses are measured and accounted for in the manner outlined in Accounting policy (f) “Income recognition” above. Unrealised valuation gains / losses on spot and forward foreign exchange contracts are recorded from the trade date to the settlement date under asset sub-item A11.4 “Off-balance sheet instruments revaluation differences” and under liability sub-item L12.1 “Off-balance sheet instruments revaluation differences” as applicable.
(h) Securities
(i) Securities held for monetary policy purposesFollowing the decisions of the Governing Council of 2009 and 2010, the securities held for monetary policy purposes comprise of euro-denominated covered bonds issued in the euro area and public and/or private debt under the Securities Market Programme. These securities are valued at amortised cost and subject to impairment test.
(ii) Securities held for other than monetary policy purposesMarketable securities classified as held-to-maturity are measured at amortised cost less provisions for impairment if any. Held-to-maturity securities are securities with fixed or determinable payments and a fixed maturity, which the Bank intends to hold until maturity.
Marketable securities (other than those held-to-maturity and similar assets) are valued, either at the mid-market prices or on the basis of the relevant yield curve prevailing at the balance sheet date, on a security by security basis. For the year ending 31 December 2010, mid-market prices at 31 December 2010 were used.
Securities which are designated as part of an earmarked portfolio comprising earmarked investments held on the assets side of the Balance sheet as a counterpart to the Bank’s capital and statutory reserves are classified as held-to-maturity investments.
Securities forming part of an earmarked portfolio comprising Malta Government securities and Treasury bills purchased on the secondary market by the Bank in its role as a market maker are measured at mid-market prices prevailing at the balance sheet date. Unrealised gains are reflected on-balance sheet in the liability sub-item L12.3 “Sundry liabilities” whilst unrealised losses are recognised in asset sub-item A11.6 “Sundry assets”.
(i) Sale and repurchase agreements and lending of securitiesSecurities sold subject to repurchase agreements (“repos”) are retained in the financial statements in the appropriate classification on the assets side of the Balance sheet; the counterparty liability is included as a collateralised inward deposit on the liabilities side of the Balance sheet, as appropriate. Securities pur-chased under agreements to resell (“reverse repos”) are recorded as a collateralised outward loan on the assets side of the Balance sheet, as appropriate. The difference between the sale and repurchase price is treated as interest and is accrued in the Profit and Loss account over the term of the agreement on a straight-line basis.
Securities lent to counterparties are also retained in the financial statements.
A-13
CENTRAL BANK OF MALTA Financial Statements for the year ended 31 December 2010
(j) Claims on the International Monetary Fund (“IMF”) The IMF Reserve Tranche Position and Special Drawing Rights (SDR) are translated into euro at the year end ECB euro / SDR exchange rate. The IMF euro holdings are revalued against the SDR at the prevail-ing representative rate for the euro as quoted by the Fund at the close of business on 31 December 2010. Adjustments on revaluation of the IMF holdings are reflected in the corresponding asset “Currency Subscrip-tion” disclosed in asset sub-item A11.6 “Sundry assets”.
(k) Accounting for euro coinsSubsequent to the agency agreement between the Bank and the Government of Malta, the face value of the euro coins issued by the Bank gives rise to a reserve in the form of a capital contribution by the Government. Deposits of euro coins with the Bank constitute a reversal of the capital contribution as disclosed in Note L15.2 “Reserves” in the Notes to the Balance sheet.
(l) Demonetised Maltese lira currency notes and coins
(i) Demonetised Maltese lira currency notesDemonetised Maltese lira currency notes shall, until ten years following the expiration of the period men-tioned in the notice of demonetisation, be redeemable by the Bank on demand for euro at the conversion rate of the Maltese lira for the euro of 0.4293 established in terms of the Treaty and without charge.
In accordance with article 62 of the Central Bank of Malta Act (Cap. 204), after the expiration of one year following the end of the period established in the notice, any unpresented demonetised Maltese lira cur-rency notes cease to be included in the Bank’s currency liabilities. The value of such notes, after deducting therefrom the value of any notes which are subsequently redeemed, shall be apportioned to the profits of the Bank over the remaining period until the expiration of the ten-year period.
(ii) Demonetised Maltese lira currency coinsDemonetised Maltese lira currency coins shall, until two years following the expiration of the period men-tioned in the notice of demonetisation, be redeemable by the Bank on demand for euro currency at the con-version rate of the Maltese lira for the euro of 0.4293 established in terms of the Treaty and without charge.
In accordance with article 63 of the Central Bank of Malta Act (Cap. 204), after the expiration of six months following the end of the period established in the notice, any unpresented demonetised Maltese lira currency coins cease to be included in the Bank’s currency liabilities. The value of such coins, after deducting there-from the value of any coins which are subsequently redeemed, shall be apportioned to the profits of the Bank over the remaining period until the expiration of the two-year period.
(m) Tangible and intangible fixed assetsAll tangible and intangible fixed assets are stated at historical cost less depreciation. Historical cost includes expenditure that is directly attributable to the acquisition of the items. Subsequent costs are included in the asset’s carrying amount or are recognised as a separate asset, as appropriate, only when it is probable that future economic benefits associated with the item will flow to the Bank and the cost of the item can be mea-sured reliably. All repairs and maintenance are charged to the Profit and Loss account during the financial period in which they are incurred.
Depreciation is calculated using the straight-line method to allocate the cost of the assets to their residual values over their estimated useful lives as follows:

A-14
Financial Statements for the year ended 31 December 2010CENTRAL BANK OF MALTA
Freehold buildings 2%Leasehold property Over the remaining term of the leaseComputer equipment and other fixed assets 10 - 25%
Tangible and intangible fixed assets are reviewed for impairment whenever events or changes in circum-stances indicate that the carrying amount may not be recoverable. An asset’s carrying amount is written down immediately to its recoverable amount if the asset’s carrying amount is greater than its estimated recoverable amount.
An item of property, plant and equipment is derecognised upon disposal or when no future economic benefits are expected from its use or disposal. Gains and losses arising on derecognition are determined by compar-ing proceeds with the carrying amount. These are included in the Profit and Loss account in the year the asset is derecognised.
(n) ProvisionsProvisions are recognised when the Bank has a present legal or constructive obligation as a result of past events. It is more likely than not that an outflow of resources will be required to settle the obligation and the amount can be reliably estimated.
4 Capital keyThe capital key determines the allocation of the ECB’s share capital to the NCBs. It is determined on the basis of population and gross domestic product data. It is adjusted every five years and every time that a new member state joins the European Union in accordance with the requirements of the Statute. The capital key of the Bank during the financial year ended 31 December 2010 was 0.0632% (2009: 0.0632%). The Eurosystem capital key is the respective NCB’s share of the total share capital held by Eurosystem members in the ECB and is utilised as the basis for allocation of monetary income, banknotes in circulation and the ECB’s results.
5 Change to the capital keyOn 1 January 2009, the ESCB experienced a quinquennial capital key change in accordance with Article 29.3 of the Statute. As explained in paragraph 4 “Capital key” above, the Bank’s share in the fully paid-up capital of the ECB increased from 0.0622% to 0.0632%. As at the same date, the Eurosystem also expand-ed due to the accession of Národná banka Slovenska which paid its capital share in full. In 2010 there were no changes to the capital key. In 2011, the Eurosystem expanded due to the accession of Eesti Pank, which did not have any effect on the Bank’s capital key.
6 Banknotes in circulationEuro banknotes are issued by the ECB and the sixteen participating NCBs, which together comprise the Eurosystem. The total value of euro banknotes in circulation is allocated on the last working day of each month in accordance with the banknote allocation key.2
The ECB has been allocated a share of 8% of the total value of euro banknotes in circulation, whereas the remaining 92% has been allocated to the NCBs according to their capital key. In the year under review, the Bank had a 0.0906% share (2009: 0.0906%) in the paid-up capital of the ECB, (referred also as Eurosystem capital key), and a 0.0835% share (2009: 0.0835%) of the euro banknotes in circulation in accordance with the banknote allocation key. The share of banknotes allocated to each NCB is disclosed in the Balance sheet under liability item L1 “Banknotes in circulation”.
2 Banknote allocation key means the percentages that result from taking into account the ECB’s share in the total euro banknote issue and applying the Eurosystem capital key to the NCBs’ share in such total.
A-15
CENTRAL BANK OF MALTA Financial Statements for the year ended 31 December 2010
The difference between the value of the euro banknotes allocated to each NCB in accordance with the banknote allocation key and the value of the euro banknotes that it actually puts into circulation, as reduced by banknotes withdrawn from circulation, gives rise to intra-Eurosystem balances remunerated3 at the main refinancing operations rate. If the value of the euro banknotes actually issued is greater than the value according to the banknote allocation key, the excess is recorded in the Balance sheet under liability sub-item L10.3 “Net liabilities related to the allocation of euro banknotes within the Eurosystem”. If the value of the euro banknotes actually issued is less than the value according to the banknote allocation key, the shortfall is recorded in the Balance sheet under asset sub-item A9.4 “Net claims related to the allocation of euro banknotes within the Eurosystem”.
In the cash changeover year4 and in the following five years following the cash changeover year, the intra-Eurosystem balances arising from the allocation of euro banknotes are adjusted in order to avoid significant changes in the NCB’s relative income positions as compared to previous years. The adjustments are effect-ed by taking into account the differences between the average value of the banknotes which the NCB had in circulation in the reference period,5 and the average value of banknotes which would have been allocated to it during that period in accordance with its capital key. The adjustments are reduced in annual stages until the first day of the sixth year after the cash changeover year, when income on banknotes will be allocated fully in proportion to the NCB’s Eurosystem capital key. The Bank’s adjustment period started on 1 January 2008 and will end on 31 December 2013.
The interest income and expense on these balances is cleared through the accounts of the ECB and is dis-closed in the Profit and Loss account under item 1 “Net interest income”.
7 Interim profit distributionThe Governing Council of the ECB has decided that the seigniorage income of the ECB, which arises from the 8% share of euro banknotes allocated to the ECB, and the ECB’s (net) income arising from SMP securi-ties shall be due to the NCBs in the same financial year it accrues and distributed in January of the following year in the form of an interim distribution of profit.6 The amount of the ECB’s income on euro banknotes in cir-culation may be reduced in accordance with any decision by the Governing Council in respect of expenses incurred by the ECB in connection with the issue and handling of euro banknotes. Before the end of the year, the Governing Council decides whether all or part of the ECB’s income arising from SMP securities and, if necessary, all or part of the ECB’s income on euro banknotes in circulation should be retained to the extent necessary to ensure that the amount of the distributed income does not exceed the ECB’s net profit for that year. The Governing Council may also decide to transfer part or all of the ECB’s income arising from SMP securities and if necessary, all or part of the ECB’s seigniorage income to a provision for foreign exchange rate, interest rate, credit and gold price risks. The amount distributed to the Bank is disclosed in the Profit and Loss account under item 4 “Income from equity shares and participating interests”.
8 Intra-Eurosystem balancesIntra-Eurosystem transactions are cross-border transactions that occur between Eurosystem NCBs. These transactions are processed primarily via TARGET2 and give rise to the daily net bilateral position vis-à-vis the ECB. This position in the financial statements of the Bank represents the net claim or liability of the Bank against the rest of the ESCB members connected to TARGET2. The resulting balance is included as an asset or liability, as appropriate, under the sub-items A9.5 / L10.4 “Other claims / liabilities within the Eurosystem (net)”.
3 ECB Decision of 25 November 2010 on the allocation of monetary income of the national central banks of Member States whose cur-rency is the euro (ECB/2010/23) (recast) OJ L35/17.4 Cash changeover year refers to the year in which the euro banknotes are introduced as legal tender in the respective Member State; for Malta this is 2008.5 The reference period refers to the 24 months which start 30 months before the day on which euro banknotes become legal tender in the respective Member State; for Malta this is the period from July 2005 to June 2007.6 ECB Decision of 25 November 2010 on the interim distribution of the income of the European Central Bank on euro banknotes in circula-tion and arising from securities purchased under the securities markets programme (ECB/2010/24) OJ L6/35.
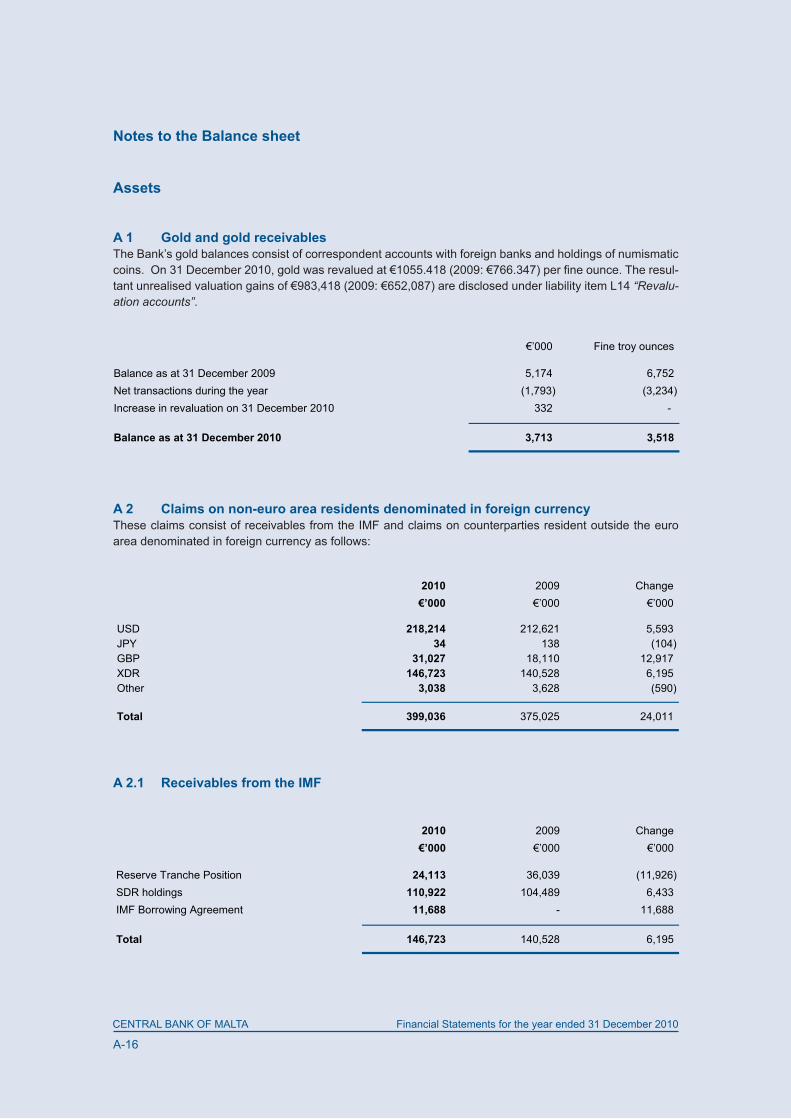
A-16
Financial Statements for the year ended 31 December 2010CENTRAL BANK OF MALTA
Notes to the Balance sheet
Assets
A 1 Gold and gold receivablesThe Bank’s gold balances consist of correspondent accounts with foreign banks and holdings of numismatic coins. On 31 December 2010, gold was revalued at €1055.418 (2009: €766.347) per fine ounce. The resul-tant unrealised valuation gains of €983,418 (2009: €652,087) are disclosed under liability item L14 “Revalu-ation accounts”.
A 2 Claims on non-euro area residents denominated in foreign currencyThese claims consist of receivables from the IMF and claims on counterparties resident outside the euro area denominated in foreign currency as follows:
A 2.1 Receivables from the IMF
€’000 Fine troy ounces
Balance as at 31 December 2009 5,174 6,752 Net transactions during the year (1,793) (3,234)Increase in revaluation on 31 December 2010 332 -
Balance as at 31 December 2010 3,713 3,518
2010 2009 Change €’000 €’000 €’000
USD 218,214 212,621 5,593 JPY 34 138 (104)GBP 31,027 18,110 12,917 XDR 146,723 140,528 6,195 Other 3,038 3,628 (590)
Total 399,036 375,025 24,011
2010 2009 Change €’000 €’000 €’000
Reserve Tranche Position 24,113 36,039 (11,926)SDR holdings 110,922 104,489 6,433 IMF Borrowing Agreement 11,688 - 11,688
Total 146,723 140,528 6,195

A-17
CENTRAL BANK OF MALTA Financial Statements for the year ended 31 December 2010
(a) IMF quota Malta’s membership subscription to the IMF amounts to SDR102,000,000 (2009: SDR102,000,000). The Bank’s financial position relating to this subscription at 31 December 2010 is reflected in the Balance sheet as follows:
(i) Reserve Tranche Position included in the above table is equivalent to SDR20,837,120 (2009: SDR33,105,960). This amount is a claim on the IMF and represents the difference between the quota of SDR102,000,000 and the balances in euro at the disposal of the Fund. During the period under review, Malta’s reserve tranche declined by SDR12.3 million due to net repayments by bor-rowing countries under IMF lending arrangements.
(ii) Currency Subscription included within asset sub-item A11.6 “Sundry assets” is stated at €94,121,796 (2009: €74,971,940) and represents the balance of the quota in euro. A correspond-ing liability included in liability item L6 “Liabilities to non-euro area residents denominated in euro” exists in the form of IMF current accounts of €94,121,796 or SDR81,162,880 (2009: €74,971,940 or SDR68,894,040).
(b) Malta’s SDR position in the IMFMalta’s SDR holdings included in the table above are equivalent to SDR95,853,968 (2009: SDR95,984,437). These include the SDRs allocated to Malta amounting to SDR95,401,757 (2009: SDR95,401,757), to which a corresponding liability exists in the form of a restricted demand deposit of the Government of Malta includ-ed under liability item L9 “Counterpart of special drawing rights allocated by the IMF” together with other SDRs acquired in accordance with IMF requirements and procedures. SDRs allocated to Malta cannot be withdrawn unless such advice is received from the Fund. Other SDRs have no specified maturity. In 2010, there were no new allocations (2009: SDR84.1 million). In November 2009, the Bank entered into a two-way voluntary trading arrangement with the IMF. Under this arrangement the Bank stands ready to buy and sell SDRs against euro, subject to certain limits, in transactions that the Fund arranges between prospective buyers and sellers of SDRs. There were no transactions during 2010 and 2009 in relation to this arrange-ment.
The Reserve Tranche Position, SDR holdings and the SDR allocation are subject to SDR interest rates quoted by the Fund on a weekly basis. The Currency Subscription and IMF current accounts are not subject to interest.
(c) IMF facilities for low-income countriesIn 2009, Malta committed to make a new contribution of subsidy resources to the Poverty Reduction and Growth Trust (PRGT) in support of the IMF’s efforts to assist its low income member countries. Thus, a con-tribution of SDR0.2 million was effected during 2010.
(d) Bilateral Borrowing AgreementIn February 2010, the IMF and the Bank signed an agreement to provide the Fund with an SDR denominated amount up to the equivalent of €120 million, as part of a commitment made by the EU in 2009 to support the IMF’s lending capacity. The total term of this interest-bearing agreement shall not exceed four years. As at 31 December 2010, the amount utilised under this facility stood at €11.7 million.

A-18
Financial Statements for the year ended 31 December 2010CENTRAL BANK OF MALTA
A 2.2 Balances with banks and security investments, external loans and other external assetsThese assets principally include security investments issued by non-euro area residents and balances with banks outside the euro area.
A 3 Claims on euro area residents denominated in foreign currencyThese foreign currency assets mainly comprise investments in marketable debt securities issued by euro area residents and balances with banks within the euro area as follows:
Contrary to 2009, the short-term US dollar liquidity-providing programme (Term Auction Facility) was not availed of in 2010 (2009: nil). Under this programme, US dollars were provided by the Federal Reserve to the ECB by means of a temporary reciprocal currency arrangement (swap line) with the aim of offering short-term US dollar funding to Eurosystem counterparties. The ECB simultaneously entered into back-to-back swap transactions with NCBs that have adopted the euro, which used the resulting funds to conduct liquidity-providing operations with the Eurosystem counterparties in the form of reverse and swap transac-tions. The back-to-back swap transactions between the ECB and NCBs resulted in intra-Eurosystem bal-ances reported under liability sub-item L10.4 “Other liabilities within the Eurosystem (net)”.
2010 2009 Change €’000 €’000 €’000
177,084 144,275 32,809
Fixed-term deposits 70,155 84,995 (14,840)Current accounts and overnight deposits 4,637 4,867 (230)
437 360 77
252,313 234,497 17,816
Marketable debt securities other than those held-to-maturity
Other external assets
Balances with banks
Total
2010 2009 Change €’000 €’000 €’000
USD 244,005 237,942 6,063 GBP 23 23 - Other 6,776 - 6,776
Total 250,804 237,965 12,839
2010 2009 Change €’000 €’000 €’000
109,176 82,030 27,146
Fixed-term deposits 141,560 155,907 (14,347)Current accounts and overnight deposits 68 28 40
250,804 237,965 12,839
Balances with banks
Total
Marketable debt securities other than those held-to-maturity
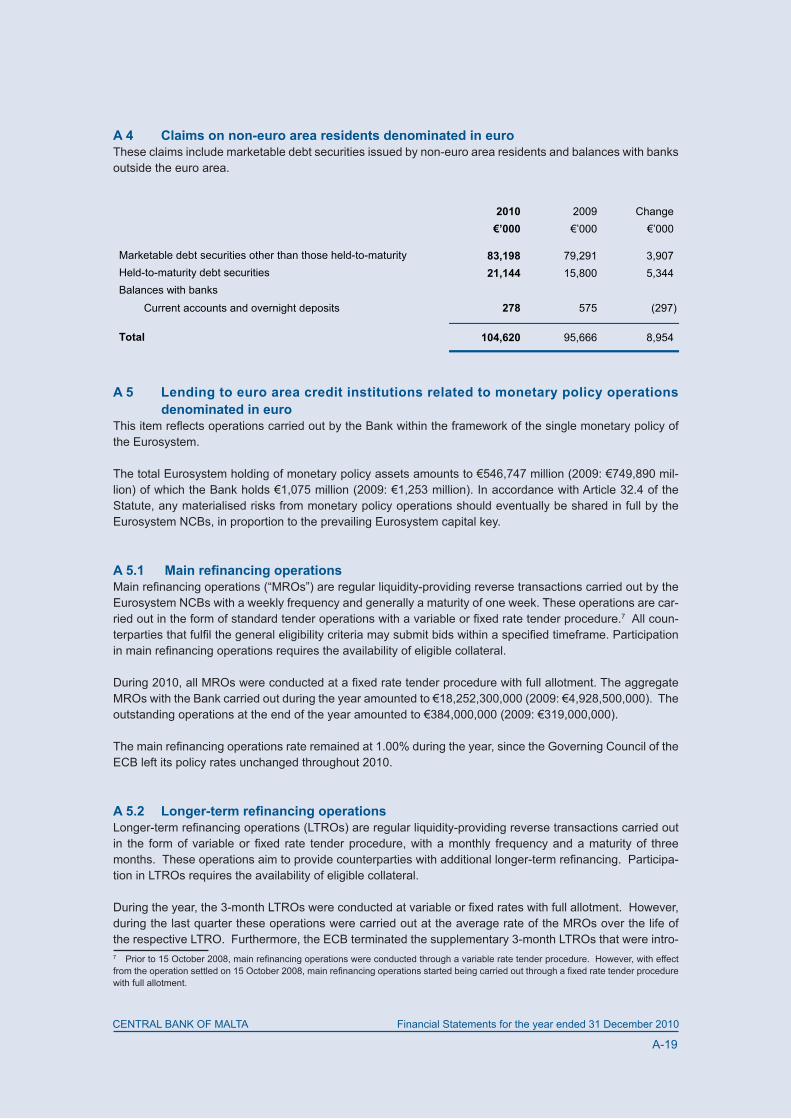
A-19
CENTRAL BANK OF MALTA Financial Statements for the year ended 31 December 2010
A 4 Claims on non-euro area residents denominated in euroThese claims include marketable debt securities issued by non-euro area residents and balances with banks outside the euro area.
A 5 Lending to euro area credit institutions related to monetary policy operations denominated in euroThis item reflects operations carried out by the Bank within the framework of the single monetary policy of the Eurosystem.
The total Eurosystem holding of monetary policy assets amounts to €546,747 million (2009: €749,890 mil-lion) of which the Bank holds €1,075 million (2009: €1,253 million). In accordance with Article 32.4 of the Statute, any materialised risks from monetary policy operations should eventually be shared in full by the Eurosystem NCBs, in proportion to the prevailing Eurosystem capital key.
A 5.1 Main refinancing operations Main refinancing operations (“MROs”) are regular liquidity-providing reverse transactions carried out by the Eurosystem NCBs with a weekly frequency and generally a maturity of one week. These operations are car-ried out in the form of standard tender operations with a variable or fixed rate tender procedure.7 All coun-terparties that fulfil the general eligibility criteria may submit bids within a specified timeframe. Participation in main refinancing operations requires the availability of eligible collateral.
During 2010, all MROs were conducted at a fixed rate tender procedure with full allotment. The aggregate MROs with the Bank carried out during the year amounted to €18,252,300,000 (2009: €4,928,500,000). The outstanding operations at the end of the year amounted to €384,000,000 (2009: €319,000,000).
The main refinancing operations rate remained at 1.00% during the year, since the Governing Council of the ECB left its policy rates unchanged throughout 2010.
A 5.2 Longer-term refinancing operationsLonger-term refinancing operations (LTROs) are regular liquidity-providing reverse transactions carried out in the form of variable or fixed rate tender procedure, with a monthly frequency and a maturity of three months. These operations aim to provide counterparties with additional longer-term refinancing. Participa-tion in LTROs requires the availability of eligible collateral.
During the year, the 3-month LTROs were conducted at variable or fixed rates with full allotment. However, during the last quarter these operations were carried out at the average rate of the MROs over the life of the respective LTRO. Furthermore, the ECB terminated the supplementary 3-month LTROs that were intro-7 Prior to 15 October 2008, main refinancing operations were conducted through a variable rate tender procedure. However, with effect from the operation settled on 15 October 2008, main refinancing operations started being carried out through a fixed rate tender procedure with full allotment.
2010 2009 Change €’000 €’000 €’000
83,198 79,291 3,907 21,144 15,800 5,344
Current accounts and overnight deposits 278 575 (297)
104,620 95,666 8,954
Held-to-maturity debt securitiesBalances with banks
Total
Marketable debt securities other than those held-to-maturity

A-20
Financial Statements for the year ended 31 December 2010CENTRAL BANK OF MALTA
duced during 2008. The maintenance period operations that are conducted on the last day of the reserve maintenance period remained in operation.
The ECB announced two specific 6-month LTROs with full allotment which were conducted in March and May fixed at the average minimum bid rate of the MROs over the life of these instruments.
The aggregate LTROs carried out during 2010 amounted to €1,145,690,000 (2009: €1,226,700,000), whilst the outstanding LTROs at the end of the year amounted to €686,000,000 (2009: €933,500,000).
A 5.3 Fine-tuning reverse operationsFine-tuning reverse operations are executed on an ad hoc basis with a view of managing the liquidity situa-tion in the market and steering interest rates. The choice of fine-tuning instruments and procedures depends on the type of transaction and its underlying objective. Fine-tuning operations are normally executed through quick tenders or through bilateral procedures. The Governing Council of the ECB may, under exceptional circumstances, empower the ECB to conduct bilateral fine-tuning operations itself. Participation in liquidity-providing reverse operations would only be allowed against eligible collateral.
During 2010, the ECB conducted four liquidity-providing fine-tuning reverse operations. The aggregate fine-tuning reverse operations with the Bank carried out during the year amounted to €384,500,000 (No fine-tuning reverse operations were conducted during 2009). The outstanding operations as at end of the year amounted to €4,500,000.
A 5.4 Structural reverse operationsStructural operations can be executed in the form of reverse open market transactions aimed at adjusting the structural position of the Eurosystem vis-à-vis the financial sector. Structural reverse operations are liquidity-providing operations with a non-standardised maturity period. All eligible counterparties may submit bids for such operations and must be backed by underlying eligible assets. No structural operations were conducted by the ECB during 2010.
A 5.5 Marginal lending facilityThe marginal lending facility is available to eligible counterparties to obtain overnight liquidity from NCBs at a predetermined interest rate against eligible assets and is intended to satisfy counterparties’ temporary liquidity needs. Under normal circumstances, the interest rate on the facility provides a ceiling for the over-night market interest rate. During 2010, the aggregate volume of such transactions with the Bank amounted to €686,062,610 (2009: €1,050,745,776). There were no outstanding balances as at 31 December 2010 (2009: nil).
The marginal lending facility rate during 2010 remained unchanged at 1.75%.
A 5.6 Credits related to margin callsThis sub-item refers to cash paid to counterparties in those instances where the market value of the collat-eral exceeds an established trigger point implying an excess of collateral with respect to outstanding mon-etary policy operations. Since the Bank operates a general pooling system, no payments to counterparties are effected.

A-21
CENTRAL BANK OF MALTA Financial Statements for the year ended 31 December 2010
A 6 Other claims on euro area credit institutions denominated in euroThis item relates to claims on credit institutions within the euro area which do not relate to monetary policy operations, consisting mainly of balances and placements with banks.
A 7 Securities of euro area residents denominated in euro
A 7.1 Securities held for monetary policy purposesThis item contains securities acquired by the NCBs within the scope of the purchase programme for cov-ered bonds8 and public and/or private debt securities acquired under the securities markets programme (SMP).9 These securities are classified as held-to-maturity. (See Note 3 (h) (i) “Securities held for monetary policy purposes” in the General notes to the financial statements). The Bank decided to participate in the SMP only.
The total Eurosystem NCBs’ holding of SMP securities amounts to €134,829 million, of which the Bank holds €119 million. In accordance with Article 32.4 of the Statute, any risks from holdings of SMP securities, if they were to materialise, should eventually be shared in full by the Eurosystem NCBs, in proportion to the prevailing Eurosystem capital key.
A 7.2 Other securitiesThis item comprises all the Bank’s holdings of debt securities issued by euro area residents that are not used in monetary policy operations and are not part of investment portfolios earmarked for specific purposes.
8 ECB Decision of 2 July 2009 on the implementation of the covered bond purchase programme (ECB/2009/16), OJ L 175, 4.7.2009, p. 18.9 ECB Decision of 14 May 2010 establishing a securities markets programme (ECB/2010/5), OJ L 124, 20.5.2010, p. 8.
2010 2009 Change €’000 €’000 €’000
Current accounts and overnight deposits 205 171 34 Other claims 349 454 (105)
Total 554 625 (71)
2010 2009 Change €’000 €’000 €’000
other than those held-to-maturity 103,349 571,395 364,122 207,273
936,818 626,196 310,622 Total
Held-to-maturity debt securities
Marketable debt securities
365,423 262,074

A-22
Financial Statements for the year ended 31 December 2010CENTRAL BANK OF MALTA
A 9 Intra-Eurosystem claimsThis item consists of claims arising from the Bank’s share in the ECB’s capital, reserves and provisions and claims equivalent to the transfer of foreign reserves to the ECB. It may also include net claims related to the allocation of euro banknotes within the Eurosystem and other net claims within the Euro-system.
A 9.1 Participating interest in ECBOn 1 May 2004, Malta joined the European Union and consequently the Bank became a member of the ESCB and in accordance with Article 28 of the Statute, it became a subscriber to the capital of the ECB. Subscriptions are determined on the basis of population and gross domestic product data provided by the European Commission in line with Article 29.1 of the Statute and which are adjusted every five years and every time that a new member state joins the European Union in accordance with Articles 29.3 and 48.3 of the Statute. The share of the Bank in the ECB’s capital on 1 May 2004 was 0.0647%. With effect from 1 January 2007, the Bank’s share in the ECB’s capital was determined at 0.0622% pursuant to the decision of the ECB of 15 December 2006. As Malta did not participate in the euro area until 1 January 2008, the transitional provisions of Article 48 of the Statute applied. Consequently, the Bank was required to pay-up a contribution of 7% of its allocated share capital in the ECB upon entry into the ESCB on 1 May 2004 amount-ing to €252,024, which was adjusted to €250,819 on 1 January 2007. The Bank paid up the remaining 93% of its capital subscription amounting to €3,332,307 as at 1 January 2008. Accordingly, the total share of the paid-up share capital in the ECB as at 1 January 2008 was €3,583,126. There were no further changes in the Bank’s share capital in the ECB during 2008.
On 1 January 2009, a regular quinquennial change in the share capital of the ECB in accordance with Article 29.3 of the Statute took place. In this respect the share of the Bank in the ECB’s share capital increased from 0.0622% to 0.0632% amounting to a total share subscription of €3,640,732. Furthermore, on 1 January 2009, the paid-up share capital of the ECB increased following the accession of the Národná banka Sloven-ska which paid its capital share in full. In 2010, there were no changes to the capital key.
The capital key shares of NCBs were as follows:

A-23
CENTRAL BANK OF MALTA Financial Statements for the year ended 31 December 2010
The ECB increased its subscribed capital by €5,000 million from €5,760,652,402.58 to €10,760,652,402.58 with effect from 29 December 2010. The NCBs of the euro area countries shall pay up their increased capital in three equal annual instalments. The first instalment was paid on 29 December 2010, and the remaining two instalments will be paid at the end of 2011 and 2012, respectively.
As a result, the subscribed and paid-up capital of NCBs is as follows:
Capital key Capital key
2010 2009% %
Nationale Bank van België / Banque Nationale de Belgique 2.4256 2.4256
Deutsche Bundesbank 18.9373 18.9373
Central Bank of Ireland 1.1107 1.1107
Bank of Greece 1.9649 1.9649
Banco de España 8.3040 8.3040
Banque de France 14.2212 14.2212
Banca d’Italia 12.4966 12.4966
Central Bank of Cyprus 0.1369 0.1369
Banque centrale du Luxembourg 0.1747 0.1747
Central Bank of Malta / Bank êentrali ta’ Malta 0.0632 0.0632
De Nederlandsche Bank 3.9882 3.9882
Oesterreichische Nationalbank 1.9417 1.9417
Banco de Portugal 1.7504 1.7504
Banka Slovenije 0.3288 0.3288
Národná banka Slovenska 0.6934 0.6934
Suomen Pankki-Finlands Bank 1.2539 1.2539
Subtotal for euro area NCBs 69.7915 69.7915
Bulgarian National Bank 0.8686 0.8686
Česká národní banka 1.4472 1.4472
Danmarks Nationalbank 1.4835 1.4835
Eesti Pank 0.1790 0.1790
Latvijas Banka 0.2837 0.2837
Lietuvos bankas 0.4256 0.4256
Magyar Nemzeti Bank 1.3856 1.3856
Narodowy Bank Polski 4.8954 4.8954
Banca NaŃională a României 2.4645 2.4645
Sveriges Riksbank 2.2582 2.2582
Bank of England 14.5172 14.5172
Subtotal for non-euro area NCBs 30.2085 30.2085
Total 100.0000 100.0000

A-24
Financial Statements for the year ended 31 December 2010CENTRAL BANK OF MALTA
2010 2010 2009 2009Subscribed Paid-up Subscribed Paid-up
capital capital capital capital€’000 €’000 €’000 €’000
Nationale Bank van België / Banque Nationale de Belgique 261,010 180,157 139,730 139,730
Deutsche Bundesbank 2,037,777 1,406,534 1,090,912 1,090,912
Central Bank of Ireland 119,519 82,495 63,984 63,984
Bank of Greece 211,436 145,939 113,191 113,191
Banco de España 893,565 616,765 478,365 478,365
Banque de France 1,530,294 1,056,254 819,234 819,234
Banca d’Italia 1,344,716 928,162 719,886 719,886
Central Bank of Cyprus 14,731 10,168 7,886 7,886
Banque centrale du Luxembourg 18,799 12,976 10,064 10,064
Central Bank of Malta / Bank êentrali ta’ Malta 6,801 4,694 3,641 3,641
De Nederlandsche Bank 429,156 296,216 229,746 229,746
Oesterreichische Nationalbank 208,940 144,216 111,855 111,855
Banco de Portugal 188,354 130,008 100,834 100,834
Banka Slovenije 35,381 24,421 18,941 18,941
Národná banka Slovenska 74,614 51,501 39,944 39,944
Suomen Pankki-Finlands Bank 134,928 93,131 72,233 72,233
Total euro area NCBs 7,510,021 5,183,637 4,020,446 4,020,446
Bulgarian National Bank 93,467 3,505 50,037 3,503
Česká národní banka 155,728 5,840 83,368 5,836
Danmarks Nationalbank 159,634 5,986 85,459 5,982
Eesti Pank10 19,262 722 10,312 722
Latvijas Banka 30,528 1,145 16,343 1,144
Lietuvos bankas 45,797 1,718 24,517 1,716
Magyar Nemzeti Bank 149,100 5,591 79,820 5,587
Narodowy Bank Polski 526,777 19,754 282,007 19,740
Banca NaŃională a României 265,196 9,945 141,971 9,938
Sveriges Riksbank 242,997 9,112 130,087 9,106
Bank of England 1,562,145 58,581 836,285 58,540
Total non-euro area NCBs 3,250,631 121,899 1,740,206 121,814
Total euro area and non-euro area NCBs 10,760,652 5,305,536 5,760,652 4,142,260
___________10 Eesti Pank joined the Eurosystem on 1 January 2011.
A-25
CENTRAL BANK OF MALTA Financial Statements for the year ended 31 December 2010
In accordance with Article 48.2 of the Statute, in 2008 the Bank also effected contributions of €7,908,437 to the ECB’s reserves and provisions in two tranches. As a result of a difference between the euro equiva-lent of foreign reserves transferred to the ECB at prevailing exchange rates and the amount determined in accordance with the capital key (disclosed under asset sub-item A9.2 “Claims equivalent to the transfer of foreign reserves”), the amount of €722,047 was considered as an advance contribution to the ECB reserves and provisions in January 2008. The balance of the contribution was settled after the approval of the ECB’s Annual Accounts for the year ended 31 December 2007 by the Governing Council of the ECB. Due to the change in the capital key referred to above, in 2009 the Bank had to contribute its respec-tive share to the ECB’s reserves and provisions. In 2010, there were no further contributions and as at year end (2009: €341,134), the balances of reserves and provisions stood at €5,772,319 and €2,477,252 respectively.
A 9.2 Claims equivalent to the transfer of foreign reservesThis asset includes the Bank’s euro-denominated claims arising from the transfer of foreign reserves to the ECB. In accordance with Article 30.1 of the Statute, on 2 and 3 January 2008 the Bank transferred foreign reserve assets to the ECB with a total equivalent amount of €36,553,305, being 15% in gold and 85% in US dollars. The Bank’s claim according to the capital key amounted to €35,831,258. The difference was utilised as an advance contribution to the ECB reserves (see Note A9.1 “Participating interest in ECB” above). As gold does not earn interest, the claim is remunerated at 85% of the applicable rate for the main refinancing operations.
The adjustments to the capital key weightings of the ECB on 1 January 2009, also resulted in the adjust-ment of the claim of the Bank with respect to the foreign reserve assets transferred to the ECB. In order to reflect its increased capital key share, the euro-denominated claim of the Bank increased by €576,065 to €36,407,323 on 1 January 2009. There were no further contributions in 2010.
A 9.4 Net claims related to the allocation of euro banknotes within the EurosystemThis sub-item reflects claims which would arise from application of the banknote allocation key (see Note 6 “Euro banknotes in circulation” in the General notes to the financial statements). As at 31 December 2010, the Bank had no claims in this respect but had a liability which is presented in liability sub-item L10.3 “Net liabilities related to the allocation of euro banknotes within the Eurosystem” (2009: nil).
A 9.5 Other claims within the Eurosystem (net) As at 31 December 2010, the Bank’s claims were netted off from liability sub-item L10.4 “Other liabilities within the Eurosystem (net)” (2009: nil).
A 10 Items in course of settlementThese assets comprise payments which had not yet been settled by the end of the financial year.
A 11 Other assets
A 11.1 Coins of euro areaThis item represents the Bank’s holdings of euro coins issued by euro area countries.

A-26
Financial Statements for the year ended 31 December 2010CENTRAL BANK OF MALTA
A 11.2 Tangible and intangible fixed assetsTangible and intangible fixed assets principally comprise the Bank’s premises, equipment, computer hard-ware and software.
A 11.3 Other financial assetsOther financial assets comprise all debt securities held by the Bank as part of an earmarked portfolio. At 31 December 2010, the Bank had an earmarked portfolio comprising held-to-maturity debt securities as a counterpart to the Bank’s capital and statutory reserves. The Bank also held another earmarked portfolio comprising of Malta Government securities and Treasury bills purchased on the secondary market by the Bank in its role as market maker.
Malta Government Stocks, which are classified as other than held-to-maturity and are accordingly carried at mid-market prices, are subject to fixed interest rates. Malta Government Treasury bills, which are also classified as other than held-to-maturity and are accordingly carried at mid-market prices, are acquired on the secondary market at discounted amounts.
Total
€’000 €’000 €’000Cost As at 31 December 2009 22,834 3,646 26,480 Additions 51 383 434
As at 31 December 2010 22,885 4,029 26,914
Accumulated depreciationAs at 31 December 2009 3,152 2,771 5,923 Charge for the year 491 576 1,067
As at 31 December 2010 3,643 3,347 6,990
Net book valueAs at 31 December 2009 19,682 875 20,557
As at 31 December 2010 19,242 682 19,924
Land and buildings
Computer equipment and
other assets
2010 2009 Change€’000 €’000 €’000
Malta Government Stocks 272,562 214,173 58,389 Malta Government Treasury bills 2,100 558 1,542 Held-to-maturity debt securities 253,161 233,412 19,749
Total 527,823 448,143 79,680

A-27
CENTRAL BANK OF MALTA Financial Statements for the year ended 31 December 2010
A 11.4 Off-balance sheet instruments revaluation differencesThis item reflects unrealised revaluation gains arising on off-balance sheet positions, principally forward for-eign exchange contracts outstanding at 31 December 2010. At year end, these unrealised gains amounted to €6,310,771 (2009: €7,968,885).
A 11.5 Accruals and prepaid expensesThis sub-item consists of accrued interest income on income-earning assets and any prepaid expenditure.
Accrued interest income at 31 December 2010, includes an amount of €1,381,868 (2009: €1,711,701) attributable to interest on intra-Eurosystem claims.
A 11.6 SundrySundry assets consist of IMF currency subscription and other assets.
2010 2009 Change €’000 €’000 €’000
Accrued interest income 38,387 29,387 9,000 Prepaid expenditure 42 20 22
Total 38,429 29,407 9,022
2010 2009 Change €’000 €’000 €’000
IMF Currency Subscription (see Note A2.1) 94,122 74,972 19,150 Other 11,463 15,606 (4,143)
Total 105,585 90,578 15,007

A-28
Financial Statements for the year ended 31 December 2010CENTRAL BANK OF MALTA
Liabilities
L 1 Banknotes in circulationThe total value of euro banknotes issued by Eurosystem NCBs is distributed among these banks on the last day of each month in accordance with the key for allocating euro banknotes (see Note 6 “Euro banknotes in circulation” in the General notes to the financial statements). In accordance with the banknote allocation key applicable on 31 December 2010, the Bank has a 0.0835% share (2009: 0.0835%) of the value of all euro banknotes in circulation. During the year ended 31 December 2010, the total value of banknotes in circulation within the Eurosystem increased from €806,411 million to €839,702 million. In accordance with the banknote allocation key, the Bank disclosed holdings of euro banknotes amounting to €701,151,170 at the end of the year (2009: €673,353,185). The value of the euro banknotes actually issued by the Bank as at that date was €805,684,425 (2009: €768,425,860). As this amount exceeded the allocated amount, the difference of €104,533,255 (2009: €95,072,675) is presented in liability sub-item L10.3 “Net liabilities related to the allocation of euro banknotes within the Eurosystem”.
L 2 Liabilities to euro area credit institutions related to monetary policy operations denominated in euroThese interest-bearing liabilities arise from the monetary policy operations conducted by the Bank on behalf of the Eurosystem.
L 2.1 Current accounts (covering the minimum reserve system)These liabilities include deposits by the credit institutions which are utilised to meet the minimum reserve requirement and settlement of payments. The main criterion for including these deposits within this sub-item is that the respective credit institutions must appear in the list of institutions which are subject to the minimum reserve regulations of the Eurosystem. Minimum reserve requirements have to be met on average over the reserve maintenance period in accordance with the schedule published by the ECB. The minimum reserve balances are remunerated at the average of the ECB’s rate for the main refinancing operations calculated over the maintenance period and weighted according to the number of calendar days. The outstanding bal-ance as at year end amounted to €470,397,451 (2009: €447,596,446).
L 2.2 Deposit facilityThe overnight deposit facility is available to eligible counterparties to make overnight deposits with NCBs at pre-specified rates. Under normal circumstances, the interest rate on the facility provides a floor for the overnight market interest rate. During 2010, the aggregate volume of such transactions with the Bank amounted to €49,344,287,000 (2009: €72,697,167,700). The outstanding balance as at year end amounted to €30,800,000 (2009: €137,000,000).
2010 2009 Change €’000 €’000 €’000
Current accounts (covering the minimum reserve system) 470,397 447,596 22,801 Deposit facility 30,800 137,000 (106,200)Credit related to margin calls - 3 (3)
Total 501,197 584,599 (83,402)

A-29
CENTRAL BANK OF MALTA Financial Statements for the year ended 31 December 2010
L 2.3 Fixed-term deposits These liabilities relate to liquidity-absorbing fine-tuning operations for a fixed-term subject to a fixed rate of interest. During 2010, the aggregate volume of such transactions with the Bank amounted to €1,010,000,000 (2009: €264,000,000). There were no outstanding fixed-term deposits at the balance sheet date (2009: nil).
In line with the SMP, weekly 7-day liquidity-absorbing operations were conducted with an intended volume covering the amount of securities purchased in the previous week. The aggregate volume of such transac-tions with the Bank amounted to €212,000,000. There were no outstanding operations as at the year end.
L 2.4 Fine-tuning reverse operationsFine-tuning liquidity-absorbing reverse operations are executed on an ad hoc basis with the purpose of managing the liquidity situation in the market and setting interest rates. Liquidity-absorbing fine-tuning reverse operations are executed, as a rule, through bilateral procedures. Moreover, their frequency and maturity are not standardised. No fine-tuning absorption reverse operations were conducted during 2010 and 2009.
L 2.5 Deposits related to margin calls This sub-item refers to cash received from counterparties in those instances where the market value of the collateral has fallen below an established trigger point implying a shortfall of collateral to cover the outstand-ing monetary policy operations. Deposits related to margin calls were used by counterparties during 2010, on those instances where their respective pool of collateral fell below the mentioned trigger level. There was no outstanding balance as at year end (2009: €2,726).
L 3 Other liabilities to euro area credit institutions denominated in euroThis balance sheet item includes credit institutions’ accounts which are unrelated to monetary policy opera-tions.
L 5 Liabilities to other euro residents denominated in euro
L 5.1 General governmentThis liability includes current and sinking fund accounts denominated in euro held by the Government of Malta. These balances are repayable on demand and are subject to variable interest rates linked to the ECB’s main refinancing operations rate.
2010 2009 Change €’000 €’000 €’000
Current accounts 232,886 240,387 (7,501)Sinking fund accounts 156,773 152,525 4,248
Total 389,659 392,912 (3,253)

A-30
Financial Statements for the year ended 31 December 2010CENTRAL BANK OF MALTA
L 5.2 Other liabilitiesCurrent accounts and fixed-term deposits denominated in euro by Maltese public sector corporations are included within this item. Current accounts are repayable on demand and subject to variable interest rates linked to the ECB’s main refinancing operations rate. Fixed-term deposits are subject to fixed interest rates.
L 6 Liabilities to non-euro area residents denominated in euroThis sub-item includes balances denominated in euro held by international and supranational organisations and by non-Eurosystem central banks, including the IMF current accounts. These liabilities are principally non-interest bearing.
L 7 Liabilities to euro area residents denominated in foreign currencyBalances held by the Government of Malta which are repayable on demand and other customer deposits are included in this item. These balances are principally subject to floating interest rates based on weekly average rates applied to call funds.
L 9 Counterpart of special drawing rights allocated by the IMFThis item represents the counterpart of special drawing rights allocated by the IMF to Malta (see Note A2.1 “Receivables from the IMF” above).
L 10 Intra-Eurosystem liabilitiesThis item represents the Bank’s liabilities to the ECB and to the other Eurosystem NCBs.
2010 2009 Change €’000 €’000 €’000
IMF current accounts (see Note A2.1) 94,122 74,972 19,150 Others 2,840 11,813 (8,973)
Total 96,962 86,785 10,177
2010 2009 Change €’000 €’000 €’000
Current accounts 74,847 43,307 31,540 Sinking fund accounts 3,810 3,685 125
Current accounts and fixed-term deposits 17,866 24,590 (6,724)
96,523 71,582 24,941
Government of Malta
Other customers
Total

A-31
CENTRAL BANK OF MALTA Financial Statements for the year ended 31 December 2010
L 10.3 Net liabilities related to the allocation of euro banknotes within the EurosystemThis item consists of the liability of the Bank vis-à-vis the Eurosystem relating to the excess of euro banknotes issued by the Bank over and above the amount allocated to the Bank by the ECB in accordance with the banknote allocation key (see Note L1 “Banknotes in circulation” above). This liability is subject to interest at the ECB main refinancing operations rate, taking cognisance of the adjustments referred to in Note 6 “Banknotes in circulation” in the General notes to the financial statements in the cash changeover year and in the subsequent five years.
L 10.4 Other liabilities within the Eurosystem (net)These liabilities mainly include the TARGET2 balance arising from cross-border euro transfers with other NCBs in the ESCB and the ECB, and correspondent accounts of other Eurosystem NCBs. The TARGET2 balance is subject to interest at the prevailing rate for the ECB main refinancing operations. Moreover, these liabilities include the net liability at year end arising from the difference between monetary income to be pooled and that distributed (see Note 5 “Net result of pooling of monetary income” to the Profit and Loss account) and the claim arising from the distribution of the ECB’s seigniorage income.
L 12 Other liabilities
L 12.1 Off-balance sheet instruments revaluation differences This item reflects unrealised revaluation losses arising on off-balance sheet positions, primarily forward foreign exchange contracts outstanding at 31 December 2010. At year end, there were no unrealised losses (2009: nil).
L 12.2 Accruals and income collected in advance These liabilities include accrued interest expense on interest-bearing liabilities and other accrued expenses. Also included is the balance of demonetised Maltese lira notes and coins which have not yet been presented or recognised in the Profit and Loss account. This amount is recognised as deferred income until the final date when such notes and coins cease to be exchangeable at the Bank.
2010 2009 Change €’000 €’000 €’000
Issued banknotes 805,684 768,426 37,258 Banknotes allocated as per banknote allocation key (701,151) (673,353) (27,798)
Excess of issued banknotes over allocation 104,533 95,073 9,460
2010 2009 Change €’000 €’000 €’000
TARGET2 balance and correspondent accounts 1,222,583 813,665 408,918 Net result from pooling of monetary income 2,623 736 1,887 Seigniorage income receivable - (713) 713
Total 1,225,206 813,688 411,518

A-32
Financial Statements for the year ended 31 December 2010CENTRAL BANK OF MALTA
Accrued interest expense at 31 December 2010 includes an amount of €981,217 (2009: €902,449) attribut-able to interest on intra-Eurosystem liabilities.
L 12.3 SundrySundry liabilities mainly comprise of unrealised revaluation gains attributable to Malta Government Stocks held as part of an earmarked portfolio amounting to €5,947,335 (2009: €7,166,078). These liabilities also include realised losses attributable to off-balance sheet positions, principally forward foreign exchange con-tracts outstanding at year end, which are offset by realised profits arising from on-balance sheet positions. The net result is disclosed within Note 2.1 “Realised gains / losses arising from financial operations” to the Profit and Loss account. For 2010, this item also includes a provision in respect of the ad hoc voluntary severance scheme (see Note 7 “Staff costs” to the Profit and Loss account).
L 13 Provisions In accordance with Article 32.4 of the Statute, the provision against counterparty risks in monetary policy operations is allocated among the NCBs of participating Member States in proportion to their Eurosystem capital key, prevailing in the year when the defaults have occurred. In accordance with the general account-ing principle of prudence, the Governing Council has reviewed the appropriateness of the volume of this provision and decided to reduce the provision from a total amount of €4,011 million as at 31 December 2009 to an amount of €2,207 million as at 31 December 2010. The Bank’s share in this provision amounts to €1,969,527 (2009: €3,579,416).
The respective adjustments are reflected in the NCBs’ Profit and Loss accounts. In the case of the Bank, the resulting income amounted to €1,609,889 (2009: €1,539,390) (see Note 5 “Net result of pooling of monetary income” to the Profit and Loss account).
L 14 Revaluation accountsThe revaluation accounts include the unrealised revaluation gains arising from the valuation of foreign currency on and off-balance sheet positions, gold and marketable securities at year end.
2010 2009 Change €’000 €’000 €’000
Gold 983 652 331 Securities 11,166 15,844 (4,678)Foreign currency positions 116 49 67
Total 12,265 16,545 (4,280)
2010 2009 Change €’000 €’000 €’000
1,299 1,207 92
Maltese Lira currency notes and coins 49,894 65,524 (15,630)842 666 176
52,035 67,397 (15,362)
Accrued interest payableDeferred income in respect of demonetised
Other
Total

A-33
CENTRAL BANK OF MALTA Financial Statements for the year ended 31 December 2010
L 15 Capital and reservesThe following table analyses the movement in capital and reserves of the Bank.
L 15.1 CapitalIn terms of article 19(1) of the Central Bank of Malta Act (Cap. 204), the Bank shall have an authorised capi-tal of €20 million. This is fully paid up and is held exclusively by the Government of Malta.
L 15.2 Reserves
(a) General reserve fundIn terms of article 19(2) of the Central Bank of Malta Act (Cap. 204), the Bank shall also maintain a General reserve fund which shall be of not less than €20 million and which shall be available for any purpose as may be determined by the Board of Directors. Whenever amounts are drawn from the General reserve fund, these shall be replaced as may be decided by the Board.
(b) Reserves for risks and contingenciesReserves for risks and contingencies are maintained in terms of article 22(1) of the Central Bank of Malta Act (Cap. 204) to cover the broad range of risks to which the Bank is exposed. The major risks in this regard arise from potential movements in market values of the Bank’s holdings of domestic and foreign securities and other investments, losses which could arise from support of the financial system in the Bank’s role as a lender of last resort, and other non-insured losses.
(c) Capital contributionThis reserve represents the capital contribution made by the Government of Malta to the Bank in respect of the agency agreement between the Bank and the Government relating to the issuance of euro coins. The Bank shall act as agent of the Government and shall retain full responsibility for procurement, storage and issuance of euro coins. This reserve represents seigniorage revenue arising from the issue of euro coins. In terms of the agency agreement, the Government has agreed not to withdraw such revenue and retain these amounts in a reserve account held at the Bank. Allocation of revenue to the reserve account shall be deemed as a capital contribution to the Bank by the Government.
Reserves for General reserve risks and Capital fund contingencies contribution
€’000 €’000 €’000 €’000
20,000 75,505 120,384 37,153 - - - 3,804 - - 9,618 -
20,000 75,505 130,002 40,957 Balance as at 31 December 2010
Transfer from profits for the year
Capital
Balance as at 31 December 2009Net issuance of euro coins

A-34
Financial Statements for the year ended 31 December 2010CENTRAL BANK OF MALTA
Notes to the Profit and Loss account
1 Net interest income This item represents the net result of interest income and interest expense.
1.1 Interest incomeInterest income includes income on foreign reserve assets and euro-denominated portfolios, as well as inter-est income on intra-Eurosystem claims and monetary policy instruments.
Income from “Net claims related to the allocation of banknotes within the Eurosystem” principally com-prises of interest income arising on a notional amount representing the differences between the average value of the banknotes which the Bank had in circulation in the reference period and the average value of banknotes which would have been allocated to the Bank during that period in accordance with its capital key. Interest is calculated at the prevailing ECB rate for the main refinancing operations. This is in line with the provisions established by the Governing Council as outlined in the ECB Decision on the allocation of monetary income (ECB/2001/16 as amended). The adjustments are reduced in annual stages until the first day of the sixth year after the cash changeover year. The Bank’s adjustment period started on 1 January 2008 and will end on 31 December 2013. This item also includes net interest payment on the difference
2010 2009 Change €’000 €’000 €’000
- In euro 43,314 47,061 (3,747)- In foreign currency 5,978 6,780 (802)
- In euro - 1,187 (1,187)- In foreign currency 1,108 1,412 (304)
- In euro - 10 (10)- In foreign currency 31 48 (17)
81 148 (67)
- Main refinancing operations 3,551 1,031 2,520 - Longer-term refinancing operations 9,028 4,565 4,463 - Fine-tuning reverse operations 65 - 65 - Marginal lending facility 39 63 (24)- Securities Market Programme 4,294 - 4,294
- Claims arising from the transfer of foreign reserves 314 401 (87)
- Net claims related to the allocation of banknotes within the Eurosystem 3,118 5,685 (2,567)
- TARGET2 balances - 631 (631)545 793 (248)107 102 5
71,573 69,917 1,656
Marketable debt securities
Fixed-term deposits
Current accounts and overnight deposits
IMF
Total
Monetary policy operations
Intra-Eurosystem claims
Forward foreign exchange contractsOther interest income

A-35
CENTRAL BANK OF MALTA Financial Statements for the year ended 31 December 2010
between the euro banknotes allocated to the Bank in accordance with the banknote allocation key and the value of the euro banknotes that the Bank actually puts into circulation, as reduced by banknotes withdrawn from circulation.
1.2 Interest expenseInterest expense arises from interest payable on Government of Malta and other customer accounts, intra-Eurosystem liabilities as well as liabilities to euro area credit institutions related to monetary policy operations.
2 Net result of financial operations, write-downs and risk provisions
2.1 Realised gains / (losses) arising from financial operationsThis item includes gains and losses arising from transactions leading to reductions in foreign currency posi-tions and disposals of financial instruments, mainly debt securities.
2010 2009 Change €’000 €’000 €’000
- In euro 2,044 2,535 (491)- In foreign currency 132 31 101
- In euro 13 23 (10)- In foreign currency 22 29 (7)
- Minimum reserves 4,816 5,882 (1,066)- Overnight deposits 492 1,910 (1,418)- Fixed-term deposits 42 6 36 - Deposits related to margin calls 8 3 5
- TARGET2 balances 8,332 - 8,332 104 102 2
16,005 10,521 5,484
Other interest expense
Total
Government accounts
Other customer accounts
Monetary policy operations
Intra-Eurosystem liabilities
2010 2009 Change €’000 €’000 €’000
Net gains / (losses) on disposal of financial instruments 7,183 3,878 3,305
Net gains / (losses) on foreign currency positions 4,505 1,290 3,215
Total 11,688 5,168 6,520

A-36
Financial Statements for the year ended 31 December 2010CENTRAL BANK OF MALTA
2.2 Write-downs on financial assets and positionsThis item comprises unrealised revaluation losses arising from the price revaluation of debt securities and the exchange rate revaluation of foreign currency assets and liabilities, including off-balance sheet positions, by comparing the market value at balance sheet date with the average book value.
3 Net income / (expense) from fees and commissionsFees and commissions receivable mainly arise from the provision of banking services. Fees and commis-sions payable include correspondent account charges, handling fees on cheques drawn on the Bank and TARGET2 connection and participation fees.
4 Income from equity shares and participating interestsDuring 2010, the Bank received €1,327,569 (2009: €104,039) representing its relative share of the ECB’s distributable profits for 2009 in proportion to the Bank’s Eurosystem capital key (see Note 4 “Capital key” in the General notes to the financial statements).
In 2010, the ECB’s seigniorage income and income on SMP securities amounting to €1,091,463,727 was fully retained by the ECB in accordance with a decision of the Governing Council dated 16 December 2010 in order to fund the increase in the ECB provision for foreign exchange rate, interest rate, credit and gold price risks to its maximum allowable level. In 2009, the ECB’s seigniorage income amounting to €787,157,441 was distributed in full and the Bank’s share in proportion to Eurosystem capital key was €712,813.
5 Net result of pooling of monetary incomeThis item contains the net result of pooling of monetary income for 2010 amounting to an expense of €2,622,592 (2009: €735,899); and the Bank’s share of the net result from the decrease in the provision against counterparty risks in monetary policy operations of the Eurosystem of €1,609,890 (2009: €1,539,390) (see Note L13 “Provisions” in the Notes to the Balance sheet). The net expenditure shown in this item amounted to €1,012,702 in comparison to a net income of €803,491 in 2009.
The amount of each Eurosystem NCB’s monetary income is determined by measuring, on a daily basis, the actual income that is derived from the earmarkable assets held against the liability base.
The liability base consists of the following items: banknotes in circulation; liabilities to credit institutions related to monetary policy operations denominated in euro; net intra-Eurosystem liabilities resulting from TARGET2 transactions; and net intra-Eurosystem liabilities related to the allocation of euro banknotes within the Eurosystem. Any interest paid on liabilities included within the liability base is to be deducted from the monetary income to be pooled.
The earmarkable assets consist of the following items: lending to euro area credit institutions related to mon-etary policy operations denominated in euro; securities held for monetary policy purposes; intra-Eurosystem claims equivalent to the transfer of foreign reserve assets to the ECB; net intra-Eurosystem claims resulting from TARGET2 transactions; net intra-Eurosystem claims related to the allocation of euro banknotes within
2010 2009 Change€’000 €’000 €’000
Write-downs on debt securities 5,442 622 4,820 Write-downs on foreign currency positions 17 876 (859)
Total 5,459 1,498 3,961

A-37
CENTRAL BANK OF MALTA Financial Statements for the year ended 31 December 2010
the Eurosystem; and a limited amount of each NCB’s gold holdings in proportion to each NCB’s capital key. Gold is considered to generate no income.
Where the value of an NCB’s earmarkable assets exceeds or falls short of the value of the liability base, the difference shall be offset by applying to the value of the difference the applicable rate for the ECB main refinancing operations.
The monetary income pooled by the Eurosystem is allocated among NCBs in relation to the Eurosystem capital key. The net result arising from the calculation of monetary income is a payment by the Bank which is the difference between the monetary income pooled amounting to €12,025,705 (2009: €11,066,684) and the amount redistributed of €9,472,568 (2009: €10,330,785). A further payment of €69,455, as an adjustment for previous years, was also effected.
6 Other incomeOther income includes an amount of €6.9 million (2009: €9.0 million) and €2.3 million relating to the balance of unredeemed Maltese coins and demonetised Lm10 4th series banknotes which ceased to be exchange-able at the Bank subsequent to 1 February 2010 and 13 September 2010 respectively. Other operating income also includes income from numismatic issues of notes and coins.
7 Staff costsStaff costs include salaries and other ancillary costs.
Other staff costs include the recognition of termination benefits of €1,310,841 (2009: nil) under an ad hoc voluntary severance scheme launched as part of the Bank’s restructuring programme which was open to all staff members who satisfied the criteria of age and years of service to the Bank. Benefits payable more than 12 months after the reporting period are discounted to their present value.
The full-time equivalent average number of staff employed by the Bank during the year was as follows:
2010 2009 Change €’000 €’000 €’000
Staff salaries 7,857 7,124 733 Other staff costs 2,324 864 1,460 Training, welfare and other related expenditure 753 802 (49)
Total 10,934 8,790 2,144
2010 2009 Change Number Number Number
Governors 2 2 - Divisional Directors 4 5 (1)Heads and executives 89 80 9 Supervisory and clerical staff 180 183 (3)Non-clerical staff 34 35 (1)
Total 309 305 4

A-38
Financial Statements for the year ended 31 December 2010CENTRAL BANK OF MALTA
8 Administrative expensesThis item consists of operating expenditure incurred by the Bank.
Other administrative expenses mainly comprise maintenance expenditure, professional fees, travelling costs and other services or expense items which are incurred in the course of the Bank’s operations. Auditors’ remuneration, inclusive of VAT, for the current financial year amounted to €71,500 (2009: €69,500).
Compensation to the members of the Board of Directors for the financial year under review amounted to €221,648 (2009: €208,311). The Governor is entitled to such benefits as the use of a leased motor vehicle, health insurance cover and refund of certain other expenses. The Deputy Governor and other members of the Board of Directors are entitled to health insurance cover and the refund of certain other expenses.
9 Depreciation of tangible and intangible fixed assetsDepreciation of buildings, equipment, computer hardware and software was charged to the Bank’s Profit and Loss account according to the depreciation rates disclosed in Note 3(m) “Tangible and intangible fixed assets” in the general notes to the financial statements.
10 Banknote production servicesThis item includes expenditure relating to the procurement and transportation of euro banknotes and other ancillary costs. Accrued expenditure also reflects the expected costs attributable to the consumption of banknotes issued.
Other notes
(a) Off-balance sheet instrumentsAt the balance sheet date, the principal outstanding off-balance sheet instruments consisted of forward for-eign exchange contracts with a notional amount of €408,065,000 (2009: €361,200,000) involving the forward purchase of euro against the forward sale of other currencies.
2010 2009 Change €’000 €’000 €’000
Market information and communication expenses 527 514 13 Other administrative expenditure 3,352 2,926 426
Total 3,879 3,440 439
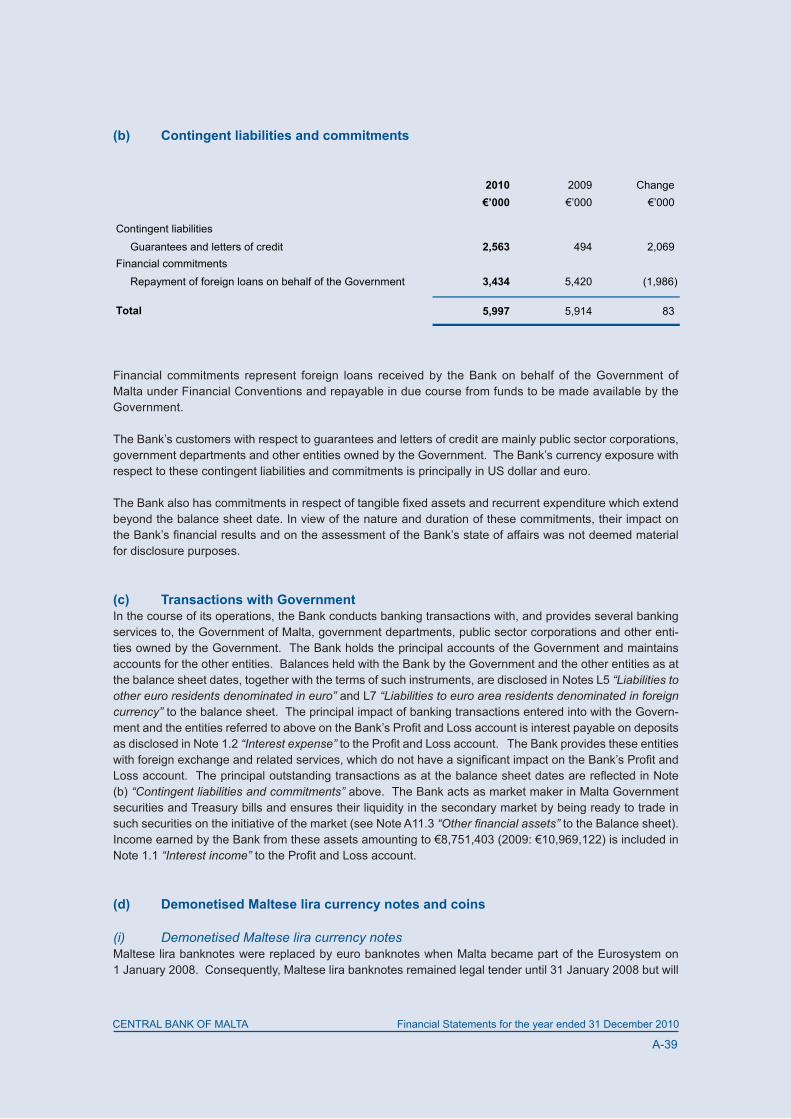
A-39
CENTRAL BANK OF MALTA Financial Statements for the year ended 31 December 2010
(b) Contingent liabilities and commitments
Financial commitments represent foreign loans received by the Bank on behalf of the Government of Malta under Financial Conventions and repayable in due course from funds to be made available by the Government.
The Bank’s customers with respect to guarantees and letters of credit are mainly public sector corporations, government departments and other entities owned by the Government. The Bank’s currency exposure with respect to these contingent liabilities and commitments is principally in US dollar and euro.
The Bank also has commitments in respect of tangible fixed assets and recurrent expenditure which extend beyond the balance sheet date. In view of the nature and duration of these commitments, their impact on the Bank’s financial results and on the assessment of the Bank’s state of affairs was not deemed material for disclosure purposes.
(c) Transactions with GovernmentIn the course of its operations, the Bank conducts banking transactions with, and provides several banking services to, the Government of Malta, government departments, public sector corporations and other enti-ties owned by the Government. The Bank holds the principal accounts of the Government and maintains accounts for the other entities. Balances held with the Bank by the Government and the other entities as at the balance sheet dates, together with the terms of such instruments, are disclosed in Notes L5 “Liabilities to other euro residents denominated in euro” and L7 “Liabilities to euro area residents denominated in foreign currency” to the balance sheet. The principal impact of banking transactions entered into with the Govern-ment and the entities referred to above on the Bank’s Profit and Loss account is interest payable on deposits as disclosed in Note 1.2 “Interest expense” to the Profit and Loss account. The Bank provides these entities with foreign exchange and related services, which do not have a significant impact on the Bank’s Profit and Loss account. The principal outstanding transactions as at the balance sheet dates are reflected in Note (b) “Contingent liabilities and commitments” above. The Bank acts as market maker in Malta Government securities and Treasury bills and ensures their liquidity in the secondary market by being ready to trade in such securities on the initiative of the market (see Note A11.3 “Other financial assets” to the Balance sheet). Income earned by the Bank from these assets amounting to €8,751,403 (2009: €10,969,122) is included in Note 1.1 “Interest income” to the Profit and Loss account.
(d) Demonetised Maltese lira currency notes and coins
(i) Demonetised Maltese lira currency notesMaltese lira banknotes were replaced by euro banknotes when Malta became part of the Eurosystem on 1 January 2008. Consequently, Maltese lira banknotes remained legal tender until 31 January 2008 but will
2010 2009 Change €’000 €’000 €’000
Guarantees and letters of credit 2,563 494 2,069
Repayment of foreign loans on behalf of the Government 3,434 5,420 (1,986)
5,997 5,914 83
Contingent liabilities
Financial commitments
Total

A-40
Financial Statements for the year ended 31 December 2010CENTRAL BANK OF MALTA
continue to be redeemed at the conversion rate of the Maltese lira for the euro of 0.4293 and without charge until 31 January 2018.
During 2010, demonetised Maltese lira currency notes presented for redemption amounted to €6,022,243 (2009: €8,095,380). At 31 December 2010, the value of unpresented demonetised currency notes amount-ed to €49,894,300 (2009: €58,169,513) analysed as follows:
The demonetised Lm10 4th series banknotes ceased to be exchangeable at the Bank subsequent to 13 September 2010 (2009: nil) (see Note 6 “Other income” to the Profit and Loss account).
(ii) Demonetised Maltese lira currency coinsMaltese lira coins were replaced by euro coins when Malta became part of the Eurosystem on 1 January 2008. Consequently, Maltese lira coins remained legal tender until 31 January 2008 but could be redeemed at the conversion rate of the Maltese lira for the euro of 0.4293 without charge until 1 February 2010.
In 2010, demonetised Maltese lira currency coins presented for redemption amounted to €447,433 (2009: €425,761). Subsequent to 1 February 2010, the value of unpresented demonetised currency coins amount-ed to €25,906,967 (31 December 2009: €26,354,400).
(e) Investment securities pledged as collateralAs at 31 December 2010, investment securities have been pledged as collateral against the provision of credit lines by a counterparty up to an amount of USD45 million or €34million approximately (2009: USD45 million or €31 million approximately). No amounts were borrowed under these facilities at the balance sheet dates.
(f) Assets held in custodyAt 31 December 2010, assets held in custody by the Bank in terms of the Maltese Insurance Business Act amounted to €45,006,571 (2009: €36,837,491).
(g) Management of funds belonging to the Investor and Depositor Compensation SchemesIn 2003, the Bank had been appointed as investment manager in respect of funds belonging to the Investor and Depositor Compensation Schemes. The Bank manages these funds on a discretionary basis in accor-dance with the investment parameters set by the Management Committees of the respective Schemes. As at 31 December 2010, the Investor and Depositor Compensation Schemes had interest and non-interest bearing deposits of €211,084 (2009: €26,430) and €148,564 (2009: €32,629) respectively, with the Bank.
2010 2009 Change €’000 €’000 €’000
Ten year period expires in:-2010 - 2,360 (2,360)-2018 49,894 55,810 (5,916)
Total 49,894 58,170 (8,276)

A-41
CENTRAL BANK OF MALTA Financial Statements for the year ended 31 December 2010
(h) Statement of the Bank’s investmentsThe statement of the Bank’s investments below is disclosed in accordance with the requirements of article 21(2)(b) of the Central Bank of Malta Act (Cap. 204).
The exposure country is the country of location of the institution or entity with which the Bank’s placements and other financial assets are held. The exposure country in respect of assets held with branches of interna-tional banks and financial institutions is usually deemed to be the country of location of the parent. In case of subsidiaries of banks and financial institutions, the exposure country is generally determined on the basis of the location of the subsidiary undertaking.
EUR GBP USD Other Total €'000 €'000 €'000 €'000 €'000
Cash and balances with banks 5,814
Gold balances 3,713
Placements with banks by exposure country: Australia - - 15,716 - 15,716Denmark - 29,741 - - 29,741France - - 66,682 - 66,682Italy - - 38,542 6,775 45,317Malta - - 29,562 - 29,562Switzerland - - 14,968 - 14,968United Kingdom - - 9,729 - 9,729
- 29,741 175,199 6,775 211,715
Securities by issuer category: Government 1,172,667 - 132,532 - 1,305,199Insurance 3,016 - - - 3,016Monetary financial institutions 402,534 - 90,075 - 492,609Non-financial institutions 28,444 - - - 28,444Other financial institutions 25,687 - 9,963 - 35,650Supranational 56,089 - 53,689 109,778
1,688,437 - 286,259 - 1,974,696
Claims on the International Monetary Fund 146,723
Participating interest in the ECB 12,944
Transfer of foreign reserves to the ECB 36,407
Other foreign currency assets 140
Total investments 2,392,152