forum energy technologies - jefferies · powerful products. confidential forward ... drilling...
TRANSCRIPT

Smart Solutions. Powerful Products.Smart Solutions. Powerful Products.
Forum Energy Technologies

Smart Solutions. Powerful Products. Confidential
Forward Looking Statements
The statements made during this presentation, including the answers to your questions, include
information that the Company believes to be forward-looking statements within the meaning of
the Private Securities Litigation Reform Act. Forward-looking statements involve risk and
uncertainties that may cause actual results or events to differ materially from those expressed
or implied in such statements. Those risks include, among other things, matters that the
Company has described in its earnings release and in its filings with the Securities and
Exchange Commission. The Company does not undertake any ongoing obligation, other than
that imposed by law, to publicly update or revise any forward-looking statements to reflect
future events, information, or circumstances that arise after this presentation. In addition, this
presentation contains time sensitive information that reflects management's best judgment only
as of the date of this presentation. This presentation may contain Non-GAAP financial
measures. A reconciliation to the most directly comparable GAAP measure is included in the
appendix to this presentation. A copy of this presentation will be available on our website at
www.f-e-t.com for 30 days following the conference.
2
Global oilfield, manufactured products and equipment company
Leveraged to attractive secular trends
‒ Deepwater / Subsea
‒ Drilling / Well Complexity
‒ Production / Completion / Service Intensity
Develop strong brands and market position
High percentage of revenue from activity-based, consumable products
Disciplined growth across breadth of product offerings
Forum Energy TechnologiesStrategy Themes
3
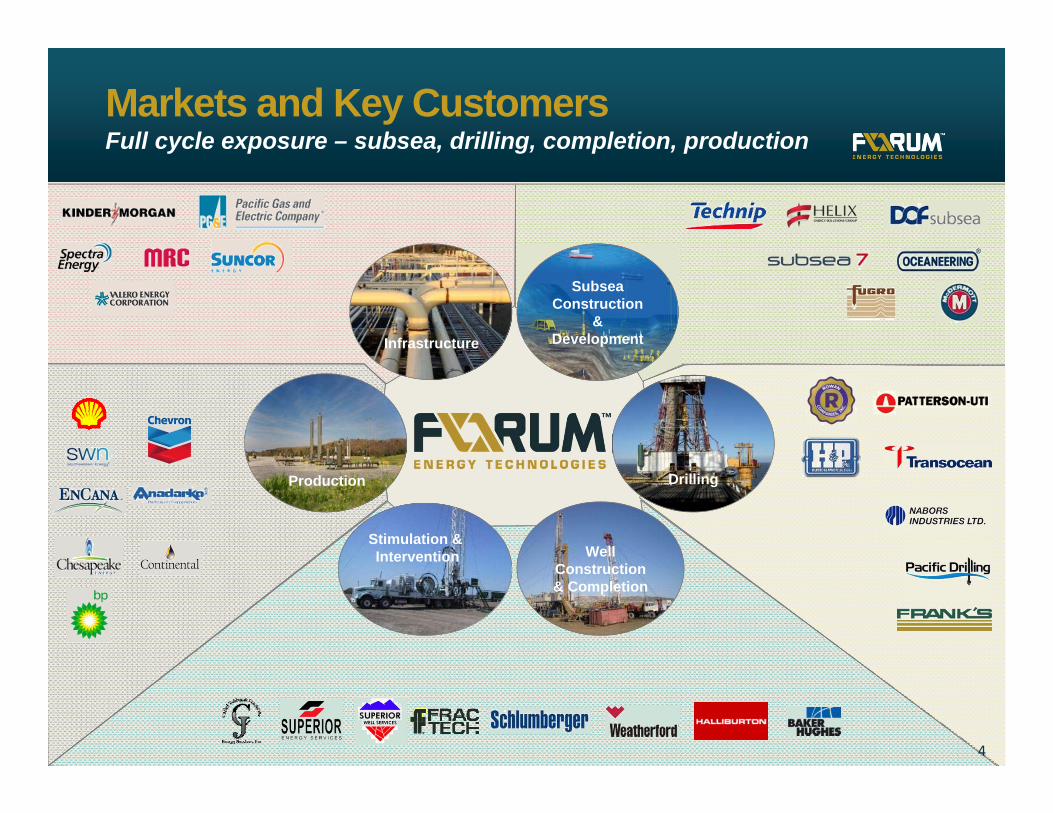
Subsea Construction
& Development
Subsea Construction
& Development
Well Construction & Completion
Production
Infrastructure
Stimulation & Intervention
Drilling
4
Markets and Key CustomersFull cycle exposure – subsea, drilling, completion, production

Business Drivers
35% Well count
‒ Multi-well surface production systems, shift to liquid / oil basins
‒ Fracturing longer laterals and more stages, pressure pumping consumables, coil tubing
‒ Well integrity, injection lines / artificial lift protection systems
30% Rig count
‒ Rig upgrade and replacement
‒ Drilling intensity (wells per rig) - tubular handling, pumps, parts & consumables
20% Subsea activity
‒ Deep water rigs, subsea equipment orders, construction / installation awards
15% Infrastructure expansion
‒ Midstream transmission, pipelines, petrochemical, heavy oil sands
‒ Broad valve offering
5
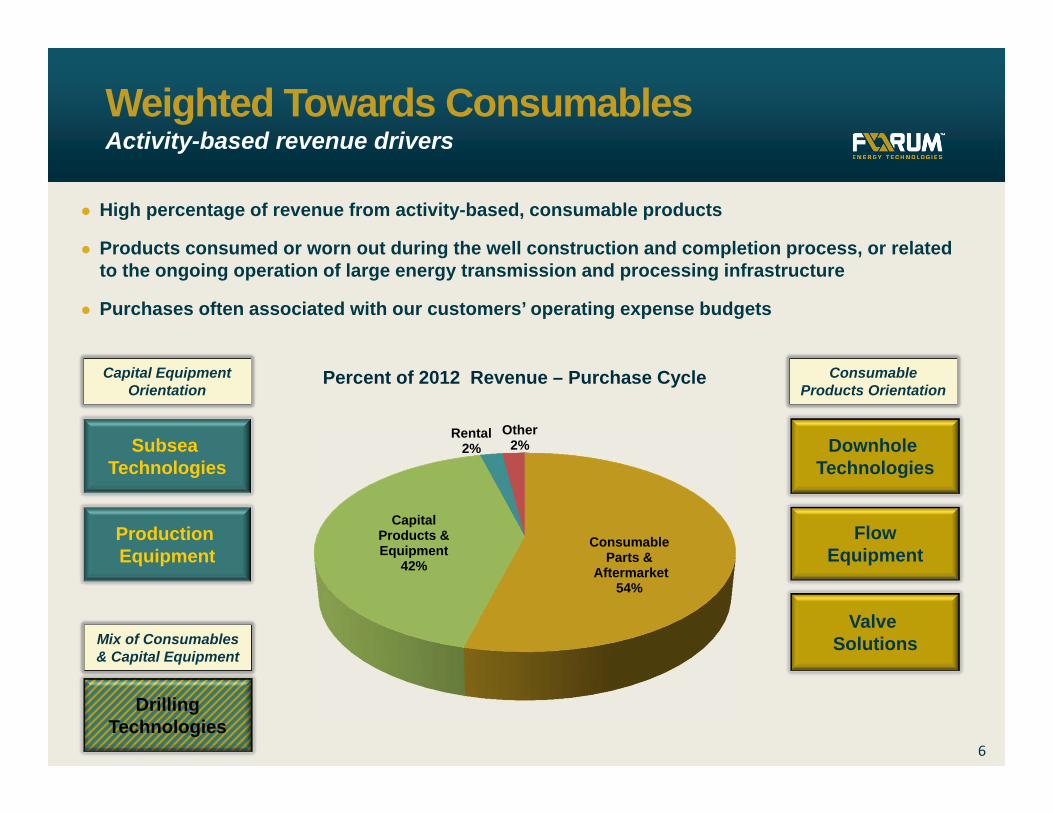
High percentage of revenue from activity-based, consumable products
Products consumed or worn out during the well construction and completion process, or related to the ongoing operation of large energy transmission and processing infrastructure
Purchases often associated with our customers’ operating expense budgets
DownholeTechnologies
Valve Solutions
FlowEquipment
DrillingTechnologies
Subsea Technologies
Production Equipment
Capital Equipment Orientation
Consumable Products Orientation
Mix of Consumables & Capital Equipment
Percent of 2012 Revenue – Purchase Cycle
ConsumableParts &
Aftermarket54%
CapitalProducts &Equipment
42%
Rental2%
Other2%
6
Weighted Towards ConsumablesActivity-based revenue drivers

Revenue enhancements across our product lines
‒ Market share gains
‒ International and offshore expansion
‒ New product commercialization
Margin improvements
‒ Manufacturing process and efficiency
‒ Distribution channel
‒ Supply chain
Complementary acquisition program
7
Drivers of Financial PerformanceFocused on organic growth prospects
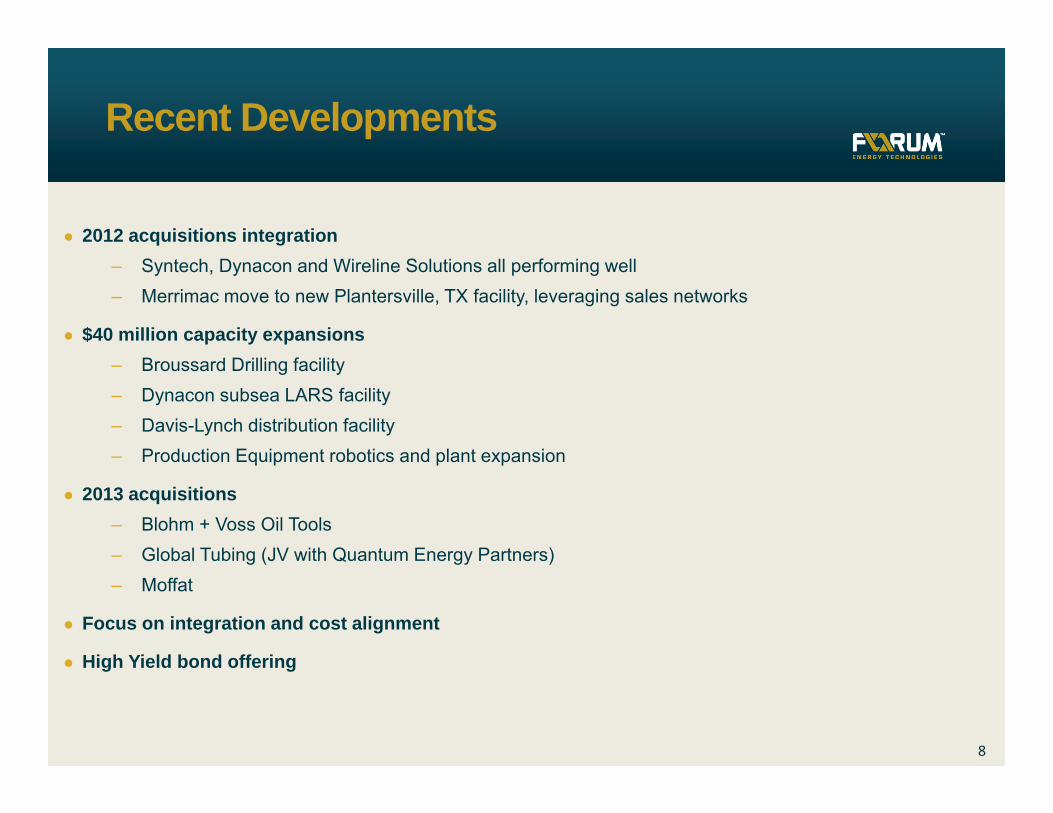
2012 acquisitions integration‒ Syntech, Dynacon and Wireline Solutions all performing well‒ Merrimac move to new Plantersville, TX facility, leveraging sales networks
$40 million capacity expansions‒ Broussard Drilling facility‒ Dynacon subsea LARS facility‒ Davis-Lynch distribution facility‒ Production Equipment robotics and plant expansion
2013 acquisitions‒ Blohm + Voss Oil Tools‒ Global Tubing (JV with Quantum Energy Partners)‒ Moffat
Focus on integration and cost alignment
High Yield bond offering
8
Recent Developments

Blohm + Voss Oil ToolsPipe Handling Equipment
9
Power Slips
Tongs
Floorhands

Blohm + Voss Oil ToolsPipe Handling Equipment
10
Investment Highlights Revenue – Onshore / Offshore
US Onshore
International Onshore
US Offshore
International Offshore
Leverage to international and offshore growth
Strong brand recognition
Strengthens market position
Strengthens pipe handling offering
Growth through existing sales, distribution and service channels

Global Tubing JVCoiled Tubing Products
11

Global Tubing JVCoiled Tubing Products
12
Revenue by Region
US & Canada
EuropeLatin America
Asia
Africa /Middle East
Exposure to increasing well complexity and horizontal well completions
100% consumable products
Strong brand and #3 market position
Significant international opportunity
Investment Highlights

MoffatPIG Launching & Receiving Systems and Subsea Connectors
13

MoffatPIG Launching & Receiving Systems and Subsea Connectors
14
Revenue by Region
EuropeAfrica / Middle East
Asia /Pacific
North & South America Leveraged to deepwater and subsea activity
International exposure
Strong brand and market position
Expands offering to our existing customers
Investment Highlights
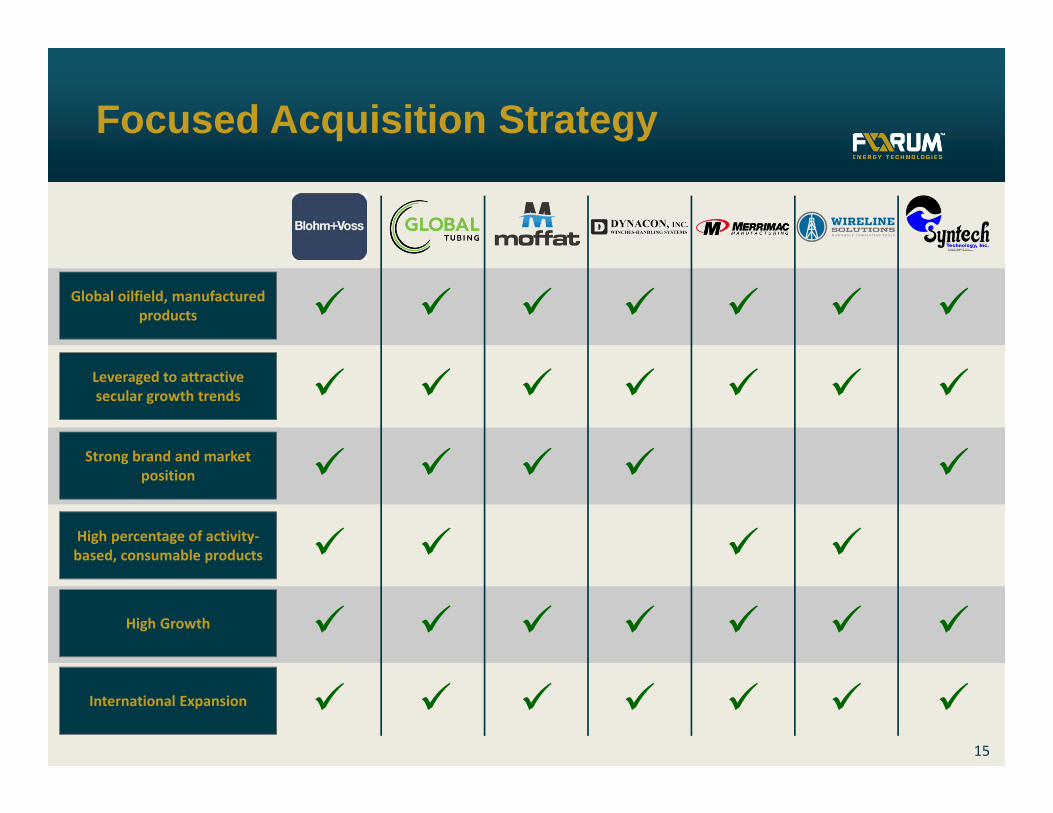
Focused Acquisition Strategy
15
Global oilfield, manufactured products
Leveraged to attractive secular growth trends
Strong brand and market position
High percentage of activity‐based, consumable products
High Growth
International Expansion

3nd Quarter 2013 Results (unaudited)($ Millions)
Quarterly Revenue & Adjusted EBITDA Margin %
$330 $373 $368 $390
15.7%16.9% 17.3%
20.3%
0%
5%
10%
15%
20%
25%
$0
$50
$100
$150
$200
$250
$300
$350
$400
$450
$500
4Q 2012 1Q 2013 2Q 2013 3Q 2013
EB
ITD
A M
argi
n %
Rev
enue
Note: EBITDA is a non-GAAP financial measure. See reconciliation of EBITDA to Net Income in the appendix. 16

CapitalizationStrong balance sheet to support growth initiatives
17
$300 million of senior unsecured notes due 2021
$120 million free cash flow YTD Sept. 30, 2013
Total Net Capitalization ($millions) Sept. 30, 2013Debt$600mm Revolver, Oct 2016 $244$300mm Term Loan, Oct 2016 285Other debt (cap leases, etc.) 2
Total Debt $531Shareholders Equity 1,284
Total Capitalization $1,812Less: Cash on hand 28
Total Net Capitalization $1,784
Common Shares Outstanding (mm) 93
Credit StatisticsNet Debt $503Net Capitalization Ratio 28%Net Debt / TTM EBITDA PF 1.9x

Global oilfield, manufactured products and equipment company
Leveraged to attractive secular trends
‒ Deepwater / Subsea
‒ Drilling / Well Complexity
‒ Production / Completion / Service Intensity
Develop strong brands and market position
High percentage of revenue from activity-based, consumable products
Disciplined growth across breadth of product offerings
18
SummaryLarge cap capabilities, small cap growth

Smart Solutions. Powerful Products.Smart Solutions. Powerful Products.
Questions?

Smart Solutions. Powerful Products.Smart Solutions. Powerful Products.
Appendix
Rescue SubmarineVMAX™ Simulation Station

Sources of RevenueAs a percent of 2012 sales
Purchase Cycle
Well Cycle Land / Offshore
Geography
UnitedStates63%
EuropeAfrica14%
Canada8%
Asia Pacific7%
Latin America4% Middle East
4%
ConsumableParts &
Aftermarket54%
CapitalProducts &Equipment
42%
Rental2%
Other2%
Subsea18%
Drilling30%
WellConstruction& Completion
10%
Stimulation &Intervention
11%
Production16%
Infrastructure15%
Land76%
Offshore24%
21

ROV Components
Drilling & Subsea DivisionSubsea Technologies
Launch & Recovery Systems
Tether Management
Systems
Largest range of ROVs in industry
Perry™ and Sub-Atlantic™
ROV Technology
VMax™ Simulation Systems
Source: Quest Offshore
22
‐
200
400
600
800
$‐
$5,000
$10,000
$15,000
$20,000
No. of Sub
sea Tree
Startup
s
CAPE
X ($MM)
Subsea Trees Tree Control Pkg Manifolds SPUs No. of Subsea Trees
Subsea Capex ($MM) & Subsea Tree Start‐ups

Subsea TechnologiesDeployment of the T-1200 Trencher
23

Drilling & Subsea DivisionDrilling Technologies
XL Backsaver
P-Quip™ mud pump liner retention system
1,000 ton hydraulic elevator
125 ton air spider
Casing slip
Drill pipe float valve
Mousehole tool
Wrangler™ Roughneck
Wrangler™ Catwalk
AMC™ torque machinesOffline Activity CraneMerrimac
Mud Pump Fluid End
Coiled Tubing BOP
24
Drilling Consumable Product SuiteMission Critical Drilling Capital Equipment

Davis-Lynch™ Casing & Cementing Technology
Drilling & Subsea DivisionDownhole Technologies
1) Spears & Associates – 2012 “Oilfield Market Report,” casing hardware market by revenue.
Weatherford39%
Halliburton17%
Forum (Davis-Lynch)
11%
Top-Co8%
Frank's Casing
3%
Varel3% Others
19%
25
Downhole Completion ToolsCannon™ Protection Systems Wireline Composite Frac Plugs
Trusted Name in a Consolidated Market1

Production & Infrastructure DivisionProduction Equipment
Exco Production Skid – Haynesville
Chevron Modular Facility - Permian SWN Compressor - Fayetteville
Seneca Resources Gas Production Unit - Marcellus
26

Production EquipmentMulti-well production equipment battery for Chevron
Heater Treater
Well Manifold
Production Separator Gas
Scrubber
Test Separators
27
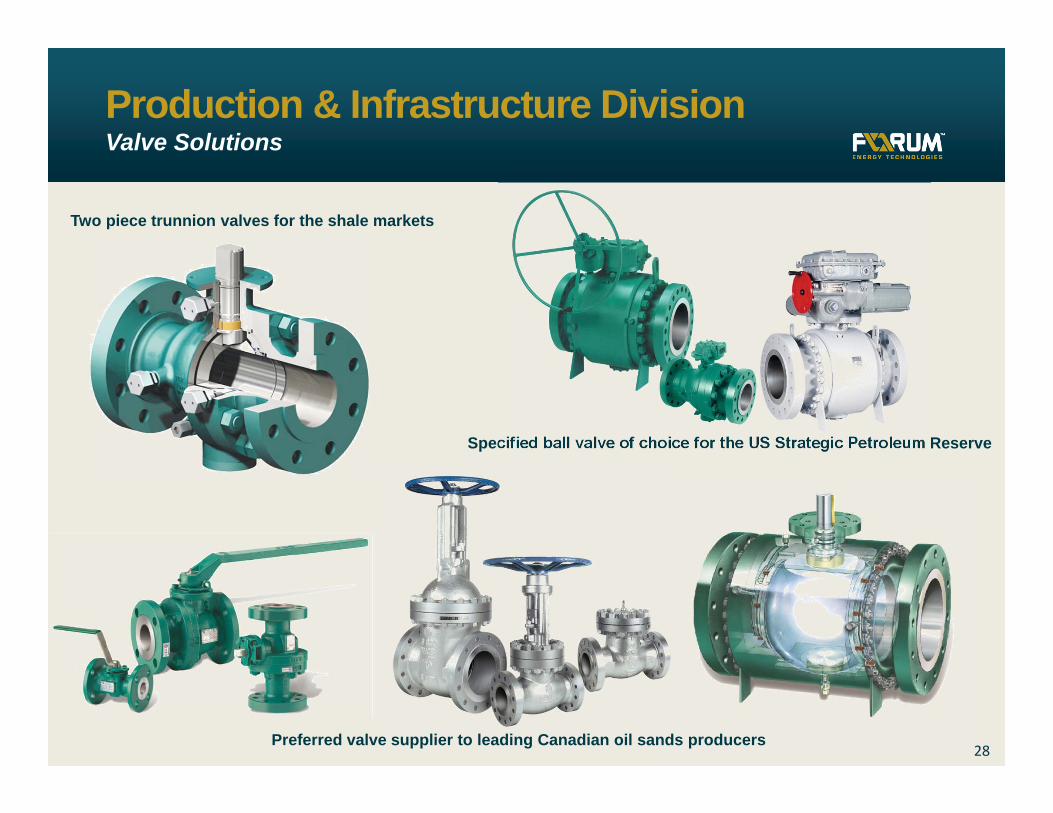
Two piece trunnion valves for the shale markets
Production & Infrastructure DivisionValve Solutions
Specified ball valve of choice for the US Strategic Petroleum Reserve
Preferred valve supplier to leading Canadian oil sands producers28

29
Production & Infrastructure DivisionFlow Equipment
29

Cris Gaut, FET Chairman & CEO‒ President (Drilling & Evaluation) and
CFO – Halliburton‒ ENSCO
Franklin Myers‒ Chief Financial Officer, Cameron‒ General Counsel, Baker Hughes
Evelyn Angelle, Halliburton ‒ Chief Accounting Officer,
Halliburton‒ Ernst & Young
Terence O’Toole, Tinicum‒ Managing Member, Tinicum
Partnership‒ Goldman, Sachs & Co.
David Baldwin, SCF Partners‒ Managing Director, SCF Partners‒ Union Pacific Drilling
Louis A. Raspino‒ President & CEO, Pride International‒ Sr VP & CFO, Grant Prideco
John A. Carrig‒ President & COO, ConocoPhillips‒ Chief Financial Officer, Conoco
Phillips
John Schmitz, Select Energy Services‒ Chairman & CEO, Select Energy
Services‒ HEP Oil Company
Mike McShane, Advent International‒ President & CEO, Grant Prideco‒ BJ Services Company
Andrew L. Waite, SCF Partners‒ Managing Director, SCF Partners‒ Simmons & Company‒ Royal Dutch Shell
Board of Directors
30

Reconciliation of Non-GAAP Measures
31
Forum Energy Technologies, Inc.Reconciliation of GAAP to non‐GAAP financial information
(Unaudited)
Three Months Ended($ millions) December 31, March 31, June 30, September 30,EBITDA Reconciliation 2012 2013 2013 2013
Net Income attributable to common stockholders $23.9 $31.9 $29.9 $33.2 Interest expense 3.4 3.4 3.1 4.4 Depreciation and amortization 13.7 13.9 14.4 15.7 Income tax expense 10.1 15.4 13.1 13.9 Severance ‐ ‐ ‐ 4.3 Facility closures ‐ ‐ ‐ 2.2 Deferred loan costs written off ‐ ‐ ‐ 2.1 Transaction expenses ‐ ‐ 1.8 1.1 Loss (gain) on foreign exchange 0.7 (1.4) 1.2 2.4 Adjusted EBITDA $51.8 $63.2 $63.5 $79.3

Non-GAAP Measures
This presentation contains “non-GAAP financial measures” as defined in Item 10 of Regulation S-K of the
Securities Exchange Act of 1934. The non-GAAP financial measures reflect earnings before interest, taxes,
depreciation and amortization expense (“EBITDA”). A reconciliation of EBITDA to the most directly
comparable financial measures calculated and presented in accordance with Generally Accepted
Accounting Principles in the United States (“GAAP”) is included in the appendix of this presentation. The
Company believes the presentation of EBITDA is useful to the Company's investors because EBITDA is an
appropriate measure of evaluating the Company's operating performance and liquidity that reflects the
resources available for strategic opportunities including, among others, investing in the business,
strengthening the balance sheet, repurchasing the Company's securities and making strategic acquisitions.
In addition, EBITDA is a widely used benchmark in the investment community.
The presentation of this additional information is not meant to be considered in isolation or as a substitute
for the Company's financial results prepared in accordance with GAAP.
32