forum one – vcg partners vietnam fund (vvf)
TRANSCRIPT

Classified: Public
FORUM ONE – VCG PARTNERS VIETNAM FUND (VVF)Thao Ong, CFA, Portfolio Manager
29 October 2020

Classified: Public
VVF: Discipline And Loyalty To GARP Strategy Lead To Long-term Outperformance
2| As of 30 September 2020Source: VinaCapital, Bloomberg
4.005.006.007.008.009.00
10.0011.0012.0013.0014.0015.0016.0017.0018.0019.00
VVF VN-Index
VVF annualized return since inception= 6.4%
VN-Index annualized return (since VVF’s inception)= 5.7%
Performance (All in $ term) VVF VN-Index Relative performanceYTD 0.3% -5.8% 6.1%3-Year 0.9% 10.4% -9.4%Since inception 38.3% 33.3% 5.0%
Classified: Public
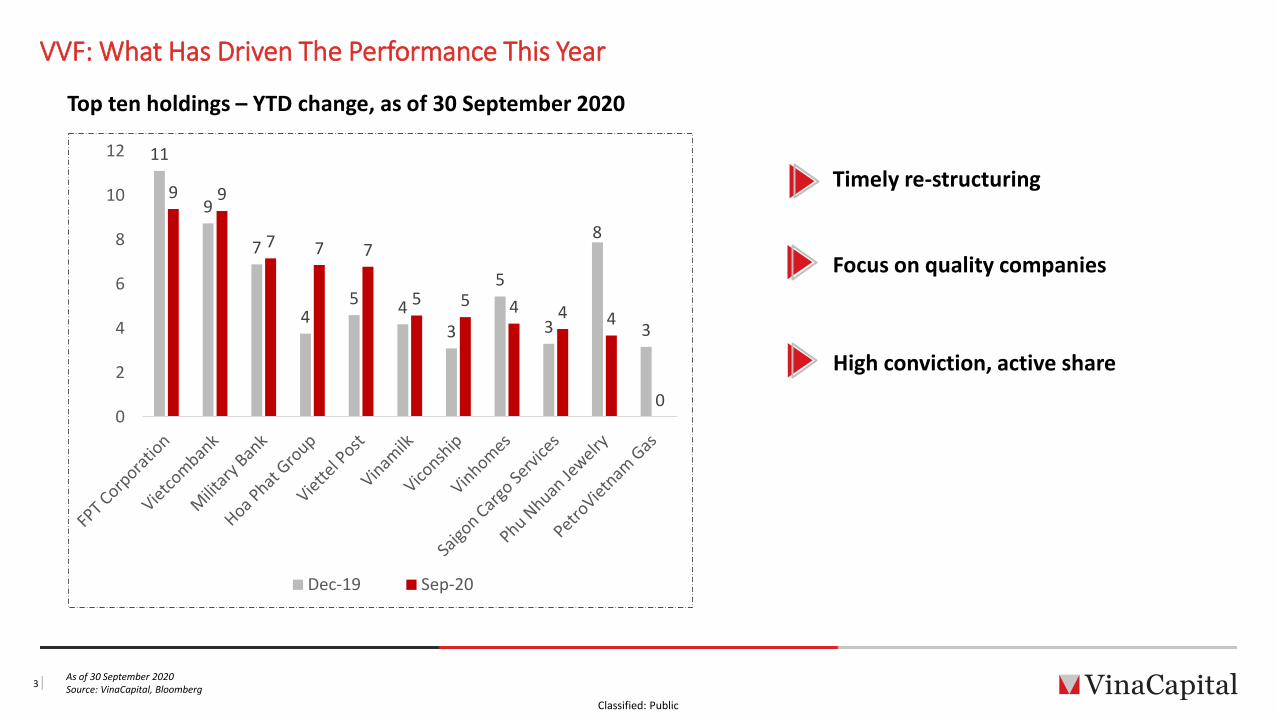
VVF: What Has Driven The Performance This Year
3| As of 30 September 2020Source: VinaCapital, Bloomberg
Top ten holdings – YTD change, as of 30 September 2020
11
9
7
45 4
3
5
3
8
3
9 9
7 7 7
5 5 4 4 4
00
2
4
6
8
10
12
Dec-19 Sep-20
Timely re-structuring
Focus on quality companies
High conviction, active share

Classified: Public
VVF: Index-Agnostic Portfolio
4| As of 30 September 2020Source: VinaCapital, Bloomberg
39%
17%
16%
12%
45%
71%
0%
10%
20%
30%
40%
50%
60%
70%
80%
90%
100%
VVF VN-Index
Small cap Mid cap Large cap
29%
8%
7%
1%
26%
5%
15%
3%
2%
27%
21%
10%
9%
8%
8%
5%
5%
1%
0% 5% 10% 15% 20% 25% 30% 35%
Financials
Industrials
Utilities
Information Technology
Real Estate
Materials
Consumer Staples
Consumer Discretionary
Energy
VVF VN-Index

Classified: Public
VVF: Performance Attribution By Sector
5| As of 30 September 2020Source: VinaCapital, Bloomberg
10%
8%
8%
8%
3%
1%
2%
2%
-6%
-5%
-4%
-2%
-18%
-21%
-19%
-16%
7%
8%
14%
13%
Industrials Real Estate Financials Materials IT
-6%
9%
-8%
50%
0% 1%
Real Estate
Materials
Financials
YTD return by sector
VN-Index
Relative weight vs. VN-Index
Industrials
Underweight real estate. Overweight Materials, Industrials, IT
IT

Classified: Public
-2.5%
-2.0%
-1.5%
-1.0%
-0.5%
0.0%
0.5%
1.0%
1.5%
2.0%
2.5%
HPG VTP VSC VNM CTG FPT ACV VHM VCB PNJ
VVF: Performance Attribution By Stock
6| As of 30 September 2020Source: VinaCapital, Bloomberg
YTD attribution
The fund’s YTD Return (as of 30 September 2020): + 0.3%
11%
37%35%
38%
15%27%
11% 7%
28%
2%

Classified: Public
7|
84103
180
232
170
88
-333
1,139
1,870
289
-50
0
50
100
150
200
250
300
-500
0
500
1000
1500
2000
2500
3000
2015 2016 2017 2018 2019
Daily turnover ($m)-(RHS) Foreign flow ($m)-(LHS)
Liquidity Driven Market In 2017-2019…
As of 30 September 2020Source: VinaCapital, Bloomberg

Classified: Public
8|
11.3 11.7
18.2 16.6
15.8
9.0
11.3
13.1
10.8 11.6
-
2.0
4.0
6.0
8.0
10.0
12.0
14.0
16.0
18.0
20.0
2015 2016 2017 2018 2019
Large caps Small & Mid caps
… Leads To A Widening Gap In Valuation Of Large Caps And Small- & Mid- Caps
Source: VinaCapital, Bloomberg

Classified: Public
9|
0.0%
2.0%
4.0%
6.0%
8.0%
10.0%
12.0%
14.0%
16.0%
18.0%
0.0% 5.0% 10.0% 15.0% 20.0% 25.0%
Net
Deb
t/Eq
uity
2020 Return on Equity
VN-Index
VVF
Quality portfolio of higher growth and more compelling valuation than benchmark
0
2
4
6
8
10
12
14
16
18
-15.0% -10.0% -5.0% 0.0% 5.0% 10.0%
2020
P/E
(x)
EPS growth
VN-Index
VVF
VVF: Growth At Reasonable Price Strategy
As of 30 September 2020Source: VinaCapital, Bloomberg

Classified: Public
10|
Navigating Through Extraordinary Times
CORE CYCLICAL OPPORTUNISTIC
High cash flow generating businesses
Liquid, quality stocks
Growing with positive tailwinds
Reasonable valuation
Active weight
Companies poised for upturn in sales cycle or favourable raw material cycle
Resilient post Covid-19
M&A catalyst
Spin-off
State divestment
VVF: Portfolio Strategy

Classified: Public
11|
Construction steel Steel pipes Hot rolled coil Galvanized steel
The Leading Steel Maker In Vietnam
VVF Investment Case: Hoa Phat Group (HPG)
Source: Hoa Phat Group, Vietnam Steel Association

Classified: Public
12|
2,203 2,294
2,769 3,537
24.0% 23.8%26.1%
32.0%
0.0%
5.0%
10.0%
15.0%
20.0%
25.0%
30.0%
35.0%
-
500
1,000
1,500
2,000
2,500
3,000
3,500
4,000
2017 2018 2019 2020E
Construction steel's sales volume ('000 tons) - (LHS) Market share (%) - (RHS)
Strong Volume And Market Share Growth Over The Years
VVF Investment Case: Hoa Phat Group (HPG)
As of 30 September 2020Source: Hoa Phat Group, Vietnam Steel Association

Classified: Public
13|
High ROE On Reasonable Gearing
25.7%
6.1%
-3.8%
44.5%
64.3%
54.3%
24.1%
33.4%
24.8%21.2%
15.8%
21.0%
0.0%
5.0%
10.0%
15.0%
20.0%
25.0%
30.0%
35.0%
40.0%
-10.0%
0.0%
10.0%
20.0%
30.0%
40.0%
50.0%
60.0%
70.0%
2015 2016 2017 2018 2019 2020E
Net debt /equity (%) - (LHS) ROE (%) - (RHS)
VVF Investment Case: Hoa Phat Group (HPG)
Source: VinaCapital, Hoa Phat Group

Classified: Public
14|
Profit Growth Acceleration
1,990
2,407
2,744
3,825
345 370 324525
0
500
1,000
1,500
2,000
2,500
3,000
3,500
4,000
2017 2018 2019 2020E
Revenue ($m) PAT ($m)
VVF Investment Case: Hoa Phat Group (HPG)
Source: VinaCapital, Hoa Phat Group

Classified: Public
15|
Significant Stock Price Outperformance YTD
-40
0
40
80
Dec-19 Feb-20 Apr-20 Jun-20 Aug-20
HPG VN-Index
VVF Investment Case: Hoa Phat Group (HPG)
As of 30 September 2020Source: Bloomberg

Classified: Public
16|
Leading Plastic Pipe Producer In Vietnam
uPVC pipes HDPE pipes PP-R pipes
Products used in residential and infrastructure projects
Highway Airport Residential
VVF Investment Case: Binh Minh Plastic (BMP)
Source: VinaCapital

Classified: Public
17|
24.0%
21.8%
10.9%
43.3%
BMP NTP HSG Others
Largest market share
VVF Investment Case: Binh Minh Plastic (BMP)
Source: VinaCapital

Classified: Public
120 143
165 169 187 195
-
20
40
60
80
100
120
140
160
180
200
2015 2016 2017 2018 2019 2020E
Revenue ($m)
18|
Steady sales growth
Revenue 5Y CAGR 10%
VVF Investment Case: Binh Minh Plastic (BMP)
Source: VinaCapital, Bloomberg

Classified: Public
19|
Earnings upside thanks to margin improvement
24% 22% 23%28%
892 901
853
783
720
740
760
780
800
820
840
860
880
900
920
0%
5%
10%
15%
20%
25%
30%
2017 2018 2019 2020E
Gross margin (%) - (LHS) PVC price ($/ton) - (RHS)
VVF Investment Case: Binh Minh Plastic (BMP)
Source: VinaCapital, Bloomberg

Classified: Public
20|
Healthy balance sheet and high dividend
40.7
27.8 30.8
42.3
70%
77%
95% 95%
19% 17% 17%
20%
0%
20%
40%
60%
80%
100%
120%
-
5.0
10.0
15.0
20.0
25.0
30.0
35.0
40.0
45.0
2017 2018 2019 2020ENet Cash balance ($m) - (LHS) Payout ratio - (RHS) ROE - (RHS)
VVF Investment Case: Binh Minh Plastic (BMP)
Source: VinaCapital, Bloomberg

Classified: Public
21|
-2std
-1std
+1std
+2std
Mean
2
3
4
5
6
7
8
9
10
11
Oct-15 Oct-16 Oct-17 Oct-18 Oct-19 Oct-20
5Y historical EV/EBITDA
Attractive valuation
VVF Investment Case: Binh Minh Plastic (BMP)
Source: VinaCapital, Bloomberg

Classified: Public
-40
-30
-20
-10
0
10
20
30
40
50
60
Dec-19 Mar-20 Jun-20 Sep-20
BMP VN-Index
22|
Strong Share Price Outperformance YTD
Entry point
VVF Investment Case: Binh Minh Plastic (BMP)
Source: Bloomberg

Classified: Public
23|
Urbanization Domestic Consumption Digitalization
Source: VinaCapital
VVF: Investment Themes

Classified: Public
Disclaimer
24|
The information contained herein has been prepared by VinaCapital (the “Company") and is subject to updating, completion, revision, further verification and amendment without notice.
The information contained herein has not been approved by any listing authority or any investment regulator. The information does not constitute or form part of any offer for sale or solicitation of any offer to buy or subscribe for any securities nor shall they or any part of them form the basis of or be relied on in connection with, or act as any inducement to enter into, any contract or commitment whatsoever.
No undertaking, representation, warranty or other assurance, expressed or implied, is made or given by or on behalf of the Company or any of its directors, officers, partners, employees, agents or advisers or any other person as to the accuracy or completeness of the information or opinions contained herein and no responsibility or liability is accepted by any of them for any such information or opinions or for any errors, omissions, misstatements, negligence or otherwise for any other communication written or otherwise.
The information herein may not be reproduced, re-distributed or passed to any other person or published in whole or in part for any purpose. By accepting receipt of this document, you agree to be bound by the limitations and restrictions set out above.
Neither these pages nor any copy of them may be taken or transmitted into or distributed in any jurisdiction where the distribution of such material would be prohibited under the jurisdiction’s applicable securities laws. Any failure to comply with this restriction may constitute a violation of national securities laws.
Past performance is not a guarantee of future returns.

Classified: Public
17th Floor, Sun Wah Tower115 Nguyen Hue, District 1, Ho Chi Minh City, Vietnam
P: +84 (0) 28 3821 9930 F: +84 (0) 28 3821 9931Email: [email protected]
Website: www.vinacapital.com
Ho Chi Minh City | Hanoi | Singapore |