forum portfolio investment policy statement · forum portfolio investment policy statement prepared...
TRANSCRIPT
Forum PortfolioInvestment Policy Statement
Prepared for
John Smith and Mary Smith
Sunday February 12, 2017
60% Equities / 40% Fixed Income
Growth Portfolio
I. Purpose
This Investment Policy Statement (IPS) has been prepared for John Smith and Mary Smith (Client). The purposeof this IPS is to assist the Client and Forum Financial Management, LP (Advisor or Forum), in effectivelysupervising, monitoring, and evaluating the investment of the Client's assets (Portfolio). The investment of thePortfolio is defined in the various sections of the IPS by:
A. Documenting the Client's attitudes, expectations, objectives, and guidelines for the investment of allassets in the Portfolio.
B. Setting forth an investment structure for managing the Client's Portfolio. This structure includes variousasset classes, investment management styles, asset allocations and acceptable ranges thereof, which, in total,are expected to produce an appropriate level of overall diversification and total investment return over theinvestment time horizon.
C. Complying with all applicable fiduciary and due diligence requirements and with all applicable state andfederal laws, rules, and regulations.
II. Statement of Objectives
This IPS describes the prudent investment process that the Advisor deems appropriate for the Client's situationbased on the information the Client has provided, which is assumed to be accurate and complete. If any of theassumptions used are based upon incorrect or inconsistent information provided to the Advisor, then theinvestment plan developed for the Client may be inadequate to meet the Client's stated financial goals. The Clientdesires to maximize spending rates with prudent levels of risk given the needs and financial goals that have beencommunicated to Forum.
The following Feasibility of Objectives provides a framework for Forum and the Client to thoughtfully considerthe investment risk appropriate for the client and the investment return required to provide a sustainable spendingover the Client's lifetime. The projections and illustrations regarding the likelihood of various investmentoutcomes are hypothetical in nature, do not reflect actual investment results, and are not guarantees of futureresults.
Information that you provided about your assets, financial goals, and personal situation are key assumptions forthe calculations and projections in this Report. If any of the assumptions are incorrect, you should notify yourfinancial advisor. Even small changes in assumptions can have a substantial impact on the results shown in thisReport. The information provided by you should be reviewed periodically and updated when either theinformation or your circumstances change.
Page 2 of 18
A. Feasibility of Objectives
The Sustainable Spending is the annual spending rate in retirement at which 75% of all simulated outcomes havemoney left at the end of the 41 year period between today and when the Client is 95 years old. For couples, werun the analysis for when the younger Client turns 95 years old. All ages listed herein refer to the age of theyounger individual. If any Outside Income or Non-Recurring Expenses are included below then the SustainableSpending is inclusive of these cash flows (i.e. a positive cash flow will increase the Sustainable Spending and anynegative cash flows decrease the Sustainable Spending).
Current Portfolio Name GNP 60 GrowthTotal to be Managed $1,000,000Total not Managed $0Total not Managed Return 0.0%Annual Savings Until Retirement* $0
Target Retirement Age 65Sustainable Spending in Retirement** $66,165Expected Value of Portfolio at Retirement $1,587,313
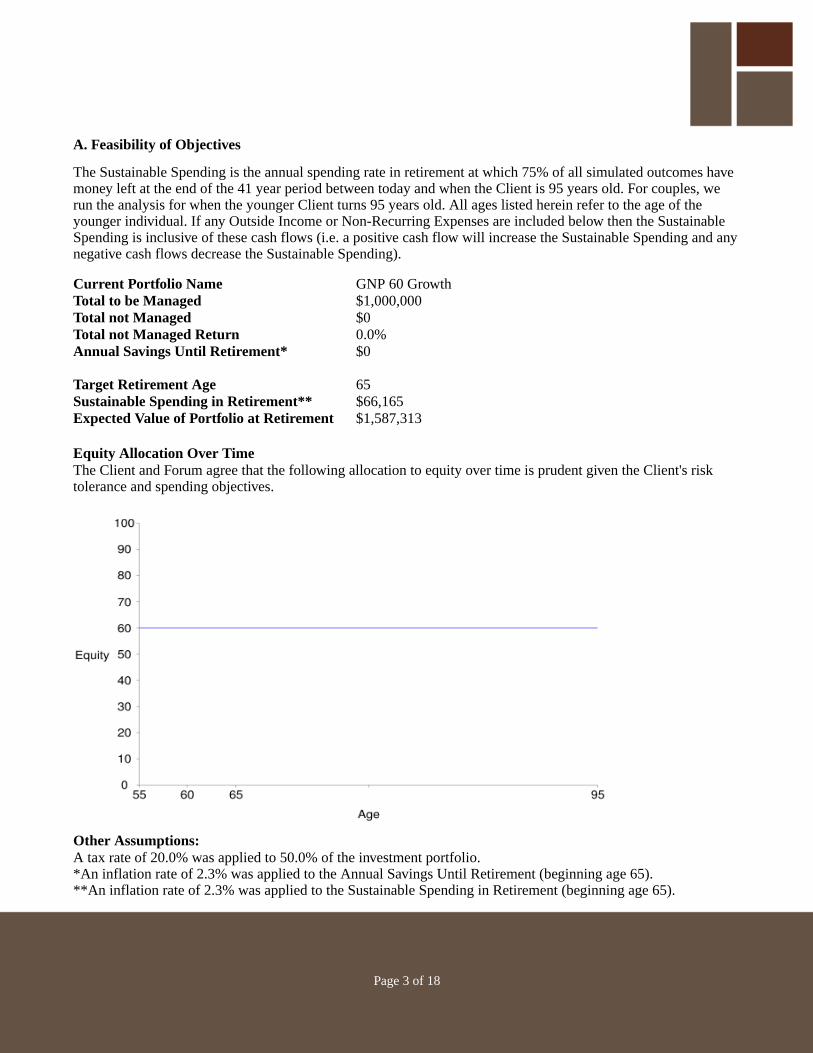
Equity Allocation Over TimeThe Client and Forum agree that the following allocation to equity over time is prudent given the Client's risktolerance and spending objectives.
Other Assumptions:A tax rate of 20.0% was applied to 50.0% of the investment portfolio.*An inflation rate of 2.3% was applied to the Annual Savings Until Retirement (beginning age 65).**An inflation rate of 2.3% was applied to the Sustainable Spending in Retirement (beginning age 65).
Page 3 of 18
B. Considering the Outcomes
The Sustainable Spending is provided to help the Client evaluate the feasibility of their current spending andinvestment plan. Before investing the Client should also understand two fundamental concepts:
1. Inflation risk. Everyone has experienced inflation in our lives. The prices at the pump go up and fruitsand vegetables get more expensive each year. The magnitude of this effect on retirement savings is evenstronger. Retirees, like all other investors, will have to spend almost twice as many dollars in twentyyears to buy the same things they buy today, but at the same time they pull dollars out of the investmentportfolio each year, reducing how much those investments can grow.
2. Investment risk. Stock markets rapidly price new information, but this efficiency can sometimes resultin dramatic fluctuations in the value of equity investments. For many investors, the risk of being in themarket is still less than the risk of being out of it because they need a return on their investments thatoutpaces inflation. The result is that we must accept a measured amount of uncertainty as equityinvestors. Ultimately, our success depends on three major factors that the Client can control: how muchthe Client has saved, how much the Client will spend, and how much risk the Client is willing to accept.
Forum makes no guarantee of the Sustainable Spending rate. The probability of success indicated hereinrepresents a range of possible outcomes, some of which would require the Client to adjust their spendingrate down in order to avoid running out of money before their death.
The Sustainable Spending rate will not be achievable if the Client's actual spending exceeds this amount orif equity and/or bond returns over the Client's lifetime are below historical averages.
Page 4 of 18
III. Asset Class Guidelines
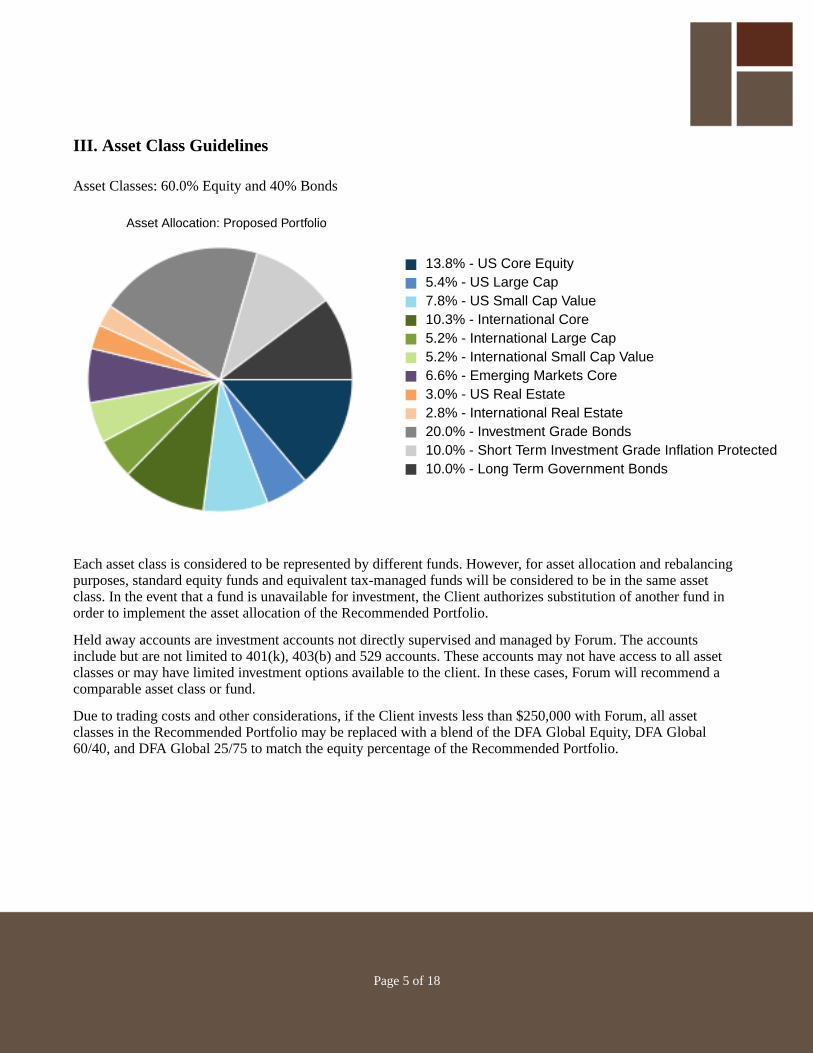
Asset Classes: 60.0% Equity and 40% Bonds
Asset Allocation: Proposed Portfolio
13.8% - US Core Equity5.4% - US Large Cap7.8% - US Small Cap Value10.3% - International Core5.2% - International Large Cap5.2% - International Small Cap Value6.6% - Emerging Markets Core3.0% - US Real Estate2.8% - International Real Estate20.0% - Investment Grade Bonds10.0% - Short Term Investment Grade Inflation Protected10.0% - Long Term Government Bonds
Each asset class is considered to be represented by different funds. However, for asset allocation and rebalancingpurposes, standard equity funds and equivalent tax-managed funds will be considered to be in the same assetclass. In the event that a fund is unavailable for investment, the Client authorizes substitution of another fund inorder to implement the asset allocation of the Recommended Portfolio.
Held away accounts are investment accounts not directly supervised and managed by Forum. The accountsinclude but are not limited to 401(k), 403(b) and 529 accounts. These accounts may not have access to all assetclasses or may have limited investment options available to the client. In these cases, Forum will recommend acomparable asset class or fund.
Due to trading costs and other considerations, if the Client invests less than $250,000 with Forum, all assetclasses in the Recommended Portfolio may be replaced with a blend of the DFA Global Equity, DFA Global60/40, and DFA Global 25/75 to match the equity percentage of the Recommended Portfolio.
Page 5 of 18
IV. Fees
Investment Advisory Fees will be based on a percentage of the Aggregate Account Balance of the Client'sPortfolio on the last day of the calendar quarter as per the Forum Advisory Agreement.
The fees will be deducted each calendar quarter in arrears from the Client's account. For the purposes of theperformance and graphical illustrations in Section VIII, an annual fee of 1.0% is used. Refer to the Forum FormADV Part 2 for additional fees charged by firms other than Forum for which the Client will be responsible (forexample, Custodian fees or fund expenses charged by the mutual fund company).
V. Graphical Representations
Important Disclosures:
The Client understands these graphs are provided for illustrative and educational purposes only, and thatno guarantees can be given about future performance. These illustrations should not be construed asoffering such a guarantee. The Client also acknowledges the following disclosures about these graphs:
• To generate the hypothetical returns of the Portfolio illustrated, the Advisor uses the total returns ofvarious indices (as described in the Appendix). The indices, in many instances, are simulated datadeveloped by DFA or academics, which may have had different security holdings than the DFA funds.The resulting simulated returns were compiled after the end of the periods shown, and do not representtrading in actual accounts or decisions made by the Advisor during the periods described. Theperformance results do not reflect the impact that material economic and market factors might have hadon the decision-making process the Client or the Advisor if the assets had been actually invested duringthat period. Simulated performance also differs from actual performance because it is achieved throughthe retroactive application of a strategy designed with the benefit of hindsight. Only actual fund datashould be used to make an investment decision. Indices used are unmanaged and cannot be invested indirectly by investors.
• Hypothetical Portfolio returns are net of, that is they take into account, the advisory fee (which isdisclosed herein and in the Forum Form ADV Part 2) and fund expenses. However, Portfolio returns donot consider any fees charged to the account by the Custodian.
• Forum reserves the right to rebalance between domestic and international funds at any time in responseto changes in global capital market weights.
• The Client's Portfolio may invest in either passively and/or actively managed securities. The actualweightings of these investments can and will vary. As a result, actual returns and volatility characteristicswill be higher or lower than those presented. The principal value of a Client's mutual fund shares, andthus the value of the account, when redeemed, may be more or less than their cost.
• The Client should also carefully consider the information about the mutual funds mentioned in thisproposal, including investment objectives, risks, and charges and expenses, which can be found in thefunds' prospectuses. Copies of the prospectuses are available, without charge, from the Custodian.
See the Appendix for further information.
Page 6 of 18
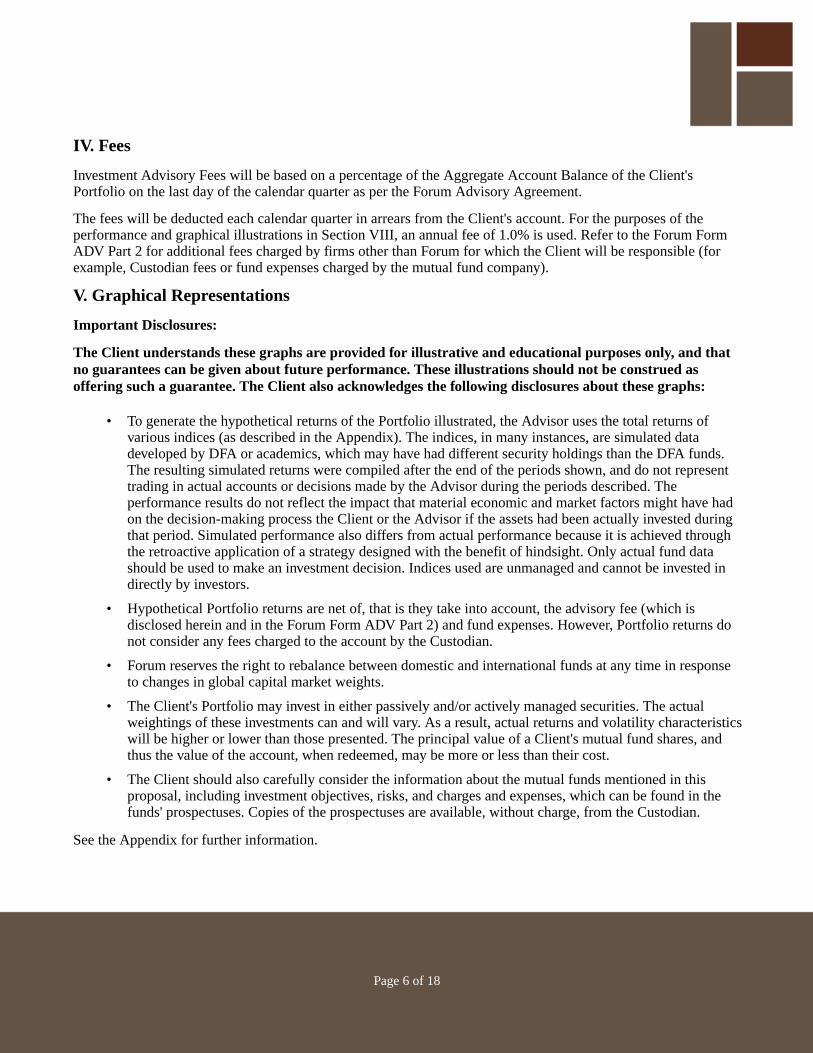
1. The Effects of Market Volatility:
Forum attempts to lower the volatility of a portfolio through asset allocation using the asset classes described inSection III. The above hypothetical example illustrates the effects of market volatility. Both portfolios in thishypothetical example have the same simple average return of 7% and each portfolio's returns sum to 35%.However, Portfolio B has lower volatility, as measured by standard deviation, at 10.69%. Portfolio A has a highervolatility, measured by its standard deviation of 21.39%, or over two times the volatility of Portfolio B. The returnof Portfolio A is significantly lower than that of Portfolio B. This may indicate that increasing risk alone may notbe an appropriate approach to increasing the performance of a Portfolio.
Page 7 of 18
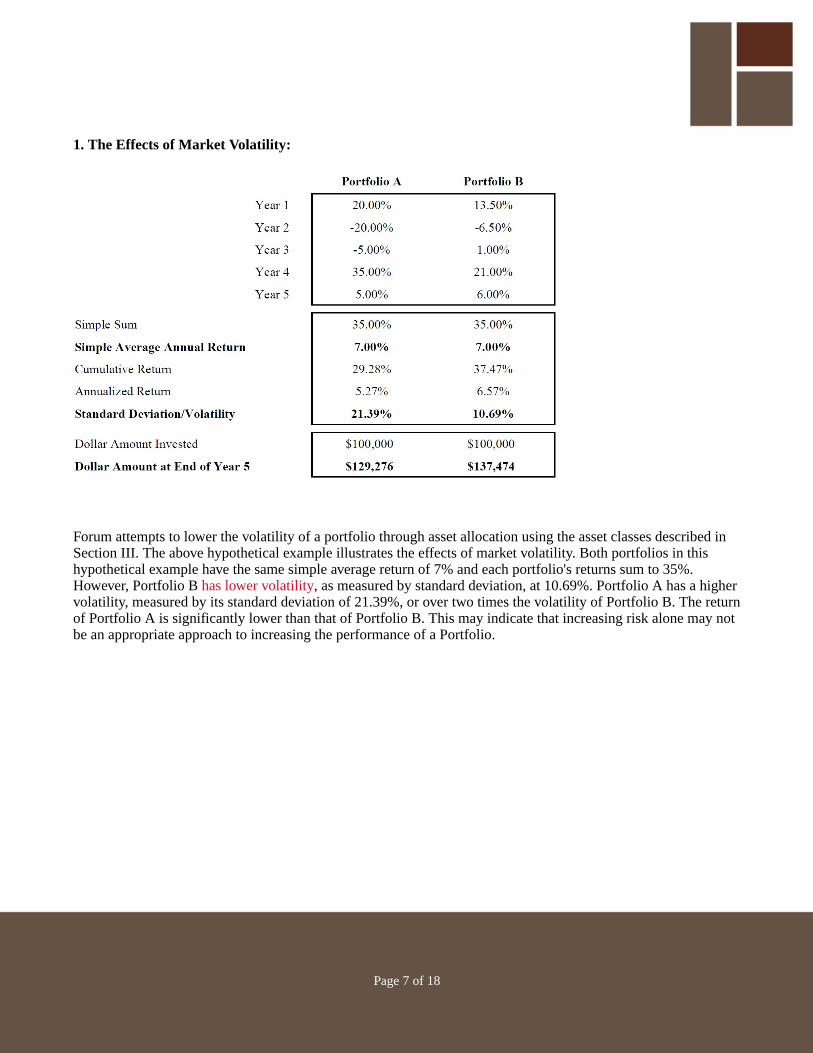
2. Range of Rolling Annual Returns for Given Periods (Net of Advisory Fees):
Data as of Dec-16
This graph uses the hypothetical historical annual returns of the Recommended Portfolio on a monthly rollingbasis. It illustrates the maximum and minimum return historically for one-year, three-year, five-year and ten-yearperiods since January 1970. The bars show the range of returns that would have occurred for these periods.Historically, a Client's chance of losing investment principal decreases dramatically when investments are held fora longer period of time. A longer investment time horizon enables the Portfolio to have more time to recover fromany losses. When an investment horizon is short, investment value may be low when money must be withdrawn.Over a longer term, the Client will have the opportunity of more time to ride out the highs and lows of the market.A Client's potential returns are less extreme with a longer holding period.
Page 8 of 18
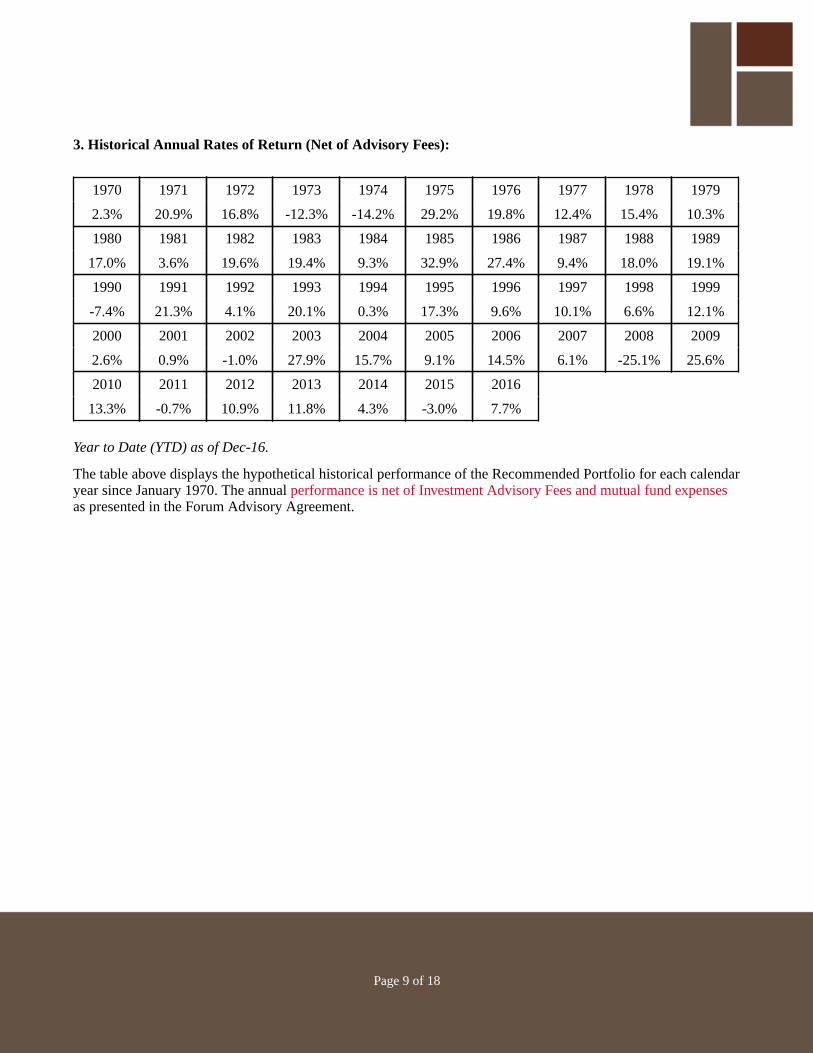
3. Historical Annual Rates of Return (Net of Advisory Fees):
1970 1971 1972 1973 1974 1975 1976 1977 1978 1979
2.3% 20.9% 16.8% -12.3% -14.2% 29.2% 19.8% 12.4% 15.4% 10.3%
1980 1981 1982 1983 1984 1985 1986 1987 1988 1989
17.0% 3.6% 19.6% 19.4% 9.3% 32.9% 27.4% 9.4% 18.0% 19.1%
1990 1991 1992 1993 1994 1995 1996 1997 1998 1999
-7.4% 21.3% 4.1% 20.1% 0.3% 17.3% 9.6% 10.1% 6.6% 12.1%
2000 2001 2002 2003 2004 2005 2006 2007 2008 2009
2.6% 0.9% -1.0% 27.9% 15.7% 9.1% 14.5% 6.1% -25.1% 25.6%
2010 2011 2012 2013 2014 2015 2016
13.3% -0.7% 10.9% 11.8% 4.3% -3.0% 7.7%
Year to Date (YTD) as of Dec-16.
The table above displays the hypothetical historical performance of the Recommended Portfolio for each calendaryear since January 1970. The annual performance is net of Investment Advisory Fees and mutual fund expensesas presented in the Forum Advisory Agreement.
Page 9 of 18
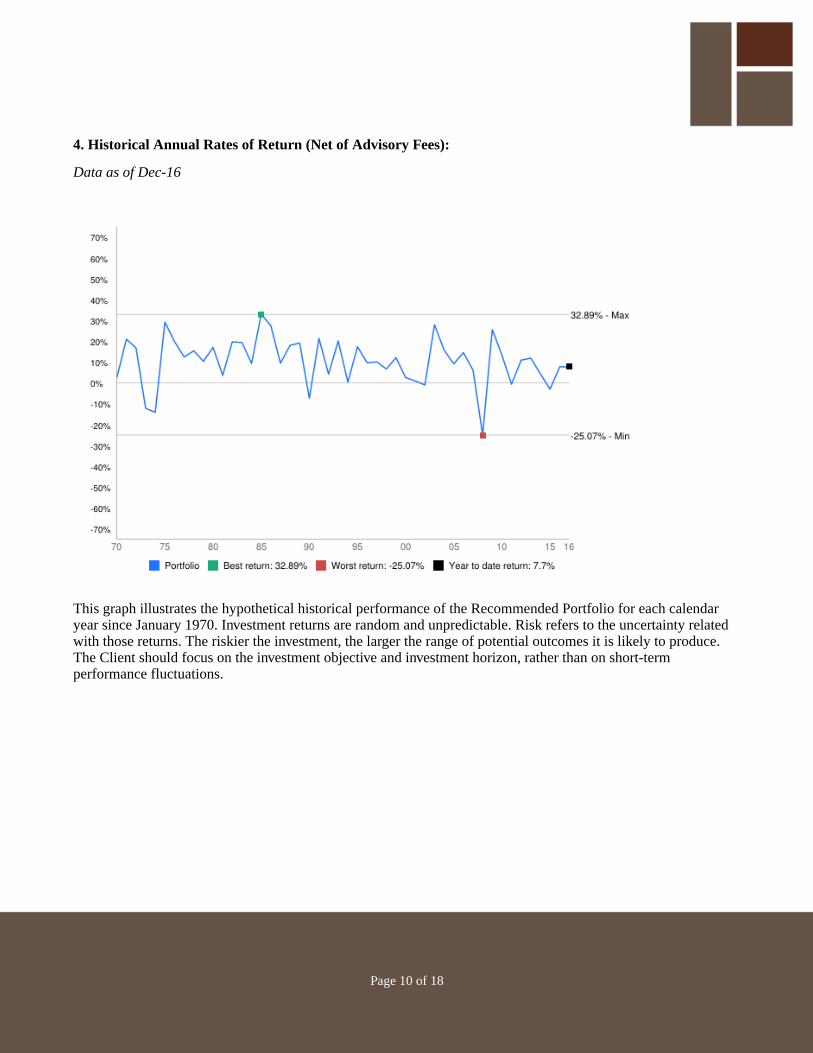
4. Historical Annual Rates of Return (Net of Advisory Fees):
Data as of Dec-16
This graph illustrates the hypothetical historical performance of the Recommended Portfolio for each calendaryear since January 1970. Investment returns are random and unpredictable. Risk refers to the uncertainty relatedwith those returns. The riskier the investment, the larger the range of potential outcomes it is likely to produce.The Client should focus on the investment objective and investment horizon, rather than on short-termperformance fluctuations.
Page 10 of 18
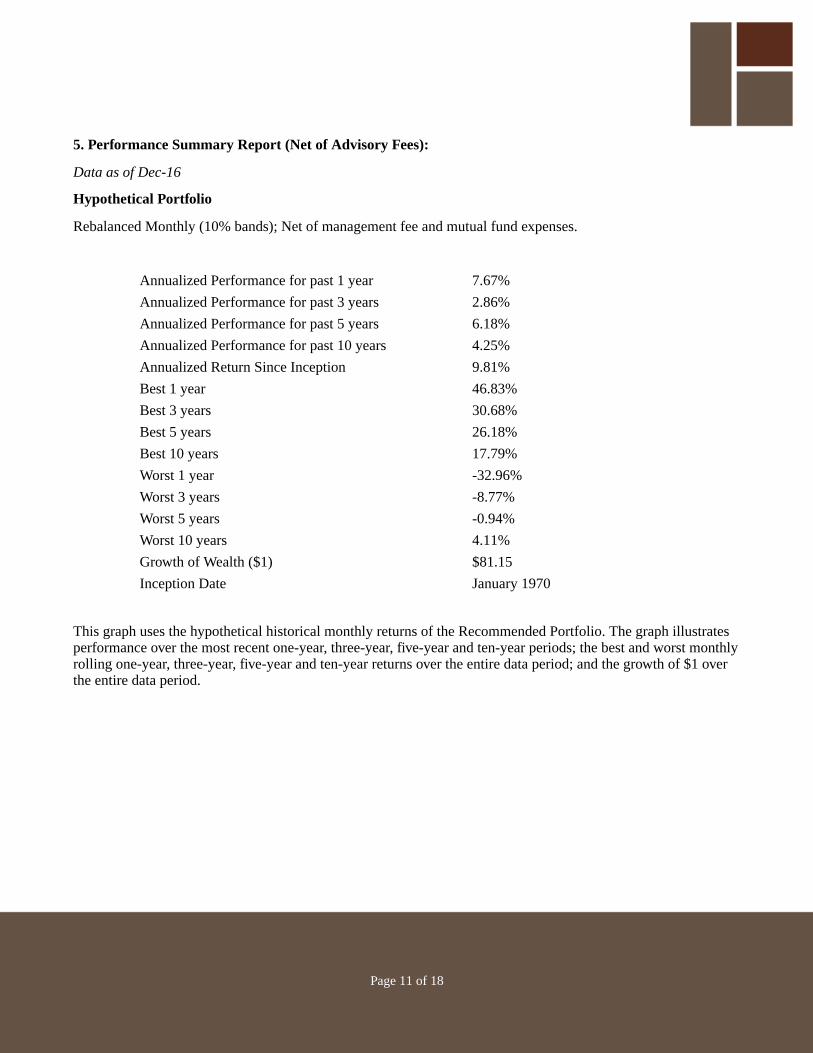
5. Performance Summary Report (Net of Advisory Fees):
Data as of Dec-16
Hypothetical Portfolio
Rebalanced Monthly (10% bands); Net of management fee and mutual fund expenses.
Annualized Performance for past 1 year 7.67%
Annualized Performance for past 3 years 2.86%
Annualized Performance for past 5 years 6.18%
Annualized Performance for past 10 years 4.25%
Annualized Return Since Inception 9.81%
Best 1 year 46.83%
Best 3 years 30.68%
Best 5 years 26.18%
Best 10 years 17.79%
Worst 1 year -32.96%
Worst 3 years -8.77%
Worst 5 years -0.94%
Worst 10 years 4.11%
Growth of Wealth ($1) $81.15
Inception Date January 1970
This graph uses the hypothetical historical monthly returns of the Recommended Portfolio. The graph illustratesperformance over the most recent one-year, three-year, five-year and ten-year periods; the best and worst monthlyrolling one-year, three-year, five-year and ten-year returns over the entire data period; and the growth of $1 overthe entire data period.
Page 11 of 18

Appendix Additional Disclosures and Definitions
All performance data is provided by Dimensional Fund Advisors through the Returns 2.0 program. Allperformance data was obtained by Forum from outside sources and is believed to be reliable, but there canbe no guarantees as to its accuracy or reliability. Estimates presented herein are based upon historicalperformance data of indices and adjusted for both the Management Fee to be charged by Forum and theexpenses of mutual funds currently used by Forum for each asset class in its investment models. However,Portfolio returns do not consider any fees charged to the account by the Custodian.
The IPS has been prepared using historical performance of indices determined by Forum to be representative ofthe asset classes. There is no stated or implied guarantee that the stated rate of return will be realized or that theinvestments presented will perform as indicated in future years. The performance displayed herein is hypotheticaland was compiled after the end of the time period specified. Such results do not represent actual results of anyparticular customer account and may not reflect the actual performance of the program, since some of theinvestments currently used in the program have not existed for the entire period shown. No attempt has beenmade to predict how these asset classes will perform in the future. Rather, the IPS attempts to compare thehistorical relationship between specific asset classes in general, with the hope of providing illustrations. As such,there is no specific claim or warranty implied about future performance.
Actual returns will depend on the performance of the actual investments. Differences between indexed returnsand volatility presented herein and actual results could arise and these differences may be material, resulting in aPortfolio value which may be more or less than the original value and/or significantly different from theRecommended Portfolio's results shown herein. Past performance is not an indication of future results.
Source Disclosure for Data Used in Graphs
Domestic Equity Asset Classes and Representative Indices
US Large CapThis asset class is comprised of mutual funds that invest in a broad range of U.S. equity securities considered to be large capitalization. TheUS Large Cap asset class is represented for performance purposes by: January 1970-present: S&P 500 Index.
US Core EquityThis asset class is comprised of mutual funds that invest in a broad range of U.S. equity securities and provides exposure to the total U.S.stock market. Securities may be weighted to provide greater than market-weight exposure to factors that increase expected return, such asbut not limited to small cap, value and profitability factors. The US Core Equity asset class is represented for performance purposes by:January 1970-present: Dimensional US Adjusted Market 2 Index.
US Small Cap ValueThis asset class is comprised of mutual funds that invest in a broad range of U.S. equity securities whose market capitalization is notconsidered large capitalization. Securities may be weighted to provide greater than market-weight exposure to factors that increaseexpected return, such as but not limited to small cap, value and profitability factors. The US Small Value asset class is represented forperformance purposes by: January 1970-present: Dimensional US Targeted Value Index.
US Real EstateThis asset class is comprised of mutual funds that invest in a broad range of U.S. Real Estate Investment Trusts ("REITs") and companiesengaged in residential construction and firms. The US Real Estate is asset class is represented for performance purposes by: January 1978-present: Dow Jones US Select REIT Index; January 1970-December 1977: 50% Dimensional US Small Cap Index and 50% DimensionalUS Small Value Index.
Page 12 of 18

International Equity Asset Classes and Representative Indices
International CoreThis asset class is comprised of mutual funds that invest in a broad range of non-U.S. developed market equity securities. Securities maybe weighted to provide greater than market-weight exposure to factors that increase expected return, such as but not limited to small cap,value and profitability factors. The International Core asset class is represented for performance purposes by: January 1994-Present:Dimensional International Adjusted Market Index; January 1970-December 1993: MSCI EAFE Index.
International Large CapThis asset class is comprised of mutual funds that invest in stocks of large capitalization non-U.S. companies from developed countries.The International Large Cap asset class is represented for performance purposes by: January 1994-present: Dimensional InternationalLarge Index; January 1970-December 1993: MSCI EAFE Index.
International Small Cap ValueThis asset class is comprised of mutual funds that invest in stocks of small capitalization non-U.S. companies. Securities may be weightedto provide greater than market exposure to factors that increase expected return, such as but not limited to small cap, value and profitabilityfactors. The International Small Cap Value asset class is represented for performance purposes by: July 1981 - Present: DimensionalInternational Small Value Index; January 1970- June 1981: Dimensional International Small Cap Index.
Emerging Markets CoreThis asset class is comprised of mutual funds that invest in a broad range of emerging market equity securities. Securities may be weightedto provide greater than market-weight exposure to factors that increase expected return, such as but not limited to small cap, value andprofitability factors. The Emerging Markets Core asset class is represented for performance purposes by: January 1994-Present:Dimensional Emerging Markets Adjusted Market Index; January 1988-December 1993 MSCI Emerging Markets Index (gross div);January 1970- December 1987: Dimensional International Small Index.
International Real EstateThis asset class is comprised of mutual funds that invest in a broad range of securities of non-U.S. companies in the real estate industry,and may include developed and emerging markets, with a focus on non-U.S. REITs and companies that the mutual fund manager considersto be REIT-like investments. The funds should be well diversified with respect to both geography and property type. The International RealEstate asset class is represented for performance purposes by: July 1989-Present: S&P Global ex US REIT Index (gross div.); January1970-June 1989: US REIT.
Global Equity Asset Classes and Representative Indices
Global EquityThis asset class is comprised of mutual funds that invest in a combination of underlying US, international, and emerging markets equityfunds. The Global Equity asset class is represented for performance purposes by: July 1973-Present: DFA Equity Balanced Strategy Index.
Global 60% EquityThis asset class is comprised of mutual funds that invest in a combination of underlying US equity, international developed equity,emerging markets equity and fixed income funds. Generally, the Portfolio invests its assets in equity and fixed income underlying funds toachieve an allocation of approximately 40% to 80% (with a target allocation of approximately 60%) of the assets allocated to equity fundsand 20% to 60% (with a target allocation of approximately 40%) of the assets allocated to fixed income funds. Global 60% Equity assetclass is represented for performance purposes by: July 1973-Present: DFA Normal Balanced Strategy Index.
Global 25% EquityThis asset class is comprised of mutual funds that invest in a combination of underlying US equity, international developed equity,emerging markets equity and fixed income funds. Generally, the Portfolio invests its assets in equity and fixed income underlying funds toachieve an allocation of approximately 5% to 45% (with a target allocation of approximately 25%) of the assets allocated to equity fundsand 55% to 95% (with a target allocation of approximately 75%) of the assets allocated to fixed income funds. The Global 25% Equityasset class is represented for performance purposes by: July 1973-Present: DFA Conservative Balanced Strategy Index.
Global Real EstateThis asset class is comprised of mutual funds that invest in securities of U.S. and non-U.S. companies in the real estate industry, includingwith a focus on U.S. and non-U.S. REITs and companies that the mutual fund manager considers to be REIT-like entities. Forum may usethis fund to replace allocations to both U.S. REIT and International REIT at its discretion. The Global Real Estate asset class is representedfor performance purposes by: July 1989-Present: S&P Global REIT Index (gross div.); January 1970-June 1989: US REIT.
Page 13 of 18

Fixed Income Asset Classes and Representative Indices
Core BondsThis asset class is comprised of mutual funds that invest in investment grade obligations. The allocation will seek to be diversified. TheCore Bonds asset class is represented for performance purposes by: January 1976-present Barclays Capital Treasury Bond Index 1-5 Years,January 1970-December 1975 Merrill Lynch One-Year US Treasury Note Index.
Investment GradeThis asset class is comprised of mutual funds that invest in investment grade obligations. The allocation will seek to be diversified. TheCore Bonds asset class is represented for performance purposes by: January 1976-present Barclays Capital Treasury Bond Index 1-5 Years,January 1970-December 1975 Long Term Government Bonds Index.
Global BondsThis asset class is comprised of mutual funds that invest in a broad range of investment grade obligations from US and internationaldeveloped fixed income securities. The Global Bonds asset class is represented for performance purposes by: January 1985-presentCitigroup World Government Bond Index 1-3 Years (hedged); January 1970-December 1984: Short-Term Bonds.
Short-Term BondsThis asset class is comprised of mutual funds that invest in investment grade with an average portfolio duration of three years or less. TheShort-Term Bonds asset class within Preservation oriented portfolios is represented by: January 1976-present Barclays Capital TreasuryBond Index 1-5 Years, January 1970-December 1975 Merrill Lynch One-Year US Treasury Note.
Short Term Investment Grade Inflation ProtectedThis asset class is comprised of mutual funds that invest in investment grade obligations typically with an average portfolio duration ofthree years or less. The Short-Term Inflation Protected asset class is represented for performance purposes by: March 1997-presentBarclays US TIPS 1-5 Years Index; January 1970-February 1997 Short Term Bonds.
Treasury Inflation ProtectedThis asset class is comprised of mutual funds that invest in fixed income securities that are structured to provide protection againstinflation. The value of the bond's principal, or the interest paid on the bond, is adjusted to track changes (up or down) in an officialinflation measure. The U.S. Treasury, the largest domestic issuer of inflation protected securities i.e., Treasury Inflation ProtectedSecurities ("TIPS"), currently uses the Consumer Price Index for Urban Consumers (CPI) as its inflation measure. Inflation-protectedbonds issued by foreign governments and U.S. or foreign corporations are generally adjusted to reflect a comparable measure of inflationdetermined by that government or corporation. Forum may allocate a portion of the allocation to short-term or intermediate term mutualfunds at its discretion. Treasury Inflation Protected asset class is represented for performance purposes by: January 1997-present BarclaysCapital U.S. TIPS Index; January 1970-December 1996: Intermediate Government.
Intermediate GovernmentPortfolio is comprised of mutual funds that invest in obligations issued or guaranteed by the US government and US government agencies,AAA rated, dollar-denominated obligations of foreign governments, obligations of supranational organizations, and futures contracts onUS Treasury securities. The Intermediate Government asset class is represented for performance purposes by: January 1973-presentBarclays Capital US Government Bond Index; January 1970-December 1972 Long-Term Government Bonds.
Page 14 of 18

Definitions of Certain Terms Used in IPS
1. Historical Rate of Return: The 1, 3, 5 & 10 year returns represent the "average" annual return for all ofthose rolling time periods (January to January, February to February and so on) in the time periodspecified. For example, during a 10-year time horizon there are 108 one-year holding periods andcalculations. No guarantee can be given about future performance and rates of return shall not be construedas offering such a guarantee. It should be recognized that the Portfolio may invest in both passively andactively managed accounts and securities, that the actual weightings of these investments can, and will,vary and, as a result, actual returns and volatility characteristics will be higher or lower than thosepresented in this report.
2. Indices: Indices represent a "basket" of securities or other investments selected to represent theperformance and characteristics of a selected sector of the market or the investment area being considered.Well known examples include the S&P 500 Index, the Dow Jones Industrial Average, etc. Indices are notavailable for direct investment and they are not indicative of any particular underlying investment. Theyserve as a useful proxy for the overall market or selected asset class for purposes of comparison with theperformance of a specific Portfolio.
3. Maximum Return: The Portfolio's maximum return is calculated using the Portfolio's upper boundary ofa specified frequency range of returns. No guarantee can be given about future performance and this valueshall not be construed as offering such a guarantee. It should be recognized that the Portfolio may invest inboth passively and actively managed accounts and securities, that the actual weightings of theseinvestments can, and will, vary and, as a result, actual returns and volatility characteristics will be higher orlower than those presented in this report.
4. Minimum Return: The Portfolio's minimum return is calculated using the Portfolio's lower boundary ofa specified frequency range of returns. No guarantee can be given about future performance and this valueshall not be construed as offering such a guarantee. It should be recognized that the Portfolio may invest inboth passively and actively managed accounts and securities, that the actual weightings of theseinvestments will, vary and, as a result, actual returns and volatility characteristics can be higher or lowerthan those presented in this report.
Page 15 of 18
Important Disclosures on Simulations
Simulation Methodology
Simulations are used to show how a reasonable range of variation in rates of return each year can affect youroutcomes. The simulation calculates the results of your plan by running hypothetical cash flows and investmentreturns, each time using a different sequence of annual returns. Some sequences of returns will give you betterresults, and some will give you worse results. These multiple trials provide a range of possible outcomes, somesuccessful (you would have money remaining at your target age) and some unsuccessful (you would not havemoney remaining at your target age). The percentage of trials that were successful is the probability that yourplan, with all its underlying assumptions, could be successful. The simulations indicate the likelihood that anevent may occur as well as the likelihood that it may not occur. In analyzing this information, please note that theanalysis does not take into account actual market conditions, which may severely affect the outcome of your goalsover the long-term.
Simulation Assumptions
For the purposes of running this simulation, we must make certain assumptions. The projected return andvolatility assumptions for the Portfolio shown in this analysis are an average annual return of 6.71% and annualstandard deviation of 10.51% as estimated by the investment committee of Forum, prior to the adjustments madefor the advisory fees and mutual fund expenses. Portfolio returns are assumed to be normally distributed. Thespending and cash flows occur on an annual basis with year 1 cash flows occurring at the end of year 1 and soforth. In models with a short-term bucket, the value is set at a fixed dollar amount at the beginning of theretirement period, and so will not remain a set percentage of the overall portfolio through time.
The Client’s actual results will vary (potentially dramatically) from those presented in this report if the actualrealized investment returns, tax rates, or inflation rates vary from those used in this analysis. All calculations useprojected return assumptions, not returns of actual investments.
Sustainable Spending and Probability of Success
The Sustainable Spending is calculated by finding the spending rate that results in a certain Probability ofSuccess. The Probability of success is the percentage of simulated outcomes in which the plan is successful. Thesimulation runs the simulation 10,000 times, so if 6,000 of those runs are successful (i.e., you have moneyremaining at the target age for the Sustainable Spending), then the Probability of Success would be 60% and theProbability of Failure would be 40%.
Page 16 of 18

QUESTIONNAIRE RESPONSES
When do you expect to begin regularly withdrawing money from this portfolio for living expenses? Please ignorerequired minimum distributions for the purposes of this question.ANSWER: 15 years or more, or expect to gift to heirs
After you begin withdrawing money from this portfolio, what is the longest period over which these withdrawals mayneed to last? Typically this is at least your joint life expectancy, or if gifting a large portion of your assets, the period overwhich beneficiaries would receive the money.ANSWER: 10 - 14 years
Inflation, the rise in prices over time, can erode investment return. Investors should be aware that if investmentreturns are less than the inflation rate, then the ability to purchase goods and services in the future (i.e., purchasingpower) might actually decline. In order to maintain purchasing power, investment returns must at least equal, orpreferably exceed, the rate of inflation. Generally, higher returns can only be achieved by accepting greater risk orvolatility (i.e. more fluctuations in the value of a portfolio).
Which of the following portfolios is most consistent with your investment philosophy?ANSWER: Portfolio C will most likely exceed long-term inflation by a moderate margin and has a moderate to high degreeof risk or volatility.
How long would your current cash reserves last if you needed to use them for living expenses?ANSWER: Three to six months
Investing involves a trade-off between risk (or volatility) and return. Historically, investors who have received higherlong-term average returns have experienced larger fluctuations in the value of their portfolios and more frequentshort-term losses.
Considering the above, which statement best describes your investment goals?ANSWER: Balance Returns and Risk. I would like to achieve moderate long-term returns and am willing to acceptmoderate additional levels of risk.
Historically markets have experienced downturns, both short-term and prolonged, followed by market recoveries.Suppose you owned a well-diversified portfolio that declined by 20%, consistent with the overall market performance(i.e. a $100,000 portfolio would now be worth $80,000). Assuming you still have 10 years until you begin withdrawals,how would you react?ANSWER: I would be somewhat concerned but would remain invested for long-term.
The following graph shows the best, average, and worst one-year return that investors might expect in the first yearafter investing $100,000 in each of 5 hypothetical portfolios. Note that the portfolio with the best potential gain alsohas the largest potential loss. The results are not intended to represent the returns of actual portfolios and are being usedonly to measure your tolerance for risk or volatility versus long-term returns. Past performance is no guarantee of futureresults.
Which of these portfolios would you prefer to hold?ANSWER: Portfolio D
Page 17 of 18
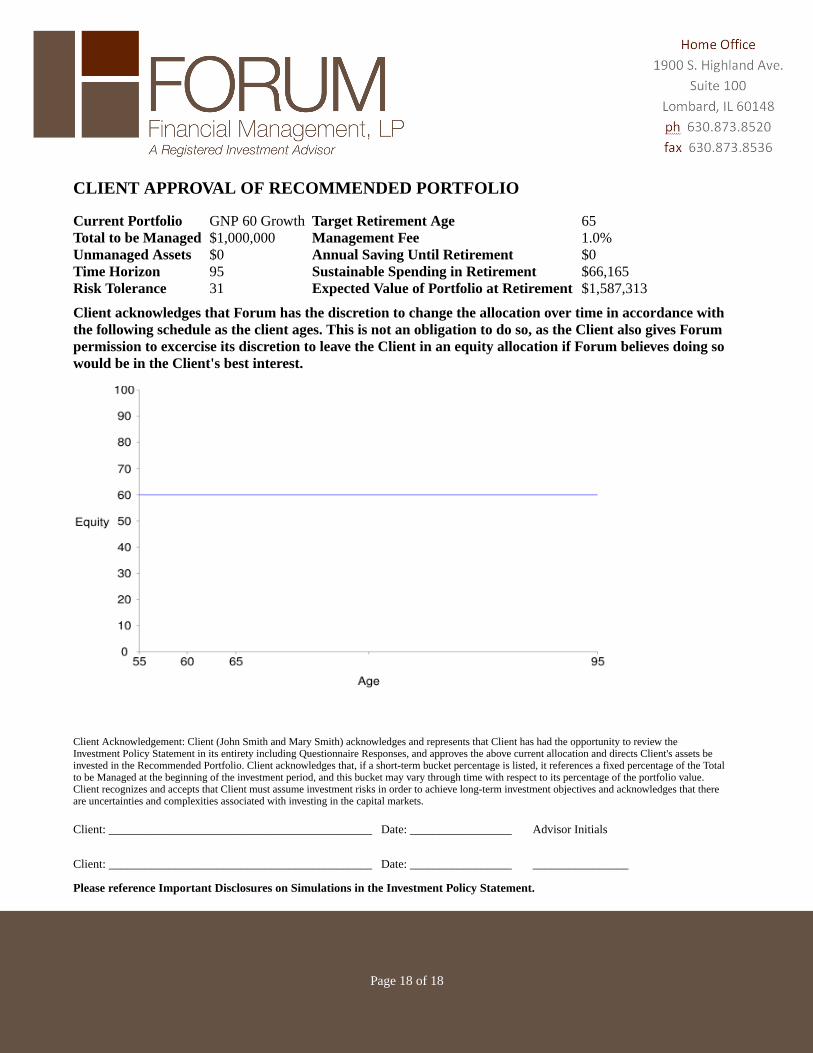
CLIENT APPROVAL OF RECOMMENDED PORTFOLIO
Current Portfolio GNP 60 Growth Target Retirement Age 65Total to be Managed $1,000,000 Management Fee 1.0%Unmanaged Assets $0 Annual Saving Until Retirement $0Time Horizon 95 Sustainable Spending in Retirement $66,165Risk Tolerance 31 Expected Value of Portfolio at Retirement $1,587,313
Client acknowledges that Forum has the discretion to change the allocation over time in accordance withthe following schedule as the client ages. This is not an obligation to do so, as the Client also gives Forumpermission to excercise its discretion to leave the Client in an equity allocation if Forum believes doing sowould be in the Client's best interest.
Client Acknowledgement: Client (John Smith and Mary Smith) acknowledges and represents that Client has had the opportunity to review theInvestment Policy Statement in its entirety including Questionnaire Responses, and approves the above current allocation and directs Client's assets beinvested in the Recommended Portfolio. Client acknowledges that, if a short-term bucket percentage is listed, it references a fixed percentage of the Totalto be Managed at the beginning of the investment period, and this bucket may vary through time with respect to its percentage of the portfolio value.Client recognizes and accepts that Client must assume investment risks in order to achieve long-term investment objectives and acknowledges that thereare uncertainties and complexities associated with investing in the capital markets.
Client: ____________________________________________ Date: _________________ Advisor Initials
Client: ____________________________________________ Date: _________________ ________________
Please reference Important Disclosures on Simulations in the Investment Policy Statement.
Page 18 of 18