forward looking statements - statoil.com · these forward-looking statements reflect current views...
TRANSCRIPT


This presentation material contains certain forward-looking statements that involve risks and
uncertainties. In some cases, we use words such as "ambition", "continue", "could", "estimate",
"expect", "focus", "likely", "may", "outlook", "plan", "strategy", "will", "guidance" and similar
expressions to identify forward-looking statements. All statements other than statements of
historical fact, including, among others, statements regarding future financial position, results of
operations and cash flows; changes in the fair value of derivatives; future financial ratios and
information; future financial or operational portfolio or performance; future market position and
conditions; business strategy; growth strategy; future impact of accounting policy judgments;
sales, trading and market strategies; research and development initiatives and strategy; market
outlook and future economic projections and assumptions; competitive position; projected
regularity and performance levels; expectations related to our recent transactions, projects and
discoveries, such as the Wintershall agreement, the agreement with OMV and discoveries in the
Bay du Nord prospect in the Flemish Pass Basin offshore Newfoundland as well as on the NCS;
the termination of the full-scale carbon capture project at Mongstad; Statoil's interest in the
OMV-operated Wisting Central oil discovery in the Hoop area; completion and results of
acquisitions, disposals and other contractual arrangements; reserve information; future margins;
projected returns; future levels, timing or development of capacity, reserves or resources; future
decline of mature fields; planned maintenance (and the effects thereof); oil and gas production
forecasts and reporting; domestic and international growth, expectations and development of
production, projects, pipelines or resources; estimates related to production and development
levels and dates; operational expectations, estimates, schedules and costs; exploration and
development activities, plans and expectations; projections and expectations for upstream and
downstream activities; oil, gas, alternative fuel and energy prices; oil, gas, alternative fuel and
energy supply and demand; natural gas contract prices; timing of gas off-take; technological
innovation, implementation, position and expectations; projected operational costs or savings;
projected unit of production cost; our ability to create or improve value; future sources of
financing; exploration and project development expenditure; effectiveness of our internal policies
and plans; our ability to manage our risk exposure; our liquidity levels and management;
estimated or future liabilities, obligations or expenses and how such liabilities, obligations and
expenses are structured; expected impact of currency and interest rate fluctuations;
expectations related to contractual or financial counterparties; capital expenditure estimates and
expectations; projected outcome, objectives of management for future operations; impact of PSA
effects; projected impact or timing of administrative or governmental rules, standards, decisions,
standards or laws (including taxation laws); estimated costs of removal and abandonment;
estimated lease payments and gas transport commitments are forward-looking statements. You
should not place undue reliance on these forward-looking statements. Our actual results could
differ materially from those anticipated in the forward-looking statements for many reasons,
including the risks described above in "Financial Risk update".
These forward-looking statements reflect current views about future events and are, by
their nature, subject to significant risks and uncertainties because they relate to events
and depend on circumstances that will occur in the future. There are a number of factors
that could cause actual results and developments to differ materially from those
expressed or implied by these forward-looking statements, including levels of industry
product supply, demand and pricing; price and availability of alternative fuels; currency
exchange rate and interest rate fluctuations; the political and economic policies of Norway
and other oil-producing countries; EU directives; general economic conditions; political
and social stability and economic growth in relevant areas of the world; Euro-zone
uncertainty; global political events and actions, including war, terrorism and sanctions;
security breaches, including breaches of our digital infrastructure (cybersecurity); changes
or uncertainty in or non-compliance with laws and governmental regulations; the timing of
bringing new fields on stream; an inability to exploit growth or investment opportunities;
material differences from reserves estimates; unsuccessful drilling; an inability to find and
develop reserves; ineffectiveness of crisis management systems; adverse changes in tax
regimes; the development and use of new technology; geological or technical difficulties;
operational problems; operator error; inadequate insurance coverage; the lack of
necessary transportation infrastructure when a field is in a remote location and other
transportation problems; the actions of competitors; the actions of field partners; the
actions of governments (including the Norwegian state as majority shareholder);
counterparty defaults; natural disasters and adverse weather conditions, climate change,
and other changes to business conditions; failure to meet our ethical and social
standards; an inability to attract and retain personnel; relevant governmental approvals
(including in relation to the agreement with Wintershall); industrial actions by workers and
other factors discussed elsewhere in this report. Additional information, including
information on factors that may affect Statoil's business, is contained in Statoil's Annual
Report on Form 20-F for the year ended December 31, 2012, filed with the U.S. Securities
and Exchange Commission, which can be found on Statoil's website at www.statoil.com.
Although we believe that the expectations reflected in the forward-looking statements are
reasonable, we cannot assure you that our future results, level of activity, performance or
achievements will meet these expectations. Moreover, neither we nor any other person
assumes responsibility for the accuracy and completeness of the forward-looking
statements. Unless we are required by law to update these statements, we will not
necessarily update any of these statements after the date of this report, either to make
them conform to actual results or changes in our expectations.
Forward looking statements
2


Oil price Brent blend (USD/bbl, 2013 prices)
0
30
60
90
120
150
1970 1980 1990 2000 2010
Actual
Historical average
0
5
10
15
20
1975 1985 1995 2005
NBP actual
NBP Historical average
HH actual
HH historical average
Gas prices Henry Hub and NBP (USD/MMBtu, 2013 prices)
Oil and gas prices – volatility is part of the game Higher oil prices and gas prices in Europe, decoupled gas in North America
4 Kilder: Reuters EcoWin, Statoil.

-30
-20
-10
0
10
20
30
40
50
190
0
191
2
192
4
193
6
194
8
196
0
197
2
198
4
199
6
200
8
Dow Jones Industrial Average Monthly change (%)
5 Source: Reuters EcoWin
Uncertainty is something we are always facing … which makes predictions valuable and disagreements profitable …
0
2000
4000
6000
8000
10000
12000
14000
16000
18000
190
0
191
3
192
6
193
9
195
2
196
5
197
8
199
1
200
4
Dow Jones Industrial Average
1
10
100
1000
10000
100000
190
0
191
3
192
6
193
9
195
2
196
5
197
8
199
1
200
4
Dow Jones Industrial Average

The global economic centre of gravity Based on geographical weighting of GDP
Shifting energy demand Share in global energy demand, %
0
25
50
75
100
2000 2010 2020 2030 2040
Rest of world IndiaChina OECD PacificOECD Europe OECD North America
6 Source: McKinsey (map), IEA, Statoil
A strong trend affecting economics and energy Economic gravity moves (back) to the east, and so does energy demand
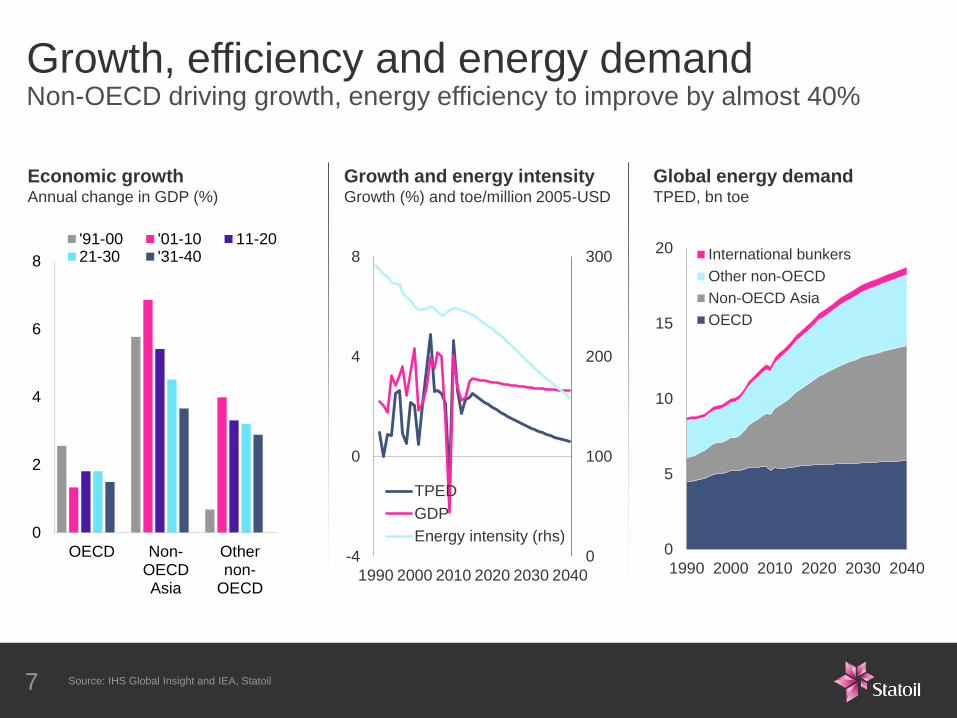
Global energy demand TPED, bn toe
Growth and energy intensity Growth (%) and toe/million 2005-USD
0
100
200
300
-4
0
4
8
1990 2000 2010 2020 2030 2040
TPED
GDP
Energy intensity (rhs)0
5
10
15
20
1990 2000 2010 2020 2030 2040
International bunkers
Other non-OECD
Non-OECD Asia
OECD
Economic growth Annual change in GDP (%)
0
2
4
6
8
OECD Non-OECDAsia
Othernon-
OECD
'91-00 '01-10 11-2021-30 '31-40
7 Source: IHS Global Insight and IEA, Statoil
Growth, efficiency and energy demand Non-OECD driving growth, energy efficiency to improve by almost 40%
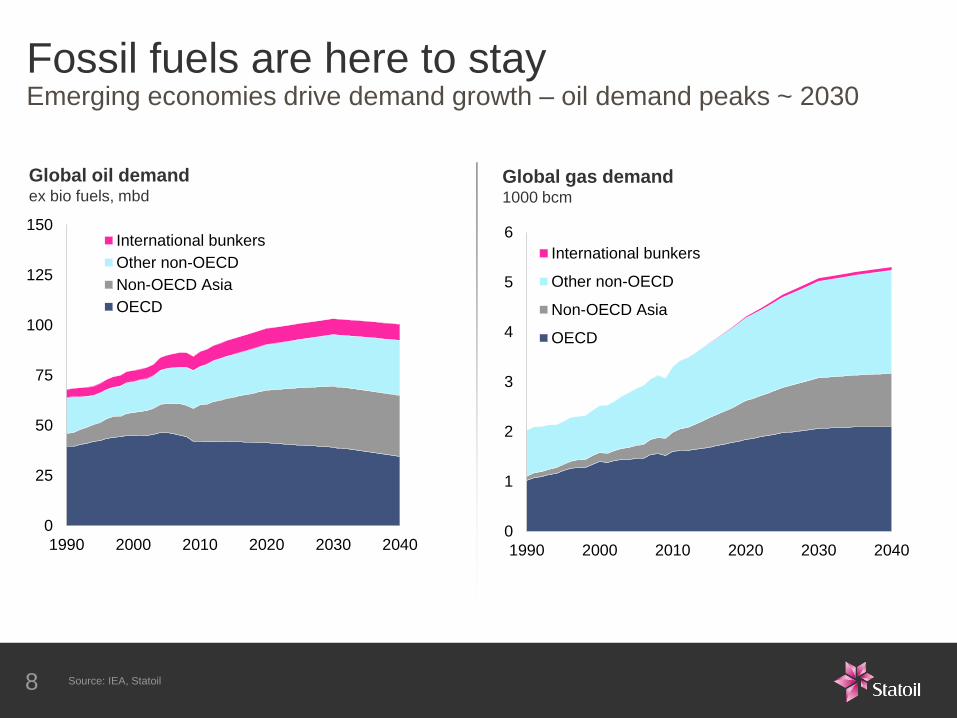
Global oil demand ex bio fuels, mbd
Global gas demand 1000 bcm
0
25
50
75
100
125
150
1990 2000 2010 2020 2030 2040
International bunkers
Other non-OECD
Non-OECD Asia
OECD
0
1
2
3
4
5
6
1990 2000 2010 2020 2030 2040
International bunkers
Other non-OECD
Non-OECD Asia
OECD
Fossil fuels are here to stay Emerging economies drive demand growth – oil demand peaks ~ 2030
Source: IEA, Statoil 8

• US economy
– Some GDP loss from shutdown expected
in 4Q 2013, but still on track for stronger
growth
– Debt ceiling looms in 2014
• Eurozone
– Out of record long recession, finally
– Will continue to grow over the final quarter
of 2013 and beyond, but growth will be
muted
• Japan sees temporary boom
• China’s recent uptick underpinned by
policy support and improved exports
• Risk and uncertainty remain elevated
9 Classification:
-5
0
5
10
15
2000 2005 2010 2015
OECDNon-OECDUSAChina
Economic growth 2000-2015 Annual change in GDP (%)
9 Source: IHS Global Insight and Statoil
Global economy: cautious improvement Slow and uneven growth, but still on track for a gradual acceleration

80
90
100
110
120
130
Oct 10 Apr 11 Oct 11 Apr 12 Oct 12 Apr 13 Oct 13
Dated Brent
ICE Brent Dec 2017
10
Oil price action and global gas price dynamics Medium-term oil price stability, persistent regional differences in gas pricing
Brent Crude Oil USD/bbl
Natural Gas and LNG Prices USD/MMBtu

0.0
0.5
1.0
1.5
2.0
2.5
3.0
3.5
4.0
July 10 July 11 July 12 July 13
Yemen Nigeria
Syria Sudans
Iraq Iran
Libya
0.0
0.5
1.0
1.5
2.0
2.5
3.0
3.5
4.0
July 10 July 11 July 12 July 13
11
The fruits of the Arab Spring: oil at USD 110+ Mounting supply loss in MENA neutralises the US tight oil revolution
Crude supply losses mbd
US onshore growth mbd

0
1
2
3
4
5
6
7
8
65
70
75
80
85
90
95
100
105
Opec spare
capacity (rhs)
Supply capacity
Demand
-1.0
-0.5
0.0
0.5
1.0
1.5
2005 2007 2009 2011 2013 2015 2017 2019
Rest Non-Opec
North America
12
Medium-term weakness in oil markets Strong North American supply growth dominates market for years to come
Global oil balance Supply capacity, demand and Opec spare (mb/d)
Annual non-Opec supply growth mb/d

Estimates of long-term breakeven costs
0
10
20
30
40
50
60
70
80
90
2010 2015 2020 2025 2030 2035
Yet to find
Discovered, not started
New fields
Base production
Crude oil supply, by status mbd
13
The long-term supply challenge remains The supply sources that will replace declining production are not cheap


A major gas player with Europe as gravity point
• Recent highlights
− Major gas discoveries offshore Tanzania
− Aasta Hansteen and Polarled –
developing a new NCS gas province
− Long term sales agreements for Shah
Deniz gas
− Innovative gas to power contract with
Stadtwerke Düsseldorf
− Deliveries of Marcellus gas to Toronto
and New York City
Shah
Deniz
SCP
TANAP
US shale gas
Caspian
NCS
Tanzania
Statoil offices with Natural Gas business activities
Statoil pipelines to premium markets
New York
City
TorontoProduction area
TAP
16

Market prices remain high
• Very strong 2012 average invoiced gas
prices, downward correction this year
• Reduced NCS volumes vs 2012
− Lower output from Troll
− Asset divestments
• NCS reduction offset by higher US
volumes
Entitlement gas sales** (mcm/day)
147122 114
136 131119 109107 113 114 107
2008 2009 2010
2012
129 mcm/d
2013 YTD
119 mcm/d
2011
European gas prices*
02468101214
0.00
0.50
1.00
1.50
2.00
2.50
3.00
3.50
Jan
-10
Jun
-10
Nov-1
0
Ap
r-11
Se
p-1
1
Fe
b-1
2
Jul-
12
Dec-1
2
Ma
y-1
3
Oct-
13
Ma
r-1
4
Au
g-1
4
USD/MMBtu NOK/SM3
NBP day-ahead
ICE NBPFW @ 1Nov. 2013
17 Sources: *ICE, ICIS Heren, **Statoil
Q1 Q2 Q3 Q4 Q1 Q2 Q3

Robust outlook for European gas demand
• Gas demand to recover post 2020
− Stable demand in heating and industry
− Coal phase-out will increase need for gas
power for baseload and back-up
− Increased use of gas for ships and heavy
trucks
• Uncertainties
− Continued competition from cheap coal
and subsidised renewables
− Growth in power demand
− Energy efficiency in heating sector
Power sector drives demand recovery bcm
0
100
200
300
400
500
600
700
2010 2012 2015 2020 2025 2030
Other Res/Com Industry Power Transport
18 Source: IHS CERA

0
100
200
300
400
500
600
700
Demand2012
Declineindigenousproduction
Demandgrowth
Supply gap2030
A European supply gap is emerging
• Europe will require new gas supplies
− Demand recovery
− Falling indigenous production
− Strong competition for LNG
− Few low-cost options for new supply
• Uncertainties
− US LNG supplies to Europe
− European shale gas
− Russian exports
19 Sources: IHS CERA, Statoil
European supply gap towards 2030 bcm

Sales directly to end users Traded markets
Relative change in Statoil’s sales
channel mix in Europe
Sales through long-term contracts
~25%
~10%
~65%
Statoil’s sales strategy
• Liberalisation gives access to new
customers and sales channels
− Increasing short-term sales on liquid
European hubs
− New relationships with end users
• Maintaining and modernising long-term
contracts
− Indexes reflecting market realities
− Entering into new partnerships
20 Source: Statoil
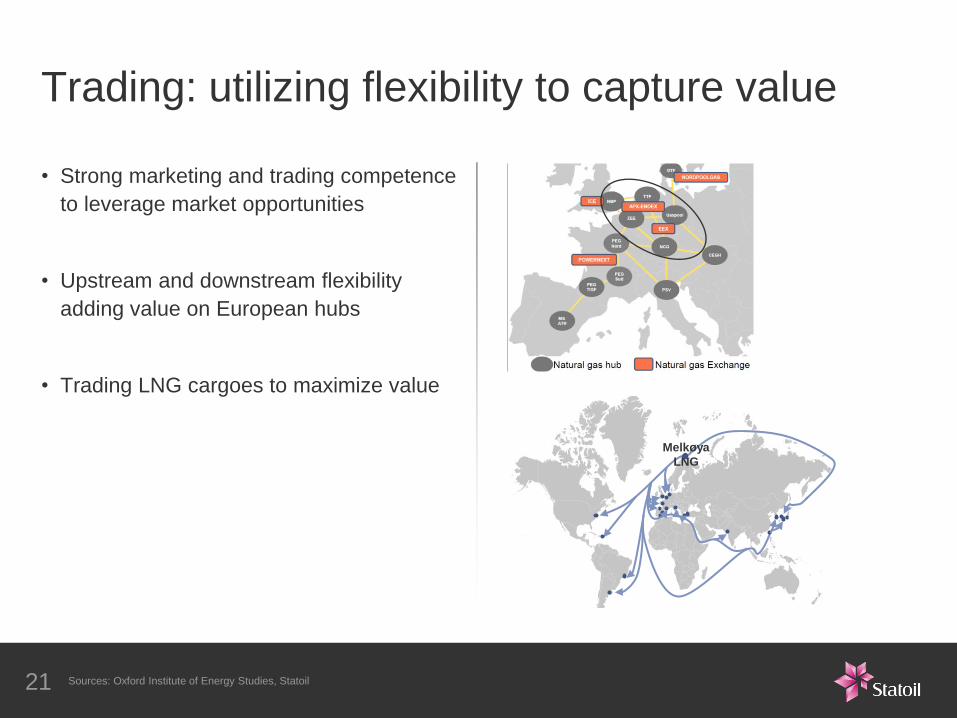
• Strong marketing and trading competence
to leverage market opportunities
• Upstream and downstream flexibility
adding value on European hubs
• Trading LNG cargoes to maximize value
Trading: utilizing flexibility to capture value
Melkøya
LNG
21 Sources: Oxford Institute of Energy Studies, Statoil

New opportunities in new segments
• Expanding direct sales to new customer segments
− Power plants
− Large industries
− Distribution companies
• Recent gas sale to Stadtwerke Düsseldorf
− 600 mcm/year 2016-2030
− Enables construction of a highly
efficient CHP gas plant
− Risk and reward sharing through
element of electricity indexing
Stadtwerke Düsseldorf delivers energy
and other public services to a city of
600 000 inhabitants
22 Source: Stadtwerke Düsseldorf
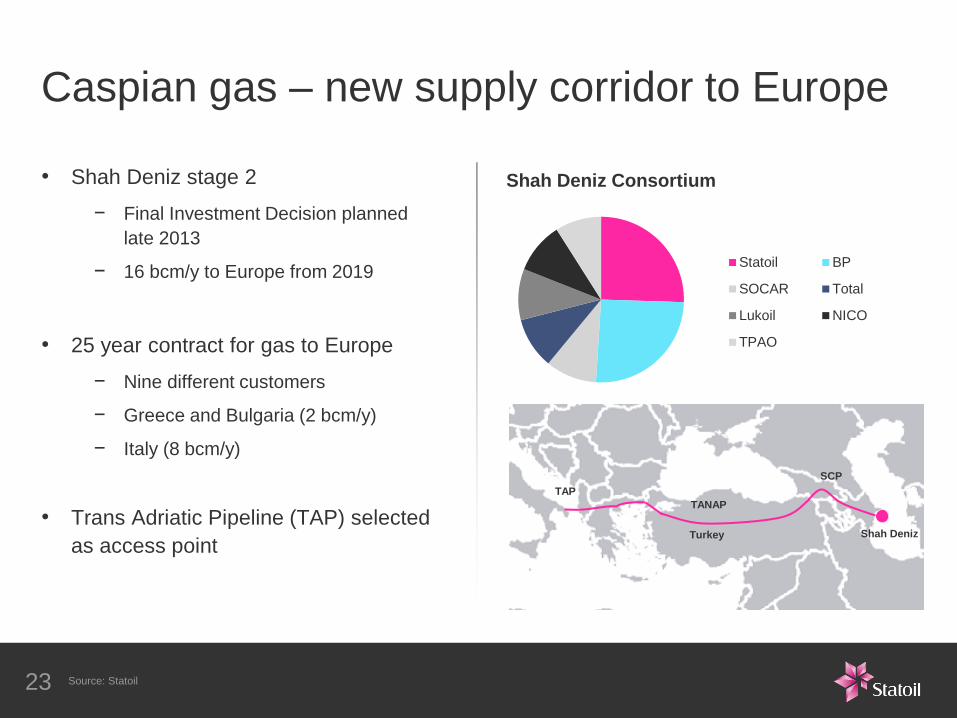
Caspian gas – new supply corridor to Europe
• Shah Deniz stage 2
− Final Investment Decision planned
late 2013
− 16 bcm/y to Europe from 2019
• 25 year contract for gas to Europe
− Nine different customers
− Greece and Bulgaria (2 bcm/y)
− Italy (8 bcm/y)
• Trans Adriatic Pipeline (TAP) selected
as access point
Shah Deniz
TAP
SCP
Turkey
TANAP
Statoil BP
SOCAR Total
Lukoil NICO
TPAO
Shah Deniz Consortium
23 Source: Statoil
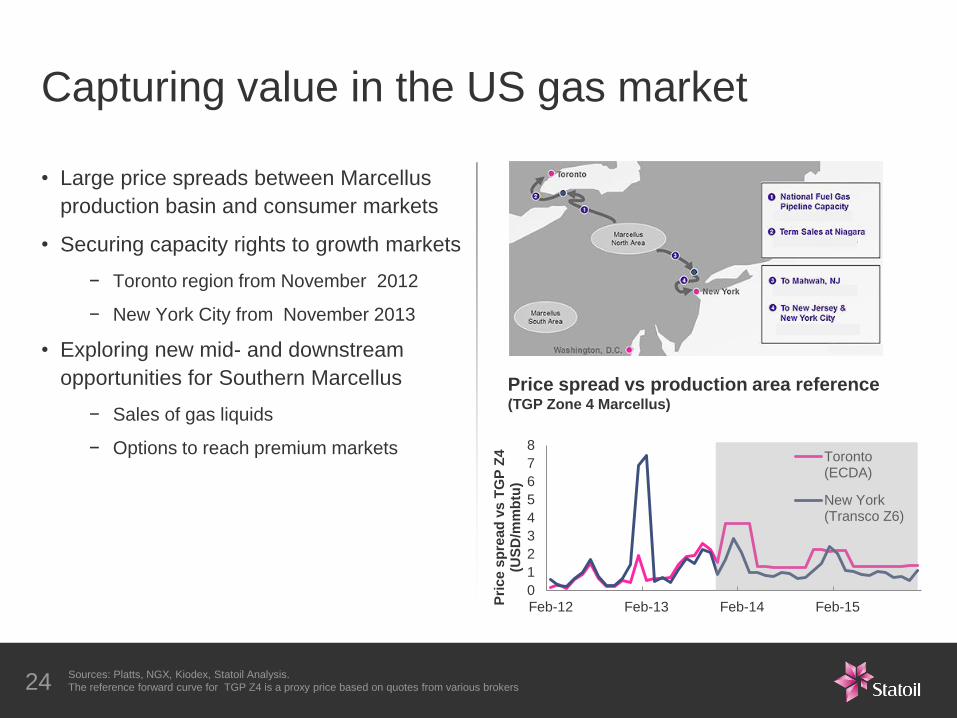
Capturing value in the US gas market
• Large price spreads between Marcellus
production basin and consumer markets
• Securing capacity rights to growth markets
− Toronto region from November 2012
− New York City from November 2013
• Exploring new mid- and downstream
opportunities for Southern Marcellus
− Sales of gas liquids
− Options to reach premium markets
Price spread vs production area reference (TGP Zone 4 Marcellus)
24 Sources: Platts, NGX, Kiodex, Statoil Analysis.
The reference forward curve for TGP Z4 is a proxy price based on quotes from various brokers
0
1
2
3
4
5
6
7
8
Feb-12 Feb-13 Feb-14 Feb-15Pri
ce
sp
rea
d v
s T
GP
Z4
(U
SD
/mm
btu
)
Toronto(ECDA)
New York(Transco Z6)

• The European gas market is recovering and outlook is robust
• Statoil’s marketing and trading strategy is designed to capture new opportunities
in a changing market
• Developing new gas value chains to expand the global gas portfolio
Concluding remarks
25


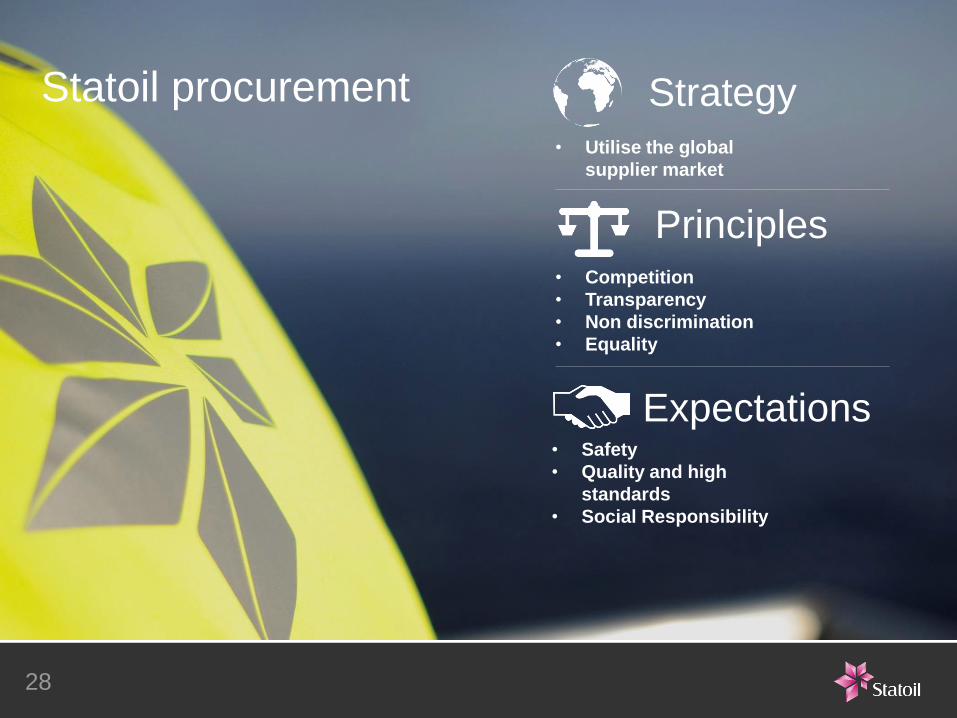
Expectations
• Safety
• Quality and high
standards
• Social Responsibility
Principles
• Competition
• Transparency
• Non discrimination
• Equality
Strategy
• Utilise the global
supplier market
28
Statoil procurement

Procurement in Norway
Procurement international
44
44
39
18
Maintenance
and
modifications
Drilling
& well
Capital
projects
Business
support
50
100
150
2012 2011
97.8
26.3
111.1
32.5 124.1
~145
OPEX
DRILLEX
CAPEX
29
Supplier industry importance Statoil procurement 2012: ~BNOK 145
BNOK

• Change in unit cost level, due to:
- Higher input prices
- Higher margins of suppliers
- Lower efficiency & productivity of suppliers
• Change in unit quantity, due to:
- More activity
- Higher complexity
- Lower efficiency & productivity
3
0
30
Upstream operator capital intensity has risen sharply
2013 2003
Change in cost level
Change in efficiency and
productivity
Change in project
complexity
Change in activity level

• Global, regional, local sourcing?
• Bundle or segment?
• Do or buy potential?
• Supplier relation – competence and
capacity?
• Benchmarks – availability and use
31
Important strategic evaluations

Specific strategy
• Contracts’
specific strategy
• Market
approach
• Pre-qualification
• Familiarisation/
contract
meetings
• Estimate and
benchmarking
• Lessons learned
from other
projects
• Supplier list
• Long term
strategy
• Demand
management
• Market
knowledge
• Lessons
learned from
other projects
Category strategy
Request
• Request and
contract
documents
• Dialogue/
clarifications
with supplier
Evaluation and awards
• Evaluation of
bids
• Negotiations/
clarifications
• Contract
awards
Supplier follow-up
• Suppliers’
performance
• Improvement
agenda
• Contract
administration
• Change orders/
additional
elements
• Assessment of
any issuance of
options
• Requirements
and garanties
• Lessons learned
32
Holistic approach
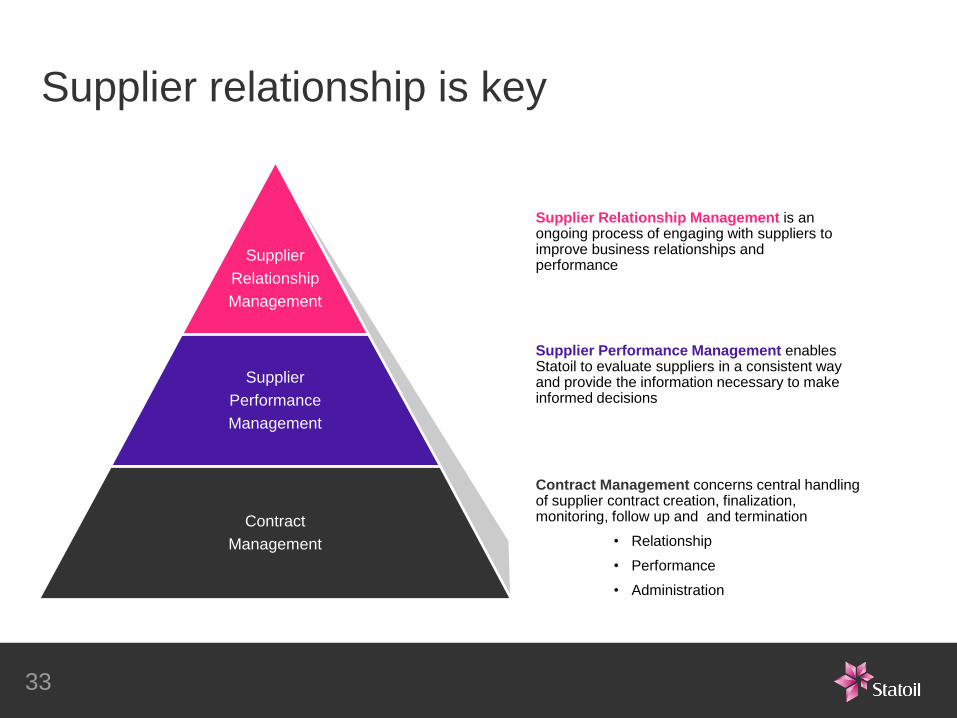
Supplier Relationship Management is an ongoing process of engaging with suppliers to improve business relationships and performance
Supplier Performance Management enables Statoil to evaluate suppliers in a consistent way and provide the information necessary to make informed decisions
Contract Management concerns central handling of supplier contract creation, finalization, monitoring, follow up and and termination
• Relationship
• Performance
• Administration
33
Supplier relationship is key
Supplier
Relationship
Management
Supplier
Performance
Management
Contract
Management

• Safe and sustainable
as a foundation for high
performance
• Internal targets aligned
with Statoil
• Use benchmarks and
productivity measurements
in continous improvement
• Accountability
«One performance standard»
34
The «optimal» Statoil supplier

Purchasing coordination, follow-up
coordination, synergies and
cooperation across the projects.
Experience transfer and increased
learning
Projects and concept synergies
Cat D and Cat J
Relevant business cases Ambitions and potentials to be achieved
Johan Castberg
Johan Sverdrup
Next projects
Systems and equipment standardised
for re-use on Johan Sverdrup.
Pilot for simplification of technical
requirements and documentation.
Conceptual standardisation, and
re-use of systems and equipment
from Johan Castberg
Standardisation an integral part of
management systems and culture
Fast track
5-10% reduced cost per FSU
35
Improvements within reach:
• 50% reduction on time
• 30% reduction on cost
20% more efficient drilling
Floating Storage Units [FSU]
35
Pursuing further standardisation and industrialisation

* Statoil share
Door opener to a new core area
JOHAN CASTBERG
Statoil share 50%
GINA KROG
Supporting the Sleipner area strategy
Statoil share 59% Start up 2017 Capacity boe/d 70.000*
VALEMON
Short term production contribution
Statoil share 54% Start up 2014 Capacity boe/d 50.000*
GUDRUN
Short term production contribution
Statoil share 51% Start up 2014 Capacity boe/d 65.000*
Production horizon beyond 2050
Statoil share 40% Start up 2018
JOHAN SVERDRUP AASTA HANSTEEN AND POLARED Pioneer in deep water area
Statoil share 75%/50% Start up 2017 Capacity boe/d 110.000*
• Solid pipeline
of projects
• High ownership
share in strategic
projects
• Robust production
outlook
MARINER
Heavy oil field project
Statoil share 65% Start up 2017 Capacity boe/d 50.000*
TANZANIA BLOCK 2
High-impact discoveries
Statoil share 65%
36
World class project portfolio

Expectations
• Safety
• Quality and high
standards
• Social Responsibility
Principles
• Competition
• Transparency
• Non discrimination
• Equality
Strategy
• Utilise the global
supplier market
37
Statoil procurement
