forward shipping options for grain by rail: a strategic...
TRANSCRIPT
Journal ofAgricultural and Resource Economics 23(2):526-544Copyright 1998 Western Agricultural Economics Association
Forward Shipping Options for Grainby Rail: A Strategic Risk Analysis
William W. Wilson, Steven R. Priewe,and Bruce Dahl
In the late 1980s, grain-hauling railroads began offering alternatives that have madeshipping decisions more strategic. Shippers now confront alternatives ranging fromnearby and unguaranteed ordering to various durations of forward and guaranteedshipment. Each has varying penalties for cancellation and payments from the rail-road for nonperformance, and differing risks and payoffs. Because of the configur-ation of choices, shippers confront a portfolio of shipping alternatives. A dynamicstochastic simulation model was developed to analyze alternative strategies. Themodel includes the effects of uncertainties in tariff rate changes, car premiums, basislevels, forward and spot grain purchases, and receiving railcars under each of threealternatives. Shipping demand is determined by inter-month commodity pricedifferences, carrying costs, transport costs, and storage capacity. Considering thesefactors, the shipper chooses grain sales and shipping strategies that maximize netpayoffs and confronts a tradeoff between expected profits and risk.
Key words: grain shipping, grain transportation, railcar allocation
Introduction
Chronic rail transportation problems have adversely affected those in the grain industryfor some time (Norton). As a normal course of business, shippers buy cash grain,resulting in a short freight position, and assume risks associated with receiving cars andchanges in rates. Before 1987, cars generally were allocated on a first-order/first-servedbasis. Rail rate and car supply guarantees usually were not offered, and shippers hadfew alternatives to manage railcar risks (rates and service), thereby increasingmerchandising isks (Gelston and Greene). Shippers often inflated orders to securerailcars because of the absence of car cancellation penalties. "Phantom orders" wereprevalent, and general car allocation mechanisms did little to address post-harvestshipping problems confronting the grain merchandising/transportation industry (W.Wilson 1989).
Railcar allocation strategies have evolved dramatically since the passage of theStaggers Rail Act. To induce more efficiency and meet the needs of logisticallydifferentiated shippers, the railroads focused on providing more shipping options. Thesetook the form of more innovative railcar allocation mechanisms which started to evolvein the late 1980s. Most important was the development of forward service options with
Wilson is a professor, Priewe is a former graduate research assistant, and Dahl is a research scientist, all in the Departmentof Agricultural Economics, North Dakota State University.
The authors would like to thank Demcey Johnson, Frank Dooley, and Denver Tolliver for their useful comments. However,errors and omissions remain the responsibility of the authors.
Forward Shipping Optionsfor Grain by Rail 527
guarantees for railcar supplies that provide logistical alternatives to grain shippers. TheBurlington Northern (BN) pioneered these efforts with the introduction of itsCertificates of Transport (COTs) program in 1987. Under COTs, forward guarantees areoffered to grain shippers using a bidding mechanism. Prepayments serve as cancellationpenalties and have had the effect of discouraging "phantom orders." Different segmentsof shippers emerged with the advent of these mechanisms, and cars essentially wereallocated according to shipping priorities. Since then, Canadian Pacific Rail Systems(CPRS), Union Pacific, CSX, and other major Class I railroads have adopted certainaspects of auction-based rate and car guarantee programs.1
In addition, following the merger of the BN and Santa Fe (BNSF) railroads, the BNSFadopted the BN programs for car allocation throughout their combined system.However, these have not been without controversy within the industry. The NationalGrain and Feed Association summarizes some of the issues in its December 1996newsletter. Further, in late 1997, the Surface Transportation Board mandated that twoof the carriers use alternative prioritization schemes, at least temporarily, and the U.S.Department of Agriculture (USDA) held listening sessions throughout the grainindustry to address these problems (USDA).
Longer-term guaranteed freight programs were introduced in the early 1990s. Thesemechanisms allowed grain companies to enter longer-term contractual arrangements,typically one to three years in duration, where shipper-owned or -controlled railcars areleased to the carrier in return for a negotiated fee and a specified number of guaranteedloadings per month. Examples of long-term guaranteed programs include BN's SWAPs(commonly referred to as "guaranteed freight") and the CPRS's Guaranteed EquipmentExchange Program (GEEP). These rail equipment supply packages generally consist ofan annual contract for a number of guaranteed car placements. The guaranteed freightprograms also have cancellation penalties for carrier and shipper nonperformance.However, it is important that such penalties are generally less onerous than those forshorter-term guaranteed options. Shippers participating in pooling arrangements eitherredeem their obligations or sell them through secondary markets. Transferability of theinstruments provides shippers flexibility and has resulted in informal secondarymarkets and transaction mechanisms for the underlying instruments to these shorter-term and longer-term programs.2
The advent of alternative forward guaranteed transportation services in grainmerchandising has given shippers options for strategically integrating logistics andmerchandising decisions.3 Utilization of these programs by shippers can be viewed ina context similar to grain hedging strategies, with some exceptions and peculiarities.Shippers' cash grain positions typically are hedged in the futures or forward cashmarket. Once the cash grain position is established, the shipper becomes short freightand experiences uncertainties about both rate changes before shipment and carplacements during the want period. These options provide alternatives from which theshipper can choose to manage risks. The configuration of discrete choices can be viewed
1 For a detailed explanation of these mechanisms, see Wilson and Priewe.2 Priewe and Wilson provide a detailed description of these mechanisms; Wilson and Dahl offer theoretical analysis and
bidding strategies for these instruments.3 Others have indicated the need for strategic analysis of grain shipping decisions (e.g., Baumel and Van Der Kamp; Frost;
Niedens; and Moser).
Wilson, Priewe, and Dahl

Journal ofAgricultural and Resource Economics
as choosing either a transaction-specific strategy, or a portfolio of alternatives. In either
case, the importance of integrating grain merchandising and shipping decisions esca-lates dramatically with these mechanisms.
In contrast to hedging cash grains, however, there are some important complications.
Each of the options has various penalties for shipper cancellation and payments for
railroad nonperformance, as well as different costs. As a result, each option has differingrisks and payoffs which must be an integral component of the decision analysis.
Analyzing shipping decisions is further compounded by uncertainty in shipping demand
and car requirements, and different premiums, durations, and obligations imbedded ineach option. Shipping under general tariff has the greatest flexibility and incurs lower
shipping costs, but has greater uncertainties of car placement and no guarantees. In
contrast, longer-term and shorter-term guarantees are characterized by having greater
flexibility, generally higher premiums, a narrower window of service, a higher
probability of receiving cars within the window, and a higher penalty imposed on the
railroad for nonperformance.The characteristics and importance of chronic post-harvest logistical problems have
been addressed in numerous agricultural marketing references (e.g., Baumel and VanDer Kamp; Frost; Gelston and Greene; Moser; Niedens; Norton; Pautsch, Lapan, and
Baumel; Pedraza; Pautsch, McVey, and Baumel). The problems of car allocation have
not been addressed in the agricultural economics literature, but the general problem of
allocating fixed supplies and establishing priorities has become increasingly important
in economics (e.g., R. Wilson 1993), as have the problems of bidding mechanisms for
allocation (e.g., Crampton; McAfee and McMillan 1987, 1996a, b; Milgrom; R. Wilson
1992). Studies on logistics theory with applications to the rail industry have been
applied generally, but have been limited in agriculture. These include studies on time
reliability (Allen, Mahmoud, and McNeil), railroad service (Ainsworth), requirementsplanning (Bookbinder and Serenda), and modal selection (Sheffi, Eskandari, and
Koutsopoulus).Our research analyzes grain shipping and merchandising strategies that integrate
these shipping options with merchandising strategies. The primary objectives are to:
(a) develop a logistics model applicable to grain shippers that captures important
operating and cost components, and (b) analyze a spectrum of logistical strategiesrepresenting varying degrees of forward commitment and their relationships with key
elements of planning uncertainty for a typical grain shipper.
Model Description and Simulation Procedure
A dynamic stochastic simulation model was developed based on inventory managementand scheduling theory to analyze the efficacy of these mechanisms for grain shippers.The model builds on the distribution and material requirements planning (DRP and
MRP) techniques (see Ballou, pp. 532-45, for a description) commonly used in logistics
management. It was applied to a shipper characterized by a single-origin elevator
shipping to competing markets-in this case, either Minneapolis or Portland. The modelis dynamic in the sense that grain selling, forward freight coverage, and shippingdecisions are made through time, and residual inventories are stored.
528 December 1998
Forward Shipping Options for Grain by Rail 529
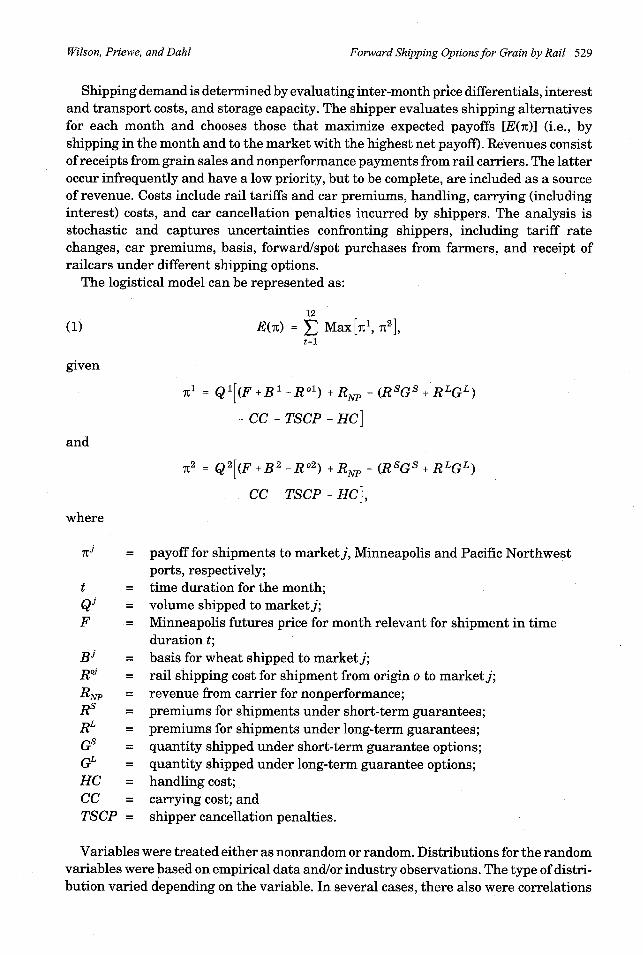
Shipping demand is determined by evaluating inter-month price differentials, interestand transport costs, and storage capacity. The shipper evaluates shipping alternativesfor each month and chooses those that maximize expected payoffs [E(T)] (i.e., byshipping in the month and to the market with the highest net payoff). Revenues consistof receipts from grain sales and nonperformance payments from rail carriers. The latteroccur infrequently and have a low priority, but to be complete, are included as a sourceof revenue. Costs include rail tariffs and car premiums, handling, carrying (includinginterest) costs, and car cancellation penalties incurred by shippers. The analysis isstochastic and captures uncertainties confronting shippers, including tariff ratechanges, car premiums, basis, forward/spot purchases from farmers, and receipt ofrailcars under different shipping options.
The logistical model can be represented as:
12
(1) E(n) = E Max[t l', 72],t=l
given
I1 = Q1[(F + B1 -R 1 ) + RNP - (RSGs + RLGL)
-CC - TSCP - HC]
and
2 = Q2[(F +B2 -Ro 2) + RN - (RSGS + RLGL)
- CC - TSCP - HC],
where
JT = payoff for shipments to marketj, Minneapolis and Pacific Northwestports, respectively;
t = time duration for the month;QJ = volume shipped to marketj;F = Minneapolis futures price for month relevant for shipment in time
duration t;BJ = basis for wheat shipped to marketj;R°J = rail shipping cost for shipment from origin o to marketj;
RNP = revenue from carrier for nonperformance;Rs = premiums for shipments under short-term guarantees;RL = premiums for shipments under long-term guarantees;Gs = quantity shipped under short-term guarantee options;GL = quantity shipped under long-term guarantee options;HC = handling cost;CC = carrying cost; andTSCP = shipper cancellation penalties.
Variables were treated either as nonrandom or random. Distributions for the randomvariables were based on empirical data and/or industry observations. The type of distri-bution varied depending on the variable. In several cases, there also were correlations
Wilson, Priewe, and Dahl
Journal ofAgricultural and Resource Economics
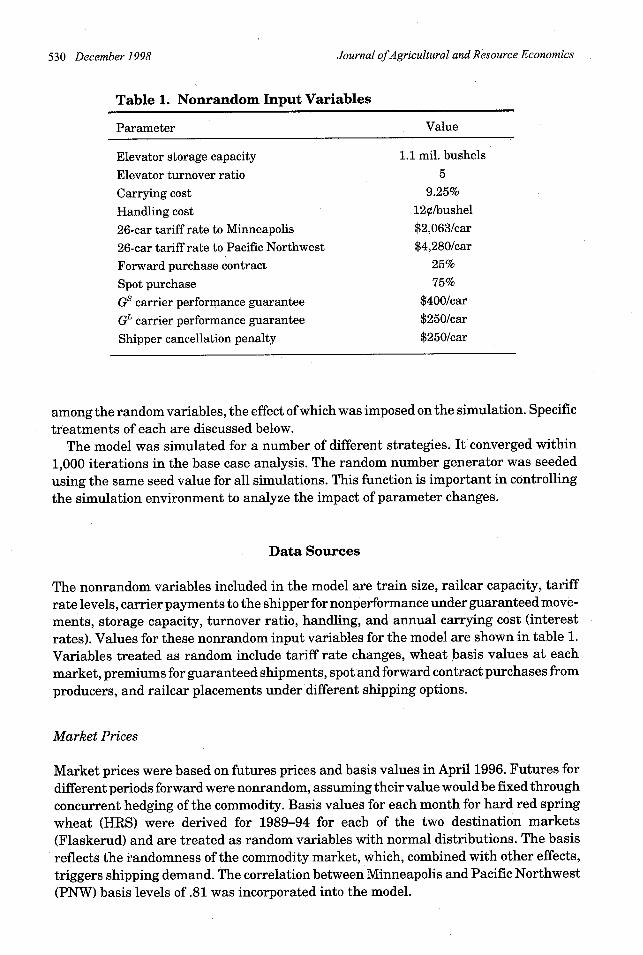
Table 1. Nonrandom Input Variables
Parameter Value
Elevator storage capacity 1.1 mil. bushels
Elevator turnover ratio 5
Carrying cost 9.25%
Handling cost 12c/bushel
26-car tariff rate to Minneapolis $2,063/car
26-car tariff rate to Pacific Northwest $4,280/car
Forward purchase contract 25%
Spot purchase 75%
Gs carrier performance guarantee $400/car
GL carrier performance guarantee $250/car
Shipper cancellation penalty $250/car
among the random variables, the effect of which was imposed on the simulation. Specific
treatments of each are discussed below.The model was simulated for a number of different strategies. It converged within
1,000 iterations in the base case analysis. The random number generator was seeded
using the same seed value for all simulations. This function is important in controlling
the simulation environment to analyze the impact of parameter changes.
Data Sources
The nonrandom variables included in the model are train size, railcar capacity, tariff
rate levels, carrier payments to the shipper for nonperformance under guaranteed move-
ments, storage capacity, turnover ratio, handling, and annual carrying cost (interest
rates). Values for these nonrandom input variables for the model are shown in table 1.
Variables treated as random include tariff rate changes, wheat basis values at each
market, premiums for guaranteed shipments, spot and forward contract purchases from
producers, and railcar placements under different shipping options.
Market Prices
Market prices were based on futures prices and basis values in April 1996. Futures for
different periods forward were nonrandom, assuming their value would be fixed through
concurrent hedging of the commodity. Basis values for each month for hard red spring
wheat (HRS) were derived for 1989-94 for each of the two destination markets
(Flaskerud) and are treated as random variables with normal distributions. The basis
reflects the randomness of the commodity market, which, combined with other effects,
triggers shipping demand. The correlation between Minneapolis and Pacific Northwest
(PNW) basis levels of .81 was incorporated into the model.
530 December 1998

Forward Shipping Options for Grain by Rail 531
Grain Purchases
Estimates of grain purchases were derived to reflect a typical single-origin shipper inNorth Dakota. Estimates for forward and spot deliveries were obtained from severalsources. First, the average annual shipment volume of a typical North Dakota elevatorwas derived. A typical elevator storage capacity and an average turnover ratio wereused to derive shipment volume (Gelston and Greene; Anderson and Vachal). Thepercentage of crop year totals sold by producers (North Dakota Agricultural StatisticsService), and therefore purchased by elevators, was applied to determine monthlypurchases by elevators. Monthly purchases consisted of both spot and forwardtransactions, each with different levels of uncertainty. The split between forward andspot delivery transactions (forward/spot delivery ratios) was 25% and 75%, respectively(Stearns).4 Spot deliveries were treated as a random variable with a normal distribution.Monthly averages and standard deviations for this parameter were calculated usinghistorical data (1991-95) from the North Dakota Agricultural Statistics Service.
Forward purchases were derived similarly. The volume purchased under forwardcontracts was assumed to have substantially less uncertainty than spot purchases dueto their obligatory nature. However, uncertainty about forward purchases increases inmore distant months. Standard deviations for forward purchases were establishedaround the fixed level of forward contracts based on interviews with grain shippers. Thestandard deviations applied were 5% for one to four months forward, 10% for five to ninemonths forward, and 15% for 10 to 12 months forward. These distributions wereincluded to reflect that there is less uncertainty about shipping demand for grain boughtunder forward contracts in contrast to spot purchases, and to reflect the increaseduncertainty shippers confront during the post-harvest season.
Shipping Costs
Shipping costs are comprised of three elements: the current tariff rate level, changes intariffs, and premiums for guaranteed service. The first is treated as nonrandom; thelatter two are random variables. The 26-car tariff rate from Devils Lake, North Dakota,to Minneapolis and Pacific Northwest markets was used as of April 1, 1996 (BurlingtonNorthern Tariff ICC-BN-4022 H-I, 1990-94).
Tariff Rate Changes. Shippers confront the risk that tariff rail rates may increase. Tocapture this risk, tariff rate changes were treated as random variables using a proce-dure of "variation around a fixed trend" (Palisade Corp., pp. 5-13). Monthly averagetariff rate changes were derived for 1990-94. Estimates were obtained with a methodused to measure volatility in commodity markets (Cox and Rubenstein, p. 257). Simply,the logarithm of monthly rate ratios [i.e., ln(Rt'JI/RJ)] was computed; the square root ofthe natural logarithm of this ratio was derived and its standard deviation calculated foreach month. These were used to derive levels of uncertainty for tariff rate changes.Results suggest a greater likelihood of rate changes for some months than for others.The Minneapolis and PNW tariff rates had a correlation of .82 for 1990-94, and this wasimposed on the simulation.
4 These were rounded from 34% forward and 66% spot to simplify later sensitivity analyses.
Wilson, Priewe, and Dahl
Journal ofAgricultural and Resource Economics
260
240
220
200
180
160
140
120
100
80
60
40
20
0
-20Aug Sept Oct Nov Dec Jan Feb Mar April May June July
-1 S.D. GsMean +1 S.D. GLPremium_, _m _mi . ..... _
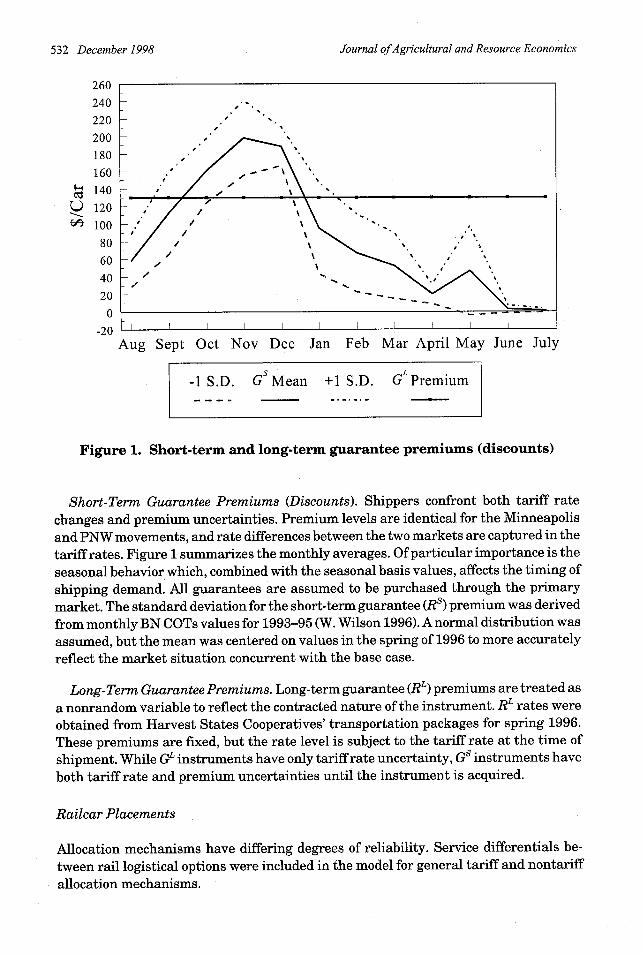
Figure 1. Short-term and long-term guarantee premiums (discounts)
Short-Term Guarantee Premiums (Discounts). Shippers confront both tariff ratechanges and premium uncertainties. Premium levels are identical for the Minneapolisand PNW movements, and rate differences between the two markets are captured in thetariff rates. Figure 1 summarizes the monthly averages. Of particular importance is the
seasonal behavior which, combined with the seasonal basis values, affects the timing ofshipping demand. All guarantees are assumed to be purchased through the primarymarket. The standard deviation for the short-term guarantee (Rs) premium was derivedfrom monthly BN COTs values for 1993-95 (W. Wilson 1996). A normal distribution was
assumed, but the mean was centered on values in the spring of 1996 to more accurately
reflect the market situation concurrent with the base case.
Long-Term Guarantee Premiums. Long-term guarantee (RL) premiums are treated asa nonrandom variable to reflect the contracted nature of the instrument. RL rates wereobtained from Harvest States Cooperatives' transportation packages for spring 1996.These premiums are fixed, but the rate level is subject to the tariff rate at the time ofshipment. While GL instruments have only tariff rate uncertainty, Gs instruments haveboth tariff rate and premium uncertainties until the instrument is acquired.
Railcar Placements
Allocation mechanisms have differing degrees of reliability. Service differentials be-tween rail logistical options were included in the model for general tariff and nontariff
allocation mechanisms.
532 December 1998

Forward Shipping Options for Grain by Rail 533
I
0.95
*_4
I 0.9
0
2 0.8P4
0.75
n 7U./
Aug Sept Oct Nov Dec Jan Feb Mar April May June July
Figure 2. Probability of receipt for short-term (GS) andlong-term (GL) guarantees
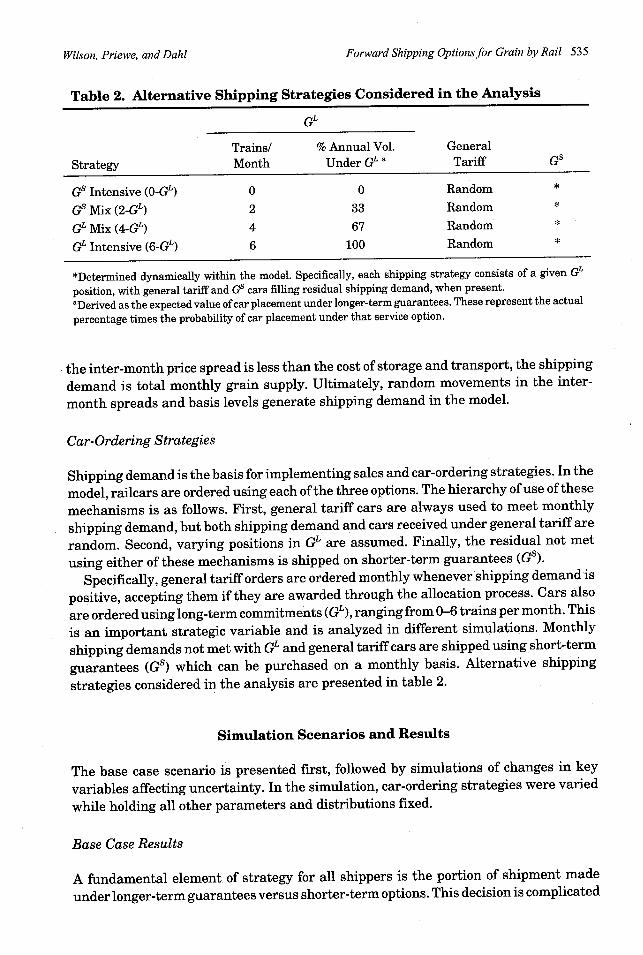
Guaranteed Service Options. Service parameters for short-term and long-term guar-antees were established as discrete probabilities. The probability of receipt was definedas one minus the likelihood of carrier default. Estimates of the probabilities of receivingcars within the shipping period were obtained through interviews with rail and grainindustry contacts (Wood; Strege). These probabilities are shown in figure 2. Both sourcesnoted a higher performance level for shorter-term than for longer-term guarantees dueto the carrier performance incentives associated with the former.
Car Allocation for General Tariff Services. Similar data were not available for carplacement under general tariff services. Thus, an algorithm was developed encom-passing the distributions for the supply and demand for railcars to approximate theprobability of receiving general tariff cars. These values were subjected to the logic ofthe general tariff allocation mechanisms to determine the likelihood of receiving carsunder this option.
Monthly railcar supply and demand estimates were calculated for North Dakota.Demand estimates were derived from several sources. First, average production levelsfor 1990-94 were computed for wheat, barley, sunflower, oats, soybeans, flaxseed, andcorn from historic estimates of principal crops harvested in North Dakota (North DakotaAgricultural Statistics Service). Trucking shares of the average annual production (tons)were netted out, assuming an average (1990-94) rail-truck ratio derived from various"North Dakota Grain and Oilseed Transportation Statistics" publications (i.e., Buschand Vachal 1992, 1993; Anderson, Young, and Vachal; Anderson and Vachal). Railshares of annual production were converted to car units, using load factors for each
.-...- ... / .........
II.I.I........ . .4. .1 1 1
/e
G( GL
Wilson, Priewe, and Dahl
I

Journal ofAgricultural and Resource Economics
commodity (Burlington Northern Railroad Co.). Average total monthly grain and oilseed
market sales were computed by multiplying derived average percentages of crop year
totals sold in open market for 1990-94 (North Dakota Agricultural Statistics Service).This total served as the railcar demand estimate for North Dakota.5
Railcar supply estimates for North Dakota were derived using several sources. NorthDakota grain movement served as the basis for these estimates (Anderson, Young, and
Vachal; Anderson and Vachal). First, three-year average monthly totals were computedfor wheat, barley, sunflowers, oats, flaxseed, and corn. These totals were converted into
cars using 1993 BN load factors (Burlington Northern Railroad Co.). Nontariff move-ments were subtracted from these totals, assuming a fixed annual percentage of tariff
movements (Vachal). This total served as the residual railcar supply estimate for North
Dakota. The estimates of both railcar supply and demand were treated as randomvariables.
An algorithm was developed to simulate the general tariff allocation proceduresused by the BN (Burlington Northern Tariff ICC-BN-4022 H-I, 1990-94). If car supplyexceeded car demand, the shipper would receive one train for that month; otherwise, arandom draw from a uniform rdistribution was used to determine whether cars wouldbe received during that month. If the shipper won, it was awarded one 26-car unit-train.Otherwise, the elevator received no general tariff cars for the cmonth. A uniformdistribution between t zero and one assures that each shipper has an equal likelihood ofreceiving a train. Residual supplies, if present, are also randomly allocated. This proce-dure exactlyreplicates that used by the BN in allocation of its general tariff cars.
Shipping Demand
Shipping demand was determined stochastically by evaluating variables within themodel that determine the expected net payoff of storing versus shipping grain. The
shipper is assumed hedged in the futures market for its commodity risk, thereby making
futures price, F, a nonrandom variable. Variables included in this evaluation are: (a)
inter-month price differences, i.e., the "carry" in the commodity market from time period
tt to t + z is defined as [(F + B)t+z - (F + B)], where F is the commodity futures price, and
B is the basis at the destination market in the respective periods t + z and t; (b) interestcost of storage (i); (c) transport costs (T), which are comprised of the current tariff plusexpected change in tariff and premium costs (i.e., T = R0j + EAR0j + RS); and (d) storage
capacity.Shipping demand is determined as follows. If [(F + B),+ - (F + B)t] < [i + E(AT)], grain
is shipped; otherwise it is stored. Literally, if the inter-month price spread [(F + B),\+ -(F + B)t] is greater than the estimated marginal cost of storage (i) and the expectedchange in transport [E(AT)], then grain is stored. Grain stocks are not shipped and arestored if [(F + B),+ - (F + B)t] > [i + E(AT)]. The evaluation also compares grain supplies
to storage capacity as follows. If the total monthly grain supplies (TGS) exceed the
storage capacity (SC), shipping demand is equal to the excess inventory.When there is a carry in the market, i.e., when [(F + B),+, - (F + B)t] > [i + E(AT)], and
total monthly grain supplies are less than storage capacity, shipping demand is zero. If
6 Shippers are assumed to prefer to move grain with lower-cost tariff cars if possible. For this reason, the summation ofthe monthly car totals for each commodity serves as the proxy for the total monthly general tariff demand.
534 December 1998
Forward Shipping Options for Grain by Rail 535
Table 2. Alternative Shipping Strategies Considered in the Analysis
GL
Trains/ % Annual Vol. General
Strategy Month Under GL a Tariff Gs
Gs Intensive (O-GL) 0 0 Random *
Gs Mix (2-GL) 2 33 Random *
GLMix (4-GL) 4 67 Random *
GL Intensive (6-GL) 6 100 Random *
*Determined dynamically within the model. Specifically, each shipping strategy consists of a given GL
position, with general tariff and Gs cars filling residual shipping demand, when present.
aDerived as the expected value of car placement under longer-term guarantees. These represent the actual
percentage times the probability of car placement under that service option.
the inter-month price spread is less than the cost of storage and transport, the shipping
demand is total monthly grain supply. Ultimately, random movements in the inter-
month spreads and basis levels generate shipping demand in the model.
Car-Ordering Strategies
Shipping demand is the basis for implementing sales and car-ordering strategies. In the
model, railcars are ordered using each of the three options. The hierarchy of use of these
mechanisms is as follows. First, general tariff cars are always used to meet monthly
shipping demand, but both shipping demand and cars received under general tariff are
random. Second, varying positions in GL are assumed. Finally, the residual not met
using either of these mechanisms is shipped on shorter-term guarantees (GS).
Specifically, general tariff orders are ordered monthly whenever shipping demand is
positive, accepting them if they are awarded through the allocation process. Cars also
are ordered using long-term commitments (GL), ranging from 0-6 trains per month. This
is an important strategic variable and is analyzed in different simulations. Monthly
shipping demands not met with GL and general tariff cars are shipped using short-term
guarantees (GS) which can be purchased on a monthly basis. Alternative shipping
strategies considered in the analysis are presented in table 2.
Simulation Scenarios and Results
The base case scenario is presented first, followed by simulations of changes in key
variables affecting uncertainty. In the simulation, car-ordering strategies were varied
while holding all other parameters and distributions fixed.
Base Case Results
A fundamental element of strategy for all shippers is the portion of shipment made
under longer-term guarantees versus shorter-term options. This decision is complicated
Wilson, Priewe, and Dahl
Journal ofAgricultural and Resource Economics
by numerous sources of uncertainties; the most important are shipping demand, pricespreads, etc., and varying penalties and requirements of the different shipping mechan-isms. The simulations seek to capture these effects and evaluate tradeoffs and illustratedifferences.
The maximum E(7) was $582,085 with a shipping strategy of zero GLs (i.e., Gs inten-sive). Under this strategy, the shipper supplements all of the remainder of shippingdemand with Gs. Longer-term guarantees are not used in this strategy (i.e., GL = 0).Increased use of longer-term guarantees results in lower payoffs, and the E(zn) decreasesat an increasing rate. The E(7s) declines to -$248,335 with a GL strategy of six unit-trains per month and no short-term guarantees. Results show a $541,880 reduction inrevenues on grain sales going from the E(zt) maximizing strategy to 100% coverage withlonger-term guarantees. Total revenues on grain sales are affected by grain prices andthe quantity shipped in a given month.
The relationship between E(s) and shipping strategy is a result of several factors. Ofparticular importance is that GLs remove marketing flexibility, forcing shipments inotherwise suboptimal shipping periods. As the number of GLs increases, shipping pat-terns are governed less by market spreads and more by railcar positions and associatedobligations.
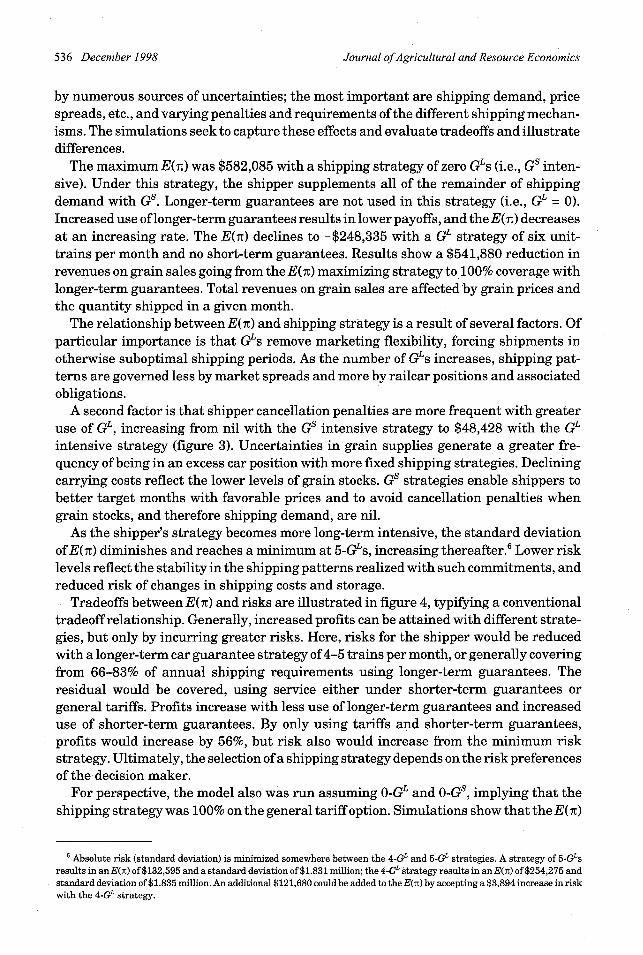
A second factor is that shipper cancellation penalties are more frequent with greateruse of GL, increasing from nil with the Gs intensive strategy to $48,428 with the GLintensive strategy (figure 3). Uncertainties in grain supplies generate a greater fre-quency of being in an excess car position with more fixed shipping strategies. Decliningcarrying costs reflect the lower levels of grain stocks. Gs strategies enable shippers tobetter target months with favorable prices and to avoid cancellation penalties whengrain stocks, and therefore shipping demand, are nil.
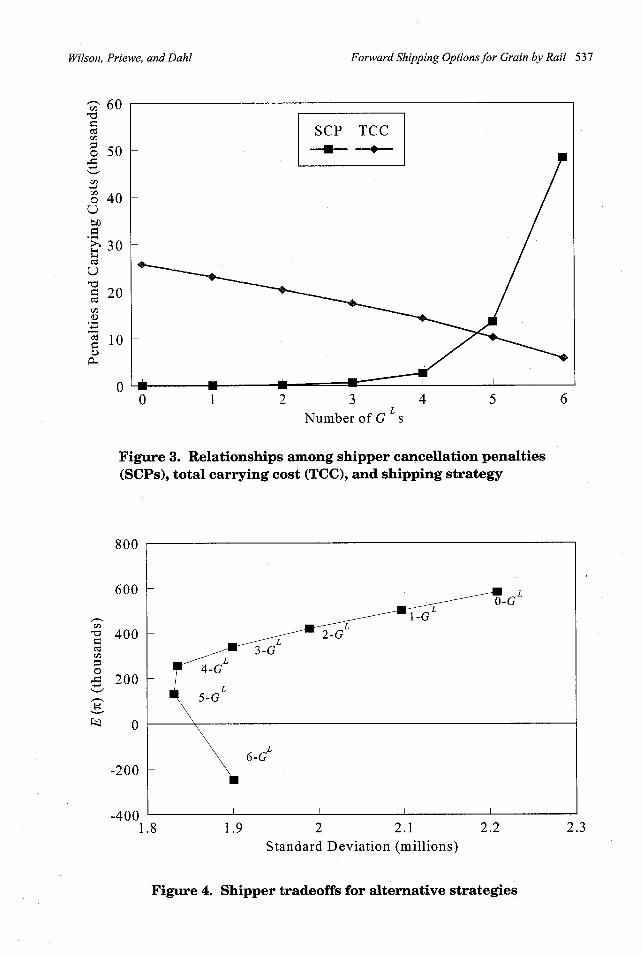
As the shipper's strategy becomes more long-term intensive, the standard deviationof E(n) diminishes and reaches a minimum at 5-GLs, increasing thereafter.6 Lower risklevels reflect the stability in the shipping patterns realized with such commitments, andreduced risk of changes in shipping costs and storage.
Tradeoffs between E(7) and risks are illustrated in figure 4, typifying a conventionaltradeoff relationship. Generally, increased profits can be attained with different strate-gies, but only by incurring greater risks. Here, risks for the shipper would be reducedwith a longer-term car guarantee strategy of 4-5 trains per month, or generally coveringfrom 66-83% of annual shipp requirements using ing longer-term guarantees. Theresidual would be covered, using service either under shorterterm guarantees orgeneral tariffs. Profits increase with less use of longer-term guarantees and increaseduse of shorter-term guarantees. By only using tariffs and shorter-term guarantees,profits would increase by 56%, but risk also would increase from the minimum riskstrategy. Ultimately, the selection of a shipping strategy depends on the risk preferencesof the decision maker.
For perspective, the model also was run assuming O-GL and 0-GS, implying that theshipping strategy was 100% on the general tariff option. Simulations show that the E(iT)
6 Absolute risk (standard deviation) is minimized somewhere between the 4-GL and 5-GL strategies. A strategy of 5-GLsresults in anE(7) of $132,595 and a standard deviation of$1.831 million; the 4-GL strategy results in anE(T) of $254,275 andstandard deviation of $1.835 million. An additional $121,680 could be added to the E(T) by accepting a $3,894 increase in riskwith the 4-GL strategy.
536 December 1998
Forward Shipping Options for Grain by Rail 537
0 1 2 3 4 5 6L
Number of G s
Figure 3. Relationships among shipper cancellation penalties(SCPs), total carrying cost (TCC), and shipping strategy
8 1.9 2 2.1 2.2Standard Deviation (millions)
Figure 4. Shipper tradeoffs for alternative strategies
o 50
rA
o 40U
30cT
§ 20
0
a)
UO
cO
c3IS
-j
1-.
/11
800
600
400
200
0
-200
A nf-'-v
1. 2.3
Wilson, Priewe, and Dahl
_ ,I-,
--A
538 December 1998 Journal of Agricultural and Resource Economics
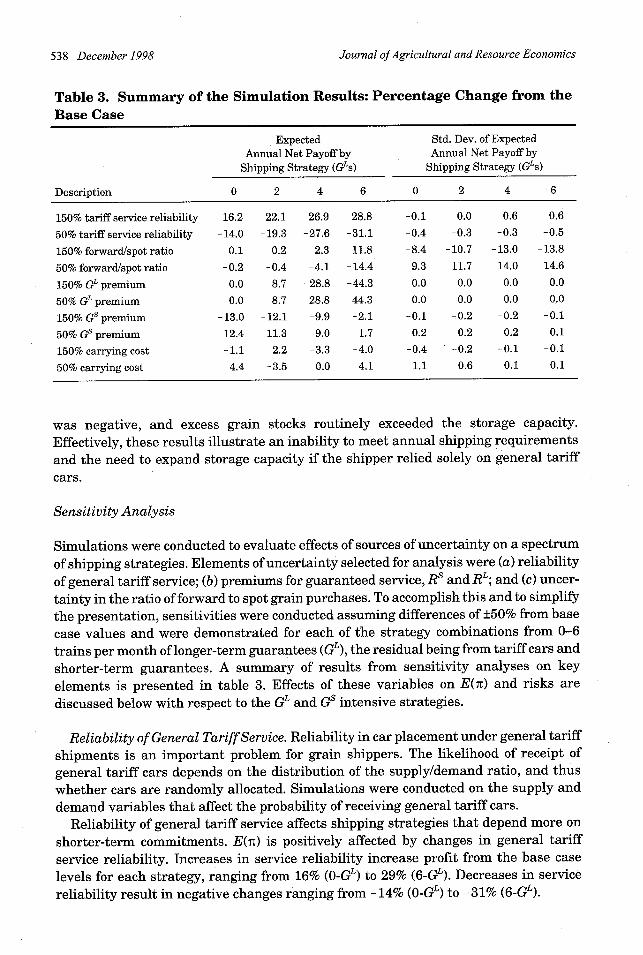
Table 3. Summary of the Simulation Results: Percentage Change from theBase Case
Expected Std. Dev. of ExpectedAnnual Net Payoff by Annual Net Payoff by
Shipping Strategy (GLs) Shipping Strategy (GLs)
Description 0 2 4 6 0 2 4 6
150% tariff service reliability 16.2 22.1 26.9 28.8 -0.1 0.0 0.6 0.6
50% tariff service reliability -14.0 -19.3 -27.6 -31.1 -0.4 -0.3 -0.3 -0.5
150% forward/spot ratio 0.1 0.2 2.3 11.8 -8.4 -10.7 -13.0 -13.8
50% forward/spot ratio -0.2 -0.4 -4.1 -14.4 9.3 11.7 14.0 14.6
150% GL premium 0.0 -8.7 -28.8 -44.3 0.0 0.0 0.0 0.0
50% GL premium 0.0 8.7 28.8 44.3 0.0 0.0 0.0 0.0
150% Gs premium -13.0 -12.1 -9.9 -2.1 -0.1 -0.2 -0.2 -0.1
50% Gs premium 12.4 11.3 9.0 1.7 0.2 0.2 0.2 0.1
150% carrying cost -1.1 2.2 -3.3 -4.0 -0.4 -0.2 -0.1 -0.1
50% carrying cost -4.4 -3.5 0.0 4.1 1.1 0.6 0.1 0.1
was negative, and excess grain stocks routinely exceeded the storage capacity.
Effectively, these results illustrate an inability to meet annual shipping requirementsand the need to expand storage capacity if the shipper relied solely on general tariffcars.
Sensitivity Analysis
Simulations were conducted to evaluate effects of sources of uncertainty on a spectrumof shipping strategies. Elements of uncertainty selected for analysis were (a) reliabilityof general tariff service; (b) premiums for guaranteed service, Rs and RL; and (c) uncer-tainty in the ratio of forward to spot grain purchases. To accomplish this and to simplifythe presentation, sensitivities were conducted assuming differences of +50% from basecase values and were demonstrated for each of the strategy combinations from 0-6
trains per month of longer-term guarantees (GL), the residual being from tariff cars andshorter-term guarantees. A summary of results from sensitivity analyses on keyelements is presented in table 3. Effects of these variables on E(i) and risks arediscussed below with respect to the GL and Gs intensive strategies.
Reliability of General Tariff Service. Reliability in car placement under general tariffshipments is an important problem for grain shippers. The likelihood of receipt ofgeneral tariff cars depends on the distribution of the supply/demand ratio, and thuswhether cars are randomly allocated. Simulations were conducted on the supply and
demand variables that affect the probability of receiving general tariff cars.Reliability of general tariff service affects shipping strategies that depend more on
shorter-term commitments. E(nT) is positively affected by changes in general tariff
service reliability. Increases in service reliability increase profit from the base caselevels for each strategy, ranging from 16% (0-GL) to 29% (6-GL). Decreases in servicereliability result in negative changes ranging from -14% (0-GL) to -31% (6-GL).

Forward Shipping Options for Grain by Rail 539
Improvements in the service reliability lead to less uncertainty in tariff car receipts
and vice versa. The impact of service reliability has a greater effect on E(iT) for shipping
strategies that are more GL intensive. Shipping strategies that rely more on shorter-term guarantees (Gs) are less affected by changes in tariff service reliability. The morefixed GL intensive strategies incur fewer shipper cancellation penalties with higherservice reliability on tariff cars. Essentially, greater service reliability for tariff carsenhances the value of longer-term guarantee mechanisms because there is less uncer-
tainty regarding residual shipping demand (i.e., that not met from tariff cars).The standard deviation was unaffected by changes in the tariff service reliability.
This is likely due to the general tariff allocation logic that depends on a random draw
and the limited percentage of total shipments made with the tariff option.
Uncertainty in Forward Grain Purchases. The timing of grain purchases from farmersresults in a great source of uncertainty for shippers. During preharvest, producers-andtherefore shippers-have a high degree of uncertainty due to growing season risk. In thepost-harvest period, uncertainty also exists around farmer delivery patterns. Grainpurchased under forward contracts has less uncertainty, resulting in a greater abilityto plan logistics requirements. Uncertainties about farmer sales patterns result inuncertainty in shipping demand, and thus risks associated with railcar strategies. Theseeffects are an important part of the model. To evaluate this effect, simulations wereconducted on a ±50% change in grain purchases under forward contracts which alsoaffect the level of spot purchases, since these two comprise total purchases. This rela-tionship is denoted the forward/spot (F/S) ratio (i.e., the portion of the crop purchasedunder a forward contract versus spots) in table 3.
E(in) has a positive relationship with changes in the percentage of forward purchases.Increases in the level of forward contracted deliveries increase the expected payoffsacross strategies. Increases in forward deliveries result in increases from base caselevels for each strategy, ranging from zero to 12% for the O-GL and 6-GL strategies,respectively. Decreases result in negative changes ranging from zero to -14% (table 3).The GL intensive strategy is affected the most by changes in the forward/spot deliveryratio.
Forward purchases have the largest impact on risk across strategies. Sensitivitiesshow an inverse relationship between changes in the level of forward contracts and the
standard deviation of E(z). Greater use of purchases under forward contracts results in
less risk. Forward contract purchases are more important as the strategy becomes moreGL intensive (see table 3). The strategic implication of this is important: an increase ingrain purchased under forward contracts reduces uncertainty in shipping demand,making forward shipping alternatives more effective and lessening the risk of cancel-lation penalties.
Gs and GL Premiums. Gs and GL premiums vary with grain transportation marketconditions. Shippers can take positions as far forward as six months before the shippingperiod with certain GS programs. However, premiums tend to be seasonal, and volatileannual production levels can result in unanticipated shifts in Gs premiums (W. Wilson1995). Positions and premiums for GL instruments can be made one to three years inadvance at fixed premiums through forward contracts. Uncertainty also exists over theactual future value of the GL instrument. Thus, the relationship between Gs premiums
Wilson, Priewe, and Dahl

Journal ofAgricultural and Resource Economics
(which are random) and GL premiums (which can be locked for extended periods) iscritical. Volatility in Gs premiums was represented in the model by a random normallydistributed variable based on monthly BN COTs data from 1993-95 (W. Wilson 1996).
GL premiums were fixed at their April 1996 value of $130 per car to reflect their
contractual nature. Simulations were conducted at ±50% deviations in each of these
premiums for each of the shipping strategies.The Gs premium level had an inverse relationship with E(n). Higher premiums result
in reduced profits from base case levels for each strategy, ranging from -2% to -13%,consequently making GL intensive strategies more attractive. As expected, the Gs inten-sive strategy was the most sensitive to changes in premiums.
Changes in GL premiums had the greatest impact on E(n) for strategies with morelonger-term coverage (table 3). This parameter had an inverse relationship with the
E(t).7 Increases in GL premiums resulted in a decrease from the base case levels forthe Gs mix (-9%), GL mix (-29%), and GL intensive (-44%) strategies. Decreases in GLpremiums increased from the base case levels for the Gs mix (9%), GL mix (29%), and GL
intensive (44%) strategies.
Summary of Simulation Results
These simulation results provide insight into effects of changes in key elements of uncer-
tainty and the relationships between Gs and GL shipping strategies. First, reliability ofgeneral tariff service has the greatest impact on expected payoff levels for the Gs
intensive and Gs mix strategies. The discrete and random nature of the generalallocation mechanism leads to large changes inE(iT). Second, GL premium changes havethe greatest impact on the more GL intensive strategies. The fixity of the forward rate
becomes more critical than the general tariff reliability as the shipping strategy becomes
more long-term intensive. Third, grain purchases on forward contracts increase in
importance as the shipper becomes more GL oriented in strategy. Uncertainty in spot
purchases results in greater risk of being understocked. Securing stocks throughforward contracts leads to greater E(z) and lower risk. Finally, Gs premiums becomeless important as the shipping strategy becomes more long term.
The Gs intensive (i.e., 0-GL) strategy consistently provided the highest E(n) and thegreatest risk. Carrying cost, Gs premiums, and tariff service reliability had little impact
on the standard deviation of risk. The ratio of forward to spot purchases (F/S ratio) had
the most influence on risk for each strategy. However, such changes only have a signifi-
cant impact on E(rn) with the GL intensive strategy. Integration of GLs into a shippingstrategy results in less risk.
Conclusions
Railcar market allocation has evolved dramatically since the passage of the Staggers
Rail Act. Railroads have addressed chronic problems with the introduction of several
innovative market-based allocation and ordering mechanisms. Because of these
7 The Gs intensive strategy was unaffected by GL premium changes since this strategy does not use the GL instrument.
540 December 1998
Forward Shipping Options for Grain by Rail 541
innovations, grain marketing participants are confronted with three logistical options:(a) general tariff, (b) short-term guarantees (Gs), and (c) long-term guarantees (GL).Forward guarantees are attractive to shippers because of seasonal fluctuations in railcardemand. Shippers must consider among different combinations of these strategies tomaximize expected profits, recognizing that each strategy has different risks andobligations.
In this study we have evaluated rail and logistical options confronting grain shippers.Results illustrate that annual profits and risks increase for shipping strategies makinggreater use of short-term guarantees (Gs intensive strategies). Second, reliability ofgeneral tariff service has an important impact on the expected payoff levels. In addition,the portion of grain purchases made on forward contracts versus spot affects risk.Changes in the portion of purchases under forward contracts, however, have greatereffects on shipping strategies using longer-term guarantees. Therefore, lower risk isachieved by integrating GL into a shipping strategy and contracting forward purchases.However, shippers must coordinate their forward car and grain positions.
Results from this dynamic stochastic simulation model can put perspective on theimportance of the variables in this system. This study illustrates the role of car-orderingstrategies and their relationships to uncertainties in deliveries, premium levels,carrying costs, and tariff reliability. Some implications are identified below for shippers,railroads, and public policy.
Implications for Shippers
In any period, shippers must develop forward strategies that integrate grain tradingand logistics strategies. These findings illustrate that grain merchandising decisionswhich are not integrated with forward shipping strategies are highly risky, and payoffswould be much less. In the extreme, the 100% general tariff shipping strategy wouldresult in negative expected profits and the need to expand storage capacity. Coordina-tion of expected grain purchases, sales, and shipping requirements increases profits.In doing so, managers must integrate grain marketing and transportation decisionplanning.
Implementing forward car-ordering strategies affects shipping patterns. First, as GLuse increases, shipping patterns become less governed by market spreads and more byrailcar commitments. Such strategies remove a degree of market speculation and mayinduce shipments in otherwise "suboptimal" shipping demand periods compared to themore flexible Gs strategies. As use of GSs increases, shipping decisions become moregoverned by grain market conditions. The value of Gs rests with the strategic flexibilityof this instrument to target peak demand shipping periods.
Shipping a portion of shipments on long-term guarantees (GLs) increases stability inshipping patterns and reduces risk, up to a point. As the shipper's strategy dependsmore on GLs, risk diminishes, reaches a minimum, and then increases. Results suggestthat longer-term freight positions of 66-83% of annual shipments would minimize riskfor a shipper with logistical characteristics similar to a typical North Dakota shipper.Fixed GL strategies may be viewed as risk-reducing tools when used with the moreflexible GS s. Success of such efforts, however, ultimately depends on the accuracy ofshipping demand projections. Since logistical options are taken over a year in advance,shippers' projections of monthly shipping demands are critical.
Wilson, Priewe, and Dahl

Journal ofAgricultural and Resource Economics
The importance of forward contracts for grain purchases escalates as shippersintegrate grain merchandising and transportation strategies. Increased use of forwardcontracts reduces uncertainty about forward shipping demand, making longer-termshipping options more attractive and less risky. Shipping strategies with longer-termguarantees require more planning and scheduling of grain flows. In this analysis, theportion of grain purchases under a forward contract has a great impact on expectedpayoff levels and risk, particularly for GL intensive strategies. Greater certainty inmonthly grain stock levels through forward contracts creates an assurance that reducesshipper cancellation penalties.
Transferability of the forward instruments has led to the development of informalsecondary markets. The emergence of transportation brokers and packages put togetherby grain trading firms has created more options for grain shippers. Secondary marketscan serve to adjust the size of railcar positions. Shippers with greater uncertainty inshipping needs can defer positions until demand becomes more apparent and thenpurchase instruments on the secondary market. Risk-averse shippers also can reduceuncertainty in primary market positions by purchasing instruments closer to thedelivery period.
Implications for Railroads
Railroads must closely monitor the effectiveness of the design of these instruments.Objectives should be to develop and offer options for shippers. Optimal levels of shippercancellation and carrier default penalties must be derived and implemented to ensureappropriate incentives are present.
Market-based allocation mechanisms have led to greater sophistication of logisticaldecision making. These systems are likely to result in productivity gains that willbenefit carriers. Most obvious is that the forward dimension of the shipping optionsprovides incentives for shippers to even out seasonal demands, and concurrentlyprovides less uncertainty and variability in forward shipping demand for the carrier.Ultimately, the challenge for railroads is to integrate this information into operationsand capacity planning.
Implications for Public Policy
Guaranteed rail transportation services have generated many public policy concerns.As an example, in late 1997, with alleged car allocation inequities, the Surface Trans-portation Board superceded the prioritization system of two western carriers. This studyshows demand exists for forward guarantee mechanisms in the grain industry. Shipperswho develop integrated logistical strategies can reduce merchandising risk using thesemechanisms. Forward guarantee mechanisms also encourage greater sophistication ofgrain marketing decisions. Forward guarantee mechanisms ration demand during peakdemand periods and level out shipping patterns. Such developments generate improve-ments in grain transportation efficiency which benefit shippers and carriers.
[Received June 1997; final revision received February 1998.]
542 December 1998
Forward Shipping Options for Grain by Rail 543
References
Ainsworth, D. P. "Implications of Inconsistent Railroad Service." In Proceedings-Thirteenth AnnualMeeting of the Transportation Research Forum 13,1(1972):489-503.
Allen, W. B., M. M. Mahmoud, and D. McNeil. "The Importance of Time in Transit and Reliability ofTransit Time for Shippers, Receivers, and Carriers." Transportation Research, Part B: Methodo-logical 19B,5(1985):447-56.
Anderson, S., and K. Vachal. "North Dakota Grain and Oilseed Transportation Statistics, 1994-95."UGPTI Pub. No. 106, Upper Great Plains Transportation Institution, North Dakota State University,Fargo, 1995.
Anderson, S., D. Young, and K. Vachal. "North Dakota Grain and Oilseed Transportation Statistics,1993-94." UGPTI Pub. No. 101, Upper Great Plains Transportation Institution, North Dakota StateUniversity, Fargo, 1994.
Ballou, R. H. Business Logistics Management. Englewood Cliffs NJ: Prentice-Hall, 1992.Baumel, C. P., and J. Van Der Kamp. "Major Changes in Grain Car Ownership Will Require Shippers
to Consider Options." Feedstuffs 66,2(1996):12-13.Bookbinder, J. H., and N. Serenda. "A DRP Approach to the Management of Rail Car Inventories."
Logistics and Transportation Rev. 23,3(1987):265-80.Burlington Northern Railroad Co. "State Statistics for North Dakota." Fort Worth TX, 1993.Busch, D., and K. Vachal. "North Dakota Grain and Oilseed Transportation Statistics, 1991-92." UGPTI
Pub. No. 94, Upper Great Plains Transportation Institution, North Dakota State University, Fargo,1992.
. "North Dakota Grain and Oilseed Transportation Statistics, 1992-93." UGPTI Pub. No. 97,Upper Great Plains Transportation Institution, North Dakota State University, Fargo, 1993.
Cox, J. C., and M. Rubenstein. Options Markets. Englewood Cliffs NJ: Prentice-Hall, 1985.Crampton, P. "Money Out of Thin Air: The Nationwide Narrowband PCS Auction." J. Econ and
Manage. Strategy 4(Summer 1995):267-343.Flaskerud, G. "Minneapolis and Pacific Northwest Basis Data Collection for Wednesday Prices,
1990-94." Unpub. data, North Dakota State University, Fargo, 1995.Frost, G. "North Dakota Farmers Fret Over Freight." Western Producer 73(February 1996):64.Gelston, W., and S. Greene. "Assessing the Potential for Improved Functioning of the Grain Merchan-
dising/Transportation System." USDOT Pub. No. GRA-RRP-92-01. Final report prepared by ApogeeResearch, Inc., submitted to the U.S. Department of Transportation, Federal Railroad Adminis-tration, Washington DC, March 1994. (82 pp.)
Harvest States Cooperatives. "Rail Equipment Supply Program Facsimile." Rail Equipment SupplyProgram Offers, St. Paul MN, 8 February 1996.
McAfee R. P., and J. McMillan. "Analyzing the Airwaves Auction." J. Econ. Perspectives 10,1(Winter1996a):159-75.- . "Auctions and Bidding." J. Econ. Lit. 25(June 1987):699-738.
. "Competition and Game Theory." J. Mktg. Res. 33(August 1996b):263-67.Milgrom, P. "Auctions and Bidding: A Primer." J. Econ. Perspectives 3,3(Summer 1989):3-22.Moser, V. "Railcar Supply Shortage: Why We Have It, What to Do About It." Grain J. (May/June
1995):41.National Grain and Feed Association. "NGFA Files Statement with STB on Rail Services." NGFA
Newsletter 49,26(18 December 1996):3.Niedens, L. "The Rail Car Shortage Saga." Agweek 11,24(1996):21.North Dakota Agricultural Statistics Service. North Dakota Agricultural Statistics. Ag Statistics Nos.
60-64, North Dakota State University, Fargo. Annual issues, 1991-95.Norton, J. D. "Assessing the Impact of Railcar Availability on Grain Prices." USDA, Transportation and
Marketing Div., Washington DC, 1995.Palisade Corp. @RISK: Risk Analysis for Spreadsheets. Newfield NJ: Palisade Corp., 1994.Pautsch, G., H. Lapan, and C. P. Baumel. "Economic Investigation into Railroad Pricing and Car
Allocation Programs." Report prepared for the Midwest Transportation Center, Iowa State Univer-sity, Ames, 1995.
Wilson, Priewe, and Dahl

544 December 1998 Journal ofAgricultural and Resource Economics
Pautsch, G., M. McVey, and C. P. Baumel. "Railroad Grain for Pricing and Supply Models." J. Trans-
portation Res. Forum 32,1(1991):1-8.Pedraza, J. M. "Waiting for the Train: Elevators Dub Delays Their No. 1 Frustration." Agweek
11,22(1996):18.Priewe, S. R., and W. W. Wilson. "Grain-Hopper Allocation Mechanisms: Evolution and Comparisons."
Dept. of Agr. Econ.; North Dakota State University, Fargo, 1997.Sheffi, Y., B. Eskandari, and H. Koutsopoulus. "Transportation Mode Choice Based on Total Logistics
Cost." J. Bus. Logistics 9,2(1988):137-54.Stearns, L. "Grain Marketing Cooperatives' Adjustments to Farm Programs." Unpub. paper, Dept. of
Agr. Econ., North Dakota State University, Fargo, 1994.Strege, S. Executive Vice President, North Dakota Grain Dealers Association, Fargo ND. Telephone
interview, 18 June 1996.Surface Transportation Board. Joint Petition for Service Order. Docket No. 501518, Supp. Order No. 1,
Washington DC, 4 December 1997.U.S. Department of Agriculture. "Listening Session on Rail Shipping Problems, 1997." USDA/Agricul-
tural Marketing Service, Washington DC, 1997.Vachal, K. "North Dakota Elevator Industry Survey Results-Marketing and Rail Carriers' Customer
Service: Summary of Results for Elevator Managers." Upper Great Plains Transportation Institution,North Dakota State University, Fargo, 1995.
Wilson, R. "Priority Pricing." In Nonlinear Pricing, chap. 10. New York: Oxford University Press, 1993.. "Strategic Analysis of Auctions." In Handbook of Game Theory with Economic Applications,
Vol. 1, eds., R. Aumann and S. Hart, pp. 228-79. Amsterdam: North-Holland, 1992.
Wilson, W. W. Personally maintained BN COTs data set, 1993-95. Unpub. data, Dept. of Agr. Econ.,North Dakota State University, Fargo, 1996.
"Posted Prices and Auctions in Rail Grain Transportation." Pub. No. AE 89020, Dept. of Agr.Econ., North Dakota State University, Fargo, 1989.
. "U.S. Grain Hopper Car Allocation Mechanisms." Unpub. data, Dept. of Agr. Econ., NorthDakota State University, Fargo, 1995.
Wilson, W. W., and B. Dahl. "Bidding on Railcars: A Strategic Analysis." Rep. No. 376, Dept. of Agr.Econ., North Dakota State University, Fargo, 1997.
Wilson, W. W., and S. Priewe. "Railcar Allocation Mechanisms for Grain: A Comparison Among U.S.Class I Railroads." Dept. of Agr. Econ., North Dakota State University, Fargo, 1997.
Wood, D. Account Manager, CP Rail Systems, Minot ND. Telephone interview, 25 June 1996.