foschini ar comlrweb - home - incite report has been prepared in accordance with the global...
TRANSCRIPT

Offering stylish fashion for larger-sized women of all ages in the LSM 6 to 10 categories.
Chain devoted to women’s footwear and handbags, offering moderately priced products in a modern international store format.
Largest men’s fashion retail chain in southern Africa providing up-to-date internationally inspired menswear of good quality and value, suitable for all occasions.
Leading jeweller that appeals to fashion-forward and image-conscious customers with appropriate products and brands that allow the growing middle market to express their status.
Offers the modern, hi-tech outdoor enthusiast a wide range of products that correspond to their lifestyle.
South Africa’s premier chain for sportswear and basic items of sports equipment with leading international brands of products to meet the everyday needs of sportsmen and sportswomen, together with complementary fashion products.
Offers a comprehensive range of contemporary furniture and décor items in addition to the homewares range.
Manages the supply of locally made apparel.
GROUP BRANDS
A modern and fashionable womenswear chain offering contemporary clothing, footwear and cosmetics for 18 to 35 year olds in the LSM 6 to 10 categories.
A value fashion chain catering for women in the LSM 5 to 9 categories.
Offers stylish and economical clothing, footwear and accessories for modern South African families in the LSM 5 to 8 categories, with particular appeal to women and men aged 30 and upwards, as well as clothing and footwear for children aged between 3 and 12 years.
Contemporary and classic jeweller well known to the market for its quality and welcoming service, offering beautiful and meaningful jewellery.
Chain offering sunglasses and cellphones to the brand-savvy and image-conscious consumer who aspires to designer labels.
Chain offering a blend of sports and fashion products directed mainly at youthful and fashion-conscious customers in a fast-paced, urban street-smart energised shopping venue.
Sells a wide range of homewares to the LSM 8 to 10 groups.
Provides credit and related services to customers of the group.
Provides personal loans and other financial services to customers of the group and others, as well as credit facilities to a number of retailers external to the Foschini group.
ABOUT THIS REPORTIn line with the recommendations of the revised King Code and Report on Governance for South Africa (King III), this year the Foschini group has produced an integrated report that provides a consolidated review of the group’s financial, social, economic and environmental performance, for the period between 1 April 2009 and 31 March 2010.
The report has been prepared in accordance with the Global Reporting Initiative’s (GRI) G3 sustainability reporting guidelines and covers the activities of all Foschini’s wholly-owned divisions, as well as its subsidiary RCS in which the group has a 55% shareholding.
FOSC
HIN
I GRO
UP A
NN
UA
L REPORT 2010 - PA
GE 1
CORPORATE PROFILE
MISSIONThe group’s mission is to be the leading fashion lifestyle retailer in Africa, by providing innovative, creative products and by leveraging our portfolio of diverse brands to differentiate our customer offering. Our talented and engaged people will always be guided by our values and social conscience.
HISTORYThe company, which commenced trading in 1924, has been listed on the JSE Limited since 1 January 1941 and is regarded as one of the foremost independent chain store groups in the country. The company’s success is strongly driven by its desire to provide the right merchandise to the respective target markets of all its trading divisions and its skill in achieving this objective has resulted in a successful track record. The Foschini group believes that teamwork coupled with professionalism in all aspects of retailing will continue to be the foundation for the future.
VALUES• Professionalism: We are accountable and drive performance in a
creative and innovative way• Resilience: We have the courage of our convictions and the
boldness to constructively challenge• Integrity: Our word is our honour, we are honest and ethical• Dignity and Respect: We treat everyone like we want to be treated• Empowerment: We have equal opportunity to grow in a supportive
environment• Excellent Service: Our customers are our future – we look after them
GROUP OVERVIEWFoschini Limited has the following operating divisions:
Retail• Foschini, branded as Foschini, donna-claire, Luella and fashíonexpress• Markham• exact!• The Sports division, branded as sportscene, Totalsports and DueSouth• The Jewellery division, branded as American Swiss, Matrix and Sterns• @home, branded as @home and @homelivingspace• TFG Apparel Supply Company• Group Merchandise Procurement and• FG Financial Services.
The retail divisions retail clothing, jewellery, accessories, cosmetics, sporting and outdoor apparel and equipment and homeware to the broad, middle-income group throughout southern Africa, mainly as a credit retailer. The ratio of credit sales to total turnover approximates 63%.
RCS Group• Transactional Finance, comprising RCS Cards and RCS Private Label
Cards and • Fixed Term Finance, comprising RCS Personal Loans and insurance
products.
RCS Group, the external financial services division provides a broad range of financial services under its own brand in South Africa, Namibia and Botswana.
FOSC
HIN
I GRO
UP A
NN
UA
L REPORT 2010 - PA
GE 2
FINA
NC
IAL H
IGH
LIGH
TS AN
D SH
ARE PERFO
RMA
NC
E
Medium-term target 2010 2009
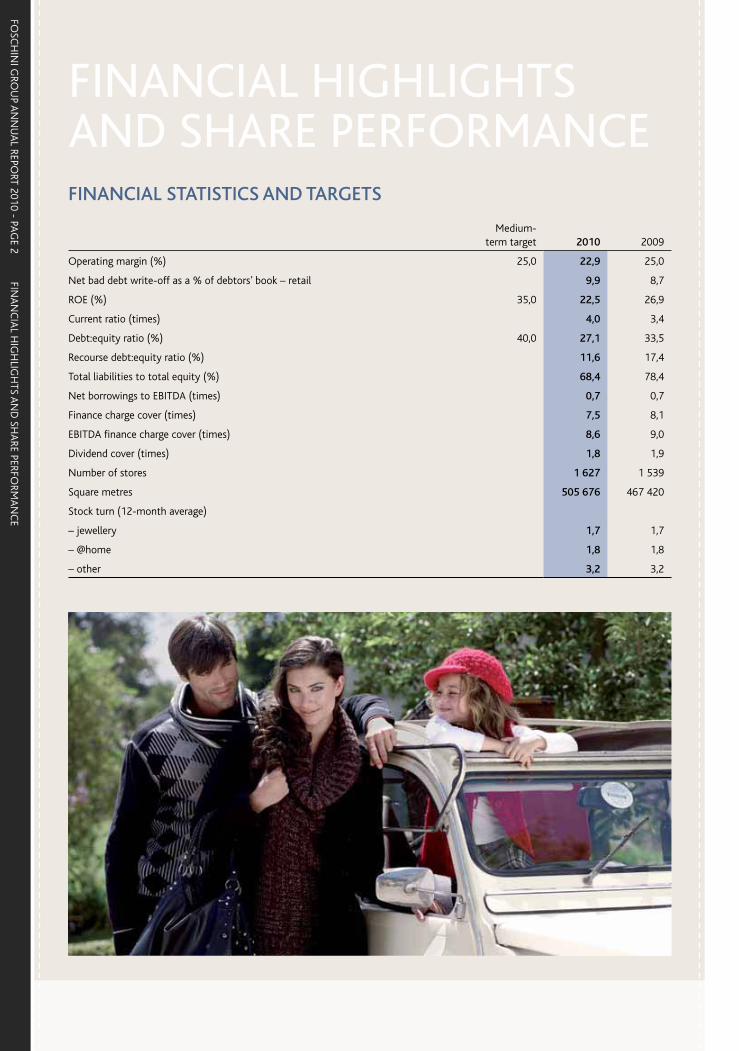
Operating margin (%) 25,0 22,9 25,0
Net bad debt write-off as a % of debtors’ book – retail 9,9 8,7
ROE (%) 35,0 22,5 26,9
Current ratio (times) 4,0 3,4
Debt:equity ratio (%) 40,0 27,1 33,5
Recourse debt:equity ratio (%) 11,6 17,4
Total liabilities to total equity (%) 68,4 78,4
Net borrowings to EBITDA (times) 0,7 0,7
Finance charge cover (times) 7,5 8,1
EBITDA finance charge cover (times) 8,6 9,0
Dividend cover (times) 1,8 1,9
Number of stores 1 627 1 539
Square metres 505 676 467 420
Stock turn (12-month average)
– jewellery 1,7 1,7
– @home 1,8 1,8
– other 3,2 3,2
FINANCIAL STATISTICS AND TARGETS
FINANCIAL HIGHLIGHTS AND SHARE PERFORMANCE
FOSC
HIN
I GRO
UP A
NN
UA
L REPORT 2010 - PA
GE 3
% change 2010 2009
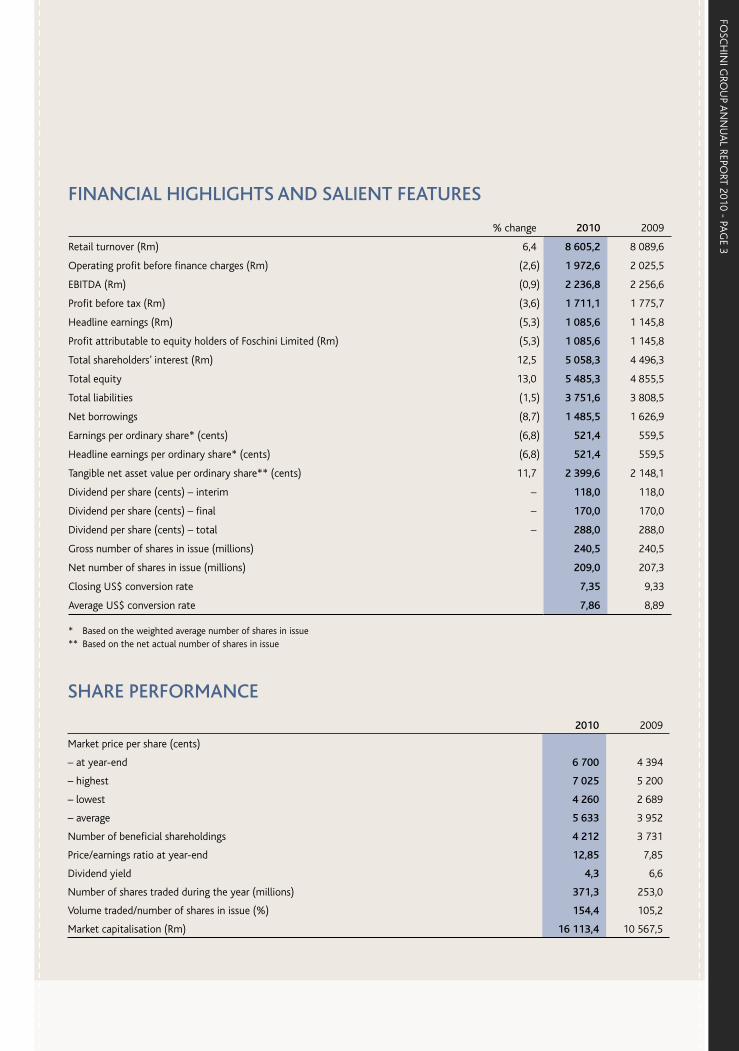
Retail turnover (Rm) 6,4 8 605,2 8 089,6
Operating profit before finance charges (Rm) (2,6) 1 972,6 2 025,5
EBITDA (Rm) (0,9) 2 236,8 2 256,6
Profit before tax (Rm) (3,6) 1 711,1 1 775,7
Headline earnings (Rm) (5,3) 1 085,6 1 145,8
Profit attributable to equity holders of Foschini Limited (Rm) (5,3) 1 085,6 1 145,8
Total shareholders’ interest (Rm) 12,5 5 058,3 4 496,3
Total equity 13,0 5 485,3 4 855,5
Total liabilities (1,5) 3 751,6 3 808,5
Net borrowings (8,7) 1 485,5 1 626,9
Earnings per ordinary share* (cents) (6,8) 521,4 559,5
Headline earnings per ordinary share* (cents) (6,8) 521,4 559,5
Tangible net asset value per ordinary share** (cents) 11,7 2 399,6 2 148,1
Dividend per share (cents) – interim – 118,0 118,0
Dividend per share (cents) – final – 170,0 170,0
Dividend per share (cents) – total – 288,0 288,0
Gross number of shares in issue (millions) 240,5 240,5
Net number of shares in issue (millions) 209,0 207,3
Closing US$ conversion rate 7,35 9,33
Average US$ conversion rate 7,86 8,89
* Based on the weighted average number of shares in issue** Based on the net actual number of shares in issue
FINANCIAL HIGHLIGHTS AND SALIENT FEATURES
2010 2009
Market price per share (cents)
– at year-end 6 700 4 394
– highest 7 025 5 200
– lowest 4 260 2 689
– average 5 633 3 952
Number of beneficial shareholdings 4 212 3 731
Price/earnings ratio at year-end 12,85 7,85
Dividend yield 4,3 6,6
Number of shares traded during the year (millions) 371,3 253,0
Volume traded/number of shares in issue (%) 154,4 105,2
Market capitalisation (Rm) 16 113,4 10 567,5
SHARE PERFORMANCE
FOSC
HIN
I GRO
UP A
NN
UA
L REPORT 2010 - PA
GE 4
CO
RPORATE STRU
CTU
RE
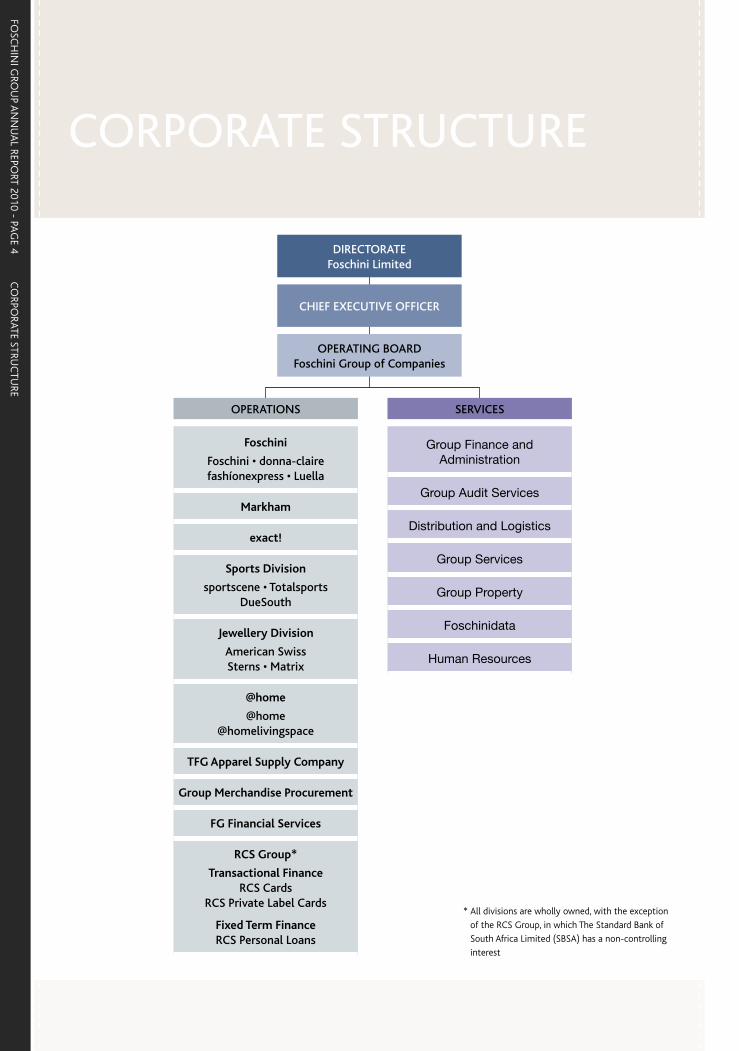
CORPORATE STRUCTURE
OPERATIONS
Foschini
Foschini • donna-clairefashíonexpress • Luella
Markham
exact!
Sports Division
sportscene • TotalsportsDueSouth
Jewellery Division
American SwissSterns • Matrix
@home
@home @homelivingspace
TFG Apparel Supply Company
Group Merchandise Procurement
FG Financial Services
RCS Group*
Transactional FinanceRCS Cards
RCS Private Label Cards
Fixed Term FinanceRCS Personal Loans
SERVICES
��������� �������������
������������ ��� �
�������������������
������� ��� �
���������� ���
���������
������ ����� �
DIRECTORATE Foschini Limited
CHIEF EXECUTIVE OFFICER
OPERATING BOARD Foschini Group of Companies
* All divisions are wholly owned, with the exception
of the RCS Group, in which The Standard Bank of
South Africa Limited (SBSA) has a non-controlling
interest
FOSC
HIN
I GRO
UP A
NN
UA
L REPORT 2010 - PA
GE 5
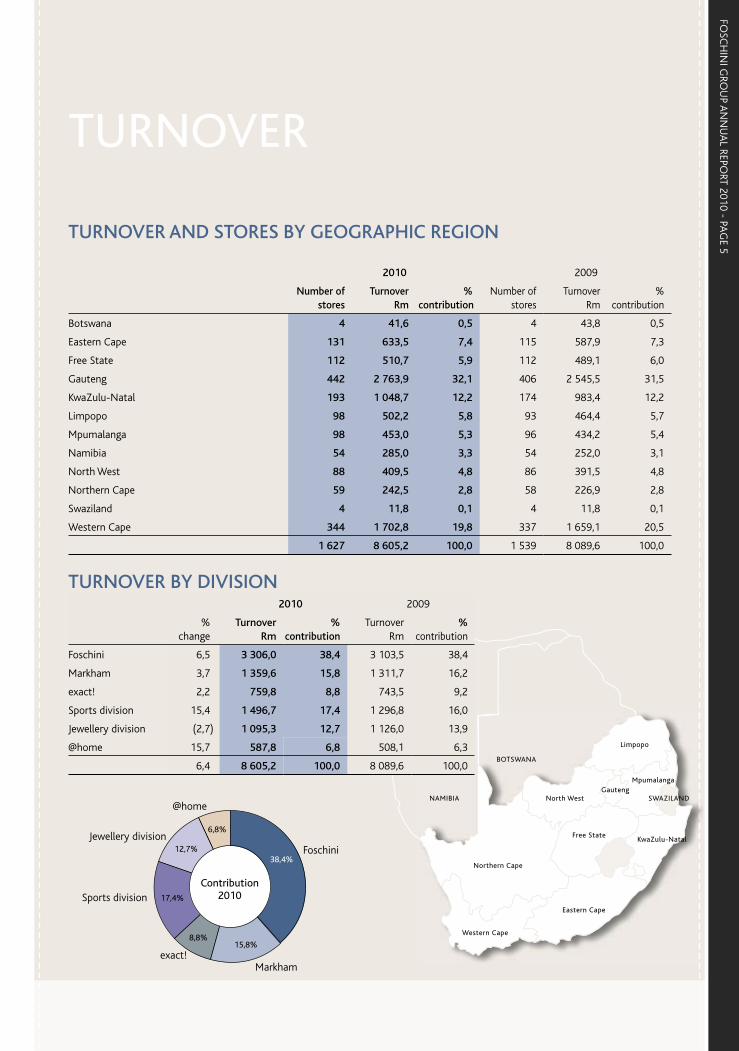
TURNOVER AND STORES BY GEOGRAPHIC REGION
2010 2009
Number of stores
Turnover Rm
% contribution
Number of stores
Turnover Rm
% contribution
Botswana 4 41,6 0,5 4 43,8 0,5
Eastern Cape 131 633,5 7,4 115 587,9 7,3
Free State 112 510,7 5,9 112 489,1 6,0
Gauteng 442 2 763,9 32,1 406 2 545,5 31,5
KwaZulu-Natal 193 1 048,7 12,2 174 983,4 12,2
Limpopo 98 502,2 5,8 93 464,4 5,7
Mpumalanga 98 453,0 5,3 96 434,2 5,4
Namibia 54 285,0 3,3 54 252,0 3,1
North West 88 409,5 4,8 86 391,5 4,8
Northern Cape 59 242,5 2,8 58 226,9 2,8
Swaziland 4 11,8 0,1 4 11,8 0,1
Western Cape 344 1 702,8 19,8 337 1 659,1 20,5
1 627 8 605,2 100,0 1 539 8 089,6 100,0
TURNOVER BY DIVISION2010 2009
% change
TurnoverRm
%contribution
TurnoverRm
%contribution
Foschini 6,5 3 306,0 38,4 3 103,5 38,4
Markham 3,7 1 359,6 15,8 1 311,7 16,2
exact! 2,2 759,8 8,8 743,5 9,2
Sports division 15,4 1 496,7 17,4 1 296,8 16,0
Jewellery division (2,7) 1 095,3 12,7 1 126,0 13,9
@home 15,7 587,8 6,8 508,1 6,3
6,4 8 605,2 100,0 8 089,6 100,0
NAMIBIA
Western Cape
Eastern Cape
Northern Cape
North West
Free StateKwaZulu-Natal
Mpumalanga
SWAZILANDGauteng
Limpopo
BOTSWANA
TURNOVER
Contribution2010
Foschini
Markhamexact!
Sports division
Jewellery division
@home
38,4%
15,8%8,8%
17,4%
12,7%
6,8%

FOSC
HIN
I GRO
UP A
NN
UA
L REPORT 2010 - PA
GE 6
FIVE YEA
RLY REVIEW
1989 – 2010
300
250
200
150
100
50
0
288,0
164,0
35,0
1989 1995 2000 2005 2010
242,0
FIVE YEARLY REVIEW 1989 – 2010
* Comparative figures have been restated in terms of the increased number of shares in issue resulting from sub-divisions and capitalisation issues.
Where applicable, earnings are shown before extraordinary/exceptional items.
From 2000 earnings are based on the weighted average number of shares in issue.
# In 1995 a scrip dividend was declared.
6 000
5 000
4 000
3 000
2 000
1 000
0
172,0
5 058,3
2 496,8
1 755,7
763,7
Equity attributable to equity holders of Foschini Limited (Rm)
1989 1995 2000 2005 2010
Turnover (Rm)
10 000
8 000
6 000
4 000
2 000
0
661,0
8 605,2
5 279,3
2 646,51 787,5
1989 1995 2000 2005 2010
Closing share price (cents)
8 000
7 000
6 000
5 000
4 000
3 000
2 000
1 000
0
254
6 700
3 555
1 360
2 200
1989 1995 2000 2005 2010
Attributable earnings (Rm)
1 200
1 000
800
600
400
200
0
55,6
1 085,6
767,0
233,3188,4
1989 1995 2000 2005 2010
Earnings per ordinary share (cents)*
600
500
400
300
200
100
0
25,3
521,4
359,6
100,181,4
1989 1995 2000 2005 2010
Cash dividends declared per ordinary share (cents)#
Number of stores
2 000
1 500
1 000
500
0
640
1 627
1 2331 088
863
1989 1995 2000 2005 2010

FOSC
HIN
I GRO
UP A
NN
UA
L REPORT 2010 - PA
GE 7
GROUP STATISTICSFoschini Limited and its subsidiariesYears ended 2010 2009 2008 2007 2006 2005 2004 2003 2002 2001
ProfitabilityRetail turnover (Rm) 8 605,2 8 089,6 7 668,7 7 230,0 6 432,1 5 279,3 4 410,0 3 880,6 3 289,9 2 980,5
Operating profit before finance charges (Rm) 1 972,6 2 025,5 1 905,5 1 887,0 1 567,3 1 204,8 814,6 582,0 348,5 202,7
Profit attributable to equity holders of Foschini Limited (Rm) 1 085,6 1 145,8 1 128,4 1 119,2 986,9 767,0 516,9 359,5 199,9 116,0
Headline earnings (Rm) 1 085,6 1 145,8 1 128,4 1 119,2 986,9 767,0 523,4 364,8 203,0 119,1
Statement of financial positionNon-current assets (Rm) 2 554,5 2 793,7 2 171,8 2 160,4 1 536,5 1 497,9 1 096,6 754,7 965,5 1 107,7
Current assets (Rm) 6 682,4 5 870,3 5 008,7 4 623,3 4 311,8 3 422,1 2 794,1 2 630,6 2 120,6 1 781,3
Total assets (Rm) 9 236,9 8 664,0 7 180,5 6 783,7 5 848,3 4 920,0 3 890,7 3 385,3 3 086,1 2 889,0
Total shareholders’ interest (Rm) 5 058,3 4 496,3 3 845,2 3 823,6 3 267,9 2 496,8 2 291,4 2 077,0 1 830,1 1 775,1
Non-controlling interest (Rm) 427,0 359,2 290,9 181,3 88,9 16,0 10,1 5,1 8,6 –
Non-current liabilities (Rm) 1 944,0 2 082,9 1 036,7 1 282,4 1 064,2 1 038,6 554,5 514,7 625,2 599,3
Current liabilities (Rm) 1 807,6 1 725,6 2 007,7 1 496,4 1 427,3 1 368,6 1 034,7 788,5 622,2 514,6
Total equity and liabilities (Rm) 9 236,9 8 664,0 7 180,5 6 783,7 5 848,3 4 920,0 3 890,7 3 385,3 3 086,1 2 889,0
Cash flow statementCash flows from operating activities (Rm) 364,5 319,9 (44,4) 99,3 (97,3) 86,7 289,9 288,3 121,4 66,1
Cash flows from investing activities (Rm) (270,3) (536,2) (52,2) (112,7) 51,5 (165,7) (187,3) (155,1) (166,6) (370,2)
Cash flows from financing activities (Rm) (106,4) 343,0 63,8 20,0 72,1 86,0 (100,6) (132,8) 46,7 352,2
Net (decrease) increase in cash (Rm) (12,2) 126,7 (32,8) 6,6 26,3 7,0 2,0 0,4 1,5 48,1
Cash at the beginning of the year (Rm)# 296,2 169,5 202,3* 62,5 36,2 29,2 27,2 26,8 175,3 127,2
Cash at the end of the year (Rm)# 284,0 296,2 169,5 69,1 62,5 36,2 29,2 27,2 176,8 175,3
# The figures from 2001 to 2002 comprise cash and cash equivalents, whereas those from 2003 onwards comprise cash only* In 2008 cash balances were restated to include an amount previously off-set against interest-bearing debt
Performance measures/ratiosTurnover growth (%) 6,4 5,5 6,1 12,4 21,8 19,7 13,6 18,0 10,4 12,6
Operating margin (%) 22,9 25,0 24,8 26,1 24,3 22,8 18,5 15,0 10,6 6,8
Debt:equity ratio (%) 27,1 33,5 36,2 18,8 16,2 12,7 4,0 8,6 17,1 15,1
Total liabilities to shareholders’ interest (times) 0,74 0,85 0,79 0,73 0,76 0,96 0,69 0,63 0,68 0,63
Current ratio (times) 4,0 3,4 2,5 3,1 3,0 2,5 2,7 3,3 3,4 3,5
Headline earnings per ordinary share (HEPS) (cents) 521,4 559,5 547,0 534,2 463,0 359,6 237,1 162,2 87,9 50,1
Change in HEPS (%) (6,8) 2,3 2,4 15,4 28,8 51,7 46,2 84,5 75,4 (50,0)
Dividends declared per ordinary share (DPS) (cents) 288,0 288,0 288,0 270,0 220,0 164,0 94,0 56,0 31,0 18,0
Tangible net asset value per ordinary share (cents) 2 399,6 2 148,1 1 862,7 1 789,4 1 523,4 1 165,0 1 039,1 917,8 803,4 731,6
Market capitalisation (Rm) 16 113,4 10 567,5 9 261,6 16 618,4 14 011,4 8 549,7 4 797,9 2 573,3 1 681,1 1 190,5
StatisticsNumber of ordinary shares in issue (millions) 240,5 240,5 240,5 240,5 240,5 240,5 240,5 240,5 240,5 240,5
Number of ordinary shares on which headline earnings per share is calculated (millions) 208,2 204,8 206,3 209,5 213,1 213,3 220,7 224,9 231,0 237,9
Net number of ordinary shares on which net asset value per share is calculated (millions) 209,0 207,3 204,6 212,0 212,6 211,9 218,4 223,6 226,3 240,5
Number of stores 1 627 1 539 1 393 1 332 1 273 1 233 1 197 1 188 1 185 1 207
Floor area (gross square metres) 505 676 467 420 410 378 380 615 354 747 334 662 323 459 317 381 310 166 309 188
Notes
When an accounting policy has been changed, comparative figures have been restated in accordance with the new policy.

FOSC
HIN
I GRO
UP A
NN
UA
L REPORT 2010 - PA
GE 8
DEFIN
ITION
S
DEFINITIONS
Credit transactions: RCS Group Comprises all loan advances and card purchases
Credit transactions: retail VAT inclusive credit retail turnover and income from sundry credit services
Current ratio Current assets divided by current liabilities
Debt:equity ratio Net borrowings expressed as a percentage of total equity
Dividend cover Basic earnings per share divided by dividend declared in respect of the relevant period
Doubtful debt provision as a % of debtors’ book Provision for doubtful debts expressed as a percentage of gross receivables
EBITDA Earnings before interest paid, tax, depreciation and amortisation
EBITDA finance charge cover EBITDA divided by interest paid
Finance charge cover Operating profit before finance charges divided by interest paid
Gross square metres Comprises the total leased store area including stockrooms
Headline earnings Net income attributable to ordinary shareholders adjusted for the effect, after tax, of exceptional items
Headline earnings per ordinary share
Headline earnings divided by the weighted average number of shares in issue for the
year
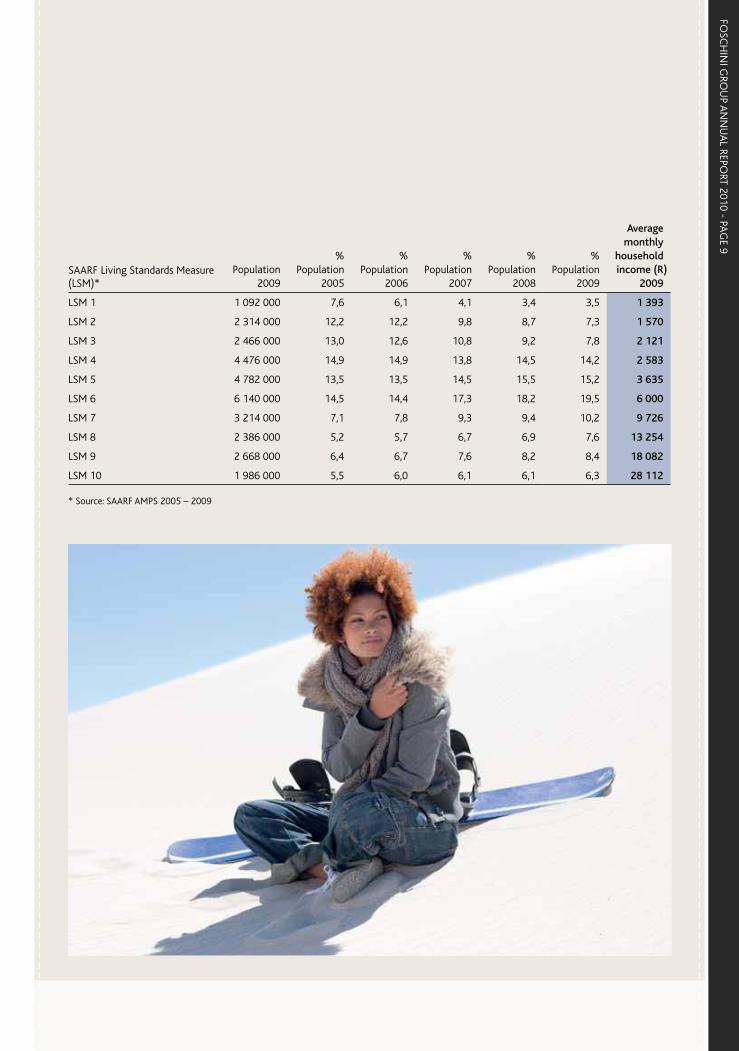
LSM Refers to the SAARF Universal Living Standards Measure which is a unique means of segmenting the South African market by dividing the population into 10 LSM groups, 1 (lowest) to 10 (highest). Refer table alongside
Market capitalisation The market price per share at the year-end multiplied by the number of ordinary shares in issue at the year-end
Net borrowings Interest-bearing debt, RCS Group external funding and non-controlling interest loans reduced by preference share investment and cash
Net bad debt and provision movement VAT exclusive bad debts including provision movement, net of recoveries
Net bad debt write-off: retail VAT inclusive bad debts, net of recoveries and excluding movement in provision in respect of the group’s retail receivables
Net bad debt write-off: RCS Group
VAT exclusive bad debts, net of recoveries and excluding movement in provision in respect of the receivables in the RCS Group
Net bad debt write-off as a % of credit transactions Net bad debt write-off expressed as a percentage of credit transactions
Net bad debt write-off as a % of debtors’ book Net bad debt write-off expressed as a percentage of gross receivables
Recourse debt:equity ratio Recourse debt reduced by preference share investment and cash, expressed as a percentage of total equity
Same store Stores which have traded for the full current and previous financial years out of the same trading area
Tangible net asset value per ordinary share
Total net asset value, after non-controlling interest, excluding goodwill and intangible
assets, divided by the net number of ordinary shares in issue at the year-end
Operating margin Operating profit before finance charges expressed as a percentage of retail turnover
FOSC
HIN
I GRO
UP A
NN
UA
L REPORT 2010 - PA
GE 9
SAARF Living Standards Measure (LSM)*
Population 2009
% Population
2005
% Population
2006
% Population
2007
% Population
2008
% Population
2009
Average monthly
household income (R)
2009
LSM 1 1 092 000 7,6 6,1 4,1 3,4 3,5 1 393
LSM 2 2 314 000 12,2 12,2 9,8 8,7 7,3 1 570
LSM 3 2 466 000 13,0 12,6 10,8 9,2 7,8 2 121
LSM 4 4 476 000 14,9 14,9 13,8 14,5 14,2 2 583
LSM 5 4 782 000 13,5 13,5 14,5 15,5 15,2 3 635
LSM 6 6 140 000 14,5 14,4 17,3 18,2 19,5 6 000
LSM 7 3 214 000 7,1 7,8 9,3 9,4 10,2 9 726
LSM 8 2 386 000 5,2 5,7 6,7 6,9 7,6 13 254
LSM 9 2 668 000 6,4 6,7 7,6 8,2 8,4 18 082
LSM 10 1 986 000 5,5 6,0 6,1 6,1 6,3 28 112
* Source: SAARF AMPS 2005 – 2009

FOSC
HIN
I GRO
UP A
NN
UA
L REPORT 2010 - PA
GE 10
DIREC
TORATE
EXECUTIVE DIRECTORATE
A D MURRAY (53) BA, CA
Appointed: 2007
Member of: Risk and Transformation committees
Meetings attended by invitation: Audit, Remuneration and Nominations committees
Joined the group: 1985
Doug joined the group in 1985 and was appointed as an executive director of Foschini Limited in 2007. He is currently the chief executive officer of the group, a position he has held since 1 January 2008.
Doug has extensive retail experience, having previously held the positions of MD of Pages (subsequently rebranded exact!) and American Swiss Jewellers. He was appointed to the operating board in 1997 and served as the retail director of the group for eight years prior to his appointment as CEO.
R STEIN (60) B Comm, CA(SA)
Appointed: 1999
Member of: Risk committee
Meetings attended by invitation: Audit and Transformation committees
Joined the group: 1996
Ronnie is currently the group financial director. He joined the group in 1996 and was appointed to the operating board in 1997. Prior to joining the group he was an accountant and auditor in public practice. He was a partner at Kessel Feinstein for 15 years.
P S MEIRING (54)
Appointed: 2009
Joined the group: 1983
Peter is currently the managing director of the group’s financial services division, a position he has held since 1998. He was appointed to the operating board in 1999. He also holds the position of chairman of the RCS Group. Peter has extensive experience in consumer credit lending. He also has experience in information technology, specifically financial systems. He has held various roles in the group’s IT department, as well as within Pages (subsequently rebranded exact!) before moving to the financial services division in 1992.
FOSC
HIN
I GRO
UP A
NN
UA
L REPORT 2010 - PA
GE 11
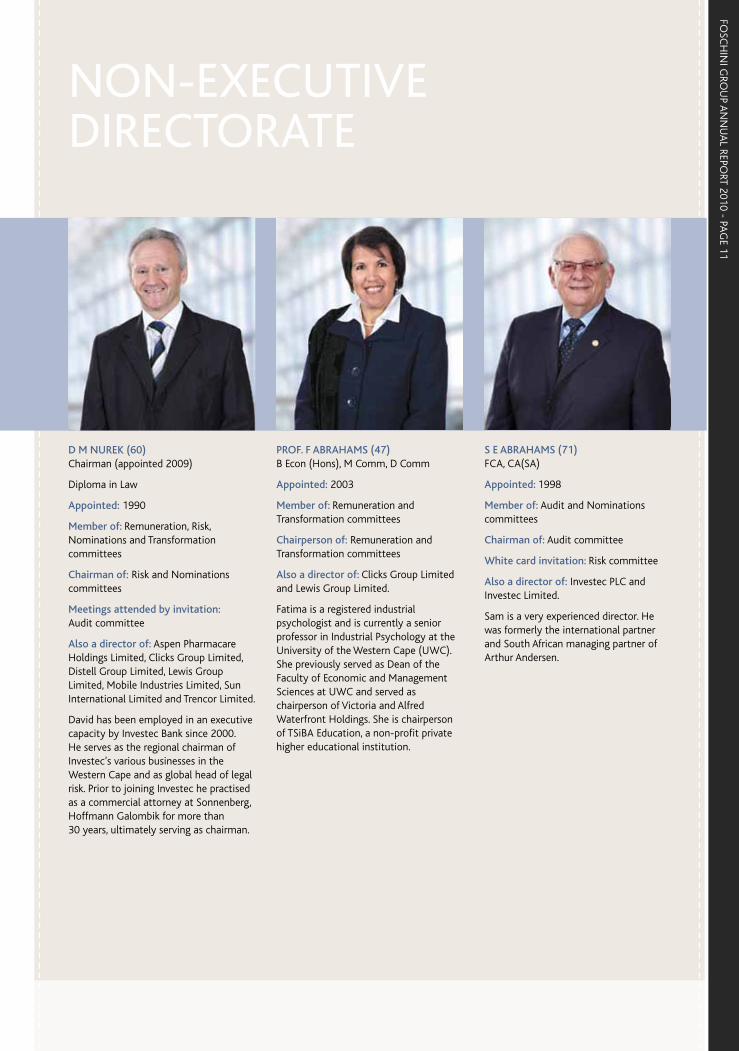
NON-EXECUTIVE DIRECTORATE
D M NUREK (60) Chairman (appointed 2009)
Diploma in Law
Appointed: 1990
Member of: Remuneration, Risk, Nominations and Transformation committees
Chairman of: Risk and Nominations committees
Meetings attended by invitation: Audit committee
Also a director of: Aspen Pharmacare Holdings Limited, Clicks Group Limited, Distell Group Limited, Lewis Group Limited, Mobile Industries Limited, Sun International Limited and Trencor Limited.
David has been employed in an executive capacity by Investec Bank since 2000. He serves as the regional chairman of Investec’s various businesses in the Western Cape and as global head of legal risk. Prior to joining Investec he practised as a commercial attorney at Sonnenberg, Hoffmann Galombik for more than 30 years, ultimately serving as chairman.
PROF. F ABRAHAMS (47) B Econ (Hons), M Comm, D Comm
Appointed: 2003
Member of: Remuneration and Transformation committees
Chairperson of: Remuneration and Transformation committees
Also a director of: Clicks Group Limited and Lewis Group Limited.
Fatima is a registered industrial psychologist and is currently a senior professor in Industrial Psychology at the University of the Western Cape (UWC). She previously served as Dean of the Faculty of Economic and Management Sciences at UWC and served as chairperson of Victoria and Alfred Waterfront Holdings. She is chairperson of TSiBA Education, a non-profit private higher educational institution.
S E ABRAHAMS (71) FCA, CA(SA)
Appointed: 1998
Member of: Audit and Nominations committees
Chairman of: Audit committee
White card invitation: Risk committee
Also a director of: Investec PLC and Investec Limited.
Sam is a very experienced director. He was formerly the international partner and South African managing partner of Arthur Andersen.

FOSC
HIN
I GRO
UP A
NN
UA
L REPORT 2010 - PA
GE 12
DIREC
TORATE C
ON
TINU
ED
W V CUBA (55) BSc (Land Surveying), BSc (Info. Systems), MBA
Appointed: 1998
Member of: Audit committee
Also a director of: Vox Telecom Limited.
Vuli has extensive business consulting experience having previously been employed by Accenture and Monitor Consulting. He is currently president and chairman of NGN Telecoms, a voice and data telephony business he founded in 2001. Prior to this he was the founder and head of Octagon, a business consulting and training organisation, as well as founding MTA Consulting. In 2008 he left Safika Holdings, a widely respected investment company which he co-founded in 1995 which specialises in taking an equity interest in black economic empowerment-driven transactions.
K N DHLOMO (37) BA (Comm, Ind. Psych.), MBA
Appointed: 2009
Member of: Audit committee
Khanyi is the founding manager of Ndalo Media (a media company she co-owns with Media24) which publishes print and digital products, as well as being the founding editor of Destiny, a business and lifestyle magazine for women. Prior to this she held various media-related roles, including editor of True Love, and also served as the manager of SA Tourism in France. She also serves on the Advisory Council of the University of Stellenbosch Business School and serves as Patron of Orion, a non-profit therapeutic and training centre for people with mental, physical and intellectual disabilities. She was chosen as a Young Global Leader for 2010 by the World Economic Forum.
M LEWIS (51)BA (Econ) (Hons)
Appointed: 1989
Member of: Nominations committee
Michael has been a non-executive director of Foschini Limited since 1989.
He is currently the chairman of Oceana Investment Corporation Limited, a private UK investment company. He is chairman of Strandbags Group (Proprietary) Limited, an Australian retail company comprising some 400 stores. Michael is also chairman of ProChon Biotech Limited, an Israeli-based biotechnology company.
NON-EXECUTIVE DIRECTORATE
FOSC
HIN
I GRO
UP A
NN
UA
L REPORT 2010 - PA
GE 13
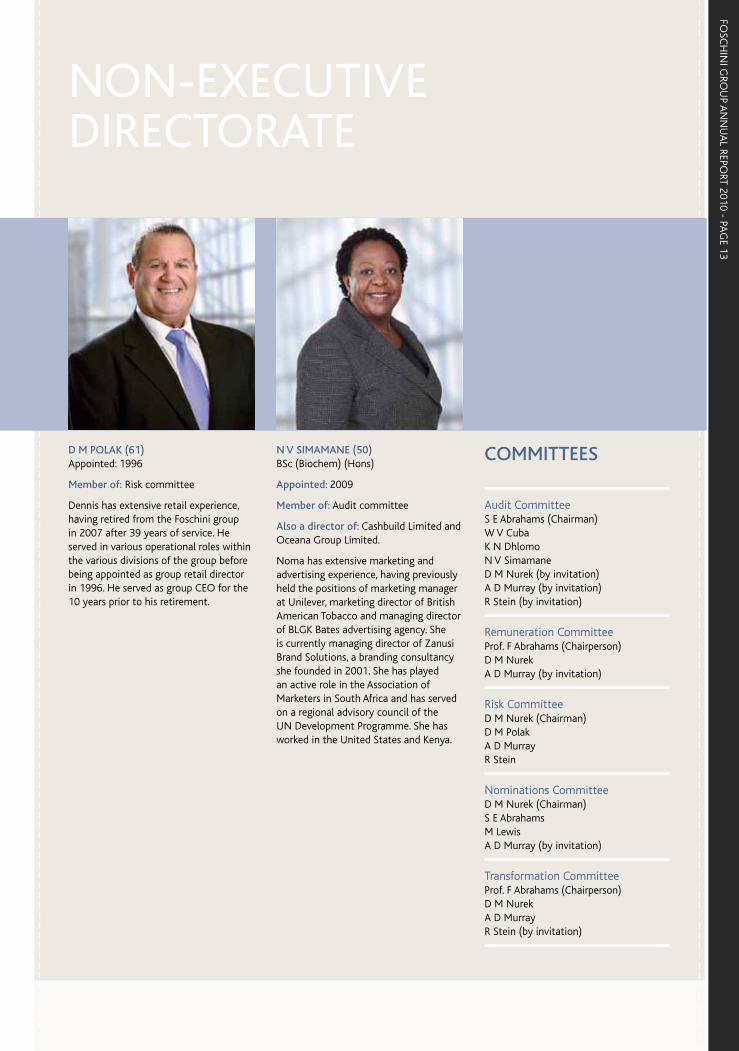
D M POLAK (61) Appointed: 1996
Member of: Risk committee
Dennis has extensive retail experience, having retired from the Foschini group in 2007 after 39 years of service. He served in various operational roles within the various divisions of the group before being appointed as group retail director in 1996. He served as group CEO for the 10 years prior to his retirement.
N V SIMAMANE (50) BSc (Biochem) (Hons)
Appointed: 2009
Member of: Audit committee
Also a director of: Cashbuild Limited and Oceana Group Limited.
Noma has extensive marketing and advertising experience, having previously held the positions of marketing manager at Unilever, marketing director of British American Tobacco and managing director of BLGK Bates advertising agency. She is currently managing director of Zanusi Brand Solutions, a branding consultancy she founded in 2001. She has played an active role in the Association of Marketers in South Africa and has served on a regional advisory council of the UN Development Programme. She has worked in the United States and Kenya.
COMMITTEES
Audit CommitteeS E Abrahams (Chairman) W V Cuba K N Dhlomo N V SimamaneD M Nurek (by invitation) A D Murray (by invitation) R Stein (by invitation)
Remuneration CommitteeProf. F Abrahams (Chairperson) D M Nurek A D Murray (by invitation)
Risk CommitteeD M Nurek (Chairman) D M Polak A D Murray R Stein
Nominations CommitteeD M Nurek (Chairman) S E Abrahams M Lewis A D Murray (by invitation)
Transformation CommitteeProf. F Abrahams (Chairperson) D M Nurek A D Murray R Stein (by invitation)
NON-EXECUTIVE DIRECTORATE

FOSC
HIN
I GRO
UP A
NN
UA
L REPORT 2010 - PA
GE 14
OPERATIN
G BO
ARD
& EX
ECU
TIVE M
AN
AG
EMEN
T
OPERATING BOARD & EXECUTIVE MANAGEMENT
L to R: H B Godfrey, M Mendelsohn, A D Murray, D B Gedye, B J Curry, G S Naidoo, R Stein, A R Bisogno and P S Meiring
FOSC
HIN
I GRO
UP A
NN
UA
L REPORT 2010 - PA
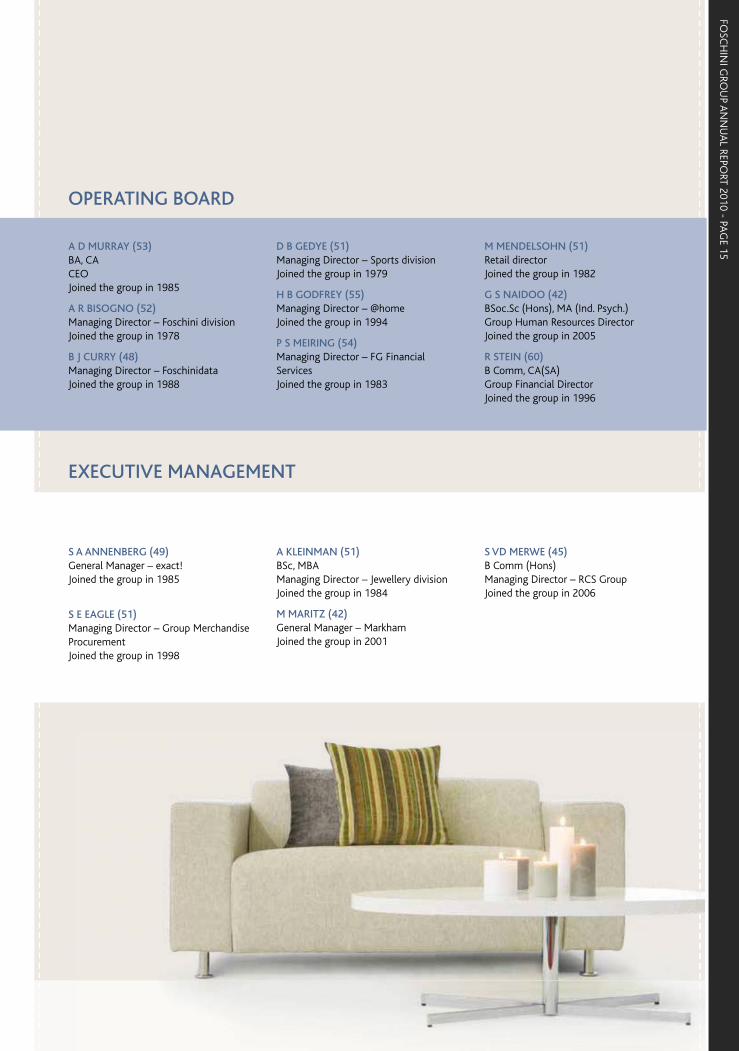
GE 15A D MURRAY (53)
BA, CA CEO Joined the group in 1985
A R BISOGNO (52)Managing Director – Foschini division Joined the group in 1978
B J CURRY (48)Managing Director – Foschinidata Joined the group in 1988
D B GEDYE (51)Managing Director – Sports division Joined the group in 1979
H B GODFREY (55)Managing Director – @home Joined the group in 1994
P S MEIRING (54)Managing Director – FG Financial Services Joined the group in 1983
M MENDELSOHN (51)Retail director Joined the group in 1982
G S NAIDOO (42)BSoc.Sc (Hons), MA (Ind. Psych.) Group Human Resources Director Joined the group in 2005
R STEIN (60)B Comm, CA(SA) Group Financial Director Joined the group in 1996
S A ANNENBERG (49)General Manager – exact! Joined the group in 1985
S E EAGLE (51)Managing Director – Group Merchandise ProcurementJoined the group in 1998
A KLEINMAN (51)BSc, MBA Managing Director – Jewellery division Joined the group in 1984
M MARITZ (42)General Manager – Markham Joined the group in 2001
S VD MERWE (45)B Comm (Hons) Managing Director – RCS Group Joined the group in 2006
OPERATING BOARD
EXECUTIVE MANAGEMENT

FOSC
HIN
I GRO
UP A
NN
UA
L REPORT 2010 - PA
GE 16
CH
AIRM
AN
’S REPORT
FOSC
HIN
I GRO
UP A
NN
UA
L REPORT 2010 - PA
GE 17
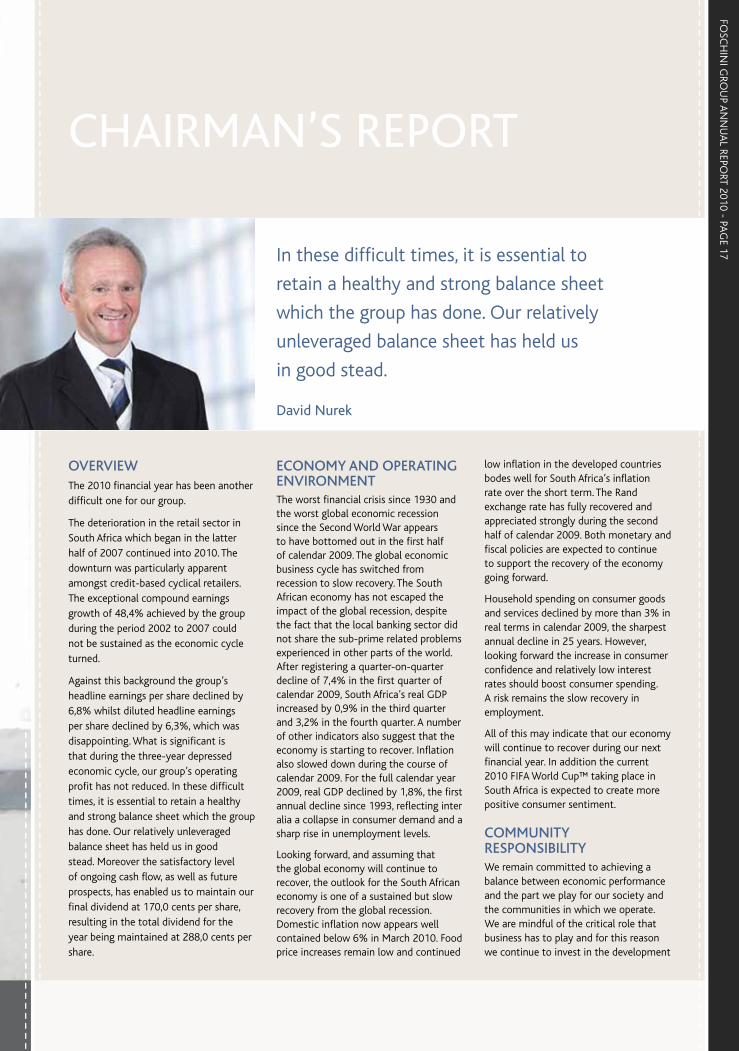
OVERVIEWThe 2010 financial year has been another difficult one for our group.
The deterioration in the retail sector in South Africa which began in the latter half of 2007 continued into 2010. The downturn was particularly apparent amongst credit-based cyclical retailers. The exceptional compound earnings growth of 48,4% achieved by the group during the period 2002 to 2007 could not be sustained as the economic cycle turned.
Against this background the group’s headline earnings per share declined by 6,8% whilst diluted headline earnings per share declined by 6,3%, which was disappointing. What is significant is that during the three-year depressed economic cycle, our group’s operating profit has not reduced. In these difficult times, it is essential to retain a healthy and strong balance sheet which the group has done. Our relatively unleveraged balance sheet has held us in good stead. Moreover the satisfactory level of ongoing cash flow, as well as future prospects, has enabled us to maintain our final dividend at 170,0 cents per share, resulting in the total dividend for the year being maintained at 288,0 cents per share.
ECONOMY AND OPERATING ENVIRONMENT The worst financial crisis since 1930 and the worst global economic recession since the Second World War appears to have bottomed out in the first half of calendar 2009. The global economic business cycle has switched from recession to slow recovery. The South African economy has not escaped the impact of the global recession, despite the fact that the local banking sector did not share the sub-prime related problems experienced in other parts of the world. After registering a quarter-on-quarter decline of 7,4% in the first quarter of calendar 2009, South Africa’s real GDP increased by 0,9% in the third quarter and 3,2% in the fourth quarter. A number of other indicators also suggest that the economy is starting to recover. Inflation also slowed down during the course of calendar 2009. For the full calendar year 2009, real GDP declined by 1,8%, the first annual decline since 1993, reflecting inter alia a collapse in consumer demand and a sharp rise in unemployment levels.
Looking forward, and assuming that the global economy will continue to recover, the outlook for the South African economy is one of a sustained but slow recovery from the global recession. Domestic inflation now appears well contained below 6% in March 2010. Food price increases remain low and continued
low inflation in the developed countries bodes well for South Africa’s inflation rate over the short term. The Rand exchange rate has fully recovered and appreciated strongly during the second half of calendar 2009. Both monetary and fiscal policies are expected to continue to support the recovery of the economy going forward.
Household spending on consumer goods and services declined by more than 3% in real terms in calendar 2009, the sharpest annual decline in 25 years. However, looking forward the increase in consumer confidence and relatively low interest rates should boost consumer spending. A risk remains the slow recovery in employment.
All of this may indicate that our economy will continue to recover during our next financial year. In addition the current 2010 FIFA World Cup™ taking place in South Africa is expected to create more positive consumer sentiment.
COMMUNITY RESPONSIBILITYWe remain committed to achieving a balance between economic performance and the part we play for our society and the communities in which we operate. We are mindful of the critical role that business has to play and for this reason we continue to invest in the development
David Nurek
In these difficult times, it is essential to
retain a healthy and strong balance sheet
which the group has done. Our relatively
unleveraged balance sheet has held us
in good stead.
CHAIRMAN’S REPORT

FOSC
HIN
I GRO
UP A
NN
UA
L REPORT 2010 - PA
GE 18
CH
AIRM
AN
’S REPORT C
ON
TINU
ED
GOVERNANCEThe directors consider responsible corporate governance to be integral to the success of the group and our commitment to it is outlined in our corporate governance report, which appears elsewhere in this annual report.
Assessment starts at the top with a comprehensive annual peer review of the performance of all board directors, as well as of the board itself and its various sub-committees. These sub-committees, which cover the fields of audit, remuneration, risk, nominations and transformation, maintain diligent oversight of all significant factors within their purview. The group has formulated and abides by a code of ethics which includes a set of clear goals to achieve in its relationships with customers, suppliers, staff, the general public and the communities among which we operate. The increasingly complex field of compliance with the laws and regulations governing our businesses is another among the many issues on the governance agenda.
of society. We make charitable donations to more than 100 national and local non-governmental organisations, with our primary focus areas being education; skills development; arts, culture and the environment; special projects and combating HIV/AIDS, with specific emphasis on women and children. Full details of our CSI endeavours are covered elsewhere in this annual report.
TRANSFORMATIONOur Transformation Committee has the task of driving the group’s broad-based black economic empowerment (BBBEE) strategy into the future. Our various internal transformation sub-committees tackle, on a daily basis, the various issues underlying BBBEE in order to ensure that our group plays its rightful role in the advancement of historically disadvantaged communities. I am pleased to note that in the Financial Mail’s Top Empowerment Companies Report of 2010, our group has once again fared well.

FOSC
HIN
I GRO
UP A
NN
UA
L REPORT 2010 - PA
GE 19
Following the publication of the King III Code of Corporate Governance, management has reviewed current practices relevant to the code. In the current financial statements the group has early adopted many aspects of King III, the balance of which will be dealt with in the new financial year.
We recognise that integrated sustainability reporting is not simply a question of including a sustainability section within our annual report. Instead, it is about demonstrating that the material sustainability issues have been integrated across all areas of the group’s performance and have influenced the strategic decisions adopted by the board. With this understanding in mind, in this annual report we have integrated our review of our sustainability performance within each of the sections of the report.
An important aim of our annual report is to enable our stakeholders to understand the key social, economic and environmental issues that affect the company and to appreciate the impact, both positive and negative, of
our operations on the social, economic and environmental well-being of the community. We seek to do this by providing a material account of our performance over the year, as well as by looking forward and outlining some of our future commitments in this area.
LOOKING AHEADNotwithstanding the difficult environment, we expect the South African economy to continue improving, particularly in the second half of the next financial year. The 2010 FIFA World Cup™ currently taking place should be the catalyst for some improvement in consumer sentiment which together with the reduced interest rate environment should improve consumer spending. Our group remains in good shape and is well positioned to take advantage of the upturn in our economy.
THANKSOn behalf of the board I wish to extend deep appreciation and thanks to:
• all employees for their excellent performance during an extremely challenging year;
• our customers for their continued loyal support;
• our shareholders for their support and confidence in the future of the group;
• our suppliers, advisers and business associates for their co-operation and contribution to the growth of the business; and
• my fellow directors for their insight, guidance and valuable input.
David NurekChairman
21 June 2010
CHAIRMAN’S REPORT

FOSC
HIN
I GRO
UP A
NN
UA
L REPORT 2010 - PA
GE 20
TRIBUTE TO
STAN
LEY LEWIS
Stanley Lewis
FOSC
HIN
I GRO
UP A
NN
UA
L REPORT 2010 - PA
GE 21
Over a period of 40 years, Stanley Lewis’ name became synonymous with Foschini of which he held the positions of managing director and also chairman during the course of these years. In 1958, Stanley Lewis bought a major shareholding in Foschini, which was then a struggling company suffering losses but which company over the ensuing years, he led and built into one of the leading retail chains of South Africa.
When he took control of Foschini, it was badly in need of a new imaginative and motivated approach – this, plus more he brought to the business. By 1960, under his leadership, Foschini had eliminated its losses and by 1966 it was nominated as one of the Financial Mail’s top 100
companies, a distinction which it has repeatedly earned.
Under his dynamic and entrepreneurial leadership, Foschini expanded and developed, at the same time seeking new opportunities and approaches. Over the years, the company inter alia acquired American Swiss Jewellers, Markhams (rebranded as Markham), Sterns and sportscene. It also established Pages (rebranded as exact!), in the process building Foschini into a group which today has over 1 600 stores in southern Africa, supported by a solid financial base and leading-edge technology.
A philosopher once said that the six essential qualities of success are wisdom, imagination, sincerity, personal integrity,
humility and charity. Stanley Lewis was generously endowed with all these fine qualities and through these qualities, this quintessential retailer became such a respected and much loved leader of the group.
People loved him because he was a team player who knew how to lead. He loved to play and watch sport and saw it as the ultimate in team work which he brought to his business life.
Although he retired as chairman in 1998, he always remained close to the group and looked back with great pride and satisfaction on the way he built Foschini into the great company it is. It is poignant that he passed away on the day of Foschini’s 2009 annual general meeting.
Businessman extraordinaire and generous benefactor, Stanley Lewis, passed
away in London on 9 September 2009, aged 86 years, survived by Zea, his
wife of 61 years and his four children.
TRIBUTE TO STANLEY LEWIS

FOSC
HIN
I GRO
UP A
NN
UA
L REPORT 2010 - PA
GE 22
CH
IEF EXEC
UTIV
E OFFIC
ER’S REPORT
FOSC
HIN
I GRO
UP A
NN
UA
L REPORT 2010 - PA
GE 23
CHIEF EXECUTIVE OFFICER’S REPORT
GROUP OVERVIEWThis financial year has been difficult and volatile for our group with consumer spending worsening during the second half of the year. The significantly higher than projected unemployment figures have also had a negative impact on our sector.
Our group trades in the mass middle market space and our customers are severely impacted by the current economic climate, more so than those consumers in the higher LSM brackets. Although interest rates and inflation have continued to drop, this has not yet translated into increased consumer spending which remains under pressure.
In the context of the economic climate which prevailed during the year we believe our result is slightly disappointing. After six exceptional years from 2002 to 2007 when our compound HEPS grew at 48,4%, the economic cycle turned and we have now completed the third year in the current down cycle. Notwithstanding that this current downturn is arguably the worst experienced by South Africa since 1930 we have nevertheless managed over these three years to increase our operating profit before finance charges from R1 887 million to R1 973 million.
The first half of the year produced turnover growth of 7,9% and an increase in headline earnings per share of 1,5%
whilst the second half worsened with turnover growth of 5% and a reduction in headline earnings per share of 12,6%. With consumer spending worsening during the second half, Christmas trade was at the lower level of our expectations which clearly impacted performance in this half. For the year as a whole turnover increased by 6,4% while headline earnings per share decreased by 6,8%. Diluted headline earnings per share decreased by 6,3%. Our final dividend has been maintained at 170,0 cents per share with a full year dividend also maintained at 288,0 cents per share.
Foschini stores, which represents 30% of our group retail turnover, had a mixed year with better growth in the first half. Its repositioning and turnaround strategy is taking longer than initially anticipated, but significant progress has been made, which positions this brand well for future growth.
Our RCS subsidiary which is an operationally independent consumer finance business, mainly as a result of the worldwide banking crisis, restructured its activities to operate during the year without any new funds being provided. This it did successfully, growing its earnings by 11,5%. In order to secure new sources of funding other than from its shareholders, RCS Group went to the market with its DMTN (domestic medium-term note) programme and
was successful in raising R303 million of funding in a mixture of long- (four years) and short-term (12 months) paper. Subsequent to the year-end an additional R250 million has been placed on a seven-year term. This new funding will allow RCS Group to return to its growth potential in the future and will, in time, lessen its reliance on funding from the Foschini group.
Being now three years into the downturn, indications are that the economy will soon start to slowly recover. Our group is well positioned to enable us to maximise our returns when the economy recovers. Our retail debtors’ book which is our group’s largest asset, continues to be well managed notwithstanding the tough consumer environment. Whilst bad debt as a percentage of the debtors’ book increased to 9,9%, this is already showing a downward trend.
Our costs were again well controlled this year which will remain a focus going forward.
TRADING ENVIRONMENTDuring the year consumers remained under significant strain with consumer sentiment driven by job losses, shorter working hours and a large increase in electricity prices. Nearly 900 000 jobs were lost in calendar year 2009, with a further 171 000 lost jobs in the first
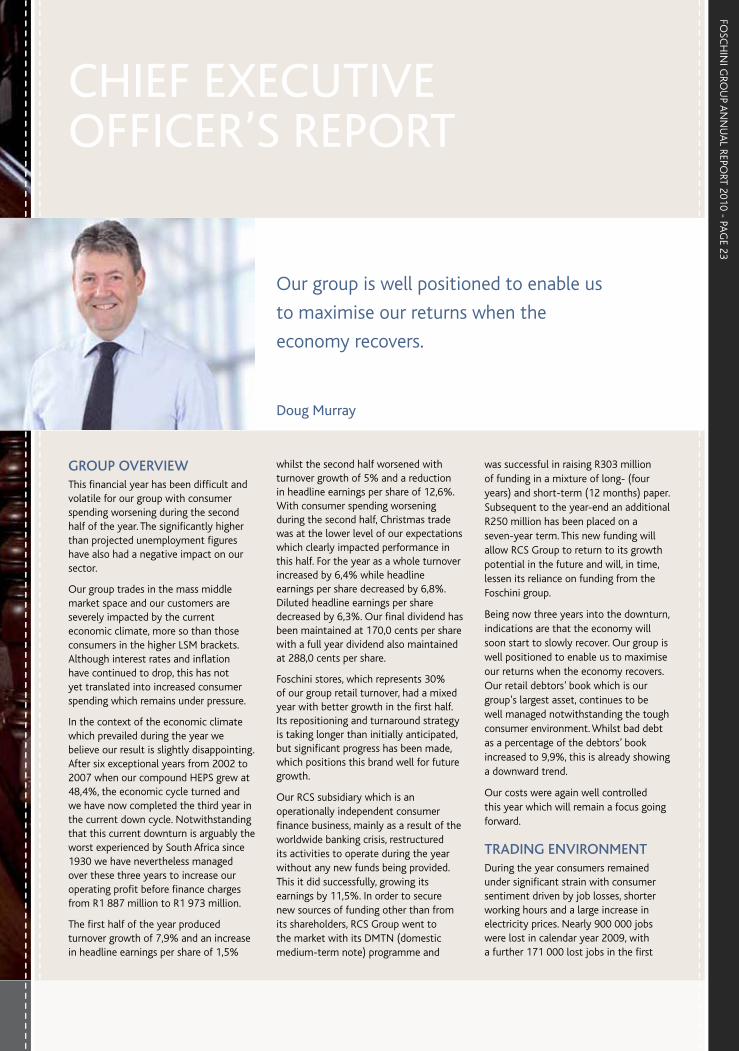
Doug Murray
Our group is well positioned to enable us
to maximise our returns when the
economy recovers.
FOSC
HIN
I GRO
UP A
NN
UA
L REPORT 2010 - PA
GE 24
CH
IEF EXEC
UTIV
E OFFIC
ER’S REPORT C
ON
TINU
ED
quarter of calendar year 2010. These job losses were significantly worse than initially projected.
Looking ahead, continued unemployment and associated factors in our economy remains our biggest potential risk.
FINANCIAL PERFORMANCEWhilst the group’s detailed financial performance for the year is described in the financial director’s report, I would like to draw attention to the following:
• operating profit before finance charges and tax almost R2 billion;
• the total dividend being maintained at 288,0 cents per share;
• solid performance from our retail debtors’ book; and
• strong financial position.
Whilst turnover growth in the first half was 7,9%, consumer spending continued to deteriorate in the second half with turnover growth of 5,0%, resulting in growth of 6,4% for the year as a whole. Retail turnover and growths in the various trading divisions are illustrated in the table above.
Same store turnover was flat, whilst product inflation averaged approximately 6% for the year.
Credit sales as a percentage of total sales increased to 62,6% from 61,8%.
Our @home division continued with its expansion, opening a further seven stores, three of which were the larger @homelivingspace stores. Turnover grew by 15,7% to R587,8 million. Same store turnover for the year reduced by 6,3% driven by slower sales and further cannibalisation caused by the rapid roll-out of the larger format stores. This cannibalisation is taken into account in the viabilities of all these new stores.
exact! which offers contemporary and modern fashion for South African families in the LSM 5 – 7 categories grew its store base during the year from 198 to 205, growing its clothing turnover for the year by 3,9% while its cellphone turnover reduced by 5,2%. Clothing same store turnover growth was -2,7%, whilst total same store turnover growth was -4,2%. In adding more authenticity and detail to their garments, product prices crept upwards which adversely affected sales. Focus has been placed on managing pricing architecture which
has been particularly successful since its implementation in the new financial year.
The Foschini division comprising Foschini, donna-claire, fashíonexpress and Luella had a mixed year with a much better growth in the first half of the year than the second half. Clothing turnover grew by 6,9% with clothing same store turnover of 2,1%. After a stronger first half, the Foschini brand suffered from a lack of casual product in the summer season. Whilst the smarter brands such as Oasis and WWW struggled, the more casual labels such as News and Instinct fared much better. The fashíonexpress brand performed well whilst donna-claire had a disappointing year. Cosmetics turnover growth increased by 12,8%. Turnover of cellphones reduced by 7,9% whilst same store cellphone turnover reduced by 11,5%. Total same store turnover grew by 1,9%. Although significant progress has been made in the repositioning and turnaround of Foschini stores, this is taking longer than initially anticipated. I believe, however, that the progress made positions this brand well for future growth.
This division added 27 new stores and now trades out of 454 locations across its various brands.
The Jewellery division comprising American Swiss, Sterns and Matrix had acceptable performance in the current difficult climate. Jewellery merchandise turnover reduced by 1,2% whilst jewellery same store turnover reduced
TRADING PERFORMANCE
Number of
stores
Retail turnover
Rm%
change
@home 78 587,8 15,7
exact! 205 759,8 2,2
Foschini 454 3 306,0 6,5
Jewellery division 365 1 095,3 (2,7)
Markham 234 1 359,6 3,7
Sports division 291 1 496,7 15,4
Total 1 627 8 605,2 6,4
FOSC
HIN
I GRO
UP A
NN
UA
L REPORT 2010 - PA
GE 25
by 4,9%. Cellphone same store turnover reduced by 13,1% whilst total same store turnover reduced by 6,1%. This division remains the dominant player in the mass middle market jewellery sector with American Swiss Jewellers being the largest jewellery chain in southern Africa, followed by Sterns. This division increased its store base by 17 stores to 365 stores.
The Markham division traded satisfactorily in the current climate with clothing turnover growth of 4,9%, whilst cellphone turnover was -4,8%. Total same store turnover was flat. Its store base increased by 12 stores to 234 stores.
The Sports division, trading as Totalsports, sportscene and DueSouth traded well in the current climate with turnover growth of 15,4% and same store turnover growth of 6,1%, maintaining its position as a market leader. Its store base increased by 27 stores to 291
stores. This is an exciting period for this division with the 2010 FIFA World Cup™ currently under way. It has spared no effort to prepare itself for this historic event. The three largest organisations active internationally in sportswear have officially recognised Totalsports as a preferred partner for the 2010 FIFA World Cup™.
FG Financial Services – manages the group’s in-store credit card programme, as well as handling the group’s financial service products such as Club and associated magazines, as well as insurance products. The consumer environment remains tough with many consumers without jobs or working fewer days. Anticipated defaults by customers grew as the incidence of customers resorting to bad debt counsellors for relief increased. Net bad debt as a percentage of debtors’ book increased to 9,9%, but this is already showing a downward trend.
CHIEF EXECUTIVE OFFICER’S REPORT
Our retail debtors’ book, which amounts to R3,2 billion, increased by 15,4% during the year and remains in good shape.
RCS GROUPThe RCS Group is an operationally independent consumer finance business that provides a broad range of financial services under its own brand in South Africa, Namibia and Botswana. It is structured into two operating business units, namely Transactional Finance and Fixed Term Finance. The Transactional Finance business comprises the RCS general-purpose card and other private label card programmes, whilst the Fixed Term Finance business comprises RCS Personal loans.
The RCS Group, which experienced a challenging year last year, performed far better this year with net profit before tax increasing by 11,5% to R225,9 million. The quality of new business written

FOSC
HIN
I GRO
UP A
NN
UA
L REPORT 2010 - PA
GE 26
CH
IEF EXEC
UTIV
E OFFIC
ER’S REPORT C
ON
TINU
ED
during the year has continued to improve with net bad debt as a percentage of debtors’ book reducing to 12,3% from 14,1% last year.
As referred to earlier in my report, RCS Group has been successful in raising in excess of R550 million with its DMTN (domestic medium-term note) programme which will allow RCS Group to return to its growth potential.
Our group’s shareholding in the RCS Group is 55% with the balance being held by The Standard Bank of South Africa Limited.
INVESTING FOR LONG-TERM GROWTHNotwithstanding our awareness of the economic downturn, we decided at the beginning of 2009 to continue investing in new store expansion in order to position ourselves favourably for the future when the economy improves.
Our targeted trading space growth for our 2009 and 2010 financial years was 24%. Whilst we fell a little short of this target, we were successful in adding 22% new trading space over the two years.
During the current year we grew our trading space by 8,1% across all our brands, adding 100 new stores, whilst closing 12 stores.
In line with our strategy of investing for the longer term, we anticipate opening in excess of 100 new stores in the year ahead.
STRATEGYThe continuing strategic focus across our divisions is to improve our customers’ experience through constantly developing our merchandise offering to consistently meet our customers’ needs, and by targeted expansion and upgrading of our store base.
As part of this process, we recognise the need to ensure that our material sustainability issues are integrated as part of core business strategy. To this end, we have engaged external consultants to assist with a process of
determining a sustainability strategy, which will guide a longer-term process of setting clear sustainability objectives and performance targets. A review of our material issues, and of the relationship between sustainable development and our core value drivers, is provided in our Sustainability Overview.
Our commitment to promoting sustainable development includes an ongoing focus on building and maintaining shareholder value, demonstrating concern for our employees and the communities in which we operate, promoting broad-based black economic empowerment, and ensuring responsible environmental practices.
A key element of the group’s strategy is the continuation of our supply chain initiative in order to ensure that lead times in ordering, acquiring and distributing stock are reduced to the minimum. Over a period of time, this will result in improved lead times and increased stock turns, ensuring our ability to be first to market with key products and ultimately ensuring a more consistent delivery of our merchandise promise to our customers. An important focus this year has been the development and implementation of a supplier audit initiative aimed at ensuring the maintenance of appropriate ethical, labour and environmental performance standards amongst suppliers.
Being a credit retailer we plan to maximise turnover from our credit book by actively pursuing new credit account drives and maximising low usage of available credit. Our success with this during the year under review will be carried forward into the new financial year.
Strategies of the individual divisions are referred to in the divisional review section of this report.
PROSPECTSWe expect the tough trading environment to continue into the next financial year. The 2010 FIFA World Cup™ currently under way will create more positive consumer sentiment, which
together with the reduced interest rate and inflationary environment should improve consumer spending. However, unemployment in the economy remains a potential risk.
Retail turnover for the first ten weeks of the new financial year has been encouraging with an upward shift in consumer spending.
In line with our strategy of investing for long-term growth, we will continue to open new stores in certain of our formats that are under-represented and we anticipate increasing trading space in the new year by approximately 7%.
All our divisions remain in good shape, with remedial action taken where required, and they are well positioned to benefit from improved consumer spending.
THANKSThanks to our chairman, David Nurek, for his effective leadership of the board during his first year as chairman of our group.
Thanks are extended to the group’s 15 000 staff members for their contribution to its development and success. I extend my sincere appreciation to each and every one of them.
Thanks are also due to all the members of the board for their wisdom, guidance and direction.
To our shareholders, I extend thanks for their support of the group. I trust that their loyalty will continue to be rewarded.
Finally, I would like to express the group’s appreciation to our suppliers, advisers, corporate stakeholders, and customers for their contributions to the group’s activities and its successes.
Doug MurrayChief Executive Officer
21 June 2010

FOSC
HIN
I GRO
UP A
NN
UA
L REPORT 2010 - PA
GE 27

FOSC
HIN
I GRO
UP A
NN
UA
L REPORT 2010 - PA
GE 28
FINA
NC
IAL D
IRECTO
R’S REPORT
FOSC
HIN
I GRO
UP A
NN
UA
L REPORT 2010 - PA
GE 29
OVERVIEWThis was a very difficult year for our group. In the first half of the year operating profit was R890,2 million, an increase of 6,4% on the prior period and an increase in headline earnings per share of 1,5% at 232,9 cents per share.
Turnover growth was 7,9%. As consumer spending worsened, the second half of the year saw turnover growing by 5,0% and operating profit of R1 082,4 million reducing by 8,9%. Headline earnings per share reduced by 12,6%. For the year as a whole retail turnover grew by 6,4%
to R8,6 billion. Headline earnings per share decreased by 6,8% to 521,4 cents, whilst diluted headline earnings per share decreased by 6,3% to 518,2 cents per share. Notwithstanding the current economic climate, these results are somewhat disappointing.
Historical financial performance
Years ended 2002 2003 2004 2005 2006 2007 2008 2009 2010
Retail turnover (Rm) 3 289,9 3 880,6 4 410,0 5 279,3 6 432,1 7 230,0 7 668,7 8 089,6 8 605,2
Retail turnover growth % 10,4 18,0 13,6 19,7 21,8 12,4 6,1 5,5 6,4
Compound retail turnover growth % 15,9 14,5 13,7 12,5
Operating profit before finance charges (Rm) 348,5 582,0 814,6 1 204,8 1 567,3 1 887,0 1 905,5 2 025,5 1 972,6
Headline earnings per share (HEPS) (cents) 87,9 162,2 237,1 359,6 463,0 534,2 547,0 559,5 521,4
HEPS % change 75,4 84,5 46,2 51,7 28,8 15,4 2,4 2,3 (6,8)
Compound HEPS growth % 48,4 40,7 30,3 29,7
Dividends per share 31,0 56,0 94,0 164,0 220,0 270,0 288,0 288,0 288,0
FINANCIAL DIRECTOR’S REPORT
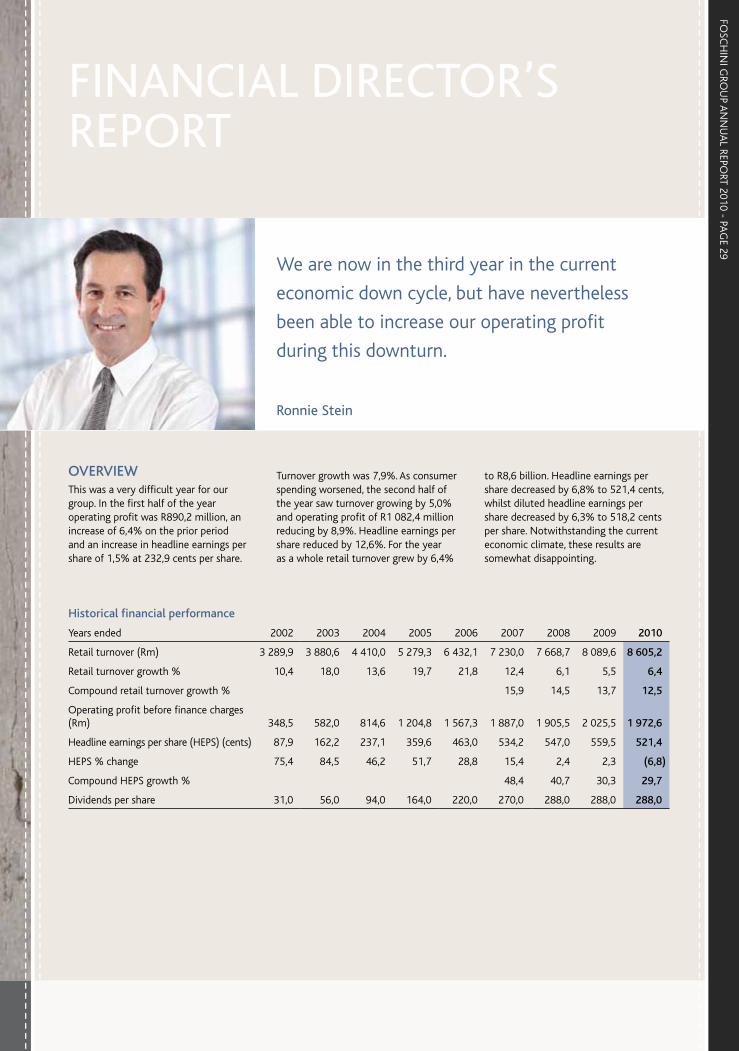
Ronnie Stein
We are now in the third year in the current
economic down cycle, but have nevertheless
been able to increase our operating profit
during this downturn.
FOSC
HIN
I GRO
UP A
NN
UA
L REPORT 2010 - PA
GE 30
FINA
NC
IAL D
IRECTO
R’S REPORT C
ON
TINU
ED
Looking back at the financial performance of our group for the last nine years, we experienced an unprecedented boom between 2002 and 2007 where our operating profit before finance charges increased from R348,5 million to R1 887,0 million. The compounded growth in headline earnings per share during this period was 48,4%. The growth in consumer spending started to decline sharply from 2008, signalling an end to the consumer-led boom referred to above. We are now in the third year in the current economic down cycle, but have nevertheless been able to increase our operating profit during this downturn. Although retail turnover for the first ten weeks of the new financial year has been encouraging with an upward shift in consumer spending, it is too soon to predict whether this represents a turn in the consumer spending cycle. Further unemployment in the economy remains a risk.
The key financial indicators for the year are as follows and are discussed in more detail elsewhere in this report.
Key performance indicators
2010
Medium- term
target 2009
Turnover (Rm) 8 605,2 8 089,6
Turnover growth 6,4% 5,5%
Gross margin 41,8% 42,0%
Operating margin 22,9% 25% 25,0%
Profit before tax (Rm) 1 711,1 1 775,7
Profit after tax (Rm) 1 162,5 1 211,3
Headline earnings per share (HEPS) (cents) 521,4 559,5
HEPS growth (6,8%) 2,3%
Diluted HEPS (cents) 518,2 553,0
Diluted HEPS growth (6,3%) 2,8%
Dividend per ordinary share (cents) 288,0 288,0
Return on average equity 22,5% 35% 26,9%
Total gearing 27,1% 40% 33,5%
Recourse gearing 11,6% 17,4%
Tangible net asset value per share (cents) 2 399,6 2 148,1
Tangible net asset value per share growth 11,7% 15,3%
Stock turn (12-month average)
– jewellery 1,7 1,7
– @home 1,8 1,8
– other 3,2 3,2
ACCOUNTING POLICIES AND STANDARDSThe annual financial statements have been prepared in accordance with the group’s accounting policies which comply with International Financial Reporting Standards (IFRS) and the requirements of the South African Companies Act. The principal accounting policies are consistent with those applied in the previous year except for the adoption of IAS 1 Presentation of Financial Statements, IFRS 8 Segmental Reporting and Circular 3/2009 Headline Earnings.
The principal effect of the changes required by IAS 1 were as follows:
• All non-owner changes in equity are now presented in “other comprehensive income” in the
Consolidated Statement of Comprehensive Income. Previously these were presented in the Consolidated Statement of Changes in Equity.
• The Consolidated Balance Sheet is now the Consolidated Statement of Financial Position.
The adoption of IFRS 8 and Circular 3/2009 has had no significant effect on these results.
In order to provide improved disclosure in the Consolidated Cash Flow Statement certain reclassifications have been made. These changes had no impact on overall equity, net assets or profitability.
Further information can be found in notes 38 and 40.
FOSC
HIN
I GRO
UP A
NN
UA
L REPORT 2010 - PA
GE 31
Retail turnover by merchandise category
2010 Rm
2009 Rm
1st half growth
%
2nd half growth
%
Total growth
%
1st half same store
growth%
2nd half same store
growth%
Total same store
growth%
Clothing 5 660,2 5 227,1 11,2 5,7 8,3 4,6 – 2,2
Jewellery 1 025,7 1 038,6 (3,0) 0,2 (1,2) (6,2) (4,0) (5,0)
Cellphones 707,6 762,6 (13,4) (1,6) (7,2) (15,9) (6,4) (11,0)
Cosmetics 622,7 552,2 16,9 9,3 12,8 12,7 5,4 8,7
Homeware and furniture 589,0 509,1 18,9 13,3 15,7 (5,3) (7,1) (6,3)
Total 8 605,2 8 089,6 7,9 5,0 6,4 1,2 (1,3) (0,1)
Retail turnover by division
2010 Turnover
Rm
1st half growth
%
2nd half growth
%
Total growth
%
1st half same store
growth%
2nd half same store
growth%
Total same store
growth%
Number of stores
Foschini 3 306,0 11,0 2,5 6,5 6,2 (2,1) 1,9 454
Markham 1 359,6 1,4 5,7 3,7 (2,8) 1,1 (0,8) 234
exact! 759,8 0,6 3,7 2,2 (5,7) (2,7) (4,2) 205
Sports division 1 496,7 18,7 12,7 15,4 7,8 4,6 6,1 291
Jewellery division 1 095,3 (5,0) (0,8) (2,7) (7,6) (4,9) (6,1) 365
@home 587,8 18,9 13,1 15,7 (5,3) (7,1) (6,3) 78
Group 8 605,2 7,9 5,0 6,4 1,2 (1,3) (0,1) 1 627
Cash sales 3 221,7 6,3 2,3 4,1
Credit sales 5 383,5 8,8 6,6 7,7
Total 8 605,2 7,9 5,0 6,4
INCOME STATEMENT
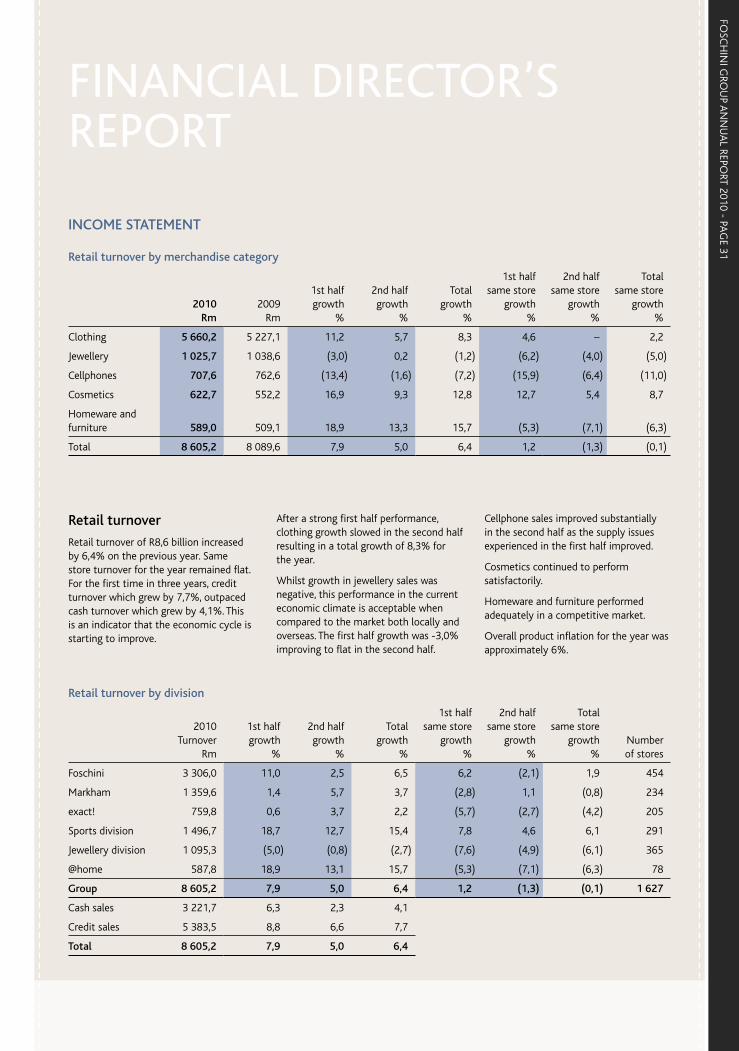
Retail turnover
Retail turnover of R8,6 billion increased by 6,4% on the previous year. Same store turnover for the year remained flat. For the first time in three years, credit turnover which grew by 7,7%, outpaced cash turnover which grew by 4,1%. This is an indicator that the economic cycle is starting to improve.
After a strong first half performance, clothing growth slowed in the second half resulting in a total growth of 8,3% for the year.
Whilst growth in jewellery sales was negative, this performance in the current economic climate is acceptable when compared to the market both locally and overseas. The first half growth was -3,0% improving to flat in the second half.
Cellphone sales improved substantially in the second half as the supply issues experienced in the first half improved.
Cosmetics continued to perform satisfactorily.
Homeware and furniture performed adequately in a competitive market.
Overall product inflation for the year was approximately 6%.
FINANCIAL DIRECTOR’S REPORT

FOSC
HIN
I GRO
UP A
NN
UA
L REPORT 2010 - PA
GE 32
FINA
NC
IAL D
IRECTO
R’S REPORT C
ON
TINU
ED
Whilst turnover growth in the first half was 7,9%, consumer spending continued to deteriorate in the second half with turnover growth of 5,0%, resulting in growth of 6,4% for the year as a whole.
Same store turnover for the first half was 1,2%, whilst the second half reduced to -1,3%, resulting in same store turnover for the year being flat.
In line with our strategy of investing for long-term growth, the group added 100 new stores across all our brands representing a total increase in trading space of 8,1%.
During the year, credit sales as a percentage of total sales increased to 62,6% from 61,8%.
Our gross margin reduced marginally by 0,2% to 41,8% from 42,0%. Our budgeted input margins remained constant, but as Christmas trade was at the lower level of management expectations, mark-downs for the group were marginally up on the previous year, increasing to 12,8% from 11,9%.
The table above reflects the historic gross margin trend analysis.
Interest received
Interest received from our trade receivables book increased by 21,0% to R636,4 million. This was driven by a growth in the average book size. The take-up of the 12-month accounts by new customers remains more popular with over 90% of new customers opting for the 12-month account. Currently 71% in value of accounts are now attracting interest, up from 68% last year.
Interest received on the RCS Group receivables increased by 5,1%, restrained by the lack of capital experienced by the RCS Group during the year (as a result of the world financial crisis), where advances to customers were substantially curtailed.
Expenses
Expenses before bad debts were well controlled at 14,9%. Like-for-like expense growth was managed at around 8%, the balance relating to the opening of new stores.
Depreciation and amortisation grew by 14,3% reflecting the costs associated with new stores as well as enhanced IT systems.
Employment costs of R1 376,9 million are our group’s biggest operating cost and increased by 12,7% over the previous year. The increase in these costs is due to normal staff salary increases which this year averaged 6%, as well as the appointment of new staff to service new store openings. Included in these costs are restraint payments amounting to R1,4 million which are paid to ensure the retention of key staff. Incentive bonuses of R1 million were paid to staff where performance targets were achieved for the year. The IFRS 2 share option charge this year amounted to R34,3 million, whilst an amount of R25,7 million was recognised as an expense last year.
Store occupancy costs, the group’s second-largest operating cost, increased by 20,8% to R816,4 million and as a percentage of sales increased to 9,5% from 8,4% last year. Whilst lease escalations average 8%, the balance of
Historic gross margin trend analysis
45%
40%
35%
30%
25%
20%
15%
10%
5%
0
2003 2004 2005 2006 2007 2008 2009 2010
FOSC
HIN
I GRO
UP A
NN
UA
L REPORT 2010 - PA
GE 33
FINANCIAL DIRECTOR’S REPORT
this cost is due to the opening of new stores, as well as the costs associated with the RCS Group’s acquisition of the Massdiscounters credit business towards the end of the previous financial year. During the year 100 new stores were opened whilst 12 stores were closed.
Net bad debt and movement in provisions in our retail debtors’ book increased by 37,3% on a 15,4% book growth to R359,1 million, reflecting the switch of new accounts to 12-month extended terms from the previous 6-month terms. The performance of our debtors’ book continues to be satisfactory with net bad debts as a percentage of debtors’ book increasing to 9,9% from 8,7%. The net bad debt and movement in provisions in the RCS Group, grew by 11,1% to R352,4 million. Write-offs improved this year, due to a focus on quality in new advances. More detail on the group’s bad debt and provisions is dealt with in the Financial Services review elsewhere in this report.
Interest paid increased marginally to R261,5 million from R249,8 million. Whilst interest rates in the economy reduced significantly this year, our group still has R800 million of borrowings at fixed rates. As these borrowings start to unwind from May 2011 onwards, we will begin to receive the benefit of the lower interest rates. Notwithstanding the increased capital requirements of our group relating to receivables and new stores, cash flow for the year was positive with net gearing at the year-end improving by R141 million over the previous year.
It is significant to note that interest paid of R197,9 million relates to the funding of the RCS Group whilst R63,6 million relates to the funding of our retail business.
Operating margin
In this difficult environment, the group’s operating margin decreased to 22,9% from 25,0%, which is our group’s medium-term target. As the economy improves, and consumer spending
becomes more buoyant, we would expect our operating margin to increase.
Taxation
The group’s effective tax rate increased from 31,8% to 32,1% mainly as a result of increased STC. Further details are contained in the Notes to the Financial Statements.
Earnings
Headline earnings decreased by 5,3% to R1 085,6 million from R1 145,8 million, whilst headline earnings per ordinary share decreased from 559,5 cents per share to 521,4 cents per share, a decrease of 6,8%. Headline earnings per share has been calculated on the weighted average number of ordinary shares in issue of 208,2 million up from 204,8 million in the prior year.
Diluted headline earnings per share decreased from 553,0 cents to 518,2 cents, a decrease of 6,3%.
The group’s return on equity (ROE) of 22,5% remains at a satisfactory level, but is down on last year’s ROE of 26,9%. Our medium-term target remains at 35%.
Dividends
Having regard to our strong balance sheet and cash flow, as well as future prospects, we have maintained our final dividend at 170,0 cents per share and together with the interim dividend of 118,0 cents per share, the total dividend for the year of 288,0 cents per share is the same as the previous year.
STATEMENT OF FINANCIAL POSITIONThe tangible net asset value per share grew by 11,7% to 2 399,6 cents per share (2009: 2 148,1 cents). Total assets now amount to R9 236,9 million and grew by 6,6%.
Assets
Property, plant and equipment
Property, plant and equipment increased by 1,5% to R995,8 million from last year’s R981,3 million primarily due to:
• the opening of new stores, store enlargements and refurbishments in line with our strategy to increase our total trading area;
• the introduction of new IT systems; and
• larger than normal depreciation resulting in the main from the substantial store openings in the previous year.
Trade receivables – retailThe group’s net retail trade receivables increased by 15,4% to R3 169,3 million on credit turnover growth of 7,7%. As mentioned previously, the take-up of 12-month accounts by new customers has been positively received with over 90% of all new accounts opting for the12-month option. This is the main reason for the growth in the book. Net bad debt as a percentage of credit transactions increased to 4,8% from 4,0%, whilst net bad debt write-off as a percentage of the debtors’ book increased to 9,9% from 8,7%, but this is already showing a downward trend. In the current economic climate, the performance of our retail debtors’ book has been satisfactory.
The key debtors’ statistics are detailed in the FG Financial Services section of this report.
Inventory
Total inventory on hand decreased by 2,0% to R1 493,8 million from R1 524,9 million. Inventory of merchandise for resale decreased by 5,4% to R1 355,0 million from R1 433,0 million. As a result of the group’s supply chain initiative, our stock has been well controlled, with all our DCs at the year-end running with approximately 50% less stock than last year. Instead of stock sitting in the DC for a period, as it now gets to the warehouse, it flows through directly to stores. Taking into account the new stores to be opened in the next financial year, stock is at the appropriate levels for future trading. Stock turns in our business remain a focus and continue to be addressed through our supply chain initiative.

FOSC
HIN
I GRO
UP A
NN
UA
L REPORT 2010 - PA
GE 34
FINA
NC
IAL D
IRECTO
R’S REPORT C
ON
TINU
ED
Our stock turn in respect of jewellery merchandise at 1,7 is satisfactory in terms of world benchmarks, whilst the group’s stock turns on other merchandise categories at 3,2 should improve in future years as a result of our supply chain initiative. Adequate provision has been made for mark-downs, shrinkage and inventory obsolescence.
RCS Group
The RCS Group is an operationally independent consumer finance business that provides a broad range of financial services under its own brand in South Africa, Namibia and Botswana. The RCS Group, which experienced a challenging year last year, performed far better this year with net profit before tax increasing by 11,5% to R225,9 million. The quality of new business written during the year has continued to improve with net bad debt as a percentage of debtors’ book reducing to 12,3% from 14,1% last year.
The key driver for the year was to improve the overall asset quality and all
key debtors’ book quality measures now show positive trends. At the year-end, RCS Group’s receivables increased by 6,4% to R2 630,8 million from R2 472,6 million.
The key debtors’ statistics are detailed in the RCS Group section of this report.
RCS Group currently represents 13,2% of our group’s profit before tax, increasing from last year’s 11,4%. It is not core to our business and it still remains our intention at some future date to reduce our group’s holding in RCS to below 50%, which will obviate the need to consolidate this group. When markets change it is possible that this group could be separately listed.
During March 2010, RCS Group went to the market with its DMTN (domestic medium-term note) programme and was successful in raising R303 million of funding in a mixture of long- (four years) and short-term (12 months) paper. Subsequent to the year-end, an additional R250 million has been placed
on a seven-year term. This new funding will allow RCS Group to return to its growth potential in the future and will, in time, lessen its reliance on funding from the Foschini group.
Equity
The group’s attributable equity increased to R5 058,3 million from R4 496,3 million translating into tangible net asset value of 2 399,6 cents per share. At the financial year-end, treasury shares held by subsidiaries including the share trust, amounted to 31,5 million shares, representing 13,1% of the total issued shares.
Non-controlling interest
The non-controlling interest of R427,0 million relates to the minority shareholding in the RCS Group. At the financial year-end the group’s shareholding in this division was 55% with the balance being held by The Standard Bank of South Africa Limited (SBSA).
Debt profile
2010
Rm%
growth2009
Rm
Interest-bearing debt and non-controlling interest loans 1 969,5 (7,2) 2 123,1
Less: preference share investment (200,0) (200,0)
Less: cash (284,0) (296,2)
Net borrowings 1 485,5 (8,7) 1 626,9
Less: SBSA loan to RCS Group (non-controlling interest loan) (478,3) (783,2)
1 007,2 843,7
Less: RCS Group external funding (commercial paper + bonds + bank loan) (372,1) –
Recourse debt 635,1 (24,7) 843,7
Less: Foschini funding of RCS Group (804,5) (825,0)
Retail (cash) borrowings (169,4) 18,7
FOSC
HIN
I GRO
UP A
NN
UA
L REPORT 2010 - PA
GE 35
Our group’s operations are financed primarily by means of its own cash flow as well as banking facilities. This debt, off-set by the group’s cash and its “near cash” preference share investment of R200 million, represents net gearing of 27,1%, which is below the group’s medium-term objective of 40%.
Of this debt, the non-controlling interest loan by SBSA to the RCS Group of R478,3 million, together with the RCS Group’s external funding of R372,1 million, has no recourse to Foschini Limited. Accordingly, our net recourse borrowings amounts to R635,1 million which represents net recourse gearing of 11,6% (2009: 17,4%).
Taking into account the R804,5 million advanced as a loan to the RCS Group, the retail side of our business is totally ungeared.
The group’s fixed long-term borrowings of R800,0 million which were put in place as protection during the recent banking crisis, mature between May and
November 2011.
FINANCIAL DIRECTOR’S REPORT
Trade and other payables
Trade and other payables increased from
R1 252,5 million to R1 293,8 million.
Our group’s policy of paying all suppliers
30 days from statement date remains
consistent with prior years.
Capital expenditure
Total capital expenditure for the year
amounted to R289,6 million, most of
which relates to the opening of new
stores and refurbishments, as well as
investment in IT systems. 60% of our
capital expenditure amounting to
R171,3 million relates to new stores.
In addition to this, a fair portion of the
group’s IT expenditure of R71,6 million
also relates to new stores.
Due to our strategy of investing for the
longer term, budgeted capital expenditure
for 2011 is approximately R300 million, as
we anticipate opening in the region of 100
new stores in the year ahead, increasing
floor space by approximately 7%.
CASH FLOWCash flows from operating activities before working capital changes amounted to R2 237,5 million, an increase on the previous year’s R2 228,6 million. Cash generated by operations amounted to R1 696,1 million compared to R1 673,9 million in the previous year. The main working capital requirements during the year related to an increase in our retail debtors’ book of R423,0 million, as well as an increase in the RCS Group debtors’ book of R158,2 million.
The net cash outflow from investing activities amounted to R270,3 million all of which related to our investment in new stores (R289,6 million).
Total net borrowings decreased by R141,0 million during the year to R1 485,5 million.
Ronnie SteinFinancial Director
21 June 2010
FOSC
HIN
I GRO
UP A
NN
UA
L REPORT 2010 - PA
GE 36
REVIEW
OF O
PERATION
S AN
D SERV
ICES
FOSC
HIN
I GRO
UP A
NN
UA
L REPORT 2010 - PA
GE 37
OPERATIONSFoschini 38
Markham 46
exact! 52
Sports Division 56
Jewellery Division 64
@home 70
Supply chain 74
TFG Apparel Supply Company 76
Group Merchandise Procurement 78
FINANCIAL SERVICES 80FG Financial Services 82
RCS Group 86
SERVICESEnvironment 93
Group Finance and Administration 97
Group Audit Services 98
Distribution and Logistics 99
Group Services 101
Group Property 102
Foschinidata 105
Human Resources 109

FOSC
HIN
I GRO
UP A
NN
UA
L REPORT 2010 - PA
GE 38
OPERATIO
NA
L REVIEW
– FOSC
HIN
I DIV
ISION
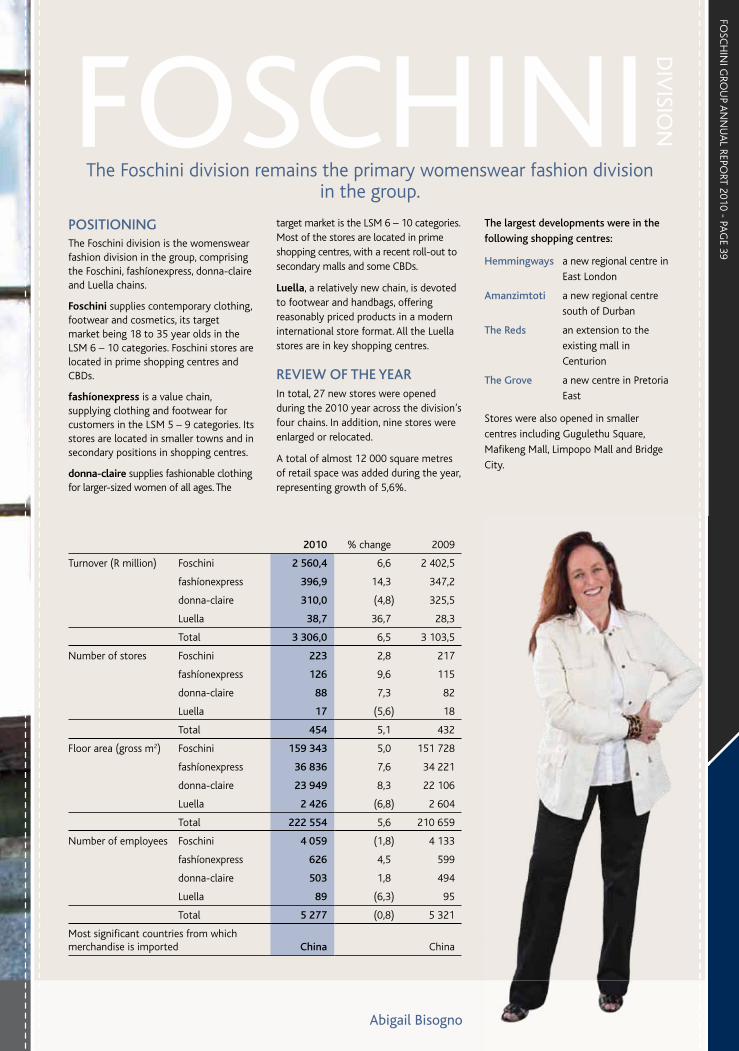
FOSC
HIN
I GRO
UP A
NN
UA
L REPORT 2010 - PA
GE 39
The Foschini division remains the primary womenswear fashion division in the group.
POSITIONINGThe Foschini division is the womenswear fashion division in the group, comprising the Foschini, fashíonexpress, donna-claire and Luella chains.
Foschini supplies contemporary clothing, footwear and cosmetics, its target market being 18 to 35 year olds in the LSM 6 – 10 categories. Foschini stores are located in prime shopping centres and CBDs.
fashíonexpress is a value chain, supplying clothing and footwear for customers in the LSM 5 – 9 categories. Its stores are located in smaller towns and in secondary positions in shopping centres.
donna-claire supplies fashionable clothing for larger-sized women of all ages. The
Abigail Bisogno
target market is the LSM 6 – 10 categories. Most of the stores are located in prime shopping centres, with a recent roll-out to secondary malls and some CBDs.
Luella, a relatively new chain, is devoted to footwear and handbags, offering reasonably priced products in a modern international store format. All the Luella stores are in key shopping centres.
REVIEW OF THE YEARIn total, 27 new stores were opened during the 2010 year across the division’s four chains. In addition, nine stores were enlarged or relocated.
A total of almost 12 000 square metres of retail space was added during the year, representing growth of 5,6%.
The largest developments were in the
following shopping centres:
Hemmingways a new regional centre in
East London
Amanzimtoti a new regional centre
south of Durban
The Reds an extension to the
existing mall in
Centurion
The Grove a new centre in Pretoria
East
Stores were also opened in smaller
centres including Gugulethu Square,
Mafikeng Mall, Limpopo Mall and Bridge
City.
2010 % change 2009
Turnover (R million) Foschini 2 560,4 6,6 2 402,5
fashíonexpress 396,9 14,3 347,2
donna-claire 310,0 (4,8) 325,5
Luella 38,7 36,7 28,3
Total 3 306,0 6,5 3 103,5
Number of stores Foschini 223 2,8 217
fashíonexpress 126 9,6 115
donna-claire 88 7,3 82
Luella 17 (5,6) 18
Total 454 5,1 432
Floor area (gross m2) Foschini 159 343 5,0 151 728
fashíonexpress 36 836 7,6 34 221
donna-claire 23 949 8,3 22 106
Luella 2 426 (6,8) 2 604
Total 222 554 5,6 210 659
Number of employees Foschini 4 059 (1,8) 4 133
fashíonexpress 626 4,5 599
donna-claire 503 1,8 494
Luella 89 (6,3) 95
Total 5 277 (0,8) 5 321
Most significant countries from which merchandise is imported China China
FOSCHINI D
IVISIO
N

FOSC
HIN
I GRO
UP A
NN
UA
L REPORT 2010 - PA
GE 40
OPERATIO
NA
L REVIEW
– FOSC
HIN
I DIV
ISION
CO
NTIN
UED
The adverse economic conditions experienced towards the end of the previous year continued into the 2010 year. In spite of this unfavourable economic climate the division achieved creditable turnover growth of 11,0% in the first half, thanks largely to a winter range which was more successful with customers than had been the winter range of the previous year.
From October 2009, with the onset of summer, a slow-down in consumer demand became more evident. This was exacerbated by a shortage the division experienced of casualwear products in a season where the trend was towards casual product. The division’s formal fashion-directed brands such as Oasis and WWW struggled, while the casual labels News and Instinct enjoyed a lift in sales. Turnover in the second half grew by 2,5%, with the result that growth for the full year was 6,5%.
Investing in talent development is an ongoing focus to ensure a supply of talent and skills to meet the division’s business requirements. Details on the group’s human resource activities – including employment equity, skills development, and occupational health and safety – are provided in the Human Resources review.
Progress has again been made in the group’s supply chain initiative, with tangible benefits in terms of the time spent by merchandise in the division’s distribution centre and elsewhere in the supply chain. Further details on the nature of our supply chain management and auditing activities are provided in Supply Chain and Group Merchandise Procurement reviews. The aim of these activities is to ensure reliability, speed, quality, value and flexibility in our supplier relationships, while also maintaining appropriate ethical, labour and environmental performance standards amongst suppliers.
CosmeticsThe cosmetics business has continued its steady growth and turnover in the full year rose by 13,1%, with growth in comparable stores of 8,7%. Turnover in this category now exceeds R600 million.
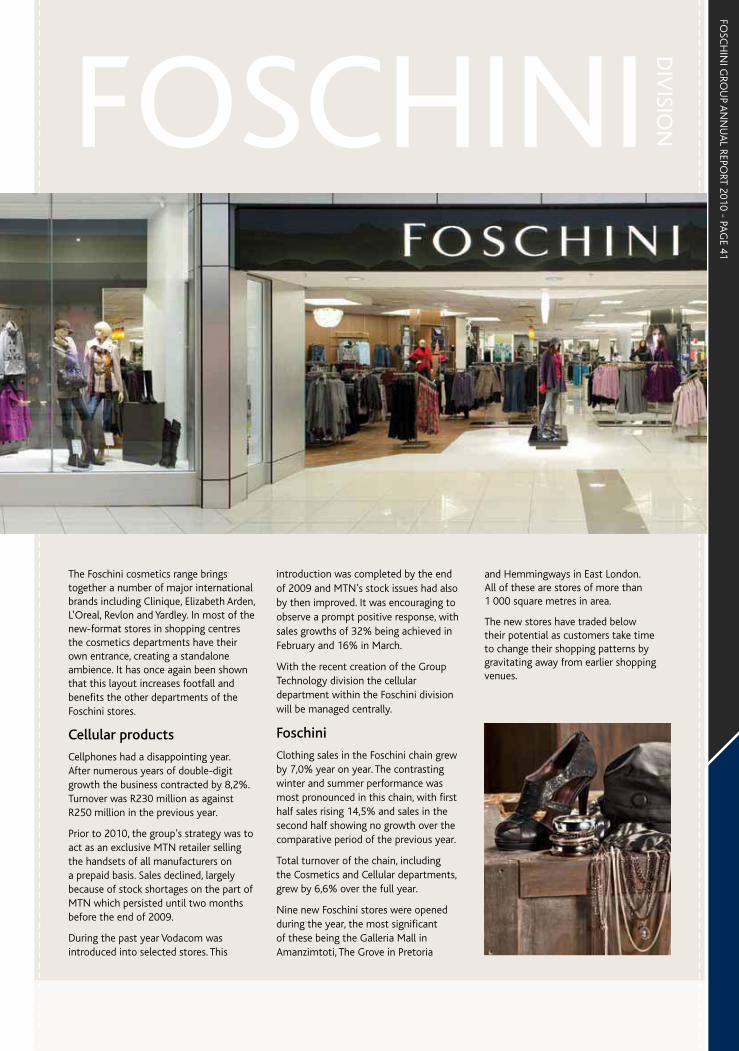
FOSC
HIN
I GRO
UP A
NN
UA
L REPORT 2010 - PA
GE 41
The Foschini cosmetics range brings together a number of major international brands including Clinique, Elizabeth Arden, L’Oreal, Revlon and Yardley. In most of the new-format stores in shopping centres the cosmetics departments have their own entrance, creating a standalone ambience. It has once again been shown that this layout increases footfall and benefits the other departments of the Foschini stores.
Cellular products
Cellphones had a disappointing year. After numerous years of double-digit growth the business contracted by 8,2%. Turnover was R230 million as against R250 million in the previous year.
Prior to 2010, the group’s strategy was to act as an exclusive MTN retailer selling the handsets of all manufacturers on a prepaid basis. Sales declined, largely because of stock shortages on the part of MTN which persisted until two months before the end of 2009.
During the past year Vodacom was introduced into selected stores. This
introduction was completed by the end of 2009 and MTN’s stock issues had also by then improved. It was encouraging to observe a prompt positive response, with sales growths of 32% being achieved in February and 16% in March.
With the recent creation of the Group Technology division the cellular department within the Foschini division will be managed centrally.
Foschini
Clothing sales in the Foschini chain grew by 7,0% year on year. The contrasting winter and summer performance was most pronounced in this chain, with first half sales rising 14,5% and sales in the second half showing no growth over the comparative period of the previous year.
Total turnover of the chain, including the Cosmetics and Cellular departments, grew by 6,6% over the full year.
Nine new Foschini stores were opened during the year, the most significant of these being the Galleria Mall in Amanzimtoti, The Grove in Pretoria
and Hemmingways in East London. All of these are stores of more than 1 000 square metres in area.
The new stores have traded below their potential as customers take time to change their shopping patterns by gravitating away from earlier shopping venues.
FOSCHINI D
IVISIO
N
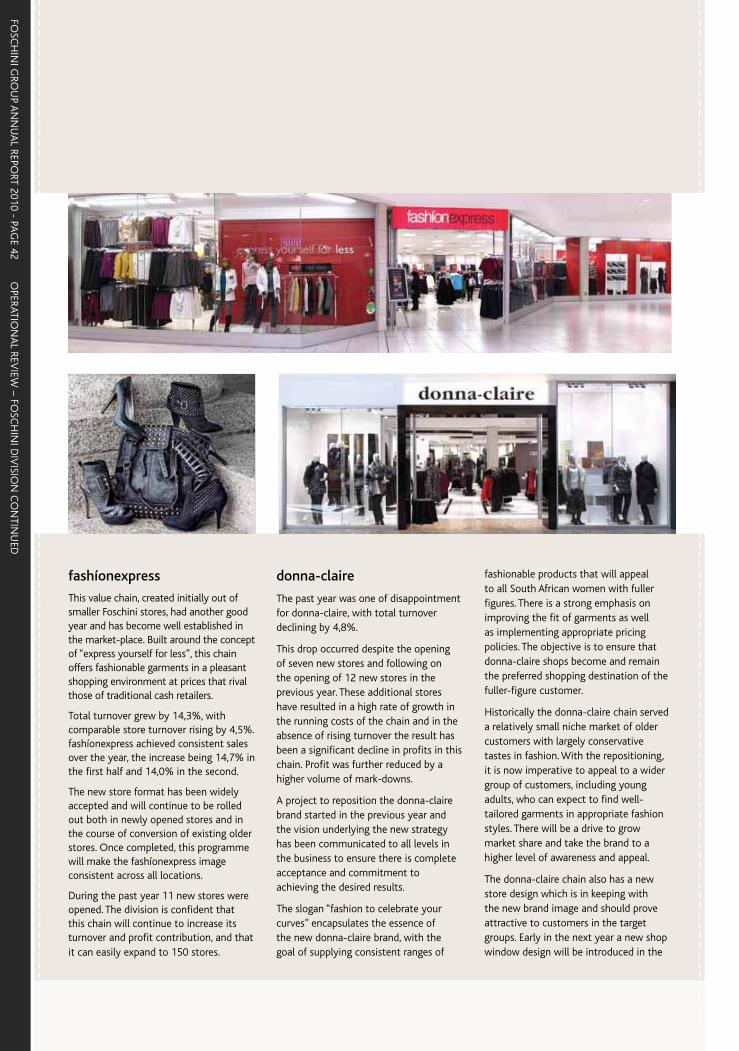
FOSC
HIN
I GRO
UP A
NN
UA
L REPORT 2010 - PA
GE 42
OPERATIO
NA
L REVIEW
– FOSC
HIN
I DIV
ISION
CO
NTIN
UED
fashíonexpress
This value chain, created initially out of smaller Foschini stores, had another good year and has become well established in the market-place. Built around the concept of “express yourself for less”, this chain offers fashionable garments in a pleasant shopping environment at prices that rival those of traditional cash retailers.
Total turnover grew by 14,3%, with comparable store turnover rising by 4,5%. fashíonexpress achieved consistent sales over the year, the increase being 14,7% in the first half and 14,0% in the second.
The new store format has been widely accepted and will continue to be rolled out both in newly opened stores and in the course of conversion of existing older stores. Once completed, this programme will make the fashíonexpress image consistent across all locations.
During the past year 11 new stores were opened. The division is confident that this chain will continue to increase its turnover and profit contribution, and that it can easily expand to 150 stores.
donna-claire
The past year was one of disappointment for donna-claire, with total turnover declining by 4,8%.
This drop occurred despite the opening of seven new stores and following on the opening of 12 new stores in the previous year. These additional stores have resulted in a high rate of growth in the running costs of the chain and in the absence of rising turnover the result has been a significant decline in profits in this chain. Profit was further reduced by a higher volume of mark-downs.
A project to reposition the donna-claire brand started in the previous year and the vision underlying the new strategy has been communicated to all levels in the business to ensure there is complete acceptance and commitment to achieving the desired results.
The slogan “fashion to celebrate your curves” encapsulates the essence of the new donna-claire brand, with the goal of supplying consistent ranges of
fashionable products that will appeal to all South African women with fuller figures. There is a strong emphasis on improving the fit of garments as well as implementing appropriate pricing policies. The objective is to ensure that donna-claire shops become and remain the preferred shopping destination of the fuller-figure customer.
Historically the donna-claire chain served a relatively small niche market of older customers with largely conservative tastes in fashion. With the repositioning, it is now imperative to appeal to a wider group of customers, including young adults, who can expect to find well-tailored garments in appropriate fashion styles. There will be a drive to grow market share and take the brand to a higher level of awareness and appeal.
The donna-claire chain also has a new store design which is in keeping with the new brand image and should prove attractive to customers in the target groups. Early in the next year a new shop window design will be introduced in the
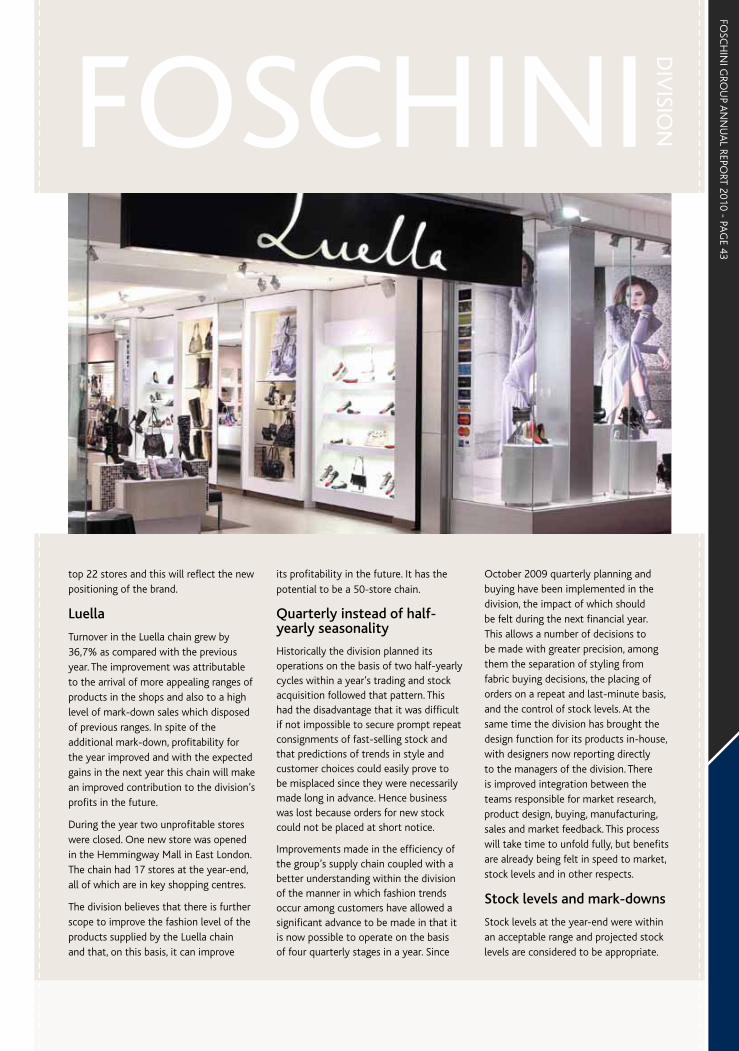
FOSC
HIN
I GRO
UP A
NN
UA
L REPORT 2010 - PA
GE 43
top 22 stores and this will reflect the new positioning of the brand.
Luella
Turnover in the Luella chain grew by 36,7% as compared with the previous year. The improvement was attributable to the arrival of more appealing ranges of products in the shops and also to a high level of mark-down sales which disposed of previous ranges. In spite of the additional mark-down, profitability for the year improved and with the expected gains in the next year this chain will make an improved contribution to the division’s profits in the future.
During the year two unprofitable stores were closed. One new store was opened in the Hemmingway Mall in East London. The chain had 17 stores at the year-end, all of which are in key shopping centres.
The division believes that there is further scope to improve the fashion level of the products supplied by the Luella chain and that, on this basis, it can improve
its profitability in the future. It has the potential to be a 50-store chain.
Quarterly instead of half-yearly seasonality
Historically the division planned its operations on the basis of two half-yearly cycles within a year’s trading and stock acquisition followed that pattern. This had the disadvantage that it was difficult if not impossible to secure prompt repeat consignments of fast-selling stock and that predictions of trends in style and customer choices could easily prove to be misplaced since they were necessarily made long in advance. Hence business was lost because orders for new stock could not be placed at short notice.
Improvements made in the efficiency of the group’s supply chain coupled with a better understanding within the division of the manner in which fashion trends occur among customers have allowed a significant advance to be made in that it is now possible to operate on the basis of four quarterly stages in a year. Since
October 2009 quarterly planning and buying have been implemented in the division, the impact of which should be felt during the next financial year. This allows a number of decisions to be made with greater precision, among them the separation of styling from fabric buying decisions, the placing of orders on a repeat and last-minute basis, and the control of stock levels. At the same time the division has brought the design function for its products in-house, with designers now reporting directly to the managers of the division. There is improved integration between the teams responsible for market research, product design, buying, manufacturing, sales and market feedback. This process will take time to unfold fully, but benefits are already being felt in speed to market, stock levels and in other respects.
Stock levels and mark-downs
Stock levels at the year-end were within an acceptable range and projected stock levels are considered to be appropriate.
FOSCHINI D
IVISIO
N

FOSC
HIN
I GRO
UP A
NN
UA
L REPORT 2010 - PA
GE 44
OPERATIO
NA
L REVIEW
– FOSC
HIN
I DIV
ISION
CO
NTIN
UED

FOSC
HIN
I GRO
UP A
NN
UA
L REPORT 2010 - PA
GE 45
The medium-term goal of the division remains to reduce clothing and footwear mark-downs to between 10% and 12% of sales, and to increase stock turn significantly.
Supporting indigenous design and supply
Foschini launched a new brand, “Love Movement by Stoned Cherrie” in November 2009. This launch was underpinned by Stoned Cherrie’s vision to become a global African-lifestyle brand in collaboration with a credible retail partner. Stoned Cherrie was established in 2000 by Nkhensani Nkosi, a well-known entrepreneur, TV personality and lauded actress, making her one of the new voices of Africa. The adoption of this brand represents visible commitment by the Foschini group to social development in Africa and support for indigenous design and supply.
“Love Movement” is currently in 49 Foschini stores. This innovative range, consisting of African-inspired products that simultaneously express old, new and futuristic elements, has proven to have
a broad customer appeal. Based on the current level of success, opportunities exist to expand both the store base and the product offering.
STRATEGY AND PROSPECTSThere is general awareness that South African consumers are under pressure and that levels of disposable income have declined. Despite this, the Foschini division considers that it is well positioned in terms of the number and quality of existing and planned stores and its flexible buying processes to withstand a continuation in the current economic downturn. Its objective is to emerge strongly, in order to capitalise on the upswing which will follow.
The division’s continuing investment of capital in its programme of new store openings and the refurbishment of existing stores, even during a period of economic decline, is part of a long-term strategy to capitalise on South Africa’s proven pattern of economic growth despite periodic downturns in the business cycle.
In the next year the division will open more than 25 new stores and will upgrade approximately 15 CBD stores. These measures will add substantial turnover and improve the visibility of the division to the consumer.
The division is currently rolling out lighting efficiency initiatives across its stores as part of efforts by the group to reduce the environmental footprint and increase the energy efficiency of its stores.
In addition the division will open its first stores in Lusaka, Zambia, in November 2010.
Other significant venues for new stores in the next year are:
I’Langa Mall (Nelspruit)Goldfields Mall (Welkom)Mamelodi Crossing (Pretoria)Chris Hani Centre (Vosloorus)
The division’s strength in the markets it serves and its growth over the years are reflected in the table alongside, setting out details of the numbers of stores in its four chains.
Mark-down statistics
2006 2007 2008 2009 2010
Mark-down value (Rm) 349,3 371,0 450,6 380,8 410,4
% of sales 15,1 15,1 17,4 15,0 15,2
Store statistics
Projection
2006 2007 2008 2009 2010 2011 2012
Foschini 201 207 211 217 223 230 235
fashíonexpress 90 97 100 115 126 140 150
donna-claire 59 64 70 82 88 93 100
Luella 6 18 19 18 17 18 25
Total No. of stores 356 386 400 432 454 481 510
Closures 6 3 5 2 5 2 2
Floor area (m2) 163 703 178 206 191 787 210 659 222 554 235 000 245 000
FOSCHINI D
IVISIO
N

FOSC
HIN
I GRO
UP A
NN
UA
L REPORT 2010 - PA
GE 46
OPERATIO
NA
L REVIEW
– MA
RKHA
M
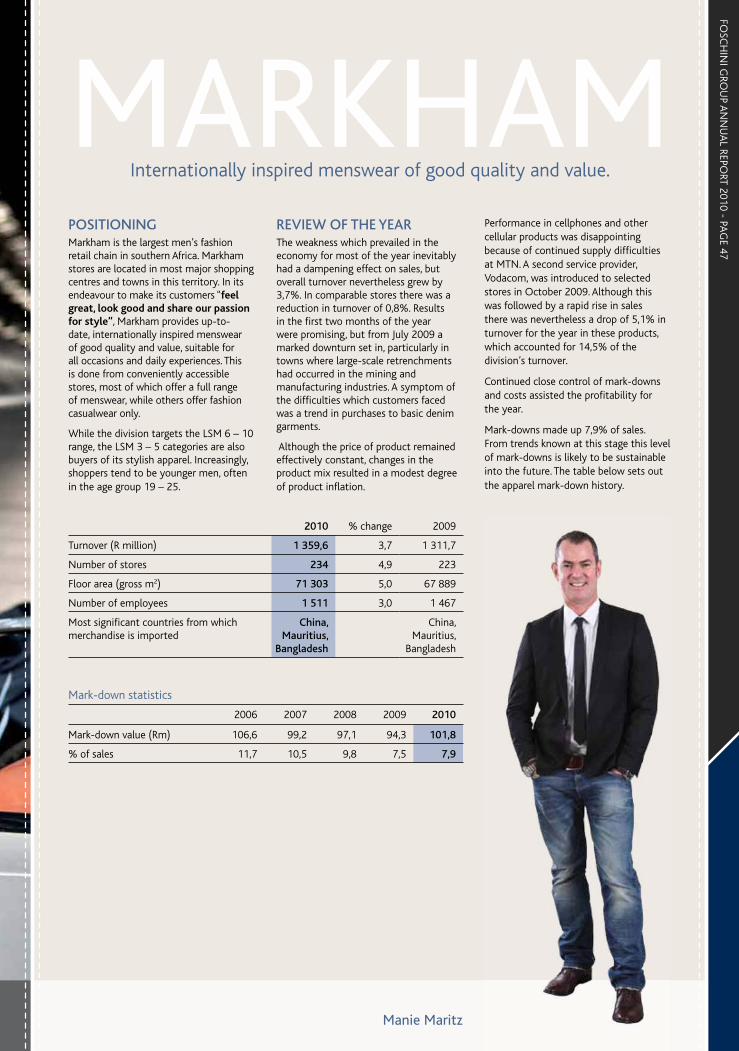
FOSC
HIN
I GRO
UP A
NN
UA
L REPORT 2010 - PA
GE 47
MARKHAMInternationally inspired menswear of good quality and value.
POSITIONINGMarkham is the largest men’s fashion retail chain in southern Africa. Markham stores are located in most major shopping centres and towns in this territory. In its endeavour to make its customers “feel great, look good and share our passion for style”, Markham provides up-to-date, internationally inspired menswear of good quality and value, suitable for all occasions and daily experiences. This is done from conveniently accessible stores, most of which offer a full range of menswear, while others offer fashion casualwear only.
While the division targets the LSM 6 – 10 range, the LSM 3 – 5 categories are also buyers of its stylish apparel. Increasingly, shoppers tend to be younger men, often in the age group 19 – 25.
REVIEW OF THE YEARThe weakness which prevailed in the economy for most of the year inevitably had a dampening effect on sales, but overall turnover nevertheless grew by 3,7%. In comparable stores there was a reduction in turnover of 0,8%. Results in the first two months of the year were promising, but from July 2009 a marked downturn set in, particularly in towns where large-scale retrenchments had occurred in the mining and manufacturing industries. A symptom of the difficulties which customers faced was a trend in purchases to basic denim garments.
Although the price of product remained effectively constant, changes in the product mix resulted in a modest degree of product inflation.
Performance in cellphones and other cellular products was disappointing because of continued supply difficulties at MTN. A second service provider, Vodacom, was introduced to selected stores in October 2009. Although this was followed by a rapid rise in sales there was nevertheless a drop of 5,1% in turnover for the year in these products, which accounted for 14,5% of the division’s turnover.
Continued close control of mark-downs and costs assisted the profitability for the year.
Mark-downs made up 7,9% of sales. From trends known at this stage this level of mark-downs is likely to be sustainable into the future. The table below sets out the apparel mark-down history.
2010 % change 2009
Turnover (R million) 1 359,6 3,7 1 311,7
Number of stores 234 4,9 223
Floor area (gross m2) 71 303 5,0 67 889
Number of employees 1 511 3,0 1 467
Most significant countries from which merchandise is imported
China, Mauritius,
Bangladesh
China, Mauritius,
Bangladesh
Mark-down statistics
2006 2007 2008 2009 2010
Mark-down value (Rm) 106,6 99,2 97,1 94,3 101,8
% of sales 11,7 10,5 9,8 7,5 7,9
Manie Maritz
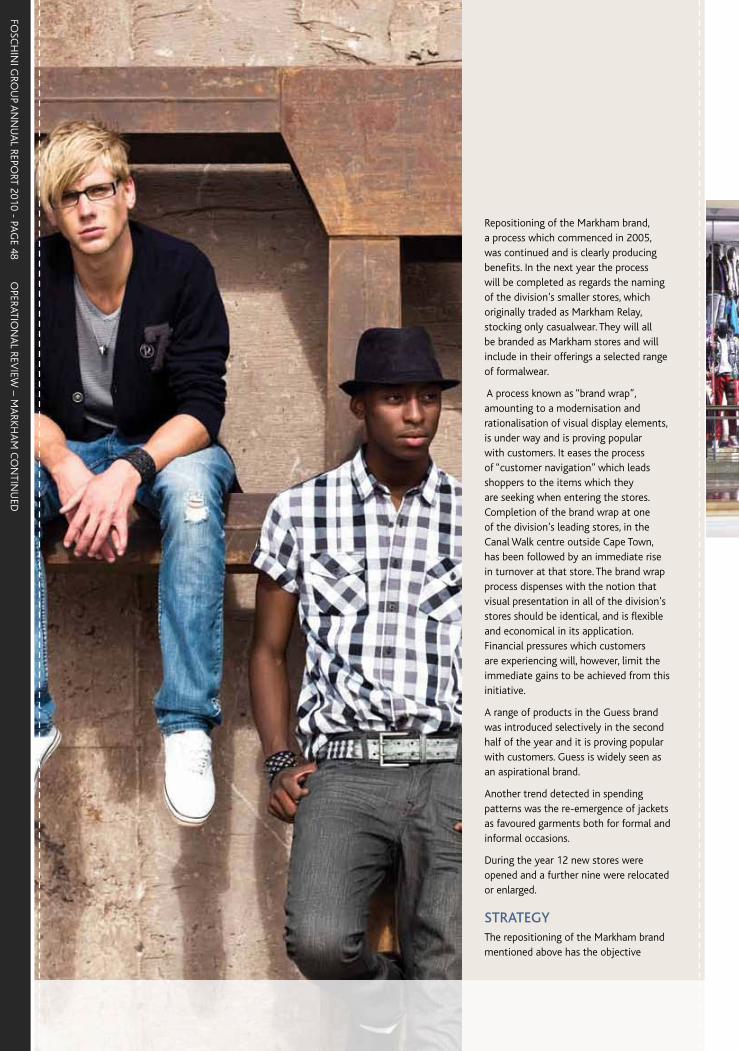
FOSC
HIN
I GRO
UP A
NN
UA
L REPORT 2010 - PA
GE 48
OPERATIO
NA
L REVIEW
– MA
RKHA
M C
ON
TINU
ED
Repositioning of the Markham brand, a process which commenced in 2005, was continued and is clearly producing benefits. In the next year the process will be completed as regards the naming of the division’s smaller stores, which originally traded as Markham Relay, stocking only casualwear. They will all be branded as Markham stores and will include in their offerings a selected range of formalwear.
A process known as “brand wrap”, amounting to a modernisation and rationalisation of visual display elements, is under way and is proving popular with customers. It eases the process of “customer navigation” which leads shoppers to the items which they are seeking when entering the stores. Completion of the brand wrap at one of the division’s leading stores, in the Canal Walk centre outside Cape Town, has been followed by an immediate rise in turnover at that store. The brand wrap process dispenses with the notion that visual presentation in all of the division’s stores should be identical, and is flexible and economical in its application. Financial pressures which customers are experiencing will, however, limit the immediate gains to be achieved from this initiative.
A range of products in the Guess brand was introduced selectively in the second half of the year and it is proving popular with customers. Guess is widely seen as an aspirational brand.
Another trend detected in spending patterns was the re-emergence of jackets as favoured garments both for formal and informal occasions.
During the year 12 new stores were opened and a further nine were relocated or enlarged.
STRATEGYThe repositioning of the Markham brand mentioned above has the objective
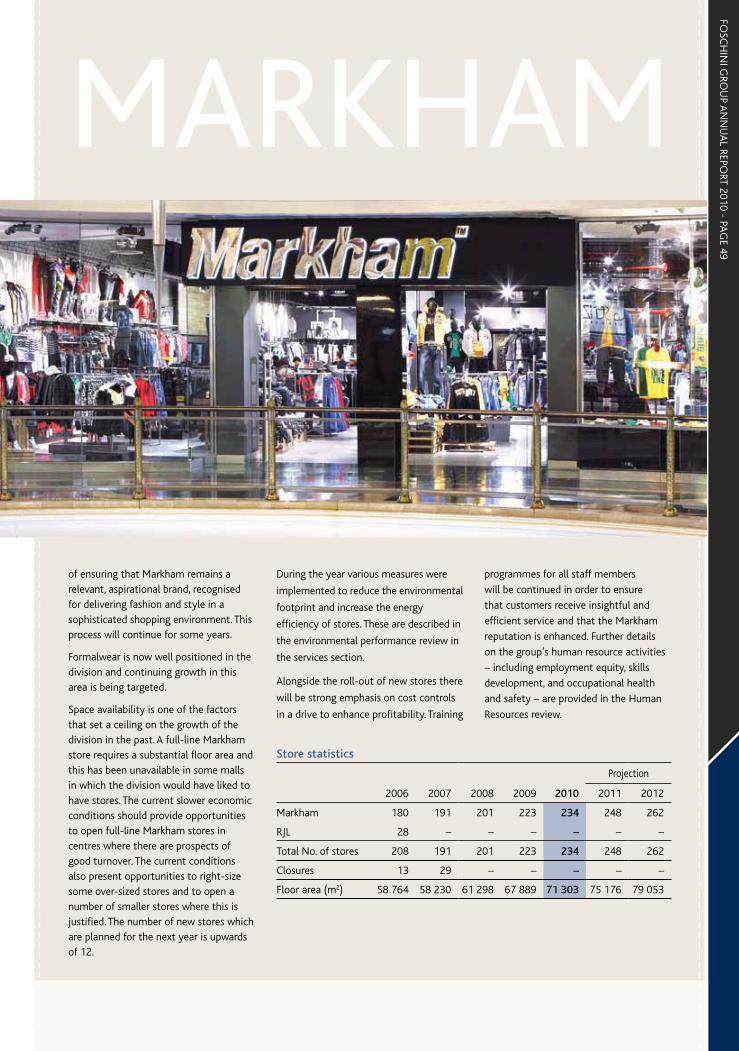
FOSC
HIN
I GRO
UP A
NN
UA
L REPORT 2010 - PA
GE 49
MARKHAM
of ensuring that Markham remains a relevant, aspirational brand, recognised for delivering fashion and style in a sophisticated shopping environment. This process will continue for some years.
Formalwear is now well positioned in the division and continuing growth in this area is being targeted.
Space availability is one of the factors that set a ceiling on the growth of the division in the past. A full-line Markham store requires a substantial floor area and this has been unavailable in some malls in which the division would have liked to have stores. The current slower economic conditions should provide opportunities to open full-line Markham stores in centres where there are prospects of good turnover. The current conditions also present opportunities to right-size some over-sized stores and to open a number of smaller stores where this is justified. The number of new stores which are planned for the next year is upwards of 12.
Store statistics
Projection
2006 2007 2008 2009 2010 2011 2012
Markham 180 191 201 223 234 248 262
RJL 28 – – – – – –
Total No. of stores 208 191 201 223 234 248 262
Closures 13 29 – – – – –
Floor area (m2) 58 764 58 230 61 298 67 889 71 303 75 176 79 053
During the year various measures were
implemented to reduce the environmental
footprint and increase the energy
efficiency of stores. These are described in
the environmental performance review in
the services section.
Alongside the roll-out of new stores there
will be strong emphasis on cost controls
in a drive to enhance profitability. Training
programmes for all staff members
will be continued in order to ensure
that customers receive insightful and
efficient service and that the Markham
reputation is enhanced. Further details
on the group’s human resource activities
– including employment equity, skills
development, and occupational health
and safety – are provided in the Human
Resources review.

FOSC
HIN
I GRO
UP A
NN
UA
L REPORT 2010 - PA
GE 50
OPERATIO
NA
L REVIEW
– MA
RKHA
M C
ON
TINU
ED
FOSC
HIN
I GRO
UP A
NN
UA
L REPORT 2010 - PA
GE 51
MARKHAMThe division will implement the next phase of the group’s supply chain initiative to reduce lead times for merchandise procurement and enhance the efficiency of distribution, hence ultimately improving stock turn. One of the elements which will be taken further in the next year is the concept of “hold-back” in the dedicated Markham distribution centre.
There will also be emphasis on better fulfilment of customers’ size requirements, utilising for the second year the group’s size-management software which is designed to ensure that the size ranges of stock arriving at a store will correspond to historical sales.
The men’s fashion arena has limited local manufacturing capability but there are fortunately a few sizeable companies in the Western Cape with whom good relationships exist and from whom good volumes of the division’s supplies can be obtained.
The division’s efforts to develop closer relationships with domestic suppliers in order to increase the level of local production will continue. Greater reliance on local manufacture implies reduced vulnerability to adverse changes in the exchange rate of the Rand, and this is a longer-term goal.
Further details on the nature of the group’s supply chain management and auditing activities are provided in the Supply Chain and Group Merchandise Procurement reviews. The aim of these activities is to ensure reliability, speed, quality, value and flexibility in the group’s supplier relationships, while also maintaining appropriate ethical, labour and environmental performance standards amongst suppliers.
Replenishment stock, replacing items recently sold, accounts for 19% of the division’s turnover and emphasis is being increasingly placed on replenishment as a strategy.
PROSPECTSMenswear has been a victim of the current poor economic conditions, particularly in smaller towns where there has been much retrenchment and is likely to continue to feel the pinch. However with the strategic steps outlined above in this report, together with the continuing roll-out of Markham stores, performance in the next year is expected to be better as consumer spending improves.
Markham will open its first store in Zambia in the next year.

FOSC
HIN
I GRO
UP A
NN
UA
L REPORT 2010 - PA
GE 52
OPERATIO
NA
L REVIEW
– EXA
CT!
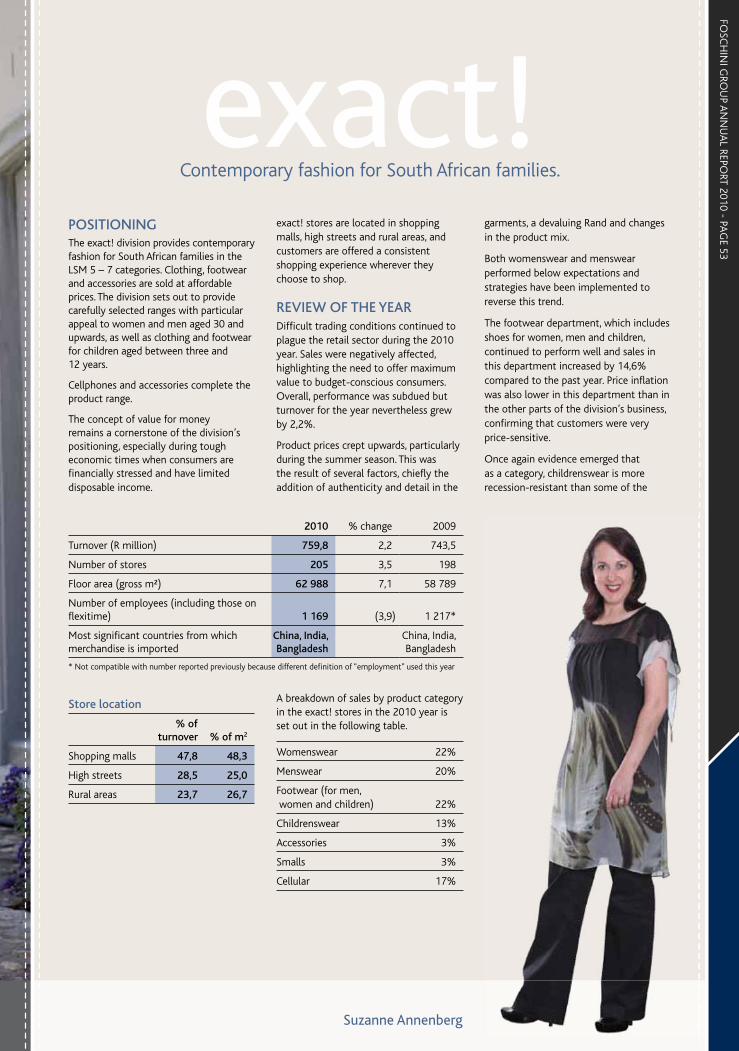
FOSC
HIN
I GRO
UP A
NN
UA
L REPORT 2010 - PA
GE 53
POSITIONINGThe exact! division provides contemporary fashion for South African families in the LSM 5 – 7 categories. Clothing, footwear and accessories are sold at affordable prices. The division sets out to provide carefully selected ranges with particular appeal to women and men aged 30 and upwards, as well as clothing and footwear for children aged between three and 12 years.
Cellphones and accessories complete the product range.
The concept of value for money remains a cornerstone of the division’s positioning, especially during tough economic times when consumers are financially stressed and have limited disposable income.
exact! stores are located in shopping malls, high streets and rural areas, and customers are offered a consistent shopping experience wherever they choose to shop.
REVIEW OF THE YEARDifficult trading conditions continued to plague the retail sector during the 2010 year. Sales were negatively affected, highlighting the need to offer maximum value to budget-conscious consumers. Overall, performance was subdued but turnover for the year nevertheless grew by 2,2%.
Product prices crept upwards, particularly during the summer season. This was the result of several factors, chiefly the addition of authenticity and detail in the
garments, a devaluing Rand and changes in the product mix.
Both womenswear and menswear performed below expectations and strategies have been implemented to reverse this trend.
The footwear department, which includes shoes for women, men and children, continued to perform well and sales in this department increased by 14,6% compared to the past year. Price inflation was also lower in this department than in the other parts of the division’s business, confirming that customers were very price-sensitive.
Once again evidence emerged that as a category, childrenswear is more recession-resistant than some of the
2010 % change 2009
Turnover (R million) 759,8 2,2 743,5
Number of stores 205 3,5 198
Floor area (gross m²) 62 988 7,1 58 789
Number of employees (including those on flexitime) 1 169 (3,9) 1 217*
Most significant countries from which merchandise is imported
China, India, Bangladesh
China, India, Bangladesh
* Not compatible with number reported previously because different definition of “employment” used this year
Suzanne Annenberg
Store location
% of turnover % of m2
Shopping malls 47,8 48,3
High streets 28,5 25,0
Rural areas 23,7 26,7
A breakdown of sales by product category in the exact! stores in the 2010 year is set out in the following table.
Womenswear 22%
Menswear 20%
Footwear (for men, women and children) 22%
Childrenswear 13%
Accessories 3%
Smalls 3%
Cellular 17%
Contemporary fashion for South African families.
exact!
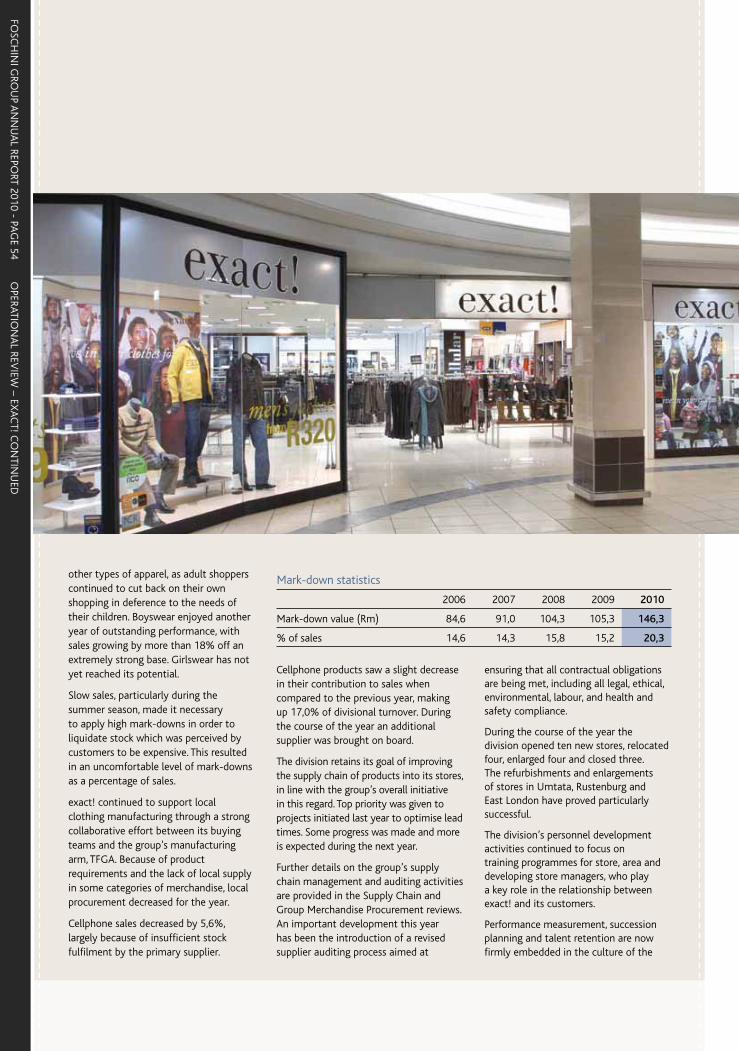
FOSC
HIN
I GRO
UP A
NN
UA
L REPORT 2010 - PA
GE 54
OPERATIO
NA
L REVIEW
– EXA
CT! C
ON
TINU
ED
other types of apparel, as adult shoppers continued to cut back on their own shopping in deference to the needs of their children. Boyswear enjoyed another year of outstanding performance, with sales growing by more than 18% off an extremely strong base. Girlswear has not yet reached its potential.
Slow sales, particularly during the summer season, made it necessary to apply high mark-downs in order to liquidate stock which was perceived by customers to be expensive. This resulted in an uncomfortable level of mark-downs as a percentage of sales.
exact! continued to support local clothing manufacturing through a strong collaborative effort between its buying teams and the group’s manufacturing arm, TFGA. Because of product requirements and the lack of local supply in some categories of merchandise, local procurement decreased for the year.
Cellphone sales decreased by 5,6%, largely because of insufficient stock fulfilment by the primary supplier.
Cellphone products saw a slight decrease in their contribution to sales when compared to the previous year, making up 17,0% of divisional turnover. During the course of the year an additional supplier was brought on board.
The division retains its goal of improving the supply chain of products into its stores, in line with the group’s overall initiative in this regard. Top priority was given to projects initiated last year to optimise lead times. Some progress was made and more is expected during the next year.
Further details on the group’s supply chain management and auditing activities are provided in the Supply Chain and Group Merchandise Procurement reviews. An important development this year has been the introduction of a revised supplier auditing process aimed at
ensuring that all contractual obligations are being met, including all legal, ethical, environmental, labour, and health and safety compliance.
During the course of the year the division opened ten new stores, relocated four, enlarged four and closed three. The refurbishments and enlargements of stores in Umtata, Rustenburg and East London have proved particularly successful.
The division’s personnel development activities continued to focus on training programmes for store, area and developing store managers, who play a key role in the relationship between exact! and its customers.
Performance measurement, succession planning and talent retention are now firmly embedded in the culture of the
Mark-down statistics
2006 2007 2008 2009 2010
Mark-down value (Rm) 84,6 91,0 104,3 105,3 146,3
% of sales 14,6 14,3 15,8 15,2 20,3
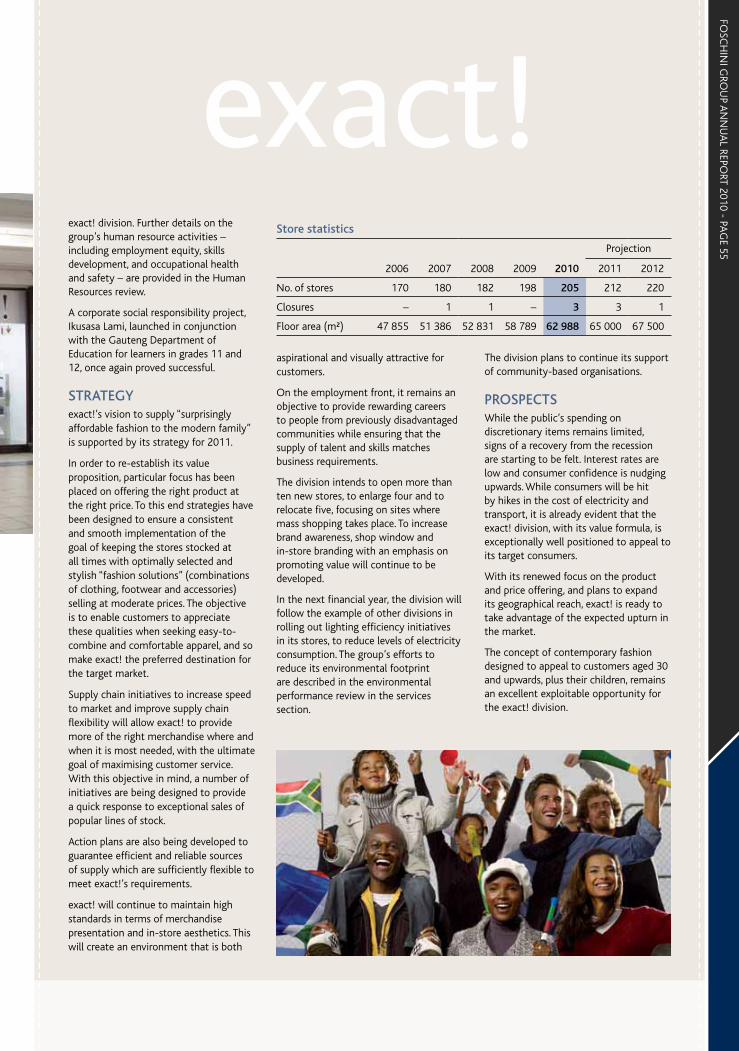
FOSC
HIN
I GRO
UP A
NN
UA
L REPORT 2010 - PA
GE 55
exact! division. Further details on the group’s human resource activities – including employment equity, skills development, and occupational health and safety – are provided in the Human Resources review.
A corporate social responsibility project, Ikusasa Lami, launched in conjunction with the Gauteng Department of Education for learners in grades 11 and 12, once again proved successful.
STRATEGYexact!’s vision to supply “surprisingly affordable fashion to the modern family” is supported by its strategy for 2011.
In order to re-establish its value proposition, particular focus has been placed on offering the right product at the right price. To this end strategies have been designed to ensure a consistent and smooth implementation of the goal of keeping the stores stocked at all times with optimally selected and stylish “fashion solutions” (combinations of clothing, footwear and accessories) selling at moderate prices. The objective is to enable customers to appreciate these qualities when seeking easy-to-combine and comfortable apparel, and so make exact! the preferred destination for the target market.
Supply chain initiatives to increase speed to market and improve supply chain flexibility will allow exact! to provide more of the right merchandise where and when it is most needed, with the ultimate goal of maximising customer service. With this objective in mind, a number of initiatives are being designed to provide a quick response to exceptional sales of popular lines of stock.
Action plans are also being developed to guarantee efficient and reliable sources of supply which are sufficiently flexible to meet exact!’s requirements.
exact! will continue to maintain high standards in terms of merchandise presentation and in-store aesthetics. This will create an environment that is both
Store statistics
Projection
2006 2007 2008 2009 2010 2011 2012
No. of stores 170 180 182 198 205 212 220
Closures – 1 1 – 3 3 1
Floor area (m²) 47 855 51 386 52 831 58 789 62 988 65 000 67 500
aspirational and visually attractive for customers.
On the employment front, it remains an objective to provide rewarding careers to people from previously disadvantaged communities while ensuring that the supply of talent and skills matches business requirements.
The division intends to open more than ten new stores, to enlarge four and to relocate five, focusing on sites where mass shopping takes place. To increase brand awareness, shop window and in-store branding with an emphasis on promoting value will continue to be developed.
In the next financial year, the division will follow the example of other divisions in rolling out lighting efficiency initiatives in its stores, to reduce levels of electricity consumption. The group’s efforts to reduce its environmental footprint are described in the environmental performance review in the services section.
The division plans to continue its support of community-based organisations.
PROSPECTSWhile the public’s spending on discretionary items remains limited, signs of a recovery from the recession are starting to be felt. Interest rates are low and consumer confidence is nudging upwards. While consumers will be hit by hikes in the cost of electricity and transport, it is already evident that the exact! division, with its value formula, is exceptionally well positioned to appeal to its target consumers.
With its renewed focus on the product and price offering, and plans to expand its geographical reach, exact! is ready to take advantage of the expected upturn in the market.
The concept of contemporary fashion designed to appeal to customers aged 30 and upwards, plus their children, remains an excellent exploitable opportunity for the exact! division.
exact!

FOSC
HIN
I GRO
UP A
NN
UA
L REPORT 2010 - PA
GE 56
OPERATIO
NA
L REVIEW
– SPORTS D
IVISIO
N
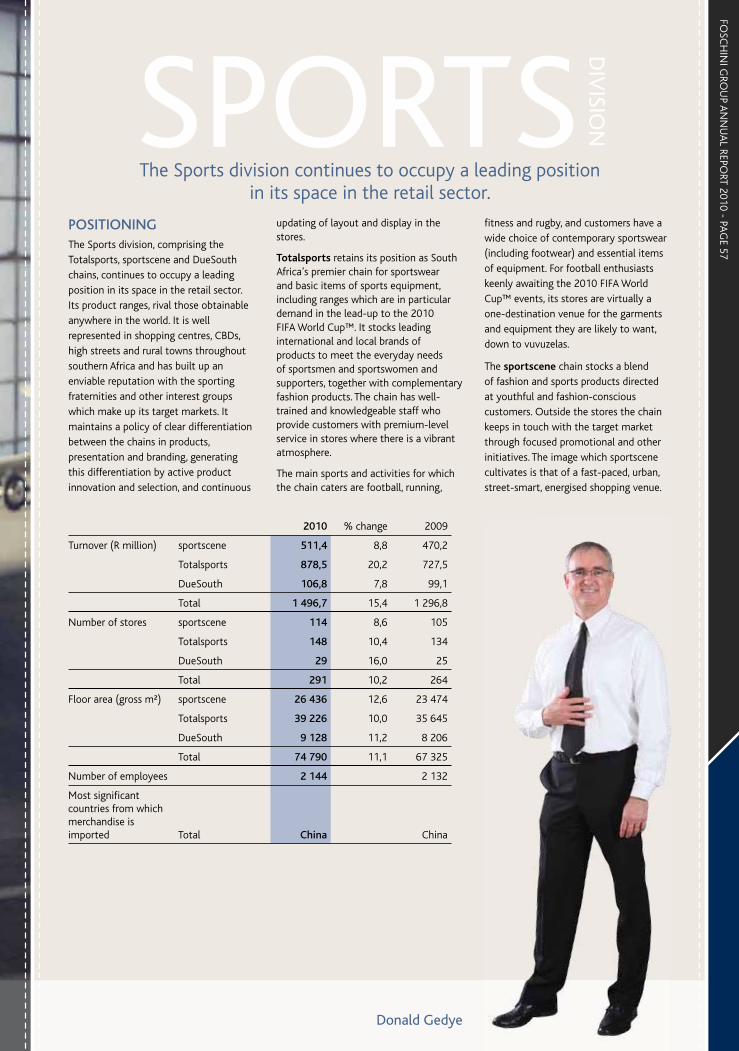
FOSC
HIN
I GRO
UP A
NN
UA
L REPORT 2010 - PA
GE 57
POSITIONINGThe Sports division, comprising the Totalsports, sportscene and DueSouth chains, continues to occupy a leading position in its space in the retail sector. Its product ranges, rival those obtainable anywhere in the world. It is well represented in shopping centres, CBDs, high streets and rural towns throughout southern Africa and has built up an enviable reputation with the sporting fraternities and other interest groups which make up its target markets. It maintains a policy of clear differentiation between the chains in products, presentation and branding, generating this differentiation by active product innovation and selection, and continuous
updating of layout and display in the stores.
Totalsports retains its position as South Africa’s premier chain for sportswear and basic items of sports equipment, including ranges which are in particular demand in the lead-up to the 2010 FIFA World Cup™. It stocks leading international and local brands of products to meet the everyday needs of sportsmen and sportswomen and supporters, together with complementary fashion products. The chain has well-trained and knowledgeable staff who provide customers with premium-level service in stores where there is a vibrant atmosphere.
The main sports and activities for which the chain caters are football, running,
fitness and rugby, and customers have a wide choice of contemporary sportswear (including footwear) and essential items of equipment. For football enthusiasts keenly awaiting the 2010 FIFA World Cup™ events, its stores are virtually a one-destination venue for the garments and equipment they are likely to want, down to vuvuzelas.
The sportscene chain stocks a blend of fashion and sports products directed at youthful and fashion-conscious customers. Outside the stores the chain keeps in touch with the target market through focused promotional and other initiatives. The image which sportscene cultivates is that of a fast-paced, urban, street-smart, energised shopping venue.
2010 % change 2009
Turnover (R million) sportscene 511,4 8,8 470,2
Totalsports 878,5 20,2 727,5
DueSouth 106,8 7,8 99,1
Total 1 496,7 15,4 1 296,8
Number of stores sportscene 114 8,6 105
Totalsports 148 10,4 134
DueSouth 29 16,0 25
Total 291 10,2 264
Floor area (gross m²) sportscene 26 436 12,6 23 474
Totalsports 39 226 10,0 35 645
DueSouth 9 128 11,2 8 206
Total 74 790 11,1 67 325
Number of employees 2 144 2 132
Most significant countries from which merchandise is imported Total China China
Donald Gedye
The Sports division continues to occupy a leading position in its space in the retail sector.
SPORTS D
IVISIO
N
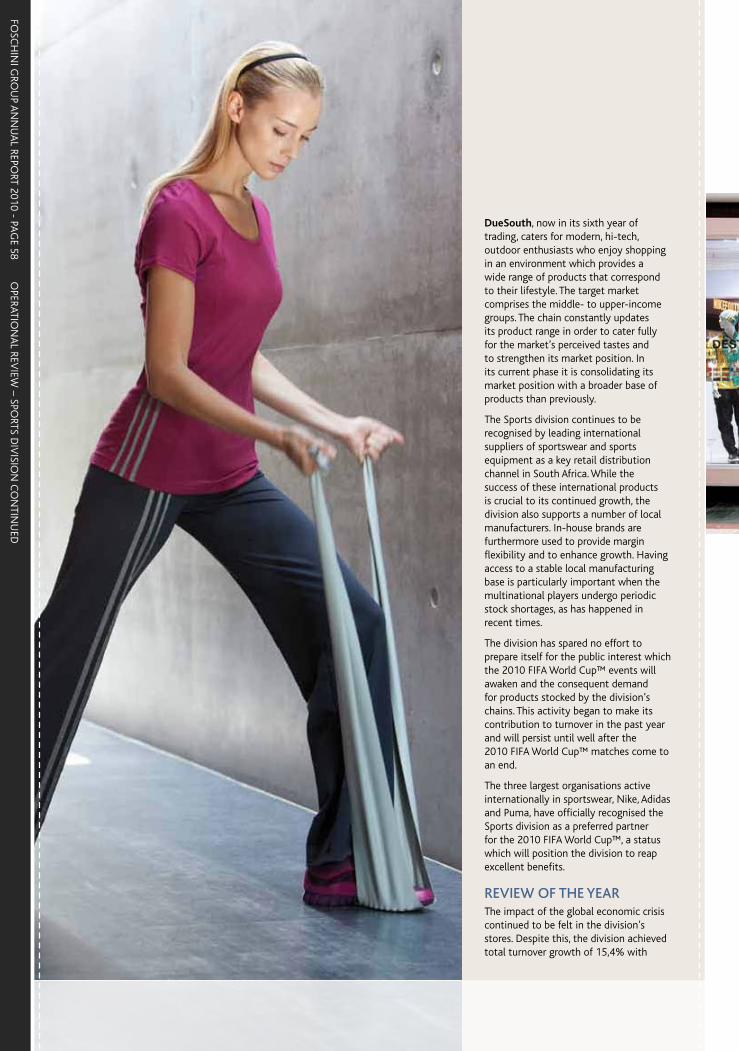
FOSC
HIN
I GRO
UP A
NN
UA
L REPORT 2010 - PA
GE 58
OPERATIO
NA
L REVIEW
– SPORTS D
IVISIO
N C
ON
TINU
ED
DueSouth, now in its sixth year of trading, caters for modern, hi-tech, outdoor enthusiasts who enjoy shopping in an environment which provides a wide range of products that correspond to their lifestyle. The target market comprises the middle- to upper-income groups. The chain constantly updates its product range in order to cater fully for the market’s perceived tastes and to strengthen its market position. In its current phase it is consolidating its market position with a broader base of products than previously.
The Sports division continues to be recognised by leading international suppliers of sportswear and sports equipment as a key retail distribution channel in South Africa. While the success of these international products is crucial to its continued growth, the division also supports a number of local manufacturers. In-house brands are furthermore used to provide margin flexibility and to enhance growth. Having access to a stable local manufacturing base is particularly important when the multinational players undergo periodic stock shortages, as has happened in recent times.
The division has spared no effort to prepare itself for the public interest which the 2010 FIFA World Cup™ events will awaken and the consequent demand for products stocked by the division’s chains. This activity began to make its contribution to turnover in the past year and will persist until well after the 2010 FIFA World Cup™ matches come to an end.
The three largest organisations active internationally in sportswear, Nike, Adidas and Puma, have officially recognised the Sports division as a preferred partner for the 2010 FIFA World Cup™, a status which will position the division to reap excellent benefits.
REVIEW OF THE YEARThe impact of the global economic crisis continued to be felt in the division’s stores. Despite this, the division achieved total turnover growth of 15,4% with
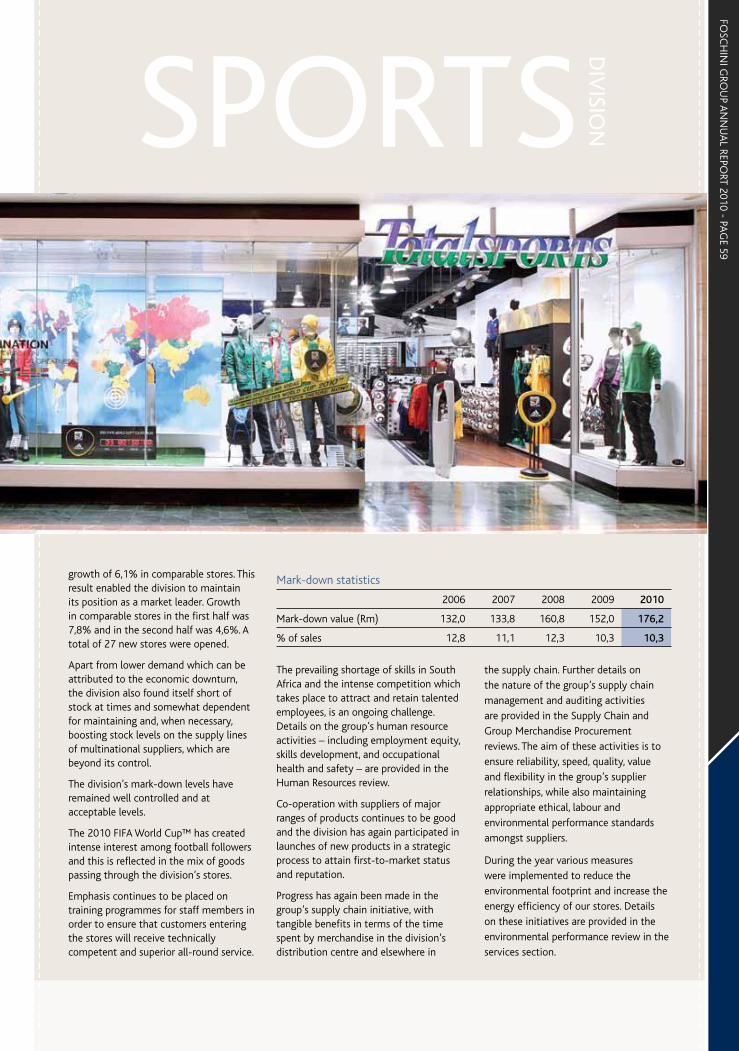
FOSC
HIN
I GRO
UP A
NN
UA
L REPORT 2010 - PA
GE 59
growth of 6,1% in comparable stores. This result enabled the division to maintain its position as a market leader. Growth in comparable stores in the first half was 7,8% and in the second half was 4,6%. A total of 27 new stores were opened.
Apart from lower demand which can be attributed to the economic downturn, the division also found itself short of stock at times and somewhat dependent for maintaining and, when necessary, boosting stock levels on the supply lines of multinational suppliers, which are beyond its control.
The division’s mark-down levels have remained well controlled and at acceptable levels.
The 2010 FIFA World Cup™ has created intense interest among football followers and this is reflected in the mix of goods passing through the division’s stores.
Emphasis continues to be placed on training programmes for staff members in order to ensure that customers entering the stores will receive technically competent and superior all-round service.
Mark-down statistics
2006 2007 2008 2009 2010
Mark-down value (Rm) 132,0 133,8 160,8 152,0 176,2
% of sales 12,8 11,1 12,3 10,3 10,3
The prevailing shortage of skills in South Africa and the intense competition which takes place to attract and retain talented employees, is an ongoing challenge. Details on the group’s human resource activities – including employment equity, skills development, and occupational health and safety – are provided in the Human Resources review.
Co-operation with suppliers of major ranges of products continues to be good and the division has again participated in launches of new products in a strategic process to attain first-to-market status and reputation.
Progress has again been made in the group’s supply chain initiative, with tangible benefits in terms of the time spent by merchandise in the division’s distribution centre and elsewhere in
the supply chain. Further details on the nature of the group’s supply chain management and auditing activities are provided in the Supply Chain and Group Merchandise Procurement reviews. The aim of these activities is to ensure reliability, speed, quality, value and flexibility in the group’s supplier relationships, while also maintaining appropriate ethical, labour and environmental performance standards amongst suppliers.
During the year various measures were implemented to reduce the environmental footprint and increase the energy efficiency of our stores. Details on these initiatives are provided in the environmental performance review in the services section.
SPORTS D
IVISIO
N

FOSC
HIN
I GRO
UP A
NN
UA
L REPORT 2010 - PA
GE 60
OPERATIO
NA
L REVIEW
– SPORTS D
IVISIO
N C
ON
TINU
ED
Totalsports
Totalsports achieved turnover growth of 20,2% for the year, with growth of 11,5% in comparable stores. The expansion policy continued with the opening of 14 new stores. No store refurbishments took place.
Football is the predominant sport followed by customers of the division, with exceptional interest being shown in the past year in the lead-up to the 2010 FIFA World Cup™ competition. Sales volumes of Bafana Bafana shirts were far beyond expectations.
Rugby continues to gain momentum and fitness and running remain key sports in the strategy of this chain.
Streamlining was undertaken to remove overlapping and substitutable product lines and add others in order to remain relevant to key sports categories. The objective has been to supply customers with ranges of products clearly defined by sport and gender.
Another innovation was the broadening of the range of Fusion own-brand
products by the introduction of new core products in apparel, accessories and equipment.
The Totalsports chain also increased its participation in co-operative events with manufacturers and distributors of internationally branded products in order to reinforce relationships both with these suppliers and with the public, and to raise awareness of the availability of these products in the stores. These relationships and the resulting consumer awareness have been important in the build-up to the 2010 FIFA World Cup™ and to the overall business climate that will confront Totalsports in the coming years.
Because of the growing public enthusiasm for football, the chain has maintained and extended its involvement in grassroots football events, interacting with more than 100 football clubs at various levels. These initiatives with the target market are supplemented by sports clinics for the staff of the chain, so building up the knowledge base and increasing commitment and energy at store level.
sportscene
Competition was again intense in South Africa in the past year particularly as a result of the entrenched position which international market participants have attained for themselves through strategies which include the opening of own-label stores and initiatives at various levels to attain dominance in segments of the retail industry.
The youth fashion market is recognised internationally as presenting opportunities for suppliers of major brands of sports products. This has led to the arrival of waves of new products and the heightened participation in the market by the major multinational players referred to above. In the jousting for retail presence which occurs, local retailers with limited competitive muscle can easily be displaced, but the division’s strength enables it to hold its own and to some extent to turn the international pressure to its own advantage.
The sportscene chain has again played a role in the participative activities of the

FOSC
HIN
I GRO
UP A
NN
UA
L REPORT 2010 - PA
GE 61
big international players, including the launches of new products, so ensuring that it can be first-to-market and can gain publicity in its own right.
The relentless pace of change in the youth market requires ongoing review of the chain’s marketing strategy. This brings about continuing change in the “look and feel” of marketing communication in order to keep it in step with fashion and hence deal effectively with competition.
A more intensive focus on sneakers and other footwear, aimed at enhancing the division’s leading position in this product category, has paid dividends. The own-label brand of Redbat continues to expand. Cellphones and airtime have been added to the ranges of products on offer.
sportscene opened nine new stores during the year and no refurbishments took place.
In another year of volatile trading conditions the chain’s turnover grew by 8,8%, but turnover in comparable stores was marginally lower by 0,4%.
DueSouth
DueSouth is the newest of the division’s chains. Effort is still being expended on raising public awareness for it and strengthening its reputation in the outdoor lifestyle market. The chain has one exclusive international range, The North Face and this exclusivity has helped to enhance the chain’s market position.
The chain also provides products under the in-house DueSouth trademark which play an accessible alternative and complementary role.
The product range continues to evolve and in the past year additional well-recognised and internationally known ranges of apparel and footwear, both for women and men, were introduced, together with an enhanced range of accessories and equipment.
A visual merchandising process has been undertaken to demarcate clearly in the stores the lifestyle and performance areas and to identify the trail-running, mountain-biking, outdoor and
exploration categories. It is clear that this process, which is continuing, has been welcomed by customers since it enhances the character and individuality of the DueSouth stores.
Four new DueSouth stores were opened in the past year.
Total turnover growth of the chain was 7,8%, while turnover in comparable stores was lower, by 2,9%. This result can be seen as a reflection both of the difficult economic climate and the teething stage of a young chain. Steps have been taken to widen the appeal of the product ranges and to secure more favourable sites for the chain in shopping centres.
STRATEGYIn the Totalsports chain there will be great emphasis in the coming year on maximising the public’s growing awareness and enthusiasm for the 2010 FIFA World Cup™ and providing an optimal selection of products for players and supporters.
SPORTS D
IVISIO
N

FOSC
HIN
I GRO
UP A
NN
UA
L REPORT 2010 - PA
GE 62
OPERATIO
NA
L REVIEW
– SPORTS D
IVISIO
N C
ON
TINU
ED
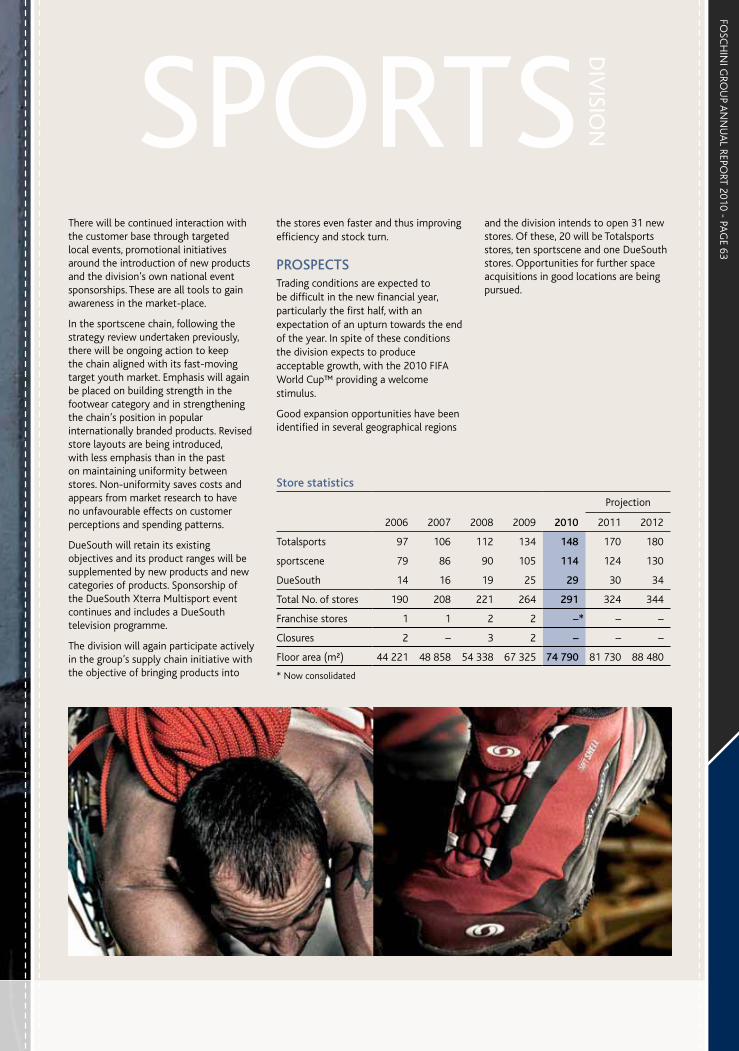
FOSC
HIN
I GRO
UP A
NN
UA
L REPORT 2010 - PA
GE 63
There will be continued interaction with the customer base through targeted local events, promotional initiatives around the introduction of new products and the division’s own national event sponsorships. These are all tools to gain awareness in the market-place.
In the sportscene chain, following the strategy review undertaken previously, there will be ongoing action to keep the chain aligned with its fast-moving target youth market. Emphasis will again be placed on building strength in the footwear category and in strengthening the chain’s position in popular internationally branded products. Revised store layouts are being introduced, with less emphasis than in the past on maintaining uniformity between stores. Non-uniformity saves costs and appears from market research to have no unfavourable effects on customer perceptions and spending patterns.
DueSouth will retain its existing objectives and its product ranges will be supplemented by new products and new categories of products. Sponsorship of the DueSouth Xterra Multisport event continues and includes a DueSouth television programme.
The division will again participate actively in the group’s supply chain initiative with the objective of bringing products into
the stores even faster and thus improving efficiency and stock turn.
PROSPECTSTrading conditions are expected to be difficult in the new financial year, particularly the first half, with an expectation of an upturn towards the end of the year. In spite of these conditions the division expects to produce acceptable growth, with the 2010 FIFA World Cup™ providing a welcome stimulus.
Good expansion opportunities have been identified in several geographical regions
and the division intends to open 31 new stores. Of these, 20 will be Totalsports stores, ten sportscene and one DueSouth stores. Opportunities for further space acquisitions in good locations are being pursued.
Store statistics
Projection
2006 2007 2008 2009 2010 2011 2012
Totalsports 97 106 112 134 148 170 180
sportscene 79 86 90 105 114 124 130
DueSouth 14 16 19 25 29 30 34
Total No. of stores 190 208 221 264 291 324 344
Franchise stores 1 1 2 2 –* – –
Closures 2 – 3 2 – – –
Floor area (m²) 44 221 48 858 54 338 67 325 74 790 81 730 88 480
* Now consolidated
SPORTS D
IVISIO
N

FOSC
HIN
I GRO
UP A
NN
UA
L REPORT 2010 - PA
GE 64
OPERATIO
NA
L REVIEW
– JEWELLERY D
IVISIO
N
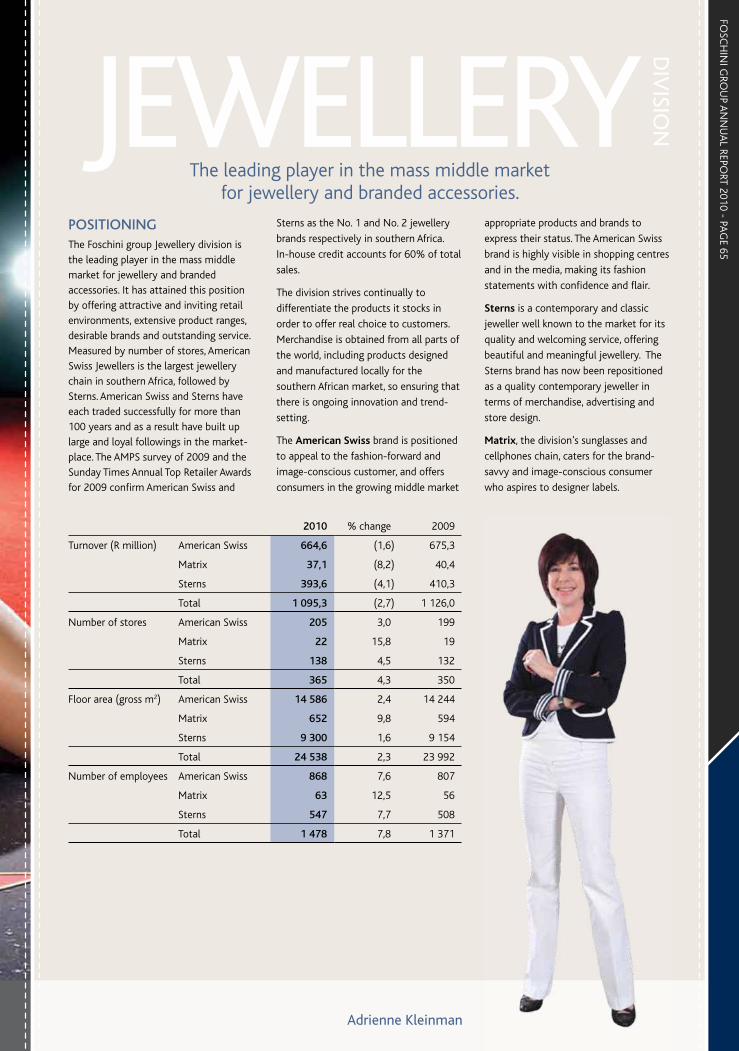
FOSC
HIN
I GRO
UP A
NN
UA
L REPORT 2010 - PA
GE 65
POSITIONINGThe Foschini group Jewellery division is the leading player in the mass middle market for jewellery and branded accessories. It has attained this position by offering attractive and inviting retail environments, extensive product ranges, desirable brands and outstanding service. Measured by number of stores, American Swiss Jewellers is the largest jewellery chain in southern Africa, followed by Sterns. American Swiss and Sterns have each traded successfully for more than 100 years and as a result have built up large and loyal followings in the market-place. The AMPS survey of 2009 and the Sunday Times Annual Top Retailer Awards for 2009 confirm American Swiss and
Sterns as the No. 1 and No. 2 jewellery
brands respectively in southern Africa.
In-house credit accounts for 60% of total
sales.
The division strives continually to
differentiate the products it stocks in
order to offer real choice to customers.
Merchandise is obtained from all parts of
the world, including products designed
and manufactured locally for the
southern African market, so ensuring that
there is ongoing innovation and trend-
setting.
The American Swiss brand is positioned
to appeal to the fashion-forward and
image-conscious customer, and offers
consumers in the growing middle market
appropriate products and brands to
express their status. The American Swiss
brand is highly visible in shopping centres
and in the media, making its fashion
statements with confidence and flair.
Sterns is a contemporary and classic
jeweller well known to the market for its
quality and welcoming service, offering
beautiful and meaningful jewellery. The
Sterns brand has now been repositioned
as a quality contemporary jeweller in
terms of merchandise, advertising and
store design.
Matrix, the division’s sunglasses and
cellphones chain, caters for the brand-
savvy and image-conscious consumer
who aspires to designer labels.
2010 % change 2009
Turnover (R million) American Swiss 664,6 (1,6) 675,3
Matrix 37,1 (8,2) 40,4
Sterns 393,6 (4,1) 410,3
Total 1 095,3 (2,7) 1 126,0
Number of stores American Swiss 205 3,0 199
Matrix 22 15,8 19
Sterns 138 4,5 132
Total 365 4,3 350
Floor area (gross m2) American Swiss 14 586 2,4 14 244
Matrix 652 9,8 594
Sterns 9 300 1,6 9 154
Total 24 538 2,3 23 992
Number of employees American Swiss 868 7,6 807
Matrix 63 12,5 56
Sterns 547 7,7 508
Total 1 478 7,8 1 371
The leading player in the mass middle market for jewellery and branded accessories.
JEWELLERY D
IVISIO
N
Adrienne Kleinman

FOSC
HIN
I GRO
UP A
NN
UA
L REPORT 2010 - PA
GE 66
OPERATIO
NA
L REVIEW
– JEWELLERY D
IVISIO
N C
ON
TINU
ED
REVIEW OF THE YEARThe division’s sales contracted by 2,7% for the year. In view of the global economic crisis and the fact that the products on offer are mainly in the luxury category, this result is neither surprising nor unsatisfactory.
The marketing budget was realigned to reflect the tightening of the economy and to ensure that advertising spend was focused on driving turnover while nevertheless protecting the brands’ essence. Divisional expenses were well controlled but additional promotional activity took place.
In recognition of the needs of consumers in the downturn, increased promotional activity was undertaken across all three brands in order to offer customers additional value for their money. This resulted in an increase in the mark-down to sales ratio to 11,6% from 10,1% in the previous year.
The Rand price of gold remained relatively stable last year after a 40% increase in the previous year. This made it possible for the prices of most gold products to be maintained at levels prevailing in the previous year, while the prices of certain lines were reduced in the promotional drive mentioned above, with notable benefits to customers.
Stock turn remained in line with prior years at 1,7 times. When trading started to slow down at the beginning of the year the division focused on managing the stock in order to ensure that closing stock levels were below those of last year. This created a strategically better starting position for the next year than that which prevailed in the past year.
The division opened 17 new stores in the year under review (seven American Swiss, seven Sterns, three Matrix). Two underperforming stores were closed (one American Swiss and one Sterns).
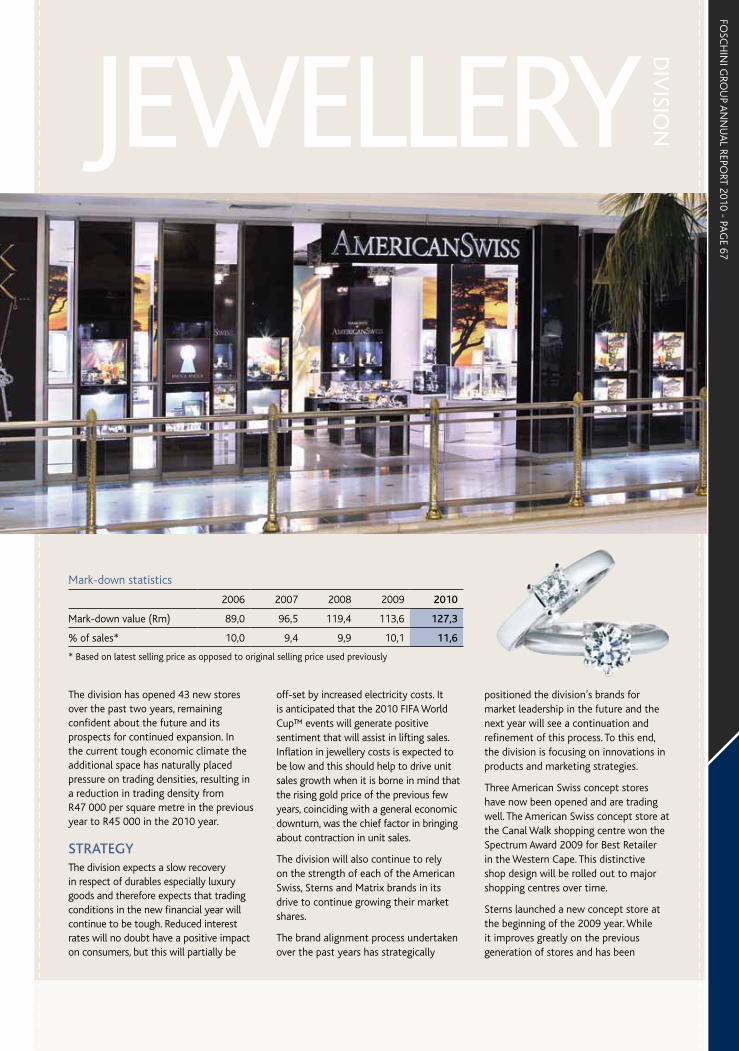
FOSC
HIN
I GRO
UP A
NN
UA
L REPORT 2010 - PA
GE 67
The division has opened 43 new stores over the past two years, remaining confident about the future and its prospects for continued expansion. In the current tough economic climate the additional space has naturally placed pressure on trading densities, resulting in a reduction in trading density from R47 000 per square metre in the previous year to R45 000 in the 2010 year.
STRATEGYThe division expects a slow recovery in respect of durables especially luxury goods and therefore expects that trading conditions in the new financial year will continue to be tough. Reduced interest rates will no doubt have a positive impact on consumers, but this will partially be
Mark-down statistics
2006 2007 2008 2009 2010
Mark-down value (Rm) 89,0 96,5 119,4 113,6 127,3
% of sales* 10,0 9,4 9,9 10,1 11,6
* Based on latest selling price as opposed to original selling price used previously
off-set by increased electricity costs. It is anticipated that the 2010 FIFA World Cup™ events will generate positive sentiment that will assist in lifting sales. Inflation in jewellery costs is expected to be low and this should help to drive unit sales growth when it is borne in mind that the rising gold price of the previous few years, coinciding with a general economic downturn, was the chief factor in bringing about contraction in unit sales.
The division will also continue to rely on the strength of each of the American Swiss, Sterns and Matrix brands in its drive to continue growing their market shares.
The brand alignment process undertaken over the past years has strategically
positioned the division’s brands for market leadership in the future and the next year will see a continuation and refinement of this process. To this end, the division is focusing on innovations in products and marketing strategies.
Three American Swiss concept stores have now been opened and are trading well. The American Swiss concept store at the Canal Walk shopping centre won the Spectrum Award 2009 for Best Retailer in the Western Cape. This distinctive shop design will be rolled out to major shopping centres over time.
Sterns launched a new concept store at the beginning of the 2009 year. While it improves greatly on the previous generation of stores and has been
JEWELLERY D
IVISIO
N

FOSC
HIN
I GRO
UP A
NN
UA
L REPORT 2010 - PA
GE 68
OPERATIO
NA
L REVIEW
– JEWELLERY D
IVISIO
N C
ON
TINU
ED
well accepted by customers, there is opportunity for further refinement of the concept. When finalised it will serve as the basis for all new stores in the Sterns chain.
The Jewellery division considers that customer service is a key differentiator. Accordingly, the division is continuing to improve the training programmes used in stores and at the group’s head office in order to ensure that all staff members are aligned with the division’s customer
focus and its core values. Further details on the group’s human resource activities – including employment equity, skills development, and occupational health and safety – are provided in the Human Resources review.
Supply chain management continues to be a key focus within the group and the division has launched several initiatives that will, over the next few years, build a supplier pipeline that has greater flexibility and shorter lead times than have prevailed in the past, while also
ensuring adherence to ethical, labour and environmental performance standards. This should result in improved decision-making and operational efficiency. The division complies with the requirements of the Kimberley Process, aimed at ensuring that all diamonds have been purchased from legitimate sources not involved in funding of conflict, in compliance with the United Nations Resolutions. Further details on the nature of the division’s supply chain management and auditing activities are
Store statistics
Projection
2006 2007 2008 2009 2010 2011 2012
American Swiss 179 181 187 199 205 212 215
Sterns 115 121 122 132 138 143 150
Matrix 14 14 19 19 22 24 26
Total No. of stores 308 316 328 350 365 379 391
Closures 3 4 7 4 2 2 2
Floor area (m2) 21 580 22 029 22 519 23 992 24 538 25 308 26 018

FOSC
HIN
I GRO
UP A
NN
UA
L REPORT 2010 - PA
GE 69
JEWELLERY D
IVISIO
N
provided in the Supply Chain and Group Merchandise Procurement reviews.
The division’s store location strategy includes the continuous monitoring of performance trends and where economic factors so dictate, closures or consolidation will proceed. Locations in new and existing shopping centres where the division’s stores are under-represented have been identified, and new stores will be opened in prime positions. Great care is taken in ensuring that new stores are appropriately sized. A measured view of expansion is taken, in line with the core strategy of seeking long-term growth in sales and profit.
PROSPECTSAs has been indicated above, the division expects that trading in the next year will be subdued, in line with conditions in the broader economy, but it is confident that the strength of its brands, the positive cash flow of the group and the expertise of staff members will enable the division to grow its turnover and market share, with benefits to overall profitability.

FOSC
HIN
I GRO
UP A
NN
UA
L REPORT 2010 - PA
GE 70
OPERATIO
NA
L REVIEW
– @H
OM
E
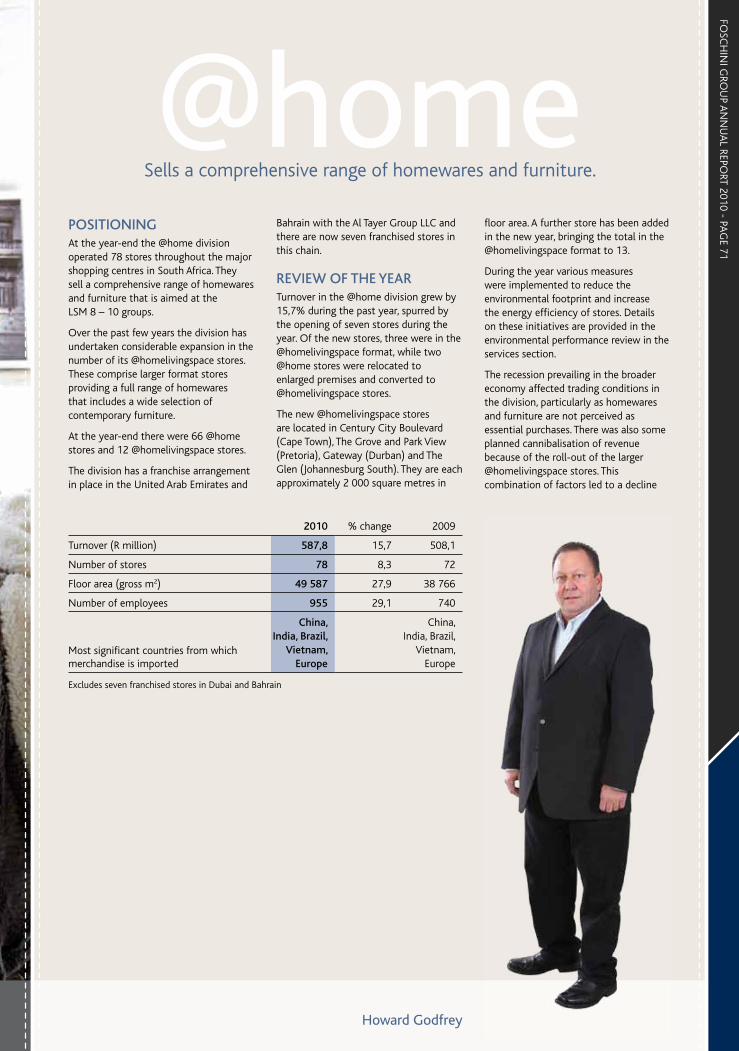
FOSC
HIN
I GRO
UP A
NN
UA
L REPORT 2010 - PA
GE 71
POSITIONINGAt the year-end the @home division operated 78 stores throughout the major shopping centres in South Africa. They sell a comprehensive range of homewares and furniture that is aimed at the LSM 8 – 10 groups.
Over the past few years the division has undertaken considerable expansion in the number of its @homelivingspace stores. These comprise larger format stores providing a full range of homewares that includes a wide selection of contemporary furniture.
At the year-end there were 66 @home stores and 12 @homelivingspace stores.
The division has a franchise arrangement in place in the United Arab Emirates and
Bahrain with the Al Tayer Group LLC and there are now seven franchised stores in this chain.
REVIEW OF THE YEARTurnover in the @home division grew by 15,7% during the past year, spurred by the opening of seven stores during the year. Of the new stores, three were in the @homelivingspace format, while two @home stores were relocated to enlarged premises and converted to @homelivingspace stores.
The new @homelivingspace stores are located in Century City Boulevard (Cape Town), The Grove and Park View (Pretoria), Gateway (Durban) and The Glen (Johannesburg South). They are each approximately 2 000 square metres in
floor area. A further store has been added in the new year, bringing the total in the @homelivingspace format to 13.
During the year various measures were implemented to reduce the environmental footprint and increase the energy efficiency of stores. Details on these initiatives are provided in the environmental performance review in the services section.
The recession prevailing in the broader economy affected trading conditions in the division, particularly as homewares and furniture are not perceived as essential purchases. There was also some planned cannibalisation of revenue because of the roll-out of the larger @homelivingspace stores. This combination of factors led to a decline
Sells a comprehensive range of homewares and furniture.
@home
2010 % change 2009
Turnover (R million) 587,8 15,7 508,1
Number of stores 78 8,3 72
Floor area (gross m2) 49 587 27,9 38 766
Number of employees 955 29,1 740
Most significant countries from which merchandise is imported
China, India, Brazil,
Vietnam, Europe
China, India, Brazil,
Vietnam, Europe
Excludes seven franchised stores in Dubai and Bahrain
Howard Godfrey

FOSC
HIN
I GRO
UP A
NN
UA
L REPORT 2010 - PA
GE 72
OPERATIO
NA
L REVIEW
– @H
OM
E CO
NTIN
UED
of 6,3% in turnover on a comparable store basis but the overall turnover of the division, enlarged by the additional stores, grew by 15,7%.
Because of the pressure experienced by the homewares sector in the recent recessionary times, special measures were taken to sharpen cost controls and stock levels were kept in line with turnover.
As part of ongoing efforts to ensure responsible supply chain management for all its wooden outdoor furniture, the division endeavours to only source wood from factories that are Forest Stewardship Council (FSC) certified, especially where teak or balua is concerned. An important development this year has been the introduction of a revised supplier auditing process aimed at ensuring that all contractual obligations are being met, including all legal, ethical, environmental, labour, and health and safety compliance. Further details on the nature of the group’s supply chain management and auditing activities are provided in the Supply Chain and Group Merchandise Procurement reviews.
Mark-down statistics
2006 2007 2008 2009 2010
Mark-down value (Rm) 27,1 39,3 47,3 46,5 72,4
% of sales 7,5 8,3 9,0 8,0 10,7
The volume of marked down sales was inevitably higher because of the prevailing recessionary conditions and the opportunity was taken to clear lines of stock unsuitable for future trading.
Trading density for the past year in comparable stores was R16 200 per square metre.
The franchised chain in the United Arab Emirates and Bahrain, now extending to seven stores, has also been affected by the global recession, but it is clear that the @home concept and brand have been well received in the region.
Investing in talent development is an ongoing focus to ensure a supply of talent and skills to meet our business requirements. Details on the group’s
human resource activities – including employment equity, skills development, and occupational health and safety – are provided in the Human Resources review.
STRATEGYThe @home division will open fewer stores in the next year. Of the five contemplated, four will be @home stores and one an @homelivingspace store, the latter to be opened in the Northern Province. Because of the quick roll-out of stores over the last few years, the next year will be a year of consolidation in order to improve efficiencies and increase trading densities.
Because of the difficult economic times the division is making a thorough review of its assortment of stock to ensure its
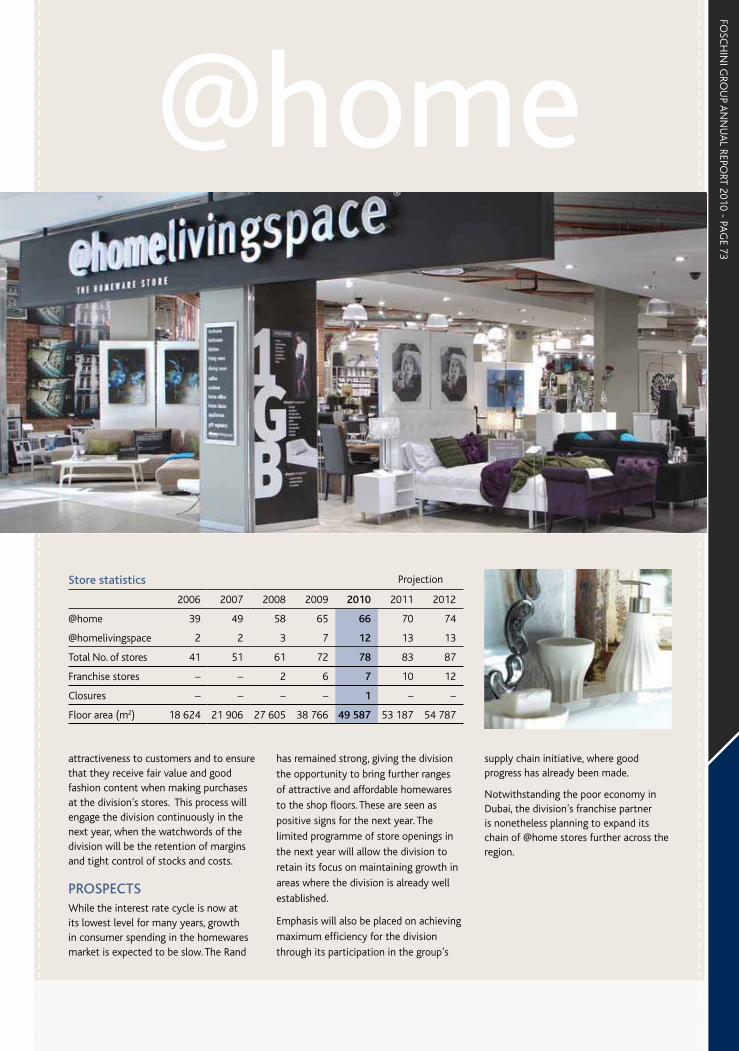
FOSC
HIN
I GRO
UP A
NN
UA
L REPORT 2010 - PA
GE 73
attractiveness to customers and to ensure that they receive fair value and good fashion content when making purchases at the division’s stores. This process will engage the division continuously in the next year, when the watchwords of the division will be the retention of margins and tight control of stocks and costs.
PROSPECTSWhile the interest rate cycle is now at its lowest level for many years, growth in consumer spending in the homewares market is expected to be slow. The Rand
has remained strong, giving the division
the opportunity to bring further ranges
of attractive and affordable homewares
to the shop floors. These are seen as
positive signs for the next year. The
limited programme of store openings in
the next year will allow the division to
retain its focus on maintaining growth in
areas where the division is already well
established.
Emphasis will also be placed on achieving
maximum efficiency for the division
through its participation in the group’s
Store statistics Projection
2006 2007 2008 2009 2010 2011 2012
@home 39 49 58 65 66 70 74
@homelivingspace 2 2 3 7 12 13 13
Total No. of stores 41 51 61 72 78 83 87
Franchise stores – – 2 6 7 10 12
Closures – – – – 1 – –
Floor area (m2) 18 624 21 906 27 605 38 766 49 587 53 187 54 787
@home
supply chain initiative, where good progress has already been made.
Notwithstanding the poor economy in Dubai, the division’s franchise partner is nonetheless planning to expand its chain of @home stores further across the region.

FOSC
HIN
I GRO
UP A
NN
UA
L REPORT 2010 - PA
GE 74
OPERATIO
NA
L REVIEW
– SUPPLY C
HA
IN
OVERVIEWEffort was divided in the past year between consolidation of the process changes made during the past two years and preparation for another wave of process changes. All this activity has the ultimate objective of achieving improved stock turn and in order to bring this about, the group is striving to create a world-class model of supply chain management. In the work done so far fundamental aspects of the business as it had traditionally been conducted have already been challenged and, where necessary, changed.
Measurable progress in this ambitious project is shown by the fact that the volume of stock held in the group’s eight distribution centres (DCs) at the year-end was 64% lower than at the end of the previous year. This was almost entirely the result of improvements in process efficiencies.
Various initiatives were employed to achieve this reduction. Among them were improving the rate at which stock is processed through the DCs, changing planning cycles to accommodate shorter throughput time and implementing a conformance programme to ensure that suppliers deliver merchandise when and where it is required. The beneficial results which are to be brought about in the longer term include a more efficiently co-ordinated order management cycle and the ability to react with speed and precision to changes in buying patterns, which are in effect dictated by changes in fashion. The final result, to be achieved in progressive steps over a number of years, is intended to be substantial improvements in rates of stock turn and correspondingly increased levels of profit.
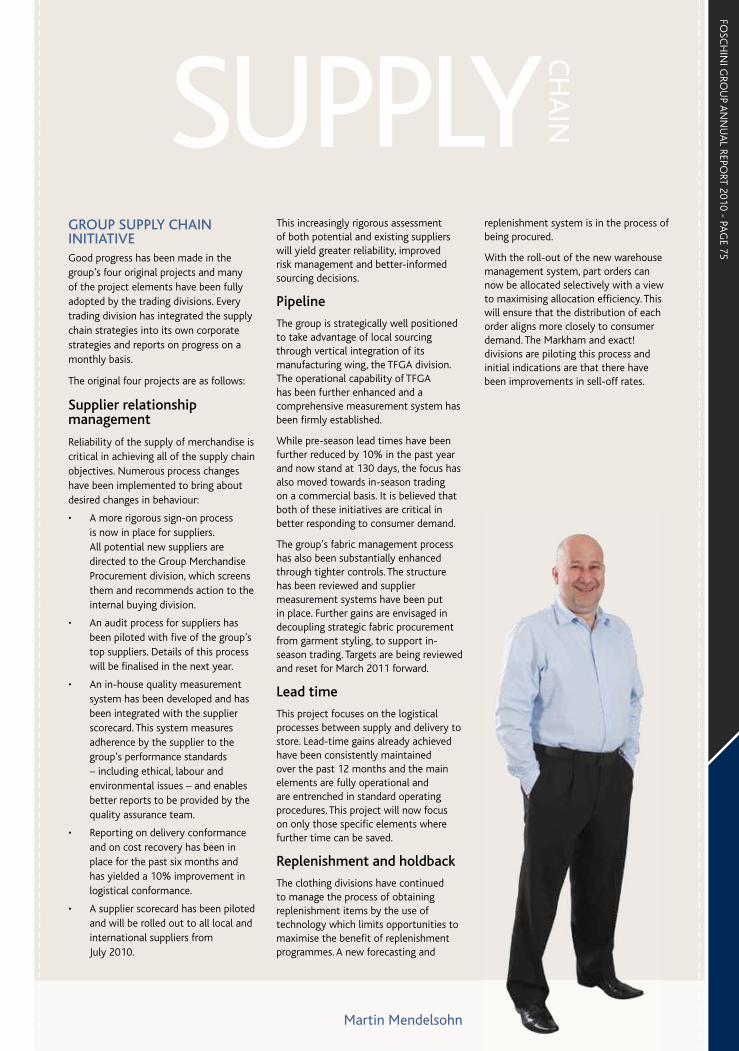
FOSC
HIN
I GRO
UP A
NN
UA
L REPORT 2010 - PA
GE 75
GROUP SUPPLY CHAIN INITIATIVEGood progress has been made in the group’s four original projects and many of the project elements have been fully adopted by the trading divisions. Every trading division has integrated the supply chain strategies into its own corporate strategies and reports on progress on a monthly basis.
The original four projects are as follows:
Supplier relationship management
Reliability of the supply of merchandise is critical in achieving all of the supply chain objectives. Numerous process changes have been implemented to bring about desired changes in behaviour:
• A more rigorous sign-on process is now in place for suppliers. All potential new suppliers are directed to the Group Merchandise Procurement division, which screens them and recommends action to the internal buying division.
• An audit process for suppliers has been piloted with five of the group’s top suppliers. Details of this process will be finalised in the next year.
• An in-house quality measurement system has been developed and has been integrated with the supplier scorecard. This system measures adherence by the supplier to the group’s performance standards – including ethical, labour and environmental issues – and enables better reports to be provided by the quality assurance team.
• Reporting on delivery conformance and on cost recovery has been in place for the past six months and has yielded a 10% improvement in logistical conformance.
• A supplier scorecard has been piloted and will be rolled out to all local and international suppliers from July 2010.
This increasingly rigorous assessment of both potential and existing suppliers will yield greater reliability, improved risk management and better-informed sourcing decisions.
Pipeline
The group is strategically well positioned to take advantage of local sourcing through vertical integration of its manufacturing wing, the TFGA division. The operational capability of TFGA has been further enhanced and a comprehensive measurement system has been firmly established.
While pre-season lead times have been further reduced by 10% in the past year and now stand at 130 days, the focus has also moved towards in-season trading on a commercial basis. It is believed that both of these initiatives are critical in better responding to consumer demand.
The group’s fabric management process has also been substantially enhanced through tighter controls. The structure has been reviewed and supplier measurement systems have been put in place. Further gains are envisaged in decoupling strategic fabric procurement from garment styling, to support in-season trading. Targets are being reviewed and reset for March 2011 forward.
Lead time
This project focuses on the logistical processes between supply and delivery to store. Lead-time gains already achieved have been consistently maintained over the past 12 months and the main elements are fully operational and are entrenched in standard operating procedures. This project will now focus on only those specific elements where further time can be saved.
Replenishment and holdback
The clothing divisions have continued to manage the process of obtaining replenishment items by the use of technology which limits opportunities to maximise the benefit of replenishment programmes. A new forecasting and
Martin Mendelsohn
replenishment system is in the process of being procured.
With the roll-out of the new warehouse management system, part orders can now be allocated selectively with a view to maximising allocation efficiency. This will ensure that the distribution of each order aligns more closely to consumer demand. The Markham and exact! divisions are piloting this process and initial indications are that there have been improvements in sell-off rates.
SUPPLYC
HA
IN

FOSC
HIN
I GRO
UP A
NN
UA
L REPORT 2010 - PA
GE 76
OPERATIO
NA
L REVIEW
– TFG A
PPAREL SU
PPLY CO
MPA
NY
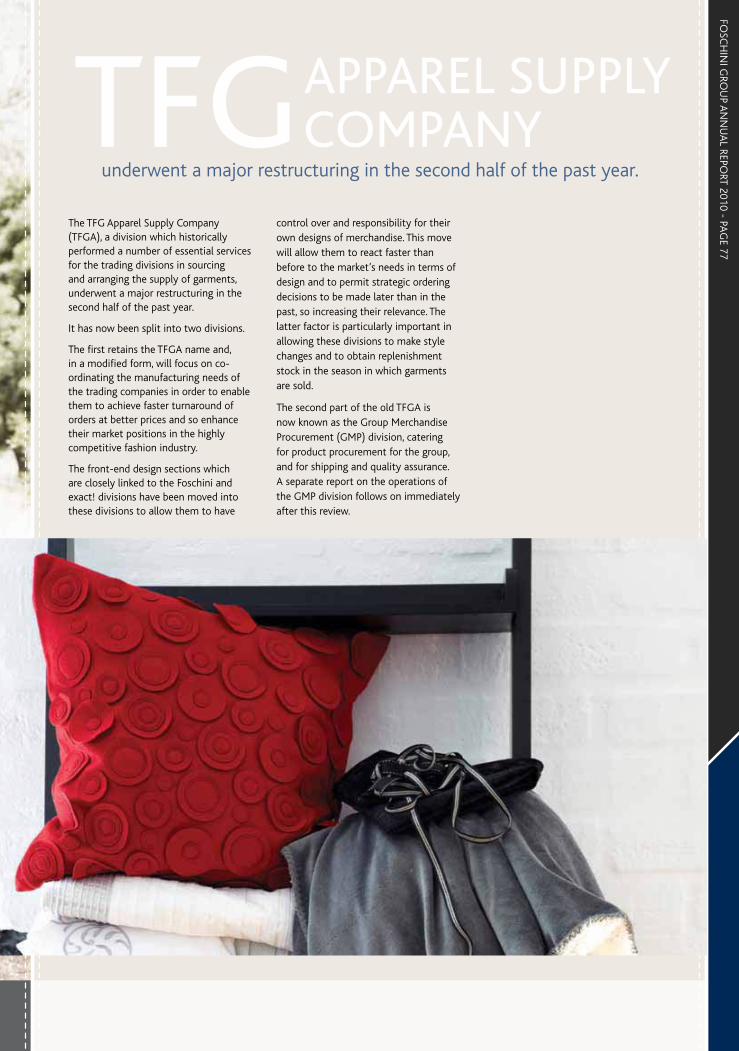
FOSC
HIN
I GRO
UP A
NN
UA
L REPORT 2010 - PA
GE 77
The TFG Apparel Supply Company (TFGA), a division which historically performed a number of essential services for the trading divisions in sourcing and arranging the supply of garments, underwent a major restructuring in the second half of the past year.
It has now been split into two divisions.
The first retains the TFGA name and, in a modified form, will focus on co-ordinating the manufacturing needs of the trading companies in order to enable them to achieve faster turnaround of orders at better prices and so enhance their market positions in the highly competitive fashion industry.
The front-end design sections which are closely linked to the Foschini and exact! divisions have been moved into these divisions to allow them to have
control over and responsibility for their own designs of merchandise. This move will allow them to react faster than before to the market’s needs in terms of design and to permit strategic ordering decisions to be made later than in the past, so increasing their relevance. The latter factor is particularly important in allowing these divisions to make style changes and to obtain replenishment stock in the season in which garments are sold.
The second part of the old TFGA is now known as the Group Merchandise Procurement (GMP) division, catering for product procurement for the group, and for shipping and quality assurance. A separate report on the operations of the GMP division follows on immediately after this review.
APPAREL SUPPLY COMPANY TFG
underwent a major restructuring in the second half of the past year.
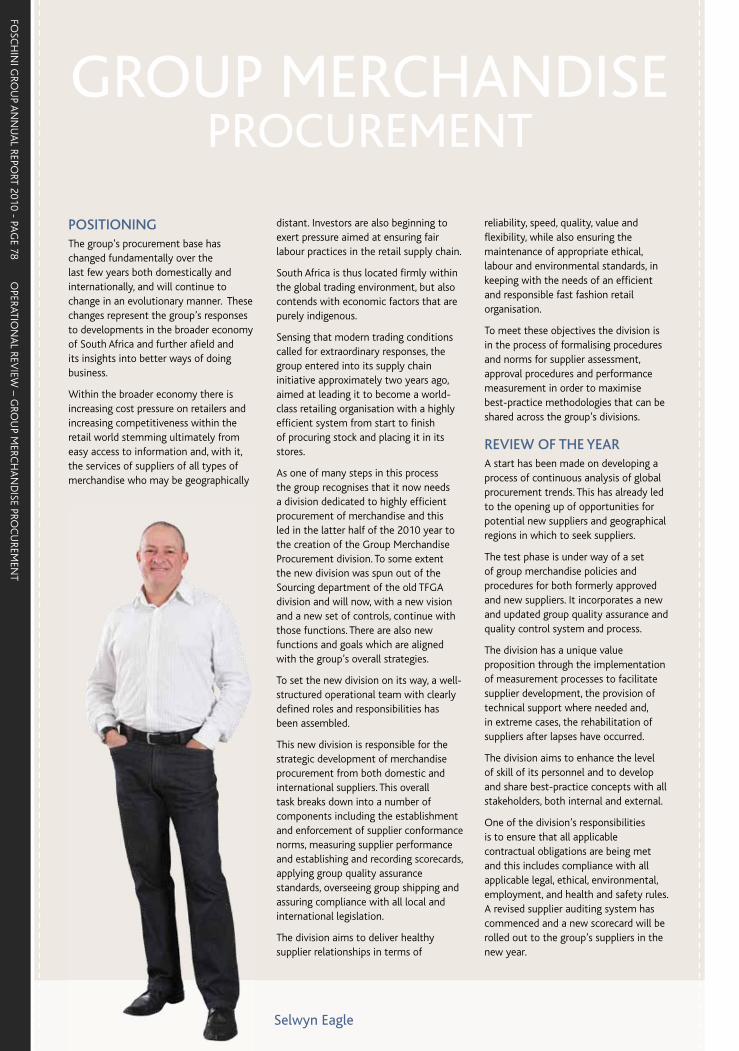
FOSC
HIN
I GRO
UP A
NN
UA
L REPORT 2010 - PA
GE 78
OPERATIO
NA
L REVIEW
– GRO
UP M
ERCH
AN
DISE PRO
CU
REMEN
T
Selwyn Eagle
GROUP MERCHANDISE PROCUREMENT
POSITIONINGThe group’s procurement base has changed fundamentally over the last few years both domestically and internationally, and will continue to change in an evolutionary manner. These changes represent the group’s responses to developments in the broader economy of South Africa and further afield and its insights into better ways of doing business.
Within the broader economy there is increasing cost pressure on retailers and increasing competitiveness within the retail world stemming ultimately from easy access to information and, with it, the services of suppliers of all types of merchandise who may be geographically
distant. Investors are also beginning to exert pressure aimed at ensuring fair labour practices in the retail supply chain.
South Africa is thus located firmly within the global trading environment, but also contends with economic factors that are purely indigenous.
Sensing that modern trading conditions called for extraordinary responses, the group entered into its supply chain initiative approximately two years ago, aimed at leading it to become a world-class retailing organisation with a highly efficient system from start to finish of procuring stock and placing it in its stores.
As one of many steps in this process the group recognises that it now needs a division dedicated to highly efficient procurement of merchandise and this led in the latter half of the 2010 year to the creation of the Group Merchandise Procurement division. To some extent the new division was spun out of the Sourcing department of the old TFGA division and will now, with a new vision and a new set of controls, continue with those functions. There are also new functions and goals which are aligned with the group’s overall strategies.
To set the new division on its way, a well-structured operational team with clearly defined roles and responsibilities has been assembled.
This new division is responsible for the strategic development of merchandise procurement from both domestic and international suppliers. This overall task breaks down into a number of components including the establishment and enforcement of supplier conformance norms, measuring supplier performance and establishing and recording scorecards, applying group quality assurance standards, overseeing group shipping and assuring compliance with all local and international legislation.
The division aims to deliver healthy supplier relationships in terms of
reliability, speed, quality, value and flexibility, while also ensuring the maintenance of appropriate ethical, labour and environmental standards, in keeping with the needs of an efficient and responsible fast fashion retail organisation.
To meet these objectives the division is in the process of formalising procedures and norms for supplier assessment, approval procedures and performance measurement in order to maximise best-practice methodologies that can be shared across the group’s divisions.
REVIEW OF THE YEARA start has been made on developing a process of continuous analysis of global procurement trends. This has already led to the opening up of opportunities for potential new suppliers and geographical regions in which to seek suppliers.
The test phase is under way of a set of group merchandise policies and procedures for both formerly approved and new suppliers. It incorporates a new and updated group quality assurance and quality control system and process.
The division has a unique value proposition through the implementation of measurement processes to facilitate supplier development, the provision of technical support where needed and, in extreme cases, the rehabilitation of suppliers after lapses have occurred.
The division aims to enhance the level of skill of its personnel and to develop and share best-practice concepts with all stakeholders, both internal and external.
One of the division’s responsibilities is to ensure that all applicable contractual obligations are being met and this includes compliance with all applicable legal, ethical, environmental, employment, and health and safety rules. A revised supplier auditing system has commenced and a new scorecard will be rolled out to the group’s suppliers in the new year.

FOSC
HIN
I GRO
UP A
NN
UA
L REPORT 2010 - PA
GE 79
Through the Shipping department and partnerships with service providers, the division manages all of the group’s payments for freight, international logistics, foreign exchange and merchandise.
By implementing a number of supply chain initiatives the division has been able to reduce transit times in order to facilitate speed to the market-place.
The diagram above illustrates the basic structure and functions of the division.
STRATEGYThe management team has identified key strategic objectives for the near and more distant future and these are being disseminated throughout the division and the group.
These objectives are built on the pillars of profit, people, process and suppliers, underpinned by effective communication.
PROSPECTSThe division’s immediate task is to ensure that the group acquires and maintains
a comprehensive and fully documented database, which is used to map, record and report on all suppliers in terms of their strengths and weaknesses. This includes implementing a formalised standard supplier take-on process to ensure consistency throughout the group.
A further aim in the next year is to implement upstream quality assurance processes both locally and internationally, covering all merchandise categories in which the group trades.
An assessment is being made of a fully integrated foreign exchange management and logistics visibility system, which the division expects to acquire and bring into use during the course of the next year. This will provide the group with updated currency and logistics positions, enabling better and faster decisions to be made.
The division has played a pivotal role in the successful introduction of @home franchise stores in the United Arab Emirates and will play a similar role elsewhere as the group expands further into Africa.
High degree of competence and expertise
Accountability
Effective comm
unication
Clearly defi
ned outputs
Who are our suppliers?
(Sign on Scorecard) Supplier selection and development
Finance Shipping
HR
Standardisation
Quality management
Conformance management
What can they do better?
(Rehabilitation)
Do they meet our requirements?
(Scorecard)
How are they doing?

FOSC
HIN
I GRO
UP A
NN
UA
L REPORT 2010 - PA
GE 80
OPERATIO
NA
L REVIEW
– FINA
NC
IAL SERV
ICES

FOSC
HIN
I GRO
UP A
NN
UA
L REPORT 2010 - PA
GE 81
The Foschini group’s interest in financial services is vested in two areas:
FINANCIAL SERV
ICES
Peter Meiring
Foschini group
100% holding 55% holding
FG Financial Services RCS Group
Store Cards
Insurance
Club
Cellular
CRM
• a wholly-owned division named FG Financial Services which provides credit and related services to customers of the group; and
• a controlling interest in a company which focuses primarily on providing personal loans and some other financial services to customers of the group and others, as well as credit facilities to a number of retailers external to the Foschini group. This company is named the RCS Group.

FOSC
HIN
I GRO
UP A
NN
UA
L REPORT 2010 - PA
GE 82
OPERATIO
NA
L REVIEW
– FG FIN
AN
CIA
L SERVIC
ES
FG Financial Services manages the group’s in-store credit card programme, which consists of 14 different card formats. This includes managing the acquisition of new accounts, customer services, debt collection and recoveries, as well as all associated support services such as forensics and risk analysis.
This division also oversees the group’s interests in the Club, a facility which offers customers of the group a range of benefits including automatic insurance, medical helplines, promotional discounts, monthly draws and bursaries to the value of R2 million annually. A further range of insurance products offered to customers of the group is also managed by the division. These products include policies related to card loss, cellphone loss, personal protection and jewellery loss.
Certain group responsibilities relating to the procurement and management of cellphones, as well as the direct sales of airtime, are also managed by this division.
The Customer Relationship Management (CRM) department has developed significantly. It too reports into this division.
The division oversees the group’s membership of the Direct Marketing Association, to ensure it is fully compliant with their code of conduct. A process of ensuring full compliance with the Consumer Protection Act is in progress, to ensure compliance by the effective date. Compliance with the requirements of the National Credit Act is also ensured.
The division is pleased to report that there were no incidents of non-compliance with regulations and voluntary codes concerning marketing communications, including advertising, promotion and sponsorship by type of outcomes, during the year in review.
REVIEW OF THE YEARThe global economic conditions that faced the division during the previous year continued to have an impact in the 2010 year. Although interest rates fell in the previous year and continued to decline, many consumers found themselves without jobs or working fewer days at their places of employment.

FOSC
HIN
I GRO
UP A
NN
UA
L REPORT 2010 - PA
GE 83
Faced with these economic realities customers battled to meet their commitments. Hence defaults increased, as did the incidence of customers resorting to debt counsellors for relief. The value of debt counselling matters lodged with the division grew from R30,2 million at the end of the previous year to R76,8 million at the end of the 2010 year. It was disappointing that roughly a third of these account holders were customers of the group whose accounts were in a current status when they went into debt review.
Payments from consumers under debt review have been held up at various points in the process. The National Credit Regulator has recently put fresh impetus behind initiatives to ensure that payments flow consistently to creditors and the level of payments coming through from this source since January 2010 has been encouraging.
The number of accounts deteriorating into write-off started to level out toward the end of 2009 and there have been encouraging signs in the first three months of 2010. It is, however, likely that the recovery will be gradual and that no significant improvement in write-offs will be seen until later in the year.
The CRM department achieved successes in a number of areas in the past year. Invitational mailing volumes rose to the extent that, despite an increase in amounts written off and widespread reluctance on the part of consumers to open new accounts, growth of 4,4% was achieved in the total number of active accounts.
A start was made on the process of consolidating the group’s interests in cellular technologies, the internet and direct marketing. They are being combined into a single unit named the Retail Technology division. It is headed by Brad Fly, a seasoned retailer in the group. The step of centralising planning and procurement, as well as the inclusion of Vodacom in the range of cellular service providers, has already led to positive sales growth. Once the consolidation process is complete this division will focus on expanding the use of the internet to encourage retail sales.
The net result of these initiatives has been positive growth in the number of active customers on the book, growth of 16,4% in the division’s profit, and a healthy debtors’ book.
INTEREST INCOMEInterest income is derived from two credit sources. The first is a repayment plan extending over six months which only attracts interest if customers default on payments and the second is an extended plan of 12 or 18 months which attracts interest on a daily balance. At the year-end 52,2% of customers used 12- or 18-month plans and 70,7% of accounts were attracting interest.
The entire book is governed by the National Credit Act (NCA). The maximum interest rate that can be applied to the book is that prescribed by the formula under the NCA. During the year under review the repo rate dropped by 300 basis points. Because the interest rate charged by the group was below the maximum NCA rate, reductions in the NCA rate did not oblige the group to reduce its rate until the two had reached parity. The weighted rate for the year was 26,0%.
Net book growth for the year was 15,4%. This growth, underpinned by expansion in the extended credit book, led interest income to increase by 21,0%.
OTHER INCOMEInsuranceDuring the course of the year insurance products named “Legal” and “Women’s Only” were launched. They bring the group’s total insurance offering to seven products. Charges for the products
are evaluated against those prevailing elsewhere in the industry and it is clear that the group’s products are extremely competitive. They have been well received by the customer base. Net income from insurance activities grew by 34,0%.
ClubCustomers continue to prize the group’s Club offerings and recent ABC statistics attribute 950 000 subscribers to the main Club magazine, making it the third-largest retail magazine in the country. ClubX, a magazine aimed at the teenage market, was launched during the year. The take-up was significant, placing the magazine at the top of teen magazine circulation ratings. Total net revenues from all Club offerings rose by 24,4% over the year. This remains a growth area for the business and the expansion of The Club into related areas will be pursued in the next year.
One2OneOne2One is a discounted airtime offer sold through telemarketing. It provides the convenience of an airtime contract linked to a group card. At present this product is exclusively an MTN offering. Over recent months, as service levels have improved, the product has been sold with more conviction. The convenience of this product has been accepted by customers and the billing base grew by 46,2% in the year.
Pienaar Sithole and Associates (PSA)To counter a perceived trend by banks to own third-party debt recovery agencies, and hence a concern about the effort that would be applied to the group’s work
2010Rm
% change
2009Rm
Interest income 636,4 21,0 526,1
Other income 215,9 31,1 164,7
852,3 23,4 690,8
Net bad debt (359,1) 37,3 (261,5)
Credit costs (236,7) 13,3 (209,0)
Profit before tax 256,5 16,4 220,3
FG FINANCIAL SERV
ICES
FOSC
HIN
I GRO
UP A
NN
UA
L REPORT 2010 - PA
GE 84
OPERATIO
NA
L REVIEW
– FG FIN
AN
CIA
L SERVIC
ES CO
NTIN
UED
lodged with these agencies, the division started a business based in Randburg focused on the recovery of written off debt. During the latter part of the year the business was strengthened by the inclusion of a senior executive from the recovery industry. This business currently devotes itself exclusively to the group’s debt recoveries.
NET BAD DEBTCollections were a challenging area of the business in the past year. Gains were made in the previous year on improving early-stage delinquency levels and returning more customers to the status of buyers, and in the past year focus was renewed on the front end. By conducting credit awareness campaigns and improving its predictive risk capability, the division reduced the overall value of accounts rolling into collections by 4,3%. Nevertheless, those that did end up in collections proved to be more intractable, with the result that the value of accounts removed from collections fell by 1,0%.
Third-party recovery agencies, including the group’s own agency, PSA, also suffered as distressed accounts yielded lower repayments. The debt review process provided by the NCA as a relief mechanism to over-indebted customers also had the effect of delaying or pre-empting debt collection procedures. Payments recovered from payment distribution agencies for accounts under debt review have only recently started to improve.
FraudThe fraud detection scorecards introduced last year have continued to benefit the group despite the impact of a higher incidence of fraud on the industry. As a result the incidence of fraud during the year remained below the group’s internal threshold.
ProvisionsThe division continued its use of the Markov model to identify the level of inherent risk in its customer base. This tool has proved reliable in its responses to changes in payment behaviour and in predicting future levels of write-off. Performance in the division is continuously evaluated against the provision predictions of the Markov model. In the past year the model
required a R53,6 million charge to the income statement as against R31,7 million in the previous year. The doubtful debt provision now stands at R306,0 million, which represents 8,8% of the closing book compared to 8,5% of the closing book in the previous year.
Net bad debt, having been adversely affected by lower collection and recovery yields, grew by 37,3%. The ratio of net bad debt to credit transactions increased to 4,8% from 4,0% in the previous year while the ratio of total net bad debt written off to book debt increased to 9,9% from 8,7% in the previous year, but it is already showing a downward trend. It had been 9,7% at September 2009.
CUSTOMER RELATIONSHIP MANAGEMENT (CRM)One of the group’s recent key strategies has been to consolidate the CRM function into a central one serving all the trading divisions in the group. This focused, holistic approach has resulted in growth in new customer acquisitions, as well as further leveraging of the large customer base.
After entering the second year of the original three-year CRM strategy, the group has seen the results of its intensified focus on customer acquisition and retention. Invitational mailings to boost new accounts resulted in an additional 166 000 new accounts opened, despite the difficult economic climate. Benefits arising from these new customers will be seen in the next year.
Recognition for the division’s invitational mailing drive came in the form of its first Assegai Award at the Annual Direct Marketing ceremony. Assegai Awards acknowledge excellence in direct marketing, taking into account both the creative concept and the return on investment achieved.
A customer entrenchment programme was implemented to ensure that new customers enjoy their shopping and continue buying at stores in the group’s 14 retail chains. It remains a key objective of the division to enhance customers’ awareness of the range of lifestyle and fashion merchandise which is opened up to them by having an account with the group. The ability to cross-shop on a single account across 14 retail
chains is one of the group’s outstanding advantages over competitors.
In order to improve the gift options available across the different formats within the group, 14 types of gift cards were launched in all stores of the group. There was a positive response to these gift cards in terms of both the amount of media publicity generated and the extent of sales, which exceeded expectations. The gift cards replaced paper vouchers previously sold in the group’s stores and in the five months that have elapsed since the launch in November 2009 have generated more than double the value in turnover generated by the previous paper-based gift certificate programme.
The division was the recipient of two Gold Prism Awards at the annual PRISA gala function in recognition of the gift card initiative and its internal communication. These awards are presented to companies that successfully incorporate strategy, creativity and professionalism into their public relations and communication initiatives.
CREDIT COSTS Credit costs increased by 13,3% (as against 26,5% in the previous year) primarily as a result of the expanded invitational mailing programme and staffing increases for telemarketing.
PROFIT The year’s divisional profit increased by 16,4%, with growth of 31,1% in other income playing a major role in the overall increase.
STRATEGYThe division will continue its efforts to grow the active account base. This is a key point in the group’s operations since 62,6% of total merchandise sales are made on credit and account holders have furthermore proved to be highly receptive to the financial products supplied by the group.
Expansion is planned for The Club and in insurance and cellular products. Market research suggests that substantial growth in these areas can be expected, with the group’s credit account offerings as its foundation.
The Retail Technology division has already produced a substantial turnaround in
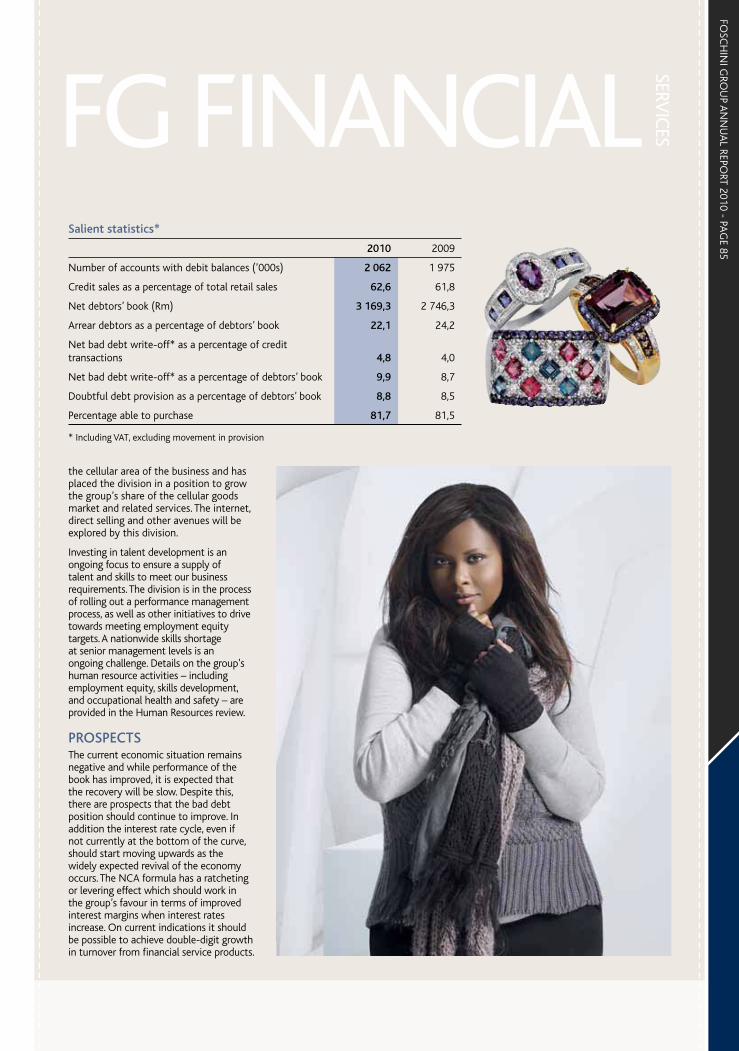
FOSC
HIN
I GRO
UP A
NN
UA
L REPORT 2010 - PA
GE 85
the cellular area of the business and has placed the division in a position to grow the group’s share of the cellular goods market and related services. The internet, direct selling and other avenues will be explored by this division.
Investing in talent development is an ongoing focus to ensure a supply of talent and skills to meet our business requirements. The division is in the process of rolling out a performance management process, as well as other initiatives to drive towards meeting employment equity targets. A nationwide skills shortage at senior management levels is an ongoing challenge. Details on the group’s human resource activities – including employment equity, skills development, and occupational health and safety – are provided in the Human Resources review.
PROSPECTSThe current economic situation remains negative and while performance of the book has improved, it is expected that the recovery will be slow. Despite this, there are prospects that the bad debt position should continue to improve. In addition the interest rate cycle, even if not currently at the bottom of the curve, should start moving upwards as the widely expected revival of the economy occurs. The NCA formula has a ratcheting or levering effect which should work in the group’s favour in terms of improved interest margins when interest rates increase. On current indications it should be possible to achieve double-digit growth in turnover from financial service products.
Salient statistics*
2010 2009
Number of accounts with debit balances (’000s) 2 062 1 975
Credit sales as a percentage of total retail sales 62,6 61,8
Net debtors’ book (Rm) 3 169,3 2 746,3
Arrear debtors as a percentage of debtors’ book 22,1 24,2
Net bad debt write-off* as a percentage of credit transactions 4,8 4,0
Net bad debt write-off* as a percentage of debtors’ book 9,9 8,7
Doubtful debt provision as a percentage of debtors’ book 8,8 8,5
Percentage able to purchase 81,7 81,5
* Including VAT, excluding movement in provision
FG FINANCIAL SERV
ICES

FOSC
HIN
I GRO
UP A
NN
UA
L REPORT 2010 - PA
GE 86
OPERATIO
NA
L REVIEW
– RCS G
ROU
P

FOSC
HIN
I GRO
UP A
NN
UA
L REPORT 2010 - PA
GE 87
The RCS Group is an operationally independent consumer finance business that provides a broad range of financial services under its own brand and in association with a number of retail entities in South Africa, Namibia and Botswana. The RCS Group is majority owned by the Foschini group (55%) with The Standard Bank of South Africa holding the balance of the shares (45%).
The RCS Group is structured into two operating business units named Transactional Finance and Fixed Term Finance. The operating units are supported by a number of shared services. In addition, the RCS Group has an investment interest of 60% in an independent data management company named Effective Intelligence.
The Transactional Finance business unit is focused on facilitating credit sales for retailers at point of sale. Retail credit sales are supported in one of two ways:
• through an own-branded general-purpose private label card known as the RCS Card that is accepted at 13 500 retail outlets countrywide; and
• by managing private label and co-branded retail credit programmes for retailers under their own brands on an outsourced basis.
Currently the private label portfolio consists of the Queenspark card as well as in-store credit offerings in Game and Dion Wired stores. The co-branded card programme comprises the recently acquired AD Spitz and Cape Union Mart portfolios.
The Fixed Term Finance business unit provides personal loans and insurance products under the RCS brand to existing RCS Group, Foschini group and external customers through direct marketing methods.
The RCS Group is functionally separate from FG Financial Services and it has its own governance structure, branding, field of operation, management team, budgets and profit models. The decision to differentiate the businesses was taken at the establishment of the RCS business in 1999 in order to ensure that the Foschini group’s focus on its traditional
RCS GROUP
Schalk van der Merwe
RCS Group
Transactional Finance Fixed Term Finance Investments
General Purpose RCS Card
Personal Loans Effective Intelligence (60%)
Private Labels Queenspark, Game, Dion Wired
Insurance
Co-branded CardsAD Spitz, Cape Union Mart
Shared Services (HR, ICT, Risk, Analytics, Collections, Finance, Compliance and Marketing)
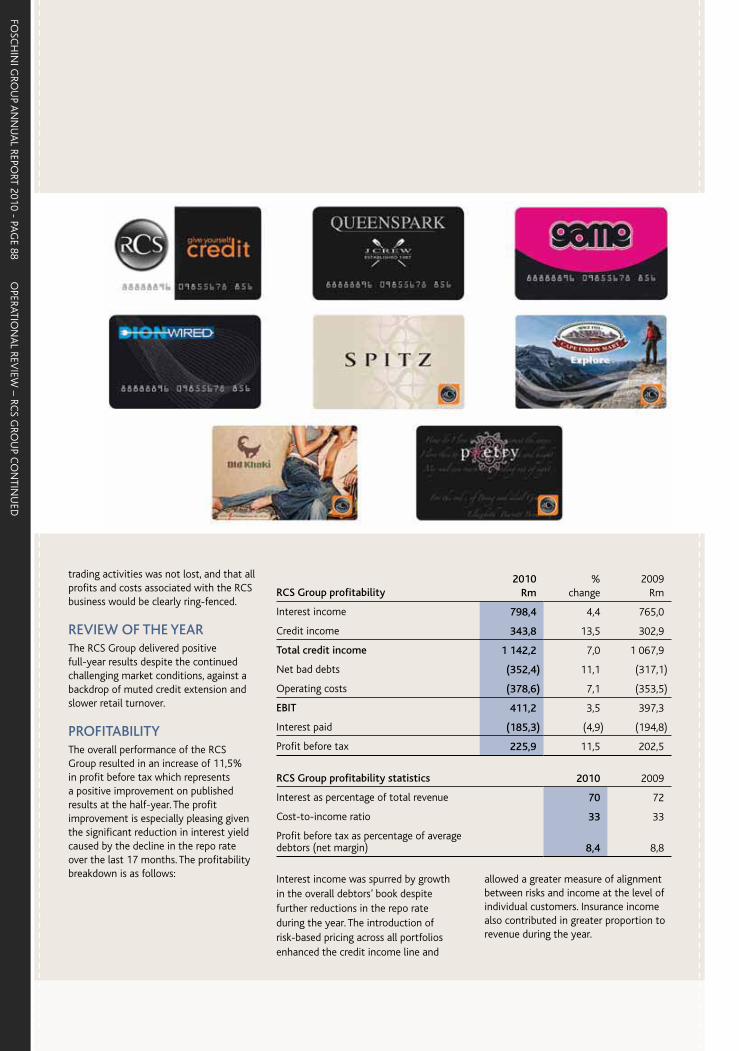
FOSC
HIN
I GRO
UP A
NN
UA
L REPORT 2010 - PA
GE 88
OPERATIO
NA
L REVIEW
– RCS G
ROU
P CO
NTIN
UED
trading activities was not lost, and that all profits and costs associated with the RCS business would be clearly ring-fenced.
REVIEW OF THE YEARThe RCS Group delivered positive full-year results despite the continued challenging market conditions, against a backdrop of muted credit extension and slower retail turnover.
PROFITABILITYThe overall performance of the RCS Group resulted in an increase of 11,5% in profit before tax which represents a positive improvement on published results at the half-year. The profit improvement is especially pleasing given the significant reduction in interest yield caused by the decline in the repo rate over the last 17 months. The profitability breakdown is as follows:
RCS Group profitability2010
Rm%
change2009 Rm
Interest income 798,4 4,4 765,0
Credit income 343,8 13,5 302,9
Total credit income 1 142,2 7,0 1 067,9
Net bad debts (352,4) 11,1 (317,1)
Operating costs (378,6) 7,1 (353,5)
EBIT 411,2 3,5 397,3
Interest paid (185,3) (4,9) (194,8)
Profit before tax 225,9 11,5 202,5
RCS Group profitability statistics 2010 2009
Interest as percentage of total revenue 70 72
Cost-to-income ratio 33 33
Profit before tax as percentage of average debtors (net margin) 8,4 8,8
Interest income was spurred by growth in the overall debtors’ book despite further reductions in the repo rate during the year. The introduction of risk-based pricing across all portfolios enhanced the credit income line and
allowed a greater measure of alignment between risks and income at the level of individual customers. Insurance income also contributed in greater proportion to revenue during the year.
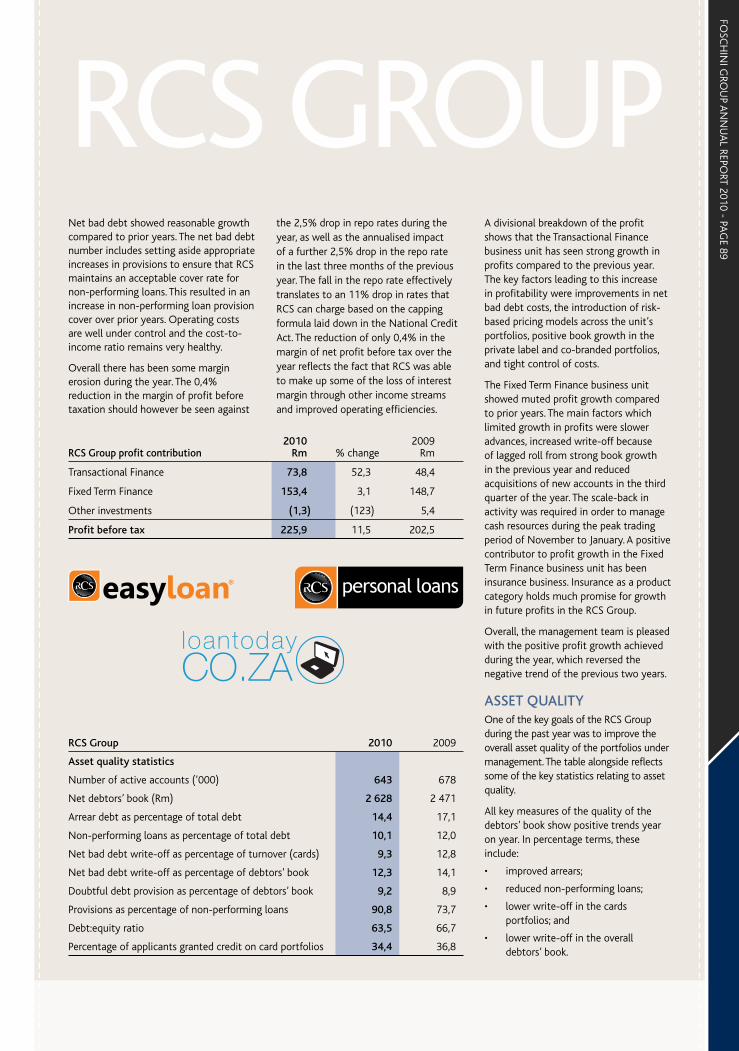
FOSC
HIN
I GRO
UP A
NN
UA
L REPORT 2010 - PA
GE 89
Net bad debt showed reasonable growth compared to prior years. The net bad debt number includes setting aside appropriate increases in provisions to ensure that RCS maintains an acceptable cover rate for non-performing loans. This resulted in an increase in non-performing loan provision cover over prior years. Operating costs are well under control and the cost-to-income ratio remains very healthy.
Overall there has been some margin erosion during the year. The 0,4% reduction in the margin of profit before taxation should however be seen against
the 2,5% drop in repo rates during the year, as well as the annualised impact of a further 2,5% drop in the repo rate in the last three months of the previous year. The fall in the repo rate effectively translates to an 11% drop in rates that RCS can charge based on the capping formula laid down in the National Credit Act. The reduction of only 0,4% in the margin of net profit before tax over the year reflects the fact that RCS was able to make up some of the loss of interest margin through other income streams and improved operating efficiencies.
RCS GROUP
RCS Group profit contribution2010
Rm % change2009
Rm
Transactional Finance 73,8 52,3 48,4
Fixed Term Finance 153,4 3,1 148,7
Other investments (1,3) (123) 5,4
Profit before tax 225,9 11,5 202,5
A divisional breakdown of the profit shows that the Transactional Finance business unit has seen strong growth in profits compared to the previous year. The key factors leading to this increase in profitability were improvements in net bad debt costs, the introduction of risk-based pricing models across the unit’s portfolios, positive book growth in the private label and co-branded portfolios, and tight control of costs.
The Fixed Term Finance business unit showed muted profit growth compared to prior years. The main factors which limited growth in profits were slower advances, increased write-off because of lagged roll from strong book growth in the previous year and reduced acquisitions of new accounts in the third quarter of the year. The scale-back in activity was required in order to manage cash resources during the peak trading period of November to January. A positive contributor to profit growth in the Fixed Term Finance business unit has been insurance business. Insurance as a product category holds much promise for growth in future profits in the RCS Group.
Overall, the management team is pleased with the positive profit growth achieved during the year, which reversed the negative trend of the previous two years.
ASSET QUALITYOne of the key goals of the RCS Group during the past year was to improve the overall asset quality of the portfolios under management. The table alongside reflects some of the key statistics relating to asset quality.
All key measures of the quality of the debtors’ book show positive trends year on year. In percentage terms, these include:
• improved arrears;
• reduced non-performing loans;
• lower write-off in the cards portfolios; and
• lower write-off in the overall debtors’ book.
RCS Group 2010 2009
Asset quality statistics
Number of active accounts (’000) 643 678
Net debtors’ book (Rm) 2 628 2 471
Arrear debt as percentage of total debt 14,4 17,1
Non-performing loans as percentage of total debt 10,1 12,0
Net bad debt write-off as percentage of turnover (cards) 9,3 12,8
Net bad debt write-off as percentage of debtors’ book 12,3 14,1
Doubtful debt provision as percentage of debtors’ book 9,2 8,9
Provisions as percentage of non-performing loans 90,8 73,7
Debt:equity ratio 63,5 66,7
Percentage of applicants granted credit on card portfolios 34,4 36,8
FOSC
HIN
I GRO
UP A
NN
UA
L REPORT 2010 - PA
GE 90
OPERATIO
NA
L REVIEW
– RCS G
ROU
P CO
NTIN
UED
Despite an improving position in non-performing loans, the provision for doubtful debts has been raised from 8,9% to 9,2% of book as a prudent measure. Cover for non-performing loans changed from 73,3% in the previous year to 90,9%. There are two key reasons for this change. The first is the acquisition of two new portfolios, Cape Union Mart and AD Spitz, which required specific new prudent provisions. Secondly, the Massdiscounters portfolio grew significantly, necessitating increased provisions to ensure that sufficient cover will be in place once book growth starts to taper down.
The RCS Group has set a target of at least 80% of cover for non-performing loans and will review this target annually in line with changes in the composition of portfolios. This supports a strategy to manage the asset quality in line with the expectations of investors in any of the RCS fund-raising programmes, as well as to maintain and strengthen the existing credit rating.
FUNDING Historically the primary source of funding used by the RCS Group was a term funding facility provided by its shareholders. During the year a project was initiated to diversify the sources of funding beyond the shareholders. This included fund-raising activities in the capital markets.
In this context one of the significant achievements of the year was the completion of a rating process and the launch of a R2 billion domestic medium-term note (DMTN) programme.
The rating process was completed by Moody’s in January 2010 with a rating of Baa1.za (long term) and P2.za (short term) with a negative outlook. The reasons for the negative outlook included uncertainty about the ability of the RCS Group to raise funding in the capital markets, its ability to grow profits positively and the general outlook for the South African consumer finance market.
The RCS Group went to market with its DMTN programme in March 2010 and was able to raise R303 million of funding in a mixture of long-term (four years) and short-term (12 months) paper. Subsequent to the year-end, an additional R250 million has been placed on a seven-year term. Following this successful launch the RCS Group expects to go to the capital markets periodically during the next year.
DIVISIONAL OVERVIEW
Transactional Finance
Overall, the Transactional Finance business unit (TF) had a good year, with growth being achieved in total account numbers, turnover and book size. It should be recalled that this unit manages three categories of portfolios, the RCS card portfolio, the private label portfolio and a co-branded portfolio.
The RCS card portfolio experienced a decline in card numbers, turnover and book size when compared to previous years. The decline in numbers was deliberately caused as part of a strategy to apply more stringent criteria in the qualification of new accounts. The decline in book size was a consequence of a decline in retail turnover in merchant outlets and is in line with reductions in general retail expenditure in the durable and semi-durable retail sector. Despite difficult trading conditions it proved possible to continue expanding the merchant network and the general-purpose RCS Card is now accepted nationally in 13 500 merchants’ outlets across a variety of industries. Several national retailers were added to the merchant network during the year, notably the Edgars Group, AD Spitz and Cape Union Mart.
Growing the private label portfolio continues to be a strategic goal of the RCS Group. Currently the RCS Group manages and owns the Queenspark, Game and Dion Wired private label portfolios. The Massdiscounters portfolio, consisting of the Game and Dion Wired
private label cards, showed significant growth. This was mainly attributable to the launch of a new private label card product in the business of both these merchants. Since this launch in September 2009 the take-up of cards has been very good and growth in both sales and book volumes has been significant. Various initiatives to improve efficiencies and reduce the cost-to-income ratio of this portfolio were also started. The Queenspark portfolio also continued to perform well and there was good growth in account numbers, turnover and book size.
During the year the AD Spitz and Cape Union Mart retail card books were purchased from First National Bank. Upon taking over the portfolios the RCS Group launched a new card offering into these merchant groups. The offering entails a co-branded card that carries the retailer’s brand on its face but allows purchases to be made not only at that retailer but also at the broader merchant network served by the RCS Group. This offering is particularly suited to smaller retail groups where running a full-scale private label offering is not financially viable. It is anticipated that the co-branded portfolio will expand with the addition of a selected number of quality brands in the next year.
Fixed Term Finance
The Fixed Term Finance business unit (FTF) focuses on the term lending and insurance portfolios. It provides personal loans and complementary insurance products to existing RCS customers, to the Foschini group’s customer base and to the public at large. It operates primarily on a direct marketing basis. Customers are attracted by the convenience and simplicity of the RCS products, with a large part of the sales process being handled telephonically. The high level of cross-selling and repeat business attests to the efficacy of this business model.
The personal loan portfolio declined in account numbers and book size over the year. As is indicated in the profit
FOSC
HIN
I GRO
UP A
NN
UA
L REPORT 2010 - PA
GE 91
review section, new account activity was curtailed during the third quarter in order to optimise the management of cash resources available in the business during the peak retail trading period of November to January. The reduction in account numbers was also influenced by deliberate action in setting more stringent qualifying criteria for new accounts. An adjustment to the term lending criteria made in the second quarter also affected the book size. Its result was a reduction in the average outstanding term of the book and a consequent faster pay-down by customers.
The RCS Group also has a home loan business which is an origination model in partnership with SA Home Loans and is an extremely small component of the overall business. During the year all origination activities in this portfolio were stopped as a result of very difficult trading conditions in the home loan origination market. The home loan origination model is currently being reviewed and it is anticipated that if feasible new origination will be selectively resumed in the next year.
The insurance business consists primarily of credit life insurance products that are sold in conjunction with various credit products offered by the RCS Group. The insurance portfolio showed good year-on-year growth through the introduction of a number of new credit life offerings. The claims history on all insurance portfolios remained well within industry limits. During the year non-credit life-based insurance products were cross-sold to a portion of the RCS Group’s customer base and initial take-up has been very encouraging. Steady expansion of this portfolio during the next year is expected.
PROSPECTSDespite the positive gains during the year a number of broader market challenges are still present:
• mass middle market consumer budgets remain under strain, resulting in muted demand for
credit, as well as for durable and semi-durable goods;
• capital markets, while becoming more accessible, remain tight, with pricing at a premium;
• the competitive landscape continues to intensify as the pool of available creditworthy customers gradually declines; and
• pricing limitations continue to prevail in the current interest rate environment because of the interest-capping formula under the National Credit Act.
Against this backdrop the RCS Group anticipates that the business will achieve moderate growth in the next year.
Gains made in improving the quality of assets will be maintained and greater operational efficiencies will be achieved as the transactional finance model is leveraged to its full extent.
It is expected that the private label and co-branded portfolios will see the addition of a number of new programmes during the next year. Furthermore, investigations into the possibility of extending the transactional finance model into southern Africa are under way, with Namibia and Botswana currently being considered.
The Fixed Term Finance business has resumed a more aggressive strategy to acquire personal loan customers, testing a number of new channels in the process. It is anticipated that the insurance business will extend its gains with expanded product offerings.
SUSTAINABILITY In terms of internal resource management, investing in talent development is an ongoing focus. Commitment to promoting employment equity in the company is demonstrated at the highest level with the CEO of the RCS Group chairing an employment equity committee and monitoring the company’s performance towards meeting employment equity targets. The company
management and employment equity committee are exploring strategies to address the ongoing challenge of attracting suitable candidates into the business, notably at senior management levels.
The RCS Group invests in a range of activities aimed at ensuring the well-being of its employees and has a low level of staff turnover at 2,25% during the financial year in review.
The company’s on-site occupational health facility employs an occupational health nursing practitioner, a medical doctor and a social worker. The majority of visits (78%) to the clinic are for primary health purposes and 22% are occupational health related. A notable achievement this year was an increase in the number of HIV-related visits to the clinic, due to an increased awareness campaign around voluntary counselling and testing. Almost half of the company’s employees know their HIV status and treatment for those testing positive is provided free of charge.
RCS Group is active in developing strategies and promoting efforts aimed at reducing the Foschini group’s environmental footprint, notably around reduced electricity consumption. The company has engaged external consultants to calculate its carbon footprint, focusing on both direct and indirect emissions, with a view to consolidating efforts to monitor and improve its environmental performance.
The company continues to be proactively involved in community development initiatives, investing over R800 000 in a range of initiatives during the financial year in review. Prominent projects include supporting TSiBA, a free tertiary education facility based in Cape Town, providing bursaries for children supported through sport by the JAG Foundation and the Karl Westvig Bursary Fund, and supporting employees by providing bursaries for their children at primary school.
RCS GROUP

FOSC
HIN
I GRO
UP A
NN
UA
L REPORT 2010 - PA
GE 92
OPERATIO
NA
L REVIEW
– SERVIC
E DIV
ISION
S
FOSC
HIN
I GRO
UP A
NN
UA
L REPORT 2010 - PA
GE 93
Although the environment is not managed as a separate division, it is appropriate to include the group’s environmental approach in this section of the annual report, as it encompasses data from all of the divisions within the group, with the information being compiled by the service divisions.
Our carbon footprint is calculated after the production of the annual report and the tables of information therefore reflect the results for the March 2009 and March 2008 financial years.
The operational impacts on the environment associated with the group’s retail and financial service activities are relatively low. In terms of direct impacts, the group’s activities consume resources, energy and water, and contribute to the generation of product and packaging waste. While the environmental impacts do not have significant financial implications for the business, the group recognises that environmental responsibility is part of good business practice and to this end are committed to developing ways to reduce its impacts more systematically. The group is a relatively small purchaser and hence its ability to promote and influence greater environmental awareness and responsible environmental practices amongst its suppliers, is limited.
Environmental management
The group’s environmental performance is managed by an environmental committee comprising senior managers from all areas of the business. The committee meets monthly and reports quarterly to the chief executive officer and three members of the operating board. A member of the operating board has responsibility for setting environmental policy, objectives, targets and reporting processes. The group has an environmental policy and is in the process of determining an environmental strategy, as part of a group sustainability strategy that is currently being developed. An environmental risk
assessment of the group’s operations is undertaken annually and performance objectives have been set for 2011. These include formulating an environmental strategy within each division and conducting an environmental assessment of merchandise and non-merchandise suppliers through the supplier audit process. The group has recently launched an environmental portal which provides staff with information covering environmental awareness, facts and tips, policy documents and guidelines, updates on the group’s environmental sustainability journey, an interactive facility for feedback and suggestions, links to sources of environmental and sustainability news and organisations, and retail industry sustainability news.
The group is in the process of implementing more systematic approaches for measuring key environmental performance data, with a view to setting quantitative performance targets.
Recognising the increasing interest shown by analysts and SRI investors around environmental performance issues, the group commissioned a second annual carbon inventory (or “carbon footprint”) assessing the greenhouse gas (GHG) emissions generated through its business activities. This provides a useful analysis of the group’s performance, as it seeks to reduce the GHG emissions associated with its activities. This year the group again participated in the Carbon Disclosure Project (CDP), the global initiative in partnership with Bank of America – Merrill Lynch, PricewaterhouseCoopers and Bloomberg, aimed at accelerating carbon reporting and emission reductions. The group is in the process of calculating its carbon footprint for the financial year ending March 2010. A review of the carbon footprints for the financial years ending 31 March 2008 and 2009, is provided later in this report, as well as the focus areas of activity to mitigate the environmental impact.
Environmental performance
Carbon footprintFoschini’s carbon footprint calculations for the period 1 April 2008 to 31 March 2009 were conducted at the Foschini head offices, distribution centres, regional offices and retail stores. Operational activities covered include:
• direct emissions resulting from fuel used by equipment owned or controlled by Foschini, being gas refills from air-conditioning and refrigeration and the vehicle fleet (referred to as Scope 1 emissions);
• indirect emissions from purchased electricity (referred to as Scope 2 emissions); and
• selected indirect emissions resulting from Foschini’s business travel activities, hotel accommodation, consumption of office and external communications paper, cardboard packaging, plastic bags, employee commuting and outsourced transport/distribution of merchandise (referred to as Scope 3 emissions).
Total emissions for Foschini for 2009 was 154 051 tonnes of CO
2e. Overall
the group’s emissions increased between 2008 and 2009, largely due to the inclusion of additional elements that were added to the calculation, including employee commuting.
The key efforts to reduce the group’s GHG emissions focus on reducing the energy demands and reducing waste production through carton reuse.
SERVICED
IVISIO
NS
ENVIRONMENT

FOSC
HIN
I GRO
UP A
NN
UA
L REPORT 2010 - PA
GE 94
OPERATIO
NA
L REVIEW
– SERVIC
E DIV
ISION
S CO
NTIN
UED
ENVIRONMENT continued
Foschini group’s carbon emissions: 2009 and 2008*
Table 1: Comparison of GHG emissions in tonnes of CO2e.
Activity 2009 2008
Fuel from equipment owned 14,72 25,54
Air-conditioning/refrigeration gas refills – 16,90
Fleet vehicles 3 672,79 3 577,94
Total Scope 1 3 687,51 3 620,38
Purchased electricity 121 169,19 88 774,03
Total Scope 2 121 169,19 88 774,03
Business travel in rental cars 47,62 42,75
Business travel in commercial airlines 1 847,19 2 235,53
Business travel in hotel accommodation 70,98 Data not available
Consumption of office paper plus external communications paper 867,31 772,69
Consumption of cardboard packaging 4 336,52 3 367,64
Consumption of plastic bags 2 549,65 2 375,33
Employee commuting 10 277,76 Data notavailable
Outsourced transport/distribution 8 648,87 Data not available
Total Scope 3 28 645,90 36 194,16
Non-Kyoto emissions 548,43 1 047,00
Total GHG emissions 154 051,03 129 635,57
Intensity: Emissions per FTE 15,29 12,27
Intensity: Emissions per m2 (excluding stores) 1,38 1,23
The inventory relied on the latest scientific data from organisations such as the Intergovernmental
Panel on Climate Change (IPCC) and the GHG Protocol. These have been supported by using up-to-
date emissions factors as supplied by the United Kingdom’s Department for Environment, Food and
Rural Affairs (Defra)
* Note: Environmental statistics are presented for the latest available two comparative periods. As
the computations in respect of 2010 are not yet available, data is presented for the 2009
and 2008 financial years

FOSC
HIN
I GRO
UP A
NN
UA
L REPORT 2010 - PA
GE 95
Table 2: Comparison of units usedActivity Units 2009 2008
Full-time permanent employees People 10 075 9 311
Area (excluding stores) Metres squared 111 925 104 970
Fuel from equipment owned Litres 5 513,00 9 712,37
Air-conditioning/refrigeration gas refills Kilograms – 13
Fleet vehicles Litres – petrol – diesel
1 536 55334 293
1 541 045Data not available
Purchased electricity Kilowatt hours – HOs & DCs– stores
13 129 673 104 510 316
14 220 09274 553 938
Business travel in rental cars Kilometres 219 684 198 132
Business travel in commercial airlines Kilometres 15 630 224 19 161 585
Business travel in hotel accommodation Nights 3 736 Data not available
Consumption of office paper plus external communications paper Tonnes 242,15 364,14
Consumption of cardboard packaging Tonnes 1 543 1 368
Consumption of plastic bags Tonnes 424 942 395 889
Employee commuting Kilometres 133 840 924 Data not available
Outsourced transport/distribution Kilometres 11 603 395 Data not available
Non-Kyoto emissions Kilograms 303 698
Our principal areas of activityThis year we have focused our efforts
to mitigate our environmental impact
in the areas of activity where we have
the greatest opportunity to make a
significant difference to our performance:
energy efficiency, packaging waste and
merchandise transport.
Energy efficiency
The group is committed to contribute
to mitigating the current energy crisis
by reducing its energy demands. Given
that a large component our electricity
usage is through lighting in our stores,
this year we reviewed our store lighting
design, piloted energy efficiency design
improvements, and rolled out lighting
design improvement across all our
divisions (excluding Foschini and exact!,
which will be addressed in 2011). In view
of an anticipated long-term increase in
electricity costs, considerable cost savings
(as well as emission reductions) have
been achieved by lowering lighting levels
as well as using more efficient fluorescent
types to reduce heat generation and
lamp replacement costs. By replacing all
50 watt dichroic lamps with 35 watt IRC
dichroic lamps in our Jewellery, Sports
and Markham divisions, we achieved a
sustained annual saving of 511 233 kW;
these divisions anticipate an average
14% decrease in lighting load for all new
stores built for the 2011 financial year.
Our Foschini division is currently rolling
our lighting efficiency initiatives across
its stores and anticipates saving 180 000
kW/hrs of electricity usage in 2011.
In line with our environmental
committee objectives, we have appointed
a utilities manager who will oversee the
process of introducing systems to ensure
that electricity usage, mainly in stores,
is measured and recorded monthly (in
kilowatt hours). This will enable us to
better monitor our performance. Electricity Employee
commutingOutsourced
transportCardboard Fleet
150 000
120 000
90 000
60 000
30 000
0
Comparison of Foschini’s top five emission contributors in tonnes of CO
²e
121 169
3 6734 3378 64910 278
SERVICED
IVISIO
NS
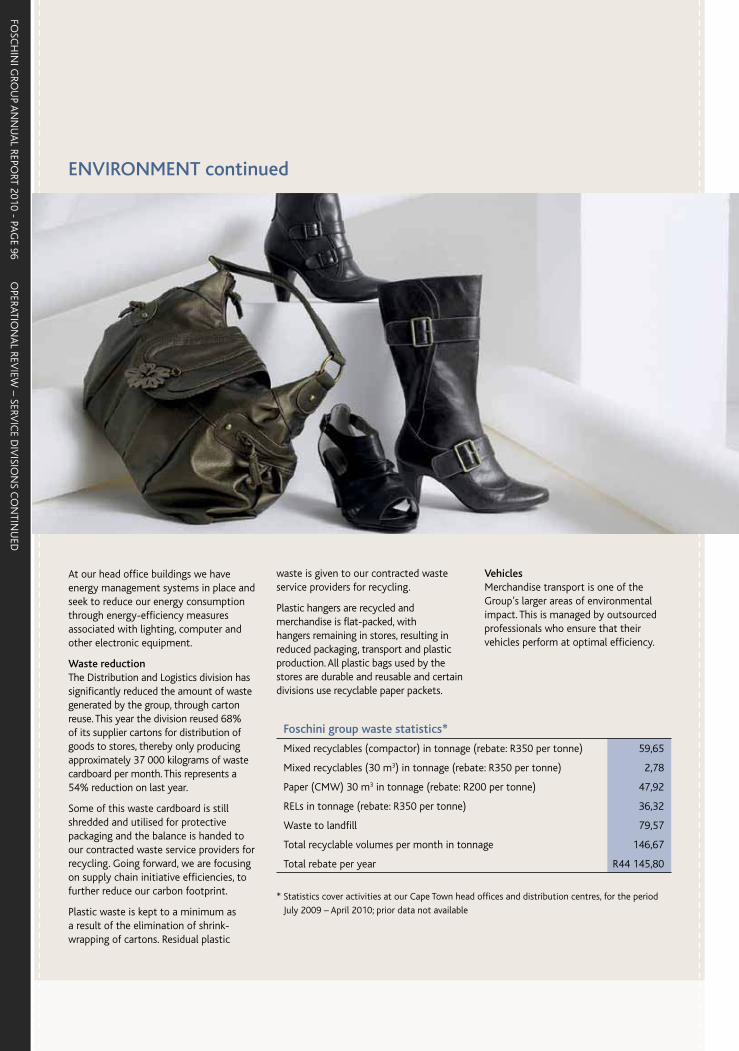
FOSC
HIN
I GRO
UP A
NN
UA
L REPORT 2010 - PA
GE 96
OPERATIO
NA
L REVIEW
– SERVIC
E DIV
ISION
S CO
NTIN
UED
At our head office buildings we have energy management systems in place and seek to reduce our energy consumption through energy-efficiency measures associated with lighting, computer and other electronic equipment.
Waste reductionThe Distribution and Logistics division has significantly reduced the amount of waste generated by the group, through carton reuse. This year the division reused 68% of its supplier cartons for distribution of goods to stores, thereby only producing approximately 37 000 kilograms of waste cardboard per month. This represents a 54% reduction on last year.
Some of this waste cardboard is still shredded and utilised for protective packaging and the balance is handed to our contracted waste service providers for recycling. Going forward, we are focusing on supply chain initiative efficiencies, to further reduce our carbon footprint.
Plastic waste is kept to a minimum as a result of the elimination of shrink-wrapping of cartons. Residual plastic
waste is given to our contracted waste service providers for recycling.
Plastic hangers are recycled and merchandise is flat-packed, with hangers remaining in stores, resulting in reduced packaging, transport and plastic production. All plastic bags used by the stores are durable and reusable and certain divisions use recyclable paper packets.
Foschini group waste statistics*
Mixed recyclables (compactor) in tonnage (rebate: R350 per tonne) 59,65
Mixed recyclables (30 m3) in tonnage (rebate: R350 per tonne) 2,78
Paper (CMW) 30 m3 in tonnage (rebate: R200 per tonne) 47,92
RELs in tonnage (rebate: R350 per tonne) 36,32
Waste to landfill 79,57
Total recyclable volumes per month in tonnage 146,67
Total rebate per year R44 145,80
* Statistics cover activities at our Cape Town head offices and distribution centres, for the period
July 2009 – April 2010; prior data not available
VehiclesMerchandise transport is one of the Group’s larger areas of environmental impact. This is managed by outsourced professionals who ensure that their vehicles perform at optimal efficiency.
ENVIRONMENT continued
FOSC
HIN
I GRO
UP A
NN
UA
L REPORT 2010 - PA
GE 97
The Group Finance and Administration division is a centralised service division that provides support to the other divisions in the group. It is made up of several departments, mentioned below, which attend to specialised functions. Overall, the division’s functions cover the following areas of responsibility:
FINANCIAL ACCOUNTING AND CORPORATE REPORTINGThis department is responsible for:
• collating data and producing the group’s interim and annual financial statements;
• undertaking corporate communications and shareholder reporting;
• ensuring compliance with all applicable accounting standards and statutory requirements; and
• undertaking liaison with external auditors.
MANAGEMENT ACCOUNTINGManagement accounting undertaken by the division comprises:
• controlling the group’s financial accounting systems and internal checking procedures;
• co-ordinating and consolidating all the group’s financial planning, including annual budgets and quarterly reprojections;
• carrying out divisional financial reporting to enable accurate management decision-making; and
• carrying out all operational financial reporting at store, area, regional and divisional level.
GENERAL FINANCE AND ADMINISTRATIONThe division’s functions under this heading comprise:
• processing and paying all merchandise costs, expenses and rental charges;
• ensuring that all stores deposit the correct amounts daily; and
• administering store and head office inventory and claims.
FINANCIAL SYSTEMS ADMINISTRATIONThe maintenance and development of the SAP financial system is included in the division’s responsibilities. The division intends to continue to investigate the use of other modules within SAP in order to obtain the full benefits of the integration capabilities of the system.
The division is involved in any changes made to the group’s information technology systems that ultimately interface into the SAP financial system. This ensures that accounting standards and internal controls are maintained throughout the group.
TREASURYThis department is responsible for managing the group’s foreign exchange and funding policies. It ensures that the group’s funding needs are provided for with adequate credit lines and appropriate financial instruments at the lowest cost and that daily cash management is optimised. Investments and interest rate risk are managed in consultation with the financial director within the parameters laid down by the board. The department, acting in conjunction with the taxation department, assists with various commercial initiatives that affect the group.
TAXATIONThis department is responsible for all aspects of the group’s taxation compliance. By its nature, it is staffed by highly skilled experts who constantly remain abreast of current and pending legislation.
SECRETARIAL AND ADMINISTRATIONThis department is responsible for:
• maintaining the group’s statutory records;
• administering the Foschini Group Retirement Fund;
• administering the group’s trademarks;
• administering certain processes relating to the preparation and signing of the group’s store leases;
• exercising the group’s compliance function; and
• providing legal assistance and advice to other divisions of the group.
RISK MANAGEMENTThe risk management department is responsible for the following functions:
• managing and controlling the risk management process, as defined by the group’s risk committee and as required by the Code of Corporate Practices and Conduct;
• obtaining and maintaining appropriate insurance for the group;
• administering all group insurance claims and compiling comprehensive loss statistics;
• exercising control over the group business continuity planning process; and
• facilitating inter-divisional store security meetings to allow cross-pollination of information and strategies regarding loss prevention.
A detailed risk analysis is contained in the Risk report within the corporate governance section of this report.
PROCUREMENT OF SERVICESThe group procurement process relating to non-merchandise procurement ensures that best practice is followed in all areas of the purchasing process throughout the group. Quarterly procurement reports are made to the procurement committee, comprising four members of the operating board and two senior managers. In addition, the procurement manager ensures that the BBBEE procurement strategy as defined by the transformation committee is implemented. Further details of initiatives in this regard are contained in the Transformation and CSI report.
SERVICED
IVISIO
NS
GROUP FINANCE AND ADMINISTRATION

FOSC
HIN
I GRO
UP A
NN
UA
L REPORT 2010 - PA
GE 98
OPERATIO
NA
L REVIEW
– SERVIC
E DIV
ISION
S CO
NTIN
UED
The Group Audit Services (GAS) division’s primary responsibility is to support the group’s commitment to strong corporate governance and sound internal control. While management is responsible for the development, implementation and monitoring of effective control systems, the internal audit division assists management in fulfilling this commitment. This is done by evaluating the adequacy and effectiveness of controls to support management in its pursuit of sustainable achievement of business objectives. The division’s function includes the appraisal of performance measures, the reliability of management information, operational controls and the safeguarding of assets.
The 20 staff members of GAS are responsible for the audits of all group operations.
An internal audit charter, approved by the audit committee of the board, determines the scope and mission of GAS’ activities. The charter conforms to the International Standards for the Professional Practice of Internal Auditing as defined by the Institute of Internal Auditors (IIA). Although GAS is responsible to the financial director for administrative matters, GAS reports to the audit committee.
HEAD OFFICE AND INFORMATION SYSTEMThe head office and information system (IS) audit teams co-operate closely to provide internal audit services for the group’s head office operations. These include financial areas, such as accounts payable and credit operations, as well as non-financial areas, including shopfitting, risk management and distribution centres.
In addition, the IS audit team conducts technical reviews such as operating system configuration, database administration and networks. The audit teams make extensive use of technology such as automated scanning and data interrogation tools to improve assurance reporting to management. A standalone facility has been established to support the testing of sophisticated audit tools in a controlled environment. GAS are involved when new computer systems are developed to ensure that cost-effective controls are considered at both the system design stage, prior to implementation, and during system implementation. In this way the risk of business interruption is reduced.
STORE AUDITS Store audit coverage for the past year was 17% of group stores (approximately 29% of all stores’ turnover). As usual, leverage was maximised by ensuring that at least 85% of all the areas experienced a minimum of one audit during the year.
The store audit team has developed a scoring system that enables management to evaluate the administrative health of stores both within and across trading divisions, i.e. the audited store’s administrative performance can be benchmarked against that of other stores. Given the geographic spread of stores, as far afield as Namibia and Botswana, the planning of visits is crucial in ensuring that the planned coverage is met. The experience and professionalism of the store auditors has contributed significantly to the success of the store audit team.
GOALSGAS is committed to providing high-quality internal audit services at a competitive cost. This is done by measuring and monitoring audit productivity and other performance factors, and keeping abreast of international trends. Specific action plans are developed for key strategic objectives.
Divisional projects to increase the automation of audit processes by implementing an electronic working papers (EWP) system and to provide internal auditors with a mobile work environment are well advanced. As was noted in last year’s report, EWP software for store audits was successfully tested. During the past year, the implementation of the EWP software for the store audit team was successfully completed. As a result, all audits are now conducted using EWP.
In addition, key areas were reviewed to assess the feasibility of implementing continuous monitoring and auditing tools. As a pilot, more frequent tests will be implemented in selected areas in the finance division. The objective is to provide independent assurance on selected key controls throughout the year.
The head office audit team has been restructured to ensure that the internal audit coverage of the RCS Group is appropriately focused and adequately resourced. This has enhanced the internal audit capacity in this area.
The internal audit team participated in the group’s gap analysis project to ascertain the current status of application of the King III Code. This process has identified specific action steps to ensure sufficient application of this version of the code.
In developing the current audit plan, internal audit management included specific reviews to ensure that the audit committee has access to independent assurance on key governance processes.
GROUP AUDIT SERVICES

FOSC
HIN
I GRO
UP A
NN
UA
L REPORT 2010 - PA
GE 99
STRUCTURE AND FUNCTIONSThe Distribution and Logistics division is responsible for managing stock received from suppliers and distributing it to the group’s stores efficiently and on time.
The group’s DCs are based near the head office in Cape Town. The group’s entire stock distribution function, including receiving, storage, picking, packing and despatch, takes place from these DCs.
The DCs together with the divisions or operations they serve are as follows:
• Tygerberg DC: Foschini, donna-claire and fashíonexpress footwear; @home and returned goods
• @homelivingspace DC: @home furniture
• Ndabeni DC: exact!, Markham and style accumulation (comprising certain partly completed orders)
• Sports DC: Totalsports, sportscene and DueSouth
• Foschini DC: Foschini, donna-claire and fashíonexpress apparel
• Jewellery DC: American Swiss, Sterns, Matrix and Foschini division jewellery
• Cloth Store DC: Fabric for local production of apparel
• Shopfitting DC: Shopfitting stock for the group
FEATURES OF THE PAST YEARIn this period the DCs distributed 39,4 million units (i.e. individual items of stock), which represents a drop of 5,3% in unit volumes from the previous year.
The decreased unit volumes once again placed pressure on efficiencies in the DCs when measured on the basis of costs per unit. However, the overall cost of logistics as a percentage of group revenue decreased from 1,68% to 1,51%. The main factors contributing to the decrease were a 10% reduction in transportation costs, based on lower fuel costs, as well as a 6% drop in operational costs at the DCs because of improvements in process efficiency.
• Improved throughput speed: Stock throughput speed averaged 4,9 days. The group continues to fine-pick the majority of its stock and this requires extensive processing time. The group cross-docks only 7% of its merchandise through the DCs, and this volume can be accomplished within a single day. (Cross-docking means that a container passes unopened through a DC to a store.) Notably the @home division cross-docked 47% of its stock, as against 30% in the previous year. Cross-docking saves costs and reduces product damage en route to stores. In the next year it is expected that the overall proportion of the group’s stock that is cross-docked will increase, so enhancing speed to market.
• DC accuracy: The accuracy of fine-picked stock leaving the DCs was maintained at a level of 99,9% in unit terms. This creates reliability in the supply chain to stores and is consistent with best-in-class retailers around the world.
• Shipping time: The Group Shipping department has further reduced the lead time of international shipments from 30 to 27 days. This represents an improvement in reliability and ensures that less stock need be held in the DCs before being dispatched to stores.
• Supplier delivery conformance: The performance of suppliers is measured in terms of the accuracy of order bookings, the promptness and accuracy of deliveries, the degree of conformance of packaging to applicable norms, and the accuracy and speed of product ticketing. Delivery conformance in terms of perfectly delivered orders improved from 69% to 77%. Significant progress was made with the local clothing suppliers who moved from a score of 56% to 74%. These improvements have assisted with process efficiencies in the DCs.
INFORMATION TECHNOLOGY AND OPERATIONAL SYSTEMS It has been reported previously that the group has acquired Manhattan Associates’ Warehouse Management System (WMS) to support its requirement for an agile supply chain.
In the past year WMS was implemented in the Markham and exact! divisions within tight project timelines.
Because of these WMS implementations there have been far-reaching advances towards the group’s goal of having a world-class distribution model. The result is greater visibility of deliveries to the WMS-enabled facilities. These facilities have also been tested for their ability to hold stock and react quickly to consumer demand, so ensuring maximum allocation efficiency.
As was previously reported, best operating practices (BOP) have been fully implemented as against the group’s previously achieved figure of 70%. The programme used for this purpose covers four key performance indicators (KPIs), namely visual performance management (VPM), teamwork, 6S (health, safety and shop-floor organisation) and problem-solving. The programme has contributed to a culture change of greater employee commitment at all levels. This will yield enhanced process efficiencies over time in all of the group’s distribution facilities.
The major risk associated with the DCs is fire, and this risk can be mitigated with prudent preventative action being taken. This covers the steps inter alia of training staff members at the warehouses in fire-fighting, undertaking maintenance of fire-fighting equipment, implementing atmospheric detection systems, and installing inter-rack sprinkler systems. Close attention was again given to these issues. Historically the group has been free of fires, but there is no place for complacency.
Generators have been provided at all the DCs in order to avoid or minimise the ill-effects of electricity interruptions.
DISTRIBUTION AND LOGISTICS
SERVICED
IVISIO
NS

FOSC
HIN
I GRO
UP A
NN
UA
L REPORT 2010 - PA
GE 100
OPERATIO
NA
L REVIEW
– SERVIC
E DIV
ISION
S CO
NTIN
UED
Security is an important element of the distribution operation, particularly at and near the time of transportation. The group’s DCs are equipped with CCTV cameras and are guarded 24 hours a day. As part of the security procedures, access control systems are in place. The group’s security procedures are extended to its transport partners, who have comprehensive security through a combination of secured premises and satellite-tracked vehicles. Regular procedure audits have ensured minimal losses throughout the past year in spite of an incidence of crime which is perceived to be high in South Africa.
Business continuity plans are in place and they were again regularly tested and reviewed by the group’s risk committee.
In reviewing the division’s impact on the environment and measuring its carbon footprint, indirect emissions from the consumption of cardboard packaging and outsourced transport were identified as the two factors accounting for the greatest impact.
To mitigate this impact the division has engaged with its merchandise suppliers to standardise their carton specification so that the group can reuse their cartons rather than buy new cartons for redistribution of its merchandise to the stores. The success of this initiative has led to a reduction of 65% in the consumption of cardboard packaging and a reduction of 54% in waste cardboard.
The outbound transportation of merchandise to the stores is outsourced. The division collaborates with its transport partners in seeking ways to reduce the group’s environmental impact. All new vehicles are equipped with the latest diesel technology to make engines run efficiently. A strict maintenance schedule is in place to ensure that the fleet is regularly maintained by the manufacturer’s agents and so maximise its operational efficiency. All transport partners utilise the latest routing and fleet management technology in order to minimise the number of kilometres travelled.
OUTLOOK FOR 2011As the group’s supply chain processes continue to mature and to respond to challenges there will no doubt be continued gains in stock efficiency and in the overall efficiency of operations.
The new Group Merchandise Procurement division can be expected to make a mark in assisting the group to make better procurement decisions. Suppliers will be systematically measured and each will for the first time receive a score against certain criteria including On-Time, In-Full, quality, DC delivery conformance, product performance and the quality of relationships. The supply base can be expected to provide increasingly good service to the group through the year.
A consequence will be higher efficiencies within the DCs. However, the fuel price is expected to increase during the year and this will place pressure on transport costs and hence profitability. WMS will be implemented in the Foschini and Sports DCs where it is expected to provide substantial benefits.
DISTRIBUTION AND LOGISTICS continued

FOSC
HIN
I GRO
UP A
NN
UA
L REPORT 2010 - PA
GE 101
SERVICED
IVISIO
NS
GROUP SERVICES
The function of the Group Services division is to add value to the operations of other divisions by providing expert and streamlined facilities management services on a cost-effective basis, so enabling the other divisions to achieve optimal efficiency in their operations and the optimal well-being of staff members in the workplace.
The division comprised 68 staff members at the year-end, of whom 65 were based in Parow, Cape Town and three in Isando, Johannesburg.
The properties owned or leased by the group, other than leased stores, are managed by the division, including the Stanley Lewis Centre and nearby buildings in Parow where the group has its headquarters, and three “legacy” buildings in Cape Town, Johannesburg and Durban which have been owned by the group for many decades. The total area of the built space managed by the division is approximately 120 000 square metres.
Benefits are extracted for the group by implementing strict service level agreements with all external service providers and by utilising only a limited number of suppliers well known to the group who have appropriate retail experience. Service level agreements incorporate provisions recognising the uniqueness of the group and addressing its special needs and methodologies.
The division supplies all stores in the group with office equipment and stationery.
Long-term space forecasting is undertaken each year and warehouses and offices are built to the group’s specifications to meet capacity growth requirements.
Another function of the division is to ensure that ongoing maintenance of all buildings, plant and equipment takes place in 19 properties owned or rented by the group. Data centres and critical functions in the buildings and warehouses are supported by uninterrupted power storage units (UPS) and power generators.
In properties for which it has responsibility the division manages
the installation and maintenance of all security, fire detection and access control systems, and implements and manages the occupational health and safety programme.
From a governance perspective all security and fire evacuation systems in properties managed by the division are tested on a regular basis. All offices, with the exception of the non-critical Isando property, have backup power generators. Isando has a UPS unit.
The Group Services division also attends to the procurement of standardised office automation equipment (printers, copiers, audiovisual), vehicles and capital equipment other than computers.
The fleet department operates within the mandated capital budget, monitors expenditure levels and negotiates volume discounts through approved suppliers.
Managing of mailrooms, reception areas, switchboards and store alarms are among the services provided.
A critical alarm monitoring system is installed in the group’s data centres to monitor equipment and environmental conditions critical to the continuous operation of these facilities. Signals are relayed according to a calling tree to ensure that appropriate action is taken by key decision-makers in the event of an alarm.
Outsourced contractors managed by the division include those providing catering, physical guarding, gardening, architectural, mechanical, electronic and electrical, and travel services.
In the current stringent economic climate there is particularly close monitoring of all expenditure, the chief items of which in the division’s budget are rentals, electricity and refurbishment costs.
Regional offices have been reduced in size by enabling the regional and area managers to work remotely with the use of mobile technology.
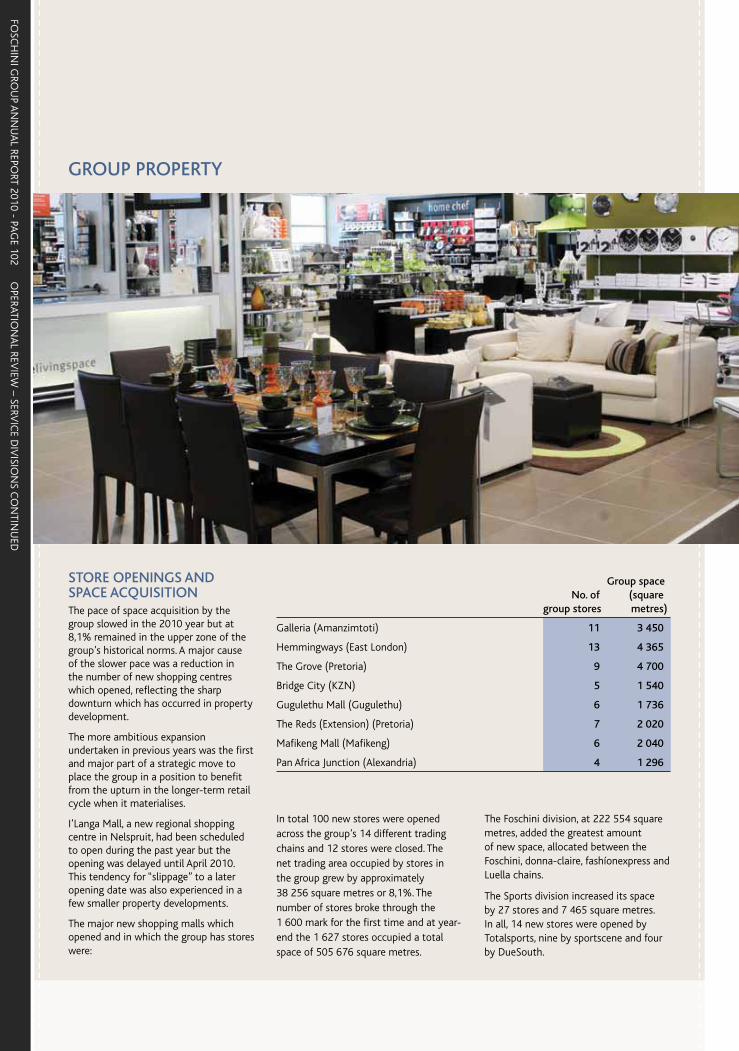
FOSC
HIN
I GRO
UP A
NN
UA
L REPORT 2010 - PA
GE 102
OPERATIO
NA
L REVIEW
– SERVIC
E DIV
ISION
S CO
NTIN
UED
STORE OPENINGS AND SPACE ACQUISITIONThe pace of space acquisition by the group slowed in the 2010 year but at 8,1% remained in the upper zone of the group’s historical norms. A major cause of the slower pace was a reduction in the number of new shopping centres which opened, reflecting the sharp downturn which has occurred in property development.
The more ambitious expansion undertaken in previous years was the first and major part of a strategic move to place the group in a position to benefit from the upturn in the longer-term retail cycle when it materialises.
I’Langa Mall, a new regional shopping centre in Nelspruit, had been scheduled to open during the past year but the opening was delayed until April 2010. This tendency for “slippage” to a later opening date was also experienced in a few smaller property developments.
The major new shopping malls which opened and in which the group has stores were:
No. of group stores
Group space (square metres)
Galleria (Amanzimtoti) 11 3 450
Hemmingways (East London) 13 4 365
The Grove (Pretoria) 9 4 700
Bridge City (KZN) 5 1 540
Gugulethu Mall (Gugulethu) 6 1 736
The Reds (Extension) (Pretoria) 7 2 020
Mafikeng Mall (Mafikeng) 6 2 040
Pan Africa Junction (Alexandria) 4 1 296
In total 100 new stores were opened across the group’s 14 different trading chains and 12 stores were closed. The net trading area occupied by stores in the group grew by approximately 38 256 square metres or 8,1%. The number of stores broke through the 1 600 mark for the first time and at year-end the 1 627 stores occupied a total space of 505 676 square metres.
The Foschini division, at 222 554 square metres, added the greatest amount of new space, allocated between the Foschini, donna-claire, fashíonexpress and Luella chains.
The Sports division increased its space by 27 stores and 7 465 square metres. In all, 14 new stores were opened by Totalsports, nine by sportscene and four by DueSouth.
GROUP PROPERTY
FOSC
HIN
I GRO
UP A
NN
UA
L REPORT 2010 - PA
GE 103
The Jewellery division opened seven new American Swiss stores, seven Sterns, and three Matrix.
The Markham and exact! chains opened 12 and 10 new stores respectively.
The @home division added no fewer than 10 800 square metres, spread across seven new stores. This increase, representing 27,9% of additional space, was largely taken up by three new @homelivingspace stores, which require larger premises than the @home stores because of their need to accommodate furniture.
Across the group, a total of 17 existing stores were enlarged to maximise the trading opportunities in key locations, and 24 stores were relocated to superior trading positions.
PROGRAMME FOR 2011 The slow-down in the rate at which shopping malls are being opened is expected to continue in the next year, when national growth in retail space is likely to be approximately 7%.
Much of the new space which the group will lease comes in the form of mid-sized malls and additional space will also be taken in centres which already accommodate one or more of the group’s stores.
The group has undertaken to open stores in the following new malls:
I’Langa Mall (Nelspruit)Brits Mall (Brits)Goldfields Mall (Welkom)Chris Hani Crossing (Vosloorus)Randridge Mall (Randpark Ridge)Mamelodi Crossing (Mamelodi)
The group’s first stores in Zambia are scheduled to open in November 2010 in the enlarged and newly renovated Manda Hill shopping centre in Lusaka. Five stores will open in this well-established and successful centre and ten additional stores are envisaged in the next few years at sites already identified. The Zambian operation will consist of corporate stores owned and operated by the group, but the establishment of a franchise division is being investigated with a view to expanding into other territories north of South Africa.
The group is experimenting with different potential combinations of “group stores”. This concept involves leasing a larger area than usual and then dividing the space amongst trading divisions which have a degree of natural affinity. Each division would have its own entrance and would maintain its own brand identity. Internal linkages would make it possible for a customer to enter one store by walking through another. Apart from cost savings related to efficiencies of scale, the major advantage of this format is believed to be that customers will have the opportunity to cross-shop. It is foreseen that there could be opportunities to set up more than one combination of group stores.
With the slow-down in the development of new regional shopping centres, there is a growing tendency for existing successful centres to enlarge or refurbish their premises. This is seen as a positive step as it tends to be more profitable to expand a retail presence in a proven environment rather than invest in unchartered territory. In the current economic climate the group is keeping a tight rein on expenses and it is rational to spend capital on expanding and upgrading profitable stores rather than on acquiring entirely new space.
RESTRUCTURING OF GROUP PROPERTY DIVISIONWith effect from April 2010 the teams responsible throughout the group for space acquisition, rentals, utilities and lease administration have been amalgamated to create a more rational and cohesive entity within the Group Property division.
Particular attention is being paid in the new entity to strategies for contending with increased costs of electricity, which represent a sizeable and growing challenge to retailers. A number of initiatives have been put in place to minimise the impact of these costs. Among them are measures to ensure that all consumption is monitored and controlled, and that all applicable charges and tariff structures are correct. The group’s efforts to reduce the environmental footprint and increase
the energy efficiency of its stores are described in the environmental performance review in the services section.
TRENDS IN RETAIL ARCHITECTUREThe economic stringency of recent times has forced the designers and operators of shopping centres to use all available means to achieve savings in day-to-day running costs, as well as in initial capital outlay. One of the results which is emerging is a trend to use natural daylight wherever possible for illumination, and to lessen the extent to which heat from the sun penetrates into areas where it will add to the burden of air-conditioning plants. Simple choices of types of light fittings and their positioning are proving to provide a part of the solution to this type of problem, as well as measures to reduce the amount of artificial lighting provided at night. Halting the movement of escalators whenever possible is another such step. The group is applying its accumulated knowledge and skill to advance these processes. A small example of what can be achieved in the field of lighting is provided by one of the group’s stores in the recently opened Galleria Mall in Amanzimtoti, where a new lighting layout achieved savings in costs without sacrificing illumination levels.
PROPERTY DEVELOPMENTProperty development is our principal indirect environmental impact. Lease agreements with developers are only approved once the required environmental impact assessment has been undertaken. In line with international trends, there is an emerging trend in South Africa towards the design and construction of eco-friendly shopping malls. However, in view of the recent challenging economic climate, progress is slow and most of our landlords are yet to embark on any significant “greening” initiatives to new and existing buildings. Revised model design features would include eco-friendly building materials, natural lighting, solar power and heating, and rain water capture.
SERVICED
IVISIO
NS

FOSC
HIN
I GRO
UP A
NN
UA
L REPORT 2010 - PA
GE 104
OPERATIO
NA
L REVIEW
– SERVIC
E DIV
ISION
S CO
NTIN
UED

FOSC
HIN
I GRO
UP A
NN
UA
L REPORT 2010 - PA
GE 105
Brent Curry
Breakdown of operating costs
Depreciation
23%
32%
20%
9%
3%
13%
Salaries
Maintenance
Outsourced Services
Other
3rd Party Mng
POSITIONING Foschinidata provides world-class information and communication technology (ICT) to the Foschini group, using a combination of fully integrated third-party solutions and in-house-developed software. The division’s major implementation partners include large multinational suppliers such as SAP, JDA, Microsoft, Manhattan and IBM.
Foschinidata’s overall aim is to consistently deliver ICT solutions that add outstanding value to the group and it has reached the point where it is well structured to achieve this objective.
Foschinidata acts as a strategic partner to the group’s divisions in meeting their specific business requirements. It also researches and tests ICT technologies which may enhance the divisions’ business operations. To this end, Foschinidata launched its “Store of the Near Future” in the past year. This is a concept store located in the group’s head office in Parow. The Store of the Near Future showcases store technologies which will enhance customers’ shopping experience, as well as assist store personnel in improving store efficiencies.
A number of these technology differentiators which have proven their worth have already been deployed to the stores in the group.
The group’s reliance on information technology (IT) for its day-to-day operations means that IT information security, risk management and governance (including alignment to the King III IT principles) are key focus areas for Foschinidata. With this in mind, best-practice methodologies have been adopted for system delivery and support via the ITIL service delivery framework (an ICT service delivery framework for managing ICT applications, services and technologies), the Cobit model for IT governance (an ICT governance framework ensuring good governance principles are adhered to) and Prince II for key project delivery (a project management framework and principles designed for good project management of ICT solutions). In addition, disaster recovery plans are updated and tested on a regular basis. This comprehensive approach ensures that Foschinidata meets the group’s business requirements and complies with concluded service level agreements (SLAs).
FOSCHINIDATA
The group’s investment in ICT is substantial, with total ICT capital expenditure for the past year of around R80 million and operating expenses of R217,5 million. The latter represented 2,4% of sales.
The ICT cost for the trading divisions only (and excluding all financial services and manufacturing operations) was 2,0% of sales, which is in line with global norms for the retail industry. A graphic illustrating this statistic in the 2010 year follows on the next page, known as “Gartner’s IT Spending as a Percentage of Revenue, by Industry”.
The breakdown of the operating cost is illustrated in the pie chart below:
SERVICED
IVISIO
NS
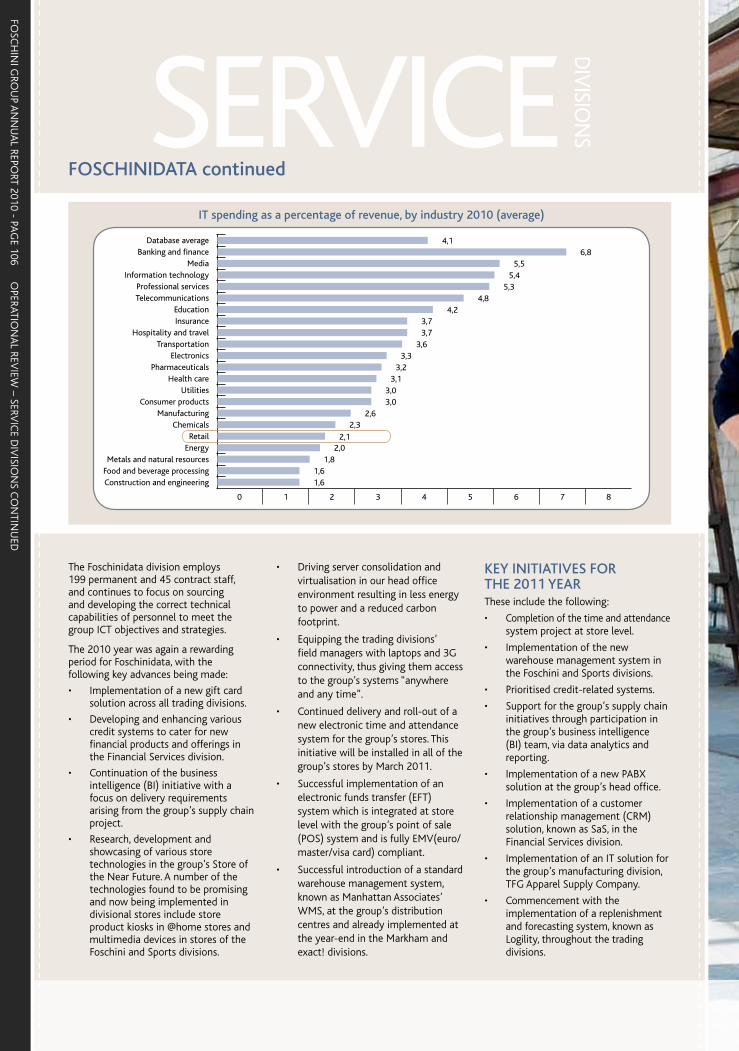
FOSC
HIN
I GRO
UP A
NN
UA
L REPORT 2010 - PA
GE 106
The Foschinidata division employs 199 permanent and 45 contract staff, and continues to focus on sourcing and developing the correct technical capabilities of personnel to meet the group ICT objectives and strategies.
The 2010 year was again a rewarding period for Foschinidata, with the following key advances being made:
• Implementation of a new gift card solution across all trading divisions.
• Developing and enhancing various credit systems to cater for new financial products and offerings in the Financial Services division.
• Continuation of the business intelligence (BI) initiative with a focus on delivery requirements arising from the group’s supply chain project.
• Research, development and showcasing of various store technologies in the group’s Store of the Near Future. A number of the technologies found to be promising and now being implemented in divisional stores include store product kiosks in @home stores and multimedia devices in stores of the Foschini and Sports divisions.
• Driving server consolidation and virtualisation in our head office environment resulting in less energy to power and a reduced carbon footprint.
• Equipping the trading divisions’ field managers with laptops and 3G connectivity, thus giving them access to the group’s systems “anywhere and any time”.
• Continued delivery and roll-out of a new electronic time and attendance system for the group’s stores. This initiative will be installed in all of the group’s stores by March 2011.
• Successful implementation of an electronic funds transfer (EFT) system which is integrated at store level with the group’s point of sale (POS) system and is fully EMV(euro/master/visa card) compliant.
• Successful introduction of a standard warehouse management system, known as Manhattan Associates’ WMS, at the group’s distribution centres and already implemented at the year-end in the Markham and exact! divisions.
KEY INITIATIVES FOR THE 2011 YEARThese include the following:
• Completion of the time and attendance system project at store level.
• Implementation of the new warehouse management system in the Foschini and Sports divisions.
• Prioritised credit-related systems.
• Support for the group’s supply chain initiatives through participation in the group’s business intelligence (BI) team, via data analytics and reporting.
• Implementation of a new PABX solution at the group’s head office.
• Implementation of a customer relationship management (CRM) solution, known as SaS, in the Financial Services division.
• Implementation of an IT solution for the group’s manufacturing division, TFG Apparel Supply Company.
• Commencement with the implementation of a replenishment and forecasting system, known as Logility, throughout the trading divisions.
IT spending as a percentage of revenue, by industry 2010 (average)
Database averageBanking and finance
MediaInformation technology
Professional servicesTelecommunications
EducationInsurance
Hospitality and travelTransportation
ElectronicsPharmaceuticals
Health careUtilities
Consumer productsManufacturing
ChemicalsRetail
EnergyMetals and natural resources
Food and beverage processingConstruction and engineering
0 1 2 3 4 5 6 7 8
4,16,8
5,55,4
5,34,8
4,23,73,7
3,63,3
3,23,1
3,03,0
2,62,3
2,12,0
1,81,61,6
SERVICED
IVISIO
NS
FOSCHINIDATA continued
OPERATIO
NA
L REVIEW
– SERVIC
E DIV
ISION
S CO
NTIN
UED

FOSC
HIN
I GRO
UP A
NN
UA
L REPORT 2010 - PA
GE 107

FOSC
HIN
I GRO
UP A
NN
UA
L REPORT 2010 - PA
GE 108
OPERATIO
NA
L REVIEW
– SERVIC
E DIV
ISION
S CO
NTIN
UED

FOSC
HIN
I GRO
UP A
NN
UA
L REPORT 2010 - PA
GE 109
MANAGING HUMAN RESOURCESThe role of the group Human Resources (HR) division is to set and implement strategies for human interaction within the group, working in collaboration with the group’s trading and service divisions. The HR division also provides a common platform to group companies for the provision of best-practice HR.
The services listed below are provided by the division and are directed at the group’s employees and at HR practitioners working within the group’s trading and service divisions:
• management of the group’s payroll for its more than 15 000 employees;
• management of policies regarding benefits and the practices associated with all these policies;
• performance management;
• reward;
• talent development;
• organisational structure management;
• resourcing;
• employment equity and transformation;
• training and development;
• industrial relations and dispute resolution;
• corporate social investment (CSI); and
• organisational development (OD).
In providing these services the division makes use of specialised information technology aimed at providing data where and when it can be used most effectively.
The group recognises that its success is dependent on the full commitment of its employees within an occupational framework that is moral, fair, has social conscience and can readily be managed.
Shani Naidoo
Summary of our staff complement, as at 31 March 2010
Male Female Foreign Grand totalOccupational Level A B C W A B C W M F
Top management 8 1 1 10
Senior management 3 1 10 70 1 3 63 151
Professional middle management 16 30 71 134 32 26 100 301 7 3 720
Skilled, junior management, supervisors 41 241 206 77 188 598 781 571 1 15 2 719
Semi-skilled 104 1 476 763 78 501 4 763 2 724 408 1 9 10 827
Unskilled 1 28 52 2 1 13 76 3 1 177
Grand total 165 1 776 1 102 369 724 5 400 3 684 1 347 10 27 14 604
WORKFORCE PROFILE
Our staff complement (total for group head offices and stores) as at 31 March 2010
Employee statistics: 2010 2009
Permanent full-time employees 10 494 10 075
Permanent part-time employees 327 313
Flexitime employees 3 233 3 103
Contract employees 550 947
Casual employees 182 1 029
SERVICED
IVISIO
NS
HUMAN RESOURCES
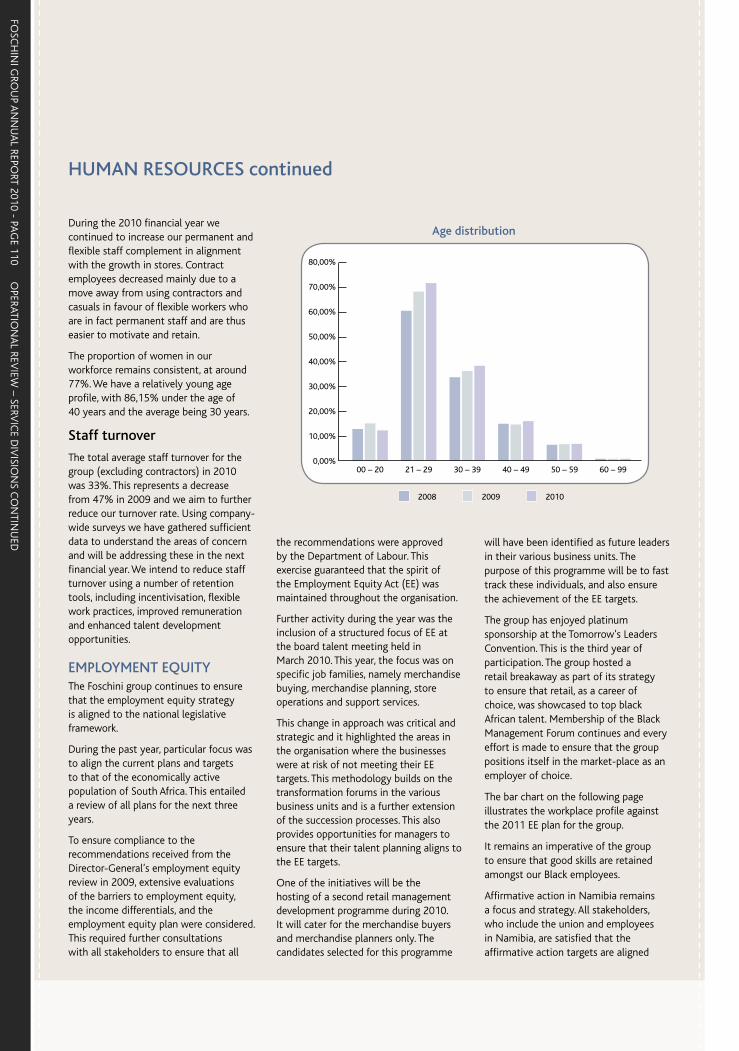
FOSC
HIN
I GRO
UP A
NN
UA
L REPORT 2010 - PA
GE 110
OPERATIO
NA
L REVIEW
– SERVIC
E DIV
ISION
S CO
NTIN
UED
During the 2010 financial year we continued to increase our permanent and flexible staff complement in alignment with the growth in stores. Contract employees decreased mainly due to a move away from using contractors and casuals in favour of flexible workers who are in fact permanent staff and are thus easier to motivate and retain.
The proportion of women in our workforce remains consistent, at around 77%. We have a relatively young age profile, with 86,15% under the age of 40 years and the average being 30 years.
Staff turnover
The total average staff turnover for the group (excluding contractors) in 2010 was 33%. This represents a decrease from 47% in 2009 and we aim to further reduce our turnover rate. Using company-wide surveys we have gathered sufficient data to understand the areas of concern and will be addressing these in the next financial year. We intend to reduce staff turnover using a number of retention tools, including incentivisation, flexible work practices, improved remuneration and enhanced talent development opportunities.
EMPLOYMENT EQUITYThe Foschini group continues to ensure that the employment equity strategy is aligned to the national legislative framework.
During the past year, particular focus was to align the current plans and targets to that of the economically active population of South Africa. This entailed a review of all plans for the next three years.
To ensure compliance to the recommendations received from the Director-General’s employment equity review in 2009, extensive evaluations of the barriers to employment equity, the income differentials, and the employment equity plan were considered. This required further consultations with all stakeholders to ensure that all
the recommendations were approved by the Department of Labour. This exercise guaranteed that the spirit of the Employment Equity Act (EE) was maintained throughout the organisation.
Further activity during the year was the inclusion of a structured focus of EE at the board talent meeting held in March 2010. This year, the focus was on specific job families, namely merchandise buying, merchandise planning, store operations and support services.
This change in approach was critical and strategic and it highlighted the areas in the organisation where the businesses were at risk of not meeting their EE targets. This methodology builds on the transformation forums in the various business units and is a further extension of the succession processes. This also provides opportunities for managers to ensure that their talent planning aligns to the EE targets.
One of the initiatives will be the hosting of a second retail management development programme during 2010. It will cater for the merchandise buyers and merchandise planners only. The candidates selected for this programme
will have been identified as future leaders in their various business units. The purpose of this programme will be to fast track these individuals, and also ensure the achievement of the EE targets.
The group has enjoyed platinum sponsorship at the Tomorrow’s Leaders Convention. This is the third year of participation. The group hosted a retail breakaway as part of its strategy to ensure that retail, as a career of choice, was showcased to top black African talent. Membership of the Black Management Forum continues and every effort is made to ensure that the group positions itself in the market-place as an employer of choice.
The bar chart on the following page illustrates the workplace profile against the 2011 EE plan for the group.
It remains an imperative of the group to ensure that good skills are retained amongst our Black employees.
Affirmative action in Namibia remains a focus and strategy. All stakeholders, who include the union and employees in Namibia, are satisfied that the affirmative action targets are aligned
HUMAN RESOURCES continued
Age distribution
2008 2009 2010
00 – 20 21 – 29 30 – 39 40 – 49 50 – 59 60 – 99
80,00%
70,00%
60,00%
50,00%
40,00%
30,00%
20,00%
10,00%
0,00%

FOSC
HIN
I GRO
UP A
NN
UA
L REPORT 2010 - PA
GE 111
to the legislation. The affirmative action measures include training and development for all the previously disadvantaged persons. The organisation will continue to ensure that it will target those individuals in all our interventions.
TALENT MANAGEMEN TThe ongoing management of talent remains a key priority. This is critical in light of the fierce competition for talent and the need to comply with the Employment Equity Act (EEA). Talent audits are done twice annually and appropriate retention and development
strategies are initiated. We continue to monitor trends relating to employee departures to enable the group to react proactively to any identified risks to staff retention.
Our approach to talent management focuses on:
• talent discovery;
• talent performance;
• talent development;
• talent movement; and
• talent retention.
Workforce
2008 Actual 2009 Actual 2010 Actual 2011 Plan
African Coloured Indian White Total Black
100,00%
90,00%
80,00%
70,00%
60,00%
50,00%
40,00%
30,00%
20,00%
10,00%
0,00%
SERVICED
IVISIO
NS
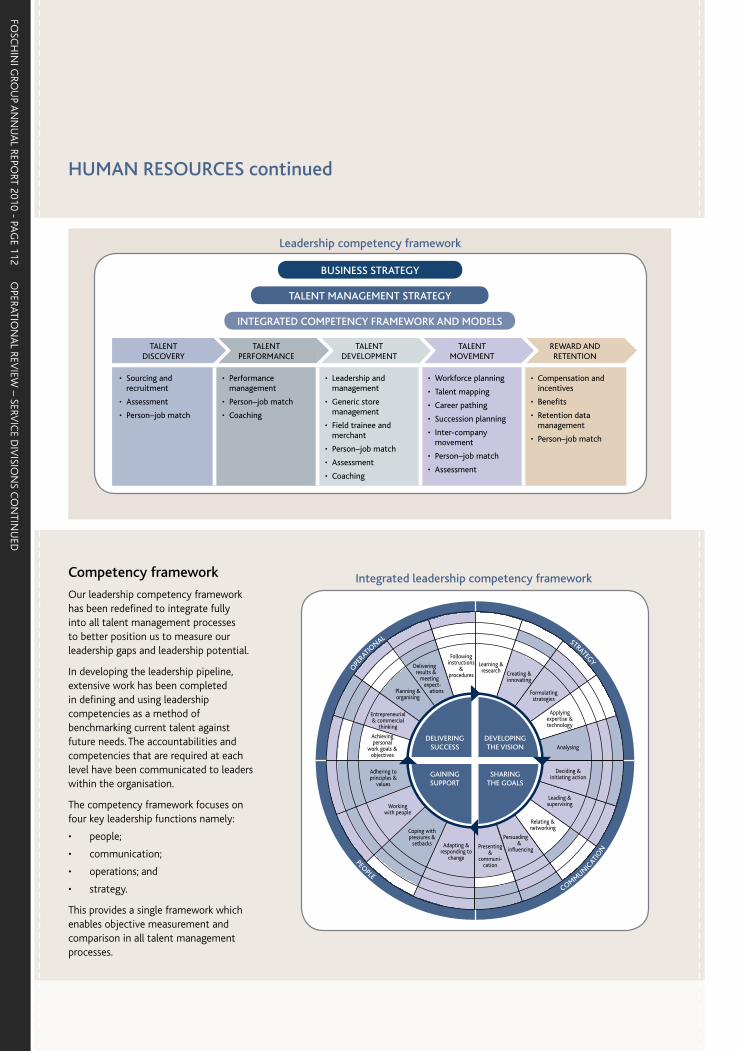
FOSC
HIN
I GRO
UP A
NN
UA
L REPORT 2010 - PA
GE 112
OPERATIO
NA
L REVIEW
– SERVIC
E DIV
ISION
S CO
NTIN
UED
Competency framework
Our leadership competency framework has been redefined to integrate fully into all talent management processes to better position us to measure our leadership gaps and leadership potential.
In developing the leadership pipeline, extensive work has been completed in defining and using leadership competencies as a method of benchmarking current talent against future needs. The accountabilities and competencies that are required at each level have been communicated to leaders within the organisation.
The competency framework focuses on four key leadership functions namely:
• people;
• communication;
• operations; and
• strategy.
This provides a single framework which enables objective measurement and comparison in all talent management processes.
HUMAN RESOURCES continued
Integrated leadership competency framework
OPE
RATIONAL STRATEGY
PEOPLE
COMMUNICATI
ON
Following instructions
& procedures
Learning & research Creating &
innovating
Formulating strategies
Applying expertise & technology
Analysing
Deciding & initiating action
Leading & supervising
Relating & networking
Persuading &
influencingPresenting &
communi- cation
Adapting & responding to
change
Coping with pressures &
setbacks
Working with people
Adhering to principles &
values
Achieving personal
work goals & objectives
Entrepreneurial & commercial
thinking
Planning & organising
Delivering results & meeting expect- ations
DELIVERING SUCCESS
GAINING SUPPORT
DEVELOPING THE VISION
SHARING THE GOALS
BUSINESS STRATEGY
TALENT MANAGEMENT STRATEGY
INTEGRATED COMPETENCY FRAMEWORK AND MODELS
TALENT DISCOVERY
TALENT PERFORMANCE
TALENT DEVELOPMENT
TALENT MOVEMENT
REWARD AND RETENTION
• Sourcing and recruitment
• Assessment
• Person–job match
• Performance management
• Person–job match
• Coaching
• Leadership and management
• Generic store management
• Field trainee and merchant
• Person–job match
• Assessment
• Coaching
• Workforce planning
• Talent mapping
• Career pathing
• Succession planning
• Inter-company movement
• Person–job match
• Assessment
• Compensation and incentives
• Benefits
• Retention data management
• Person–job match
Leadership competency framework
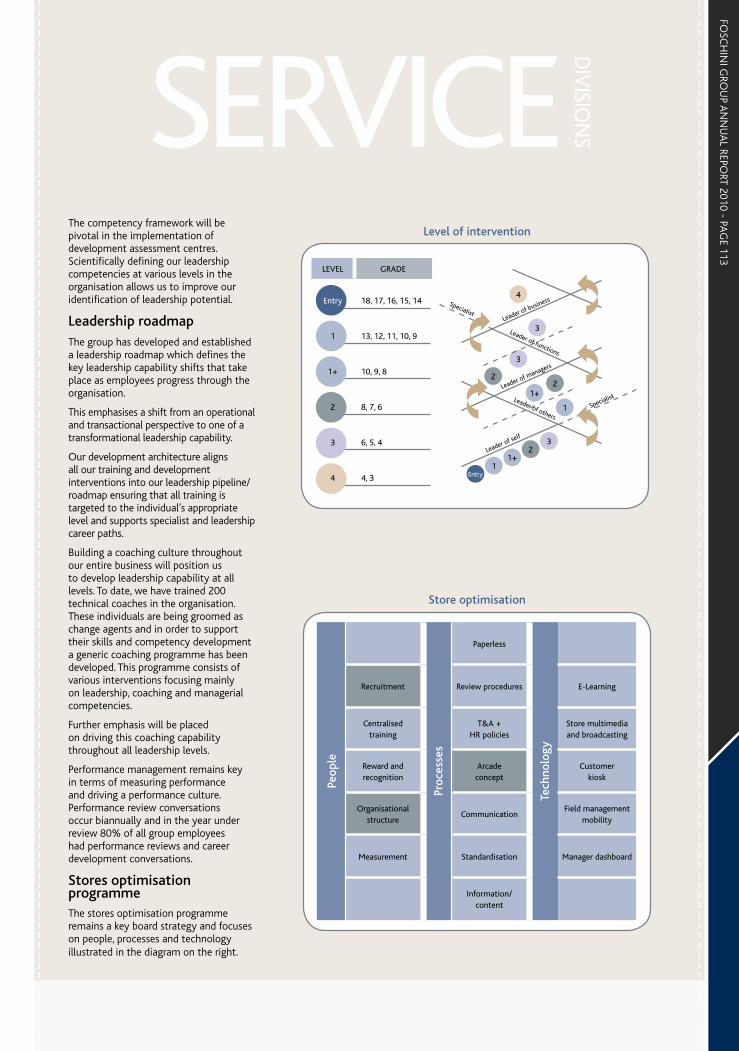
FOSC
HIN
I GRO
UP A
NN
UA
L REPORT 2010 - PA
GE 113
The competency framework will be pivotal in the implementation of development assessment centres. Scientifically defining our leadership competencies at various levels in the organisation allows us to improve our identification of leadership potential.
Leadership roadmapThe group has developed and established a leadership roadmap which defines the key leadership capability shifts that take place as employees progress through the organisation.
This emphasises a shift from an operational and transactional perspective to one of a transformational leadership capability.
Our development architecture aligns all our training and development interventions into our leadership pipeline/roadmap ensuring that all training is targeted to the individual’s appropriate level and supports specialist and leadership career paths.
Building a coaching culture throughout our entire business will position us to develop leadership capability at all levels. To date, we have trained 200 technical coaches in the organisation. These individuals are being groomed as change agents and in order to support their skills and competency development a generic coaching programme has been developed. This programme consists of various interventions focusing mainly on leadership, coaching and managerial competencies.
Further emphasis will be placed on driving this coaching capability throughout all leadership levels.
Performance management remains key in terms of measuring performance and driving a performance culture. Performance review conversations occur biannually and in the year under review 80% of all group employees had performance reviews and career development conversations.
Stores optimisation programmeThe stores optimisation programme remains a key board strategy and focuses on people, processes and technology illustrated in the diagram on the right.
Level of intervention
LEVEL GRADE
Entry 18, 17, 16, 15, 14
1 13, 12, 11, 10, 9
1+ 10, 9, 8
2 8, 7, 6
3 6, 5, 4
4 4, 3 Entry
1
1
1+
1+
22
2
3
3
3
4
Leader of business
Leader of managers
Leader of self
Specialist
Specialist
Leader of functions
Leader of others
Store optimisation
Paperless
Recruitment Review procedures E-Learning
Centralised training
T&A + HR policies
Store multimedia and broadcasting
Reward and recognition
Arcade concept
Customer kiosk
Organisational structure
CommunicationField management
mobility
Measurement Standardisation Manager dashboard
Information/ content
Peop
le
Proc
esse
s
Tech
nolo
gy
SERVICED
IVISIO
NS
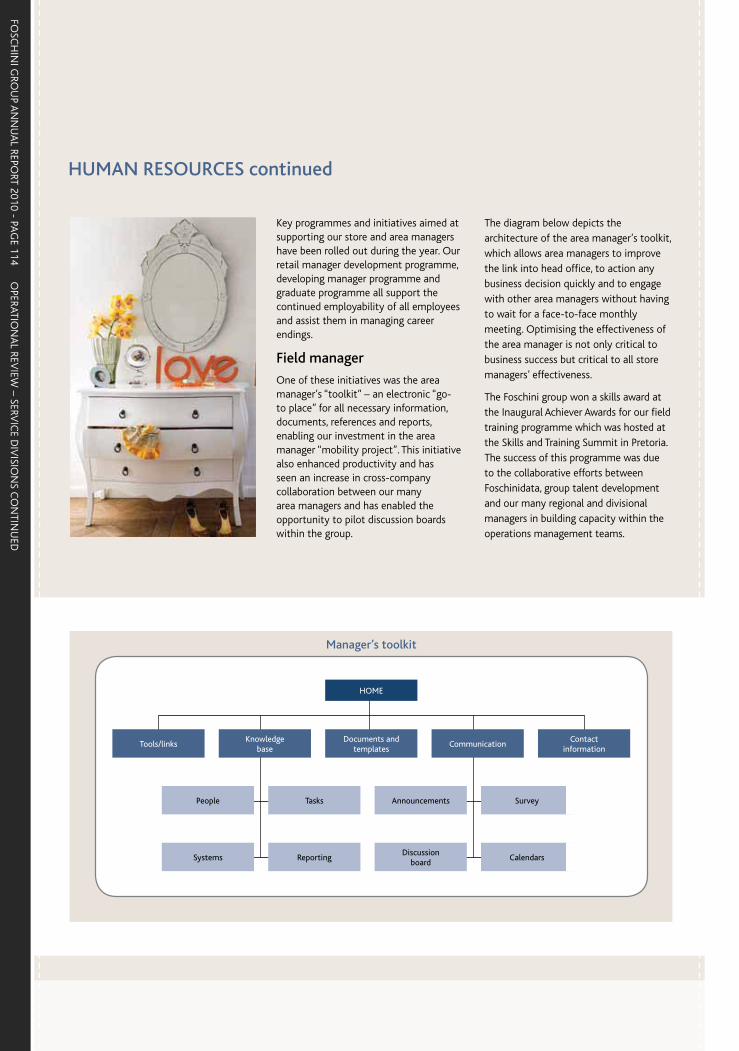
FOSC
HIN
I GRO
UP A
NN
UA
L REPORT 2010 - PA
GE 114
OPERATIO
NA
L REVIEW
– SERVIC
E DIV
ISION
S CO
NTIN
UED
Key programmes and initiatives aimed at supporting our store and area managers have been rolled out during the year. Our retail manager development programme, developing manager programme and graduate programme all support the continued employability of all employees and assist them in managing career endings.
Field manager
One of these initiatives was the area manager’s “toolkit” – an electronic “go-to place” for all necessary information, documents, references and reports, enabling our investment in the area manager “mobility project”. This initiative also enhanced productivity and has seen an increase in cross-company collaboration between our many area managers and has enabled the opportunity to pilot discussion boards within the group.
Manager’s toolkit
The diagram below depicts the architecture of the area manager’s toolkit, which allows area managers to improve the link into head office, to action any business decision quickly and to engage with other area managers without having to wait for a face-to-face monthly meeting. Optimising the effectiveness of the area manager is not only critical to business success but critical to all store managers’ effectiveness.
The Foschini group won a skills award at the Inaugural Achiever Awards for our field training programme which was hosted at the Skills and Training Summit in Pretoria. The success of this programme was due to the collaborative efforts between Foschinidata, group talent development and our many regional and divisional managers in building capacity within the operations management teams.
HUMAN RESOURCES continued
People Tasks Announcements Survey
Systems ReportingDiscussion
boardCalendars
HOME
Tools/linksKnowledge
baseDocuments and
templatesCommunication
Contact information
FOSC
HIN
I GRO
UP A
NN
UA
L REPORT 2010 - PA
GE 115
TRAINING AND DEVELOPMENTThis year the group significantly increased its investment spend on training and development to R88 million, up from R62,2 million in 2009 – as well as the number of employees trained (see performance data below):
Training statistics 2010 % increase 2009
Total number of interventions attended by employees 131 166 78 73 526
Total number of interventions attended by black employees 113 373 87 60 699
Total number of interventions attended by black female employees 108 309 161 41 477
Total spend on training and development (including cost of salaries for in-store training interventions) (R million) 88,4 42 62,2
During the last skills year, April 2009 to March 2010, the group paid a skills levy of R11,3 million. The maximum available rebate from the Wholesale and Retail SETA was recovered.
Central resourcing
In the past year 426 permanent and 440 contract head office and field placements were made (inclusive of our call centre agent placements). Of those hired externally, 72% were equity candidates. An increase in direct applications and placements was seen due largely to the group’s career website attracting candidates. CVs posted online increased from a database of 20 000 to 32 000 during the course of the past year.
Recruitment in the field of IT continues to be challenging. Fortunately our attendance at The Homecoming Revolution (a London-based careers fair) provided an opportunity to expand awareness of Foschinidata and to source South African candidates with international IT experience who wanted to return home. This resulted in a placement of six candidates and proved financially viable as we reached the cost-neutral point after four placements.
The recruitment of call centre agents has slowed down from the previous year, largely because labour turnover has reduced. Reasons for this include: sourcing better calibre agents; and improved succession planning and career development for agents. Over the past year the number of agents recruited was 391 (50% down on the number recruited in the previous financial year).
Graduate recruitment was yet again successful with 31 placements being made, of which 50% were for trainee buyer and trainee planner positions. Graduate recruitment is a critical talent pipeline for management levels across the group and is a key driver of employment equity. 74% of the candidates hired fulfilled the equity requirements – an improvement from 70% last year. Of the graduates placed, 35% were recruited from within the group, thus providing valuable internal career development opportunities.
REWARDBest practice in reward management remains a critical area of focus, to ensure that the group remains well positioned in a highly competitive
market. A comprehensive, “total reward” approach is followed, recognising that whilst remuneration is critical, this must be balanced with attractive benefits, an enjoyable working environment and the opportunity for employees to develop and grow.
Remuneration for each employee in the group is benchmarked against a base pay range for their specific position or, in a minority of cases, for their grade. A desired market position is defined for each family of roles, taking into account the value that these groupings of roles add to the retail value chain.
Base pay is integrated with a best-of-breed job evaluation system that ensures that the market benchmarks that are used in determining remuneration are accurate and valid.
Recognising that employees are parents, family and community members, “Flex-e”, a flexible working hours programme, was introduced during this year. This programme is available to all non-store staff in roles where flexibility will not negatively impact service delivery to our stores. This has enabled staff, outside of defined core working hours, to flexibly self-manage their working hours to improve balance between work and other responsibilities and interests.
Current approaches to incentivise store staff have been reviewed and as a result a pilot was launched during the year to test a group-wide incentive for all permanent store staff. This pilot is being reviewed and it is anticipated that it will be rolled out to the group in the next financial year.
An extensive investigation was made towards the introduction of a second share incentive scheme that will be used in tandem with the existing Share Appreciation Right scheme to create the desired balance between retention and reward for organisational performance. This, subject to shareholder approval, will be introduced during the coming year.
SERVICED
IVISIO
NS
FOSC
HIN
I GRO
UP A
NN
UA
L REPORT 2010 - PA
GE 116
OPERATIO
NA
L REVIEW
– SERVIC
E DIV
ISION
S CO
NTIN
UED
MANAGING EMPLOYEE RELATIONS The size of the workforce, the complexities and the diversities of the various brands within our organisation require that conflict management remains a key focus for the group. The employee relations team continue to manage out-of-line situations immediately and without any delays or disruptions to the workplace.
Issues relating to workplace disputes and referrals to the Commission for Conciliation, Mediation and Arbitration (CCMA) have increased from 143 referrals in 2008 to 172 referrals in 2009. These low levels of referrals can be attributed to fair processes and procedures in the workplace.
Union activity both in South Africa and Namibia is mainly confined to annual wage negotiations.
Occupational health and safety
The group is committed to ensuring a safe and healthy workplace for all its employees, and shopping environment. Due to the nature of our operations as a retailer, our employees work in a low risk environment. We comply with all relevant legislation, in particular the Occupational Health and Safety (OHS) Act of 1993, ensuring responsible management of occupational health through an external service provider. This includes monitoring risks in the workplace, addressing reported incidents, and raising awareness and responsibility amongst employees around serious diseases.
Treatment for injuries on duty, as well as curative and preventative care, is provided from a centrally located clinic that is permanently staffed by two qualified nursing sisters. The clinic provides a service to all employees working at the head office campuses as well as those in the larger distribution centres. Services offered include family planning, HIV testing, primary health care, post-employment health screening
and health education. A medical doctor is on site twice a week to assist with cases requiring specialised attention.
All cases of extended ill health are managed through our service provider’s WAKE programme. The programme is available to all our employees working in stores within South Africa and Namibia and in our head office and regional centres. Permanently employed staff who are unable to work as a result of ill health or injury for an indefinite or fixed period of time receive income replacement benefit.
Our OHS performance remained relatively consistent with previous years; the majority of incidents reported were minor and there were no fatalities. Incidents relate primarily to emotional trauma or physical discomfort and impairment.
The statistics for reported incidents involving staff members of the group in 2010 are as follows:
Managing HIV/AIDS
The group is committed to providing ongoing initiatives aimed at minimising the spread and impact of HIV/AIDS in the workplace. The disease is adequately managed in the group and is not regarded as a material risk. Enhancing the extent of participation by employees in our initiatives providing testing, counselling and treatment, is an ongoing challenge.
We have a formal HIV/AIDS policy in place, which is communicated to all existing and new employees and is available on the group intranet. Access to free and confidential HIV testing and counselling is provided to all our employees through an external network of pharmacies. Those employees who test HIV-negative are encouraged to adopt safe behaviour to retain this status, while those testing HIV-positive are encouraged to enrol on a disease management programme offered by QUALSA. All treatment is confidential and provided free of charge, including antiretroviral therapy, to all our permanent employees.
Occupational injuries and diseases 2010 2009
Total number of days lost 1 510 1 924
Total number of incidents 445 403
Number of incidents involving three days or less off from work 349 294
Number of incidents requiring more than three days off from work 96 109
HUMAN RESOURCES continued
FOSC
HIN
I GRO
UP A
NN
UA
L REPORT 2010 - PA
GE 117
Treatment is also available to all our permanent staff in Namibia.
To date, 1 046 HIV tests have been conducted through the programme, with 79 testing positive. Treatment is being provided to 43 employees through the group’s disease management programme. Some employees choose to receive treatment through their independent medical schemes or through the State.
According to annual risk assessments commissioned by the group from Health Monitor Company, the HIV-positive prevalence rate within the group is estimated to be in the region of 7%. The direct measurable cost to the group as a result of HIV infection was R302 528 in 2010 down from R325 900 in 2009. Combined with the cost of benefits provided in Namibia, the combined cost for 2010 was R458 115.
Additional efforts to promote free HIV testing include providing ongoing facilities at our centrally located clinic in Cape Town and onsite testing during the group’s annual Health Days and on World Aids Day. Through our “Retailers Uniting Against HIV/AIDS” campaign launched in collaboration with four leading retailers in South Africa in 2007, we have provided testing to 1 056 members of our collective staff working in shopping centres.
Recognising that HIV/AIDS affects our workforce, their families, our customers and communities nationwide, a focus of our corporate social investment activities is providing support to organisations that assist communities in managing the impact of HIV infection.
Promoting employee well-being
In addition to ensuring health and safety in the workplace and promoting personal growth through skills development, the group offers its employees a range of benefits (outlined below) and has a formal employee assistance policy and employee wellness programme aimed at
promoting a broader sense of employee good health and well-being. This service includes a free and confidential help line, managed by our occupational health service provider and manned by a qualified social worker, to provide telephonic psycho-social support to all employees irrespective of where they are located. Issues raised through the help line range from financial advice to family matters, inter-personal conflict, legal issues, substance abuse and HIV/AIDS. Referrals to community-based specialist networks are made when appropriate and all help line cases are followed up until satisfactorily resolved. Since its launch in 2008, the help line has recorded 1 356 cases.
The help line also co-ordinates support to stores that have been involved in armed robberies. This includes trauma counselling services and ongoing telephonic support. This year we introduced a regular weekly face-to-face counselling facility for employees working at our head office in Parow, Cape Town, who do not have access to private telephone lines at work.
Employee benefitsThe following provides a brief description of additional initiatives aimed at promoting employee well-being.
Retirement funding All permanent staff of the group’s wholly-owned subsidiaries are required to join the Foschini Group Retirement Fund. Despite the volatility of financial markets the fund achieved an overall performance return of 15,3% during its financial year. Total market value of the assets of the fund at 31 March 2010 amounted to R2,7 billion, which is R0,5 billion higher than the previous year.
Pensioners were awarded an increase of 7% effective from 1 January 2010, which is in line with the pensioner increase policy of the fund to award at least inflationary increases, subject to affordability. Apart from retirement benefits, the following are provided by the fund:
• a funeral benefit of R10 000 for the principal member and spouse and
a lesser benefit for their dependent children;
• a death benefit of four times annual salary as well as the member’s gross equishare is available to provide benefits to dependants and beneficiaries, payable in the event of death in service and where the death is accidental, a further benefit of twice annual salary is payable; and
• in cases of disablement, an insured disability benefit is provided to qualifying staff members, equating to 75% of pensionable salary earned at the time of becoming disabled, payable until attainment of normal retirement age (subject to continued disablement), after which the normal retirement benefit becomes effective.
Employees of RCS Group are not members of the Foschini Group Retirement Fund but receive comparable benefits from the Liberty Life Provident Fund.
Where required, employees of subsidiaries trading outside South Africa belong to umbrella funds that comply with the legislation of the relevant country. Further detail about our retirement fund is available through our website.
Foschini Group Medical Aid SchemeThe Foschini Group Medical Aid Scheme is an in-house, subsidised medical scheme that is designed to best suit the needs of most employees. Membership is voluntary except for senior employees. We have approximately 2 500 principal members covering approximately 5 200 lives in total.
The scheme is administered by the Metropolitan Health Group and is fully compliant with the Medical Schemes Act. The board of trustees of the scheme is responsible for all aspects of its operations, which are reviewed by both the Foschini group medical aid audit committee and external auditors.
The accumulated funds ratio of the scheme at 31 December 2009 was
SERVICED
IVISIO
NS

FOSC
HIN
I GRO
UP A
NN
UA
L REPORT 2010 - PA
GE 118
OPERATIO
NA
L REVIEW
– SERVIC
E DIV
ISION
S CO
NTIN
UED
61,82% which is well in excess of the required minimum of 25%, but not excessive for a small in-house scheme that will be subject to greater volatility than the norm as a result of sporadic large claims.
The scheme experienced higher than expected claims during 2009 which necessitated increases of 19,5% and 15% respectively for the two benefit plans available for 2010, compared to 5% and 7,5% for the previous year.
A risk assessment of the scheme is undertaken at least annually, both by the trustees and the administrators. The highest risk identified by the trustees is the volume and impact of legislation affecting medical schemes. Keeping abreast of all current and pending legislation and adapting the scheme’s rules accordingly assists in managing this risk.
Employees based in Namibia may elect to join a medical scheme that is similarly funded by the group.
All permanent staff of RCS Group are required to become members of a medical plan of their choice offered by Discovery Health.
Educational assistanceThe group offers its permanent employees low-interest loans to assist with tertiary education costs for their children. The loans are available on an annual basis for each child and are repayable over two years.
Personal loans Interest-bearing loans are available to our permanent employees to assist with hardship, or the purchase or improvement of property. During the review period, 26 qualifying staff members took advantage of this facility, 81% of whom were from previously disadvantaged communities. The balance of the loans were weighted towards employees experiencing hardships due to the impact of the downturn in the economy. As at year-end, the outstanding value of these loans was R115 886.
Home assistanceEmployees may access further financial assistance for home purchases or improvements from an outsourced facility, using their share in the Foschini Group Retirement Fund as security. This is subject to the rules of the fund. The total of these loans at the year-end was R8,7 million.
SponsorshipEmployees are encouraged to undertake studies that will assist them in their current or future careers with the group. Sponsorship varies according to the level of study and requires greater financial commitment from employees at higher educational levels. Support for matriculation study fees is 100%. The group also offers sponsorship for the UNISA Retail Certificate, an intensive one-year retail-specific diploma.
Sponsorship amounting to R404 866 was provided to employees during the review period, 86,8% of whom were from previously disadvantaged groups, up from 78% last year.
HUMAN RESOURCES continued

FOSC
HIN
I GRO
UP A
NN
UA
L REPORT 2010 - PA
GE 119

FOSC
HIN
I GRO
UP A
NN
UA
L REPORT 2010 - PA
GE 120
GO
VERN
AN
CE PRO
FILE

FOSC
HIN
I GRO
UP A
NN
UA
L REPORT 2010 - PA
GE 121
Corporate Governance Report 122
Audit Committee Report 136
Risk Report 139
Remuneration Report 143
Transformation and CSI 147
Sustainability Overview 152
Value Added Statement 168

FOSC
HIN
I GRO
UP A
NN
UA
L REPORT 2010 - PA
GE 122
CO
RPORATE G
OV
ERNA
NC
E REPORT
CORPORATE GOVERNANCE REPORT
The board of directors of Foschini Limited (Foschini) remains fully committed to business integrity, fairness, transparency and accountability in all its activities. In support of this commitment, the board subscribes to the highest standards of corporate governance in all aspects of the business and to the ongoing development and implementation of best practices.
The board is ultimately responsible for ensuring that the group meets high governance standards and is assisted by management who aims to instil a culture of compliance and good governance throughout the group.
Foschini fully endorses the principles and practices incorporated in the King Code of Governance for South Africa 2009 (King III) and in the Listings Requirements of the JSE Limited.
GOVERNANCE LANDSCAPEThe King Code of Governance for South Africa 2009 became effective on 1 March 2010. In terms of the Listings Requirements of the JSE Limited application of the changes relating to King III must be complied with in respect of all financial years commencing on or after 1 March 2010.
Whilst Foschini is therefore required to ensure compliance with King III in respect of the year ending 31 March 2011, a concerted effort has been made to produce an integrated report in line with the requirements of King III for the year ended 31 March 2010. Where a principle of King III has not been applied, this has been explained where relevant.
Integrated reporting in terms of King III requires annual reporting of both financial and sustainability performance, as well as commentary on how the company plans to enhance the positive aspects and eradicate or ameliorate the negative aspects in the year ahead.
The changes to the annual report resulting from the application of King III have largely been to present the required information in a more relevant layout such that separate reports covering
risk, remuneration and transformation have now been introduced. The aspects covered in these reports were previously dealt with to a lesser degree within the Corporate Governance report itself.
A more integrated approach to sustainability reporting has been applied with information being presented where most relevant as opposed to being contained strictly within the Sustainability report itself. The board believes that the information contained within the entire integrated report and specifically within the Corporate Governance, Risk, Remuneration, Sustainability and Transformation reports collectively adequately conveys Foschini’s sustainability performance. The financial performance continues to be adequately covered in the annual financial statements. The commentary contained both within these reports, as well as in the Chairman’s, CEO’s and FD’s reports, outlines the positives and negatives as well as planned action steps.
The board acknowledges that it has ultimate responsibility for ensuring the integrity of the integrated report and is satisfied that sufficient controls are in place to verify and safeguard the integrity of the 31 March 2010 integrated report. In addition, the board has accepted the recommendation by the audit committee regarding the reliability of the sustainability disclosures that have been made.
Aside from the changes made to the annual report, much of the impact of King III relates to operational governance issues such as board sub-committee composition and functioning; as well as day-to-day board procedures. Foschini’s procedures have been strengthened where relevant to align with the King III requirements.
The board acknowledges that the application of the King Code of Governance continues to serve as a valuable guide to the entrenchment of strong governance principles throughout the group.
THE MAIN BOARD OF DIRECTORS OF FOSCHINI LIMITED
Role
The direction and leadership of Foschini is the responsibility of the directors of the main board of Foschini Limited whilst the operating board has responsibility for the day-to-day management of the group.
Function
King III imposes various specific responsibilities on the board and the Foschini directors embrace this responsibility and acknowledge that:
• the board should act in the best interests of Foschini;
• the board is the custodian of corporate governance and undertakes to provide leadership based on an ethical foundation, as well as ensuring that ethics are managed effectively;
• Foschini is, and must be seen to be, a responsible corporate citizen;
• strategy, risk, performance and sustainability are inseparable;
• Foschini has an effective and independent audit committee;
• risk management and IT governance:
– The board is responsible for the governance of risk (including information technology governance), as well as for determining the levels of risk tolerance.
– Whilst management has responsibility for the implementation of the risk management plan and for providing assurance to the board in this regard, the board will ensure that risk monitoring is a continual process and that risk assessments are performed on an ongoing basis with appropriate risk responses.
FOSC
HIN
I GRO
UP A
NN
UA
L REPORT 2010 - PA
GE 123
– In addition the board will ensure that the frameworks are such that they increase the probability of anticipating unpredictable risks and that appropriate risk disclosure is made to stakeholders;
• compliance:
– The board should ensure compliance with applicable laws and ensure that compliance risk is addressed in the risk management process.
– In addition each individual director undertakes to maintain a working understanding of the laws, rules, codes and standards applicable to Foschini.
– Management will be responsible for the implementation of an effective compliance function and processes;
• internal audit:
– Foschini has an effective internal audit function known as Group Audit Services, which follows a risk-based approach to its plan.
– Group Audit Services is appropriately positioned to achieve its objectives and is overseen by the audit committee.
– Group Audit Services provides a written assessment of the effectiveness of Foschini’s internal controls to the audit and risk committees of the board;
• stakeholder engagement:
– Whilst management is tasked with managing stakeholder relationships, the board gives due consideration to the effect of stakeholder perceptions on Foschini’s reputation and strives to achieve a balance between the various stakeholder
groupings in its decision-making process.
– Appropriate consideration is given to the format and content of communication with stakeholders, as well as ensuring that dispute resolution is an effective process.
– Every effort is made to ensure equitable treatment of shareholders; and
• the board should ensure the integrity of the integrated report that should include financial and sustainability performance.
Leadership
The position of chairman is undertaken by an independent non-executive director, Mr D M Nurek whose role is separate and clearly defined from that of the chief executive officer (CEO), Mr A D Murray. There is a clear division of responsibilities between the chairman and the CEO with both providing leadership and guidance to the company’s board, encouraging deliberation on all matters requiring the board’s attention, and obtaining optimum input from the other directors.
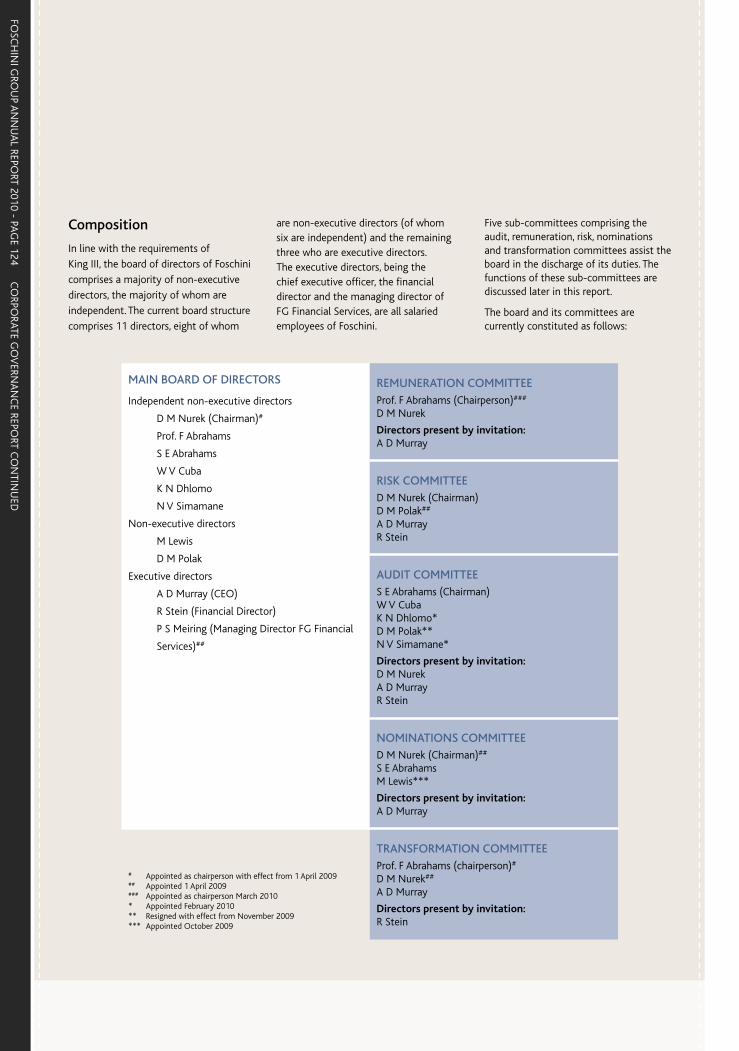
FOSC
HIN
I GRO
UP A
NN
UA
L REPORT 2010 - PA
GE 124
CO
RPORATE G
OV
ERNA
NC
E REPORT C
ON
TINU
ED
Composition
In line with the requirements of
King III, the board of directors of Foschini
comprises a majority of non-executive
directors, the majority of whom are
independent. The current board structure
comprises 11 directors, eight of whom
are non-executive directors (of whom six are independent) and the remaining three who are executive directors. The executive directors, being the chief executive officer, the financial director and the managing director of FG Financial Services, are all salaried employees of Foschini.
Five sub-committees comprising the audit, remuneration, risk, nominations and transformation committees assist the board in the discharge of its duties. The functions of these sub-committees are discussed later in this report.
The board and its committees are currently constituted as follows:
MAIN BOARD OF DIRECTORS
Independent non-executive directors
D M Nurek (Chairman)#
Prof. F Abrahams
S E Abrahams
W V Cuba
K N Dhlomo
N V Simamane
Non-executive directors
M Lewis
D M Polak
Executive directors
A D Murray (CEO)
R Stein (Financial Director)
P S Meiring (Managing Director FG Financial
Services)##
REMUNERATION COMMITTEEProf. F Abrahams (Chairperson)### D M Nurek
Directors present by invitation:A D Murray
RISK COMMITTEED M Nurek (Chairman)D M Polak##
A D MurrayR Stein
AUDIT COMMITTEES E Abrahams (Chairman)W V CubaK N Dhlomo*D M Polak**N V Simamane*
Directors present by invitation:D M NurekA D MurrayR Stein
NOMINATIONS COMMITTEED M Nurek (Chairman)##
S E AbrahamsM Lewis***
Directors present by invitation:A D Murray
# Appointed as chairperson with effect from 1 April 2009## Appointed 1 April 2009### Appointed as chairperson March 2010* Appointed February 2010** Resigned with effect from November 2009*** Appointed October 2009
TRANSFORMATION COMMITTEEProf. F Abrahams (chairperson)#
D M Nurek##
A D Murray
Directors present by invitation:R Stein
FOSC
HIN
I GRO
UP A
NN
UA
L REPORT 2010 - PA
GE 125
Sub-committee compositionIn order to comply as far as practical with the recommendations of King III, the nominations committee recommended the following changes to the various sub-committees during the year:
Remuneration committeeProf. F Abrahams replaced Mr D M Nurek as chairperson of the remuneration committee with effect from March 2010.
Risk committeeKing III recommends that the chairman of the board should not be the chairman of this committee. The nominations committee however recommended that Mr D M Nurek continue to serve as the chairman of the risk committee as he is considered to be the most relevant and practical choice.
Audit committeeMr D M Polak stood down as a member of the audit committee (as he is not considered independent in terms of the King III definitions and therefore not eligible for membership) during the year.
Following his appointment as chairman of the board, Mr D M Nurek is no longer a member of this committee, but continues to attend meetings by invitation.
Nominations committeeMr A D Murray attends the meetings of this committee by invitation as is recommended by King III.
Transformation committeeProf. F Abrahams replaced Mr E Osrin as chairperson of this committee on 1 April 2009.
In order to ensure a majority of non-executive directors on this committee, Mr R Stein now attends meetings of this committee by invitation.
DirectorsThe non-executive directors come from diverse backgrounds in commerce and industry. Their collective experience enables them to provide sound, independent and objective judgement in decision-making that is in the best interests of the group. They are ultimately responsible for the performance of the
group, its long-term sustainable growth, and the enhancement of shareholder value. They review and ratify the group’s strategy in addition to monitoring and measuring its performance and executive management against key performance indicators. They provide opinion and advice regarding the group’s financial, audit, governance and risk management controls. In order to ensure sustainable leadership they review group transformation and succession planning at senior levels, and provide input into the remuneration process.
All directors exercise unfettered discretion in the fulfilment of their duties, resulting in constructive debate at meetings that continues to yield well-considered decisions.
Detailed information on the directors and their credentials appear on pages 10 to 13.
Director appointment and induction
Newly appointed non-executive directors hold office only until the next annual general meeting, at which time they retire and become eligible for re-election as directors. Each year, one-third of the existing board members are subject to retirement by rotation. This is in line with the requirements of King III. The nominations committee recommends re-election by the shareholders after due consideration is given to the individual directors’ attendance and performance. Non-executive directors have no fixed term of employment and the performance of all directors is subject to annual peer review.
A formal induction programme for new directors is in place with the objective of maximising their understanding of the group and enabling them immediately to provide input and make well-informed decisions.
Changes to the board during the current year
The appointment of Mr D M Nurek as chairman of the board and the appointment of Mr P S Meiring as a
director of Foschini Limited were both effective on 1 April 2009 and were both reported in the 2009 annual report. Aside from these changes, no other changes were made in respect of the composition of the main board during the year under review.
Independence assessment
All directors are required to complete an independence questionnaire to establish whether they meet the objective independence criteria of King III. Six of the non-executive directors are independent according to the King III definition.
Mr M Lewis is not considered independent in terms of the King III definition by virtue of his indirect shareholding in the group. Mr D M Polak is likewise not currently considered independent in terms of the King III definition by virtue of the fact that he was employed by the group in an executive capacity until December 2007. He is required to undergo a cooling off period of three financial years (until 1 April 2011) before he may be considered independent.
Of the six directors that satisfy the objective independence requirements, three directors have served a term exceeding nine years. The nominations committee reviewed the independence of Mr D M Nurek, Mr S E Abrahams and Mr W V Cuba and after due consideration, concluded that their long association with the group has not impaired their independence.
Board charter
The board is governed by a formal charter supported by relevant authority limits. This charter has been reviewed and updated where necessary to take into account the King III requirements.
A process is in place to review this charter on an annual basis.
Board meetings
The board typically meets quarterly in Cape Town, and further meetings are held at short notice when necessary.
CORPORATE GOVERNANCE REPORT
FOSC
HIN
I GRO
UP A
NN
UA
L REPORT 2010 - PA
GE 126
Proceedings at meetings are directed by a formal agenda. The proposed agenda is circulated prior to the meeting to allow board members sufficient opportunity to request additional agenda items.
In addition a comprehensive board pack is distributed to all members in advance of meetings to ensure that they are properly informed and enable them to undertake meaningful discussion and effectively discharge their duties. These packs typically include:
• Agenda
• Previous meeting minutes
• Copies of any resolutions passed since the last board meeting
• Update on matters arising since the last board meeting
• Minutes of all sub-committee meetings which have taken place since the last board meeting
• Shareholder analysis
• Summary of any announcements on SENS (stock exchange news service) in the intervening period
• Governance update to assist directors in remaining abreast of relevant legislation
All directors have unrestricted access to the company secretary and all company records as well as to independent professional advice at the company’s expense in appropriate circumstances.
Board evaluations
An annual evaluation of the board and each of the sub-committees is undertaken by means of a questionnaire sent to all board members. The results are collated by the company secretary and passed on to the chairman who has a one-on-one interview session with each director to discuss their feedback as well as any areas of concern. The chairman provides feedback to the full board on any actions arising from the evaluation process.
This annual evaluation is comprehensive, encompassing all aspects of the board’s responsibilities. It covers both individual member contributions and the effectiveness of the board as a whole. The results of the executive and non-executive directors are separately tabulated, in order to gauge any areas of difference in perception.
The evaluation undertaken during the current year resulted in the following actions being taken:
• nominations committee to consider the merits of appointing an additional non-executive director who possesses the suggested specific additional skills; and
• an additional board meeting has been scheduled specifically to deal with the three- to five-year strategy plan.
Directors’ remuneration and shareholdings
The remuneration paid to directors during the current year is disclosed in the Remuneration report that appears elsewhere in this report.
Information relating to the direct and indirect holdings of the directors at 31 March 2010, as well as their participation in share incentive schemes (where relevant) are likewise disclosed in the Remuneration report.
Non-executive directors do not participate in the share incentive schemes, with the exception of Mr D M Polak who obtained options whilst still an executive of the company.
Personal share dealings
The board complies with the requirements of the JSE Limited in relation to restrictions on the trading of Foschini’s shares by directors and employees during the defined closed periods. Restrictions may also be placed on share dealings at other times if the group is involved in corporate activity or sensitive negotiations. The company secretary notifies all directors and
employees prior to the commencement of the closed trading periods of the prohibitions contained in the Insider Trading Act relating to share dealings whilst in possession of price-sensitive information.
Details of directors’ share dealings are disclosed to the listings division of the JSE Limited and communicated through its electronic news service, SENS. These dealings are also disclosed at board meetings. There is a process in place in terms of the requirements of the JSE Limited for directors to obtain prior clearance before dealing in the company’s shares. All transactions are conducted at the ruling market price on the JSE Limited.
Directors’ interests in contracts
In addition to a formal annual disclosure process, directors are required to make ongoing disclosures of any interests in contracts. During the year under review the directors had no interests in contracts as contemplated in section 234 of the Companies Act.
Succession
It is the responsibility of the nominations committee to ensure adequate succession planning for all main board directors, as well as to ensure that all sub-committees are appropriately constituted and chaired.
As reported previously the appointment of Mr D M Nurek as chairman and the appointment of Mr P S Meiring as a director were both effective on 1 April 2009. No further changes were deemed necessary during the year under review.
The nominations committee believes that advanced planning is the key to succession and gives due consideration to succession planning on an ongoing basis.
Board attendance
The attendance of the directors at board meetings and board committee meetings for the financial year was as follows:
CO
RPORATE G
OV
ERNA
NC
E REPORT C
ON
TINU
ED
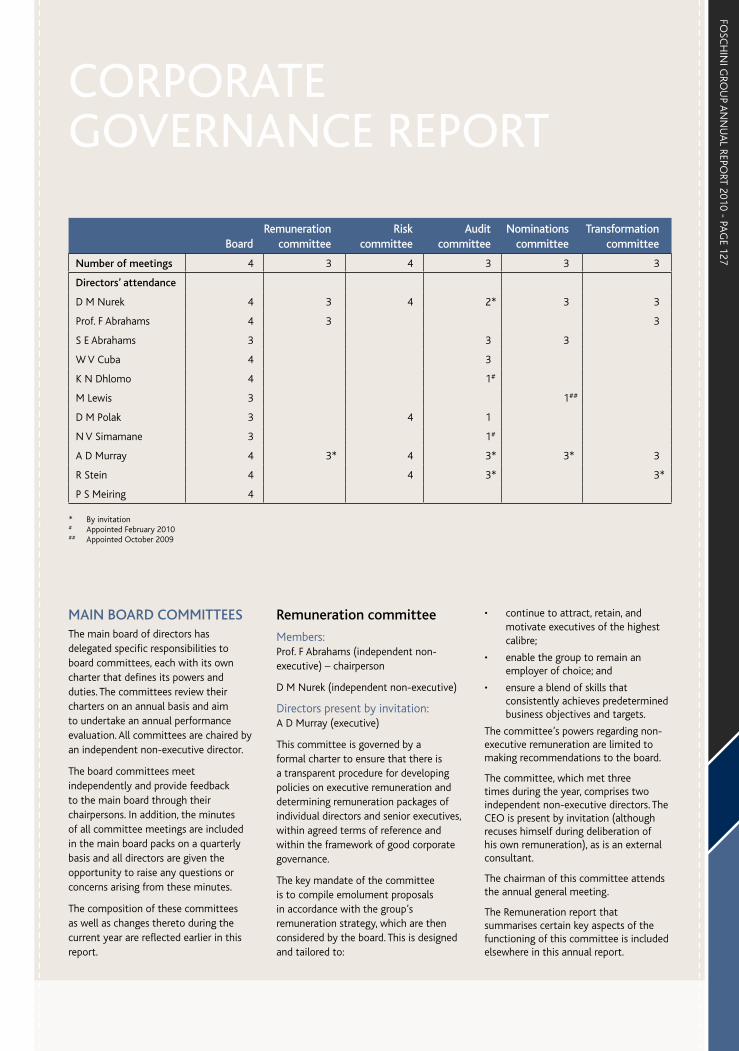
FOSC
HIN
I GRO
UP A
NN
UA
L REPORT 2010 - PA
GE 127
MAIN BOARD COMMITTEESThe main board of directors has delegated specific responsibilities to board committees, each with its own charter that defines its powers and duties. The committees review their charters on an annual basis and aim to undertake an annual performance evaluation. All committees are chaired by an independent non-executive director.
The board committees meet independently and provide feedback to the main board through their chairpersons. In addition, the minutes of all committee meetings are included in the main board packs on a quarterly basis and all directors are given the opportunity to raise any questions or concerns arising from these minutes.
The composition of these committees as well as changes thereto during the current year are reflected earlier in this report.
Remuneration committee
Members:Prof. F Abrahams (independent non-executive) – chairperson
D M Nurek (independent non-executive)
Directors present by invitation:A D Murray (executive)
This committee is governed by a formal charter to ensure that there is a transparent procedure for developing policies on executive remuneration and determining remuneration packages of individual directors and senior executives, within agreed terms of reference and within the framework of good corporate governance.
The key mandate of the committee is to compile emolument proposals in accordance with the group’s remuneration strategy, which are then considered by the board. This is designed and tailored to:
• continue to attract, retain, and motivate executives of the highest calibre;
• enable the group to remain an employer of choice; and
• ensure a blend of skills that consistently achieves predetermined business objectives and targets.
The committee’s powers regarding non-executive remuneration are limited to making recommendations to the board.
The committee, which met three times during the year, comprises two independent non-executive directors. The CEO is present by invitation (although recuses himself during deliberation of his own remuneration), as is an external consultant.
The chairman of this committee attends the annual general meeting.
The Remuneration report that summarises certain key aspects of the functioning of this committee is included elsewhere in this annual report.
CORPORATE GOVERNANCE REPORT
BoardRemuneration
committeeRisk
committeeAudit
committeeNominations
committeeTransformation
committee
Number of meetings 4 3 4 3 3 3
Directors’ attendance
D M Nurek 4 3 4 2* 3 3
Prof. F Abrahams 4 3 3
S E Abrahams 3 3 3
W V Cuba 4 3
K N Dhlomo 4 1#
M Lewis 3 1##
D M Polak 3 4 1
N V Simamane 3 1#
A D Murray 4 3* 4 3* 3* 3
R Stein 4 4 3* 3*
P S Meiring 4
* By invitation# Appointed February 2010## Appointed October 2009

FOSC
HIN
I GRO
UP A
NN
UA
L REPORT 2010 - PA
GE 128
CO
RPORATE G
OV
ERNA
NC
E REPORT C
ON
TINU
ED
Risk committee
Members:D M Nurek (Independent non-executive) – chairman
D M Polak (non-executive)
A D Murray (executive)
R Stein (executive)
The board is responsible for risk management, while divisional and operational management are accountable to the board for this process.
The group has adopted an ongoing, systematic and documented risk management process that ensures that all material risks are identified, evaluated, effectively managed, and where this is practical, quantified. This process is undertaken within each division as well as by the operating board. It has served to ingrain a sustainable risk awareness and culture at all levels. The assessments are aligned to the immediate, medium- and long-term strategic and business objectives within each division, as well as those of the group as a whole.
All significant projects undertaken by the group are subject to formal risk assessments. Ongoing business sustainability is addressed as part of this process.
The risk committee is responsible for ensuring that:
• appropriate risk and control policies are in place and are communicated throughout the group;
• the process of risk management and the system of internal control are regularly reviewed for effectiveness;
• there is an ongoing process of identifying, evaluating and managing the significant risks faced by the group, and that this is in place throughout the year;
• a formal risk assessment is undertaken annually;
• there is an adequate and effective system of internal control in place to manage the more significant risks faced by the group to an acceptable level;
• there is a documented and tested process in place that will allow the group to continue its critical business processes in the event of a disaster, inter alia the destruction of a distribution centre, head office, or computer facility, that affects its activities;
• a risk register is maintained and kept up to date; and
• appropriate insurance cover is placed and regularly reviewed, and that all uninsured risks are reviewed and managed.
The risk committee comprises two non-executive directors and two executive directors as at the financial year-end. Meetings are held four times a year.
The Risk report that summarises certain key aspects of the functioning of this committee is included elsewhere in this annual report.
Audit committee
Members:S E Abrahams (independent non-executive) – chairman
W V Cuba (independent non-executive)
K N Dhlomo (independent non-executive)
N V Simamane (independent non-executive)
Directors present by invitation:D M Nurek (independent non-executive)
A D Murray (executive)
R Stein (executive)
The committee is governed by a formal audit committee charter that has recently been updated to ensure compliance with the requirements of King III. This charter guides the committee in terms of its objectives, authority and responsibilities.
The role of the audit committee is, inter alia:
• to review the effectiveness of the group’s systems of internal control,
including internal financial control and risk management, and to ensure that effective internal control systems are maintained;
• to ensure that written representations on internal control are submitted to the board annually by all divisional managing directors and general managers (these being representations that provide assurance on the adequacy and effectiveness of the group’s systems of internal control);
• to monitor and supervise the effective functioning and performance of the internal auditors;
• to ensure that the scope of the internal audit function has no limitations imposed by management and that there is no impairment on its independence;
• to evaluate the independence, effectiveness, and performance of the external auditors and obtain assurance from the auditors that adequate accounting records are being maintained;
• to recommend the appointment of the external auditors on an annual basis;
• to ensure that the respective roles and functions of external audit and internal audit are sufficiently clarified and co-ordinated; and
• to review financial statements for proper and complete disclosure of timely, reliable and consistent information and to confirm that the accounting policies used are appropriate.
The committee consists of four independent non-executive directors. It typically meets three times per annum. Executive directors, members of executive management, internal audit, and the external audit partners and staff attend meetings at the invitation of the committee.
The Audit Committee report that summarises certain key aspects of the functioning of this committee is included elsewhere in this annual report.
FOSC
HIN
I GRO
UP A
NN
UA
L REPORT 2010 - PA
GE 129
Nominations committeeMembers:D M Nurek (independent non-executive) – chairman
S E Abrahams (independent non-executive)
M Lewis (non-executive)
Directors present by invitation:A D Murray (executive)
This committee is governed by a formal charter to ensure that there is a process in place to identify and assess new executive and non-executive directors fairly and thoroughly. The committee’s responsibilities include:
• reviewing the board structure, size and composition;
• reviewing the nature, size and composition of the board sub-committees;
• succession planning;
• reviewing the balance between non-executive and executive directors;
• ensuring that the directors have the required blend of experience, skills and knowledge to guarantee the continued success of the group;
• ensuring the existence of a formal process of performance evaluation; and
• compliance with the principles of good governance and the code of best practice.
During the year this committee analysed board and sub-committee composition in light of the requirements of King III and made certain recommendations for changes that are discussed earlier in this report. The committee considered the independence of all independent non-executive directors whose term exceeded nine years and satisfied themselves that all directors who are described as independent in the annual report, are indeed believed to be so. The performance and attendance of all directors retiring by rotation was considered by the committee prior to requesting that they stand for re-election at the upcoming annual
general meeting. The committee gave due consideration to the outcome of the performance evaluation process and determined certain actions arising therefrom. The committee is tasked with finding a suitable successor to the audit committee chairman within the next five years.
This committee met three times during the year. It comprises three non-executive directors. The chief executive officer attends meetings by invitation.
Transformation committeeMembers:Prof. F Abrahams (independent non-executive) – chairperson
D M Nurek (independent non-executive)
A D Murray (executive)
Directors present by invitation:R Stein (executive)
The scope of authority of this committee is clearly defined in a formal charter.
The committee has established a broad-based BEE strategy aligned to the Broad-based Black Economic Empowerment Act of 2003 and the associated codes of good practice, including a BBBEE-level contributor target with timelines. Clear guidelines have been defined for each of the seven elements of BBBEE, being equity ownership, management control, employment equity, skills development, preferential procurement, enterprise development and socio-economic development.
The committee has an ongoing responsibility to monitor and review all aspects of the group’s BBBEE strategies and to ensure the achievement of its targets. In order to attain these targets, sub-committees for each of the seven elements have been established, with meetings taking place at least quarterly.
The transformation committee comprises two independent non-executive directors and the CEO. The financial director attends meetings by invitation. The committee met three times during the last year.
The Transformation and CSI report that summarises certain key aspects of the functioning of this committee is included elsewhere in this annual report.
THE OPERATING BOARD OF DIRECTORS OF THE GROUPThe operating board is responsible for the group’s strategy formulation, as well as the day-to-day management of all aspects of the operations of the trading and service divisions.
Currently the operating board is responsible for all operational matters in relation to the group’s fashion retailing and financial services businesses and support functions, including but not limited to:
• merchandise sourcing, buying, planning, warehousing and distribution;
• store location, leasing, operations, design and architecture;
• human resource recruitment, training, development and remuneration;
• information systems acquisition, development and maintenance;
• credit management and customer relationship marketing and systems;
• financial management and administration;
• strategic plan formulation, development, execution and refinement;
• development, review and achievement of budgets in relation to sales, operating expenses and capital expenditure;
• identification, assessment, mitigation and management of risk;
• development and refinement of business philosophy and the value system;
• development, monitoring and audit of internal controls;
• development, review and implementation of the employment equity plan;
• development and monitoring of operational policies and procedures;
CORPORATE GOVERNANCE REPORT
FOSC
HIN
I GRO
UP A
NN
UA
L REPORT 2010 - PA
GE 130
CO
RPORATE G
OV
ERNA
NC
E REPORT C
ON
TINU
ED
• development, implementation and monitoring of transformation strategy;
• approving transactions regarding investment, disinvestment, refinancing and restructuring, in accordance with parameters set by the main board; and
• adopting and implementing corporate governance practices and meeting standards set out in King III.
This board typically meets monthly, and further meetings take place at short notice when necessary.
Operating board of directors of the groupA D Murray (Chief Executive Officer)
R Stein (Financial Director)
M Mendelsohn (Retail Director)
H B Godfrey (Managing Director – @ Home)
P S Meiring (Managing Director – FG Financial Services)
B J Curry (Managing Director – Foschinidata)
G S Naidoo (Managing Director – Group Human Resources)
A R Bisogno (Managing Director – Foschini division)
D B Gedye (Managing Director – Sports division)
Detailed information of the operating board and their credentials appear on pages 14 and 15.
LEGAL COMPLIANCEThe compliance function’s purpose is to provide assurance to the board that the group is compliant with applicable legislation.
The group’s compliance function is divided into three areas:
• general compliance, a focus on new or amended laws and the co-ordination of group compliance;
• FG Financial Services’ retail credit and technology products’ compliance; and
• compliance within the RCS Group.
The responsibilities of the three areas of the compliance function include:
• identifying and advising the group on existing and new legislation that is applicable to the group’s business;
• facilitating compliance with relevant legislation and assigning responsibility for areas of compliance;
• facilitating compliance with internal policies, rules, guidelines and procedures; and
• monitoring of compliance.
There have been many changes to laws and regulations in the previous years, with more laws to be finalised or effective shortly.
New pieces of legislation that will affect the group are:
• Consumer Protection Act (not yet effective; regulations needed);
• Companies Act (not yet effective and to be amended before operational; draft regulations need to be finalised); and
• Protection of Personal Information Bill (not yet finalised).
The group has working groups and project boards in place to ensure that there are impact assessments on new laws or amendments. Thereafter timelines, implementation areas and business owners to implement changes are agreed.
The Consumer Protection Act will impact, among other things, the merchandise sold in stores. Certain services are also affected, such as repairs. Working groups have identified certain products, such as cosmetics, homewear, sports equipment, cellphones, as examples where this Act has particular application.
This is in addition to, and often overlapping with existing laws, such as the Foodstuffs, Cosmetics and Disinfectants Act. In order to assess the full impact of the Consumer Protection Act, final regulations are needed. These regulations need to be finalised by
24 October 2010. In addition, industry codes will detail how industries ensure that consumer rights are upheld in businesses within an industry.
Based on core laws that are effective as at 31 March 2010, there are no material areas of non-compliance.
Changes arising from the National Credit Act and amendments to the Regulation of Interception of Communications Act have been implemented and business processes changed to ensure compliance.
There are ongoing changes to fiscal legislation. These are monitored and implemented by the group’s tax department.
During the year a gap analysis between the group’s current practice and that recommended by King III was undertaken. Many of the King III practices and recommendations were already in place. Those areas requiring corporate governance changes have been identified and are in the process of being implemented.
The group compliance officer gives report-backs at each audit committee meeting.
The internal audit department and the compliance function work closely together, with the former assisting at times with monitoring compliance. Where significant compliance issues are identified they are referred for independent review to outsourced experts.
REMUNERATIONThe group’s policy is to align the remuneration structure of the executive directors and staff with the interests of shareholders, and consequently a portion of their packages is performance-related. Share options and incentives are based on the performance of the individual as well as the performance of the group as a whole, aligned to specific business objectives and bottom-line absolute profits. The principle adhered to is that bonuses are self-funded out of profits in excess of targets.
Remuneration of non-executive directors is reviewed annually by the remuneration committee for proposal to the board.
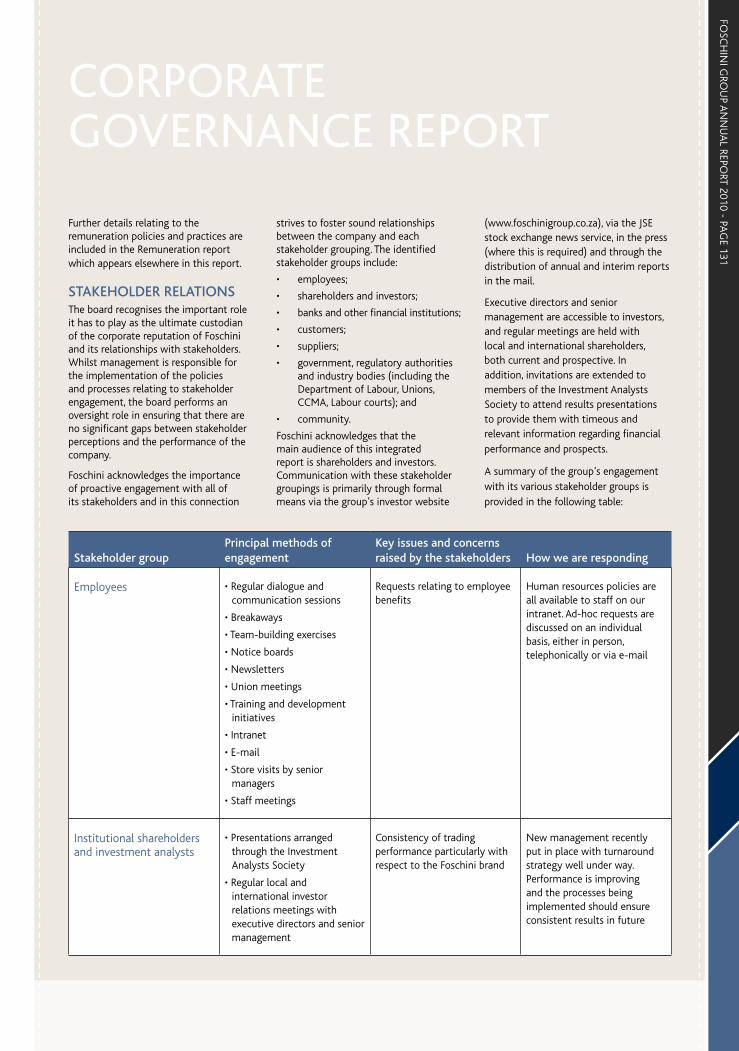
FOSC
HIN
I GRO
UP A
NN
UA
L REPORT 2010 - PA
GE 131
Further details relating to the remuneration policies and practices are included in the Remuneration report which appears elsewhere in this report.
STAKEHOLDER RELATIONSThe board recognises the important role it has to play as the ultimate custodian of the corporate reputation of Foschini and its relationships with stakeholders. Whilst management is responsible for the implementation of the policies and processes relating to stakeholder engagement, the board performs an oversight role in ensuring that there are no significant gaps between stakeholder perceptions and the performance of the company.
Foschini acknowledges the importance of proactive engagement with all of its stakeholders and in this connection
strives to foster sound relationships between the company and each stakeholder grouping. The identified stakeholder groups include:
• employees;
• shareholders and investors;
• banks and other financial institutions;
• customers;
• suppliers;
• government, regulatory authorities and industry bodies (including the Department of Labour, Unions, CCMA, Labour courts); and
• community.
Foschini acknowledges that the main audience of this integrated report is shareholders and investors. Communication with these stakeholder groupings is primarily through formal means via the group’s investor website
(www.foschinigroup.co.za), via the JSE stock exchange news service, in the press (where this is required) and through the distribution of annual and interim reports in the mail.
Executive directors and senior management are accessible to investors, and regular meetings are held with local and international shareholders, both current and prospective. In addition, invitations are extended to members of the Investment Analysts Society to attend results presentations to provide them with timeous and relevant information regarding financial performance and prospects.
A summary of the group’s engagement with its various stakeholder groups is provided in the following table:
Stakeholder groupPrincipal methods of engagement
Key issues and concerns raised by the stakeholders How we are responding
Employees • Regular dialogue and communication sessions
• Breakaways
• Team-building exercises
• Notice boards
• Newsletters
• Union meetings
• Training and development initiatives
• Intranet
• Store visits by senior managers
• Staff meetings
Requests relating to employee benefits
Human resources policies are all available to staff on our intranet. Ad-hoc requests are discussed on an individual basis, either in person, telephonically or via e-mail
Institutional shareholders and investment analysts
• Presentations arranged through the Investment Analysts Society
• Regular local and international investor relations meetings with executive directors and senior management
Consistency of trading performance particularly with respect to the Foschini brand
New management recently put in place with turnaround strategy well under way. Performance is improving and the processes being implemented should ensure consistent results in future
CORPORATE GOVERNANCE REPORT
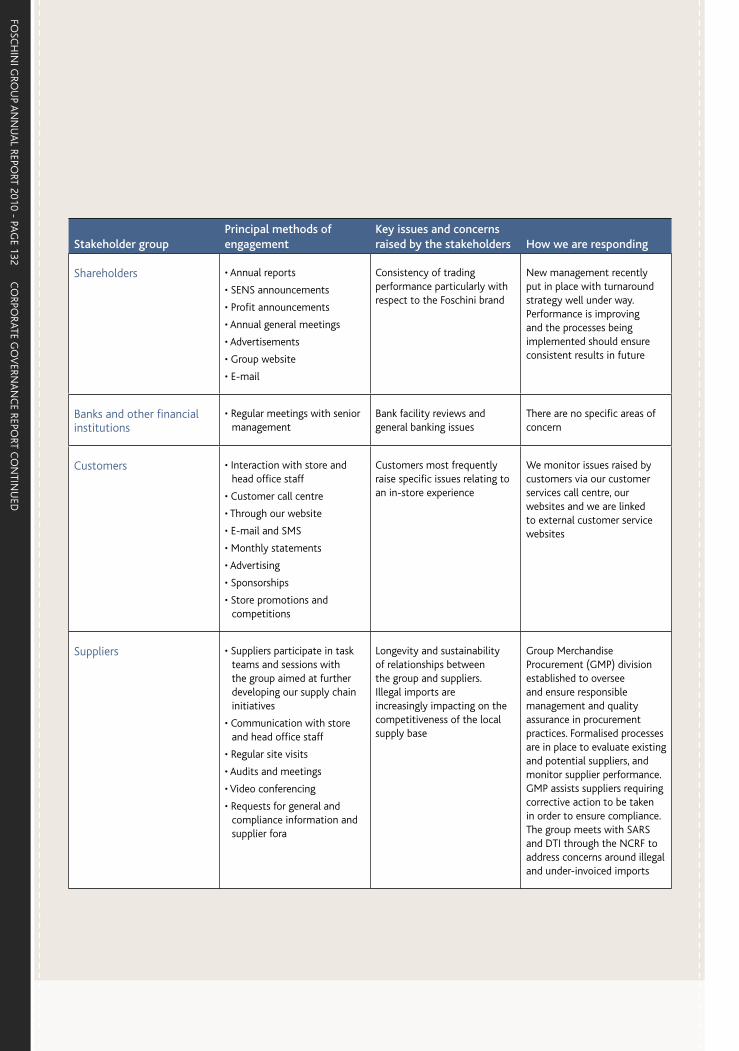
FOSC
HIN
I GRO
UP A
NN
UA
L REPORT 2010 - PA
GE 132
CO
RPORATE G
OV
ERNA
NC
E REPORT C
ON
TINU
ED
Stakeholder groupPrincipal methods of engagement
Key issues and concerns raised by the stakeholders How we are responding
Shareholders • Annual reports
• SENS announcements
• Profit announcements
• Annual general meetings
• Advertisements
• Group website
Consistency of trading performance particularly with respect to the Foschini brand
New management recently put in place with turnaround strategy well under way. Performance is improving and the processes being implemented should ensure consistent results in future
Banks and other financial institutions
• Regular meetings with senior management
Bank facility reviews and general banking issues
There are no specific areas of concern
Customers • Interaction with store and head office staff
• Customer call centre
• Through our website
• E-mail and SMS
• Monthly statements
• Advertising
• Sponsorships
• Store promotions and competitions
Customers most frequently raise specific issues relating to an in-store experience
We monitor issues raised by customers via our customer services call centre, our websites and we are linked to external customer service websites
Suppliers • Suppliers participate in task teams and sessions with the group aimed at further developing our supply chain initiatives
• Communication with store and head office staff
• Regular site visits
• Audits and meetings
• Video conferencing
• Requests for general and compliance information and supplier fora
Longevity and sustainability of relationships between the group and suppliers. Illegal imports are increasingly impacting on the competitiveness of the local supply base
Group Merchandise Procurement (GMP) division established to oversee and ensure responsible management and quality assurance in procurement practices. Formalised processes are in place to evaluate existing and potential suppliers, and monitor supplier performance. GMP assists suppliers requiring corrective action to be taken in order to ensure compliance. The group meets with SARS and DTI through the NCRF to address concerns around illegal and under-invoiced imports

FOSC
HIN
I GRO
UP A
NN
UA
L REPORT 2010 - PA
GE 133
Stakeholder groupPrincipal methods of engagement
Key issues and concerns raised by the stakeholders How we are responding
Government and regulatory authorities
• Ad-hoc formal meetings
• Written and oral submissions regarding relevant draft legislation
On occasion government and regulatory authorities approach the group with queries on compliance with the law, or requesting input on draft legislation. Recently the group has been extensively involved with the process of drafting the Consumer Protection Act; we are now focusing on the anticipated content of the regulations and have sent a written submission to the Department of Trade and Industry. In addition we are considering our involvement in the drafting and adopting of an industry code. Recently we have also submitted comments on legislation that falls within the Department of Justice’s responsibility, such as the Protection of Personal Information Bill. On the National Credit Act, we meet with the National Credit Regulator as and if required. We are currently engaging with a task team that has been set up by the National Credit Regulator to address the bottlenecks in the debt review process. Business Unity South Africa communicates to its members any government and regulatory authority concerns as regards businesses, and also provides opportunity for member organisations to meet with government and regulatory authority representatives, submit comments on draft laws and be represented at formal interactions between business and key government and regulatory representatives
The group submits comments on draft laws to the relevant government department or authority. Government representatives may ask for clarification on a submission or ask for suggested wording for draft laws. Where government and regulatory authorities approach the group with a concern or question they may have on the law, we will either meet with the government or regulatory representative in person or submit a written reply. Where it is recommended or advised that the group change a practice based on a government or regulatory authority’s interpretation of the law, this is discussed with the authority and we will take measures to ensure compliance
CORPORATE GOVERNANCE REPORT
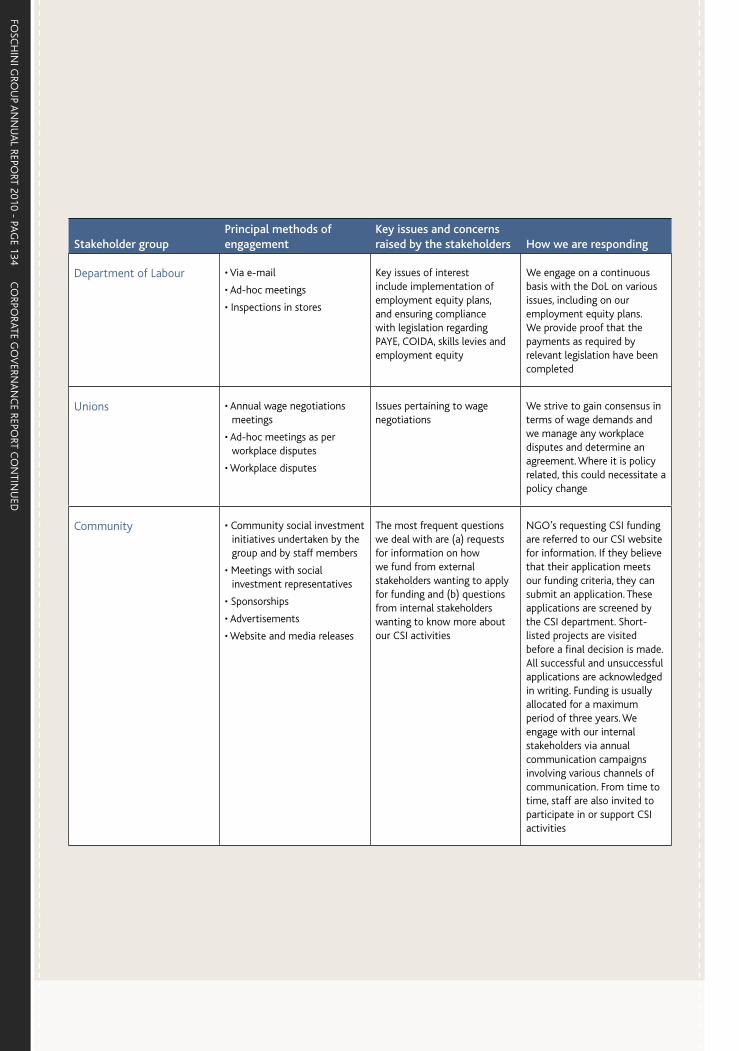
FOSC
HIN
I GRO
UP A
NN
UA
L REPORT 2010 - PA
GE 134
CO
RPORATE G
OV
ERNA
NC
E REPORT C
ON
TINU
ED
Stakeholder groupPrincipal methods of engagement
Key issues and concerns raised by the stakeholders How we are responding
Department of Labour • Via e-mail
• Ad-hoc meetings
• Inspections in stores
Key issues of interest include implementation of employment equity plans, and ensuring compliance with legislation regarding PAYE, COIDA, skills levies and employment equity
We engage on a continuous basis with the DoL on various issues, including on our employment equity plans. We provide proof that the payments as required by relevant legislation have been completed
Unions • Annual wage negotiations meetings
• Ad-hoc meetings as per workplace disputes
• Workplace disputes
Issues pertaining to wage negotiations
We strive to gain consensus in terms of wage demands and we manage any workplace disputes and determine an agreement. Where it is policy related, this could necessitate a policy change
Community • Community social investment initiatives undertaken by the group and by staff members
• Meetings with social investment representatives
• Sponsorships
• Advertisements
• Website and media releases
The most frequent questions we deal with are (a) requests for information on how we fund from external stakeholders wanting to apply for funding and (b) questions from internal stakeholders wanting to know more about our CSI activities
NGO’s requesting CSI funding are referred to our CSI website for information. If they believe that their application meets our funding criteria, they can submit an application. These applications are screened by the CSI department. Short-listed projects are visited before a final decision is made. All successful and unsuccessful applications are acknowledged in writing. Funding is usually allocated for a maximum period of three years. We engage with our internal stakeholders via annual communication campaigns involving various channels of communication. From time to time, staff are also invited to participate in or support CSI activities
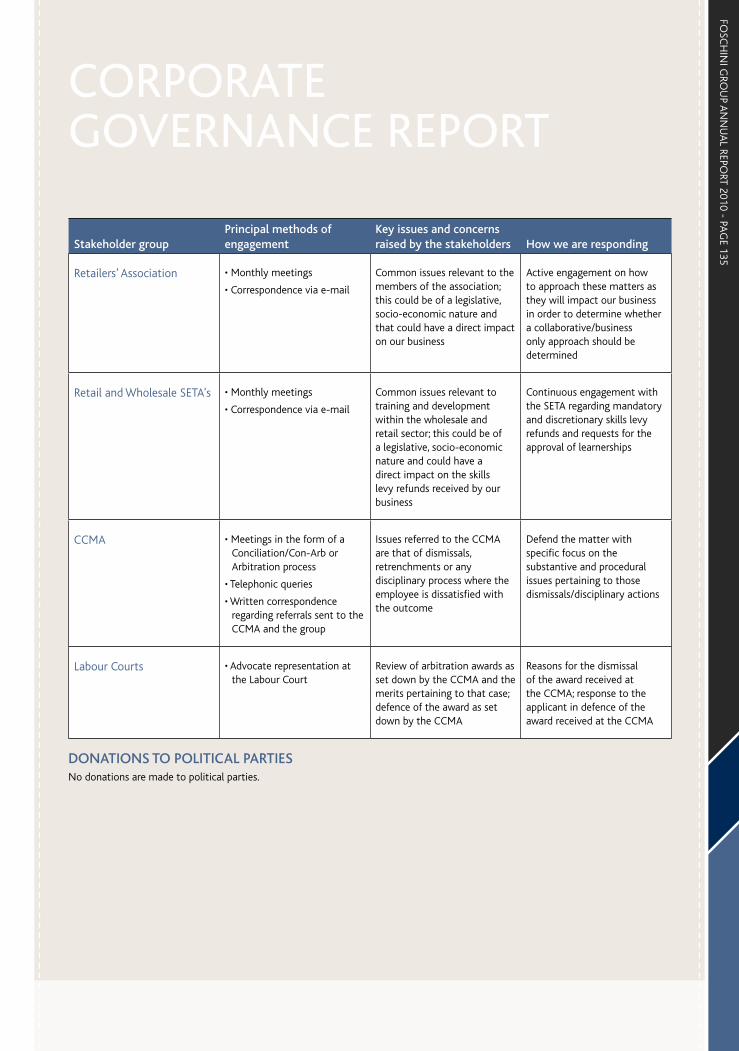
FOSC
HIN
I GRO
UP A
NN
UA
L REPORT 2010 - PA
GE 135
Stakeholder groupPrincipal methods of engagement
Key issues and concerns raised by the stakeholders How we are responding
Retailers’ Association • Monthly meetings
• Correspondence via e-mail
Common issues relevant to the members of the association; this could be of a legislative, socio-economic nature and that could have a direct impact on our business
Active engagement on how to approach these matters as they will impact our business in order to determine whether a collaborative/business only approach should be determined
Retail and Wholesale SETA’s • Monthly meetings
• Correspondence via e-mail
Common issues relevant to training and development within the wholesale and retail sector; this could be of a legislative, socio-economic nature and could have a direct impact on the skills levy refunds received by our business
Continuous engagement with the SETA regarding mandatory and discretionary skills levy refunds and requests for the approval of learnerships
CCMA • Meetings in the form of a Conciliation/Con-Arb or Arbitration process
• Telephonic queries
• Written correspondence regarding referrals sent to the CCMA and the group
Issues referred to the CCMA are that of dismissals, retrenchments or any disciplinary process where the employee is dissatisfied with the outcome
Defend the matter with specific focus on the substantive and procedural issues pertaining to those dismissals/disciplinary actions
Labour Courts • Advocate representation at the Labour Court
Review of arbitration awards as set down by the CCMA and the merits pertaining to that case; defence of the award as set down by the CCMA
Reasons for the dismissal of the award received at the CCMA; response to the applicant in defence of the award received at the CCMA
DONATIONS TO POLITICAL PARTIESNo donations are made to political parties.
CORPORATE GOVERNANCE REPORT

FOSC
HIN
I GRO
UP A
NN
UA
L REPORT 2010 - PA
GE 136
AU
DIT C
OM
MITTEE REPO
RT
This report by the audit committee to the shareholders of Foschini Limited (Foschini) is in compliance with the requirements of the Companies Act of South Africa and as far as possible with the King Code of Governance for South Africa 2009 (King III). Whilst compliance with King III is mandatory for the 2011 year-end, the committee has attempted to ensure compliance where possible in respect of the 2010 year-end.
The committee is governed by a formal audit committee charter that has recently been updated to ensure compliance with the requirements of King III. This charter guides the committee in terms of its objectives, authority and responsibilities.
The audit committee recognises its important role as part of the risk management and corporate governance processes and procedures of the Foschini group.
ROLE OF THE COMMITTEEThe role of the audit committee is, inter alia:
General
• to ensure that the respective roles and functions of external audit and internal audit are sufficiently clarified and co-ordinated, and that the combined assurance received is appropriate to address all significant risks;
• to assist the board in carrying out its risk and IT responsibilities; and
• to receive and deal appropriately with any complaints.
External auditors
• to evaluate the independence, effectiveness and performance of the external auditors and obtain assurance from the auditors that adequate accounting records are being maintained and appropriate accounting principles are in place which have been consistently applied;
• the appointment of the external auditors on an annual basis;
• approval of audit fee and fees in respect of any non-audit services;
• to consider and respond to any questions from the main board and shareholders regarding the resignation or dismissal of the external auditor; and
• to ensure that the scope of the external audit has no limitations imposed by management and that there is no impairment on its independence.
Internal control and internal audit
• to review the effectiveness of the group’s systems of internal control, including internal financial control and risk management, and to ensure that effective internal control systems are maintained;
• to ensure that written representations on internal control are submitted to the board annually by all divisional managing directors and general managers (these being representations that provide assurance on the adequacy and effectiveness of the group’s systems of internal control);
• to monitor and supervise the effective functioning and performance of the internal auditors; and
• to ensure that the scope of the internal audit function has no limitations imposed by management and that there is no impairment on its independence.
Finance function
• to consider the appropriateness of the expertise and experience of the financial director; and
• to satisfy itself of the expertise, resources and experience of the finance function.
Financial results
• to consider any accounting treatments, significant unusual transactions or accounting judgements that could be contentious;
• to review the integrated report, as well as annual financial statements, interim reports, preliminary reports or other financial information prior to submission and approval by the board; and
• to provide as part of the integrated report, a report by the audit committee.
COMMITTEE COMPOSITIONThe committee comprises four independent non-executive directors and the chairman of the committee is not the chairman of the board.
As at the date of this report, the following directors served on the committee:
• Mr S E Abrahams (chairman)
• Mr W V Cuba
• Ms N V Simamane (appointed 24 February 2010)
• Ms K N Dhlomo (appointed 24 February 2010)
Mr D M Polak stepped down from this committee during the year as he does not currently meet the independence requirements of King III.
Details of the qualifications of the directors appears in the directorate section of this annual report.
Details of fees paid to committee members appear in the Remuneration report.
The chief executive officer, the financial director, the head of Group Audit Services, the company secretary and the external audit partners and staff attend meetings at the regular invitation of the committee. In addition, other members of executive management are invited to attend various meetings on an ad-hoc invitational basis. The chairman of the group also attends meetings of the audit committee by invitation.
AUDIT COMMITEE REPORT
FOSC
HIN
I GRO
UP A
NN
UA
L REPORT 2010 - PA
GE 137
COMMITTEE FUNCTIONINGThe committee typically meets three times a year with the main focus of each respective meeting being as follows:
• approval of interim results;
• consideration of control risks and risk management; and
• approval of annual results.
Independently of management, members of the committee meet separately with the head of internal audit and the external auditors respectively.
Meeting dates and topics are agreed well in advance each year. Each meeting is preceded by the distribution to each attendee of an audit committee pack comprising:
• detailed agenda;
• minutes of previous meeting;
• report by the external auditors; and
• written reports by management including:
– compliance;
– Group Audit Services;
– loss statistics; and
– fraud.
The chairman of this committee has a “white card invitation” to attend meetings of the risk committee.
The committee held three meetings during the 2010 financial year. The committee considered the draft interim and annual financial reports prepared by management and recommended their adoption to the board subject to certain amendments. The chairman provided a written report to the main board summarising the committee’s findings and recommendations.
During the 2010 financial year an evaluation of the committee’s performance was undertaken. The feedback received resulted in the following actions being taken:
• review of audit committee composition; and
• evaluation of external audit performance is to be formalised.
KING III CONSIDERATIONSAs a result of the pending implementation of the King III recommendations, the following actions have been taken:
• The audit committee charter has been updated.
• The head of Foschinidata has been requested to continue reporting to the committee on IT governance
issues on an ongoing basis.
• Various changes have been requested in respect of the internal audit function, including:
– the internal audit plan being approved by this committee (previously approved by the risk committee); and
– the head of Group Audit Services providing a written assessment regarding internal controls on an annual basis
• Various performance assessments will be considered by this committee, including:

FOSC
HIN
I GRO
UP A
NN
UA
L REPORT 2010 - PA
GE 138
AU
DIT C
OM
MITTEE REPO
RT CO
NTIN
UED
– evaluating the performance of Group Audit Services; and
– evaluating the expertise and experience of the finance function
• The audit committee has accepted the responsibility of recommending the integrated report to the board (including reviewing the sustainability information).
SPECIFIC RESPONSIBILITIES
Internal control
Whilst the board is ultimately responsible for the system of internal control, this committee, together with the risk committee, the internal auditors and external auditors, assist the board in monitoring the effectiveness and adequacy of the control environment.
During the 2010 financial year, the committee was not made aware of any:
• material breaches of any laws or legislation; and
• material breach of internal controls or procedures.
Risk management
Whilst the board is ultimately responsible for the maintenance of an effective risk management process, the committee, together with the risk committee, assist the board in assessing the adequacy of the risk management process.
During the course of the 2010 financial year, the committee considered the risk management approach, as well as key control risks and believes that the approach is relevant and that all key control risks are being adequately addressed by management.
Further details on the risk management approach and process are included in the Risk report.
External auditors
The group’s external auditors are KPMG Inc and the designated partner is Mr H du Plessis.
KPMG is afforded unrestricted access to the group’s records and management and present any significant issues arising from the annual audit to the committee. In addition, Mr Du Plessis raises matters of concern directly with the chairman of the committee.
In respect of the committee’s responsibilities relating to the external auditors, the committee confirms that it has carried out its functions in terms of the Corporate Laws Amendment Act 24 of 2006 by:
• confirming the nomination of KPMG Inc as the group’s registered auditor and being satisfied that it is independent of the company;
• approving the terms of engagement and fees to be paid to KPMG Inc; and
• determining the nature and extent of any non-audit services which the external auditors provide to the company.
The committee gave due consideration to the independence of the external auditors and is satisfied that KPMG Inc is independent of the group and management and therefore able to express an independent opinion on the group’s annual financial statements.
Financial director
In accordance with the JSE Listings Requirements, the committee considers the appropriateness of the expertise and experience of the financial director of the company on an annual basis.
In respect of the above requirement, the committee believes that Mr Ronnie Stein, the group financial director, possesses the appropriate expertise and experience to meet his responsibilities in that position.
Finance function
The committee considered the expertise, resources and experience of the finance function and concluded that these were appropriate based on the nature, complexity and size of the group’s operations.
Approval
The committee recommended the approval of the annual financial statements to the board and confirmed that the sustainability information contained throughout the remainder of the annual report was in no way contradictory to that disclosed in the annual financial statements.
S E AbrahamsChairman: Audit committee
21 June 2010

FOSC
HIN
I GRO
UP A
NN
UA
L REPORT 2010 - PA
GE 139
The board recognises the critical role of risk management in the organisation and accepts responsibility for ensuring that risk is appropriately governed through the implementation of a formal system and process.
The board is assisted in this regard by the risk committee of the board which meets on a quarterly basis. The risk committee comprises both executive and non-executive directors. The committee gives due consideration to the effectiveness of the risk management activities, the key risks facing the group and the responses identified to address the key risks.
Management is accountable for designing, implementing and monitoring the system and process of risk
management and integrating it into the day-to-day activities of the group.
The audit committee plays an important supplementary role in the risk management process.
As mentioned in the Corporate Governance report, the group has adopted an ongoing, systematic and documented risk management process that ensures that all material risks are identified, evaluated, effectively managed, and where this is practical, quantified. This process is undertaken within each division as well as by the operating board. It has served to ingrain a sustainable risk awareness and culture at all levels. The assessments are aligned to the immediate, medium, and long-term
strategic and business objectives within
each division, as well as those of the
group as a whole.
All significant projects undertaken
by the group are subject to formal
risk assessments. Ongoing business
sustainability is addressed as part of this
process.
RISK MANAGEMENT
Risk review
The primary identified risks to the group
are listed below, with their management
strategies to contend with them being
stated. These risks are largely unchanged
from the previous year.
Risk How we manage this risk
Customer base retentionRetaining our existing customers and attracting new customers
• the establishment of a customer relationship management department with the specific objective of maximising customer value and duration of relationship by creating an unbeatable customer experience over all legs of the relationship life cycle
Supply chainThe inability to provide our customers with the desired merchandise at the right price and time as a result of deficiencies in the management process of the supply chain
• considering all possible occurring events and factors that can cause a disruption in our supply chain
• examining possible scenarios from past experience and analysing changing market forces
• creating solutions culminating in improved stock-turn and customer satisfaction;
• implementing changes in the supply chain methodically within appropriate and achievable time frames
• continuing significant support for our local apparel supplier base in order to ensure sustained merchandise manufacture and supply
Further detail is provided in the Group Logistics section of this report
Fashion trendsThe misreading of fashion trends by the merchandise teams
• development and retention of talented merchandise teams that keep abreast of global fashion trends
• extensive input from international fashion fairs, consultants, the internet as well as local fashion research
• based in the southern hemisphere, benefiting from the knowledge of the forthcoming season’s successful trends in the northern hemisphere
• utilising advanced systems to ensure that purchasing volumes are correct
RISK REPORT

FOSC
HIN
I GRO
UP A
NN
UA
L REPORT 2010 - PA
GE 140
RISK REPORT C
ON
TINU
ED
Risk How we manage this risk
Bad debtsWithin the context of the current financial environment and the threat of escalating unemployment, there is a risk of increasing bad debt
Account origination
• credit applications are reviewed for fraud indicators, and assessed against NCA compliant internal scorecards, credit bureau scores and verification of employment where necessary
Account management
• analytic decision systems determine appropriate collection strategies, approved credit line adjustments and authorisations by utilising internal behavioural and credit bureau scores
Systems and strategies are subject to ongoing management review within both of the above risk areas
Information technology (IT)Ever-increasing reliance upon computer systems necessitates a stable, secure and uninterrupted computer infrastructure
• constant senior management review and updating of the IT strategic plan
• maintaining a comprehensive, regularly tested disaster recovery plan that should provide seamless computing capacity in the event of a disaster, involving the establishment of secure computer suites in separate locations with adequate capacity to provide backup access to critical systems
• strict change control procedures for all system enhancements
• conducting risk assessments for all significant projects
• ensuring that access controls are implemented and enforced
• ongoing consolidation and standardisation of applications and infrastructure technology
• an ongoing upgrade and technology “refresh” programme to ensure that our applications and infrastructure are current and supported
• instilling employee awareness of the need for responsible use of computer facilities (all employees being required to abide by a formal computer code of conduct)
• ongoing emphasis at all levels on enhancing IT security from all potential threats, both internal and external
• adopting strong IT governance policies and best practice IT service delivery models
CrimeCrime, particularly armed and violent crime, which continues unabated, creating losses and, in particular, trauma to our staff
• continually reviewing security at stores
• providing staff training on how to deal with armed robberies
• maintaining a strong focus on syndicated identity fraud via a dedicated forensics department
• maintaining regular communication with anti-crime fora to ensure that we minimise the impact of crime in all of its forms
• utilising an anonymous toll-free whistle-blowing facility for the reporting of criminal acts (details of which are contained later in this report)
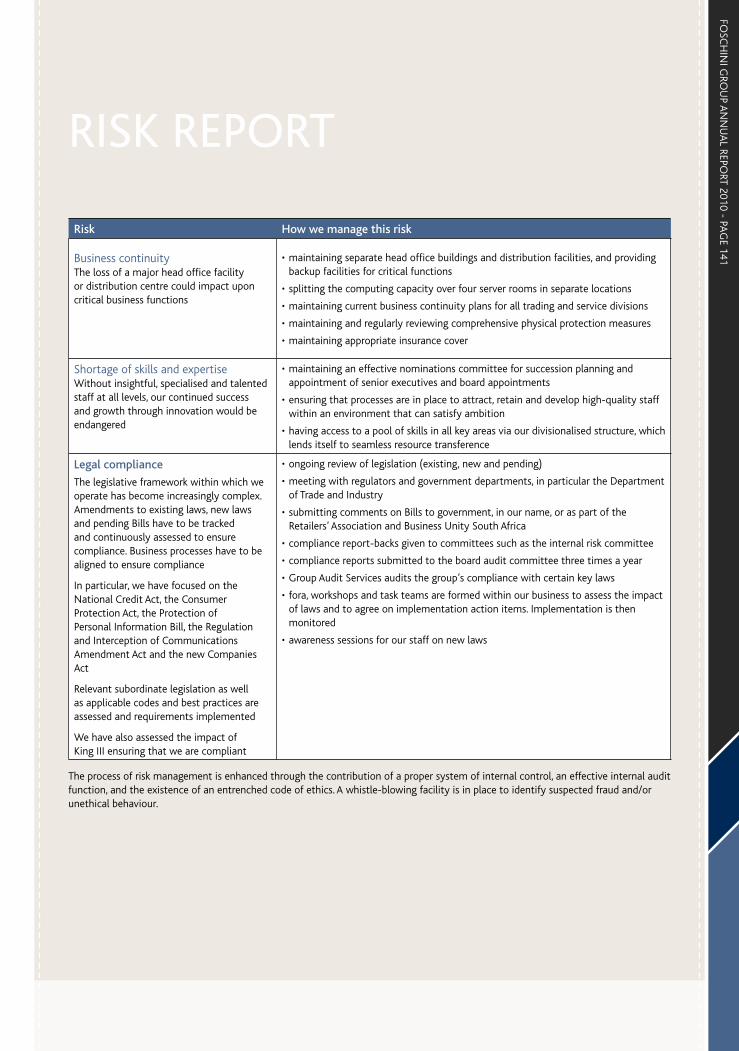
FOSC
HIN
I GRO
UP A
NN
UA
L REPORT 2010 - PA
GE 141
Risk How we manage this risk
Business continuityThe loss of a major head office facility or distribution centre could impact upon critical business functions
• maintaining separate head office buildings and distribution facilities, and providing backup facilities for critical functions
• splitting the computing capacity over four server rooms in separate locations
• maintaining current business continuity plans for all trading and service divisions
• maintaining and regularly reviewing comprehensive physical protection measures
• maintaining appropriate insurance cover
Shortage of skills and expertiseWithout insightful, specialised and talented staff at all levels, our continued success and growth through innovation would be endangered
• maintaining an effective nominations committee for succession planning and appointment of senior executives and board appointments
• ensuring that processes are in place to attract, retain and develop high-quality staff within an environment that can satisfy ambition
• having access to a pool of skills in all key areas via our divisionalised structure, which lends itself to seamless resource transference
Legal compliance
The legislative framework within which we operate has become increasingly complex. Amendments to existing laws, new laws and pending Bills have to be tracked and continuously assessed to ensure compliance. Business processes have to be aligned to ensure compliance
In particular, we have focused on the National Credit Act, the Consumer Protection Act, the Protection of Personal Information Bill, the Regulation and Interception of Communications Amendment Act and the new Companies Act
Relevant subordinate legislation as well as applicable codes and best practices are assessed and requirements implemented
We have also assessed the impact of King III ensuring that we are compliant
• ongoing review of legislation (existing, new and pending)
• meeting with regulators and government departments, in particular the Department of Trade and Industry
• submitting comments on Bills to government, in our name, or as part of the Retailers’ Association and Business Unity South Africa
• compliance report-backs given to committees such as the internal risk committee
• compliance reports submitted to the board audit committee three times a year
• Group Audit Services audits the group’s compliance with certain key laws
• fora, workshops and task teams are formed within our business to assess the impact of laws and to agree on implementation action items. Implementation is then monitored
• awareness sessions for our staff on new laws
The process of risk management is enhanced through the contribution of a proper system of internal control, an effective internal audit function, and the existence of an entrenched code of ethics. A whistle-blowing facility is in place to identify suspected fraud and/or unethical behaviour.
RISK REPORT
FOSC
HIN
I GRO
UP A
NN
UA
L REPORT 2010 - PA
GE 142
RISK REPORT C
ON
TINU
ED
Internal control
The board of directors is responsible for the group’s systems of internal control. Effective internal control systems have been implemented and are continuously evaluated:
• to provide reasonable assurance as to the integrity and reliability of the financial statements;
• to safeguard, verify and maintain accountability of its assets;
• to detect and minimise fraud, potential liability, loss and material misstatement; and
• to review compliance with applicable legislation and regulations.
The internal control systems are governed by a comprehensive internal control standards manual that is available to all staff via our intranet. Compliance with these standards rests within each division and is monitored by internal and external audit checks.
The board is not aware of any material breakdown during the past year in the functioning of these controls.
Internal audit
The internal audit department carries out an independent appraisal and assurance function. Although it is responsible to the group’s financial director for administrative matters, it reports to the audit committee of the board. This structure does not impair the function’s independence or objectivity. An internal audit charter, approved by the audit committee and conforming to the International Standards for the Professional Practice of Internal Auditing, determines the mission and scope of the function.
Further information on the internal audit function is contained in the divisional reports section of this annual report.
Code of ethics
The board has adopted a code aimed at creating a culture of the highest standards of ethics and uncompromising honesty among all employees throughout the group. The code is founded on the principles of integrity, good faith, impartiality, openness and accountability. The code of ethics forms an integral part of the induction programme and all new employees agree to subscribe to the code. It is available to all staff members on our intranet.
It is comprehensive in nature, clearly outlining the full obligations of every member of staff in their dealings with
fellow employees, customers, suppliers, competitors, shareholders and society at large. It requires, inter alia:
• conformance with all laws and regulations;
• disclosure of any gifts offered or received and which must be within prescribed financial parameters;
• disclosure of any direct or indirect conflict of interest;
• that no bribes be accepted or proffered;
• reporting of any unethical or harmful behaviour; and
• compliance with all of the group’s standards and procedures, including the computer usage policy.
Sound processes are in place to manage any deviations from this code.
Whistle-blowing
A whistle-blowing facility has been in place since February 1998 for the reporting of suspected fraud and unethical behaviour. Use is made of an outsourced, anonymous, toll-free hotline. All reports are submitted to the centralised risk management department, which ensures that all incidents are logged and resolved. A minimum reward of R5 000 (increased to R10 000 with effect from 1 May 2010) is paid when follow-up confirms evidence of fraud or unethical behaviour. There is a strong focus on staff awareness of this facility through regular distribution of informational cards, e-mails and posters.
An additional reward of R10 000 is paid twice annually to a randomly selected staff member who has already been awarded the initial reward.
During the year 109 reports were received, resulting in 16 dismissals and 23 resignations before enquiry.

FOSC
HIN
I GRO
UP A
NN
UA
L REPORT 2010 - PA
GE 143
ROLE OF THE REMUNERATION COMMITTEEThe remuneration committee is a committee of the board of directors and is responsible for:
• making recommendations to the board of directors on executive remuneration practice and policy, across all remuneration components; and
• determining remuneration for executive and senior management, including base pay, benefits, short-term incentives and long-term/share-based incentives.
Remuneration committee membership
The remuneration committee consists of two members:
• Prof. F Abrahams (chairperson)
• D M Nurek
An independent advisor attends meetings by invitation, as does the CEO although he is not present when his remuneration is discussed.
The committee met three times during the 2010 financial year.
In line with King III corporate governance principles, in March 2010 Mr D M Nurek stepped down as chair of the remuneration committee, and this role is now fulfilled by Prof. F Abrahams.
Remuneration committee advice and education
An additional independent remuneration consultant with extensive experience in executive remuneration has been retained to advise the new chair and members of the remuneration committee, as well as provide formal training where required.
REMUNERATION POLICY
Principles
The group’s remuneration approach seeks to attract, motivate and retain the executive talent that is essential for the
implementation of our business strategy, towards sustained and long-term returns for shareholders.
Remuneration of executives seeks to achieve the following principal objectives:
• external equity, ensuring executives are rewarded in line with the market, taking all relevant and appropriate factors into account;
• internal equity, ensuring that executives are remunerated correctly relative to each other, in recognition of their individual contribution and accountability;
• remuneration that rewards performance against defined and challenging objectives, appropriate to the stage of the business cycle, whilst recognising the need for retention; and
• an appropriate mix of remuneration components, each one sized so as to align remuneration with the appropriate short-term and long-term objectives.
Components of remuneration
Components of remuneration and the applicable policy are detailed below. In determining the mix and structure of these components, a balance is sought between the retention of key executive talent through competitive guaranteed pay, with the need to drive short- and long-term performance through variable pay and share-based incentives.
Each component, as well as the mix between components, is benchmarked against the market.
Base payBase pay is reviewed annually, with reference to the market, and is targeted around the median of aggregate market information.
Aggregate market information from at least two appropriate and credible executive remuneration survey providers is obtained for each executive director role. Each role, in terms of our base pay
policy, must be deemed to be a 70% match with the survey role in order for survey information to be utilised. Market information sourced is not limited to retail companies, to ensure that the true market for executive talent in an environment of our size and complexity is considered when setting pay.
Each role is benchmarked against the market taking accepted operating and demographic measures into account such as market capitalisation, turnover, employees, payroll size and profit measures.
Individual, divisional and group contribution are taken into account, as well as any changes in accountability and structure in the past year.
BenefitsThe remuneration committee reviews executive benefits annually against market benchmarks. Medical aid and pension benefits are provided in proportion to the base salary of each executive, as is the case for all group employees, defined in medical aid and retirement fund rules. Vehicle benefits are provided linked to organisational level, as defined by our car allowance and fleet policies. Dread disease cover is also in place.
Short-term incentivesAn annual bonus is payable to all executives, subject to the performance of their division and/or the group against a stretch target set above budgeted performance. These targets are defined at the start of the financial year and the remuneration committee recommends payments once they have verified achievement of the relevant targets.
The annual bonus is determined as a factor of each individual’s base pay and the extent to which stretch targets have been attained, i.e. at divisional or group level. The bonus multiple applicable for group achievement of stretch targets is in excess of any bonus payable for achievement at divisional level, in line with the board’s focus on collaboration between divisions.
REMUNERATION REPORT
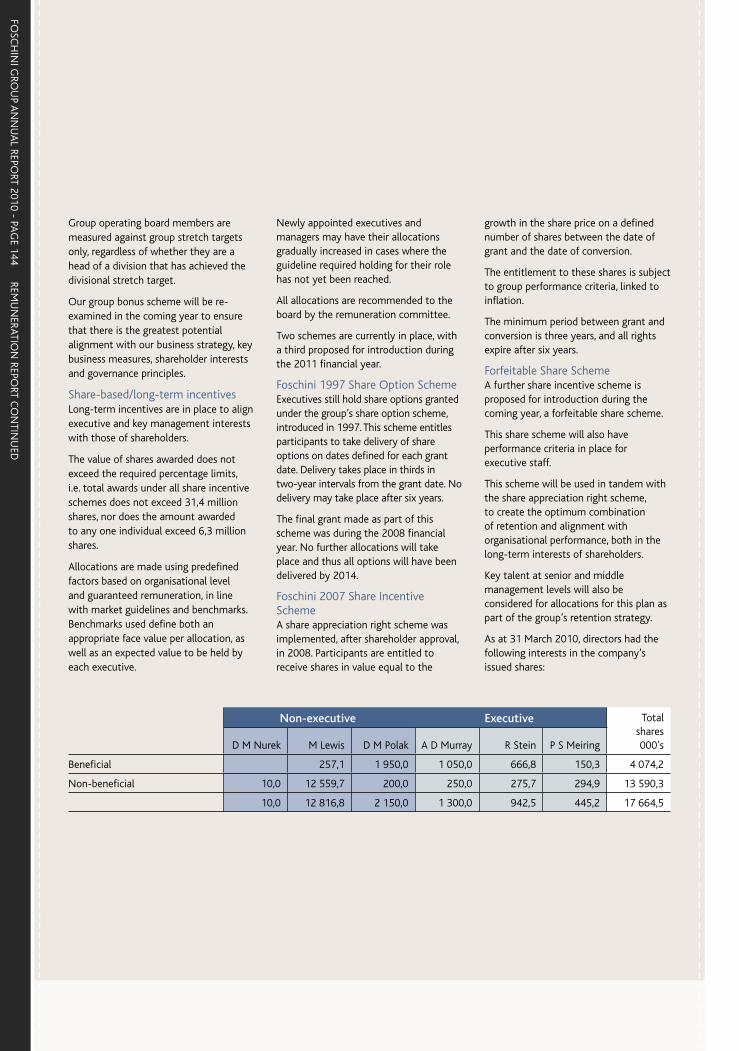
FOSC
HIN
I GRO
UP A
NN
UA
L REPORT 2010 - PA
GE 144
REMU
NERATIO
N REPO
RT CO
NTIN
UED
Group operating board members are measured against group stretch targets only, regardless of whether they are a head of a division that has achieved the divisional stretch target.
Our group bonus scheme will be re-examined in the coming year to ensure that there is the greatest potential alignment with our business strategy, key business measures, shareholder interests and governance principles.
Share-based/long-term incentivesLong-term incentives are in place to align executive and key management interests with those of shareholders.
The value of shares awarded does not exceed the required percentage limits, i.e. total awards under all share incentive schemes does not exceed 31,4 million shares, nor does the amount awarded to any one individual exceed 6,3 million shares.
Allocations are made using predefined factors based on organisational level and guaranteed remuneration, in line with market guidelines and benchmarks. Benchmarks used define both an appropriate face value per allocation, as well as an expected value to be held by each executive.
Newly appointed executives and managers may have their allocations gradually increased in cases where the guideline required holding for their role has not yet been reached.
All allocations are recommended to the board by the remuneration committee.
Two schemes are currently in place, with a third proposed for introduction during the 2011 financial year.
Foschini 1997 Share Option SchemeExecutives still hold share options granted under the group’s share option scheme, introduced in 1997. This scheme entitles participants to take delivery of share options on dates defined for each grant date. Delivery takes place in thirds in two-year intervals from the grant date. No delivery may take place after six years.
The final grant made as part of this scheme was during the 2008 financial year. No further allocations will take place and thus all options will have been delivered by 2014.
Foschini 2007 Share Incentive SchemeA share appreciation right scheme was implemented, after shareholder approval, in 2008. Participants are entitled to receive shares in value equal to the
growth in the share price on a defined number of shares between the date of grant and the date of conversion.
The entitlement to these shares is subject to group performance criteria, linked to inflation.
The minimum period between grant and conversion is three years, and all rights expire after six years.
Forfeitable Share SchemeA further share incentive scheme is proposed for introduction during the coming year, a forfeitable share scheme.
This share scheme will also have performance criteria in place for executive staff.
This scheme will be used in tandem with the share appreciation right scheme, to create the optimum combination of retention and alignment with organisational performance, both in the long-term interests of shareholders.
Key talent at senior and middle management levels will also be considered for allocations for this plan as part of the group’s retention strategy.
As at 31 March 2010, directors had the following interests in the company’s issued shares:
Non-executive Executive Total shares 000’sD M Nurek M Lewis D M Polak A D Murray R Stein P S Meiring
Beneficial 257,1 1 950,0 1 050,0 666,8 150,3 4 074,2
Non-beneficial 10,0 12 559,7 200,0 250,0 275,7 294,9 13 590,3
10,0 12 816,8 2 150,0 1 300,0 942,5 445,2 17 664,5

FOSC
HIN
I GRO
UP A
NN
UA
L REPORT 2010 - PA
GE 145
As at 31 March 2010, executive directors had exercised the following options:
Executive Total executive
options 000’sYear of delivery
Price per option
(R) A D Murray R Stein P S Meiring
2011 60,95 133,3 76,7 60,0 270,0
2011 36,00 116,7 90,0 66,7 273,4
2012 60,55 83,3 83,3
2013 60,95 133,3 76,7 60,0 270,0
2014 60,55 83,3 83,3
549,9 243,4 186,7 980,0
As at 31 March 2010, Mr D M Polak (previously an executive of the company) had exercised the following options, which were granted whilst he was still an executive:
Non-executive
Year of delivery
Price per option
RD M Polak
000’s
2011 60,95 150,0
2011 36,00 200,0
2013 60,95 150,0
500,0
As at 31 March 2010, directors had accepted the following share appreciation rights (SARs):
Executive Total SARs 000’sYear of earliest delivery
Price per SAR (R) A D Murray R Stein P S Meiring
2011 41,87 555,0 225,0 180,0 960,0
2012 40,00 250,0 130,0 130,0 510,0
2012 42,28 275,0 130,0 130,0 535,0
1 080,0 485,0 440,0 2 005,0
Executive service contractsCertain key executives have formal service contracts to ensure stability and continuity. These contracts include restraint of trade stipulations. No agreements provide for ex gratia or other lump sum payments on severance or retirement.
Executive director remuneration
RemunerationPension
fundTravel
allowance Bonus#
Other benefits*
Total R’000
A D Murray 3 543,0 425,2 297,6 1 500,0 119,8 5 885,6
R Stein 2 075,0 249,0 228,1 600,0 74,7 3 226,8
P S Meiring 1 801,0 216,1 228,1 800,0 76,2 3 121,4
7 419,0 890,3 753,8 2 900,0 270,7 12 233,8# Relates to performance in the prior year
* Other benefits include medical aid and group life cover
REMUNERATION REPORT
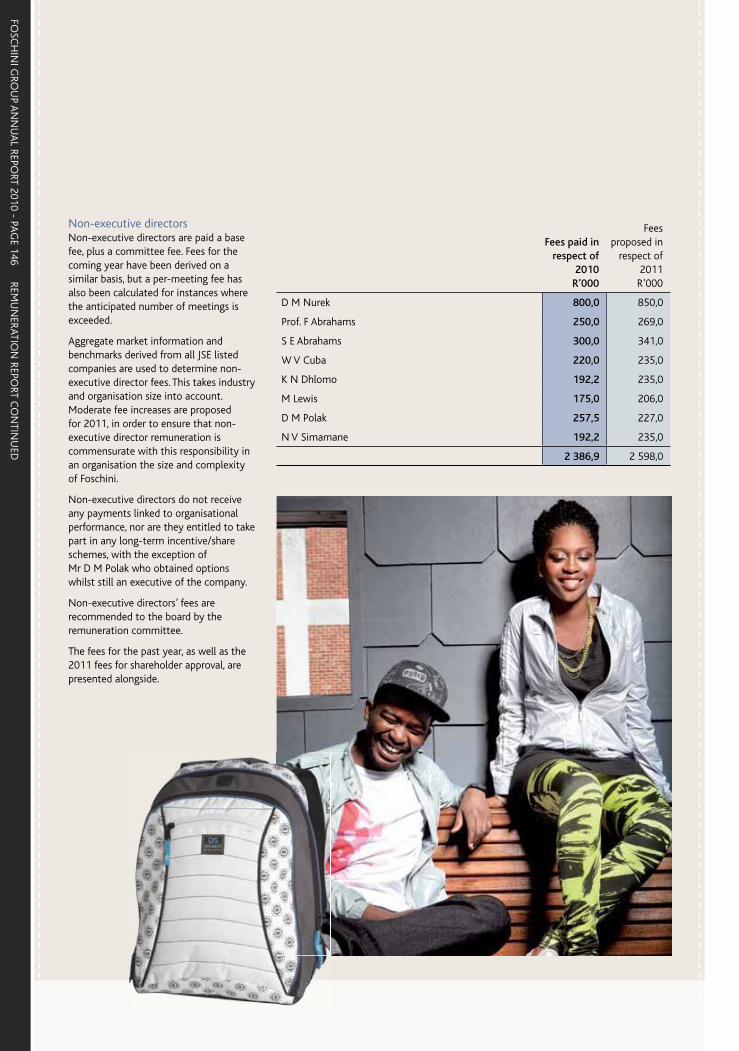
FOSC
HIN
I GRO
UP A
NN
UA
L REPORT 2010 - PA
GE 146
REMU
NERATIO
N REPO
RT CO
NTIN
UED
Non-executive directorsNon-executive directors are paid a base fee, plus a committee fee. Fees for the coming year have been derived on a similar basis, but a per-meeting fee has also been calculated for instances where the anticipated number of meetings is exceeded.
Aggregate market information and benchmarks derived from all JSE listed companies are used to determine non-executive director fees. This takes industry and organisation size into account. Moderate fee increases are proposed for 2011, in order to ensure that non-executive director remuneration is commensurate with this responsibility in an organisation the size and complexity of Foschini.
Non-executive directors do not receive any payments linked to organisational performance, nor are they entitled to take part in any long-term incentive/share schemes, with the exception of Mr D M Polak who obtained options whilst still an executive of the company.
Non-executive directors’ fees are recommended to the board by the remuneration committee.
The fees for the past year, as well as the 2011 fees for shareholder approval, are presented alongside.
Fees paid in respect of
2010 R’000
Fees proposed in
respect of 2011
R’000
D M Nurek 800,0 850,0
Prof. F Abrahams 250,0 269,0
S E Abrahams 300,0 341,0
W V Cuba 220,0 235,0
K N Dhlomo 192,2 235,0
M Lewis 175,0 206,0
D M Polak 257,5 227,0
N V Simamane 192,2 235,0
2 386,9 2 598,0
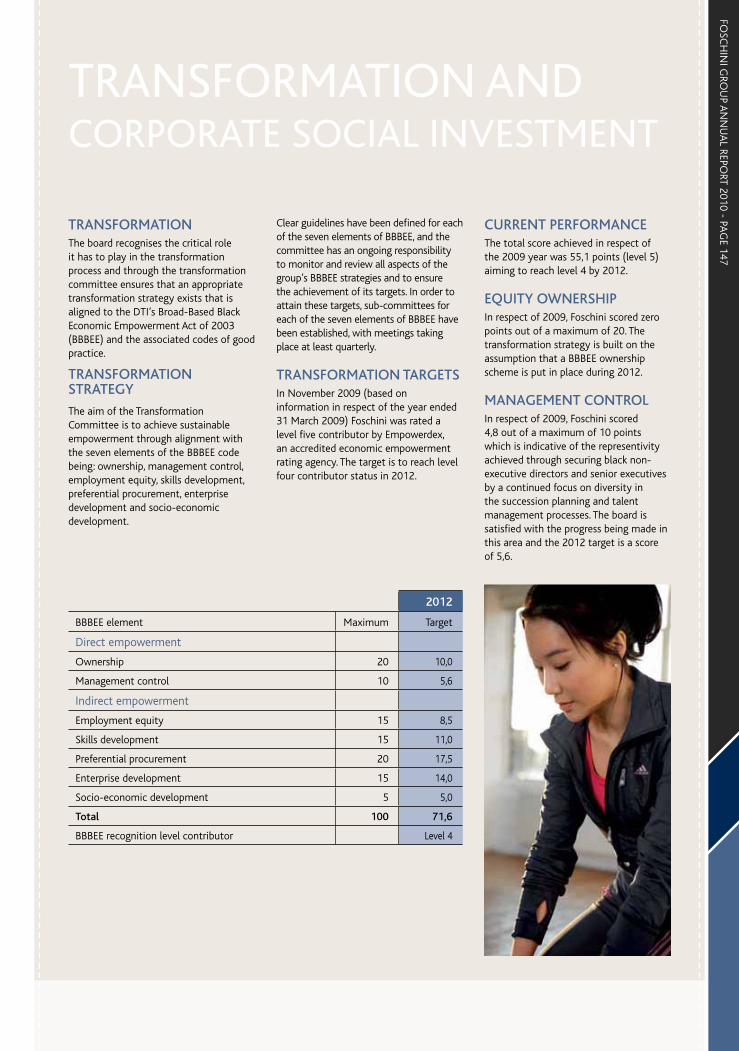
FOSC
HIN
I GRO
UP A
NN
UA
L REPORT 2010 - PA
GE 147
TRANSFORMATIONThe board recognises the critical role it has to play in the transformation process and through the transformation committee ensures that an appropriate transformation strategy exists that is aligned to the DTI’s Broad-Based Black Economic Empowerment Act of 2003 (BBBEE) and the associated codes of good practice.
TRANSFORMATION STRATEGY
The aim of the Transformation Committee is to achieve sustainable empowerment through alignment with the seven elements of the BBBEE code being: ownership, management control, employment equity, skills development, preferential procurement, enterprise development and socio-economic development.
Clear guidelines have been defined for each of the seven elements of BBBEE, and the committee has an ongoing responsibility to monitor and review all aspects of the group’s BBBEE strategies and to ensure the achievement of its targets. In order to attain these targets, sub-committees for each of the seven elements of BBBEE have been established, with meetings taking place at least quarterly.
TRANSFORMATION TARGETSIn November 2009 (based on information in respect of the year ended 31 March 2009) Foschini was rated a level five contributor by Empowerdex, an accredited economic empowerment rating agency. The target is to reach level four contributor status in 2012.
2012
BBBEE element Maximum Target
Direct empowerment
Ownership 20 10,0
Management control 10 5,6
Indirect empowerment
Employment equity 15 8,5
Skills development 15 11,0
Preferential procurement 20 17,5
Enterprise development 15 14,0
Socio-economic development 5 5,0
Total 100 71,6
BBBEE recognition level contributor Level 4
CURRENT PERFORMANCEThe total score achieved in respect of the 2009 year was 55,1 points (level 5) aiming to reach level 4 by 2012.
EQUITY OWNERSHIPIn respect of 2009, Foschini scored zero points out of a maximum of 20. The transformation strategy is built on the assumption that a BBBEE ownership scheme is put in place during 2012.
MANAGEMENT CONTROLIn respect of 2009, Foschini scored 4,8 out of a maximum of 10 points which is indicative of the representivity achieved through securing black non-executive directors and senior executives by a continued focus on diversity in the succession planning and talent management processes. The board is satisfied with the progress being made in this area and the 2012 target is a score of 5,6.
TRANSFORMATION AND CORPORATE SOCIAL INVESTMENT
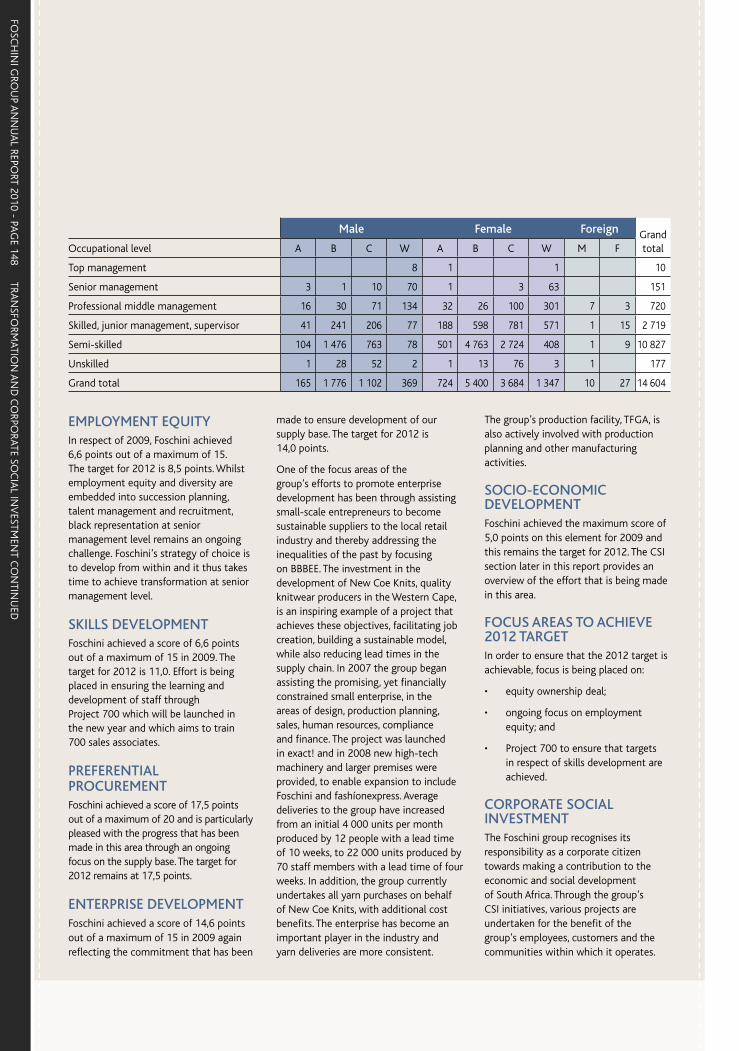
FOSC
HIN
I GRO
UP A
NN
UA
L REPORT 2010 - PA
GE 148
TRAN
SFORM
ATION
AN
D C
ORPO
RATE SOC
IAL IN
VESTM
ENT C
ON
TINU
ED
EMPLOYMENT EQUITYIn respect of 2009, Foschini achieved 6,6 points out of a maximum of 15. The target for 2012 is 8,5 points. Whilst employment equity and diversity are embedded into succession planning, talent management and recruitment, black representation at senior management level remains an ongoing challenge. Foschini’s strategy of choice is to develop from within and it thus takes time to achieve transformation at senior management level.
SKILLS DEVELOPMENTFoschini achieved a score of 6,6 points out of a maximum of 15 in 2009. The target for 2012 is 11,0. Effort is being placed in ensuring the learning and development of staff through Project 700 which will be launched in the new year and which aims to train 700 sales associates.
PREFERENTIAL PROCUREMENTFoschini achieved a score of 17,5 points out of a maximum of 20 and is particularly pleased with the progress that has been made in this area through an ongoing focus on the supply base. The target for 2012 remains at 17,5 points.
ENTERPRISE DEVELOPMENTFoschini achieved a score of 14,6 points out of a maximum of 15 in 2009 again reflecting the commitment that has been
made to ensure development of our supply base. The target for 2012 is 14,0 points.
One of the focus areas of the group’s efforts to promote enterprise development has been through assisting small-scale entrepreneurs to become sustainable suppliers to the local retail industry and thereby addressing the inequalities of the past by focusing on BBBEE. The investment in the development of New Coe Knits, quality knitwear producers in the Western Cape, is an inspiring example of a project that achieves these objectives, facilitating job creation, building a sustainable model, while also reducing lead times in the supply chain. In 2007 the group began assisting the promising, yet financially constrained small enterprise, in the areas of design, production planning, sales, human resources, compliance and finance. The project was launched in exact! and in 2008 new high-tech machinery and larger premises were provided, to enable expansion to include Foschini and fashíonexpress. Average deliveries to the group have increased from an initial 4 000 units per month produced by 12 people with a lead time of 10 weeks, to 22 000 units produced by 70 staff members with a lead time of four weeks. In addition, the group currently undertakes all yarn purchases on behalf of New Coe Knits, with additional cost benefits. The enterprise has become an important player in the industry and yarn deliveries are more consistent.
The group’s production facility, TFGA, is also actively involved with production planning and other manufacturing activities.
SOCIO-ECONOMIC DEVELOPMENTFoschini achieved the maximum score of 5,0 points on this element for 2009 and this remains the target for 2012. The CSI section later in this report provides an overview of the effort that is being made in this area.
FOCUS AREAS TO ACHIEVE 2012 TARGETIn order to ensure that the 2012 target is achievable, focus is being placed on:
• equity ownership deal;
• ongoing focus on employment equity; and
• Project 700 to ensure that targets in respect of skills development are achieved.
CORPORATE SOCIAL INVESTMENTThe Foschini group recognises its responsibility as a corporate citizen towards making a contribution to the economic and social development of South Africa. Through the group’s CSI initiatives, various projects are undertaken for the benefit of the group’s employees, customers and the communities within which it operates.
Male Female Foreign Grand totalOccupational level A B C W A B C W M F
Top management 8 1 1 10
Senior management 3 1 10 70 1 3 63 151
Professional middle management 16 30 71 134 32 26 100 301 7 3 720
Skilled, junior management, supervisor 41 241 206 77 188 598 781 571 1 15 2 719
Semi-skilled 104 1 476 763 78 501 4 763 2 724 408 1 9 10 827
Unskilled 1 28 52 2 1 13 76 3 1 177
Grand total 165 1 776 1 102 369 724 5 400 3 684 1 347 10 27 14 604
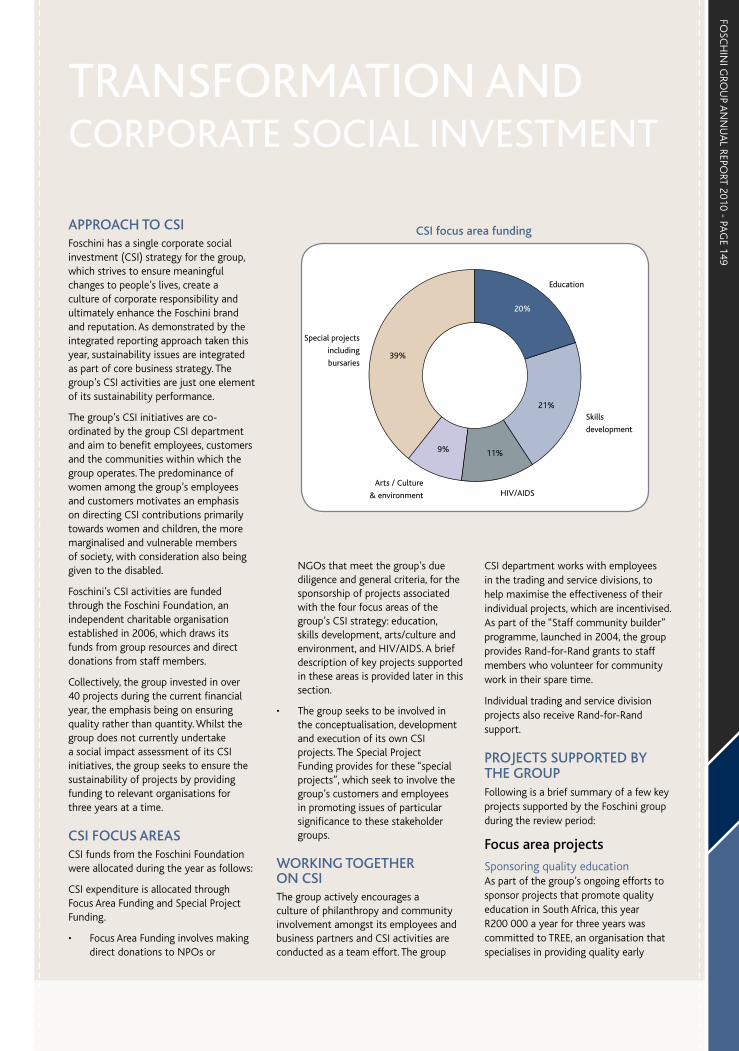
FOSC
HIN
I GRO
UP A
NN
UA
L REPORT 2010 - PA
GE 149
CSI focus area funding
Education
20%
21%
11%9%
39%
Skills
development
HIV/AIDSArts / Culture
& environment
Special projects
including
bursaries
APPROACH TO CSIFoschini has a single corporate social investment (CSI) strategy for the group, which strives to ensure meaningful changes to people’s lives, create a culture of corporate responsibility and ultimately enhance the Foschini brand and reputation. As demonstrated by the integrated reporting approach taken this year, sustainability issues are integrated as part of core business strategy. The group’s CSI activities are just one element of its sustainability performance.
The group’s CSI initiatives are co-ordinated by the group CSI department and aim to benefit employees, customers and the communities within which the group operates. The predominance of women among the group’s employees and customers motivates an emphasis on directing CSI contributions primarily towards women and children, the more marginalised and vulnerable members of society, with consideration also being given to the disabled.
Foschini’s CSI activities are funded through the Foschini Foundation, an independent charitable organisation established in 2006, which draws its funds from group resources and direct donations from staff members.
Collectively, the group invested in over 40 projects during the current financial year, the emphasis being on ensuring quality rather than quantity. Whilst the group does not currently undertake a social impact assessment of its CSI initiatives, the group seeks to ensure the sustainability of projects by providing funding to relevant organisations for three years at a time.
CSI FOCUS AREASCSI funds from the Foschini Foundation were allocated during the year as follows:
CSI expenditure is allocated through Focus Area Funding and Special Project Funding.
• Focus Area Funding involves making direct donations to NPOs or
NGOs that meet the group’s due diligence and general criteria, for the sponsorship of projects associated with the four focus areas of the group’s CSI strategy: education, skills development, arts/culture and environment, and HIV/AIDS. A brief description of key projects supported in these areas is provided later in this section.
• The group seeks to be involved in the conceptualisation, development and execution of its own CSI projects. The Special Project Funding provides for these “special projects”, which seek to involve the group’s customers and employees in promoting issues of particular significance to these stakeholder groups.
WORKING TOGETHER ON CSIThe group actively encourages a culture of philanthropy and community involvement amongst its employees and business partners and CSI activities are conducted as a team effort. The group
CSI department works with employees in the trading and service divisions, to help maximise the effectiveness of their individual projects, which are incentivised. As part of the “Staff community builder” programme, launched in 2004, the group provides Rand-for-Rand grants to staff members who volunteer for community work in their spare time.
Individual trading and service division projects also receive Rand-for-Rand support.
PROJECTS SUPPORTED BY THE GROUPFollowing is a brief summary of a few key projects supported by the Foschini group during the review period:
Focus area projects
Sponsoring quality educationAs part of the group’s ongoing efforts to sponsor projects that promote quality education in South Africa, this year R200 000 a year for three years was committed to TREE, an organisation that specialises in providing quality early
TRANSFORMATION AND CORPORATE SOCIAL INVESTMENT
FOSC
HIN
I GRO
UP A
NN
UA
L REPORT 2010 - PA
GE 150
TRAN
SFORM
ATION
AN
D C
ORPO
RATE SOC
IAL IN
VESTM
ENT C
ON
TINU
ED
childhood development (ECD) training, which forms the basis of future learning around literacy, numeracy, mathematics and science education. These funds will help to develop ten community-based ECD sites in Ixopo, KwaZulu-Natal.
Other beneficiaries include the Rural Education Project (through the University of Cape Town’s Schools Development Unit), the Western Cape Primary Science Programme, LEAP Science and Maths School and ORT-TEch South Africa.
Promoting arts/culture and environmentThe group has committed funding of R180 000 a year for three years (2009 – 2011) to the iKAPA Dance Theatre, an innovative dance company which uses dance as a medium to inspire, train and mentor the youth. The group’s funds have enabled iKAPA’s Outreach arm, Imbewu yeKapa School of Arts, which takes dance to children and young adults in previously disadvantaged neighbourhoods around Cape Town, to increase its number of students to 300 in seven different outreach centres.
Supporting efforts to manage HIV/AIDSThe group is a longstanding contributor to under-resourced programmes aimed at managing HIV/AIDS in South African communities. The group has committed R540 000 over three years (2009 – 2011) to Ikamvu Labantu, an organisation that supports orphans and vulnerable children affected and infected by HIV. Interventions and activities are designed to ensure that these children receive adequate care within their own communities. Providing home-based care and specific support for child-headed households is an important need within the HIV environment, especially in light of the limited access to health care and the growing number of AIDS orphans in South Africa.
Promoting skills developmentA focus of the group’s efforts to promote skills development, job creation and entrepreneurship, is the commitment
to provide R300 000 a year, over three years, towards the Indigenous Trees for Life enterprise development programme, operated by the NGO Wildlands Conservation Trust. This “tree-preneur” project involves training members of poor and vulnerable communities as facilitators to teach communities how to grow indigenous plant seedlings. These seedlings are then traded back to Wildlands for food, clothes, bicycles, agricultural goods and tools, school and university fees. The programme equips facilitators with additional entrepreneurial skills, to help them to start their own businesses, or help the tree-preneurs with such opportunities.
Other beneficiary organisations include The Big Issue, Lifeline/Childline and The WHEAT Trust.
Special projects
The Feel Good ProjectThe Feel Good Project is a pioneering skills development and job creation initiative launched by the group over a year ago in partnership with the NPO, Learn to Earn. The project centres around a retail shop, The Feel Good Store, located in Claremont, Cape Town. The shop stocks reconditioned customer returns, as well as limited samples, rejects and overruns from the various Foschini group brands. Previously unemployed people are enrolled in the project as trainees,
to work and learn skills relevant to the retail supply chain. All proceeds from the shop are reinvested in the project, which is proving to be a sustainable model for success. In addition to the retail shop, there is also a warehousing and production component to the project, ensuring that trainees acquire diverse skills, to enhance their chances of securing employment.
In addition to the start-up capital, the group donated customer returns comprising men’s, ladies’ and children’s clothing in excess of R22 million to this project. Profits generated from the sale of these reconditioned and refurbished items through the retail outlet “The Feel Good Store” is ploughed back into the project, to make it self-funding and sustainable into the future. The store achieved a retail sales turnover of just under R3 million and moved 53 307 units during the year under review.
Currently, 21 unemployed people are “employed” on short-term contracts in the capacity of trainees. Fifty-five group employees gave freely of their time to the project set-up and many continue to do so in an advisory capacity. These learners were trained in aspects of warehousing, sewing and repairs and retail selling, all of which are built on a foundation of life skills training by Learn to Earn.
The Foschini Foundation
The Foschini Foundation was registered as an independent charitable organisation in August 2006, with an initial capital base provided by the group. The foundation’s current trustees are A D Murray (executive director) and D M Nurek (independent non-executive director). Investments under the foundation’s control are valued at R85,1 million this year, up from R62 million last year due to a strong market. The foundation’s investment income is distributed as donations to selected charitable causes.
The foundation made donations amounting to over R4,5 million during the year. Merchandise donations for the benefit of The Feel Good Project aimed at promoting skills development totalled R22,6 million. Additional donations to the value of R863 529 were made by various divisions of the group in cash, sundry equipment, merchandise and services. Of their own volition and from their own resources, staff members and business partners of the group contributed an additional R17 640.

FOSC
HIN
I GRO
UP A
NN
UA
L REPORT 2010 - PA
GE 151
These individuals spend a minimum of six months on the programme and then enter the open market with skills that will make them more employable. Trainees from this project are encouraged to apply for employment opportunities within the group.
16 days of activismThis year marked the fifth year of supporting the “16 days of activism” campaign against the abuse of women and children. To date, the group has donated over R2 million to 38 NPOs working in this field throughout South Africa. In addition to financial support, the group conducts annual awareness raising campaigns and negotiates publicity and exposure for the NPOs, to raise their public profile. This involves a number of media channels and this year included the social media platform, MXIT.
Glitz, glam and goodIn support of breast health the group CSI collaborated with Foschini stores to raise funds and awareness for this worthy cause. Foschini stores, through an in-store campaign, “Colour Makes Change”, collected more than 1 200 bras from customers and raised more than R175 000 through the sale of highlighted products. These funds, together with a further donation of R55 000 from group CSI went towards South Africa’s first Mobile Breast Check Unit Trucks. These units provide access to a mobile mammography screening facility for South African women, as well as providing education on the topic of breast cancer, breast self-examination and patient rights.
The successes of these projects were complemented by the reach of the group CSI into the broader community, where funding is also given to more than 60 organisations according to specific funding criteria.
Divisional CSI initiativesIn addition to the group’s CSI initiatives, staff members within the various divisions undertook their own CSI initiatives by providing support to:
TRANSFORMATION AND CORPORATE SOCIAL INVESTMENT
• CANSA Eastern Cape;
• CANSA Welkom;
• Ncenduluntu Sanctuary Trust; and
• Solomon’s Haven.
RCS Group CSI initiativesRCS Group is likewise active in community development initiatives and this year invested over R800 000 in various projects. The division’s flagship project is a partnership with TSiBA, a free tertiary educational institution. Together they developed a financial literacy curriculum aimed at empowering students with skills to manage their finances responsibly. This programme, as part of the “pay it forward” concept, has now been rolled out to communities via outreach programmes run by the students of TSiBA.
Other projects supported by the RCS Group include:
• the JAG Foundation which supports children from disadvantaged communities through sport;
• Habitat for Humanity through which RCS have built three houses over three years;
• Building a food tent with HEART, a social security organisation at the Dusk to Dawn Shelter in order to ensure there is a vegetable garden big enough to sustain the food needs of the home;
• Carehaven, a different home, also received a food tent; and
• Project O supports orphans and vulnerable children in rural villages in KZN.
FOSC
HIN
I GRO
UP A
NN
UA
L REPORT 2010 - PA
GE 152
SUSTA
INA
BILITY OV
ERVIEW
SUSTAINABILITY OVERVIEW
In line with the recommendations of King III, this year we have produced an integrated sustainability report that provides a consolidated review of our financial, social, economic and environmental performance. We have done this by integrating a performance review of our material issues within the sections reviewing our various operations and services, and governance practices.
In this section of the report, we briefly:
• review the relationship between sustainable development and our core value drivers;
• identify our most material sustainability issues;
• provide an overview of our performance on these issues, noting key achievements, challenges, strategic focus areas and commitments, and identifying where these issues are addressed in more detail elsewhere in the report;
• outline our approach to managing sustainability throughout the company; and
• facilitate comparability, both with our own performance year on year, and with the performance of our peers. We have provided a detailed index in which we respond to each of the “G3” criteria of the Global Reporting Initiative (GRI) and identify in which section of the annual report relevant information on our sustainable development performance is discussed.
LINKING SUSTAINABILITY TO OUR CORE VALUE DRIVERSAs this report is targeted primarily at current and potential investors in the company, our identification of material issues focuses on those issues that can have meaningful impact on our financial performance. As a retail company in the apparel, footwear, sporting and jewellery business we believe that there are various ways in which societal and environmental issues are material to our core business:
• Primarily, there are significant implications, both direct and indirect, associated with existing and anticipated government policy aimed at addressing societal, governance and environmental challenges. Examples of direct impacts on our business include the recent regulatory focus on protecting consumers’ rights (typified by the 2009 Consumer Protection Act), new requirements relating to corporate governance practices and the various environmental policy measures (relating, for example, to energy efficiency and waste) that may impact on our activities throughout our value chain.
• At a more general level, government policy on social and environmental issues may have broader macroeconomic impacts with resulting implications for our business. For example, certain policy measures will result in increased energy and water prices, leading to reductions in the disposable income of our consumers. Although some areas of our business are less vulnerable than others, a slowing consumer spending environment translates into lower sales growth and a decline in revenue. Adverse macroeconomic conditions could also result in higher-than-forecast bad debt write-offs, which would affect the earnings of our group.
• We anticipate that, in time, growing resource constraints will result in increasing raw material and operating costs. Higher energy and fuel costs are seen to be of most material concern to our distribution and purchasing activities, and underline the need for continuing efforts to maximise operational efficiencies. Potential resource constraints and the resulting policy responses may also increase the volatility of the supply and distribution of certain raw materials and products.
• As we begin to see greater competition in the local market – including increased activity from international competing brands in the sports and footwear sector, some of whom have positioned themselves very strongly on sustainability issues – we believe that this will increase the potential for environmental and social considerations to provide a source of local competitive advantage, as well as raising reputational pressures. While local clothing retailers have not faced the same level of consumer scrutiny on supply chain practices as our international peers, we anticipate that there will be growing consumer and investor awareness on these issues.
• An important source of growth for the company lies in our capacity to develop new stores. The tight availability of sites for new stores may have a negative impact on our expansion programme.
• Finally, we recognise that providing an attractive work environment with competitive salaries and associated benefits encourages greater productivity and employee loyalty.
Underlying our commitment to addressing these material sustainability issues is the belief that socially responsible management is symptomatic of good general management. Companies that are more responsive to developments within society tend to be those that are well managed and more successful in the short, medium and long term.
REPORTING ON OUR MATERIAL ISSUESWe have identified our material sustainability issues through a process of internal evaluation and reflection that is informed in part by the outcomes of discussions with our stakeholders. A review of our recent stakeholder engagement activities is provided in the

FOSC
HIN
I GRO
UP A
NN
UA
L REPORT 2010 - PA
GE 153
corporate governance section of this report.
Issues that have been raised by our various stakeholders include: building and maintaining shareholder value; demonstrating concern for our employees; promoting broad-based black economic empowerment; and supporting the communities in which we operate. In line with international trends, some of our investors are beginning to show an increasing interest in our approach to managing our supply chain, particularly as regards the maintenance of labour and environmental standards. Enhancing our supplier assessment processes to ensure
responsible practice has been a specific focus over the last two years and we are particularly pleased with our progress in this area.
In the table below, we have reviewed how our key activities may have an impact on the social, economic and environmental well-being of the community, and we have identified where in the report further information on these areas can be found. A more comprehensive guide as to where information on different aspects of our sustainability performance may be found in the report is provided in the GRI G3 content index at the end of this section.
Understanding Foschini’s sustainability impacts Section of report
Making a positive contribution to the economy by providing employment, generating business for local service providers, paying taxes and supplying affordable quality goods
Addressed throughout the report; quantitative data in Financial Director’s report and financial statements
Ensuring ethical integrity through transparent corporate governance practices
Corporate Governance report
Providing a safe place of work that rewards and motivates our employees appropriately and that reflects the diversity of the people that shop with us
Human Resources report and Transformation and CSI report
Promoting sound social and environmental practices throughout our supply chain
Group Merchandise Procurement
Ensuring product safety and integrity, for example through clear labelling and marketing practices
Group Merchandise Procurement
Adopting sound environmental management practices in our operations
Environmental and Logistics sections of the services review
Providing resources, time and energy to our corporate social investment programme
CSI activities reviewed in Transformation and CSI report
OUR SUSTAINABILITY PERFORMANCE AT A GLANCEThis section provides an overview of our principal achievements during the financial year under review, and outlines our key challenges and strategic focus areas and future commitments in these areas. It also includes a table of quantitative performance data for the last two years.
Overview of our principal achievements, challenges, and strategic focus areas and commitments
Key achievements• In spite of challenging trading
conditions due to the global recession, all our divisions produced satisfying results. A total of 100 new stores were opened and 12 were closed across the group’s 14 trading brands and turnover for the year grew by 6,4%. Positive growth is expected in the next financial year.
• Significantly reduced lead times for merchandise procurement and a 64% reduction in stock holding at our distribution centres, as a result of supply chain initiatives aimed at improving efficiencies.
• Implemented formalised group merchandise policies and procedures aimed at ensuring a more rigorous assessment of both potential and existing suppliers. This approach includes updated quality assurance and quality control processes, ensuring that all our contractual obligations are being met, including all legal, ethical, environmental, labour, and health and safety compliance. A test phase has been conducted on both pre- and post- approved suppliers.
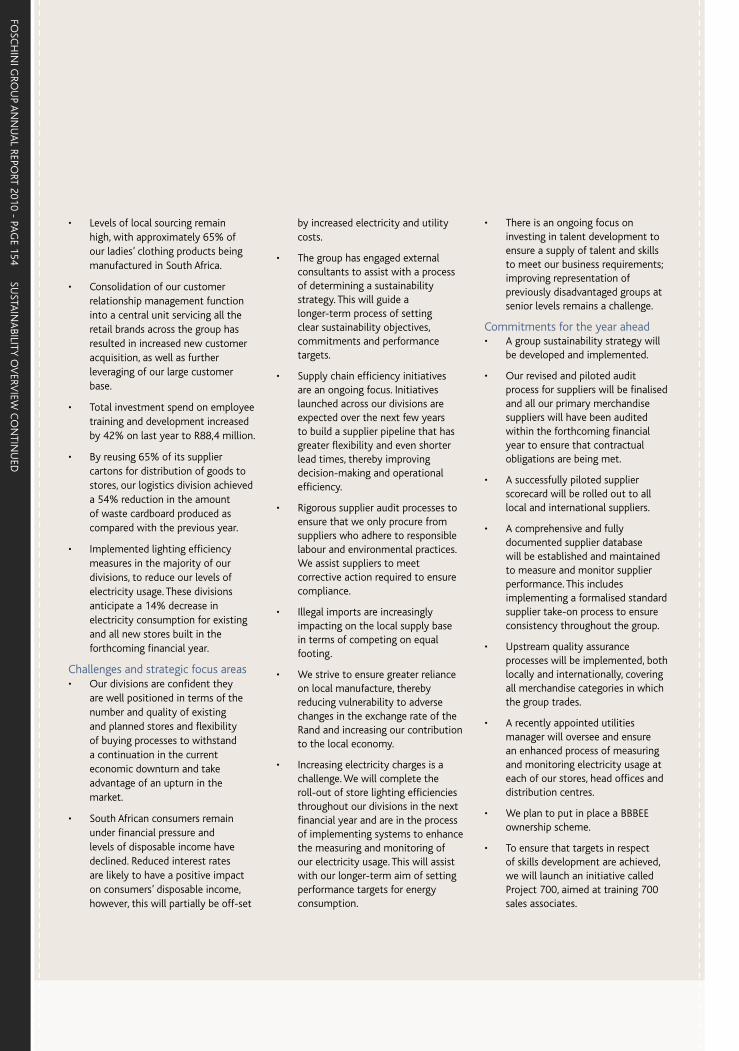
FOSC
HIN
I GRO
UP A
NN
UA
L REPORT 2010 - PA
GE 154
SUSTA
INA
BILITY OV
ERVIEW
CO
NTIN
UED
• Levels of local sourcing remain high, with approximately 65% of our ladies’ clothing products being manufactured in South Africa.
• Consolidation of our customer relationship management function into a central unit servicing all the retail brands across the group has resulted in increased new customer acquisition, as well as further leveraging of our large customer base.
• Total investment spend on employee training and development increased by 42% on last year to R88,4 million.
• By reusing 65% of its supplier cartons for distribution of goods to stores, our logistics division achieved a 54% reduction in the amount of waste cardboard produced as compared with the previous year.
• Implemented lighting efficiency measures in the majority of our divisions, to reduce our levels of electricity usage. These divisions anticipate a 14% decrease in electricity consumption for existing and all new stores built in the forthcoming financial year.
Challenges and strategic focus areas• Our divisions are confident they
are well positioned in terms of the number and quality of existing and planned stores and flexibility of buying processes to withstand a continuation in the current economic downturn and take advantage of an upturn in the market.
• South African consumers remain under financial pressure and levels of disposable income have declined. Reduced interest rates are likely to have a positive impact on consumers’ disposable income, however, this will partially be off-set
by increased electricity and utility costs.
• The group has engaged external consultants to assist with a process of determining a sustainability strategy. This will guide a longer-term process of setting clear sustainability objectives, commitments and performance targets.
• Supply chain efficiency initiatives are an ongoing focus. Initiatives launched across our divisions are expected over the next few years to build a supplier pipeline that has greater flexibility and even shorter lead times, thereby improving decision-making and operational efficiency.
• Rigorous supplier audit processes to ensure that we only procure from suppliers who adhere to responsible labour and environmental practices. We assist suppliers to meet corrective action required to ensure compliance.
• Illegal imports are increasingly impacting on the local supply base in terms of competing on equal footing.
• We strive to ensure greater reliance on local manufacture, thereby reducing vulnerability to adverse changes in the exchange rate of the Rand and increasing our contribution to the local economy.
• Increasing electricity charges is a challenge. We will complete the roll-out of store lighting efficiencies throughout our divisions in the next financial year and are in the process of implementing systems to enhance the measuring and monitoring of our electricity usage. This will assist with our longer-term aim of setting performance targets for energy consumption.
• There is an ongoing focus on investing in talent development to ensure a supply of talent and skills to meet our business requirements; improving representation of previously disadvantaged groups at senior levels remains a challenge.
Commitments for the year ahead• A group sustainability strategy will
be developed and implemented.
• Our revised and piloted audit process for suppliers will be finalised and all our primary merchandise suppliers will have been audited within the forthcoming financial year to ensure that contractual obligations are being met.
• A successfully piloted supplier scorecard will be rolled out to all local and international suppliers.
• A comprehensive and fully documented supplier database will be established and maintained to measure and monitor supplier performance. This includes implementing a formalised standard supplier take-on process to ensure consistency throughout the group.
• Upstream quality assurance processes will be implemented, both locally and internationally, covering all merchandise categories in which the group trades.
• A recently appointed utilities manager will oversee and ensure an enhanced process of measuring and monitoring electricity usage at each of our stores, head offices and distribution centres.
• We plan to put in place a BBBEE ownership scheme.
• To ensure that targets in respect of skills development are achieved, we will launch an initiative called Project 700, aimed at training 700 sales associates.

FOSC
HIN
I GRO
UP A
NN
UA
L REPORT 2010 - PA
GE 155
SUSTAINABILITY OVERVIEWOUR SUSTAINABILITY PERFORMANCE YEAR ON YEAR*
Performance indicator 2010 2009
Economic and related core baseline indicatorsTurnover (Rm) 8 605,2 8 089,6Operating profit before finance charges (Rm) 1 972,6 2 025,5Headline earnings per ordinary share (cents) 521,4 559,5Dividends declared per ordinary share (cents) 288,0 288,0Total number of stores 1 627 1 539Total number of distribution centres 8 8
Total procurement from BBBEE sources (%)1 53% (2009) 46% (2008)Number of environmental, health and safety and/or governance legal incidents None None
Employee issuesTotal number of employees– Permanent full-time employees 10 494 10 075– Permanent part-time employees 327 313– Flexitime employees 3 233 3 103– Contract employees 550 947– Casual employees 182 1 029
New jobs created (direct employment only) 1 083 Data not available
Employee turnover (excluding contractors) (%) 33% 47%Employment equity (% representation of previously disadvantaged groups among permanent employees)2
– Senior management 9,8 7,1– Specialists and middle management 37,0 13,7– Skilled technical and junior management 74,0 70,1– Semi- and unskilled employees 94,2 93,0Investment in employee training and development– total expenditure (Rm) 88,4 62,2– % of payroll 7,1% 6,0%Total number of employee training interventions 131 166 73 526Work-related fatalities None NoneNumber of classified injuries – number of days lost 1 924 1 510– number of incidents 403 445– number of incidents where days off were 3 or less 294 349Number of lost workdays due to industrial action 0 0
Environmental issuesEnergy usage (kilowatt hours) (stores, distribution centres and offices) Data not
available 117 639 989Carbon footprint (tonnes CO
2e)
– total Carbon inventory currently
being calculated
154 051,06– Scope 1 3 672,79– Scope 2 121 169,19– Scope 3 28 645,94
Water consumption (kilolitres) (head offices and distribution centres)3 34 695 33 733Waste to landfill (tonnes)4 79,57 Reliable data
not availableTotal recyclable volumes per month (tonnes) 146,67 Reliable data
not available
Corporate social investmentCSI total spend (Rm) 4,5 4,3
1 Total procurement (not only for merchandise); data is not currently available for 20102 Employment equity statistics: Reported annually in October of each year, in line with SA Department of Labour3 Water usage: Stores were not included as consumption is minimal. Toilet facilities in stores are communal and therefore would fall under the bulk
water usage of the mall or facility where the store is located4 Waste statistics: Statistics cover activities at our Cape Town head offices and distribution centres for the period July 2009 – April 2010
* Note: Whilst every effort is made to present data in respect of the latest two comparative periods, in certain instances the data is not yet available and is noted as such in the table above.
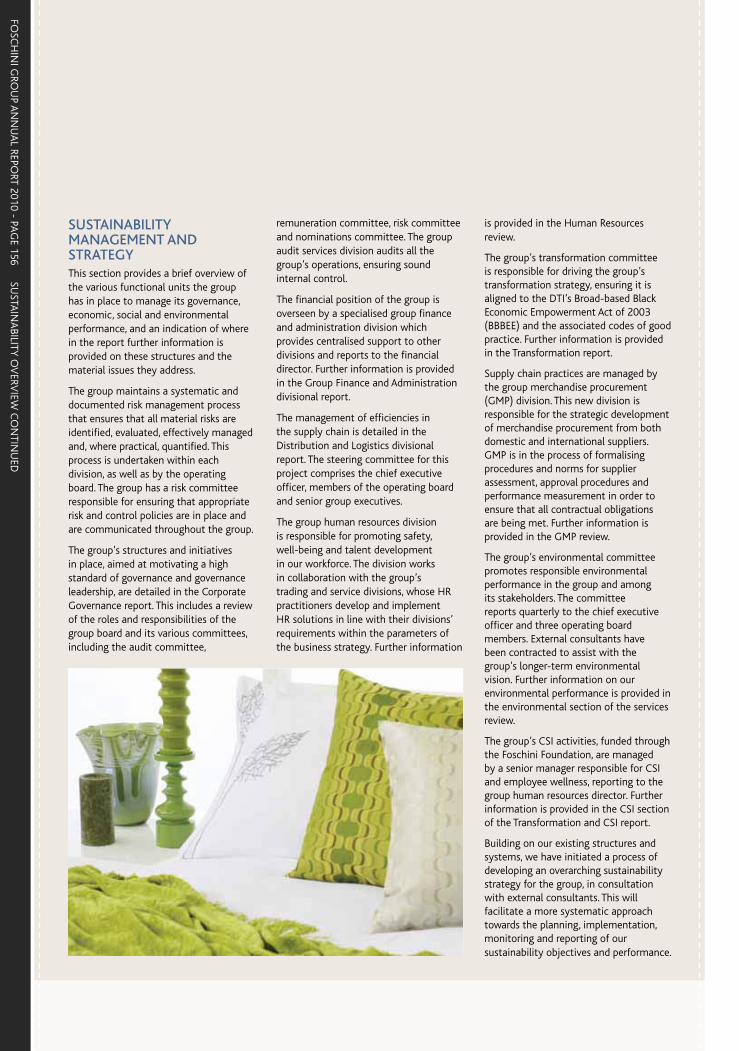
FOSC
HIN
I GRO
UP A
NN
UA
L REPORT 2010 - PA
GE 156
SUSTA
INA
BILITY OV
ERVIEW
CO
NTIN
UED
SUSTAINABILITY MANAGEMENT AND STRATEGYThis section provides a brief overview of the various functional units the group has in place to manage its governance, economic, social and environmental performance, and an indication of where in the report further information is provided on these structures and the material issues they address.
The group maintains a systematic and documented risk management process that ensures that all material risks are identified, evaluated, effectively managed and, where practical, quantified. This process is undertaken within each division, as well as by the operating board. The group has a risk committee responsible for ensuring that appropriate risk and control policies are in place and are communicated throughout the group.
The group’s structures and initiatives in place, aimed at motivating a high standard of governance and governance leadership, are detailed in the Corporate Governance report. This includes a review of the roles and responsibilities of the group board and its various committees, including the audit committee,
remuneration committee, risk committee and nominations committee. The group audit services division audits all the group’s operations, ensuring sound internal control.
The financial position of the group is overseen by a specialised group finance and administration division which provides centralised support to other divisions and reports to the financial director. Further information is provided in the Group Finance and Administration divisional report.
The management of efficiencies in the supply chain is detailed in the Distribution and Logistics divisional report. The steering committee for this project comprises the chief executive officer, members of the operating board and senior group executives.
The group human resources division is responsible for promoting safety, well-being and talent development in our workforce. The division works in collaboration with the group’s trading and service divisions, whose HR practitioners develop and implement HR solutions in line with their divisions’ requirements within the parameters of the business strategy. Further information
is provided in the Human Resources review.
The group’s transformation committee is responsible for driving the group’s transformation strategy, ensuring it is aligned to the DTI’s Broad-based Black Economic Empowerment Act of 2003 (BBBEE) and the associated codes of good practice. Further information is provided in the Transformation report.
Supply chain practices are managed by the group merchandise procurement (GMP) division. This new division is responsible for the strategic development of merchandise procurement from both domestic and international suppliers. GMP is in the process of formalising procedures and norms for supplier assessment, approval procedures and performance measurement in order to ensure that all contractual obligations are being met. Further information is provided in the GMP review.
The group’s environmental committee promotes responsible environmental performance in the group and among its stakeholders. The committee reports quarterly to the chief executive officer and three operating board members. External consultants have been contracted to assist with the group’s longer-term environmental vision. Further information on our environmental performance is provided in the environmental section of the services review.
The group’s CSI activities, funded through the Foschini Foundation, are managed by a senior manager responsible for CSI and employee wellness, reporting to the group human resources director. Further information is provided in the CSI section of the Transformation and CSI report.
Building on our existing structures and systems, we have initiated a process of developing an overarching sustainability strategy for the group, in consultation with external consultants. This will facilitate a more systematic approach towards the planning, implementation, monitoring and reporting of our sustainability objectives and performance.
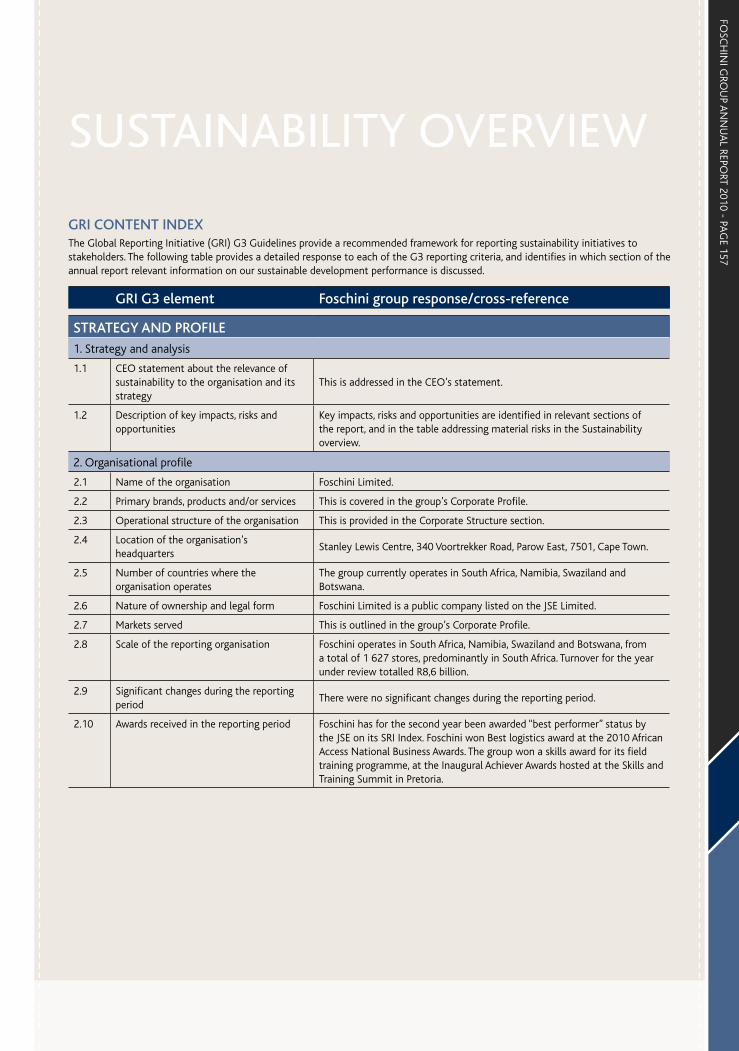
FOSC
HIN
I GRO
UP A
NN
UA
L REPORT 2010 - PA
GE 157
SUSTAINABILITY OVERVIEW
GRI CONTENT INDEXThe Global Reporting Initiative (GRI) G3 Guidelines provide a recommended framework for reporting sustainability initiatives to stakeholders. The following table provides a detailed response to each of the G3 reporting criteria, and identifies in which section of the annual report relevant information on our sustainable development performance is discussed.
GRI G3 element Foschini group response/cross-reference
STRATEGY AND PROFILE1. Strategy and analysis
1.1 CEO statement about the relevance of sustainability to the organisation and its strategy
This is addressed in the CEO’s statement.
1.2 Description of key impacts, risks and opportunities
Key impacts, risks and opportunities are identified in relevant sections of the report, and in the table addressing material risks in the Sustainability overview.
2. Organisational profile
2.1 Name of the organisation Foschini Limited.
2.2 Primary brands, products and/or services This is covered in the group’s Corporate Profile.
2.3 Operational structure of the organisation This is provided in the Corporate Structure section.
2.4 Location of the organisation’s headquarters
Stanley Lewis Centre, 340 Voortrekker Road, Parow East, 7501, Cape Town.
2.5 Number of countries where the organisation operates
The group currently operates in South Africa, Namibia, Swaziland and Botswana.
2.6 Nature of ownership and legal form Foschini Limited is a public company listed on the JSE Limited.
2.7 Markets served This is outlined in the group’s Corporate Profile.
2.8 Scale of the reporting organisation Foschini operates in South Africa, Namibia, Swaziland and Botswana, from a total of 1 627 stores, predominantly in South Africa. Turnover for the year under review totalled R8,6 billion.
2.9 Significant changes during the reporting period
There were no significant changes during the reporting period.
2.10 Awards received in the reporting period Foschini has for the second year been awarded “best performer” status by the JSE on its SRI Index. Foschini won Best logistics award at the 2010 African Access National Business Awards. The group won a skills award for its field training programme, at the Inaugural Achiever Awards hosted at the Skills and Training Summit in Pretoria.

FOSC
HIN
I GRO
UP A
NN
UA
L REPORT 2010 - PA
GE 158
SUSTA
INA
BILITY OV
ERVIEW
CO
NTIN
UED
GRI G3 element Foschini group response/cross-reference
3. Report parameters
3.1 Reporting period The reporting period is 1 April 2009 to 31 March 2010.
3.2 Date of most recent previous report Foschini Limited 2009 Annual Report covering 1 April 2008 to 31 March 2009.
3.3 Reporting cycle 1 April to 31 March.
3.4 Contact point Addressed in Administration section (inside back cover).
3.5 Process for defining report content Our most material sustainability issues are identified in the Sustainability overview. Performance reporting on these material issues is consolidated and embedded within the various sections of the report.
3.6 Boundary of the report The report covers all Foschini’s wholly-owned companies and in all significant aspects, its subsidiary RCS, in which is has a 55% shareholding.
3.7 Limitations Issues that are currently not being measured or reported on, or for which only partial or derived performance measures are available (such as our carbon footprint), are identified in relevant sections of this GRI table.
3.8 Basis for reporting on JVs There are currently no joint ventures.
3.9 Data measurement techniques These are explained where data is provided.
3.10 Explanation of effect of restatements Provided in notes to the financial statements.
3.11 Significant changes in scope, boundary or measurement method
There were no significant changes. In terms of the group’s environmental performance, the scope of the carbon footprint analysis was expanded to include Scope 3 inventory.
3.12 GRI content index GRI content index provided here.
3.13 External assurance External assurance is provided for financial performance only. Foschini is in the process of improving its monitoring of quantitative data relating to its other areas of sustainability performance. Seeking independent assurance of our sustainability reports is not currently deemed to be appropriate.
4. Governance, commitments and engagement
4.1 Governance structure Addressed in Corporate Governance section.
4.2 Nature of role of the chair Addressed in Corporate Governance section.
4.3 No. of non-executive members Addressed in Corporate Governance section.
4.4 Mechanisms for shareholder direction and employee input
Addressed in the Corporate Governance and Human Resources reviews.
4.5 Linkage between compensation and performance
Addressed in the Remuneration report.
4.6 Processes for managing conflicts of interest This is addressed in the Risk report in the Governance section.
4.7 Process for determining expertise Addressed in section on the Directorate and in the annex to notice of AGM.
4.8 Internally developed statements of mission or values, codes of conduct relevant to economic, social and environmental performance
This is addressed in the Risk report in the Governance section.
4.9 Risk management procedures These are addressed in the Risk report in the Governance section.
4.10 Performance evaluation processes Addressed in Corporate Governance review.
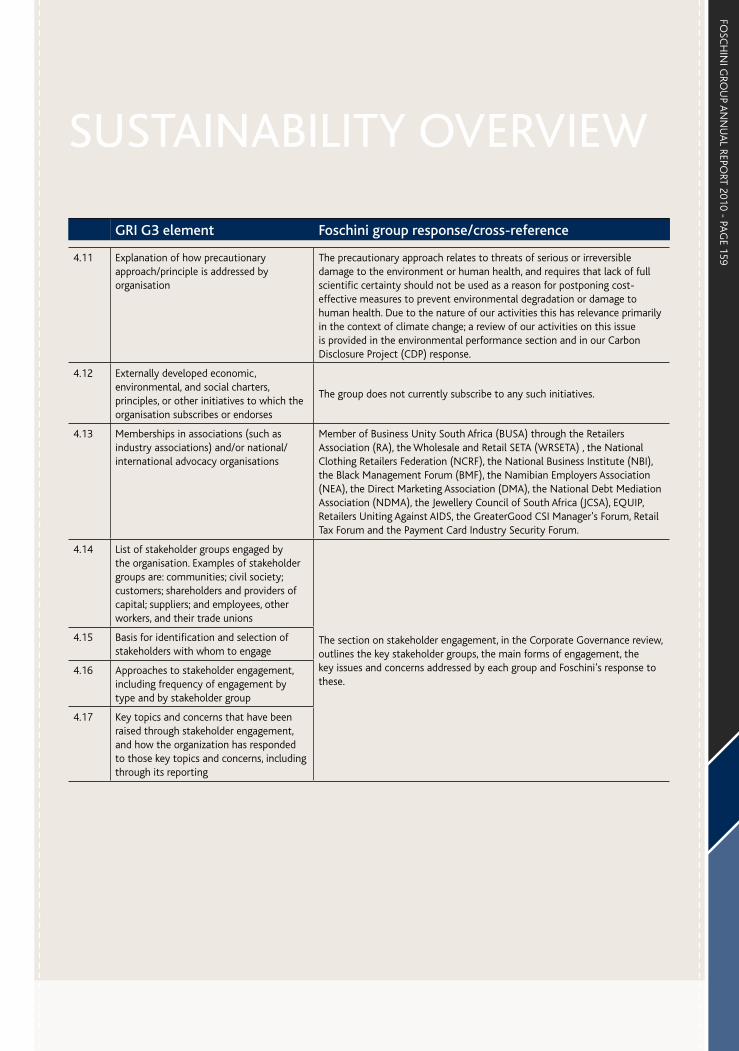
FOSC
HIN
I GRO
UP A
NN
UA
L REPORT 2010 - PA
GE 159
SUSTAINABILITY OVERVIEW
GRI G3 element Foschini group response/cross-reference
4.11 Explanation of how precautionary approach/principle is addressed by organisation
The precautionary approach relates to threats of serious or irreversible damage to the environment or human health, and requires that lack of full scientific certainty should not be used as a reason for postponing cost-effective measures to prevent environmental degradation or damage to human health. Due to the nature of our activities this has relevance primarily in the context of climate change; a review of our activities on this issue is provided in the environmental performance section and in our Carbon Disclosure Project (CDP) response.
4.12 Externally developed economic, environmental, and social charters, principles, or other initiatives to which the organisation subscribes or endorses
The group does not currently subscribe to any such initiatives.
4.13 Memberships in associations (such as industry associations) and/or national/international advocacy organisations
Member of Business Unity South Africa (BUSA) through the Retailers Association (RA), the Wholesale and Retail SETA (WRSETA) , the National Clothing Retailers Federation (NCRF), the National Business Institute (NBI), the Black Management Forum (BMF), the Namibian Employers Association (NEA), the Direct Marketing Association (DMA), the National Debt Mediation Association (NDMA), the Jewellery Council of South Africa (JCSA), EQUIP, Retailers Uniting Against AIDS, the GreaterGood CSI Manager’s Forum, Retail Tax Forum and the Payment Card Industry Security Forum.
4.14 List of stakeholder groups engaged by the organisation. Examples of stakeholder groups are: communities; civil society; customers; shareholders and providers of capital; suppliers; and employees, other workers, and their trade unions
The section on stakeholder engagement, in the Corporate Governance review, outlines the key stakeholder groups, the main forms of engagement, the key issues and concerns addressed by each group and Foschini’s response to these.
4.15 Basis for identification and selection of stakeholders with whom to engage
4.16 Approaches to stakeholder engagement, including frequency of engagement by type and by stakeholder group
4.17 Key topics and concerns that have been raised through stakeholder engagement, and how the organization has responded to those key topics and concerns, including through its reporting
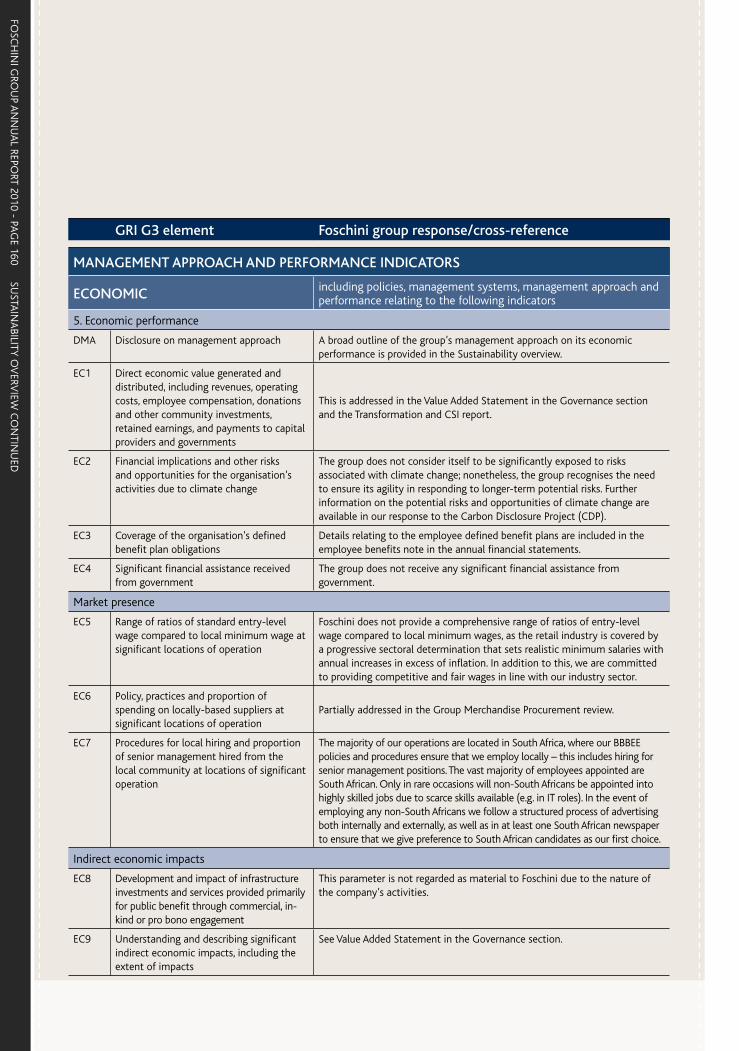
FOSC
HIN
I GRO
UP A
NN
UA
L REPORT 2010 - PA
GE 160
SUSTA
INA
BILITY OV
ERVIEW
CO
NTIN
UED
GRI G3 element Foschini group response/cross-reference
MANAGEMENT APPROACH AND PERFORMANCE INDICATORS
ECONOMIC including policies, management systems, management approach and performance relating to the following indicators
5. Economic performance
DMA Disclosure on management approach A broad outline of the group’s management approach on its economic performance is provided in the Sustainability overview.
EC1 Direct economic value generated and distributed, including revenues, operating costs, employee compensation, donations and other community investments, retained earnings, and payments to capital providers and governments
This is addressed in the Value Added Statement in the Governance section and the Transformation and CSI report.
EC2 Financial implications and other risks and opportunities for the organisation’s activities due to climate change
The group does not consider itself to be significantly exposed to risks associated with climate change; nonetheless, the group recognises the need to ensure its agility in responding to longer-term potential risks. Further information on the potential risks and opportunities of climate change are available in our response to the Carbon Disclosure Project (CDP).
EC3 Coverage of the organisation’s defined benefit plan obligations
Details relating to the employee defined benefit plans are included in the employee benefits note in the annual financial statements.
EC4 Significant financial assistance received from government
The group does not receive any significant financial assistance from government.
Market presence
EC5 Range of ratios of standard entry-level wage compared to local minimum wage at significant locations of operation
Foschini does not provide a comprehensive range of ratios of entry-level wage compared to local minimum wages, as the retail industry is covered by a progressive sectoral determination that sets realistic minimum salaries with annual increases in excess of inflation. In addition to this, we are committed to providing competitive and fair wages in line with our industry sector.
EC6 Policy, practices and proportion of spending on locally-based suppliers at significant locations of operation
Partially addressed in the Group Merchandise Procurement review.
EC7 Procedures for local hiring and proportion of senior management hired from the local community at locations of significant operation
The majority of our operations are located in South Africa, where our BBBEE policies and procedures ensure that we employ locally – this includes hiring for senior management positions. The vast majority of employees appointed are South African. Only in rare occasions will non-South Africans be appointed into highly skilled jobs due to scarce skills available (e.g. in IT roles). In the event of employing any non-South Africans we follow a structured process of advertising both internally and externally, as well as in at least one South African newspaper to ensure that we give preference to South African candidates as our first choice.
Indirect economic impacts
EC8 Development and impact of infrastructure investments and services provided primarily for public benefit through commercial, in-kind or pro bono engagement
This parameter is not regarded as material to Foschini due to the nature of the company’s activities.
EC9 Understanding and describing significant indirect economic impacts, including the extent of impacts
See Value Added Statement in the Governance section.
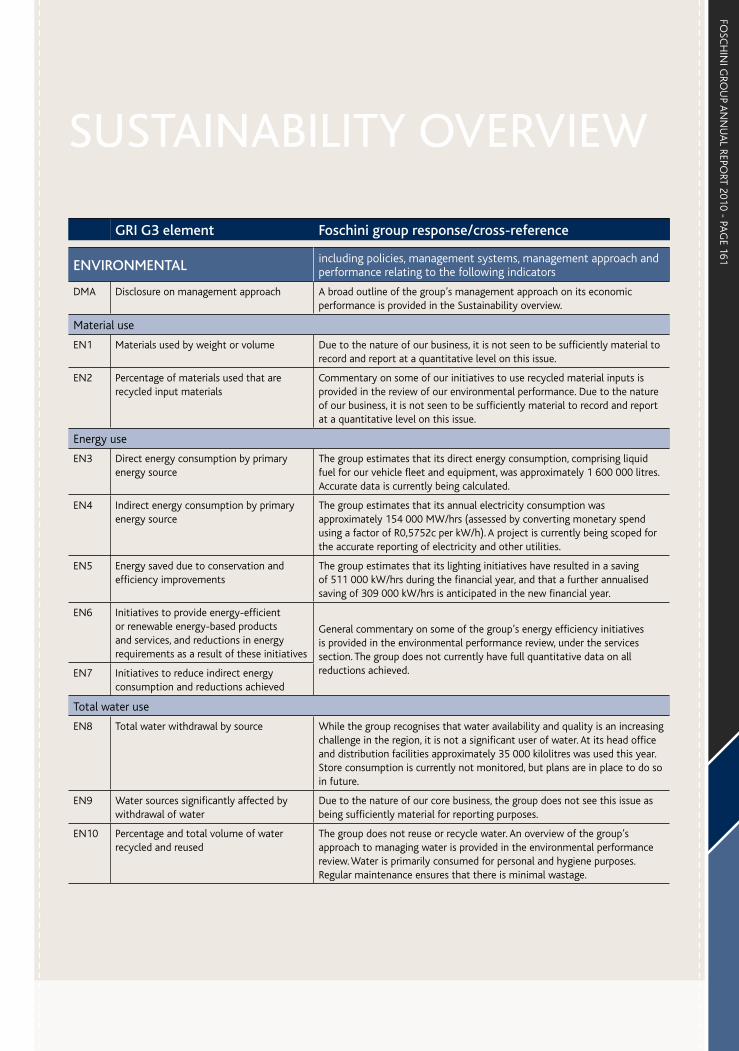
FOSC
HIN
I GRO
UP A
NN
UA
L REPORT 2010 - PA
GE 161
SUSTAINABILITY OVERVIEW
GRI G3 element Foschini group response/cross-reference
ENVIRONMENTAL including policies, management systems, management approach and performance relating to the following indicators
DMA Disclosure on management approach A broad outline of the group’s management approach on its economic performance is provided in the Sustainability overview.
Material use
EN1 Materials used by weight or volume Due to the nature of our business, it is not seen to be sufficiently material to record and report at a quantitative level on this issue.
EN2 Percentage of materials used that are recycled input materials
Commentary on some of our initiatives to use recycled material inputs is provided in the review of our environmental performance. Due to the nature of our business, it is not seen to be sufficiently material to record and report at a quantitative level on this issue.
Energy use
EN3 Direct energy consumption by primary energy source
The group estimates that its direct energy consumption, comprising liquid fuel for our vehicle fleet and equipment, was approximately 1 600 000 litres. Accurate data is currently being calculated.
EN4 Indirect energy consumption by primary energy source
The group estimates that its annual electricity consumption was approximately 154 000 MW/hrs (assessed by converting monetary spend using a factor of R0,5752c per kW/h). A project is currently being scoped for the accurate reporting of electricity and other utilities.
EN5 Energy saved due to conservation and efficiency improvements
The group estimates that its lighting initiatives have resulted in a saving of 511 000 kW/hrs during the financial year, and that a further annualised saving of 309 000 kW/hrs is anticipated in the new financial year.
EN6 Initiatives to provide energy-efficient or renewable energy-based products and services, and reductions in energy requirements as a result of these initiatives
General commentary on some of the group’s energy efficiency initiatives is provided in the environmental performance review, under the services section. The group does not currently have full quantitative data on all reductions achieved.EN7 Initiatives to reduce indirect energy
consumption and reductions achieved
Total water use
EN8 Total water withdrawal by source While the group recognises that water availability and quality is an increasing challenge in the region, it is not a significant user of water. At its head office and distribution facilities approximately 35 000 kilolitres was used this year. Store consumption is currently not monitored, but plans are in place to do so in future.
EN9 Water sources significantly affected by withdrawal of water
Due to the nature of our core business, the group does not see this issue as being sufficiently material for reporting purposes.
EN10 Percentage and total volume of water recycled and reused
The group does not reuse or recycle water. An overview of the group’s approach to managing water is provided in the environmental performance review. Water is primarily consumed for personal and hygiene purposes. Regular maintenance ensures that there is minimal wastage.
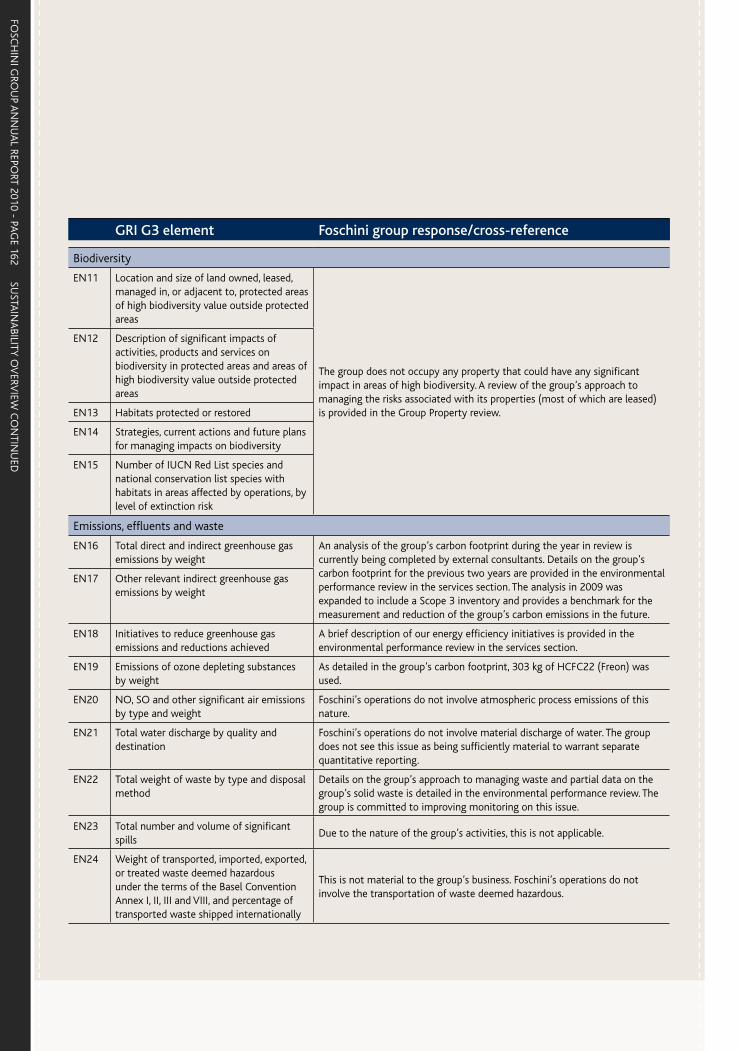
FOSC
HIN
I GRO
UP A
NN
UA
L REPORT 2010 - PA
GE 162
SUSTA
INA
BILITY OV
ERVIEW
CO
NTIN
UED
GRI G3 element Foschini group response/cross-reference
Biodiversity
EN11 Location and size of land owned, leased, managed in, or adjacent to, protected areas of high biodiversity value outside protected areas
The group does not occupy any property that could have any significant impact in areas of high biodiversity. A review of the group’s approach to managing the risks associated with its properties (most of which are leased) is provided in the Group Property review.
EN12 Description of significant impacts of activities, products and services on biodiversity in protected areas and areas of high biodiversity value outside protected areas
EN13 Habitats protected or restored
EN14 Strategies, current actions and future plans for managing impacts on biodiversity
EN15 Number of IUCN Red List species and national conservation list species with habitats in areas affected by operations, by level of extinction risk
Emissions, effluents and waste
EN16 Total direct and indirect greenhouse gas emissions by weight
An analysis of the group’s carbon footprint during the year in review is currently being completed by external consultants. Details on the group’s carbon footprint for the previous two years are provided in the environmental performance review in the services section. The analysis in 2009 was expanded to include a Scope 3 inventory and provides a benchmark for the measurement and reduction of the group’s carbon emissions in the future.
EN17 Other relevant indirect greenhouse gas emissions by weight
EN18 Initiatives to reduce greenhouse gas emissions and reductions achieved
A brief description of our energy efficiency initiatives is provided in the environmental performance review in the services section.
EN19 Emissions of ozone depleting substances by weight
As detailed in the group’s carbon footprint, 303 kg of HCFC22 (Freon) was used.
EN20 NO, SO and other significant air emissions by type and weight
Foschini’s operations do not involve atmospheric process emissions of this nature.
EN21 Total water discharge by quality and destination
Foschini’s operations do not involve material discharge of water. The group does not see this issue as being sufficiently material to warrant separate quantitative reporting.
EN22 Total weight of waste by type and disposal method
Details on the group’s approach to managing waste and partial data on the group’s solid waste is detailed in the environmental performance review. The group is committed to improving monitoring on this issue.
EN23 Total number and volume of significant spills
Due to the nature of the group’s activities, this is not applicable.
EN24 Weight of transported, imported, exported, or treated waste deemed hazardous under the terms of the Basel Convention Annex I, II, III and VIII, and percentage of transported waste shipped internationally
This is not material to the group’s business. Foschini’s operations do not involve the transportation of waste deemed hazardous.

FOSC
HIN
I GRO
UP A
NN
UA
L REPORT 2010 - PA
GE 163
SUSTAINABILITY OVERVIEW
GRI G3 element Foschini group response/cross-reference
EN25 Identity, size, protected status, and biodiversity value of water bodies and related habitats significantly affected by the reporting organisation’s discharges of water and run-off
This is not material to the group’s business. Foschini’s operations do not involve material discharge of water and run-off to surrounding habitats.
Products and services
EN26 Initiatives to mitigate environmental impacts of products and services, and extent of impact mitigation
Efforts in this regard are currently limited (for example, watch batteries are environmentally disposed of in the workshop). The group plans to focus more on developing appropriate initiatives as part of its longer-term sustainability strategy that is being developed and in line with new legislative requirements.
EN27 Percentage of products sold and their packaging materials that are reclaimed by category
The group does not see this issue as being sufficiently material to its core business.
Compliance
EN28 Monetary value of significant fines and total number of non-monetary sanctions for non-compliance with environmental laws and regulations
No fines were incurred this year for non-compliance with environmental laws.
Transport
EN29 Significant environmental impacts of transporting products and other goods and materials used for the organisation’s operations, and transporting members of the workforce
Merchandise transport is managed by outsourced professionals who ensure that their vehicles perform at optimal efficiency.
Overall
EN30 Total environmental protection expenditures and investments by type
The group does not see this issue as being sufficiently material to its core business to warrant separate quantitative reporting.

FOSC
HIN
I GRO
UP A
NN
UA
L REPORT 2010 - PA
GE 164
SUSTA
INA
BILITY OV
ERVIEW
CO
NTIN
UED
GRI G3 element Foschini group response/cross-reference
SOCIAL including policies, management systems, management approach and performance relating to the following indicators
Labour practices and decent work
DMA Disclosure on management approach A broad outline of the group’s management approach on its human resources performance is provided in the Human Resources review.
LA1 Total workforce by employment type, employment contract and region
This is addressed in the Human Resources review.
LA2 Total number and rate of employee turnover by age group, gender and region
The rate of employee turnover is provided in the Human Resources review.
LA3 Benefits provided to full-time employees that are not provided to temporary or part-time employees, by major operations
Most of the employee benefit schemes provided to the group’s full-time employees entail longer-term commitments and processes that are only suitable for full-time permanent employees. All permanent staff of the group’s wholly-owned subsidiaries are required to join the Foschini Group Retirement Fund. Employees of RCS receive comparable benefits from the Liberty Life Provident Fund. Membership of the Foschini group in-house, subsidised medical scheme is voluntary except for senior employees. All permanent staff of RCS and its subsidiaries are required to become members of a medical plan of their choice offered by Discovery Health. Further benefits offered to the group’s permanent employees include low-interest loans to assist with tertiary education costs for their children and interest-bearing loans for personal use. Further information on employee benefit schemes are provided in the Human Resources review.
LA4 Percentage of employees covered by collective bargaining agreements
There is no broad collective bargaining agreement within the retail sector. Within Foschini, 8% of our employees are unionised. Union negotiations take place on a decentralised basis within the different countries and legal entities.
LA5 Minimum notice period(s) regarding operational changes, including whether it is specified in collective agreements
Foschini ensures full compliance with the requirements of the Basic Conditions of Employment Act and the Labour Relations Act. There is no collective agreement within the group.
LA6 Percentage of total workforce represented in formal joint management–worker health and safety committees that help monitor and advise on occupational health and safety programmes
The group’s management of occupational health and safety is overseen throughout the organisation, at all levels. Members of staff work with management on various initiatives associated with the ongoing monitoring and enforcement of health and safety in the workplace. At every site there are employees trained in providing first aid to colleagues in need. Further details on our OHS activities are provided in the Human Resources review.
LA7 Rates of injury, occupational diseases, lost days, and absenteeism, and number of work-related fatalities by region
This is addressed in the occupational health and safety section of the Human Resources review.
LA8 Education, training, counselling, prevention and risk-control programmes in place regarding serious diseases
This is addressed in the occupational health and safety section of the Human Resources review.
LA9 Health and safety topics covered in formal agreements with trade unions
Health and safety topics are not specifically covered in formal agreements with trade unions.
LA10 Average hours of training per year per employee by employee category
Foschini reports quantitative data on training interventions, but not specifically on average of hours of training per year per employee by employee category.

FOSC
HIN
I GRO
UP A
NN
UA
L REPORT 2010 - PA
GE 165
SUSTAINABILITY OVERVIEW
GRI G3 element Foschini group response/cross-reference
LA11 Programmes for skills management and lifelong learning that support the continued employability of employees and assist them in managing career endings
The group implements numerous talent development and staff training initiatives aimed at ensuring the personal growth and skills development of each of its employees, and consequently their ability to manage their longer-term personal and professional prospects. Retirement planning seminars are provided to those head office staff who are approaching retirement age.
LA12 Percentage of employees receiving regular performance and career development reviews
Performance review conversations occur biannually; in the year under review, 80% of all group employees had performance reviews and career development conversations. Further information is provided in the Human Resources review.
LA13 Composition of governance bodies and breakdown of employees per category according to gender, age group, minority group membership and other indicators of diversity
A profile of the group’s workplace profile against the 2011 employment equity plan for the group is provided in the Human Resources review. The composition of the group’s transformation committee and other governance bodies is included in the Corporate Governance review.
LA14 Ratio of basic salary of men to women by employee category
There are no significant material differences between male and female salary rates.
Human rights
DMA Disclosure on management approach In terms of internal employment practices, a general overview of possible risk areas relating to human rights issues, and the group’s approach to managing these issues, is provided in the Human Resources review. In terms of ensuring responsible management of human rights issues in the supply chain, the Group Merchandise Procurement (GMP) division has implemented a revised auditing system to ensure compliance. Further details are provided in the GMP review.
HR1 Percentage and total number of significant investment agreements that include human rights clauses or that have undergone human rights screening
The group does not see this issue as being sufficiently material to its core business.
HR2 Percentage of significant suppliers and contractors that have undergone screening on human rights and actions taken
General commentary on the group’s approach to managing suppliers is provided in the Group Merchandise Procurement review.
HR3 Total hours of employee training on policies and procedures concerning aspects of human rights that are relevant to operations, including the percentage of employees trained
Due to the nature of its business the group does not provide employee training specifically on human rights issues other than in terms of relevant training and awareness programmes relating to non-discrimination and labour issues.
HR4 Total number of incidents of discrimination and actions taken
Issues relating to workplace disputes and referrals to the Commission for Conciliation, Mediation and Arbitration (CCMA) have increased from 143 referrals in 2008 to 172 referrals in 2009. These low levels of referrals can be attributed to fair processes and procedures in the workplace.
HR5 Operations identified in which the right to exercise freedom of association and collective bargaining may be at significant risk, and actions taken to support these rights
The group does not believe that the right to exercise freedom of association and collective bargaining is at risk at any of its operations. The group’s operations are based in South Africa, Namibia, Swaziland and Botswana, all of which legally recognise the right to collective bargaining.
HR6 Operations identified as having significant risk for incidents of child labour and measures taken to contribute to the elimination of child labour
This issue is broadly addressed in the general review of the group’s approach to managing human rights issues in the supply chain, provided in the Group Merchandise Procurement review.
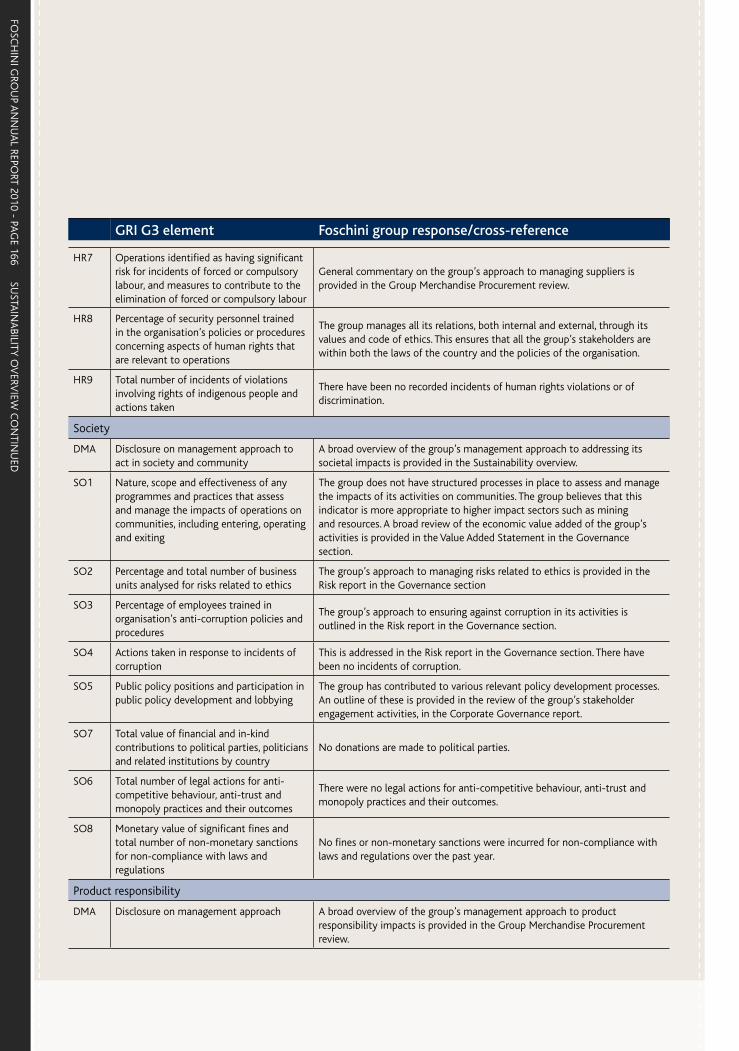
FOSC
HIN
I GRO
UP A
NN
UA
L REPORT 2010 - PA
GE 166
SUSTA
INA
BILITY OV
ERVIEW
CO
NTIN
UED
GRI G3 element Foschini group response/cross-reference
HR7 Operations identified as having significant risk for incidents of forced or compulsory labour, and measures to contribute to the elimination of forced or compulsory labour
General commentary on the group’s approach to managing suppliers is provided in the Group Merchandise Procurement review.
HR8 Percentage of security personnel trained in the organisation’s policies or procedures concerning aspects of human rights that are relevant to operations
The group manages all its relations, both internal and external, through its values and code of ethics. This ensures that all the group’s stakeholders are within both the laws of the country and the policies of the organisation.
HR9 Total number of incidents of violations involving rights of indigenous people and actions taken
There have been no recorded incidents of human rights violations or of discrimination.
Society
DMA Disclosure on management approach to act in society and community
A broad overview of the group’s management approach to addressing its societal impacts is provided in the Sustainability overview.
SO1 Nature, scope and effectiveness of any programmes and practices that assess and manage the impacts of operations on communities, including entering, operating and exiting
The group does not have structured processes in place to assess and manage the impacts of its activities on communities. The group believes that this indicator is more appropriate to higher impact sectors such as mining and resources. A broad review of the economic value added of the group’s activities is provided in the Value Added Statement in the Governance section.
SO2 Percentage and total number of business units analysed for risks related to ethics
The group’s approach to managing risks related to ethics is provided in the Risk report in the Governance section
SO3 Percentage of employees trained in organisation’s anti-corruption policies and procedures
The group’s approach to ensuring against corruption in its activities is outlined in the Risk report in the Governance section.
SO4 Actions taken in response to incidents of corruption
This is addressed in the Risk report in the Governance section. There have been no incidents of corruption.
SO5 Public policy positions and participation in public policy development and lobbying
The group has contributed to various relevant policy development processes. An outline of these is provided in the review of the group’s stakeholder engagement activities, in the Corporate Governance report.
SO7 Total value of financial and in-kind contributions to political parties, politicians and related institutions by country
No donations are made to political parties.
SO6 Total number of legal actions for anti-competitive behaviour, anti-trust and monopoly practices and their outcomes
There were no legal actions for anti-competitive behaviour, anti-trust and monopoly practices and their outcomes.
SO8 Monetary value of significant fines and total number of non-monetary sanctions for non-compliance with laws and regulations
No fines or non-monetary sanctions were incurred for non-compliance with laws and regulations over the past year.
Product responsibility
DMA Disclosure on management approach A broad overview of the group’s management approach to product responsibility impacts is provided in the Group Merchandise Procurement review.

FOSC
HIN
I GRO
UP A
NN
UA
L REPORT 2010 - PA
GE 167
GRI G3 element Foschini group response/cross-reference
PR1 Life cycle stages in which health and safety impacts of products and services are assessed for improvement and percentage of significant products and services categories subject to such procedures
The group does not currently undertake any formal assessments of the health and safety impacts of its products through their life cycle. The group has not had any requests from stakeholders for such assessments and does not believe this to be sufficiently material due to the nature of its core business. The group is not directly involved in the design and development of new products.
PR2 Total number of incidents of non-compliance with regulations and voluntary codes concerning health and safety impacts of products and services during their life cycle, by type of outcomes
There were no incidents of non-compliance with regulations and voluntary codes concerning health and safety impacts of products and services during their life cycle.
PR3 Type of product and service information required by procedures and percentage of significant products and services subject to such information requirements
In terms of product labelling the group ensures compliance with relevant consumer protection legislation. Significant changes are anticipated in relation to the Consumer Protection Act, as described in the legal compliance review in the Governance section.
PR4 Total number of incidents of non-compliance with regulations and voluntary codes concerning product and service information and labelling, by type of outcomes
No such incidents have occurred during the review period.
PR5 Practices related to customer satisfaction, including results of surveys measuring customer satisfaction
The group monitors issues raised by customers via its customer services call centre, its websites and by being linked to external customer service websites. In addition, the group participates in the annual Orange index, which benchmarks service excellence. This has reflected a significant improvement compared to the previous year.
PR6 Programmes for adherence to laws, standards and voluntary codes related to marketing communications, including advertising, promotion and sponsorship
The group is a member of the Direct Marketing Association and is fully compliant with their code of conduct. The group is in the process of ensuring full compliance with the Consumer Protection Act and will be compliant by the effective date. The group is also compliant with the requirements of the National Credit Act.
PR7 Total number of incidents of non-compliance with regulations and voluntary codes concerning marketing communications, including advertising, promotion and sponsorship by type of outcomes
No incidents of non-compliance with regulations and voluntary codes concerning marketing communications, including advertising, promotion and sponsorship by type of outcomes have been noted.
PR8 Total number of substantiated complaints regarding breaches of customer privacy and losses of customer data
No substantiated complaints regarding breaches of customer privacy and losses of customer data have been noted.
PR9 Monetary value of significant fines for non-compliance with laws and regulations concerning the provision and use of products and services
No fines were incurred for non-compliance with laws and regulations concerning the provision and use of products and services during the period under review.
SUSTAINABILITY OVERVIEW

FOSC
HIN
I GRO
UP A
NN
UA
L REPORT 2010 - PA
GE 168
VALU
E AD
DED
STATEMEN
T
VALUE ADDED STATEMENTfor the years ended 31 March
Note2010
Rm %2009
Rm %
Retail turnover 8 605,2 8 089,6
Dividends received 13,8 19,1
Paid to suppliers for goods and services (4 990,1) (4 626,5)
Value added 3 628,9 100,0 3 482,2 100,0
Applied as follows:
Employees
Remuneration to employees 1 376,9 37,9 1 222,0 35,1
Providers of capital
To lenders as finance charges 261,5 7,2 249,8 7,2
To shareholders as dividends 692,6 19,1 692,6 19,9
Taxation
Taxation 544,7 15,0 557,0 16,0
Reinvested
Reinvested in the group to finance future expansion and growth 1 753,2 20,8 760,8 21,8
Employment of value added 3 628,9 100,0 3 482,2 100,0
Notes to the Value Added Statement
1. Reinvested in the group to finance future expansion and growth
Depreciation and amortisation 264,2 7,3 231,1 6,6
Deferred taxation 8,5 0,2 (7,4) (0,2)
Retained income 480,5 13,3 537,1 15,4
753,2 20,8 760,8 21,8
2. State taxes
Direct taxation as above 544,7 557,0
Net value added taxation 323,7 251,2
Employees taxation 124,5 109,1
Channelled through the group 992,9 917,3
2010 %
2009 %
Employees 37,9 35,1
Reinvested 20,8 21,8
Taxation 15,0 16,0
Providers of capital 26,3 27,1
2010
37,9%
20,8%
15,0%
26,3%
2009
35,1%
21,8%
16,0%
27,1%

FOSC
HIN
I GRO
UP A
NN
UA
L REPORT 2010 - PA
GE 170
AN
NU
AL FIN
AN
CIA
L STATEMEN
TS

FOSC
HIN
I GRO
UP A
NN
UA
L REPORT 2010 - PA
GE 171
APPROVALSDirectors’ Approval 172
Company Secretary’s Certificate 172
Independent Auditor’s Report 173
Directors’ Report 174
GROUP AFSGroup Statement of Financial Position 176
Group Income Statement 177
Group Statement of Comprehensive Income 178
Group Statement of Changes in Equity 179
Group Cash Flow Statement 180
Group Segmental Analysis 181
Notes to the Financial Statements 182
COMPANY AFSStatement of Financial Position 224
Income Statement 225
Statement of Comprehensive Income 225
Statement of Changes in Equity 225
Appendix 1: Subsidiary Companies 226
Appendix 2: Related Party Information 227

FOSC
HIN
I GRO
UP A
NN
UA
L REPORT 2010 - PA
GE 172
DIREC
TORS’ A
PPROVA
L AN
D C
OM
PAN
Y SECRETA
RY’S CERTIFIC
ATE
DIRECTORS’ APPROVAL AND COMPANY SECRETARY’S CERTIFICATEfor the year ended 31 March 2010
DIRECTORS’ RESPONSIBILITY FOR AND APPROVAL OF THE GROUP ANNUAL FINANCIAL STATEMENTSThe board of directors (the board) is responsible for the content and integrity of the group annual financial statements and related information included in this report. It is their responsibility to ensure that the annual financial statements fairly present the state of affairs of the company and the group as at the end of the financial year and the results of their operations and cash flows for the financial year, in conformity with International Financial Reporting Standards. The group’s external auditors are engaged to express an independent opinion on the group annual financial statements.
The group annual financial statements are prepared in accordance with International Financial Reporting Standards. The accounting policies, unless otherwise stated, are consistently applied and supported by reasonable and prudent judgements and estimates.
The directors acknowledge that they are ultimately responsible for the system of internal control and review its operation primarily through the audit and risk committees and various other management systems.
A strong control environment is maintained by applying a risk-based system of internal accounting and administrative controls and by ensuring adequate segregation of duties. In addition, Group Audit Services (internal audit) conduct specific risk-based audits and co-ordinate audit coverage with the external auditors.
The directors are of the opinion, based on the information and explanations given by management, the internal auditors and the external auditors, that the system of internal control provides reasonable assurance that the financial records may be relied on for the preparation of the group annual financial statements. However, any system of internal control can provide only reasonable, and not absolute, assurance against material misstatement or loss.
The directors have every reason to believe that the group will continue as a going concern for the foreseeable future, and the annual financial statements have been prepared on the basis of this assumption.
The annual financial statements and group annual financial statements set out on pages 174 to 227 were approved by the board on 21 June 2010 and are signed on its behalf by:
D M Nurek A D MurrayChairman Chief Executive Officer
COMPANY SECRETARY’S CERTIFICATEI certify that Foschini Limited has lodged with the Registrar of Companies all returns as required by a public company in terms of the Companies Act No. 61 of 1973, as amended, and that all such returns are, to the best of my knowledge and belief, true, correct and up to date.
D SheardSecretary
21 June 2010

FOSC
HIN
I GRO
UP A
NN
UA
L REPORT 2010 - PA
GE 173
INDEPENDENT AUDITOR’S REPORTfor the year ended 31 March 2010
TO THE MEMBERS OF FOSCHINI LIMITEDWe have audited the annual financial statements and the group annual financial statements of Foschini Limited, which comprise the statements of financial position at 31 March 2010, and the income statements, the statements of comprehensive income, the statements of changes in equity and cash flow statements for the year then ended, and the notes to the financial statements, which include a summary of significant accounting policies and other explanatory notes and the directors’ report as set out on pages 174 to 227.
DIRECTORS’ RESPONSIBILITY FOR THE FINANCIAL STATEMENTSThe company’s directors are responsible for the preparation and fair presentation of these financial statements in accordance with International Financial Reporting Standards and in the manner required by the Companies Act of South Africa. This responsibility includes: designing, implementing and maintaining internal control relevant to the preparation and fair presentation of financial statements that are free from material misstatement, whether due to fraud or error; selecting and applying appropriate accounting policies; and making accounting estimates that are reasonable in the circumstances.
AUDITOR’S RESPONSIBILITYOur responsibility is to express an opinion on these financial statements based on our audit. We conducted our audit in accordance with International Standards on Auditing. Those standards require that we comply with ethical requirements and plan and perform the audit to obtain reasonable assurance whether the financial statements are free from misstatement.
An audit involves performing procedures to obtain audit evidence about the amounts and disclosures in the financial statements. The procedures selected depend on the auditor’s judgement, including the assessment of the risks of material misstatement of the financial statements, whether due to fraud or error. In making those risk assessments, the auditor considers internal control relevant to the entity’s preparation and fair presentation of the financial statements in order to design audit procedures that are appropriate in the circumstances, but not for the purpose of expressing an opinion on the effectiveness of the entity’s internal control.
An audit also includes evaluating the appropriateness of accounting policies used and the reasonableness of accounting estimates made by management, as well as evaluating the overall presentation of the financial statements.
We believe that the audit evidence we have obtained is sufficient and appropriate to provide a basis for our audit opinion.
OPINIONIn our opinion, the financial statements present fairly, in all material respects, the consolidated and separate financial position of Foschini Limited at 31 March 2010, and its
consolidated and separate financial performance and consolidated and separate cash flows for the year then ended in accordance with International Financial Reporting Standards, and in the manner required by the Companies Act of South Africa.
KPMG Inc.Registered AuditorPer Henry du PlessisChartered Accountant (SA)Director8th Floor MSC House1 Mediterranean StreetCape Town800121 June 2010

FOSC
HIN
I GRO
UP A
NN
UA
L REPORT 2010 - PA
GE 174
DIREC
TORS’ REPO
RT
DIRECTORS’ REPORTfor the year ended 31 March 2010
NATURE OF BUSINESSFoschini Limited is an investment holding company whose subsidiaries, through their retail operating divisions – Foschini, branded as Foschini, donna-claire, fashíonexpress and Luella; Markham; exact!; the Sports division, branded as sportscene, Totalsports and DueSouth; the Jewellery division, branded as American Swiss, Matrix and Sterns; @home, branded as @home and @homelivingspace; TFG Apparel Supply Company; Group Merchandise Procurement; and FG Financial Services – retail clothing, jewellery, accessories, cosmetics, sporting and outdoor apparel and equipment and homeware and furniture to the broad, middle-income group throughout southern Africa.
The RCS Group is an operationally independent consumer finance business that provides a broad range of financial services under its own brand in South Africa, Namibia and Botswana.
The group operates in the retail and financial services segments, almost entirely within the South African Common Monetary Area.
Retail turnover emanating from Swaziland and Botswana accounts for 0,6% of the group’s turnover.
GENERAL REVIEWThe financial results are reflected in the annual financial statements on pages 174 to 227.
SHARE CAPITALThe group’s share buy-back programme commenced at the end of May 2001. At 31 March 2010, 24,0 million shares are held by a subsidiary, and a further 7,5 million by the group’s share incentive trust. These shares, representing 13,1% of the company’s issued share capital are treated as treasury shares and have been eliminated on consolidation. Further details of the authorised and issued share capital are reflected in note 13.
DIVIDENDSInterim OrdinaryThe directors declared an interim ordinary dividend of 118 cents per ordinary share, which was paid on 11 January 2010 to ordinary shareholders recorded in the books of the company at the close of business on Friday, 8 January 2010.
Final OrdinaryThe directors declared a final ordinary dividend of 170 cents per ordinary share payable on Monday, 12 July 2010 to ordinary shareholders recorded in the books of the company at the close of business on Friday, 9 July 2010.
PreferenceThe company paid the following dividends to holders of 6,5% cumulative preference shares:
30 September 2009 – R13 000(29 September 2008 – R13 000)29 March 2010 – R13 000 (30 March 2009 – R13 000).
DIRECTORSThe names of the company’s directors appear on pages 10 to 13 of this report.
The following changes took place during the current year:
D M Nurek (appointed as chairman 1 April 2009)
P S Meiring (appointed 1 April 2009)
The following directors retire by rotation in terms of the articles of association but, being eligible, offer themselves for re-election as directors:
A D Murray (executive)
S E Abrahams (independent non-executive)
M Lewis (non-executive)
W V Cuba (independent non-executive)
For details of directors’ interests in the company’s issued shares, refer to note 13.5. Details of directors’ remuneration are set out in note 35.
SECRETARYThe company secretary of Foschini Limited is Ms D Sheard. Her business and postal address appear on the inside back cover of this report.
AUDIT COMMITTEEThe directors confirm that the audit committee has addressed the specific responsibilities required in terms of section 270A of the Companies Act No. 61 of 1973. Further detail are contained within the Audit Committee report on page 136.
SUBSIDIARIESThe names of, and certain financial information relating to the company’s key subsidiaries appear on page 226.
EARNINGS OF SUBSIDIARIESThe total profits (losses) of consolidated subsidiaries are as follows:
2010 Rm
2009 Rm
Profits 1 033,2 1 037,3
Losses – –
Net consolidated profit after taxation 1 033,2 1 037,3
SPECIAL RESOLUTIONSOn 9 September 2009 shareholders renewed the approval, as a general authority, of the acquisition by the company or any of its subsidiaries of the issued ordinary shares of the company, valid until the next annual general meeting. At the next annual general meeting to be held on 1 September 2010 shareholders will be asked to renew this general authority, as set out in the Notice of Annual General Meeting.

FOSC
HIN
I GRO
UP A
NN
UA
L REPORT 2010 - PA
GE 175
No other special resolutions were passed during the year under review.
SPECIAL RESOLUTIONS PASSED BY SUBSIDIARY COMPANIESNo special resolutions of any significance were passed during the year under review.
STAFF SHARE INCENTIVE AND OPTION SCHEMESDetails are reflected in note 34.1.
SUBSEQUENT EVENTDetails are reflected in note 24.
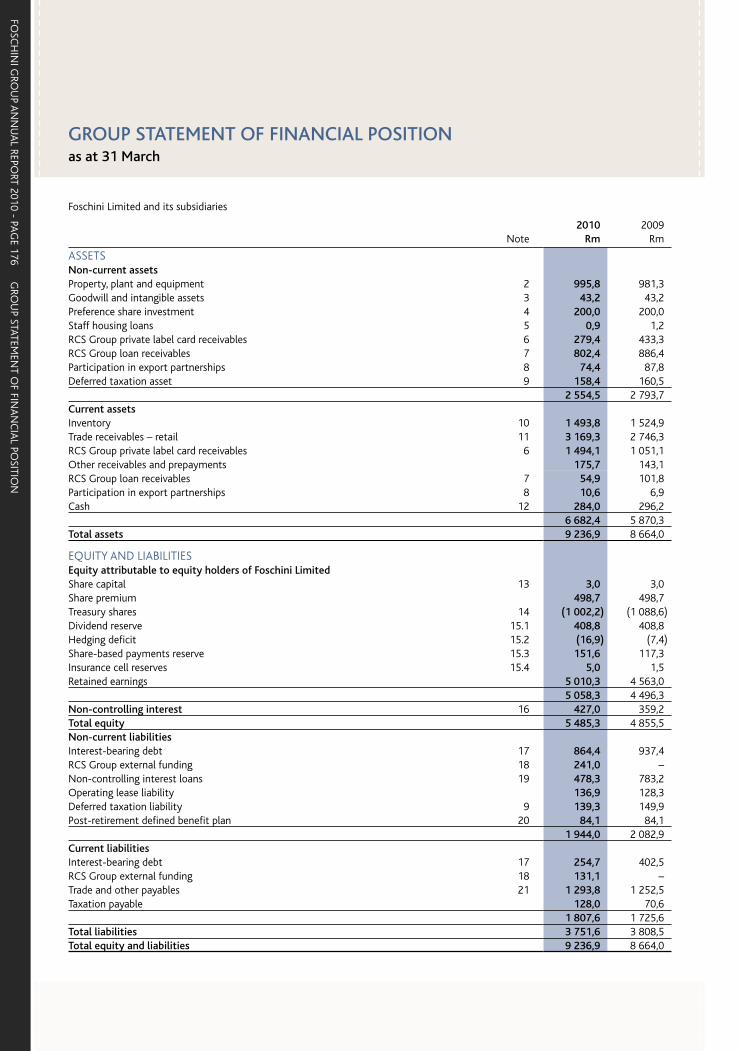
FOSC
HIN
I GRO
UP A
NN
UA
L REPORT 2010 - PA
GE 176
GRO
UP STATEM
ENT O
F FINA
NC
IAL PO
SITION
GROUP STATEMENT OF FINANCIAL POSITIONas at 31 March
Foschini Limited and its subsidiaries
Note 2010
Rm 2009
Rm
ASSETSNon-current assetsProperty, plant and equipment 2 995,8 981,3 Goodwill and intangible assets 3 43,2 43,2 Preference share investment 4 200,0 200,0 Staff housing loans 5 0,9 1,2 RCS Group private label card receivables 6 279,4 433,3 RCS Group loan receivables 7 802,4 886,4 Participation in export partnerships 8 74,4 87,8 Deferred taxation asset 9 158,4 160,5
2 554,5 2 793,7 Current assetsInventory 10 1 493,8 1 524,9 Trade receivables – retail 11 3 169,3 2 746,3 RCS Group private label card receivables 6 1 494,1 1 051,1 Other receivables and prepayments 175,7 143,1 RCS Group loan receivables 7 54,9 101,8 Participation in export partnerships 8 10,6 6,9 Cash 12 284,0 296,2
6 682,4 5 870,3 Total assets 9 236,9 8 664,0
EQUITY AND LIABILITIESEquity attributable to equity holders of Foschini LimitedShare capital 13 3,0 3,0 Share premium 498,7 498,7 Treasury shares 14 (1 002,2) (1 088,6)Dividend reserve 15.1 408,8 408,8 Hedging deficit 15.2 (16,9) (7,4)Share-based payments reserve 15.3 151,6 117,3 Insurance cell reserves 15.4 5,0 1,5 Retained earnings 5 010,3 4 563,0
5 058,3 4 496,3 Non-controlling interest 16 427,0 359,2 Total equity 5 485,3 4 855,5 Non-current liabilities Interest-bearing debt 17 864,4 937,4 RCS Group external funding 18 241,0 – Non-controlling interest loans 19 478,3 783,2 Operating lease liability 136,9 128,3 Deferred taxation liability 9 139,3 149,9 Post-retirement defined benefit plan 20 84,1 84,1
1 944,0 2 082,9 Current liabilitiesInterest-bearing debt 17 254,7 402,5 RCS Group external funding 18 131,1 –Trade and other payables 21 1 293,8 1 252,5 Taxation payable 128,0 70,6
1 807,6 1 725,6 Total liabilities 3 751,6 3 808,5 Total equity and liabilities 9 236,9 8 664,0
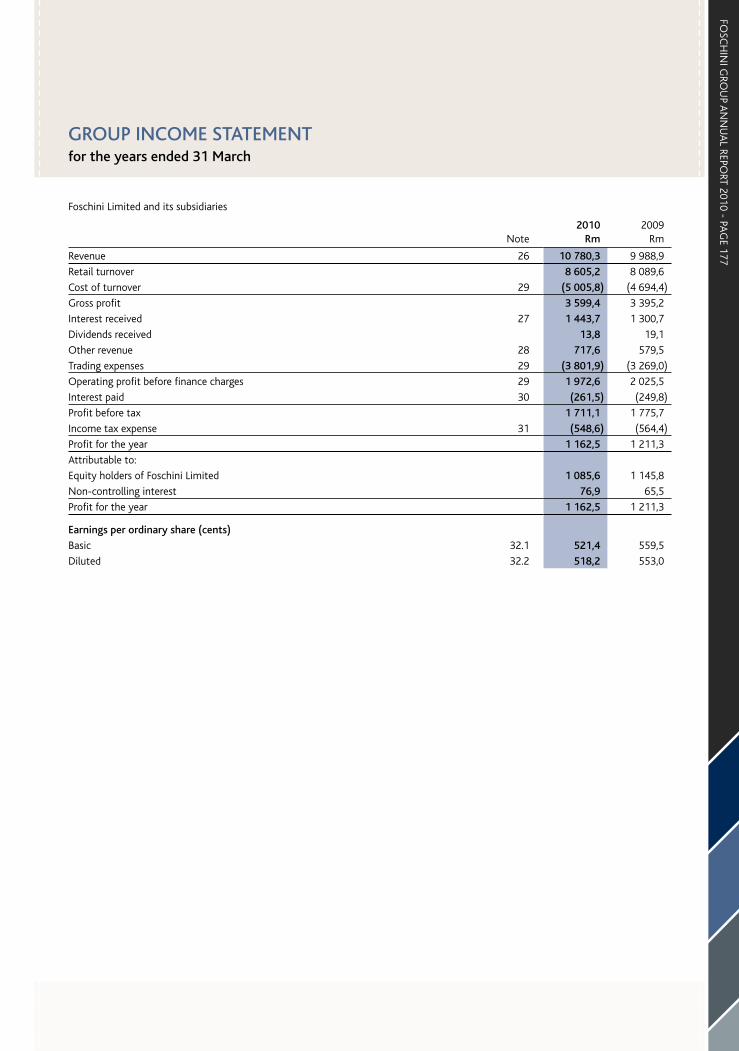
FOSC
HIN
I GRO
UP A
NN
UA
L REPORT 2010 - PA
GE 177
GROUP INCOME STATEMENTfor the years ended 31 March
Foschini Limited and its subsidiaries
Note2010
Rm2009
Rm
Revenue 26 10 780,3 9 988,9
Retail turnover 8 605,2 8 089,6
Cost of turnover 29 (5 005,8) (4 694,4)
Gross profit 3 599,4 3 395,2
Interest received 27 1 443,7 1 300,7
Dividends received 13,8 19,1
Other revenue 28 717,6 579,5
Trading expenses 29 (3 801,9) (3 269,0)
Operating profit before finance charges 29 1 972,6 2 025,5
Interest paid 30 (261,5) (249,8)
Profit before tax 1 711,1 1 775,7
Income tax expense 31 (548,6) (564,4)
Profit for the year 1 162,5 1 211,3
Attributable to:
Equity holders of Foschini Limited 1 085,6 1 145,8
Non-controlling interest 76,9 65,5
Profit for the year 1 162,5 1 211,3
Earnings per ordinary share (cents)
Basic 32.1 521,4 559,5
Diluted 32.2 518,2 553,0
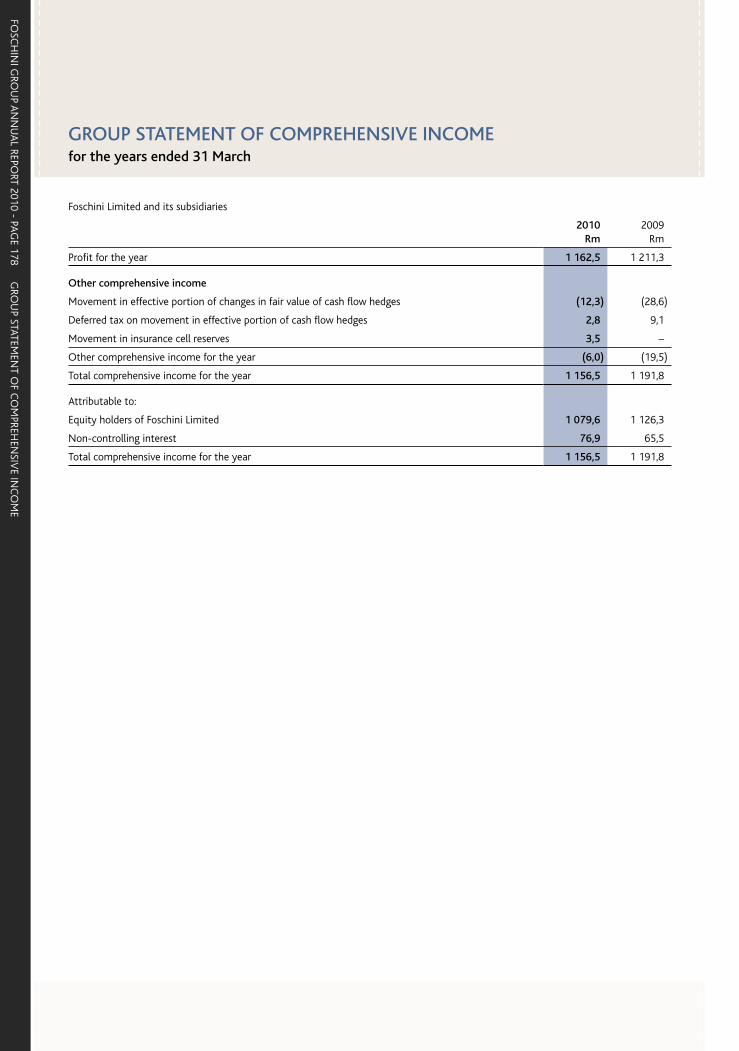
FOSC
HIN
I GRO
UP A
NN
UA
L REPORT 2010 - PA
GE 178
GRO
UP STATEM
ENT O
F CO
MPREH
ENSIV
E INC
OM
E
GROUP STATEMENT OF COMPREHENSIVE INCOME for the years ended 31 March
Foschini Limited and its subsidiaries
2010 Rm
2009 Rm
Profit for the year 1 162,5 1 211,3
Other comprehensive income
Movement in effective portion of changes in fair value of cash flow hedges (12,3) (28,6)
Deferred tax on movement in effective portion of cash flow hedges 2,8 9,1
Movement in insurance cell reserves 3,5 –
Other comprehensive income for the year (6,0) (19,5)
Total comprehensive income for the year 1 156,5 1 191,8
Attributable to:
Equity holders of Foschini Limited 1 079,6 1 126,3
Non-controlling interest 76,9 65,5
Total comprehensive income for the year 1 156,5 1 191,8

FOSC
HIN
I GRO
UP A
NN
UA
L REPORT 2010 - PA
GE 179
GROUP STATEMENT OF CHANGES IN EQUITYfor the years ended 31 March
Foschini Limited and its subsidiaries
Share capital
Rm
Share premium
Rm
Treasury shares
Rm
Other reserves
Rm
Retained earnings
Rm
Attribut-able
to equity holders of
Foschini Limited
Rm
Non-controlling
interestRm
Total equity
Rm
Equity at 31 March 2008 3,0 498,7 (1 230,2) 514,0 4 059,7 3 845,2 290,9 4 136,1
Total comprehensive income for the year (19,5) 1 145,8 1 126,3 65,5 1 191,8
Profit for the year 1 145,8 1 145,8 65,5 1 211,3
Other comprehensive income
Movement in effective portion of changes in fair value of cash flow hedges (28,6) (28,6) (28,6)
Deferred tax on movement in effective portion of cash flow hedges 9,1 9,1 9,1
Contributions by and distributions to owners
Change in degree of control – 3,4 3,4
Share-based payments reserve movements 25,7 25,7 25,7
Transfer from dividend reserve (408,8) 408,8 – –
Dividends paid (589,2) (589,2) (0,6) (589,8)
Transfer to dividend reserve 408,8 (408,8) – –
Proceeds on delivery of shares by share trust 88,3 88,3 88,3
Delivery of shares by share trust 141,6 (141,6) – –
Equity at 31 March 2009 3,0 498,7 (1 088,6) 520,2 4 563,0 4 496,3 359,2 4 855,5
Total comprehensive income for the year (6,0) 1 085,6 1 079,6 76,9 1 156,5
Profit for the year 1 085,6 1 085,6 76,9 1 162,5
Other comprehensive income
Movement in effective portion of changes in fair value of cash flow hedges (12,3) (12,3) (12,3)
Deferred tax on movement in effective portion of cash flow hedges 2,8 2,8 2,8
Movement in insurance cell reserves 3,5 3,5 3,5
Contributions by and distributions to owners
Share-based payments reserve movements 34,3 34,3 34,3
Transfer from dividend reserve (408,8) 408,8 – –
Dividends paid (599,1) (599,1) (9,1) (608,2)
Transfer to dividend reserve 408,8 (408,8) – –
Proceeds on delivery of shares by share trust 47,2 47,2 47,2
Delivery of shares by share trust 86,4 (86,4) – –
Equity at 31 March 2010 3,0 498,7 (1 002,2) 548,5 5 010,3 5 058,3 427,0 5 485,3
Dividend per ordinary share (cents) Note 2010 2009
Interim 118,0 118,0
Final 15.1 170,0 170,0
Total 288,0 288,0
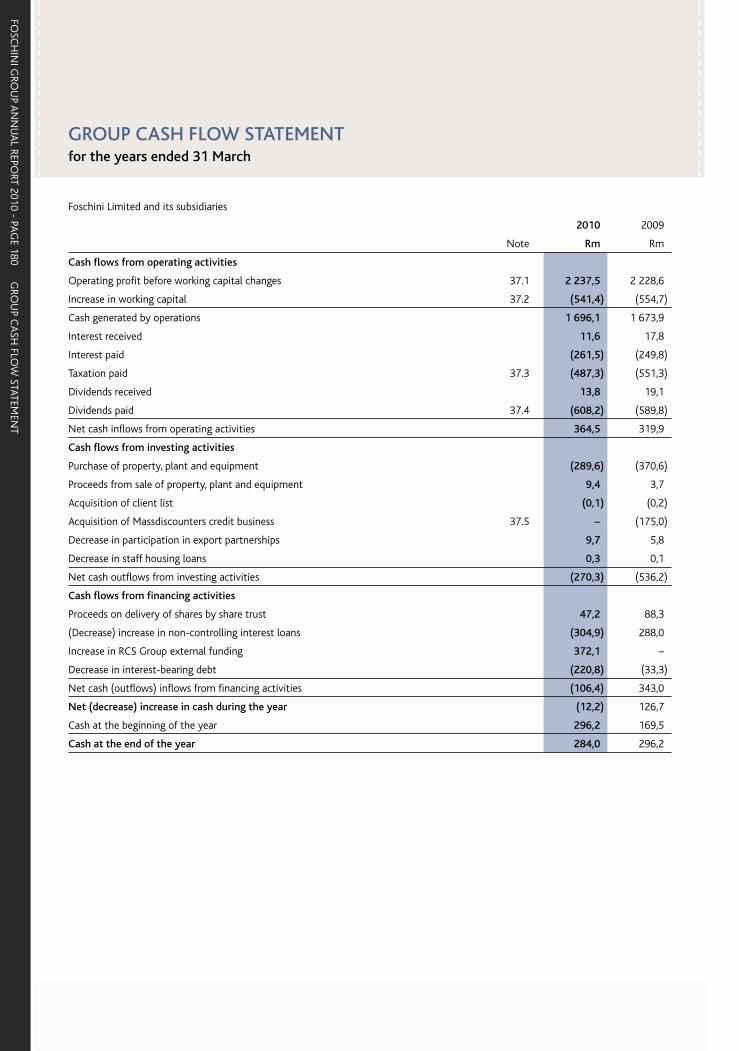
FOSC
HIN
I GRO
UP A
NN
UA
L REPORT 2010 - PA
GE 180
GRO
UP C
ASH
FLOW
STATEMEN
T
GROUP CASH FLOW STATEMENTfor the years ended 31 March
Foschini Limited and its subsidiaries
2010 2009
Note Rm Rm
Cash flows from operating activities
Operating profit before working capital changes 37.1 2 237,5 2 228,6
Increase in working capital 37.2 (541,4) (554,7)
Cash generated by operations 1 696,1 1 673,9
Interest received 11,6 17,8
Interest paid (261,5) (249,8)
Taxation paid 37.3 (487,3) (551,3)
Dividends received 13,8 19,1
Dividends paid 37.4 (608,2) (589,8)
Net cash inflows from operating activities 364,5 319,9
Cash flows from investing activities
Purchase of property, plant and equipment (289,6) (370,6)
Proceeds from sale of property, plant and equipment 9,4 3,7
Acquisition of client list (0,1) (0,2)
Acquisition of Massdiscounters credit business 37.5 – (175,0)
Decrease in participation in export partnerships 9,7 5,8
Decrease in staff housing loans 0,3 0,1
Net cash outflows from investing activities (270,3) (536,2)
Cash flows from financing activities
Proceeds on delivery of shares by share trust 47,2 88,3
(Decrease) increase in non-controlling interest loans (304,9) 288,0
Increase in RCS Group external funding 372,1 –
Decrease in interest-bearing debt (220,8) (33,3)
Net cash (outflows) inflows from financing activities (106,4) 343,0
Net (decrease) increase in cash during the year (12,2) 126,7
Cash at the beginning of the year 296,2 169,5
Cash at the end of the year 284,0 296,2

FOSC
HIN
I GRO
UP A
NN
UA
L REPORT 2010 - PA
GE 181
GROUP SEGMENTAL ANALYSISfor the years ended 31 March
Foschini Limited and its subsidiaries
Retail trading
divisionsFG Financial
Services
Central and shared
services Total Retail RCS Group Consolidated
2010 Rm Rm Rm Rm Rm Rm
External revenue* 8 605,2 1 031,0 30,0 9 666,2 1 114,1 10 780,3
External interest received – 636,4 8,9 645,3 798,4 1 443,7
External interest paid – – (155,8) (155,8) (105,7) (261,5)
Depreciation and amortisation – – (251,2) (251,2) (13,0) (264,2)
Group profit before tax 1 485,2 225,9 1 711,1
Segmental profit before tax 1 886,6 256,5 (620,4) 1 522,7 225,9 1 748,6
IFRS charges (37,5) – (37,5)
Capital expenditure 283,1 6,5 289,6
Segment assets 6 403,2 2 833,7 9 236,9
Segment liabilities 1 842,8 1 908,8 3 751,6
2009
External revenue* 8 089,6 843,9 36,2 8 969,7 1 019,2 9 988,9
External interest received – 526,1 9,6 535,7 765,0 1 300,7
External interest paid – – (158,5) (158,5) (91,3) (249,8)
Depreciation and amortisation – – (217,6) (217,6) (13,5) (231,1)
Group profit before tax 1 573,2 202,5 1 775,7
Segmental profit before tax 1 925,3 220,3 (553,1) 1 592,5 202,5 1 795,0
IFRS charges (19,3) – (19,3)
Capital expenditure 351,5 19,1 370,6
Segment assets 6 008,5 2 655,5 8 664,0
Segment liabilities 1 940,3 1 868,2 3 808,5
* Includes retail turnover, interest received, dividends received and other income
For management purposes, the following operating divisions have been identified as the group’s reportable segments:
• Retail trading divisions, comprising the @home division, exact!, the Foschini division, the Jewellery division, Markham and the Sports division, retail clothing, jewellery, cosmetics, cellphones, and homeware and furniture;
• FG Financial Services – manages the group’s in-store credit card programme, as well as handling the group’s financial service products such as Club and associated magazines as well as insurance products;
• Central and shared services provide services to the trading divisions, including but not limited to, finance and administration, internal audit, information technology, logistics, human resources, facilities management and real estate; and
• RCS Group, an operationally independent consumer finance business that provides a broad range of financial services under its own brand in South Africa, Namibia and Botswana.
The board, identified as the chief operating decision-maker, reviews the results of these business units on a monthly basis for the purpose of allocating resources and evaluating performance.
Performance is measured based on segmental profit before tax, as included in the monthly management report reviewed by the chief operating decision-maker.

FOSC
HIN
I GRO
UP A
NN
UA
L REPORT 2010 - PA
GE 182
NO
TES TO TH
E FINA
NC
IAL STATEM
ENTS
1. ACCOUNTING POLICIESReporting EntityFoschini Limited (the “company”) is a company domiciled in South Africa. The consolidated financial statements of the company as at and for the year ended 31 March 2010 comprise the company and its subsidiaries (together referred to as the “group”).
Basis of PreparationStatement of ComplianceThe consolidated financial statements are prepared in accordance with the group’s accounting policies, which comply with International Financial Reporting Standards (IFRS) and have been consistently applied with those adopted in the prior year, except as described in note 40.
The financial statements were authorised for issue by the directors on 21 June 2010.
Basis of MeasurementThe consolidated financial statements are prepared on the going concern and historical cost bases, except where otherwise stated.
Functional and Presentation Currency The consolidated financial statements are presented in South African Rands, which is the company’s functional currency, rounded to the nearest million, unless otherwise stated.
Significant JudgementsThe preparation of financial statements in conformity with IFRS requires management to make judgements, estimates and assumptions that affect the application of accounting policies and reported amounts of assets, liabilities, income and expenses. Actual results may differ from these estimates.
Estimates and underlying assumptions are reviewed on an ongoing basis. Revisions to accounting estimates are recognised in the period in which the estimates are revised and in any future periods affected.
Significant areas of estimation, uncertainty and critical judgements made in applying the group’s accounting policies, that potentially have a significant effect on the amounts recognised in the financial statements are as follows:
Trade receivables impairmentTrade receivables are disclosed net of any accumulated impairment losses. The calculation of the impairment amount is performed using the internationally-recognised Markov model. The Markov model uses delinquency roll rates on customer balances to determine the inherent bad debt in a debtors’ book. The directors believe that the application of the Markov model results in trade receivables balances being measured reliably.
Inventory valuationInventory is valued at the lower of cost and net realisable value. Historic information with respect to sales trends is
used to quantify the expected mark-down between the estimated net realisable value and the original cost.
OtherFurther estimates and judgements are made relating to residual values, useful lives and depreciation methods; goodwill impairment tests (refer note 3); estimating the fair value of share options and share appreciation rights granted (refer note 34.1); and pension fund and employee obligations (refer note 34).
Significant Accounting PoliciesThe principal accounting policies adopted are set out below:
Basis of ConsolidationThe consolidated financial statements incorporate the financial statements of the parent company, its subsidiaries, special-purpose entities (SPE) and associates. The financial statements of subsidiaries are prepared for the consistent reporting period using consistent accounting policies.
Subsidiaries are entities controlled by the group. Control exists when the group has the power, directly or indirectly, to govern the financial and operating policies of an entity so as to obtain benefits from its activities. In assessing control, potential voting rights that are presently exercisable are taken into account. The financial statements of subsidiaries are included in the consolidated financial statements from the date that control commences until the date that control ceases. Gains made on dilution of interest in subsidiaries are recognised in equity.
The group has established a SPE in the form of the share incentive trust. The group does not have any direct or indirect shareholding in the share incentive trust. A SPE is consolidated if, based on an evaluation of the substance of its relationship with the group and the SPE’s risks and rewards, the group concludes that it controls the SPE. The results of the share incentive trust that in substance is controlled by the group, are consolidated.
Associates are those entities in which the group has significant influence, but not control, over the financial and operating policies. Significant influence is presumed to exist when the group holds between 20 and 50 per cent of the voting power of another entity. Joint ventures are those entities over whose activities the group has joint control, established by contractual agreement and requiring unanimous consent for strategic financial and operating decisions. Associates and jointly controlled entities are accounted for using the equity method (equity accounted investees) and are initially recognised at cost. The group’s investment includes goodwill identified on acquisition, net of any accumulated impairment losses. The consolidated financial statements include the group’s share of the income and expenses and equity movements of equity accounted investees, after adjustments to align the accounting policies with those of the group, from the date that significant influence or joint control commences until the date that significant influence or joint control ceases. When the group’s share of losses exceeds its interest in an equity
NOTES TO THE FINANCIAL STATEMENTSfor the years ended 31 March
Foschini Limited and its subsidiaries
FOSC
HIN
I GRO
UP A
NN
UA
L REPORT 2010 - PA
GE 183
accounted investee, the carrying amount of that interest (including any long-term investments) is reduced to nil and the recognition of further losses is discontinued except to the extent that the group has an obligation or has made payments on behalf of the investee.
All intra-group transactions, intra-group balances and any unrealised gains and losses are eliminated on consolidation. Unrealised gains arising from transactions with equity accounted investees are eliminated against the investment to the extent of the group’s interest in the investee. Unrealised losses are eliminated in the same way as unrealised gains, but only to the extent that there is no evidence of impairment.
The financial statements of foreign operations are translated in terms of the accounting policy on foreign currencies.
The company’s financial statements measure investments in subsidiaries at cost.
Cost of TurnoverCost of turnover is calculated as the cost of goods sold, including all costs of purchase, costs of conversion, and other costs, including promotional costs incurred in bringing inventories to their present location and condition. Costs of purchase include royalties paid, import duties and other taxes and transport costs. Inventory write-downs are included in cost of sales when recognised.
DividendsDividends and the related secondary taxation on companies are accounted for in the period when the dividend is declared. Dividends declared on equity instruments after the reporting date, and the related secondary taxation on companies thereon, are accordingly not recognised as liabilities at the reporting date. Final dividends declared after the reporting date are however transferred to a dividend reserve.
Earnings Per ShareThe group presents basic and diluted earnings per share (EPS) data for its ordinary shares. Basic EPS is calculated by dividing the profit or loss attributable to ordinary shareholders of the company by the weighted average number of ordinary shares outstanding during the period. Diluted EPS is calculated by dividing the profit or loss attributable to ordinary shareholders by the weighted average number of ordinary shares outstanding, adjusted for the effects of all dilutive potential ordinary shares, which comprise share options granted to employees.
Employee BenefitsShort-term employee benefitsThe cost of all short-term employee benefits is recognised during the period in which the employee renders the related service. The accruals for employee entitlements to wages, salaries, annual and sick leave represent the amount which the group has a present obligation to pay as a result of employees’ services provided to the reporting date. The
short-term employee benefits have been calculated at undiscounted amounts based on current wage and salary rates.
Other long-term employee benefitsThese are employee benefits (other than post-employment benefits and termination benefits) that are not expected to be settled within 12 months after the end of the period in which the employees render the related service.
The group’s net obligation in respect of long-term employee benefits is the amount of future benefit that employees have earned in return for their service in the current and prior periods; that benefit is discounted using market-related rates and the fair value of any related assets is deducted. The calculation is performed using the Projected Unit Credit Method. Any actuarial gains or losses are recognised in profit or loss in the period in which they arise.
Post-employment benefitsThe company and its subsidiaries contribute to several defined benefit and defined contribution plans.
Defined contribution plansA defined contribution plan is a post-employment benefit plan under which an entity pays fixed contributions into a separate entity and will have no legal or constructive obligation to pay further amounts. Obligations for contributions to defined contribution pension, provident and retirement funds are recognised as an employee benefit expense in profit or loss when they are due. Prepaid contributions are recognised as an asset to the extent that a cash refund or a reduction in future payments is available.
Defined benefit plansA defined benefit plan is a post-employment plan other than a defined contribution plan. The group’s net obligation in respect of a defined benefit plan is calculated separately for each plan by estimating the amount of future benefit that employees have earned in return for their service in the current and prior periods; that benefit is discounted to determine its present value. Any unrecognised past service costs and the fair value of any plan assets are deducted.
The Projected Unit Credit Method is used to determine the present value of the defined benefit medical aid obligations and the related current service cost and where applicable, past service cost. This calculation is performed by a qualified actuary. When the calculation results in a benefit to the group, the recognised asset is limited to the total of any unrecognised past service costs and the present value of economic benefits available in the form of any future refunds from the plan or reductions in future contributions to the plan. An economic benefit is available to the group if it is realisable during the life of the plan or on settlement of the plan liabilities. When the benefits of a plan are improved, the portion of the increased benefit relating to the past service by employees is recognised in profit or loss on a straight-line basis over the average period until the benefits become vested. To the extent that the benefits are already vested, past service costs are recognised immediately in profit or loss.
NOTES TO THE FINANCIAL STATEMENTS CONTINUEDfor the years ended 31 March
Foschini Limited and its subsidiaries
NO
TES TO TH
E FINA
NC
IAL STATEM
ENTS C
ON
TINU
EDFO
SCH
INI G
ROU
P AN
NU
AL REPO
RT 2010 - PAG
E 184
1. ACCOUNTING POLICIES CONTINUEDActurial gains or losses in respect of defined benefit plans are recognised immediately in profit or loss.
Post-retirement medical aid benefitsWhere the company has an obligation to provide post-retirement medical aid benefits to employees, the company recognises the cost of these benefits in the year in which the employees render the services using the same accounting methodology described in respect of defined benefit plans above.
Share-based payment transactionsThe group grants share options and share appreciation rights (SARs) to certain employees under an employee share plan. The fair value of options and SARs granted to employees is recognised as an expense with a corresponding increase in equity. The fair value is measured at the grant date using a binomial option-pricing model and is spread over the option term. Costs incurred in administering the schemes are expensed as incurred.
ExpensesInterest expenseInterest expense comprises interest paid and payable on borrowings calculated using the effective interest method. All borrowing costs are recognised in profit or loss.
Operating lease paymentsLeases where the lessor retains the risks and rewards of ownership of the underlying asset are classified as operating leases.
Payments made under operating leases are recognised in profit or loss on a straight-line basis over the term of the lease.
Contingent rent is expensed as incurred.
Finance Lease PaymentsLeases that transfer substantially all the risks and rewards of ownership of the underlying asset to the group are classified as finance leases.
Assets acquired in terms of finance leases are capitalised at the lower of fair value and the present value of the minimum lease payments at inception of the lease, and depreciated over the estimated useful life of the asset. The capital element of future obligations under the leases is included as a liability in the statement of financial position.
Minimum lease payments are apportioned between the finance charge and the reduction of the outstanding liability. The finance charge is allocated to each period during the lease term so as to produce a constant periodic rate of interest on the remaining balance of the liability.
Financial InstrumentsA financial instrument is recognised when the group becomes a party to the contractual provisions of the instrument.
Financial assets are derecognised if the group’s contractual rights to the cash flows from the financial assets expire or if the group transfers the financial asset to another party without retaining control or substantially all risks and rewards of the asset. Regular way purchases and sales of financial assets are accounted for at trade date, being the date that the group commits itself to purchase or sell the asset. Financial liabilities are derecognised if the group’s obligations specified in the contract expire or are discharged or cancelled.
Non-derivative financial instrumentsNon-derivative financial instruments recognised in the statement of financial position include cash, trade and other receivables, staff housing loans, participation in export partnerships, investments, interest-bearing debt, non-controlling interest loans, RCS Group external funding, and trade and other payables.
Initial measurementFinancial instruments are initially recognised at fair value. For those instruments not measured at fair value through profit and loss, directly attributable transaction costs are included on initial measurement. Subsequent to initial recognition financial instruments are measured as described below.
CashCash comprises cash on hand and amounts held on deposit at financial institutions. Cash is measured at amortised cost, based on the relevant exchange rates at reporting date. Outstanding cheques are included in trade and other payables and added back to cash balances included in the statement of financial position.
Available-for-sale financial assetsListed investments classified as available-for-sale financial assets are carried at fair value, which is market value calculated by reference to stock exchange-quoted selling prices at the close of business on the reporting date, after taking into account any impairment losses. Unlisted investments are shown at fair value, which is determined by the directors using appropriate valuation bases (after taking into account any impairment losses), unless their fair value cannot be reliably determined, in which case they are shown at cost less accumulated impairment losses. Currently the group does not have any available-for-sale financial assets.
Loans and receivablesThe preference share investment, staff housing loans, RCS Group loan receivables, RCS Group private label card receivables, trade receivables – retail and participation in export partnerships, are classified as loans and receivables and are carried at amortised cost using the effective interest method, less any accumulated impairment losses. Amortised cost for the group’s participation in export partnerships is the group’s cost of original participation less principal subsequent repayments received, plus the cumulative amortisation of the difference between the initial amount and the maturity amount, less any write-down for impairment of uncollectability. The fair value of loans and receivables,
NOTES TO THE FINANCIAL STATEMENTS CONTINUEDfor the years ended 31 March
Foschini Limited and its subsidiaries

FOSC
HIN
I GRO
UP A
NN
UA
L REPORT 2010 - PA
GE 185
determined for disclosure purposes is estimated based on the present value of future principal and interest cash flows, discounted at the market rate of interest at the reporting date.
Financial liabilities measured at amortised costNon-derivative financial liabilities including interest-bearing debt, non-controlling interest loans, RCS Group external funding, and trade and other payables are recognised at amortised cost, comprising original debt less principal payments and amortisations.
The fair value of non-derivative financial liabilities, determined for disclosure purposes, is estimated based on the present value of future principal and interest cash flows, discounted at the market rate of interest at the reporting date.
Gains and Losses on Subsequent MeasurementAll fair value gains and losses on subsequent measurement of financial instruments are recognised in profit or loss, except for hedged instruments and available-for-sale assets. Hedged instruments are accounted for as described in the hedge accounting policy note. Gains and losses arising from available-for-sale financial assets are recognised directly in equity, except for impairment losses and foreign exchange gains and losses on available-for-sale monetary items which are recognised in profit or loss. When an investment classified as available-for-sale is derecognised, the cumulative gain or loss in equity is transferred to profit or loss.
Derivative financial instrumentsThe group uses derivative financial instruments to hedge its exposure to foreign exchange and interest rate risks arising from operational, financing and investment activities. In accordance with its treasury policy, the group does not hold or issue derivative financial instruments for trading purposes.
Derivative financial instruments are subsequently measured at fair value, with the gain or loss on remeasurement being recognised immediately in profit or loss. However, where derivatives qualify for hedge accounting, recognition of any gain or loss depends on the nature of the hedge (refer to hedge accounting policy note).
The fair value of interest rate swaps is the estimated amount that the group would receive or pay to terminate the swap at the reporting date, taking into account current interest rates and the current creditworthiness of the swap counterparties.
The fair value of forward exchange contracts is the present value of their forward price.
Share capitalOrdinary sharesOrdinary shares are classified as equity. Incremental costs directly attributable to the issue of ordinary shares and share options are recognised as a deduction from equity, net of any tax effects.
Preference share capitalPreference share capital is classified as equity. Dividends thereon are recognised as distributions within equity.
OffsetFinancial assets and financial liabilities are off-set and the net amount reported in the statement of financial position when the group has a legally enforceable right to set off the recognised amounts, and intends either to settle on a net basis, or to realise the financial asset and settle the financial liability simultaneously.
Foreign CurrenciesThe functional currency of each entity within the group is determined based on the currency of the primary economic environment in which that entity operates.
Foreign currency transactionsTransactions in currencies other than the entity’s functional currency are translated at the rates of exchange ruling on the transaction date.
Monetary assets and liabilities denominated in such currencies are translated at the rates ruling at the reporting date.
Non-monetary assets and liabilities denominated in such currencies are translated using the exchange rate at the date of the transaction.
Foreign currency gains and losses arising on translation are recognised in profit or loss, except for differences arising on the translation of available-for-sale equity instruments, which are recognised directly in equity.
Foreign operationsAs at the reporting date, the assets and liabilities of foreign operations, including goodwill and fair value adjustments arising on acquisition, are translated into the presentation currency of the group at the rate of exchange ruling at the reporting date and their income statements are translated at the exchange rates at the dates of the transactions or the average rates if it approximates the actual rates.
Gains and losses arising on translation of the assets, liabilities, income and expenses of foreign operations are recognised directly in equity as a foreign currency translation reserve.
Goodwill All business combinations are accounted for by applying the purchase method. Goodwill represents amounts arising on acquisition of subsidiaries, associates and joint ventures and is the difference between the cost of the acquisition and the group’s interest in the net fair value of the identifiable assets, liabilities and contingent liabilities of the acquiree. When the difference is negative (negative goodwill), it is recognised immediately in profit or loss.
Goodwill is measured at cost less any accumulated impairment losses. Goodwill is allocated to cash-generating units and is not amortised but is tested annually for impairment and whenever there is an indication of impairment.
NOTES TO THE FINANCIAL STATEMENTS CONTINUEDfor the years ended 31 March
Foschini Limited and its subsidiaries
NO
TES TO TH
E FINA
NC
IAL STATEM
ENTS C
ON
TINU
EDFO
SCH
INI G
ROU
P AN
NU
AL REPO
RT 2010 - PAG
E 186
1. ACCOUNTING POLICIES CONTINUEDIn respect of equity accounted investees, the carrying amount of goodwill is included in the carrying amount of the investment.
Hedge AccountingGains and losses from remeasuring the hedging instruments relating to a fair value hedge at fair value are recognised immediately in profit or loss.
To the extent that they are effective, gains and losses from remeasuring the hedging instruments relating to a cash flow hedge to fair value are initially recognised directly in equity. If the hedged firm commitment or forecast transaction results in the recognition of a non-financial asset or a liability, the cumulative amount recognised in equity up to the transaction date is adjusted against the initial measurement of the asset or liability. For other cash flow hedges, the cumulative amount recognised in equity is included in net profit or loss in the period when the commitment or forecast transaction affects profit or loss. The ineffective portion of any gain or loss is recognised immediately in profit or loss.
Where the hedging instrument or hedge relationship is terminated but the hedged transaction is still expected to occur, the cumulative unrealised gain or loss at that point remains in equity and is recognised in accordance with the above policy when the transaction occurs. If the hedged transaction is no longer expected to occur, the cumulative unrealised gain or loss is recognised in profit or loss immediately.
Impairment of AssetsFinancial assetsA financial asset is assessed at each reporting date to determine whether there is any objective evidence that it is impaired. A financial asset is considered to be impaired if objective evidence indicates that one or more events have had a negative effect on the estimated future cash flows of that asset.
An impairment loss in respect of a financial asset measured at amortised cost is calculated as the difference between its carrying amount and the present value of the estimated future cash flows discounted at the original effective interest rate. An impairment loss in respect of an available-for-sale financial asset is calculated by reference to its current fair value.
Individually significant financial assets are tested for impairment on an individual basis. The remaining financial assets are assessed collectively in groups that share similar credit risk characteristics.
All impairment losses are recognised in profit or loss. Any cumulative loss in respect of an available-for-sale financial asset recognised previously in equity is transferred to profit or loss.
An impairment loss is reversed if the reversal can be related objectively to an event occurring after the impairment loss was recognised. For financial assets measured at amortised cost and available-for-sale financial assets that are debt securities, the reversal is recognised in profit or loss. For available-for-sale financial assets that are equity securities, the reversal is recognised directly in equity.
Non-financial assetsThe carrying values of the group’s non-financial assets, other than inventories and deferred tax assets, are reviewed at each reporting date to determine whether there is any indication of impairment. If any such indication exists then the asset’s recoverable amount is estimated. For goodwill and intangible assets that have indefinite useful lives or that are not yet available for use, the recoverable amount is estimated at each reporting date.
An impairment loss is recognised if the carrying amount of an asset or its cash-generating unit exceeds its recoverable amount. A cash-generating unit is the smallest identifiable asset group that generates cash inflows that are largely independent of the cash inflows from other assets or asset groups. Impairment losses are recognised in profit or loss. Impairment losses recognised in respect of cash-generating units are allocated first to reduce the carrying amount of any goodwill allocated to the units and then to reduce the carrying amount of the other assets in the unit (group of units) on a pro rata basis. The recoverable amount of an asset or cash-generating unit is the greater of its value in use and its fair value less costs to sell. In assessing value in use, the estimated future cash flows are discounted to their present value using a pre-tax discount rate that reflects current market assessments of the time value of money and the risks specific to the asset.
An impairment loss in respect of goodwill is not reversed. In respect of other assets, impairment losses recognised in prior periods are assessed at each reporting date for any indications that the loss has decreased or no longer exists. An impairment loss is reversed if there has been a change in the estimates used to determine the recoverable amount. An impairment loss is reversed only to the extent that the asset’s carrying amount does not exceed the carrying amount that would have been determined, net of depreciation or amortisation, if no impairment loss had been recognised.
Intangible AssetsIntangible assets that are acquired by the group, which have finite useful lives, are measured at cost less accumulated amortisation and accumulated impairment losses.
Subsequent expenditure is capitalised only when it increases the future economic benefits embodied in the specific asset to which it relates. All other expenditure, including expenditure on internally generated goodwill and brands, is recognised in profit or loss as incurred.
NOTES TO THE FINANCIAL STATEMENTS CONTINUEDfor the years ended 31 March
Foschini Limited and its subsidiaries
FOSC
HIN
I GRO
UP A
NN
UA
L REPORT 2010 - PA
GE 187
Amortisation for intangible assets with finite useful lives, other than goodwill, is recognised in profit or loss on a straight-line basis over their estimated useful lives from the date that they are available for use, at the following rate per annum:
Client lists 20%
InventoriesInventories are measured at the lower of cost and net realisable value. Net realisable value is the estimated selling price in the ordinary course of business, less the estimated costs of selling expenses.
The cost of inventories is based on the first-in-first-out principle and includes expenditure incurred in acquiring the inventories and bringing them to their present location and condition.
Costs may also include transfers from equity of any gain or loss on qualifying cash flow hedges of foreign currency purchases of inventories.
Property, Plant and EquipmentItems of property, plant and equipment are measured at cost or deemed cost less accumulated depreciation and accumulated impairment losses. The cost of self-constructed assets includes the cost of materials, direct labour, any other costs directly attributable to bringing the asset to a working condition for its intended use, and the costs of dismantling and removing the items and restoring the site on which they are located.
Cost includes expenditures that are directly attributable to the acquisition of the asset.
When parts of an item of property, plant and equipment have different useful lives, they are accounted for as separate items (major components) of property, plant and equipment.
Certain items of property, plant and equipment that had been revalued to fair value on or prior to transition to IFRS, are measured on the basis of deemed cost, being the fair value at the date of transition.
Property, plant and equipment are depreciated on a straight-line basis over the periods of their estimated useful lives, at the following rates per annum:
Shopfittings 20%
Passenger vehicles 20%
Commercial vehicles 25%
Computers and related equipment 20% – 33%
Furniture and fittings 16,67%
Buildings 3,33%
Land is not depreciated.
Depreciation methods, useful lives and residual values are reassessed at each reporting date.
The cost of replacing part of an item of property, plant and equipment is recognised in the carrying amount of the item if it is probable that the future economic benefits embodied within the part will flow to the group, and its cost can be measured reliably. The carrying amount of the replaced part is derecognised. The day-to-day servicing costs of property, plant and equipment are recognised in profit or loss as incurred.
Gains or losses on the disposal of property, plant and equipment are recognised in profit or loss. The gain or loss is the difference between the net disposal proceeds and the carrying amount of the asset.
ProvisionsA provision is recognised in the statement of financial position when the group has a present legal or constructive obligation as a result of a past event and it is probable that an outflow of economic benefits will be required to settle the obligation, and a reliable estimate can be made of the amount of the obligation. Provisions are reviewed at each reporting date and adjusted to reflect the current best estimate.
Provisions are determined by discounting the expected future cash flows at a pre-tax rate that reflects current market assessments of the time value of money and the risks specific to the liability.
Revenue RecognitionTurnoverTurnover represents the invoiced value of retail sales, excluding intra-group sales and Value Added Tax. Sales are recognised when significant risks and rewards of ownership are transferred to the buyer, there is no continuing management involvement with the goods, the amount of revenue can be measured reliably, costs and possible return of goods can be measured reliably and receipt of the future economic benefits is probable.
Revenue is measured at the fair value of the consideration received or receivable, net of returns and allowances, discounts and rebates.
Interest receivedInterest is recognised on a time-proportion basis, taking account of the principal outstanding and the effective rate over the period to maturity, when it is probable that such income will accrue to the group.
Dividends receivedDividends received on equity instruments are recognised when the right to receive payment is established.
Merchants’ commissionCommission income is recognised when the related transaction on which the commission is earned has been concluded.
Club incomeClub income is recognised in profit or loss when due.
NOTES TO THE FINANCIAL STATEMENTS CONTINUEDfor the years ended 31 March
Foschini Limited and its subsidiaries

NO
TES TO TH
E FINA
NC
IAL STATEM
ENTS C
ON
TINU
EDFO
SCH
INI G
ROU
P AN
NU
AL REPO
RT 2010 - PAG
E 188
1. ACCOUNTING POLICIES CONTINUEDInsurance incomeInsurance income is recognised in profit or loss when due and no further services are required.
Segmental ReportingAn operating segment is a component of the group that engages in business activities from which it may earn revenues and incur expenses, including revenues and expenses that relate to transactions with any of the group’s other components. All operating segments’ operating results are reviewed regularly by the board, identified as the chief operating decision-maker, to make decisions about resources to be allocated to the segment and assess its performance and for which internal financial information is available.
Segment results that are reported to the board include items directly attributable to a segment, as well as those that can be allocated on a reasonable basis. Unallocated items comprise mainly the operating lease liability adjustment and the share-based payments reserve movements.
The group is organised into four reportable operating divisions:
• Retail trading divisions, comprising the @home division, exact!, the Foschini division, the Jewellery division, Markham and the Sports division, retail clothing, jewellery, cosmetics, cellphones, and homeware and furniture;
• FG Financial Services – manages the group’s in-store credit card programme, as well as handling the group’s financial service products such as Club and associated magazines as well as insurance products;
• Central and shared services provide services to the trading divisions including, but not limited to, finance and administration, internal audit, information technology, logistics, human resources, facilities management and real estate; and
• RCS Group, an operationally independent consumer finance business that provides a broad range of financial services under its own brand in South Africa, Namibia and Botswana.
The group operates solely in the southern African market and accordingly has not presented any geographical information.
Inter-segment pricing is determined on an arm’s legth basis.
TaxationIncome tax expense comprises current and deferred tax.
Income tax expense is recognised in profit or loss except to the extent that it relates to a transaction that is recognised directly in equity, in which case it is recognised in equity.
Current tax is the expected taxation payable, calculated on the basis of taxable income for the year, using the tax rates enacted or substantively enacted at the reporting date and any adjustment of taxation payable for previous years.
Deferred taxation is recognised using the liability method, to take into account the effect of temporary differences between the tax base of an asset or liability and its carrying amount. Deferred tax is not recognised for the following temporary differences: the initial recognition of goodwill; the initial recognition of assets and liabilities in a transaction that is not a business combination and that affects neither accounting nor taxable profit; and differences relating to investments in subsidiaries and associates to the extent that they probably will not reverse in the foreseeable future. Deferred tax is measured at the tax rates that are expected to be applied to temporary differences when they reverse, based on the laws that have been enacted or substantively enacted by the reporting date.
Deferred tax assets and liabilities are off-set if there is a legally enforceable right to off-set current tax liabilities and assets, and they relate to income taxes levied by the same tax authority on the same taxable entity, or on different tax entities, but they intend to settle current tax liabilities and assets on a net basis, or their tax assets and liabilities will be realised simultaneously.
Deferred taxation assets are recognised for all deductible temporary differences and assessed losses to the extent that it is probable that taxable profit will be available against which such deductible temporary differences and assessed losses can be utilised. Deferred tax assets are reviewed at each reporting date and are reduced to the extent that it is no longer probable that the related tax benefit will be realised.
Secondary taxation on companies is provided in respect of dividend payments or declarations, net of dividends received or receivable and is recognised as a tax charge in the year in which the related dividend is declared and the liability to pay the related dividend is recognised.
Treasury SharesFoschini Limited shares purchased and held by subsidiaries are classified as treasury shares and are presented as a deduction from equity.
Dividends received on treasury shares are eliminated on consolidation.
Gains or losses on disposal of treasury shares are accounted for directly in equity.
Issued and weighted average numbers of shares are reduced by treasury shares for earnings per share purposes.
NOTES TO THE FINANCIAL STATEMENTS CONTINUEDfor the years ended 31 March
Foschini Limited and its subsidiaries

FOSC
HIN
I GRO
UP A
NN
UA
L REPORT 2010 - PA
GE 189
Foschini Limited and its subsidiaries
2010 Rm
2009 Rm
2. PROPERTY, PLANT AND EQUIPMENTLand and buildings
At deemed cost 259,0 257,1
Accumulated depreciation (70,3) (64,2)
Carrying value at the end of the year 188,7 192,9
Shopfittings, vehicles, computers, and furniture and fittings
At cost 2 253,2 2 112,7
Accumulated depreciation (1 446,1) (1 324,3)
Carrying value at the end of the year 807,1 788,4
Total
At cost/deemed cost 2 512,2 2 369,8
Accumulated depreciation (1 516,4) (1 388,5)
Carrying value at the end of the year 995,8 981,3
Analysis of movementsLand andbuildings
Shop-fittings,
vehicles, computers,
and furniture
and fittings Total
Carrying value at the beginning of the year 192,9 788,4 981,3
Additions 1,9 287,7 289,6
Disposals – (11,0) (11,0)
Depreciation (6,1) (258,0) (264,1)
Carrying value at the end of the year 188,7 807,1 995,8
None of the group’s assets are in any way encumbered.
Registers of the land and buildings are available for inspection at the head office of the company at Parow East.
NOTES TO THE FINANCIAL STATEMENTS CONTINUEDfor the years ended 31 March
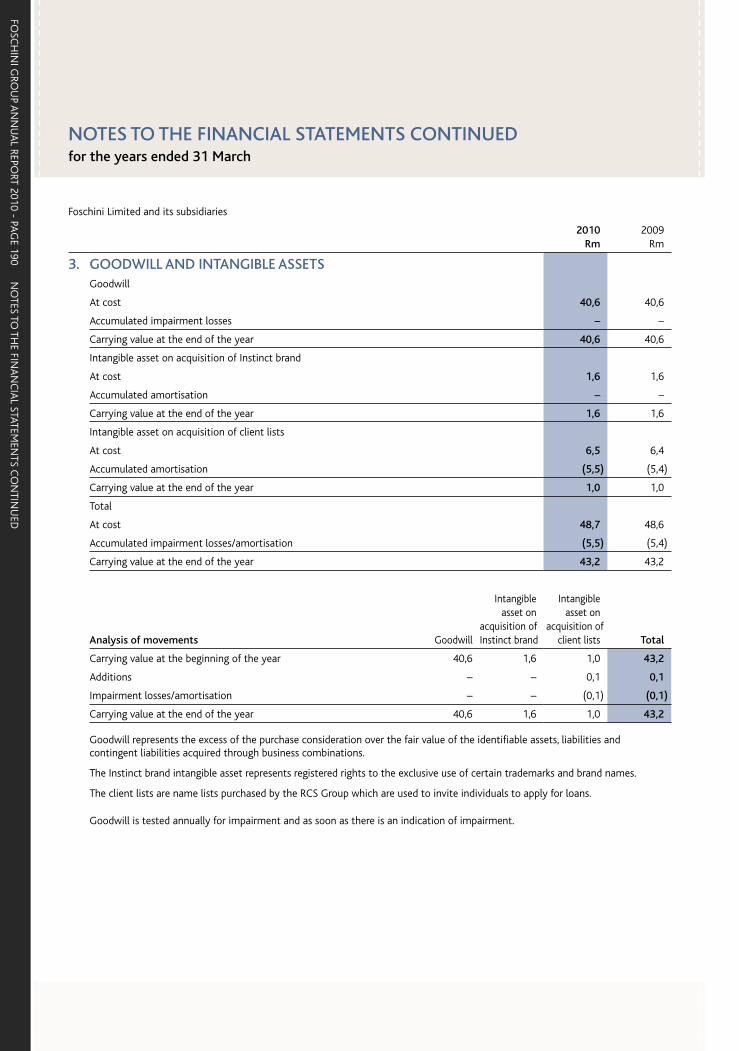
NO
TES TO TH
E FINA
NC
IAL STATEM
ENTS C
ON
TINU
EDFO
SCH
INI G
ROU
P AN
NU
AL REPO
RT 2010 - PAG
E 190
Foschini Limited and its subsidiaries
2010 Rm
2009 Rm
3. GOODWILL AND INTANGIBLE ASSETSGoodwill
At cost 40,6 40,6
Accumulated impairment losses – –
Carrying value at the end of the year 40,6 40,6
Intangible asset on acquisition of Instinct brand
At cost 1,6 1,6
Accumulated amortisation – –
Carrying value at the end of the year 1,6 1,6
Intangible asset on acquisition of client lists
At cost 6,5 6,4
Accumulated amortisation (5,5) (5,4)
Carrying value at the end of the year 1,0 1,0
Total
At cost 48,7 48,6
Accumulated impairment losses/amortisation (5,5) (5,4)
Carrying value at the end of the year 43,2 43,2
Analysis of movements Goodwill
Intangible asset on
acquisition ofInstinct brand
Intangible asset on
acquisition ofclient lists Total
Carrying value at the beginning of the year 40,6 1,6 1,0 43,2
Additions – – 0,1 0,1
Impairment losses/amortisation – – (0,1) (0,1)
Carrying value at the end of the year 40,6 1,6 1,0 43,2
Goodwill represents the excess of the purchase consideration over the fair value of the identifiable assets, liabilities and contingent liabilities acquired through business combinations.
The Instinct brand intangible asset represents registered rights to the exclusive use of certain trademarks and brand names.
The client lists are name lists purchased by the RCS Group which are used to invite individuals to apply for loans.
Goodwill is tested annually for impairment and as soon as there is an indication of impairment.
NOTES TO THE FINANCIAL STATEMENTS CONTINUEDfor the years ended 31 March
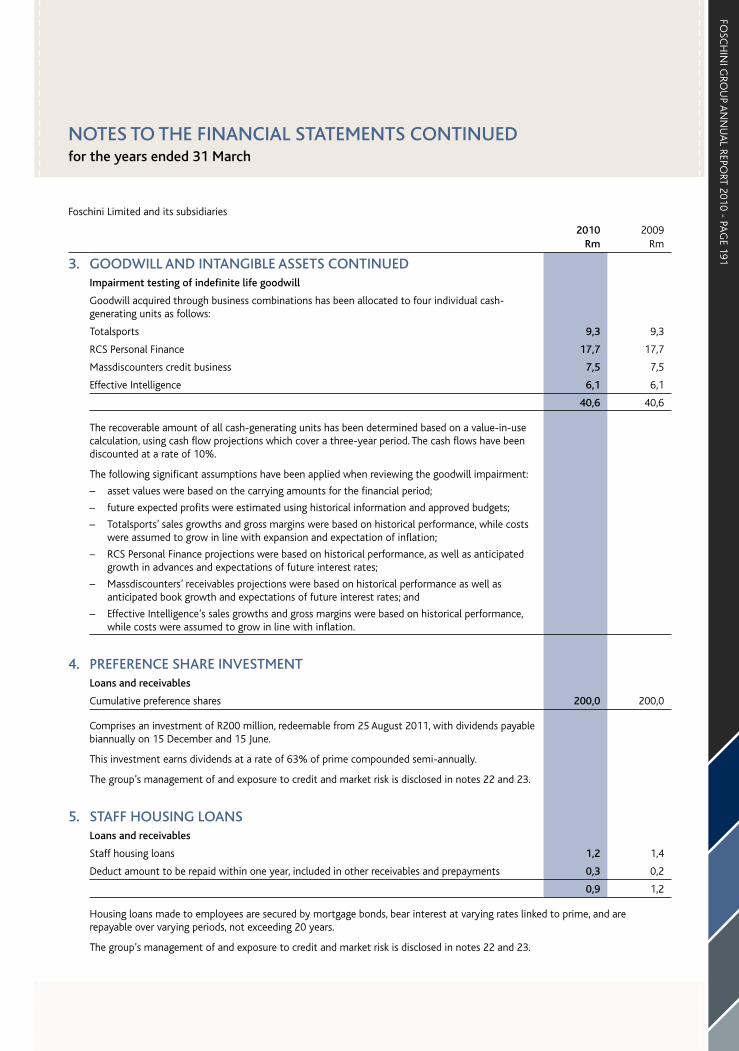
FOSC
HIN
I GRO
UP A
NN
UA
L REPORT 2010 - PA
GE 191
Foschini Limited and its subsidiaries
2010 Rm
2009 Rm
3. GOODWILL AND INTANGIBLE ASSETS CONTINUEDImpairment testing of indefinite life goodwill
Goodwill acquired through business combinations has been allocated to four individual cash-generating units as follows:
Totalsports 9,3 9,3
RCS Personal Finance 17,7 17,7
Massdiscounters credit business 7,5 7,5
Effective Intelligence 6,1 6,1
40,6 40,6
The recoverable amount of all cash-generating units has been determined based on a value-in-use calculation, using cash flow projections which cover a three-year period. The cash flows have been discounted at a rate of 10%.
The following significant assumptions have been applied when reviewing the goodwill impairment:
– asset values were based on the carrying amounts for the financial period;
– future expected profits were estimated using historical information and approved budgets;
– Totalsports’ sales growths and gross margins were based on historical performance, while costs were assumed to grow in line with expansion and expectation of inflation;
– RCS Personal Finance projections were based on historical performance, as well as anticipated growth in advances and expectations of future interest rates;
– Massdiscounters’ receivables projections were based on historical performance as well as anticipated book growth and expectations of future interest rates; and
– Effective Intelligence’s sales growths and gross margins were based on historical performance, while costs were assumed to grow in line with inflation.
4. PREFERENCE SHARE INVESTMENTLoans and receivables
Cumulative preference shares 200,0 200,0
Comprises an investment of R200 million, redeemable from 25 August 2011, with dividends payable biannually on 15 December and 15 June.
This investment earns dividends at a rate of 63% of prime compounded semi-annually.
The group’s management of and exposure to credit and market risk is disclosed in notes 22 and 23.
5. STAFF HOUSING LOANSLoans and receivables
Staff housing loans 1,2 1,4
Deduct amount to be repaid within one year, included in other receivables and prepayments 0,3 0,2
0,9 1,2
Housing loans made to employees are secured by mortgage bonds, bear interest at varying rates linked to prime, and are repayable over varying periods, not exceeding 20 years.
The group’s management of and exposure to credit and market risk is disclosed in notes 22 and 23.
NOTES TO THE FINANCIAL STATEMENTS CONTINUEDfor the years ended 31 March

NO
TES TO TH
E FINA
NC
IAL STATEM
ENTS C
ON
TINU
EDFO
SCH
INI G
ROU
P AN
NU
AL REPO
RT 2010 - PAG
E 192
Foschini Limited and its subsidiaries
2010 Rm
2009 Rm
6. RCS GROUP PRIVATE LABEL CARD RECEIVABLESLoans and receivables
RCS Group private label card receivables 1 773,5 1 484,4
Deduct amount to be repaid within one year, included in current assets 1 494,1 1 051,1
279,4 433,3
RCS Group private label card receivables comprise a number of individual unsecured revolving card accounts, which attract interest at variable rates as per the National Credit Act.
The effective interest rate on these receivables for the year under review is 26,9% (2009: 32,3%).
The amounts are repayable over periods not exceeding two years.
The group’s management of and exposure to credit and market risk is disclosed in notes 22 and 23.
7. RCS GROUP LOAN RECEIVABLESLoans and receivables
RCS Group loan receivables 857,3 988,2
Deduct amount to be repaid within one year, included in current assets 54,9 101,8
802,4 886,4
RCS Group loan receivables comprise a number of individual unsecured loans. The loans bear interest at fixed rates determined on the initial advance of the loan based on the risk profile of the customer. The effective rate of interest earned during the year under review is 33,8% (2009: 33,9%). These loans are repayable over periods not exceeding five years.
The group’s management of and exposure to credit and market risk is disclosed in notes 22 and 23.
8. PARTICIPATION IN EXPORT PARTNERSHIPSLoans and receivables
Participation in export partnership 85,0 94,7
Deduct amount to be repaid within one year, included in current assets 10,6 6,9
74,4 87,8
Certain subsidiary companies participated in various export partnerships, whose business was the purchase and export sale of containers. The partnerships bought and sold the containers in terms of long-term suspensive purchase and credit sale agreements respectively, with repayment terms usually over a 10- to 15-year period.
The group’s management of and exposure to credit and market risk is disclosed in notes 22 and 23.
NOTES TO THE FINANCIAL STATEMENTS CONTINUEDfor the years ended 31 March

FOSC
HIN
I GRO
UP A
NN
UA
L REPORT 2010 - PA
GE 193
Foschini Limited and its subsidiaries
2010 Rm
2009 Rm
9. DEFERRED TAXATIONBalance at 1 April 10,6 18,0
Prior year (over) under provision (6,4) 2,2
Rate change 0,1 –
Amounts recognised directly in equity
Consolidation of associate not previously recognised – 1,3
Foreign currency and financial instrument reserve movements (2,8) 9,1
Current year movement in temporary differences
Secondary taxation on companies 2,4 –
Operating leases 27,2 (29,0)
Working capital allowances (6,4) (8,5)
Capital allowances 0,6 (1,7)
Restraint of trade payments (2,0) (2,8)
Export partnerships (refer note 8) 10,3 6,6
Assessed loss (14,5) 15,4
At 31 March 19,1 10,6
Arising as a result of:
Deferred tax assets
Foreign currency and financial instrument reserve movements – 9,1
Operating leases 38,3 11,1
Secondary taxation on companies 2,4 –
Working capital allowances 114,5 118,0
Capital allowances – 2,6
Restraint of trade payments 2,2 4,2
Trademarks 0,1 0,1
Assessed loss 0,9 15,4
Deferred taxation asset 158,4 160,5
Deferred tax liability
Capital allowances (37,1) (47,4)
Working capital allowances (6,5) (3,1)
Foreign currency and financial instrument reserve movements (6,6) –
Export partnerships (refer note 8) (89,1) (99,4)
Deferred taxation liability (139,3) (149,9)
Total deferred taxation 19,1 10,6
In the event that the total available distributable reserves of R5 558,8 (2009: R5 083,2) million were declared as a dividend toshareholders the related secondary taxation on companies would amount to R483,1 (2009: R462,1) million.
NOTES TO THE FINANCIAL STATEMENTS CONTINUEDfor the years ended 31 March
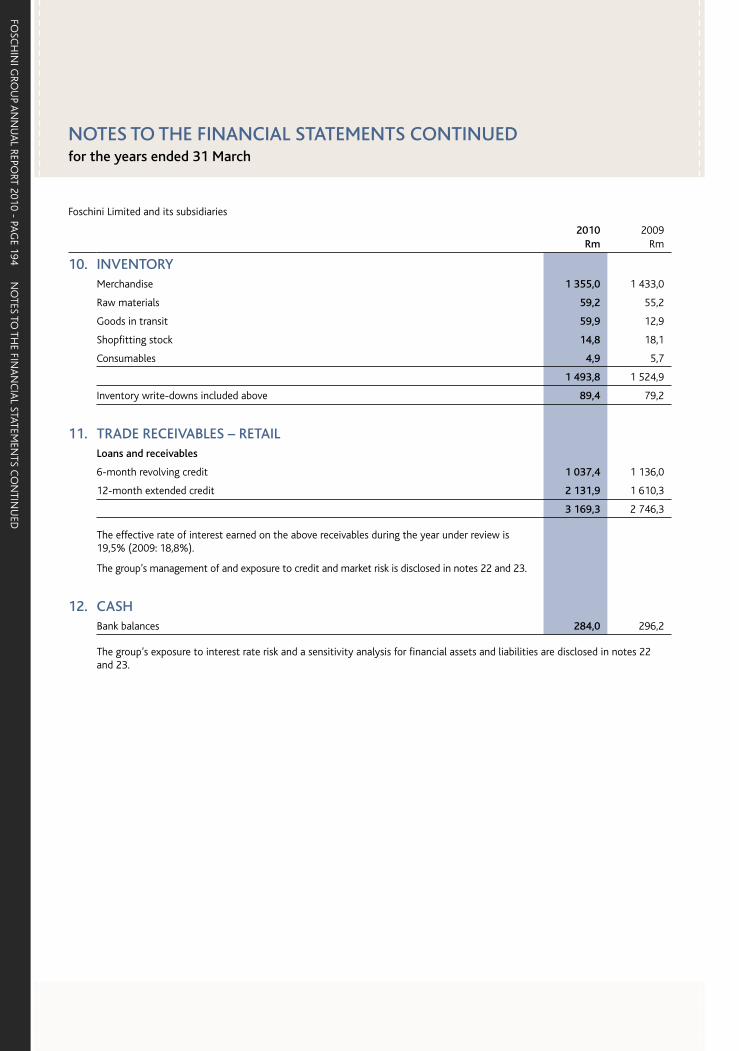
NO
TES TO TH
E FINA
NC
IAL STATEM
ENTS C
ON
TINU
EDFO
SCH
INI G
ROU
P AN
NU
AL REPO
RT 2010 - PAG
E 194
Foschini Limited and its subsidiaries
2010 Rm
2009 Rm
10. INVENTORYMerchandise 1 355,0 1 433,0
Raw materials 59,2 55,2
Goods in transit 59,9 12,9
Shopfitting stock 14,8 18,1
Consumables 4,9 5,7
1 493,8 1 524,9
Inventory write-downs included above 89,4 79,2
11. TRADE RECEIVABLES – RETAILLoans and receivables
6-month revolving credit 1 037,4 1 136,0
12-month extended credit 2 131,9 1 610,3
3 169,3 2 746,3
The effective rate of interest earned on the above receivables during the year under review is 19,5% (2009: 18,8%).
The group’s management of and exposure to credit and market risk is disclosed in notes 22 and 23.
12. CASHBank balances 284,0 296,2
The group’s exposure to interest rate risk and a sensitivity analysis for financial assets and liabilities are disclosed in notes 22 and 23.
NOTES TO THE FINANCIAL STATEMENTS CONTINUEDfor the years ended 31 March
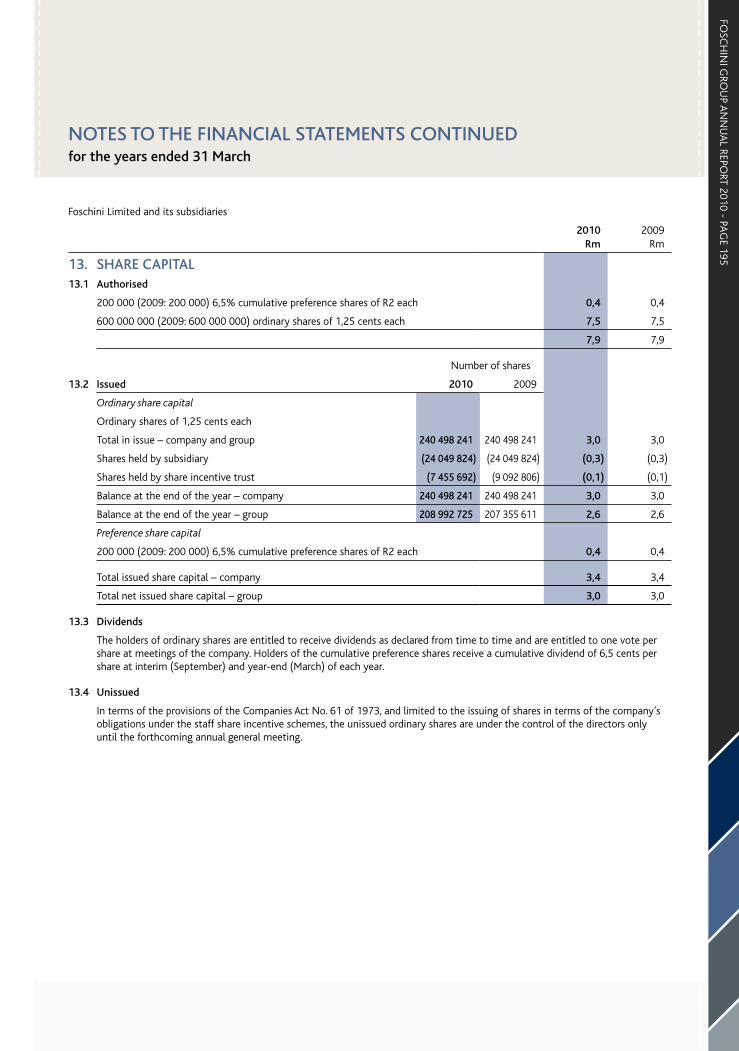
FOSC
HIN
I GRO
UP A
NN
UA
L REPORT 2010 - PA
GE 195
Foschini Limited and its subsidiaries
2010 Rm
2009 Rm
13. SHARE CAPITAL13.1 Authorised
200 000 (2009: 200 000) 6,5% cumulative preference shares of R2 each 0,4 0,4
600 000 000 (2009: 600 000 000) ordinary shares of 1,25 cents each 7,5 7,5
7,9 7,9
Number of shares
13.2 Issued 2010 2009
Ordinary share capital
Ordinary shares of 1,25 cents each
Total in issue – company and group 240 498 241 240 498 241 3,0 3,0
Shares held by subsidiary (24 049 824) (24 049 824) (0,3) (0,3)
Shares held by share incentive trust (7 455 692) (9 092 806) (0,1) (0,1)
Balance at the end of the year – company 240 498 241 240 498 241 3,0 3,0
Balance at the end of the year – group 208 992 725 207 355 611 2,6 2,6
Preference share capital
200 000 (2009: 200 000) 6,5% cumulative preference shares of R2 each 0,4 0,4
Total issued share capital – company 3,4 3,4
Total net issued share capital – group 3,0 3,0
13.3 Dividends
The holders of ordinary shares are entitled to receive dividends as declared from time to time and are entitled to one vote per share at meetings of the company. Holders of the cumulative preference shares receive a cumulative dividend of 6,5 cents per share at interim (September) and year-end (March) of each year.
13.4 Unissued
In terms of the provisions of the Companies Act No. 61 of 1973, and limited to the issuing of shares in terms of the company’s obligations under the staff share incentive schemes, the unissued ordinary shares are under the control of the directors only until the forthcoming annual general meeting.
NOTES TO THE FINANCIAL STATEMENTS CONTINUEDfor the years ended 31 March
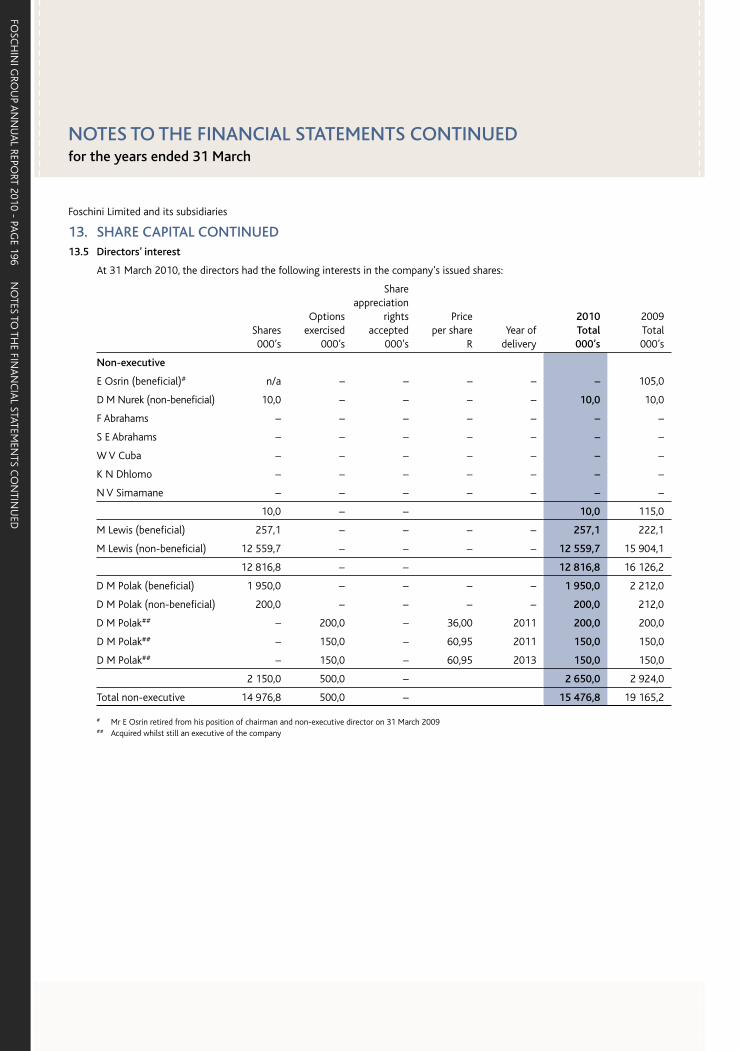
NO
TES TO TH
E FINA
NC
IAL STATEM
ENTS C
ON
TINU
EDFO
SCH
INI G
ROU
P AN
NU
AL REPO
RT 2010 - PAG
E 196
Foschini Limited and its subsidiaries
13. SHARE CAPITAL CONTINUED13.5 Directors’ interest
At 31 March 2010, the directors had the following interests in the company’s issued shares:
Shares000’s
Options exercised
000’s
Share appreciation
rights accepted
000’s
Priceper share
RYear of
delivery
2010Total000’s
2009Total000’s
Non-executive
E Osrin (beneficial)# n/a – – – – – 105,0
D M Nurek (non-beneficial) 10,0 – – – – 10,0 10,0
F Abrahams – – – – – – –
S E Abrahams – – – – – – –
W V Cuba – – – – – – –
K N Dhlomo – – – – – – –
N V Simamane – – – – – – –
10,0 – – 10,0 115,0
M Lewis (beneficial) 257,1 – – – – 257,1 222,1
M Lewis (non-beneficial) 12 559,7 – – – – 12 559,7 15 904,1
12 816,8 – – 12 816,8 16 126,2
D M Polak (beneficial) 1 950,0 – – – – 1 950,0 2 212,0
D M Polak (non-beneficial) 200,0 – – – – 200,0 212,0
D M Polak## – 200,0 – 36,00 2011 200,0 200,0
D M Polak## – 150,0 – 60,95 2011 150,0 150,0
D M Polak## – 150,0 – 60,95 2013 150,0 150,0
2 150,0 500,0 – 2 650,0 2 924,0
Total non-executive 14 976,8 500,0 – 15 476,8 19 165,2
# Mr E Osrin retired from his position of chairman and non-executive director on 31 March 2009## Acquired whilst still an executive of the company
NOTES TO THE FINANCIAL STATEMENTS CONTINUEDfor the years ended 31 March

FOSC
HIN
I GRO
UP A
NN
UA
L REPORT 2010 - PA
GE 197
Foschini Limited and its subsidiaries
13. SHARE CAPITAL CONTINUED13.5 Directors’ interest continued
Shares000’s
Options exercised
000’s
Share appreciation
rights(SARs)
accepted000’s
Priceper share/
SAR R
Year of delivery
2010Total000’s
2009Total000’s
Executive
A D Murray (beneficial) 1 050,0 – – – – 1 050,0 1 140,7
A D Murray (non-beneficial) 250,0 – – – – 250,0 137,6
A D Murray – – – 18,80 2010 – 123,3
A D Murray – – – 16,60 2010 – 166,7
A D Murray – – – 60,55 2010 – 83,3
A D Murray – 133,3 – 60,95 2011 133,3 133,3
A D Murray – 116,7 – 36,00 2011 116,7 116,7
A D Murray – 83,3 – 60,55 2012 83,3 83,3
A D Murray – 133,3 – 60,95 2013 133,3 133,3
A D Murray – 83,3 – 60,55 2014 83,3 83,3
1 300,0 549,9 – 1 849,9 2 201,5
A D Murray – – 555,0 41,87 2011 555,0 555,0
A D Murray – – 250,0 40,00 2012 250,0 250,0
A D Murray – – 275,0 42,28 2012 275,0 275,0
– – 1 080,0 1 080,0 1 080,0
R Stein (beneficial) 666,8 – – – – 666,8 600,8
R Stein (non-beneficial) 275,7 – – – – 275,7 275,7
R Stein – – – 18,80 2010 – 93,3
R Stein – – – 16,60 2010 – 116,7
R Stein – 90,0 – 36,00 2011 90,0 90,0
R Stein – 76,7 – 60,95 2011 76,7 76,7
R Stein – 76,7 – 60,95 2013 76,7 76,7
942,5 243,4 – 1 185,9 1 329,9
R Stein – – 225,0 41,87 2011 225,0 225,0
R Stein – – 130,0 40,00 2012 130,0 130,0
R Stein – – 130,0 42,28 2012 130,0 130,0
– – 485,0 485,0 485,0
NOTES TO THE FINANCIAL STATEMENTS CONTINUEDfor the years ended 31 March
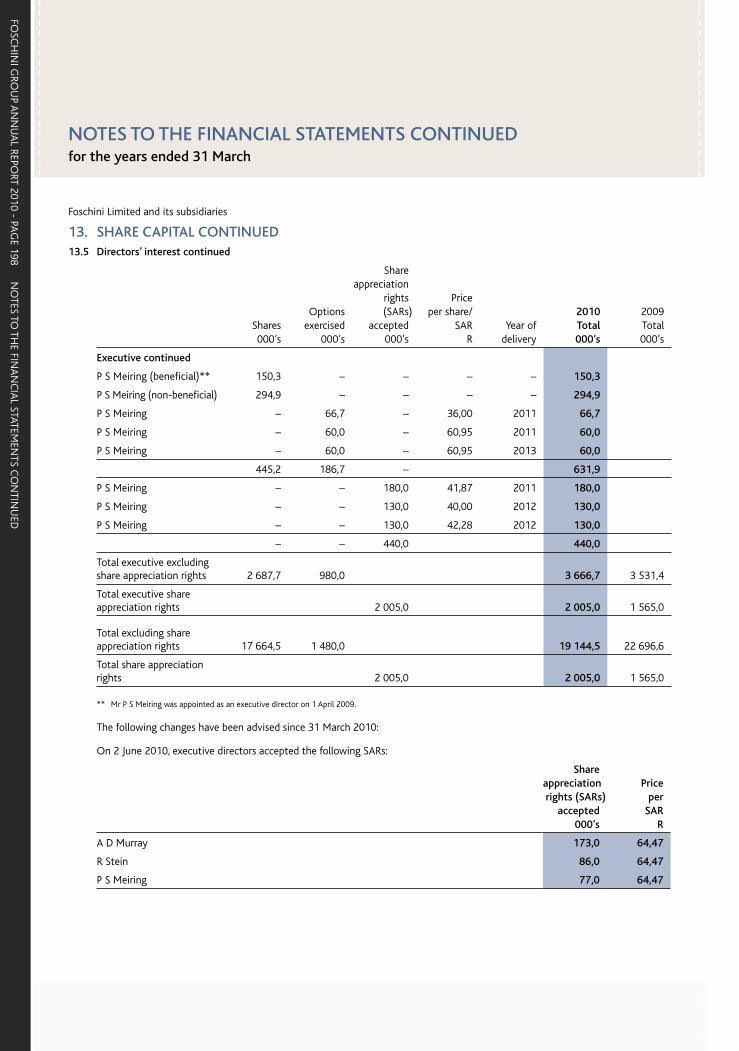
NO
TES TO TH
E FINA
NC
IAL STATEM
ENTS C
ON
TINU
EDFO
SCH
INI G
ROU
P AN
NU
AL REPO
RT 2010 - PAG
E 198
Foschini Limited and its subsidiaries
13. SHARE CAPITAL CONTINUED13.5 Directors’ interest continued
Shares000’s
Options exercised
000’s
Share appreciation
rights(SARs)
accepted000’s
Priceper share/
SAR R
Year of delivery
2010Total000’s
2009Total000’s
Executive continued
P S Meiring (beneficial)** 150,3 – – – – 150,3
P S Meiring (non-beneficial) 294,9 – – – – 294,9
P S Meiring – 66,7 – 36,00 2011 66,7
P S Meiring – 60,0 – 60,95 2011 60,0
P S Meiring – 60,0 – 60,95 2013 60,0
445,2 186,7 – 631,9
P S Meiring – – 180,0 41,87 2011 180,0
P S Meiring – – 130,0 40,00 2012 130,0
P S Meiring – – 130,0 42,28 2012 130,0
– – 440,0 440,0
Total executive excluding share appreciation rights 2 687,7 980,0 3 666,7 3 531,4
Total executive share appreciation rights 2 005,0 2 005,0 1 565,0
Total excluding share appreciation rights 17 664,5 1 480,0 19 144,5 22 696,6
Total share appreciation rights 2 005,0 2 005,0 1 565,0
** Mr P S Meiring was appointed as an executive director on 1 April 2009.
The following changes have been advised since 31 March 2010:
On 2 June 2010, executive directors accepted the following SARs:
Share appreciation rights (SARs)
accepted 000’s
Priceper
SARR
A D Murray 173,0 64,47
R Stein 86,0 64,47
P S Meiring 77,0 64,47
NOTES TO THE FINANCIAL STATEMENTS CONTINUEDfor the years ended 31 March
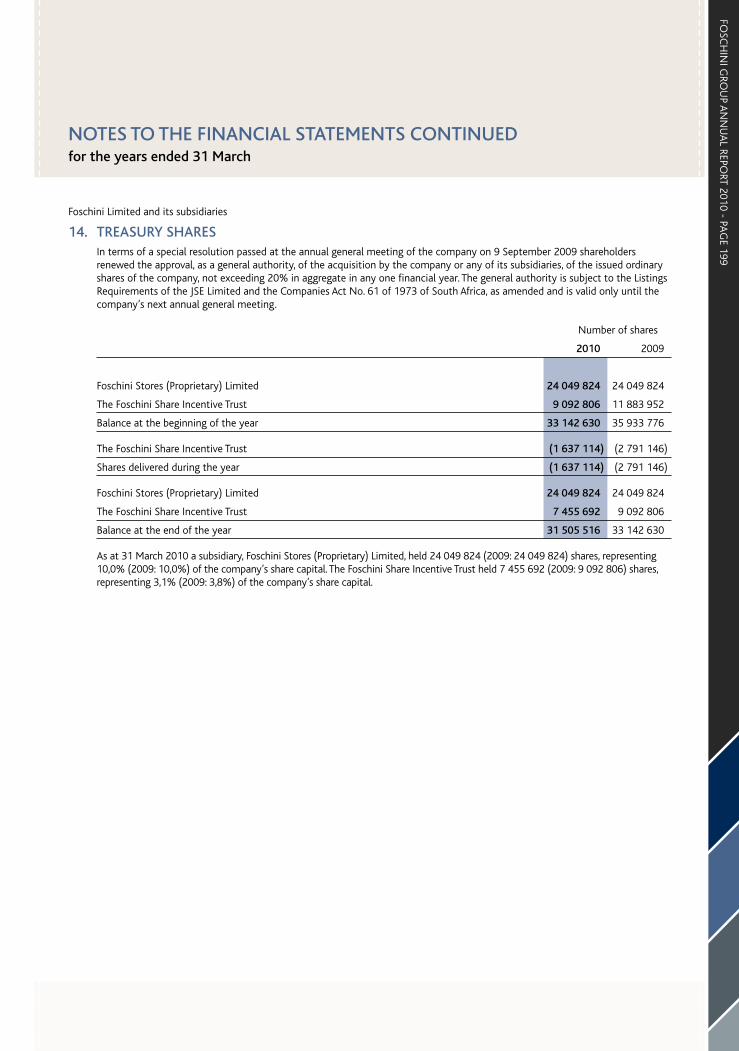
FOSC
HIN
I GRO
UP A
NN
UA
L REPORT 2010 - PA
GE 199
Foschini Limited and its subsidiaries
14. TREASURY SHARESIn terms of a special resolution passed at the annual general meeting of the company on 9 September 2009 shareholders renewed the approval, as a general authority, of the acquisition by the company or any of its subsidiaries, of the issued ordinary shares of the company, not exceeding 20% in aggregate in any one financial year. The general authority is subject to the Listings Requirements of the JSE Limited and the Companies Act No. 61 of 1973 of South Africa, as amended and is valid only until the company’s next annual general meeting.
Number of shares
2010 2009
Foschini Stores (Proprietary) Limited 24 049 824 24 049 824
The Foschini Share Incentive Trust 9 092 806 11 883 952
Balance at the beginning of the year 33 142 630 35 933 776
The Foschini Share Incentive Trust (1 637 114) (2 791 146)
Shares delivered during the year (1 637 114) (2 791 146)
Foschini Stores (Proprietary) Limited 24 049 824 24 049 824
The Foschini Share Incentive Trust 7 455 692 9 092 806
Balance at the end of the year 31 505 516 33 142 630
As at 31 March 2010 a subsidiary, Foschini Stores (Proprietary) Limited, held 24 049 824 (2009: 24 049 824) shares, representing 10,0% (2009: 10,0%) of the company’s share capital. The Foschini Share Incentive Trust held 7 455 692 (2009: 9 092 806) shares, representing 3,1% (2009: 3,8%) of the company’s share capital.
NOTES TO THE FINANCIAL STATEMENTS CONTINUEDfor the years ended 31 March
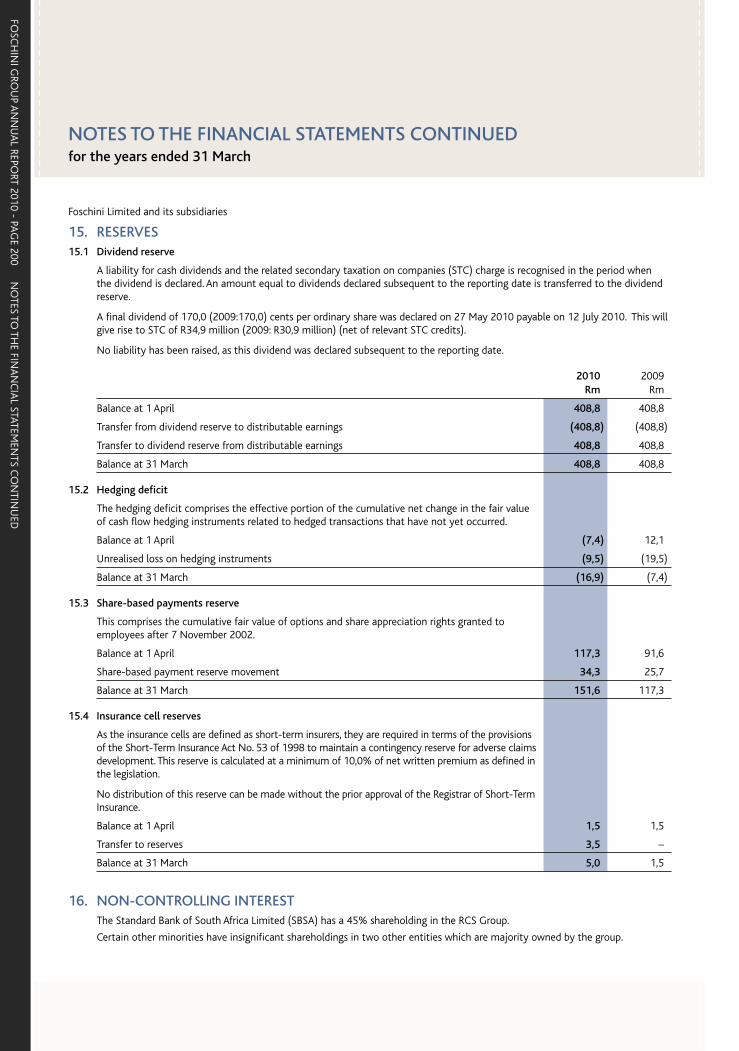
NO
TES TO TH
E FINA
NC
IAL STATEM
ENTS C
ON
TINU
EDFO
SCH
INI G
ROU
P AN
NU
AL REPO
RT 2010 - PAG
E 200
Foschini Limited and its subsidiaries
15. RESERVES15.1 Dividend reserve
A liability for cash dividends and the related secondary taxation on companies (STC) charge is recognised in the period when the dividend is declared. An amount equal to dividends declared subsequent to the reporting date is transferred to the dividend reserve.
A final dividend of 170,0 (2009:170,0) cents per ordinary share was declared on 27 May 2010 payable on 12 July 2010. This will give rise to STC of R34,9 million (2009: R30,9 million) (net of relevant STC credits).
No liability has been raised, as this dividend was declared subsequent to the reporting date.
2010Rm
2009 Rm
Balance at 1 April 408,8 408,8
Transfer from dividend reserve to distributable earnings (408,8) (408,8)
Transfer to dividend reserve from distributable earnings 408,8 408,8
Balance at 31 March 408,8 408,8
15.2 Hedging deficit
The hedging deficit comprises the effective portion of the cumulative net change in the fair value of cash flow hedging instruments related to hedged transactions that have not yet occurred.
Balance at 1 April (7,4) 12,1
Unrealised loss on hedging instruments (9,5) (19,5)
Balance at 31 March (16,9) (7,4)
15.3 Share-based payments reserve
This comprises the cumulative fair value of options and share appreciation rights granted to employees after 7 November 2002.
Balance at 1 April 117,3 91,6
Share-based payment reserve movement 34,3 25,7
Balance at 31 March 151,6 117,3
15.4 Insurance cell reserves
As the insurance cells are defined as short-term insurers, they are required in terms of the provisions of the Short-Term Insurance Act No. 53 of 1998 to maintain a contingency reserve for adverse claims development. This reserve is calculated at a minimum of 10,0% of net written premium as defined in the legislation.
No distribution of this reserve can be made without the prior approval of the Registrar of Short-Term Insurance.
Balance at 1 April 1,5 1,5
Transfer to reserves 3,5 –
Balance at 31 March 5,0 1,5
16. NON-CONTROLLING INTERESTThe Standard Bank of South Africa Limited (SBSA) has a 45% shareholding in the RCS Group.
Certain other minorities have insignificant shareholdings in two other entities which are majority owned by the group.
NOTES TO THE FINANCIAL STATEMENTS CONTINUEDfor the years ended 31 March
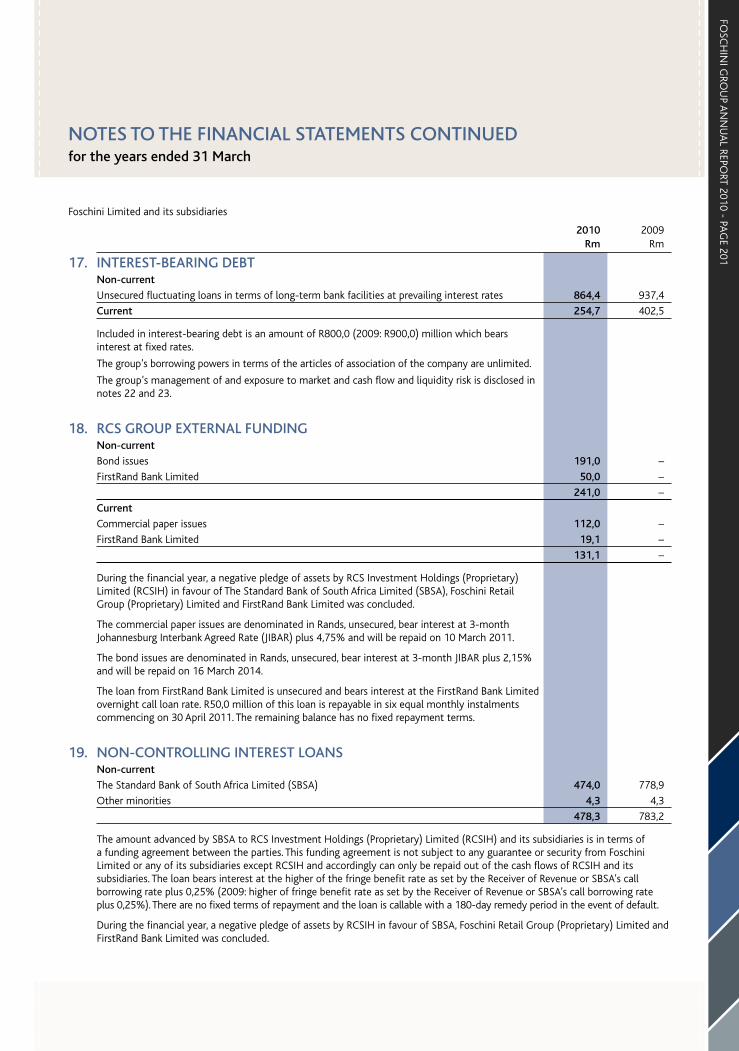
FOSC
HIN
I GRO
UP A
NN
UA
L REPORT 2010 - PA
GE 201
Foschini Limited and its subsidiaries
2010Rm
2009 Rm
17. INTEREST-BEARING DEBTNon-current
Unsecured fluctuating loans in terms of long-term bank facilities at prevailing interest rates 864,4 937,4
Current 254,7 402,5
Included in interest-bearing debt is an amount of R800,0 (2009: R900,0) million which bears interest at fixed rates.
The group’s borrowing powers in terms of the articles of association of the company are unlimited.
The group’s management of and exposure to market and cash flow and liquidity risk is disclosed in notes 22 and 23.
18. RCS GROUP EXTERNAL FUNDINGNon-current
Bond issues 191,0 –
FirstRand Bank Limited 50,0 –
241,0 –
Current
Commercial paper issues 112,0 –
FirstRand Bank Limited 19,1 –
131,1 –
During the financial year, a negative pledge of assets by RCS Investment Holdings (Proprietary) Limited (RCSIH) in favour of The Standard Bank of South Africa Limited (SBSA), Foschini Retail Group (Proprietary) Limited and FirstRand Bank Limited was concluded.
The commercial paper issues are denominated in Rands, unsecured, bear interest at 3-month Johannesburg Interbank Agreed Rate (JIBAR) plus 4,75% and will be repaid on 10 March 2011.
The bond issues are denominated in Rands, unsecured, bear interest at 3-month JIBAR plus 2,15% and will be repaid on 16 March 2014.
The loan from FirstRand Bank Limited is unsecured and bears interest at the FirstRand Bank Limited overnight call loan rate. R50,0 million of this loan is repayable in six equal monthly instalments commencing on 30 April 2011. The remaining balance has no fixed repayment terms.
19. NON-CONTROLLING INTEREST LOANSNon-current
The Standard Bank of South Africa Limited (SBSA) 474,0 778,9
Other minorities 4,3 4,3
478,3 783,2
The amount advanced by SBSA to RCS Investment Holdings (Proprietary) Limited (RCSIH) and its subsidiaries is in terms of a funding agreement between the parties. This funding agreement is not subject to any guarantee or security from Foschini Limited or any of its subsidiaries except RCSIH and accordingly can only be repaid out of the cash flows of RCSIH and its subsidiaries. The loan bears interest at the higher of the fringe benefit rate as set by the Receiver of Revenue or SBSA’s call borrowing rate plus 0,25% (2009: higher of fringe benefit rate as set by the Receiver of Revenue or SBSA’s call borrowing rate plus 0,25%). There are no fixed terms of repayment and the loan is callable with a 180-day remedy period in the event of default.
During the financial year, a negative pledge of assets by RCSIH in favour of SBSA, Foschini Retail Group (Proprietary) Limited and FirstRand Bank Limited was concluded.
NOTES TO THE FINANCIAL STATEMENTS CONTINUEDfor the years ended 31 March

NO
TES TO TH
E FINA
NC
IAL STATEM
ENTS C
ON
TINU
EDFO
SCH
INI G
ROU
P AN
NU
AL REPO
RT 2010 - PAG
E 202
Foschini Limited and its subsidiaries
2010Rm
2009 Rm
20. POST-RETIREMENT DEFINED BENEFIT PLANPost-retirement medical aid
Balance at beginning and end of year 84,1 84,1
Further details in respect of post-retirement medical aid benefits are included in note 34.5.
21. TRADE AND OTHER PAYABLESFinancial liabilities
Trade payables 869,8 881,9
Other liabilities
VAT payable 9,8 –
Other payables and accruals 414,2 370,6
1 293,8 1 252,5
The group’s management of and exposure to market, cash flow and liquidity risk is disclosed in notes 22 and 23.
NOTES TO THE FINANCIAL STATEMENTS CONTINUEDfor the years ended 31 March
FOSC
HIN
I GRO
UP A
NN
UA
L REPORT 2010 - PA
GE 203
Foschini Limited and its subsidiaries
22. FINANCIAL RISK MANAGEMENT22.1 Overview
The group has exposure to the following risks from its use of financial instruments:· credit risk;· cash flow and liquidity risk; and· market risk.
This note presents information about the group’s exposure to each of the above risks and the group’s objectives, policies and processes for measuring and managing risk. Further quantitative disclosures are included throughout these consolidated financial statements.
The board of directors has overall responsibility for the establishment and oversight of the group’s risk management framework. The board has established the risk committee, which is responsible for developing and monitoring the group’s risk management policies. The committee reports quarterly to the board of directors on its activities.
The group’s risk management policies are established to identify and analyse the risks faced by the group, to set appropriate risk limits and controls, and to monitor risks and adherence to limits. Risk management policies and systems are reviewed regularly to reflect changes in market conditions and the group’s activities. The group, through its training and management standards and procedures, aims to develop a disciplined and constructive control environment in which all employees understand their roles and obligations.
The group audit committee oversees how management monitors compliance with the group’s risk management policies and procedures and reviews the adequacy of the risk management framework in relation to the risks faced by the group. The group audit committee is assisted in its oversight role by internal audit. Internal audit undertakes both regular and ad-hoc reviews of risk management controls and procedures, the results of which are reported to the audit committee.
22.2 Credit risk
Credit risk is the risk of financial loss to the group if a customer or counterparty to a financial instrument fails to meet its contractual obligations and arises on trade receivables – retail, cash, investments, participation in export partnerships, staff housing loans, RCS Group loan receivables and RCS Group private label card receivables.
Trade receivables – retailThe group’s exposure to credit risk is influenced mainly by the individual characteristics of each customer. There is no concentration of credit risk.
The risk arising on trade receivables – retail is managed through a stringent group policy on the granting, continual review and monitoring of credit sales. The group has established a credit policy under which each new customer is analysed individually for creditworthiness before payment terms and conditions are offered. A credit facility is established for each customer, which represents the maximum open amount without requiring approval from the risk management committee; these limits are reviewed annually.
The group does not require collateral in respect of trade and other receivables.
The group establishes an allowance for impairment that represents its estimate of incurred losses in respect of trade and other receivables. The allowance is calculated using the internationally-recognised Markov model. The Markov model uses delinquency roll rates on customer balances to determine the inherent bad debt in a debtors’ book. The board of directors believes that the application of the Markov model results in trade receivables balances being measured fairly.
Cash and investmentsThe group limits its exposure to credit risk through dealing with well-established financial institutions with high credit standing and thus management does not expect any counterparty to fail to meet its obligations. The group does not consider there to be any significant concentration of credit risk in respect of which adequate impairment has not been raised.
Participation in export partnershipsA company listed on the JSE Limited has warranted certain important cash flow aspects of the subsidiary companies’ participation in export partnerships. The group does not consider there to be any significant concentration of credit risk in respect of which adequate impairment has not been raised.
Staff housing loans, RCS Group loan receivables and RCS Group private label card receivablesThe group limits its exposure to credit risk through a stringent group policy on the granting, continual review and monitoring of loan advances. The group does not consider there to be any significant concentration of credit risk in respect of which adequate impairment has not been raised.
NOTES TO THE FINANCIAL STATEMENTS CONTINUEDfor the years ended 31 March
FOSC
HIN
I GRO
UP A
NN
UA
L REPORT 2010 - PA
GE 204
NO
TES TO TH
E FINA
NC
IAL STATEM
ENTS C
ON
TINU
ED
Foschini Limited and its subsidiaries
22. FINANCIAL RISK MANAGEMENT CONTINUED22.3 Cash flow and liquidity risk
Liquidity risk is the risk that the group will not be able to meet its financial obligations as they fall due. The group’s approach to managing liquidity is to ensure that it will always have sufficient cash flow to meet its liabilities when due, under both normal and stressed conditions, without incurring unacceptable losses or risking damage to the group’s reputation.
This risk is managed through cash flow forecasts, the optimisation of daily cash management and by ensuring that adequate borrowing facilities are maintained. In terms of the articles of association, the group’s borrowing powers are unlimited.
22.4 Market risk
Market risk is the risk that changes in market prices, such as foreign exchange rates, interest rates and equity prices will affect the group’s income or the value of its holdings of financial instruments. The objective of market risk management is to manage and control market risk exposures within acceptable parameters, whilst optimising the return.
The group uses derivative financial instruments to hedge its exposure to foreign exchange and interest rate risks arising from operational, financing and investment activities. In accordance with its treasury policy, the group does not hold or issue derivative financial instruments for trading purposes.
Currency riskThe group is exposed to currency risk as operating subsidiaries undertake transactions that are denominated in foreign currencies. These currencies are the Euro, US Dollars (USD) and Sterling (GBP).
At any point in time it is the group’s intention to hedge all its estimated foreign currency exposure in respect of forecast purchases over the following six months. The group uses forward exchange contracts to hedge its currency risk, most with a maturity of less than one year from the reporting date. When necessary, forward exchange contracts are rolled over at maturity.
Refer to note 23.3 for further details.
Interest rate riskThe group is exposed to interest rate risk as it both borrows and invests funds. This risk is managed by maintaining an appropriate mix of fixed and floating rate instruments with reputable financial institutions.
In addition, interest rate swap contracts are entered into for the purposes of cash flow hedging. The RCS Group loan receivables largely bear interest at fixed rates whilst borrowings bear interest at variable rates.
22.5 Capital management
The group primarily makes use of equity for capital management purposes.
The board’s policy is to maintain a strong capital base so as to maintain investor, creditor and market confidence, and to sustain future development of business. The board of directors monitors the return on equity, which the group defines as profit for the year divided by total average equity, including non-controlling interests. The board of directors also monitors the level of dividends to ordinary shareholders.
The board seeks to maintain a balance between the higher returns that might be possible with higher levels of borrowings and the advantages and security afforded by a sound capital position. The group’s medium-term target is to achieve a return on equity of 35%; in 2010 the return was 22,5% (2009: 26,9%).
From time to time the group purchases its own shares on the market. The shares are primarily intended to be used to meet the group’s obligations in terms of its share incentive schemes (refer note 34.1).
There were no changes in the group’s approach to capital management during the year.
NOTES TO THE FINANCIAL STATEMENTS CONTINUEDfor the years ended 31 March
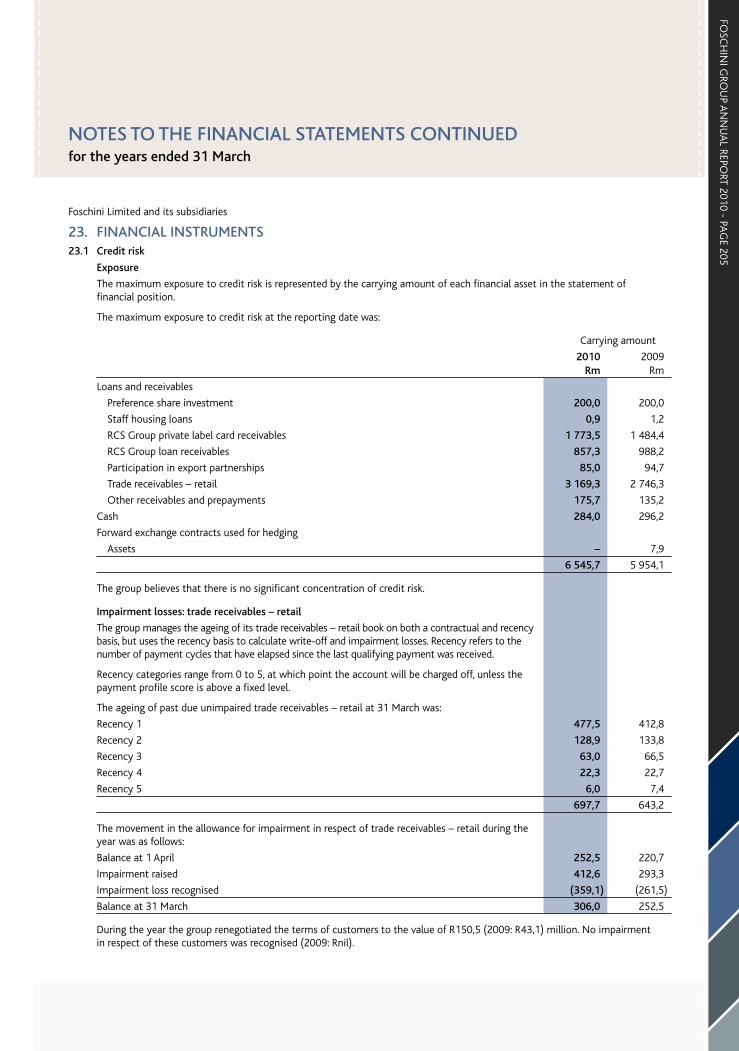
FOSC
HIN
I GRO
UP A
NN
UA
L REPORT 2010 - PA
GE 205
Foschini Limited and its subsidiaries
23. FINANCIAL INSTRUMENTS23.1 Credit risk
Exposure
The maximum exposure to credit risk is represented by the carrying amount of each financial asset in the statement of financial position.
The maximum exposure to credit risk at the reporting date was:
Carrying amount
2010 Rm
2009 Rm
Loans and receivables
Preference share investment 200,0 200,0
Staff housing loans 0,9 1,2
RCS Group private label card receivables 1 773,5 1 484,4
RCS Group loan receivables 857,3 988,2
Participation in export partnerships 85,0 94,7
Trade receivables – retail 3 169,3 2 746,3
Other receivables and prepayments 175,7 135,2
Cash 284,0 296,2
Forward exchange contracts used for hedging
Assets – 7,9
6 545,7 5 954,1
The group believes that there is no significant concentration of credit risk.
Impairment losses: trade receivables – retail
The group manages the ageing of its trade receivables – retail book on both a contractual and recency basis, but uses the recency basis to calculate write-off and impairment losses. Recency refers to the number of payment cycles that have elapsed since the last qualifying payment was received.
Recency categories range from 0 to 5, at which point the account will be charged off, unless the payment profile score is above a fixed level.
The ageing of past due unimpaired trade receivables – retail at 31 March was:
Recency 1 477,5 412,8
Recency 2 128,9 133,8
Recency 3 63,0 66,5
Recency 4 22,3 22,7
Recency 5 6,0 7,4
697,7 643,2
The movement in the allowance for impairment in respect of trade receivables – retail during the year was as follows:
Balance at 1 April 252,5 220,7
Impairment raised 412,6 293,3
Impairment loss recognised (359,1) (261,5)
Balance at 31 March 306,0 252,5
During the year the group renegotiated the terms of customers to the value of R150,5 (2009: R43,1) million. No impairmentin respect of these customers was recognised (2009: Rnil).
NOTES TO THE FINANCIAL STATEMENTS CONTINUEDfor the years ended 31 March
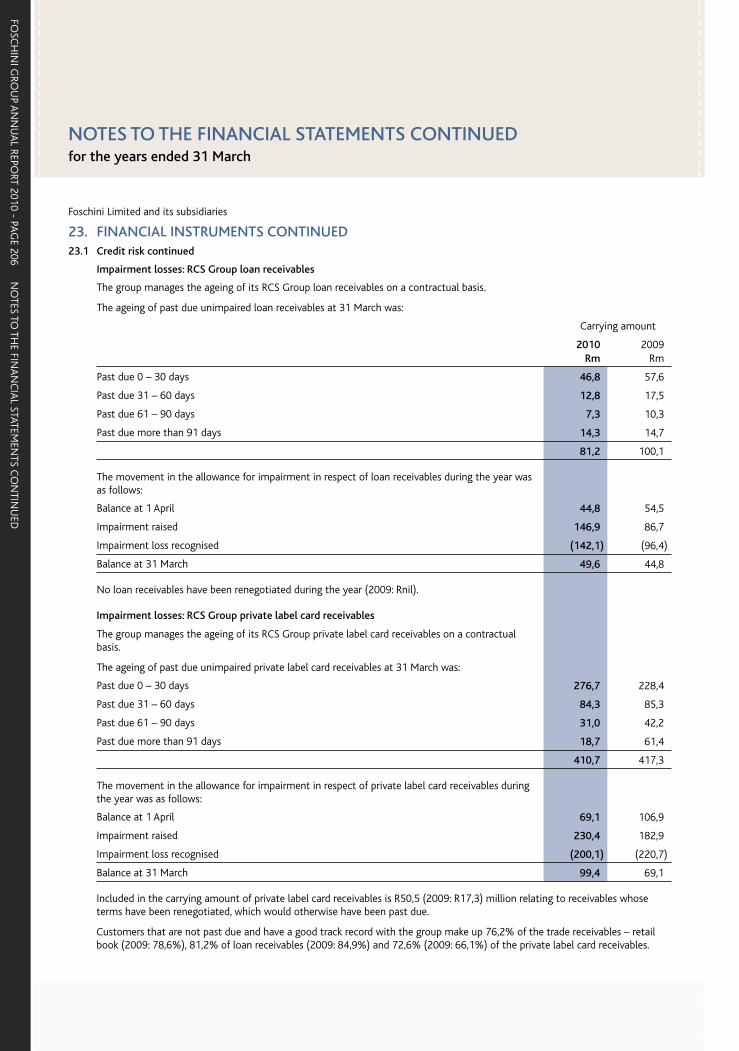
NO
TES TO TH
E FINA
NC
IAL STATEM
ENTS C
ON
TINU
EDFO
SCH
INI G
ROU
P AN
NU
AL REPO
RT 2010 - PAG
E 206
Foschini Limited and its subsidiaries
23. FINANCIAL INSTRUMENTS CONTINUED23.1 Credit risk continued
Impairment losses: RCS Group loan receivables
The group manages the ageing of its RCS Group loan receivables on a contractual basis.
The ageing of past due unimpaired loan receivables at 31 March was:
Carrying amount
2010 Rm
2009 Rm
Past due 0 – 30 days 46,8 57,6
Past due 31 – 60 days 12,8 17,5
Past due 61 – 90 days 7,3 10,3
Past due more than 91 days 14,3 14,7
81,2 100,1
The movement in the allowance for impairment in respect of loan receivables during the year was as follows:
Balance at 1 April 44,8 54,5
Impairment raised 146,9 86,7
Impairment loss recognised (142,1) (96,4)
Balance at 31 March 49,6 44,8
No loan receivables have been renegotiated during the year (2009: Rnil).
Impairment losses: RCS Group private label card receivables
The group manages the ageing of its RCS Group private label card receivables on a contractual basis.
The ageing of past due unimpaired private label card receivables at 31 March was:
Past due 0 – 30 days 276,7 228,4
Past due 31 – 60 days 84,3 85,3
Past due 61 – 90 days 31,0 42,2
Past due more than 91 days 18,7 61,4
410,7 417,3
The movement in the allowance for impairment in respect of private label card receivables during the year was as follows:
Balance at 1 April 69,1 106,9
Impairment raised 230,4 182,9
Impairment loss recognised (200,1) (220,7)
Balance at 31 March 99,4 69,1
Included in the carrying amount of private label card receivables is R50,5 (2009: R17,3) million relating to receivables whose terms have been renegotiated, which would otherwise have been past due.
Customers that are not past due and have a good track record with the group make up 76,2% of the trade receivables – retail book (2009: 78,6%), 81,2% of loan receivables (2009: 84,9%) and 72,6% (2009: 66,1%) of the private label card receivables.
NOTES TO THE FINANCIAL STATEMENTS CONTINUEDfor the years ended 31 March
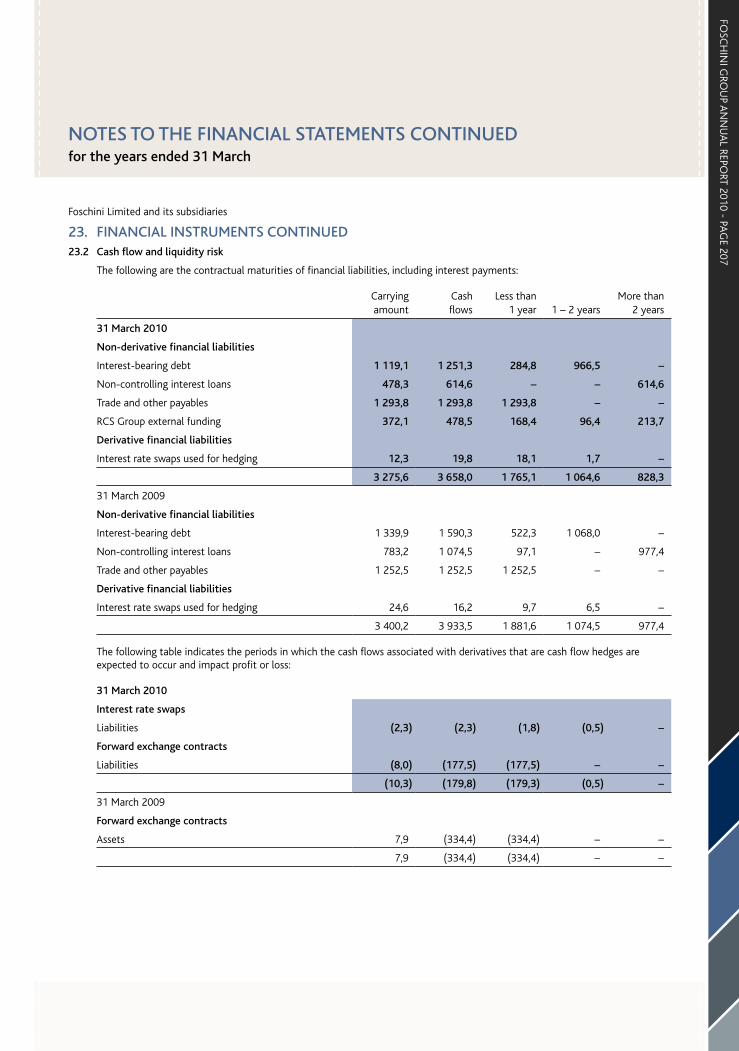
FOSC
HIN
I GRO
UP A
NN
UA
L REPORT 2010 - PA
GE 207
Foschini Limited and its subsidiaries
23. FINANCIAL INSTRUMENTS CONTINUED23.2 Cash flow and liquidity risk
The following are the contractual maturities of financial liabilities, including interest payments:
Carrying amount
Cash flows
Less than 1 year 1 – 2 years
More than 2 years
31 March 2010
Non-derivative financial liabilities
Interest-bearing debt 1 119,1 1 251,3 284,8 966,5 –
Non-controlling interest loans 478,3 614,6 – – 614,6
Trade and other payables 1 293,8 1 293,8 1 293,8 – –
RCS Group external funding 372,1 478,5 168,4 96,4 213,7
Derivative financial liabilities
Interest rate swaps used for hedging 12,3 19,8 18,1 1,7 –
3 275,6 3 658,0 1 765,1 1 064,6 828,3
31 March 2009
Non-derivative financial liabilities
Interest-bearing debt 1 339,9 1 590,3 522,3 1 068,0 –
Non-controlling interest loans 783,2 1 074,5 97,1 – 977,4
Trade and other payables 1 252,5 1 252,5 1 252,5 – –
Derivative financial liabilities
Interest rate swaps used for hedging 24,6 16,2 9,7 6,5 –
3 400,2 3 933,5 1 881,6 1 074,5 977,4
The following table indicates the periods in which the cash flows associated with derivatives that are cash flow hedges are expected to occur and impact profit or loss:
31 March 2010
Interest rate swaps
Liabilities (2,3) (2,3) (1,8) (0,5) –
Forward exchange contracts
Liabilities (8,0) (177,5) (177,5) – –
(10,3) (179,8) (179,3) (0,5) –
31 March 2009
Forward exchange contracts
Assets 7,9 (334,4) (334,4) – –
7,9 (334,4) (334,4) – –
NOTES TO THE FINANCIAL STATEMENTS CONTINUEDfor the years ended 31 March
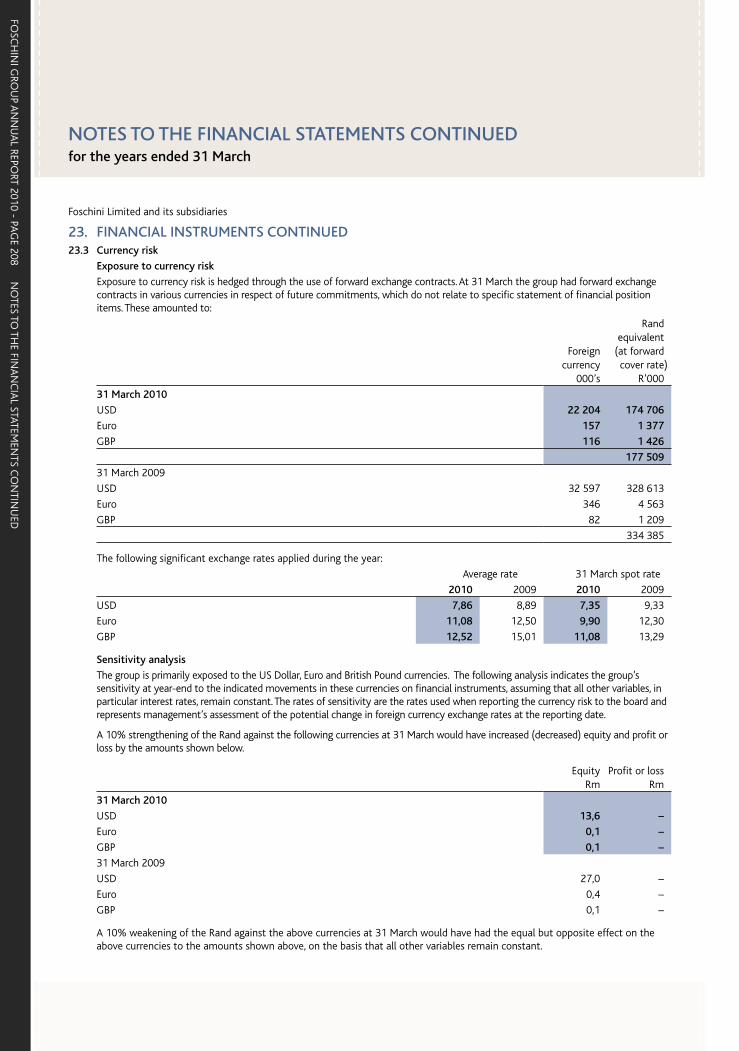
NO
TES TO TH
E FINA
NC
IAL STATEM
ENTS C
ON
TINU
EDFO
SCH
INI G
ROU
P AN
NU
AL REPO
RT 2010 - PAG
E 208
Foschini Limited and its subsidiaries
23. FINANCIAL INSTRUMENTS CONTINUED23.3 Currency risk
Exposure to currency risk
Exposure to currency risk is hedged through the use of forward exchange contracts. At 31 March the group had forward exchange contracts in various currencies in respect of future commitments, which do not relate to specific statement of financial position items. These amounted to:
Foreign currency
000’s
Rand equivalent(at forward cover rate)
R’000
31 March 2010
USD 22 204 174 706
Euro 157 1 377
GBP 116 1 426
177 509
31 March 2009
USD 32 597 328 613
Euro 346 4 563
GBP 82 1 209
334 385
The following significant exchange rates applied during the year:
Average rate 31 March spot rate
2010 2009 2010 2009
USD 7,86 8,89 7,35 9,33
Euro 11,08 12,50 9,90 12,30
GBP 12,52 15,01 11,08 13,29
Sensitivity analysis
The group is primarily exposed to the US Dollar, Euro and British Pound currencies. The following analysis indicates the group’s sensitivity at year-end to the indicated movements in these currencies on financial instruments, assuming that all other variables, in particular interest rates, remain constant. The rates of sensitivity are the rates used when reporting the currency risk to the board and represents management’s assessment of the potential change in foreign currency exchange rates at the reporting date.
A 10% strengthening of the Rand against the following currencies at 31 March would have increased (decreased) equity and profit or loss by the amounts shown below.
EquityRm
Profit or lossRm
31 March 2010
USD 13,6 –
Euro 0,1 –
GBP 0,1 –
31 March 2009
USD 27,0 –
Euro 0,4 –
GBP 0,1 –
A 10% weakening of the Rand against the above currencies at 31 March would have had the equal but opposite effect on the above currencies to the amounts shown above, on the basis that all other variables remain constant.
NOTES TO THE FINANCIAL STATEMENTS CONTINUEDfor the years ended 31 March
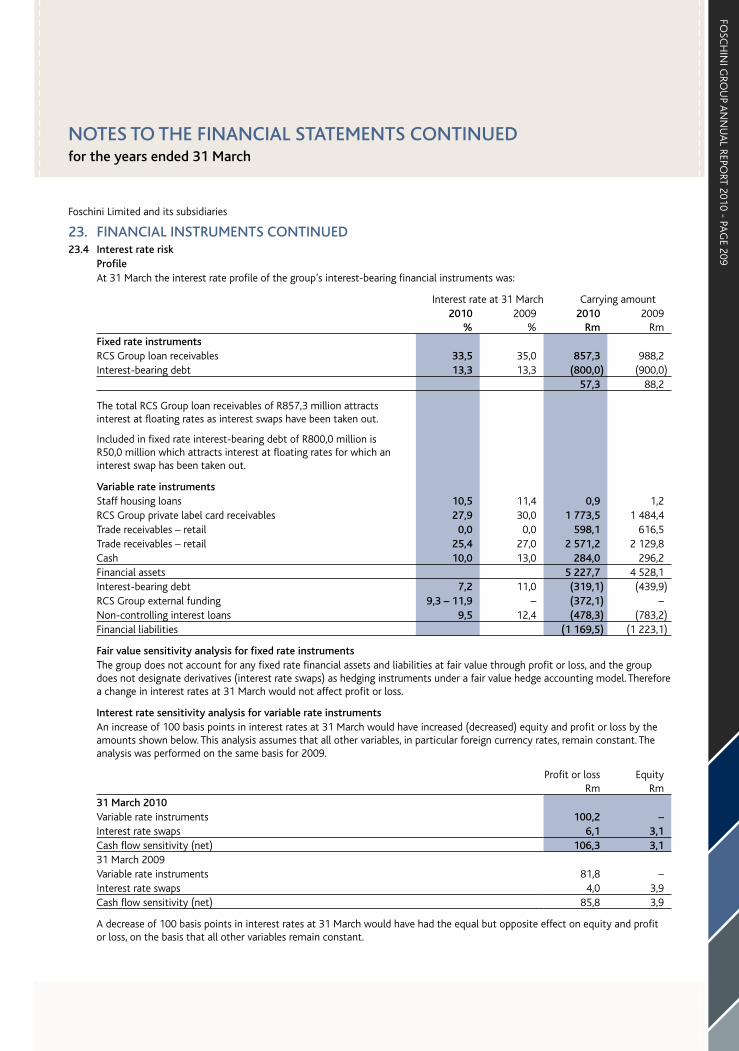
FOSC
HIN
I GRO
UP A
NN
UA
L REPORT 2010 - PA
GE 209
Foschini Limited and its subsidiaries
23. FINANCIAL INSTRUMENTS CONTINUED23.4 Interest rate risk
ProfileAt 31 March the interest rate profile of the group’s interest-bearing financial instruments was:
Interest rate at 31 March Carrying amount2010
%2009
%2010
Rm2009
RmFixed rate instrumentsRCS Group loan receivables 33,5 35,0 857,3 988,2 Interest-bearing debt 13,3 13,3 (800,0) (900,0)
57,3 88,2
The total RCS Group loan receivables of R857,3 million attracts interest at floating rates as interest swaps have been taken out.
Included in fixed rate interest-bearing debt of R800,0 million is R50,0 million which attracts interest at floating rates for which an interest swap has been taken out.
Variable rate instrumentsStaff housing loans 10,5 11,4 0,9 1,2 RCS Group private label card receivables 27,9 30,0 1 773,5 1 484,4 Trade receivables – retail 0,0 0,0 598,1 616,5 Trade receivables – retail 25,4 27,0 2 571,2 2 129,8 Cash 10,0 13,0 284,0 296,2 Financial assets 5 227,7 4 528,1 Interest-bearing debt 7,2 11,0 (319,1) (439,9)RCS Group external funding 9,3 – 11,9 – (372,1) –Non-controlling interest loans 9,5 12,4 (478,3) (783,2)Financial liabilities (1 169,5) (1 223,1)
Fair value sensitivity analysis for fixed rate instrumentsThe group does not account for any fixed rate financial assets and liabilities at fair value through profit or loss, and the group does not designate derivatives (interest rate swaps) as hedging instruments under a fair value hedge accounting model. Therefore a change in interest rates at 31 March would not affect profit or loss.
Interest rate sensitivity analysis for variable rate instrumentsAn increase of 100 basis points in interest rates at 31 March would have increased (decreased) equity and profit or loss by the amounts shown below. This analysis assumes that all other variables, in particular foreign currency rates, remain constant. The analysis was performed on the same basis for 2009.
Profit or lossRm
EquityRm
31 March 2010Variable rate instruments 100,2 – Interest rate swaps 6,1 3,1 Cash flow sensitivity (net) 106,3 3,1 31 March 2009Variable rate instruments 81,8 – Interest rate swaps 4,0 3,9 Cash flow sensitivity (net) 85,8 3,9
A decrease of 100 basis points in interest rates at 31 March would have had the equal but opposite effect on equity and profit or loss, on the basis that all other variables remain constant.
NOTES TO THE FINANCIAL STATEMENTS CONTINUEDfor the years ended 31 March

NO
TES TO TH
E FINA
NC
IAL STATEM
ENTS C
ON
TINU
EDFO
SCH
INI G
ROU
P AN
NU
AL REPO
RT 2010 - PAG
E 210
Foschini Limited and its subsidiaries
23. FINANCIAL INSTRUMENTS CONTINUED23.5 Fair values
Fair values versus carrying amountsThe fair values of financial assets and liabilities reasonably approximate their carrying values in the statement of financial position.
24. SUBSEQUENT EVENTSubsequent to the year-end RCS Group raised an additional R250 million funding as part of their domestic medium-term note (DMTN) programme.
Aside from the above, no other significant events took place between the end of the financial year under review and the date of signature of these financial statements.
2010 Rm
2009 Rm
25. COMMITMENTS AND CONTINGENT LIABILITIESAuthorised capital commitments 10,0 6,8
Contingent liabilitiesThe Foschini Group has provided RCS Group with a liquidity facility of R30,8 (2009: Rnil) million in respect of their DMTN programme.
Forward exchange commitmentsRefer to note 23.3.
26. REVENUERetail turnover 8 605,2 8 089,6 Interest received (refer note 27) 1 443,7 1 300,7 Dividends received – retail 13,8 19,1 Other revenue (refer note 28) 717,6 579,5
10 780,3 9 988,9
27. INTEREST RECEIVEDTrade receivables – retail 636,4 526,1RCS Group loan receivables 355,4 307,6RCS Group private label card receivables 440,3 449,2Sundry – RCS Group 2,7 8,2Sundry – retail 8,9 9,6
1 443,7 1 300,7
28. OTHER REVENUEMerchants’ commission – RCS Group 30,2 36,7Club income – retail 193,0 169,6Club income – RCS Group 5,4 6,0Customer charges income – retail 25,3 18,9Customer charges income – RCS Group 192,3 136,2Insurance income – retail 141,3 99,5Insurance income – RCS Group 87,8 75,3Cellular income – one2one airtime product 35,0 29,8Sundry income – retail 7,3 7,5
717,6 579,5
NOTES TO THE FINANCIAL STATEMENTS CONTINUEDfor the years ended 31 March
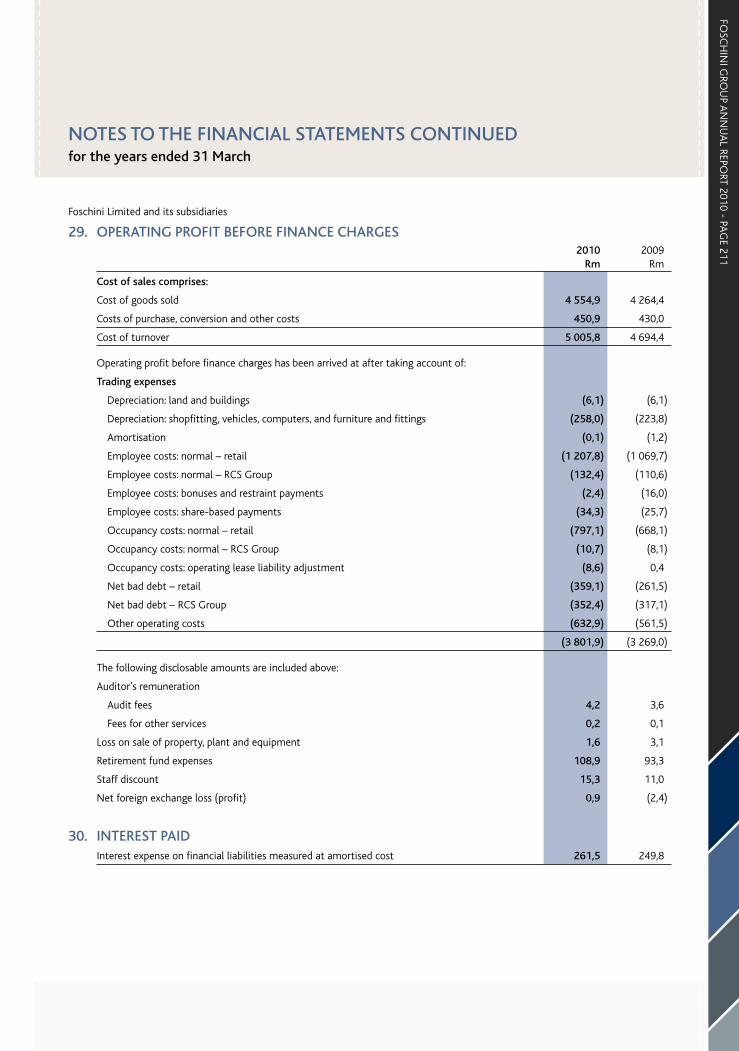
FOSC
HIN
I GRO
UP A
NN
UA
L REPORT 2010 - PA
GE 211
Foschini Limited and its subsidiaries
29. OPERATING PROFIT BEFORE FINANCE CHARGES2010
Rm2009
Rm
Cost of sales comprises:
Cost of goods sold 4 554,9 4 264,4
Costs of purchase, conversion and other costs 450,9 430,0
Cost of turnover 5 005,8 4 694,4
Operating profit before finance charges has been arrived at after taking account of:
Trading expenses
Depreciation: land and buildings (6,1) (6,1)
Depreciation: shopfitting, vehicles, computers, and furniture and fittings (258,0) (223,8)
Amortisation (0,1) (1,2)
Employee costs: normal – retail (1 207,8) (1 069,7)
Employee costs: normal – RCS Group (132,4) (110,6)
Employee costs: bonuses and restraint payments (2,4) (16,0)
Employee costs: share-based payments (34,3) (25,7)
Occupancy costs: normal – retail (797,1) (668,1)
Occupancy costs: normal – RCS Group (10,7) (8,1)
Occupancy costs: operating lease liability adjustment (8,6) 0,4
Net bad debt – retail (359,1) (261,5)
Net bad debt – RCS Group (352,4) (317,1)
Other operating costs (632,9) (561,5)
(3 801,9) (3 269,0)
The following disclosable amounts are included above:
Auditor’s remuneration
Audit fees 4,2 3,6
Fees for other services 0,2 0,1
Loss on sale of property, plant and equipment 1,6 3,1
Retirement fund expenses 108,9 93,3
Staff discount 15,3 11,0
Net foreign exchange loss (profit) 0,9 (2,4)
30. INTEREST PAIDInterest expense on financial liabilities measured at amortised cost 261,5 249,8
NOTES TO THE FINANCIAL STATEMENTS CONTINUEDfor the years ended 31 March
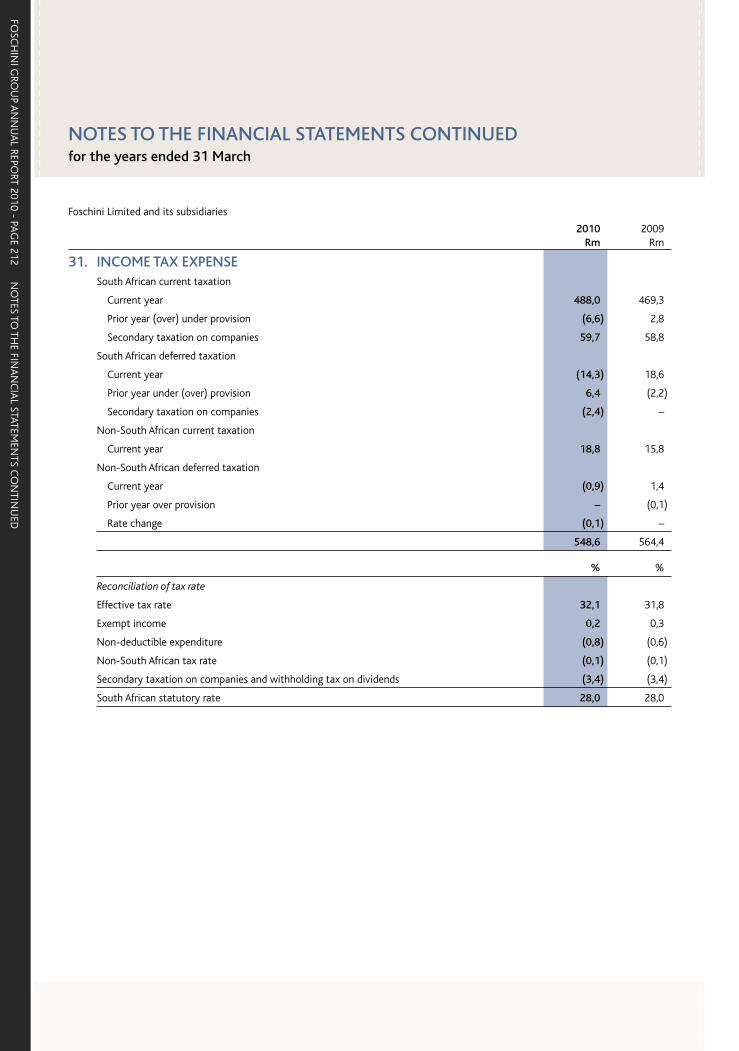
NO
TES TO TH
E FINA
NC
IAL STATEM
ENTS C
ON
TINU
EDFO
SCH
INI G
ROU
P AN
NU
AL REPO
RT 2010 - PAG
E 212
Foschini Limited and its subsidiaries
2010 Rm
2009 Rm
31. INCOME TAX EXPENSESouth African current taxation
Current year 488,0 469,3
Prior year (over) under provision (6,6) 2,8
Secondary taxation on companies 59,7 58,8
South African deferred taxation
Current year (14,3) 18,6
Prior year under (over) provision 6,4 (2,2)
Secondary taxation on companies (2,4) –
Non-South African current taxation
Current year 18,8 15,8
Non-South African deferred taxation
Current year (0,9) 1,4
Prior year over provision – (0,1)
Rate change (0,1) –
548,6 564,4
% %
Reconciliation of tax rate
Effective tax rate 32,1 31,8
Exempt income 0,2 0,3
Non-deductible expenditure (0,8) (0,6)
Non-South African tax rate (0,1) (0,1)
Secondary taxation on companies and withholding tax on dividends (3,4) (3,4)
South African statutory rate 28,0 28,0
NOTES TO THE FINANCIAL STATEMENTS CONTINUEDfor the years ended 31 March

FOSC
HIN
I GRO
UP A
NN
UA
L REPORT 2010 - PA
GE 213
Foschini Limited and its subsidiaries
32. EARNINGS PER SHARE32.1 Basic and headline earnings per share
The calculation of basic and headline earnings per share at 31 March 2010 was based on profit for the year attributable to ordinary shareholders of Foschini Limited and headline earnings of R1 085,6 (2009: R1 145,8) million divided by the weighted average number of ordinary shares as follows:
2010 Rm
2009 Rm
Profit attributable to equity holders of Foschini Limited 1 085,6 1 145,8
Headline earnings 1 085,6 1 145,8
Weighted average number of ordinary shares in issue 208 243 974 204 774 314
Earnings per ordinary share (cents) 521,4 559,5
Headline earnings per ordinary share (cents) 521,4 559,5
32.2 Diluted earnings and headline earnings per share
The calculation of diluted earnings and headline earnings per share at 31 March 2010 was based on profit for the year attributable to ordinary shareholders of Foschini Limited and headline earnings of R1 085,6 (2009: R1 145,8) million divided by the fully diluted weighted average number of ordinary shares as follows:
Weighted average number of ordinary shares as above 208 243 974 204 774 314
Number of shares that would have been issued for no consideration 1 264 151 2 401 781
Weighted average number of ordinary shares used for dilution 209 508 125 207 176 095
Diluted earnings per ordinary share (cents) 518,2 553,0
Diluted headline earnings per ordinary share (cents) 518,2 553,0
33. OPERATING LEASE OBLIGATIONThe group leases most of its trading premises under operating leases.
Leases on trading premises are contracted for periods of between five and ten years, with renewal options for a further five years, wherever possible. The lease agreements for certain stores provide for a minimum annual rental payment and additional payments determined on the basis of turnover. Turnover rentals, where applicable, average approximately 4,5% of turnover. Rental escalations vary, but average at a rate of approximately 8% per annum.
At 31 March, future non-cancellable minimum lease rentals are as follows:
Less than 1 year 837,5 732,0
More than 1 year and less than 5 years 2 043,4 1 748,8
More than 5 years 90,5 123,5
NOTES TO THE FINANCIAL STATEMENTS CONTINUEDfor the years ended 31 March
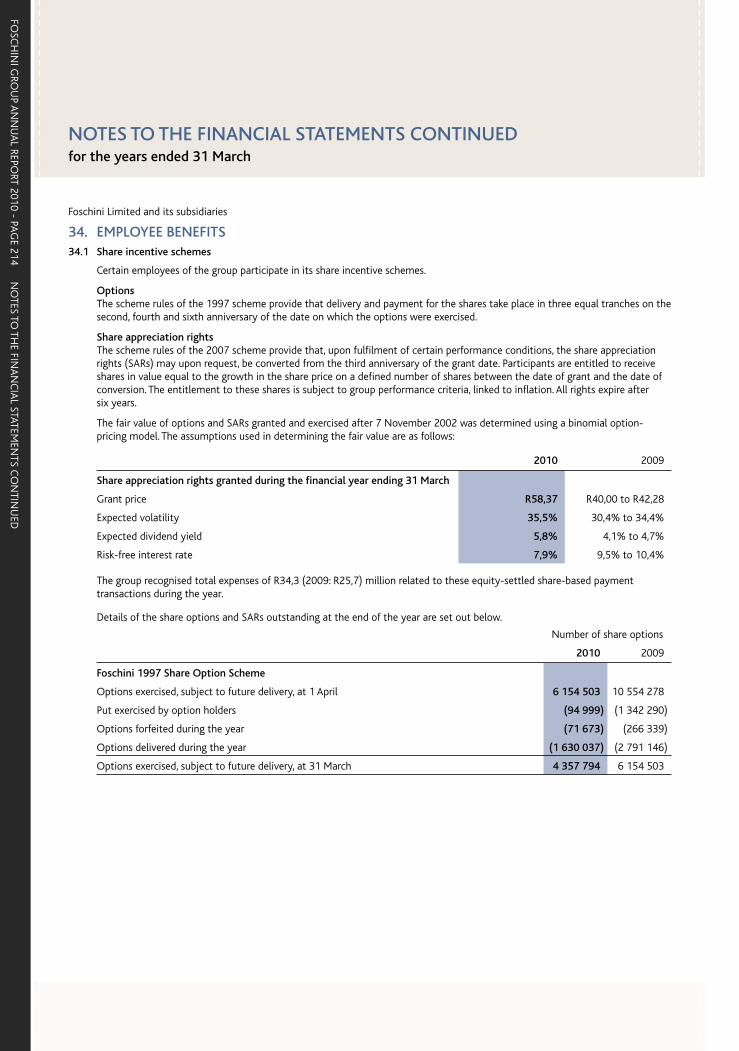
NO
TES TO TH
E FINA
NC
IAL STATEM
ENTS C
ON
TINU
EDFO
SCH
INI G
ROU
P AN
NU
AL REPO
RT 2010 - PAG
E 214
Foschini Limited and its subsidiaries
34. EMPLOYEE BENEFITS34.1 Share incentive schemes
Certain employees of the group participate in its share incentive schemes.
OptionsThe scheme rules of the 1997 scheme provide that delivery and payment for the shares take place in three equal tranches on the second, fourth and sixth anniversary of the date on which the options were exercised.
Share appreciation rightsThe scheme rules of the 2007 scheme provide that, upon fulfilment of certain performance conditions, the share appreciation rights (SARs) may upon request, be converted from the third anniversary of the grant date. Participants are entitled to receive shares in value equal to the growth in the share price on a defined number of shares between the date of grant and the date of conversion. The entitlement to these shares is subject to group performance criteria, linked to inflation. All rights expire after six years.
The fair value of options and SARs granted and exercised after 7 November 2002 was determined using a binomial option-pricing model. The assumptions used in determining the fair value are as follows:
2010 2009
Share appreciation rights granted during the financial year ending 31 March
Grant price R58,37 R40,00 to R42,28
Expected volatility 35,5% 30,4% to 34,4%
Expected dividend yield 5,8% 4,1% to 4,7%
Risk-free interest rate 7,9% 9,5% to 10,4%
The group recognised total expenses of R34,3 (2009: R25,7) million related to these equity-settled share-based payment transactions during the year.
Details of the share options and SARs outstanding at the end of the year are set out below.
Number of share options
2010 2009
Foschini 1997 Share Option Scheme
Options exercised, subject to future delivery, at 1 April 6 154 503 10 554 278
Put exercised by option holders (94 999) (1 342 290)
Options forfeited during the year (71 673) (266 339)
Options delivered during the year (1 630 037) (2 791 146)
Options exercised, subject to future delivery, at 31 March 4 357 794 6 154 503
NOTES TO THE FINANCIAL STATEMENTS CONTINUEDfor the years ended 31 March
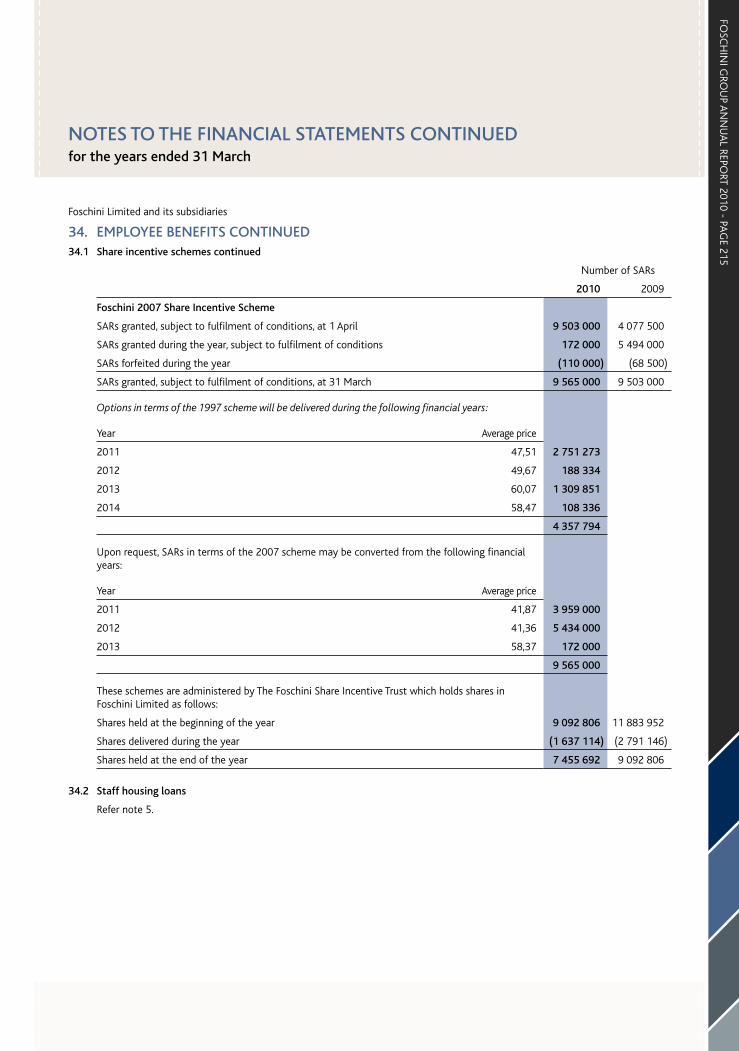
FOSC
HIN
I GRO
UP A
NN
UA
L REPORT 2010 - PA
GE 215
Foschini Limited and its subsidiaries
34. EMPLOYEE BENEFITS CONTINUED34.1 Share incentive schemes continued
Number of SARs
2010 2009
Foschini 2007 Share Incentive Scheme
SARs granted, subject to fulfilment of conditions, at 1 April 9 503 000 4 077 500
SARs granted during the year, subject to fulfilment of conditions 172 000 5 494 000
SARs forfeited during the year (110 000) (68 500)
SARs granted, subject to fulfilment of conditions, at 31 March 9 565 000 9 503 000
Options in terms of the 1997 scheme will be delivered during the following financial years:
Year Average price
2011 47,51 2 751 273
2012 49,67 188 334
2013 60,07 1 309 851
2014 58,47 108 336
4 357 794
Upon request, SARs in terms of the 2007 scheme may be converted from the following financial years:
Year Average price
2011 41,87 3 959 000
2012 41,36 5 434 000
2013 58,37 172 000
9 565 000
These schemes are administered by The Foschini Share Incentive Trust which holds shares in Foschini Limited as follows:
Shares held at the beginning of the year 9 092 806 11 883 952
Shares delivered during the year (1 637 114) (2 791 146)
Shares held at the end of the year 7 455 692 9 092 806
34.2 Staff housing loans
Refer note 5.
NOTES TO THE FINANCIAL STATEMENTS CONTINUEDfor the years ended 31 March
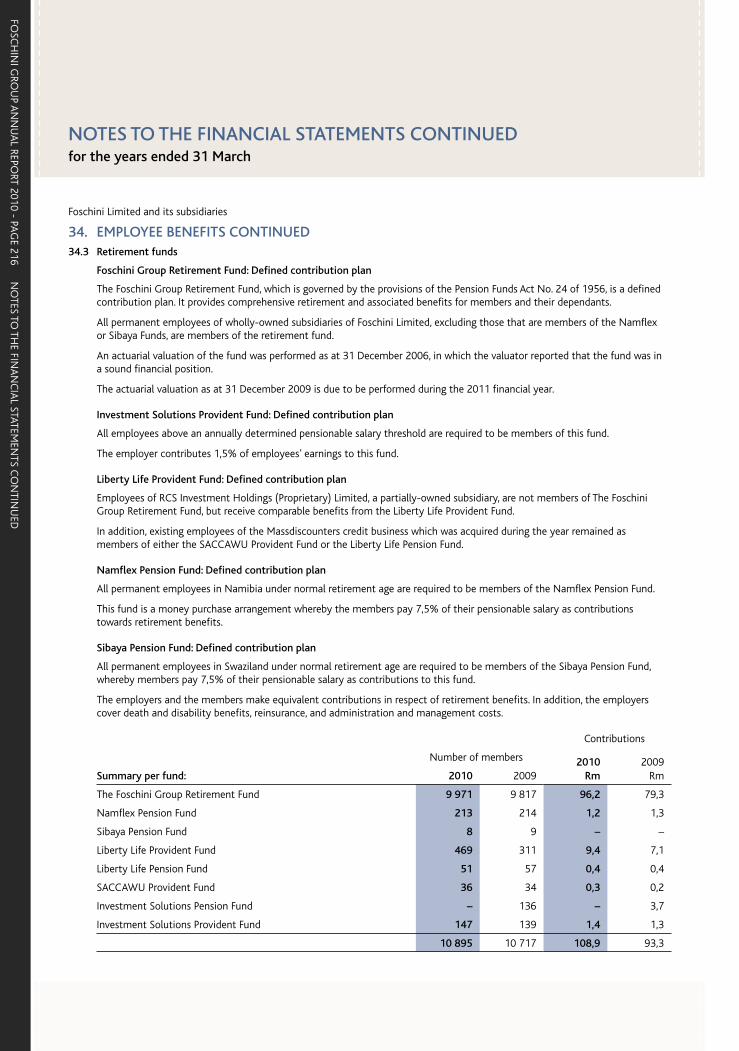
NO
TES TO TH
E FINA
NC
IAL STATEM
ENTS C
ON
TINU
EDFO
SCH
INI G
ROU
P AN
NU
AL REPO
RT 2010 - PAG
E 216
Foschini Limited and its subsidiaries
34. EMPLOYEE BENEFITS CONTINUED34.3 Retirement funds
Foschini Group Retirement Fund: Defined contribution plan
The Foschini Group Retirement Fund, which is governed by the provisions of the Pension Funds Act No. 24 of 1956, is a defined contribution plan. It provides comprehensive retirement and associated benefits for members and their dependants.
All permanent employees of wholly-owned subsidiaries of Foschini Limited, excluding those that are members of the Namflex or Sibaya Funds, are members of the retirement fund.
An actuarial valuation of the fund was performed as at 31 December 2006, in which the valuator reported that the fund was in a sound financial position.
The actuarial valuation as at 31 December 2009 is due to be performed during the 2011 financial year.
Investment Solutions Provident Fund: Defined contribution plan
All employees above an annually determined pensionable salary threshold are required to be members of this fund.
The employer contributes 1,5% of employees’ earnings to this fund.
Liberty Life Provident Fund: Defined contribution plan
Employees of RCS Investment Holdings (Proprietary) Limited, a partially-owned subsidiary, are not members of The Foschini Group Retirement Fund, but receive comparable benefits from the Liberty Life Provident Fund.
In addition, existing employees of the Massdiscounters credit business which was acquired during the year remained as members of either the SACCAWU Provident Fund or the Liberty Life Pension Fund.
Namflex Pension Fund: Defined contribution plan
All permanent employees in Namibia under normal retirement age are required to be members of the Namflex Pension Fund.
This fund is a money purchase arrangement whereby the members pay 7,5% of their pensionable salary as contributions towards retirement benefits.
Sibaya Pension Fund: Defined contribution plan
All permanent employees in Swaziland under normal retirement age are required to be members of the Sibaya Pension Fund, whereby members pay 7,5% of their pensionable salary as contributions to this fund.
The employers and the members make equivalent contributions in respect of retirement benefits. In addition, the employers cover death and disability benefits, reinsurance, and administration and management costs.
Contributions
Summary per fund:
Number of members 2010 Rm
2009 Rm2010 2009
The Foschini Group Retirement Fund 9 971 9 817 96,2 79,3
Namflex Pension Fund 213 214 1,2 1,3
Sibaya Pension Fund 8 9 – –
Liberty Life Provident Fund 469 311 9,4 7,1
Liberty Life Pension Fund 51 57 0,4 0,4
SACCAWU Provident Fund 36 34 0,3 0,2
Investment Solutions Pension Fund – 136 – 3,7
Investment Solutions Provident Fund 147 139 1,4 1,3
10 895 10 717 108,9 93,3
NOTES TO THE FINANCIAL STATEMENTS CONTINUEDfor the years ended 31 March

FOSC
HIN
I GRO
UP A
NN
UA
L REPORT 2010 - PA
GE 217
Foschini Limited and its subsidiaries
34. EMPLOYEE BENEFITS CONTINUED34.4 Medical aid
The Foschini Group Medical Aid Scheme: Defined benefit plan
The company and its wholly-owned subsidiaries operate a defined benefit medical aid scheme for the benefit of their permanent employees (excluding those employed in Namibia, Swaziland and Botswana). Membership of the scheme is voluntary, except for senior employees.
Total membership currently stands at 2 712 principal members.
These costs are charged against income as incurred and amounted to R26,9 (2009: R19,2) million, with employees contributing a further R26,9 million to the fund.
In respect of the year ended 31 December 2009, the scheme earned contributions of R50,2 million and reflected a net deficit of R2,9 million after the deduction of all expenses. The fund had net assets totalling R35,5 million.
The budgeted projected deficit in respect of the year ending 31 December 2010 is R2,7 million.
Bankmed Medical Aid Scheme: Defined benefit plan
Permanent employees in Namibia are voluntary members of the Bankmed Medical Aid Scheme.
These costs are charged against income as incurred and amounted to R0,7 (2009: R0,5) million, with employees contributing a further R0,7 million to the fund. There are currently 64 members of this fund.
Ingwe Health Plan: Defined benefit plan
An external medical aid scheme, Ingwe Health Plan, is also available to group employees and is subsidised by the group in the same way as the schemes mentioned above. The plans offered cater for lower income earners and 67 employees are currently members. Costs charged to income total R1,4 (2009: R1,4) million.
Discovery Health: Defined benefit plan
All permanent staff of RCS Investment Holdings (Proprietary) Limited, a partially-owned subsidiary, are required to become members of their choice of the medical plans offered by Discovery Health.
These costs are charged against income as incurred and amounted to R3,6 (2009: R3,0) million. Total membership currently stands at 509 principal members.
34.5 Post-retirement medical aid
Qualifying retired employees are entitled to medical aid benefits, which have been fully provided for (refer note 20).
The cost of providing post-retirement medical aid has been determined in accordance with IAS 19 and the charge against income for the year was Rnil (2009: Rnil) million.
The principal assumptions at the last valuation date, being 31 March 2010 were as follows:
Net discount rate 1,5%Withdrawal rates 0% – 20%Normal retirement age 60 – 65 years
34.6 Other
Group employees and pensioners are entitled to a discount on purchases made at stores within the group.
NOTES TO THE FINANCIAL STATEMENTS CONTINUEDfor the years ended 31 March
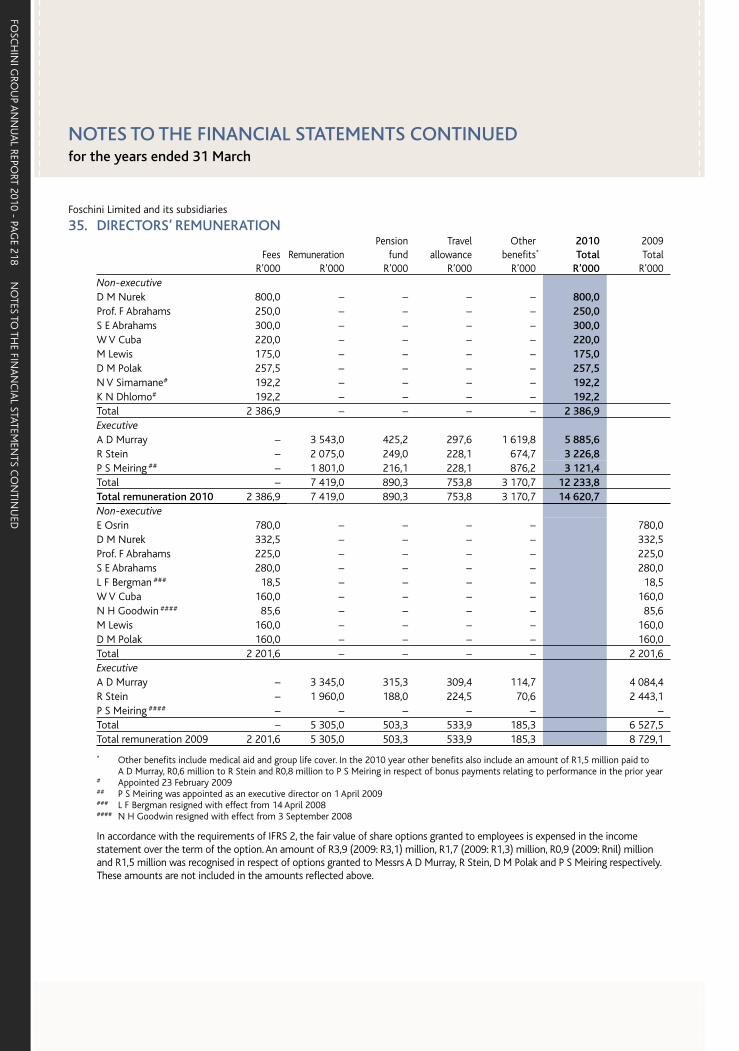
NO
TES TO TH
E FINA
NC
IAL STATEM
ENTS C
ON
TINU
EDFO
SCH
INI G
ROU
P AN
NU
AL REPO
RT 2010 - PAG
E 218
Foschini Limited and its subsidiaries
35. DIRECTORS’ REMUNERATION
Fees R’000
Remuneration R’000
Pension fund
R’000
Travel allowance
R’000
Other benefits*
R’000
2010Total
R’000
2009Total
R’000Non-executiveD M Nurek 800,0 – – – – 800,0 Prof. F Abrahams 250,0 – – – – 250,0 S E Abrahams 300,0 – – – – 300,0 W V Cuba 220,0 – – – – 220,0 M Lewis 175,0 – – – – 175,0 D M Polak 257,5 – – – – 257,5 N V Simamane# 192,2 – – – – 192,2 K N Dhlomo# 192,2 – – – – 192,2 Total 2 386,9 – – – – 2 386,9 ExecutiveA D Murray – 3 543,0 425,2 297,6 1 619,8 5 885,6 R Stein – 2 075,0 249,0 228,1 674,7 3 226,8 P S Meiring ## – 1 801,0 216,1 228,1 876,2 3 121,4 Total – 7 419,0 890,3 753,8 3 170,7 12 233,8Total remuneration 2010 2 386,9 7 419,0 890,3 753,8 3 170,7 14 620,7Non-executiveE Osrin 780,0 – – – – 780,0 D M Nurek 332,5 – – – – 332,5 Prof. F Abrahams 225,0 – – – – 225,0 S E Abrahams 280,0 – – – – 280,0 L F Bergman ### 18,5 – – – – 18,5 W V Cuba 160,0 – – – – 160,0 N H Goodwin #### 85,6 – – – – 85,6 M Lewis 160,0 – – – – 160,0 D M Polak 160,0 – – – – 160,0 Total 2 201,6 – – – – 2 201,6 ExecutiveA D Murray – 3 345,0 315,3 309,4 114,7 4 084,4 R Stein – 1 960,0 188,0 224,5 70,6 2 443,1 P S Meiring #### – – – – – –Total – 5 305,0 503,3 533,9 185,3 6 527,5 Total remuneration 2009 2 201,6 5 305,0 503,3 533,9 185,3 8 729,1
* Other benefits include medical aid and group life cover. In the 2010 year other benefits also include an amount of R1,5 million paid to A D Murray, R0,6 million to R Stein and R0,8 million to P S Meiring in respect of bonus payments relating to performance in the prior year
# Appointed 23 February 2009## P S Meiring was appointed as an executive director on 1 April 2009### L F Bergman resigned with effect from 14 April 2008#### N H Goodwin resigned with effect from 3 September 2008
In accordance with the requirements of IFRS 2, the fair value of share options granted to employees is expensed in the income statement over the term of the option. An amount of R3,9 (2009: R3,1) million, R1,7 (2009: R1,3) million, R0,9 (2009: Rnil) million and R1,5 million was recognised in respect of options granted to Messrs A D Murray, R Stein, D M Polak and P S Meiring respectively. These amounts are not included in the amounts reflected above.
NOTES TO THE FINANCIAL STATEMENTS CONTINUEDfor the years ended 31 March

FOSC
HIN
I GRO
UP A
NN
UA
L REPORT 2010 - PA
GE 219
Foschini Limited and its subsidiaries
36. RELATED PARTY TRANSACTIONSShareholders
An analysis of the principal shareholders of the company is provided in the Shareholdings section of the annual report.For details of directors’ interests refer to note 13.5.
Subsidiaries
During the year, in the ordinary course of business, certain companies within the group entered into arm’s length transactions. These intra-group transactions have been eliminated on consolidation.
Other related parties
The Foschini Group Retirement Fund
The Foschini Group Retirement Fund is administered by Foschini Retail Group (Proprietary) Limited, a subsidiary of Foschini Limited.
2010Rm
2009Rm
Administration fee earned from The Foschini Group Retirement Fund 1,8 1,7
An executive director of Foschini Limited (Mr R Stein) is also a trustee of The Foschini Group Retirement Fund.
Directors
Remuneration
Details relating to executive and non-executive directors’ remuneration are disclosed in note 35.
Interest of directors in contracts
No directors have any interests in contracts that are in contravention of section 234 of the Companies Act No. 61 of 1973.
Executive directors are bound by service contracts.
Loans to directors
No loans have been made to directors.
Employees
Details relating to the share incentive schemes are disclosed in note 34.1.
Key management personnel
Key management personnel are those having authority and responsibility for planning, directing and controlling activities, directly or indirectly, including any director of that entity. Executive directors and associates of all subsidiary companies and Foschini Limited have been classified as key management personnel.
No key management personnel had a material interest in any contract of significance with any group company during the year under review.
Remuneration paid to key management personnel is as follows:
Remuneration 77,5 59,6
Pension fund 8,8 6,1
Travel allowance 9,7 7,2
Other benefits 3,8 1,6
Performance bonus 1,1 0,9
Fair value of share options granted* 27,4 20,5
Total remuneration 128,3 95,9 * The fair value of options granted is the annual expense determined in accordance with IFRS 2 Share-based payments
Refer to note 35 for further disclosure regarding remuneration paid to executive directors of the company.
NOTES TO THE FINANCIAL STATEMENTS CONTINUEDfor the years ended 31 March

NO
TES TO TH
E FINA
NC
IAL STATEM
ENTS C
ON
TINU
EDFO
SCH
INI G
ROU
P AN
NU
AL REPO
RT 2010 - PAG
E 220
NOTES TO THE FINANCIAL STATEMENTS CONTINUEDfor the years ended 31 March
Foschini Limited and its subsidiaries
2010Rm
2009Rm
37. CASH FLOW37.1 Operating profit before working capital changes
Profit before tax 1 711,1 1 775,7
Adjusted for:
Interest received (11,6) (17,8)
Interest paid 261,5 249,8
Dividends received (13,8) (19,1)
Non-cash items 290,3 240,0
Operating profit before working capital changes 2 237,5 2 228,6
37.2 Working capital changes
Decrease (increase) in inventory 31,1 (234,9)
Increase in trade and other receivables (613,8) (830,5)
Increase in trade and other payables 41,3 510,7
Increase in working capital (541,4) (554,7)
37.3 Reconciliation of taxation paid
Amount unpaid at the beginning of the year (70,6) (64,9)
Current year provision (559,9) (546,7)
Current tax effect of other items in equity 15,2 (10,3)
Amount unpaid at the end of the year 128,0 70,6
(487,3) (551,3)
37.4 Reconciliation of dividends paid
Dividends declared during the year (599,1) (589,2)
Dividends paid by subsidiary to outside shareholders (9,1) (0,6)
(608,2) (589,8)
37.5 Acquisition of Massdiscounters credit business
On 30 June 2008 RCS Cards (Proprietary) Limited acquired the consumer credit business of MDD Financial Services, a division of Masstores (Proprietary) Limited for an amount of R7,5 million.
The right, title and interest in the receivables’ book of MDD Financial Services were ceded to RCS Cards (Proprietary) Limited for an amount of R167,5 million.
The cash flow effects of the acquisition are reflected below.
Purchase consideration – 175,0
Fair value of net assets – 167,5
Goodwill – 7,5
Purchase consideration – 175,0
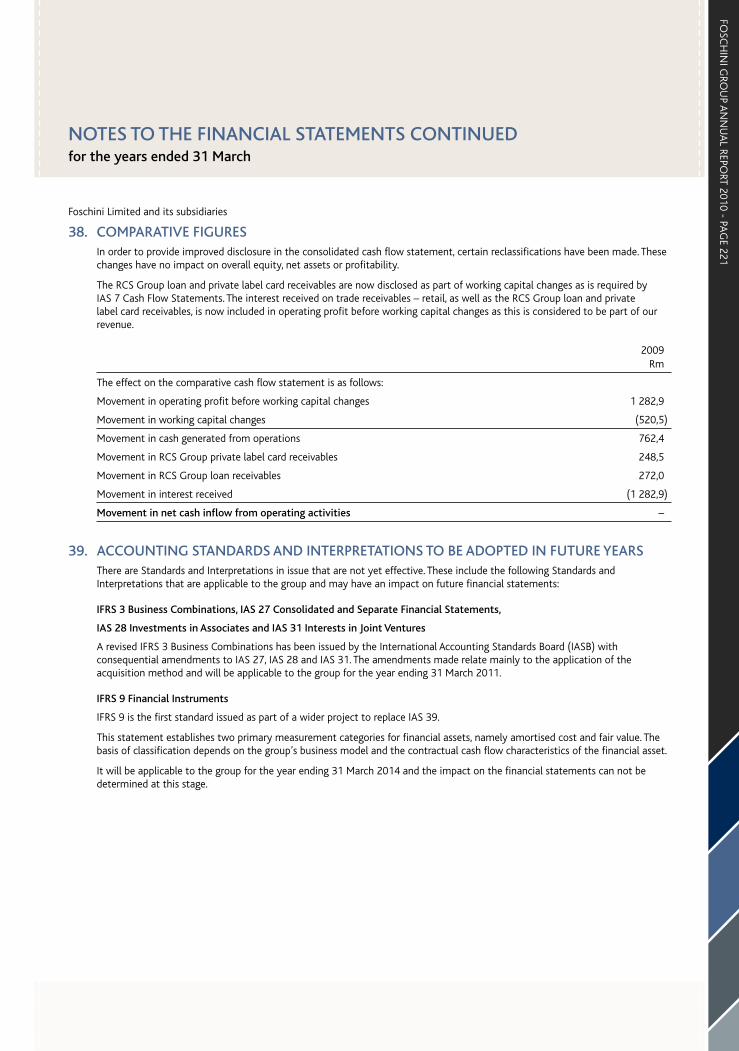
FOSC
HIN
I GRO
UP A
NN
UA
L REPORT 2010 - PA
GE 221
Foschini Limited and its subsidiaries
38. COMPARATIVE FIGURESIn order to provide improved disclosure in the consolidated cash flow statement, certain reclassifications have been made. These changes have no impact on overall equity, net assets or profitability.
The RCS Group loan and private label card receivables are now disclosed as part of working capital changes as is required by IAS 7 Cash Flow Statements. The interest received on trade receivables – retail, as well as the RCS Group loan and private label card receivables, is now included in operating profit before working capital changes as this is considered to be part of our revenue.
2009Rm
The effect on the comparative cash flow statement is as follows:
Movement in operating profit before working capital changes 1 282,9
Movement in working capital changes (520,5)
Movement in cash generated from operations 762,4
Movement in RCS Group private label card receivables 248,5
Movement in RCS Group loan receivables 272,0
Movement in interest received (1 282,9)
Movement in net cash inflow from operating activities –
39. ACCOUNTING STANDARDS AND INTERPRETATIONS TO BE ADOPTED IN FUTURE YEARSThere are Standards and Interpretations in issue that are not yet effective. These include the following Standards and Interpretations that are applicable to the group and may have an impact on future financial statements:
IFRS 3 Business Combinations, IAS 27 Consolidated and Separate Financial Statements,
IAS 28 Investments in Associates and IAS 31 Interests in Joint Ventures
A revised IFRS 3 Business Combinations has been issued by the International Accounting Standards Board (IASB) with consequential amendments to IAS 27, IAS 28 and IAS 31. The amendments made relate mainly to the application of the acquisition method and will be applicable to the group for the year ending 31 March 2011.
IFRS 9 Financial Instruments
IFRS 9 is the first standard issued as part of a wider project to replace IAS 39.
This statement establishes two primary measurement categories for financial assets, namely amortised cost and fair value. The basis of classification depends on the group’s business model and the contractual cash flow characteristics of the financial asset.
It will be applicable to the group for the year ending 31 March 2014 and the impact on the financial statements can not be determined at this stage.
NOTES TO THE FINANCIAL STATEMENTS CONTINUEDfor the years ended 31 March
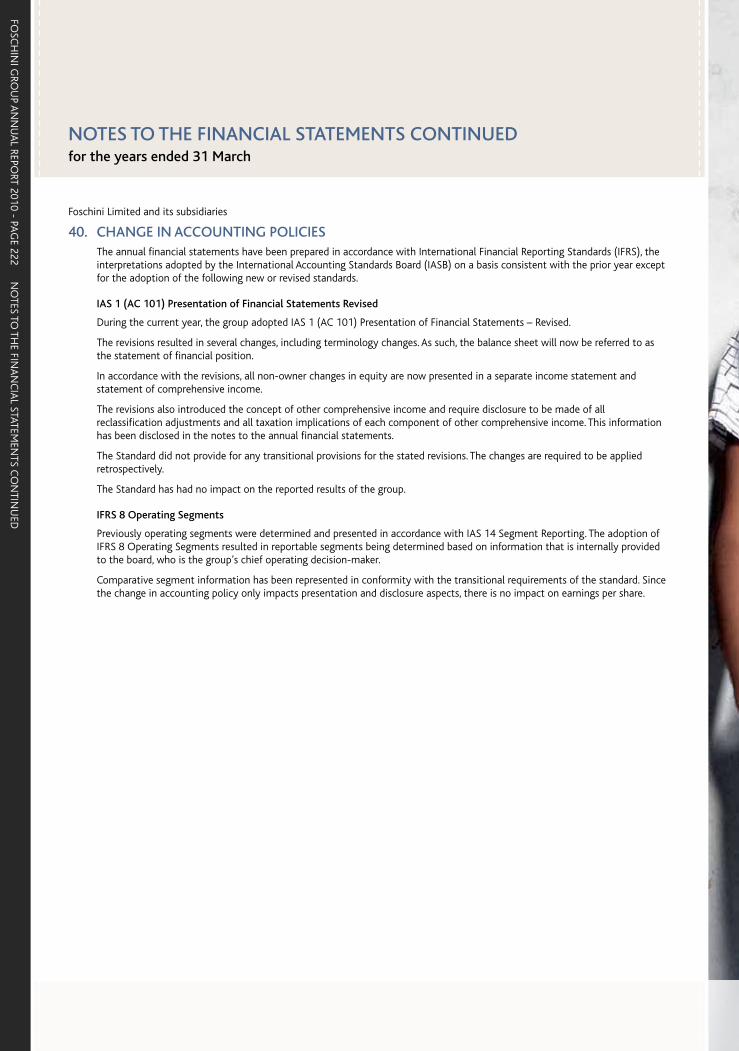
NO
TES TO TH
E FINA
NC
IAL STATEM
ENTS C
ON
TINU
EDFO
SCH
INI G
ROU
P AN
NU
AL REPO
RT 2010 - PAG
E 222
Foschini Limited and its subsidiaries
40. CHANGE IN ACCOUNTING POLICIESThe annual financial statements have been prepared in accordance with International Financial Reporting Standards (IFRS), the interpretations adopted by the International Accounting Standards Board (IASB) on a basis consistent with the prior year except for the adoption of the following new or revised standards.
IAS 1 (AC 101) Presentation of Financial Statements Revised
During the current year, the group adopted IAS 1 (AC 101) Presentation of Financial Statements – Revised.
The revisions resulted in several changes, including terminology changes. As such, the balance sheet will now be referred to as the statement of financial position.
In accordance with the revisions, all non-owner changes in equity are now presented in a separate income statement and statement of comprehensive income.
The revisions also introduced the concept of other comprehensive income and require disclosure to be made of all reclassification adjustments and all taxation implications of each component of other comprehensive income. This information has been disclosed in the notes to the annual financial statements.
The Standard did not provide for any transitional provisions for the stated revisions. The changes are required to be applied retrospectively.
The Standard has had no impact on the reported results of the group.
IFRS 8 Operating Segments
Previously operating segments were determined and presented in accordance with IAS 14 Segment Reporting. The adoption of IFRS 8 Operating Segments resulted in reportable segments being determined based on information that is internally provided to the board, who is the group’s chief operating decision-maker.
Comparative segment information has been represented in conformity with the transitional requirements of the standard. Since the change in accounting policy only impacts presentation and disclosure aspects, there is no impact on earnings per share.
NOTES TO THE FINANCIAL STATEMENTS CONTINUEDfor the years ended 31 March

FOSC
HIN
I GRO
UP A
NN
UA
L REPORT 2010 - PA
GE 223
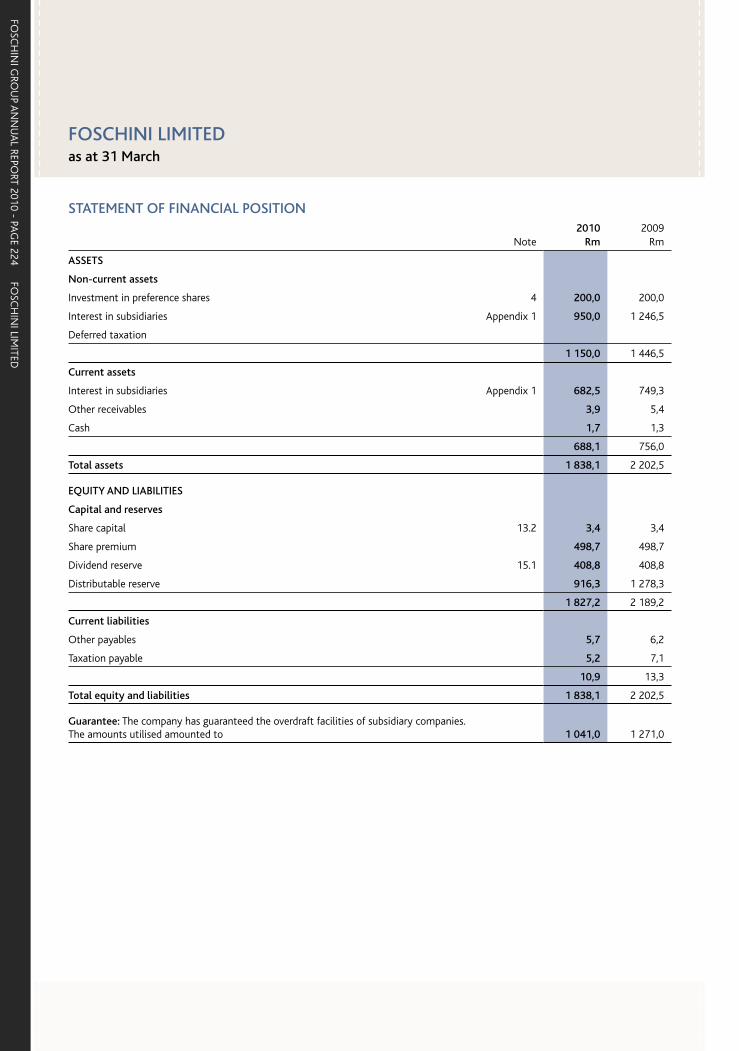
FOSC
HIN
I GRO
UP A
NN
UA
L REPORT 2010 - PA
GE 224
FOSC
HIN
I LIMITED
FOSCHINI LIMITEDas at 31 March
STATEMENT OF FINANCIAL POSITION
Note2010
Rm2009
Rm
ASSETS
Non-current assets
Investment in preference shares 4 200,0 200,0
Interest in subsidiaries Appendix 1 950,0 1 246,5
Deferred taxation
1 150,0 1 446,5
Current assets
Interest in subsidiaries Appendix 1 682,5 749,3
Other receivables 3,9 5,4
Cash 1,7 1,3
688,1 756,0
Total assets 1 838,1 2 202,5
EQUITY AND LIABILITIES
Capital and reserves
Share capital 13.2 3,4 3,4
Share premium 498,7 498,7
Dividend reserve 15.1 408,8 408,8
Distributable reserve 916,3 1 278,3
1 827,2 2 189,2
Current liabilities
Other payables 5,7 6,2
Taxation payable 5,2 7,1
10,9 13,3
Total equity and liabilities 1 838,1 2 202,5
Guarantee: The company has guaranteed the overdraft facilities of subsidiary companies. The amounts utilised amounted to 1 041,0 1 271,0
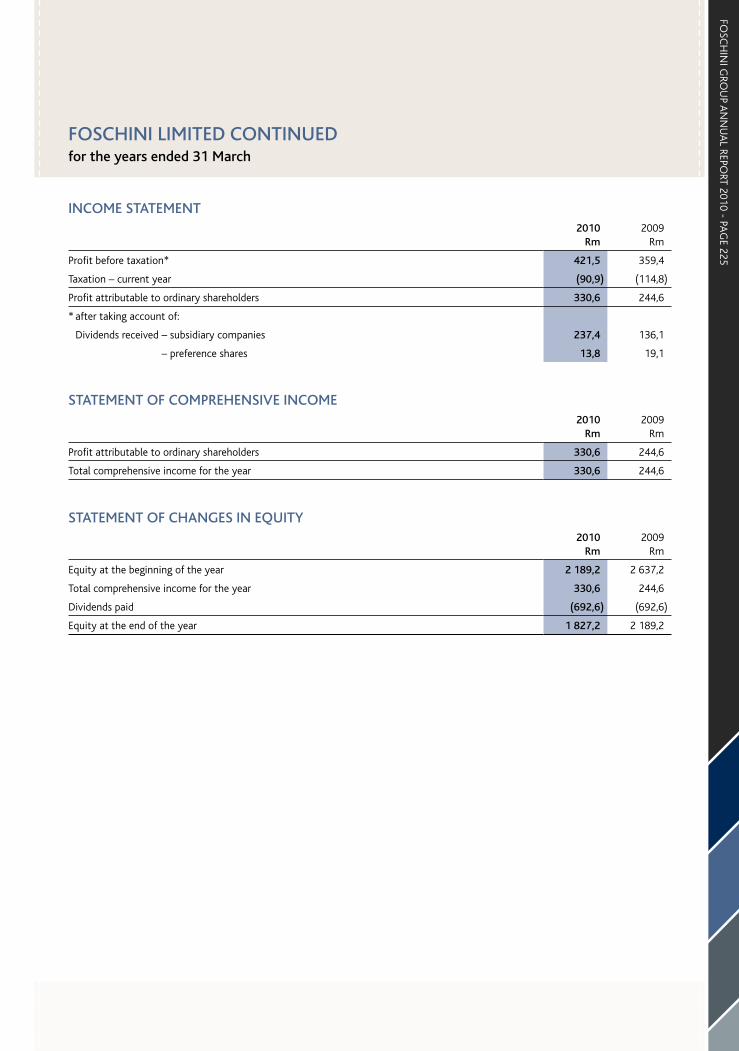
FOSC
HIN
I GRO
UP A
NN
UA
L REPORT 2010 - PA
GE 225
FOSCHINI LIMITED CONTINUEDfor the years ended 31 March
INCOME STATEMENT2010
Rm2009
Rm
Profit before taxation* 421,5 359,4
Taxation – current year (90,9) (114,8)
Profit attributable to ordinary shareholders 330,6 244,6
* after taking account of:
Dividends received – subsidiary companies 237,4 136,1
– preference shares 13,8 19,1
STATEMENT OF COMPREHENSIVE INCOME2010
Rm2009
Rm
Profit attributable to ordinary shareholders 330,6 244,6
Total comprehensive income for the year 330,6 244,6
STATEMENT OF CHANGES IN EQUITY2010
Rm2009
Rm
Equity at the beginning of the year 2 189,2 2 637,2
Total comprehensive income for the year 330,6 244,6
Dividends paid (692,6) (692,6)
Equity at the end of the year 1 827,2 2 189,2

FOSC
HIN
I GRO
UP A
NN
UA
L REPORT 2010 - PA
GE 226
FOSC
HIN
I LIMITED
CO
NTIN
UED
FOSCHINI LIMITED CONTINUEDfor the years ended 31 March
APPENDIX 1: SUBSIDIARY COMPANIES
Name of subsidiary Note
Issuedshare
capitalR
2010 Cost
Rm
2009 CostRm
2010 Indebted-
nessRm
2009 Indebted-
nessRm
Trading subsidiaries
Foschini Retail Group (Proprietary) Limited 2, 3, 7 2 102,5 102,5 727,0 1 142,6
Retail Credit Solutions (Proprietary) Limited 2 18 200 – – – –
What U Want To Wear (Proprietary) Limited 2 66 200 0,1 0,1 – –
Markhams (Proprietary) Limited 2 1 – – – –
Fashion Retailers (Proprietary) Limited 4 250 006 0,2 0,2 – –
Foschini Finance (Proprietary) Limited 2, 7 6 – – 153,0 219,9
Foschini Services (Proprietary) Limited 2 10 – – – –
Foschini Stores (Proprietary) Limited 2, 6 1 – – 528,6 528,6
Foschini Swaziland (Proprietary) Limited 5 2 – – – –
Foschini Investments (Proprietary) Limited 2 10 – – – –
Pienaar Sithole and Associates (Proprietary) Limited 2, 7 100 – – 1,8 1,8
TFG Apparel Supply Company (Proprietary) Limited 2, 7 2 – – 119,1 –
Total trading subsidiaries 102,8 102,8 1 529,5 1 892,9
Other* 1,1 1,1 (0,9) (0,9)
Total 103,9 103,9 1 528,6 1 892,0
Summary2010
Rm2009
Rm
Investment in shares at cost 103,9 103,9
Amounts owing by subsidiaries – non-current portion 846,1 1 142,6
Total non-current portion 950,0 1 246,5
Amounts owing by subsidiaries – current portion 682,5 749,3
Total interest in subsidiaries 1 632,5 1 995,8
Notes
1. The company owns, directly or indirectly, all the ordinary shares in the subsidiaries listed above.2. Incorporated in South Africa. 3. Included is an amount of R102,5 (2009: R102,5 ) million representing the fair value of 102 500 R1 preference shares issued on
28 February 2002. The directors’ valuation thereof at 31 March 2010 is R102,5 (2009: R102,5) million.4. Incorporated in Namibia.5. Incorporated in Swaziland.6. The loan to subsidiary is unsecured, interest free and no fixed date for repayment has been determined.7. The loan to subsidiary is unsecured, bears interest at rates determined from time to time and no fixed date for repayment has been
determined. By mutual agreement the loan will not be repayable within the next 12 months.
* A schedule of these details is available on request
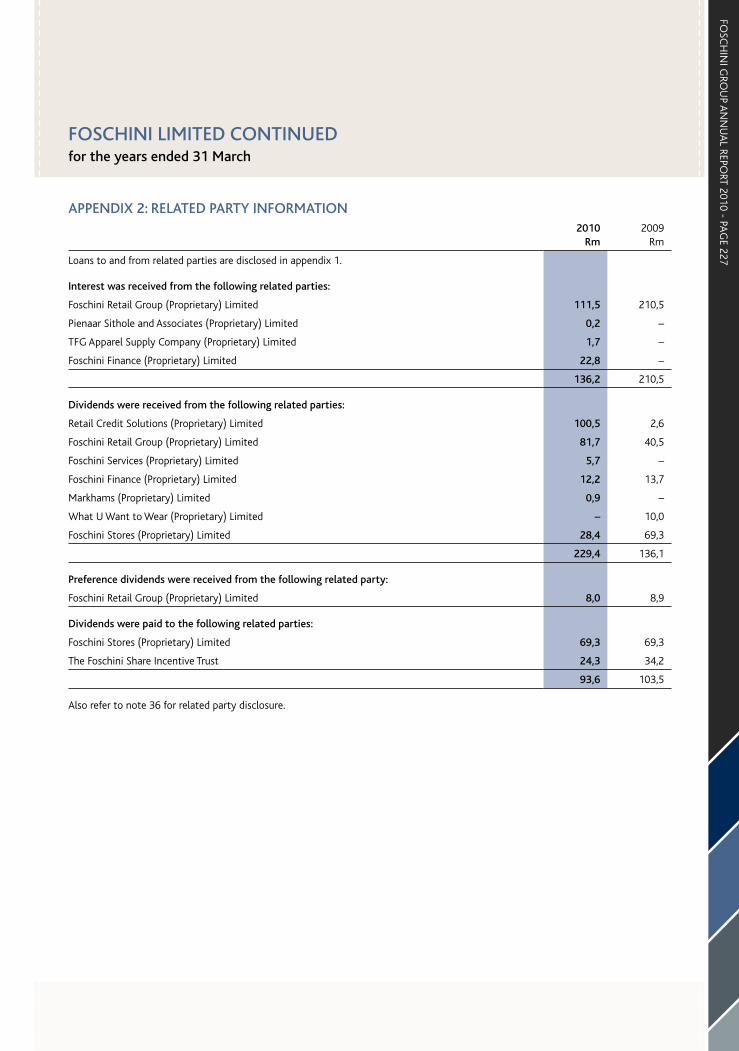
FOSC
HIN
I GRO
UP A
NN
UA
L REPORT 2010 - PA
GE 227
FOSCHINI LIMITED CONTINUEDfor the years ended 31 March
APPENDIX 2: RELATED PARTY INFORMATION2010
Rm2009
Rm
Loans to and from related parties are disclosed in appendix 1.
Interest was received from the following related parties:
Foschini Retail Group (Proprietary) Limited 111,5 210,5
Pienaar Sithole and Associates (Proprietary) Limited 0,2 –
TFG Apparel Supply Company (Proprietary) Limited 1,7 –
Foschini Finance (Proprietary) Limited 22,8 –
136,2 210,5
Dividends were received from the following related parties:
Retail Credit Solutions (Proprietary) Limited 100,5 2,6
Foschini Retail Group (Proprietary) Limited 81,7 40,5
Foschini Services (Proprietary) Limited 5,7 –
Foschini Finance (Proprietary) Limited 12,2 13,7
Markhams (Proprietary) Limited 0,9 –
What U Want to Wear (Proprietary) Limited – 10,0
Foschini Stores (Proprietary) Limited 28,4 69,3
229,4 136,1
Preference dividends were received from the following related party:
Foschini Retail Group (Proprietary) Limited 8,0 8,9
Dividends were paid to the following related parties:
Foschini Stores (Proprietary) Limited 69,3 69,3
The Foschini Share Incentive Trust 24,3 34,2
93,6 103,5
Also refer to note 36 for related party disclosure.

FOSC
HIN
I GRO
UP A
NN
UA
L REPORT 2010 - PA
GE 228
SHA
REHO
LDIN
GS
SHAREHOLDINGSFoschini Limited
ANALYSIS OF SHAREHOLDING AT 26 MARCH 2010
Spread analysisNo. of
shareholdings % of total Number of shares held
% of shares in issue
1 – 1 000 shares 2 319 55,1 886 737 0,4
1 001 – 10 000 shares 1 248 29,6 4 115 676 1,7
10 001 – 100 000 shares 428 10,2 15 392 473 6,4
100 001 – 1 000 000 shares 174 4,1 54 686 668 22,7
1 000 001 shares and over 43 1,0 165 416 687 68,8
Total 4 212 100,0 240 498 241 100,0
Distribution of shareholdings
Banks 140 3,3 81 874 965 34,0
Companies 213 5,1 31 805 365 13,2
Individuals 2 722 64,6 11 223 026 4,7
Insurance companies 59 1,4 14 358 690 6,0
Mutual funds 195 4,6 29 421 963 12,2
Nominee companies and trusts 614 14,6 12 840 481 5,3
Pension and provident fund 269 6,4 58 973 751 24,6
4 212 100,0 240 498 241 100,0
Shareholding spread
Directors 21 0,5 18 658 690 7,8
Subsidiary 1 – 24 049 824 10,0
Trustees 2 0,1 7 455 692 3,1
Public 4 188 99,4 190 334 035 79,1
Total 4 212 100,0 240 498 241 100,0
Beneficial shareholdings greater than 5%
Beneficial interests (direct and indirect), as per share register and information supplied by nominee companies at 26 March 2010.
Government Employees’ Pension Fund 38 542 659 16,0
Foschini Stores (Proprietary) Limited 24 049 824 10,0
Lewis family 12 816 874 5,3
Fund managers holding greater than 5%
According to disclosures made, the following fund managers administered client portfolios which included more than 5% of the companys issued shares
Public Investment Corporation 28 009 348 11,6
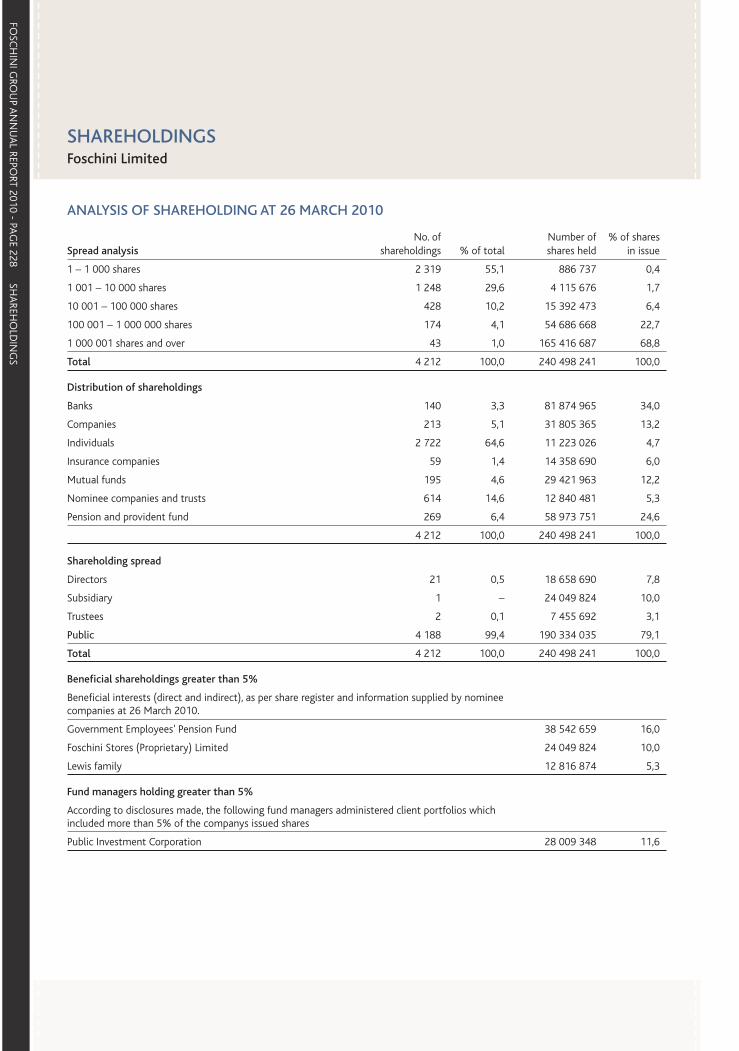
ADMINISTRATION
SHAREHOLDERS’ CALENDAR
Foschini LimitedReg. No. 1937/009504/06 JSE codes: FOS – FOSP ISIN: ZAE000031019 – ZAE000031027
Registered OfficeStanley Lewis Centre 340 Voortrekker Road Parow East 7500 South Africa
Head OfficeStanley Lewis Centre 340 Voortrekker Road Parow East 7500 South Africa Telephone +27 (0) 21 938 1911
SecretaryD Sheard B Comm, CA(SA) Stanley Lewis Centre 340 Voortrekker Road Parow East 7500 South Africa PO Box 6020, Parow East 7501 South Africa
SponsorUBS South Africa (Proprietary) Limited 64 Wierda Road East, Wierda Valley Sandton 2196 South Africa
AuditorsKPMG Inc
AttorneysEdward Nathan Sonnenbergs Inc
Principal BankerFirst Rand Bank Limited
Transfer SecretariesComputershare Investor Services (Proprietary) Limited 9th Floor, 70 Marshall Street Johannesburg 2001 South Africa PO Box 61051, 2107 Marshalltown South Africa Telephone +27 (0) 11 370 5000
United States ADR DepositaryThe Bank of New York Mellon 620 Ave. of the Americas New York, NY 10011
Websitehttp://www.foschinigroup.com/
Financial year-end 31 March 2010
Annual Report 31 July 2010
Annual general meeting (73rd) 1 September 2010
Interim profit announcement 4 November 2010
Dividend payments
Ordinary – final July 2010
– interim January 2011
Preference – interim September 2010
– final March 2011
The Foschini Limited Annual Report is printed on Sappi Triple Green™ – a paper grade manufactured according to three environmental pillars: A minimum of 60% of the pulp used in the production of this paper is sugar cane fibre, which is the material remaining after raw sugar has been extracted from sugar cane; the bleaching process is elemental chlorine-free; and the remaining pulp used in the production process comprises wood fibre which is obtained from sustainable and internationally certified afforestation, using independently audited chains of custody.

FOSC
HIN
I GRO
UP A
NN
UA
L REPORT 2010 - PA
GE 169