founding and requirements of starting a plastics product
TRANSCRIPT

Founding and requirements of starting a plastics product factory Case Hämeen Lanka
Paul Fletcher
Degree Thesis
Plastics technology
2013
1

2
DEGREE THESIS Arcada Degree Programme: Plastics Technology Identification number: 3128 Author: Paul Fletcher Title: Founding and requirements of starting a plastics product
factory. Case Hämeen Lanka. Supervisor (Arcada): Henry Clay Ericsson Commissioned by: Abstract:
This thesis is a study on finding a suitable product or product group to manufacture at an predefined domestic factory site, which offers certain infrastructural services, but simultaneously has its own drawbacks.The main objects of the thesis is to provide feasi-bility of producing plastic goods in Finland, analyse and define a suitable product or product group. A suitable manufacturing process and raw material must be chosen, and a layout of the factory must be defined to produce these goods. Lastly, profitability calcula-tions based on the product or product group have been made to estimate if its manufac-ture is profitable enough to execute. Research for this thesis has been conducted by factory visits, field studies and observations, interviewing experts in the field and fellow students, literature studies, drawings and calculations covering profitability, required manpower, and raw material pricing and production machinery were based on life-like figures. As an result, a suitable product was found, the manufacture of preforms to produce beverage bottles mainly for domestic producers. The study covers several scenarios on production, what kind of production methods were considered and what kind of methods can be possibly used to decrease the production costs. The author concludes that the biggest profitability factor is raw material costs, and their vigorous fluctuations. Thus the increasing research into bioplastics and their future possibilities of utilisation is vital and important also to improve the preforms enviromentally-friendliness, their biggest current drawback being carbon dioxide permeability. Keywords: Hämeen Lanka, Injection moulding, PET, PLA, Preform
production, Beverage production, Profitability calculations,
Number of pages: 80 Language: English Date of acceptance:
3
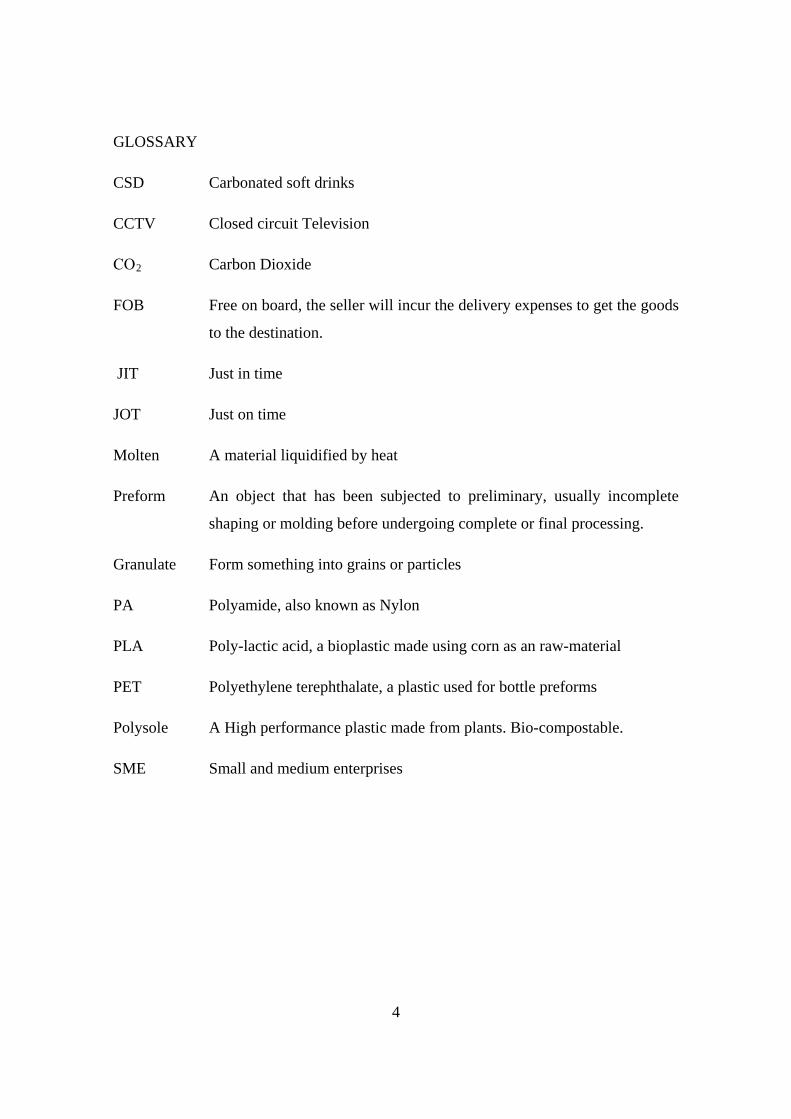
GLOSSARY
CSD Carbonated soft drinks
CCTV Closed circuit Television
СО2 Carbon Dioxide
FOB Free on board, the seller will incur the delivery expenses to get the goods
to the destination.
JIT Just in time
JOT Just on time
Molten A material liquidified by heat
Preform An object that has been subjected to preliminary, usually incomplete
shaping or molding before undergoing complete or final processing.
Granulate Form something into grains or particles
PA Polyamide, also known as Nylon
PLA Poly-lactic acid, a bioplastic made using corn as an raw-material
PET Polyethylene terephthalate, a plastic used for bottle preforms
Polysole A High performance plastic made from plants. Bio-compostable.
SME Small and medium enterprises
4

Contents
1 Introduction .......................................................................................................... 13
1.1 Backround ................................................................................................................... 13 1.2 Objective ...................................................................................................................... 13 1.3 Methology .................................................................................................................... 13
1.3.1 Factory visits, field studies and observations ...................................................... 14 1.3.2 Interviews ............................................................................................................ 14 1.3.3 Literature studies ................................................................................................. 14 1.3.4 Drawings .............................................................................................................. 14 1.3.5 Calculations ......................................................................................................... 14
2 The existing factory ............................................................................................. 15
2.1 Factory premises ......................................................................................................... 15 2.2 Backround ................................................................................................................... 15 2.3 Survey of premises ...................................................................................................... 16 2.4 Measurements of the building ..................................................................................... 16 2.5 Water ........................................................................................................................... 16
2.5.1 Drinking water ...................................................................................................... 17 2.6 Heating and electricity consumption ............................................................................ 17 2.7 Main building – old part ............................................................................................... 17 2.8 Siporex part of the building .......................................................................................... 18 2.9 Cold storage ................................................................................................................ 18
3 Alternatives of plastic products for manufacture ............................................ 20
3.1 Type of product to manufacture .................................................................................. 20 3.1.1 Medical goods ..................................................................................................... 20 3.1.2 Household utensils .............................................................................................. 20 3.1.3 Preform manufacture for bottles for soft drinks and mineral waters ................... 21
3.2 Comparison of production figures and their generation of turnover ............................ 21 3.2.1 Insulin needles and syringes ............................................................................... 21 3.2.2 Soft drinks and mineral water preforms ............................................................... 22
3.3 Choosing the product .................................................................................................. 23 3.3.1 Syringes, insulin pen needles and similar medical goods ................................... 23 3.3.2 Household utensils .............................................................................................. 24 3.3.3 Preform manufacture ........................................................................................... 24
3.4 Choice of product for manufacture .............................................................................. 25 Logistical location .................................................................................................................... 25
5

3.5 Transportation of preforms to mineral water and beverage manufacturers and
harbours .................................................................................................................................. 26
4 Literature review .................................................................................................. 28
4.1 Beverage bottle preform manufacture ......................................................................... 28 4.2 The preform manufacturing process ........................................................................... 28
4.2.1 The Preform manufacturing process in 6 steps .................................................. 29 4.3 Materials used for beverage perform manufacture ..................................................... 29
4.3.1 Poly(ethylene terephthalate) Overview ............................................................... 30 4.3.2 Polylactic acid (PLA Overview) ........................................................................... 30
4.4 Disadvantages when using Polyethylene Terepthalate as a raw material .................. 31 4.4.1 Appearance and crystallisation-related issues .................................................... 31 4.4.2 Carbon dioxide permeability ................................................................................ 32
4.5 Disadvantages when using Polylactic acid as a raw material ..................................... 32 4.5.1 Heat stability ........................................................................................................ 32 4.5.2 Composting ......................................................................................................... 33 4.5.3 Using PLA for beverages with Carbon dioxide as a protective gas or for fizz .... 33 4.5.4 Moral issues ........................................................................................................ 33
4.6 Conclusion of the literature survey .............................................................................. 34
5 Product decision ................................................................................................. 35
6 Manufacturing Processes and materials ........................................................... 35
6.1 Manufacturing method ................................................................................................. 35 6.1.1 In general ............................................................................................................. 35 6.1.2 Injection moulding ................................................................................................ 35 6.1.3 Drawbacks on injection moulding ........................................................................ 37 6.1.4 The future of preform production ........................................................................ 37
7 Factory Layout ..................................................................................................... 38
8 Layout of production facilities ........................................................................... 39
9 Financial calculations ......................................................................................... 41
9.1 Raw materials .............................................................................................................. 41 9.1.1 Bottle grade PET ................................................................................................. 41 9.1.2 Additives and colour ............................................................................................ 41
9.2 Preform price (Product price without investments) ..................................................... 42 9.3 Production capacity restrictions ................................................................................... 43 9.4 Background on cost calculations for plastics production ............................................. 44 9.5 Heating expenses ........................................................................................................ 45
6
9.6 Insurance ..................................................................................................................... 46 9.7 Overhaul of premises .................................................................................................. 46 9.8 Maintenance of production machines and site equipment .......................................... 47 9.9 Employee wages ......................................................................................................... 47 9.10 Production equipment ................................................................................................. 48 9.11 Investment loan ........................................................................................................... 49 9.12 Factory building ownership alternatives ...................................................................... 50 9.13 Real-life market share and profitability estimations ..................................................... 50 9.14 Break-even .................................................................................................................. 51 9.15 Wage subsidy support ................................................................................................. 52 9.16 Exit strategy ................................................................................................................. 54
10 Financial parameters: ...................................................................................... 54
10.1 Return on investment (ROI) ........................................................................................ 54 10.1.1 ROI Estimation for 20 year time period ............................................................... 56
10.2 EBIT ............................................................................................................................. 56 10.3 Debt/equity ratio .......................................................................................................... 57 10.4 Return on Assets (ROA) .............................................................................................. 58
11 Ownership of the factory ................................................................................. 58
11.1 Holding company ......................................................................................................... 58 11.2 Collaborative preform production with beverage producers........................................ 59 11.3 Co-ownership of the preform production plant ............................................................ 59
12 Employee availability ....................................................................................... 60
13 Use of the end product .................................................................................... 61
14 Conclusion ....................................................................................................... 63
14.1 Is it profitable of not ? .................................................................................................. 64
15 Discussion ........................................................................................................ 65
15.1 Cutting production costs .............................................................................................. 65 15.2 Light weighing .............................................................................................................. 65 15.3 RPET ........................................................................................................................... 66 15.4 Buffer stocking of raw materials .................................................................................. 67
References .................................................................................................................. 68
7
Figure 1 Hämeen Lanka 1st floor layout Source PI Projekti-Insinöörit ......................... 18
Figure 3 Hämeen Lanka factory layout 3rd floor Source PI Projekti-Insinöörit ............ 19
Figure 2 Hämeen Lanka factory layout 2nd floor Source PI Projekti-Insinöörit ........... 19
Figure 4 attaching a string onto a sleigh at Orthex. Picture source
http://www.yrittajat.fi/File/09e7932f-9ccd-42f8-a6c2-fb7ed200ab51/orthex2.jpg ....... 21
Figure 5 A cowskin-style letterbox Picture source http://www.dilishop.fi/Postilaatikko-
Lehmae post box ............................................................................................................. 21
Figure 6: Orthex retail store Picture source http://www.tjt-
kaluste.fi/myymalakalusteet.shtml ................................................................................. 21
Figure 7 Diagram of a hypodermic syringe. Source:
http://www.madehow.com/images/hpm_ ....................................................................... 23
Figure 8 Insulin pen needle. Source http://www.diabeticlive.com/wp-
content/uploads/2010/06/BD-Pen-Needles-300x210.gif ................................................ 24
Figure 9 Turnover estimations of production alternative based on 2010 turnover. Figure
by Paul Fletcher. ............................................................................................................. 25
Figure 10 Locations of largest beverage producers & breweries in Finland. Picture
source: Google Maps & Paul Fletcher ............................................................................ 26
Figure 11 the main Finnish harbours on the southern coast. Picture source: Google
Maps & Paul Fletcher ..................................................................................................... 27
Figure 12 Preform manufacture process. Source: http://mse-gsd1.matsceng.ohio-
state.edu/~glenn/HS_Mat_Sci/Unfiled_Content/ASM_07Disc/MST/EMTECH_%20Ha
ndouts/EMTECH_Demos.pdf ........................................................................................ 29
Figure 13: The repeat unit of PET. Source: Surface Properties of Poly(ethylene
terephthalate), Thomas Matthews .................................................................................. 30
Figure 14: Poly(lactic acid) (PLA) Source:
http://www.uweb.engr.washington.edu/research/tutorials/plagla.html .......................... 31
Figure 15 Diagram of an injection moulding machine. Picture source:
http://www.cheresources.com/content/articles/bulk-solids/basics-of-injection-molding36
Figure 16: 72-cavity mould. Picture source: http://www.mega-machinery.com/preform-
mold02.pdf ...................................................................................................................... 37
8
Figure 18 Husky HyPET Preform product examples. Picture source HyPET Systems
brochure, http://www.husky.ca/documentlibrary.aspx?id=2147483911 ........................ 38
Figure 17 Example measurements of 24 g preform [53] ................................................ 38
Figure 19 Factory layout ................................................................................................ 40
Figure 20 PET Bottle grade raw material historical prices 2002 - 2010 source
www.europlasticnews.com ............................................................................................. 41
Figure 21 Chain extender dosage. Source: Additives for the Modification of
Poly(Ethylene Terephthalate) to Produce Engineering-Grade Polymers by J Scheirs. .. 42
Figure 22 Production capacity of HYPET 225 & 300 [53] ........................................... 44
Figure 23: Calculation of ROI with uneven cash flow. Source Henry Clay Ericsson´s
lecture notes .................................................................................................................... 55
Figure 24 ROI Calculation ............................................................................................. 55
Figure 25 ROI Calculation values .................................................................................. 55
Figure 26 Companies which took part in Salpaus´es questionnaire related to their
workforce size and their industrial field. Ruiskuvalu = injection moulding. Picture
source Loppuraportti_julkinen, received by email from Timo Malén during August
2010. ............................................................................................................................... 61
Figure 27 Flow chart on RPET manufacturing process. Source:
http://www.bepet.com/article-on-recycling.htm............................................................. 66
Table 1 Need for syringes & insulin pens for medical use in Finland 2010 .................. 22
Table 2 Domestic sales of domestic soft drinks and mineral waters Source:
http://www.etl.fi/www/en/statistics/files/Domestic_sales_of_Finnish_food_products.pdf
fetched 20th September 2011 ......................................................................................... 22
Table 3 Domestic sales per package type. Source
http://www.panimoliitto.fi/panimoliitto/liitetiedostot/pdf/pakkaukset1999_2010.pdf
fetched 6th October 2011 ............................................................................................... 23
Table 4 Estimate of beverage and mineral water preform market turnover in Finland
2010 ................................................................................................................................ 23
Table 5 Logistical information of customers. Source of information route calculations
from Google Maps .......................................................................................................... 27
Table 6 Product cost without investments ...................................................................... 43 9

Table 7 Estimated electricity costs for preform production, using a 225-ton and 300-ton
injection moulding machines .......................................................................................... 45
Table 8 Wage calculations for factory running under 50 % production capacity .......... 48
Table 9 Annual wage costs of the workers if the market share rises over 50 % of
possible factory production capacity .............................................................................. 48
Table 10 the contents of the whole investment loan ...................................................... 49
Table 11 Loan payback scheme...................................................................................... 49
Table 12 Cost estimation for 2013-2023 above and below ............................................ 51
Table 13 Break-even figures........................................................................................... 52
Table 14 Personnel wages with possible subsidy compensations .................................. 53
Table 16 EBIT 2013-2023 .............................................................................................. 57
Table 17ROA and Debt/Equity ratio calculations .......................................................... 58
Table 18 Shareholder scenario with present market share growth assumptions ............ 59
Table 19 schools and educational establishments offering training in the field of plastics
in the Häme municipality ............................................................................................... 61
Picture 1 Geographical overview of Padasjoki. Picture source Google Maps .............. 15
Picture 2 Dismantling old machine from the Siporex part of the building. Picture source
Paul Fletcher ................................................................................................................... 15
Picture 3 outside view of factory premises. Picture source Paul Fletcher ...................... 16
Picture 4 Factory oil burner Picture source Paul Fletcher .............................................. 17
Picture 5 some of the dismantled yarning machinery Picture source Paul Fletcher....... 17
Picture 6 General view of the corridor Picture source Paul Fletcher ............................. 17
Picture 7 Siporex building Picture source Paul Fletcher ................................................ 18
Picture 8 Cold storage Picture source Paul Fletcher ...................................................... 18
Picture 9 Bottle preforms. Source: http://www.putoksnis.lt/article/archive/208/ .......... 28
Picture 10 Factory floor height vs. a person’s height. Picture Paul Fletcher ................ 38
Picture 11 Preforms being transported into filling machine Picture Paul Fletcher 2011 62
Picture 12 Bottle filling mould Picture source Paul Fletcher ......................................... 62
Picture 13 Single bottle filling moulds Picture source Paul Fletcher ............................. 63
Picture 15 Ecobase preform on the left. Potential weight savings and case study
application on the right side. Picture sources HYPET Preform system brochure .......... 66 10

Picture 14 Preform design objectives. Source: Presentation from Next steps in PET
bottle light weighting conference, UK 2007 by Edward Kosior Nextek Ltd ................. 65
Picture 16 Contaminated RPET preform source: Large scale demonstration of the
viability of Recycled PET (rPET) in Retail Packaging Coca-Cola Enterprises Ltd 2006
........................................................................................................................................ 67
Picture 17 Location of companies/factories making plastic products in the vicinity of the
factory. Picture source: Fonecta finder search. ............................................................... 67
11

FOREWORD
I would like to thank the following people who have inspired me to write this thesis and
helped me along the way. First I would like to thank my thesis supervisor Mr Henry
Clay Ericsson for his time, suggestions and indomitable help to get the work done. My
study colleagues Mr Bimo Murti, Mr Simo Toivonen & Mr Markus Lindgren for their
help in inspiring with ideas and feedback, my friend Mr Jani-Matti Hätinen in IT
support on using Excel and ideas, and my brother Mr Michael Fletcher for his help. I
would also like to express my gratitude on Mr Tuomas Häme for providing me
information on the actual factory site, and Mrs Paula Kokkonen providing information
on medical goods. There is not enough space to thank all my friends who have given me
support and sometimes a push to get the job done when I have needed it. Last of all, I
would like to thank my mother Mrs Maikki Id for being strong and supporting me
during all of these years.
Pa & R, this is for you.
12

1 INTRODUCTION
1.1 Backround
The production of Plastics goods in Finland has diminished considerably during the 1st
decade of 2000 - 2010. This has largely been due to economic recession and profit
margins getting smaller for example in the cases of subcontracting work or Perlos and
Eimo for Nokia mobile phones. Both of these have been acquired by competitors
(Eimo acquired by Foxconn and Perlos by Lite-on Technologies )and have moved their
production first to eastern Europe and later into China [1] , making thousands of people
redundant in the plastic industry field. Finland has however had a long history of
plastics production, the first plastics production company in Finland was Sarvis Oy,
which was founded in 1921. This was only 12 years after the first completely synthetic
plastic Bakelite was patented in the United States.
1.2 Objective
There are several objectives for the purpose of this thesis;
1. Provide a feasibility study of producing plastic goods in Finland.
2. Analyse and define a plastic product or -group that could be manufactured in
Finland, and sold to domestic and possibly international markets.
3. Define the correct manufacturing process and raw material for the product(s) to
be produced.
4. Prepare a layout of the factory to define how the possible production of these
goods could be carried out.
5. Make profitability calculations based on the beforementioned product or product
group to estimate if its manufacture is profitable enough to execute.
1.3 Methology
Research for this thesis has been carried out using the following methods:
13
1.3.1 Factory visits, field studies and observations
Visits were conducted to beverage production plants, the Hämeen Lanka premises and
field visits to the Padasjoki industrial estate. On-site observations were done at beverage
production plants (filling out and blow-moulding of bottles from preforms etc.)
1.3.2 Interviews
Interviews were conducted with an expert from the beverage production industry, the
Padasjoki municipal manager (Heikki Jaakkola), thesis writers (Valeria Poliyakova) &
Bimo Murti; both of graduates from the Arcada University of applied sciences.
1.3.3 Literature studies
Information was harvested from the internet on articles, e-books, teaching material and
brochures concerning for example preform manufacture, chemical characteristics of raw
materials, general news of the plastic packaging industry and reading thesis works writ-
ten in relation to the subject. In addition to this, printed material such as magazines,
brochures and hand-outs were also researched.
1.3.4 Drawings
Existing factory layout drawings of Hämeen Lanka´s premises and AutoCAD/Visio-
based layout proposal drawings were used.
1.3.5 Calculations
Calculations, estimations and future forecasts were carried out. Calculations concerning
profitability, required manpower, and raw material pricing and production machinery
were based on life-like figures.
14

2 THE EXISTING FACTORY
2.1 Factory premises
Hämeen Lanka`s factory site in Kaukela was chosen based on personal interest. The
factory is a large part of local history, and it has been closed since 2007. Diverse plans
to convert the site into for example a logistics center have been considered, but they
have not lead to any kind of concrete actions.
In October 2012 the yarning machinery was sold and shipped to China. Also the scrap
metal is being taken away. In November 2012, the whole factory will be empty.
2.2 Backround
Hämeen Lanka was founded into the village of Kaukela in the Padasjoki municipality in
1948. Padasjoki is located in the province of Southern Finland and is part of the
Päijänne Tavastia region. The company used to produce(spin) 500 tons of wool
annually for making carpet yarns, and 90% of the production was exported. In 2007,
Hämeen Lanka was sold to Danspin, a danish competitor. The most functional
production lines were moved to Danspins factory in Estonia. The Kaukela factory was
closed down, and 33 people were made redundant. The turnover in 2006-7 was
estimated to be 10 MEUR for the whole company, including the Estonian factory site.
Picture 1 Geographical overview of Padasjoki. Picture source Google Maps
Picture 2 Dismantling old machinery from the Siporex part of the building. Picture source Paul Fletcher
Hämeen Lanka
Padasjoki centre
15

2.3 Survey of premises
The premises are situated at Kaukelantie 322, Padasjoki. In overall, the factory building is in good condition although it has been empty since October 2007 when the previous production operations ceased [34]
Picture 3 outside view of factory premises. Picture source Paul Fletcher
2.4 Measurements of the building
The site is divided into three parts: the old part, the Siporex part and the cold storage.
Old part (built 1958 - 1959) total area 3714 m2, spread out over 3 floors. (Approximately 1200m2/floor)
Siporex part (white, built behind old part in 1974 total area 2.330 m2 (3 floors) Cold storage (built in 1974) total area 1.375 m2 (1 floor) [65]
2.5 Water
The factory site lacks proper drainage systems and waterpipe infrastructure. The closest
municipal waterpipes are in the Padasjoki center 8 kilometres away. Water is supplied
to the factory from the Miestämä lake via a pumpstation located approximately 0.5 km
away. In 2002 the water intake for yarn processing and cooling was approximately
75 000 m3. Dirty waters were mainly generated from sanitary-, cooling- and processing
water, and lead back to the lake via a concrete-encased biological cleaning station. Due
to the cleaning station , the factory had an enviromental permit valid until 2014. [35]
16

2.5.1 Drinking water
Drinking water was brought from the municipal waterworks and stored in containers on-site. The enviromental permit states that a suitable local supply source wasnt found [35].
2.6 Heating and electricity consumption
Heating and steam for the processing work for the previous production process is provided via a 1.3 MW oilburner. The oilburner was renewed in 2001. Burning fumes from the oilburner were lead into a 25m-high chimney located at the right hand end of the factory. When the factory was fully operational in 2002; 208,3 tonnes of heavy fuel oil was consumed. Electricity consumption in 2003 was 1,32 Gwh [36]
2.7 Main building – old part
The factory has 3 floors, which are approximately 3-4 meters high and each floor is interconnected with each other with more than one elevator. The corridoors are long and narrow in many places,as visible in picture 6 below. The concrete floor is very robust, so carrying capacity is not a problem. The walls are surfaced with bricks. All floors have radiators for heating, so maintaining a constant temperature would not be a prob-lem. In general the condition inside the building is good; no humidity related damages are visible. Figures 1- 3 provide more information on the factory layout.
Picture 6 General view of the corridor Picture source Paul Fletcher
Picture 4 Factory oil burner Picture source Paul Fletcher
Picture 5 some of the dismantled yarn-ing machinery Picture source Paul Fletcher
17

2.8 Siporex part of the building
The Siporex part built behind the old part of the building, is very brightly lit inside due
to the large windows and as it set directly towards the sun. This together with the large
open and high spaces at both ends of the building make it the ideal location for the
production facility. See figure 1 for more information.
2.9 Cold storage
The cold warehouse which is partly visible in Figure 1 & Picture 8 below, is built from wood and has a tin roof. It cannot sustain a constant temperature or humidity.
Figure 1 Hämeen Lanka 1st floor layout Source PI Projekti-Insinöörit
Picture 7 Siporex building Picture source Paul Fletcher Picture 8 Cold storage Picture source Paul Fletcher
18

Figure 3 Hämeen Lanka factory layout 3rd floor Source PI Projekti-Insinöörit
Figure 2 Hämeen Lanka factory layout 2nd floor Source PI Projekti-Insinöörit
19

3 ALTERNATIVES OF PLASTIC PRODUCTS FOR MANUFACTURE
3.1 Type of product to manufacture
Diverse products or product families which could facilitate a constant income were
researched. During preliminary research such items as house-hold utensils, kitchenware,
plastic cabling, buoys, roadwork fencing and stoppers were considered. Production
figures and profit estimates on these products proved to be difficult or impossible to
acquire. Information related to medical products such as syringes, insulin pens, and
beverage bottle preforms were possible to access through personal contacts and the web.
In addition to this, information concerning general plastic utensils were acquired
through some major producer websites and media, this information led to partly
choosing the product categories. Finally three diverse product groups were compared to
each other to make the decision on what kind of products would be chosen.
3.1.1 Medical goods
Insulin needles and syringes were among the products considered for production, as
their need is increasing. The age structure of people in need of these is growing due to
people suffering from diabetes and for geriatric needs. The total number of people with
diabetes is projected to rise from 171 million in 2000 to 366 million in 2030 [13]
3.1.2 Household utensils
This product group consists of products for domestic use, such as buckets, tubs,kitchen-
ware and snow-work tools. Finnnish companies Plasto,Plastex & Orthex all produce
them, so domestic competition is tough. Production of these diversified goods require a
lot of machines and personnel to run them. This leads to a loss in production efficiency,
as the batches are relatively small in size (in 1000s of pieces at a time) and the products
are often available in different colours and sizes. Changing the products colour and the
moulds or other tooling during production leads to production downtime, during which
20

nothing can be produced on these machines. Also the need of seasonal products can be
difficult to forecast, creating a surplus of unsold goods and a waste of warehouse space.
As an example, Orthex manufactures approximately 200 different products, and have
approximately 500 active production titles as some titles are available in several colours
[37]. During a factory visit to Orthex it was observed that the assembly of many goods
require hand-labour, thus making product assembly time-consuming and expensive.
Figure 4 attaching a string onto a sleigh at Orthex. Picture source http://www.yrittajat.fi/File/09e7932f-9ccd-42f8-a6c2-fb7ed200ab51/orthex2.jpg
Figure 5 A cowskin-style letterbox Picture source http://www.dilishop.fi/Postilaatikko-Lehmae post box
Figure 6: Orthex retail store Picture source http://www.tjt-kaluste.fi/myymalakalusteet.shtml
3.1.3 Preform manufacture for bottles for soft drinks and mineral waters
In 2010 over 320 million liters of soft drinks and mineral waters were sold in Finland
(figure 2). The figure excludes alcoholic drinks. Bottles for these drinks are
manufactured from plastic preforms supplied to the bottling plant, and they are filled
after being blow-moulded into bottle shape on the bottling line.
3.2 Comparison of production figures and their generation of turnover
3.2.1 Insulin needles and syringes
Finland has public healthcare, so these products are supplied free of charge for medical
use such as diabetes, so accurate figures on the needs for syringes and insulin needles
are easy to get. Free market sales are not substantial. In Table 1 calculations have been
made to define the sales figures of insulin needles and syringes for the public healthcare
21

market. These figures have been received from the Helsinki town procurement office
which covers the Helsinki region [17]. The whole country estimation is based on a con-
versation with Helsinki deputy mayor Paula Kokkonen [18] Syringe Amount for whole Finland
Size/Length Amount Price each Subtotal Amount for whole Finland 0,3 ml 8 mm 240 000 0,16 € 38 400,00 € (Helsinki accounts for 10 % of total need 1261114 ½ ml 12,7 mm 86 300 0,13 € 11 219,00 € Turnover tax 23 %) 290056,2 0,5 ml 8 mm 45 700 0,09 € 4 204,40 € Total sum for whole Finland 1 551 170 €
1ml 12,7 mm 14 000 0,09 € 1 288,00 €
Insulin pen Single use
29 G 10 mm 2 000 0,07 € 142,00 € Source of information: information request from Helsinki town procurement office
29 G 12 mm 19 000 0,07 € 1 349,00 € Information received by email from Procurement officer Riitta Hintikka
30 G 8 mm 86 800 0,07 € 6 162,80 € 6th September 2010.
31 G 5 mm 346 000 0,07 € 24 566,00 € Information of total amounts for whole of Finland received from 31 G 6 mm 284 700 0,07 € 20 213,70 € Mrs. Paula Kokkonen, Deputy Mayor of the City of Helsinki September 2010 31 G 8 mm 261 500 0,07 € 18 566,50 €
Total purchases for Helsinki 126 111,40 €
Table 1 Need for syringes & insulin pens for medical use in Finland 2010
3.2.2 Soft drinks and mineral water preforms
Table 2 below describes the domestic sales of soft drinks and mineral waters in 2000
and 2005 – 20120. The statistics are from the Finnish Food and Drinks Industries’
Federation (Elintarviketeollisuusliitto or ETL) website.
Table 2 Domestic sales of domestic soft drinks and mineral waters Source: http://www.etl.fi/www/en/statistics/files/Domestic_sales_of_Finnish_food_products.pdf fetched 20th September 2011
These figures were used as an reference for calculations on needs for preforms for
bottling beverages in Finland, and what kind of sales they would generate.
- According to my expert source from the industry, the average price for 0.5 l pre-
forms is 4.5 ¢ (0,045 €)/each and 1.5 l preforms 6.4 ¢ (0,0645 €)/each (2010).
- 30 % of these drinks are bottled into 0.5 l bottles and 70 % into 1.5 l bottles.
- According to table 3, 84,9 % of the total volume of sold soft drinks and mineral
waters in 2010 were packed into bottles. According to the used expert source,
usage of glass bottles is small and would not clearly affect these figures. 22

Table 3 Domestic sales per package type. Source http://www.panimoliitto.fi/panimoliitto/liitetiedostot/pdf/pakkaukset1999_2010.pdf fetched 6th October 2011
See table 4 below for a total sales estimation based on these figures. Beverages and mineral waters sold in Finland in 2010 in total (1000s of litres) Total Soft drinks 263856 Mineral waters 64921 Total: 328777 According to table 5 , 84,9 % of these drinks were sold in bottles, thus the correct figure for bottles is (328777 X 1000 litres/100) X 84,9 279131673 Out of which an estimated 270 M litres is bottled into plastic bottles with preforms 0.5 l preforms: (270 M litres X 0.3) / 0.5 litres = 81000000 1.5 l preforms: (270 M litres X 0.7) /1.5 litres = 189000000 81000000 X 0,045 € + 189000000 X 0,0645 € = 15835500 €
Price source: Expert working in the beverage and brewery industry Estimate of total turnover of beverage & mineral water preforms for domestic markets 15,835 MEUR
Table 4 Estimate of beverage and mineral water preform market turnover in Finland 2010
3.3 Choosing the product
3.3.1 Syringes, insulin pen needles and similar medical goods
Production of these goods is complex compared to preforms. As hypo-
dermic syringes are in direct contact with the interior of the body,
government regulations require that they are made from biocompatible
materials which are pharmacologically inert [23]. This affects the price
of the products as other plastics cannot be used. The products must be
sterile and nontoxic, so they must be made in clean room facilities, in-
creasing the costs of the production facility. See figure 7 for a diagram
of the different parts of a syringe.
Figure 7 Diagram of a hypodermic syringe. Source: http://www.madehow.com/images/hpm
23

In addition to this, these products are far more complex to manufacture than preforms
which don’t have moving parts or traversing seals to transport the liquid to the tip.
Insulin pen needles do not consist of
many parts, but have similar challen-
ges as syringes, being always packed
and sealed individually. Figure 8 descri
-bes the needle construction in detail.
According to table 4, the domestic
sales of syringe & insulin needles was
1,5 MEUR in 2010.
These figures do not cover sales for private or vetenirary use, but the joint sales figures
are so small that further research into this product sector was unnecessary.
3.3.2 Household utensils
As mentioned in paragraph 3.1.2, the domestic market was very competetive. In 2010
Orthex had a turnover of 13.6 MEUR and 90 employees [25]. Plastex, situated close to
Orthex in Lohja had a turnover of 4.5 MEUR and employed 33 people [32]. Plasto in
the Åland islands makes toys and kitchenware and its daughter company Plastopak
plastic packaging. Their turnover was 4.2 MEUR [26] employing 50 people in 2010.
3.3.3 Preform manufacture
The manufacture of preforms is a relatively simple process, the end-product has no
moving parts or large variations in apperance or construction. The dimensions of the
end product are modified by the mould in which they manufactured and the production
process is always the same. In addition to the change in dimensions, the raw materials
and the colour and transparency characteristics change. As of October 2012, there is no
large-scale preform manufacture in Finland. Preformia which used to process recycled
post-consumer plastic bottles into preforms went bankrupt in May 2011 [28].
Figure 8 Insulin pen needle. Source http://www.diabeticlive.com/wp-content/uploads/2010/06/BD-Pen-Needles-300x210.gif
24

According to the expert consulted for this thesis, the manufacturers which supply most
preforms to Finnish customers are Plastitehase (Estonia), Pretainer ( Lithuania) and
Returpak (Sweden). Graham packaging Company Oy produces preforms in small-scale
and non-standard 0.2 l, 0.35 l & 0.75 l sizes for Pernod-Ricard Finland [33].
3.4 Choice of product for manufacture
The decision on what to manufacture was based on several factors. Estimations on
generated turnover were compared, preforms providing the largest. Household goods
are produced by several domestic manufacturers, and the market is somewhat saturated.
Syringes and insulin needles offer a much smaller market in Finland, and overseas sales
would be needed to increase sales/turnover. Production machinery for them are very
expensive and require the use of Bioplastics and cleanroom facilities. In addition to this,
some domestic production already exists. See figure 9 for a graphical representation of
turnover various product and product group alternatives, which are described in chapter
3.1 and their financial information in chapter 3.2.
Figure 9 Turnover estimations of production alternative based on 2010 turnover. Figure by Paul Fletcher.
Logistical location
The Hämeen Lanka premises is located with good transportation possibilities to
domestic beverage- and alcoholic drink manufacturers and harbour and railway hubs.
The site offers an strong advantage over foreign competitors: a possibility for almost
15,4 13,6
4,5 4,2 1,55
0 2 4 6 8
10 12 14 16 18
Estimated domestic turnover
of beverage & mineral water
preforms in 2010
Orthex Oy International
turnover in 2010
Plastex Oy International
turnover in 2010
Plasto Oy Internation
turnover in 2010
Estimated domestic sales of insulin needles & syringes in 2010
Turnover estimations in MEUR (2010)
25

immeadiate delivery. This would facilitate the beverage producers to bottle drinks using
JOT/JIT-like principles. According to the expert working in the beverage industry,
foreign competitors have a lead time of at least 4 weeks. A shorter lead time and saving
warehouse space at the bottling plant are considerable competitional advantages compa-
red to foreign producers. Storing preforms and their raw materials for a long time
increases the risk of humidity to the products to become non-marketeable. Markus
Portmans thesis in Arcada [45] arrived at the following conclusion:
PET Preforms start to absorb humidity almost immeadetly after being manufactured by injection moulding. Even after a time period of two days the possible humidity that the preform has absorbed can have substantial effect in the expansion properties of PET material. If the preform has been too long in a humid atmosphere, it is impossible to produce high quality bottles out of such preforms. It is important to keep the shelf-life as short as possible. The recommended time span is less than 2 days, at a temperature of 24 °C and in a dry warehouse. (see: RIVA Packing Solutions, fetched 3.6.2009) [44]
3.5 Transportation of preforms to mineral water and beverage manufacturers and harbours
As visualised in figures 10 and 11, transportation of ready goods could be arranged to
any of the larger producers from the factory during one working day. The longest dis-
tance from the factory is to Olvi Oy in Iisalmi. The driving time to Olvi is approxi-
mately 5 hours and the distance less than 350 kilometres. The working day definition
according to the Finnish Working hour’s act (605/1996) is 8 hours a day [30]. This
enables lorry deliveries driven safely to all of the bottling plants and harbours with
overseas connections described in table 5, all during one working day.
Altia Rajamäki
Finn Spring
Olvi
Preform factory
Hartwall
Sinebrychoff
VIP-Juicemaker
Altia, Koskenkorva
Figure 10 Locations of largest beverage producers & breweries in Finland. Picture source: Google Maps & Paul Fletcher
26
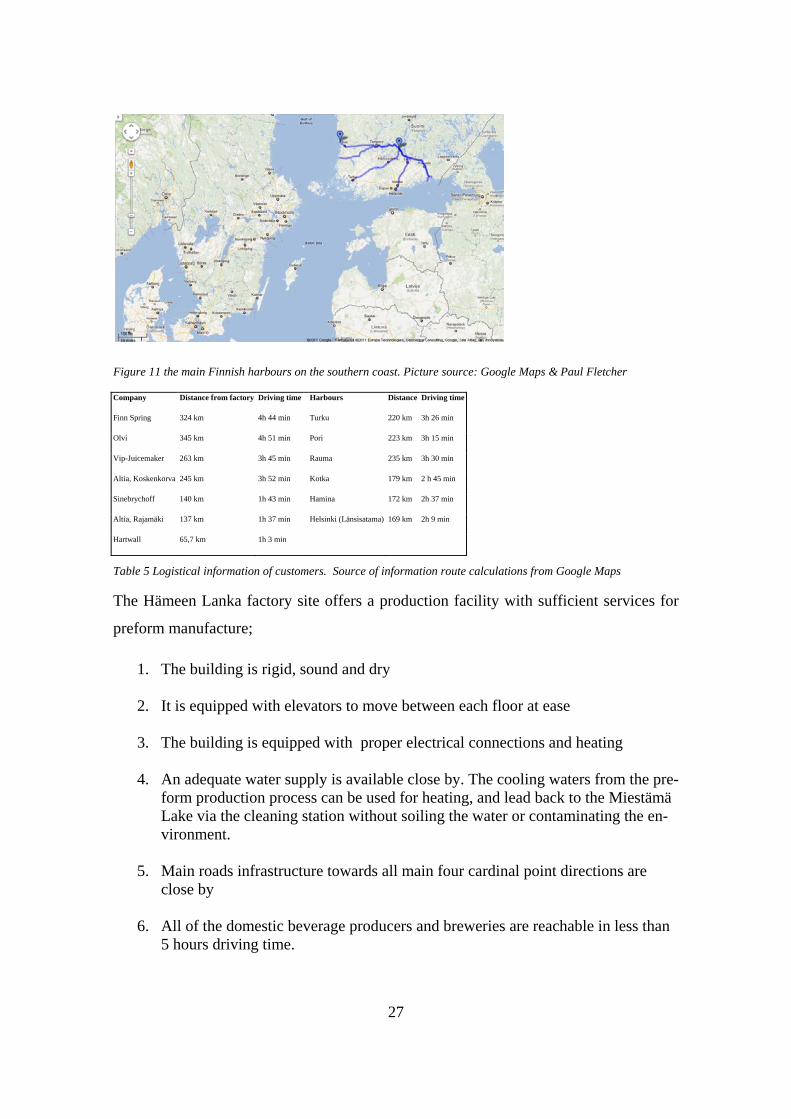
Figure 11 the main Finnish harbours on the southern coast. Picture source: Google Maps & Paul Fletcher
Company Distance from factory Driving time Harbours Distance Driving time
Finn Spring 324 km 4h 44 min Turku 220 km 3h 26 min
Olvi 345 km 4h 51 min Pori 223 km 3h 15 min
Vip-Juicemaker 263 km 3h 45 min Rauma 235 km 3h 30 min
Altia, Koskenkorva 245 km 3h 52 min Kotka 179 km 2 h 45 min
Sinebrychoff 140 km 1h 43 min Hamina 172 km 2h 37 min
Altia, Rajamäki 137 km 1h 37 min Helsinki (Länsisatama) 169 km 2h 9 min
Hartwall 65,7 km 1h 3 min
Table 5 Logistical information of customers. Source of information route calculations from Google Maps
The Hämeen Lanka factory site offers a production facility with sufficient services for
preform manufacture;
1. The building is rigid, sound and dry
2. It is equipped with elevators to move between each floor at ease
3. The building is equipped with proper electrical connections and heating
4. An adequate water supply is available close by. The cooling waters from the pre-form production process can be used for heating, and lead back to the Miestämä Lake via the cleaning station without soiling the water or contaminating the en-vironment.
5. Main roads infrastructure towards all main four cardinal point directions are close by
6. All of the domestic beverage producers and breweries are reachable in less than 5 hours driving time.
27
4 LITERATURE REVIEW
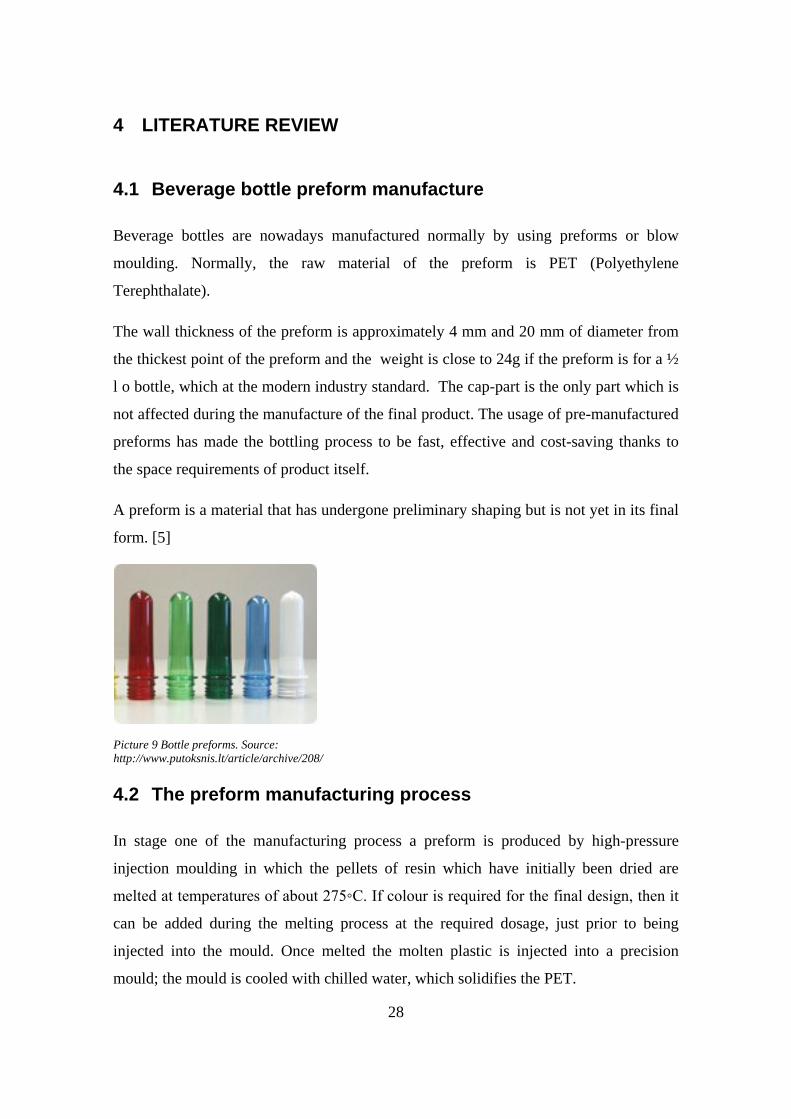
4.1 Beverage bottle preform manufacture
Beverage bottles are nowadays manufactured normally by using preforms or blow
moulding. Normally, the raw material of the preform is PET (Polyethylene
Terephthalate).
The wall thickness of the preform is approximately 4 mm and 20 mm of diameter from
the thickest point of the preform and the weight is close to 24g if the preform is for a ½
l o bottle, which at the modern industry standard. The cap-part is the only part which is
not affected during the manufacture of the final product. The usage of pre-manufactured
preforms has made the bottling process to be fast, effective and cost-saving thanks to
the space requirements of product itself.
A preform is a material that has undergone preliminary shaping but is not yet in its final
form. [5]
4.2 The preform manufacturing process
In stage one of the manufacturing process a preform is produced by high-pressure
injection moulding in which the pellets of resin which have initially been dried are
melted at temperatures of about 275◦C. If colour is required for the final design, then it
can be added during the melting process at the required dosage, just prior to being
injected into the mould. Once melted the molten plastic is injected into a precision
mould; the mould is cooled with chilled water, which solidifies the PET.
Picture 9 Bottle preforms. Source: http://www.putoksnis.lt/article/archive/208/
28
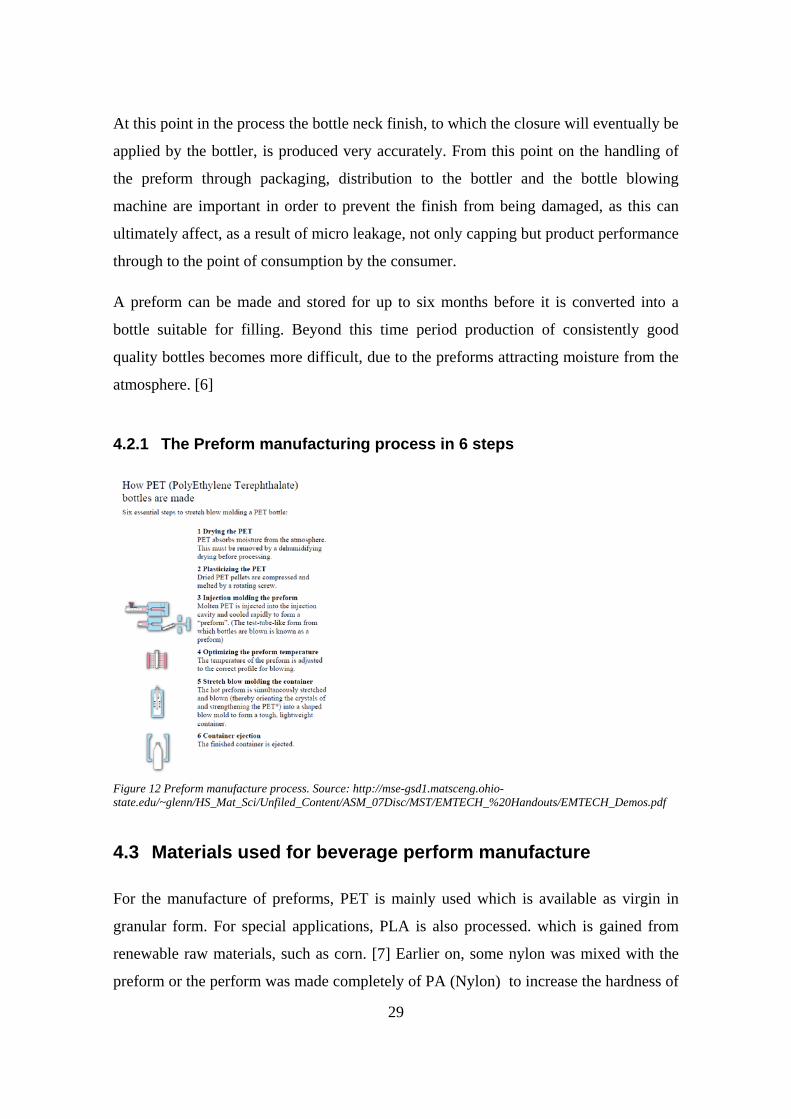
At this point in the process the bottle neck finish, to which the closure will eventually be
applied by the bottler, is produced very accurately. From this point on the handling of
the preform through packaging, distribution to the bottler and the bottle blowing
machine are important in order to prevent the finish from being damaged, as this can
ultimately affect, as a result of micro leakage, not only capping but product performance
through to the point of consumption by the consumer.
A preform can be made and stored for up to six months before it is converted into a
bottle suitable for filling. Beyond this time period production of consistently good
quality bottles becomes more difficult, due to the preforms attracting moisture from the
atmosphere. [6]
4.2.1 The Preform manufacturing process in 6 steps
Figure 12 Preform manufacture process. Source: http://mse-gsd1.matsceng.ohio-state.edu/~glenn/HS_Mat_Sci/Unfiled_Content/ASM_07Disc/MST/EMTECH_%20Handouts/EMTECH_Demos.pdf
4.3 Materials used for beverage perform manufacture
For the manufacture of preforms, PET is mainly used which is available as virgin in
granular form. For special applications, PLA is also processed. which is gained from
renewable raw materials, such as corn. [7] Earlier on, some nylon was mixed with the
preform or the perform was made completely of PA (Nylon) to increase the hardness of
29
fully-blown bottle. However there were problems with the surface finish, as the bottle
was used several times before being ground back to granulate. The surface of the fully-
blown bottle became subject to scratches and appeared soiled on the surface. Soon the
type of bottle which was re-used several times before being crushed, was pulled off the
market at least in Finland.
Today, more and more PET and PLA are recycled in the production process. Genuine
regrind from PET or PLA bottles is preferred in order to guarantee the quality of the
bottles. If amorphous regrind is used, it must be crystallised before drying. [8]
4.3.1 Poly(ethylene terephthalate) Overview
Poly(ethylene terephthalate) (PET) is used in a variety of commercial applications, from
soft drink containers to fibers used to make textiles or tire cords. PET has been used as a
commercial fibre since as far back as 1953.The excellent mechanical and thermal
properties of PET give it a wide variety of uses for everyday items. Stretched PET
provides a good barrier against carbon dioxide, making it an ideal container for
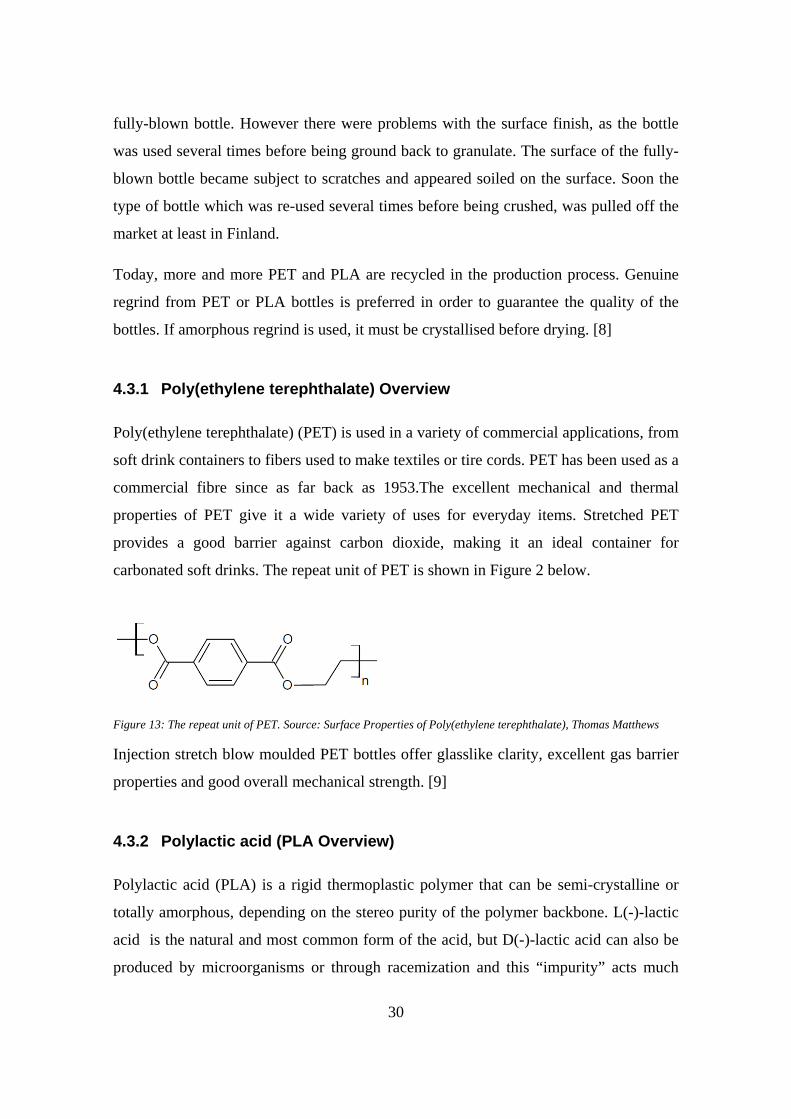
carbonated soft drinks. The repeat unit of PET is shown in Figure 2 below.
Figure 13: The repeat unit of PET. Source: Surface Properties of Poly(ethylene terephthalate), Thomas Matthews
Injection stretch blow moulded PET bottles offer glasslike clarity, excellent gas barrier
properties and good overall mechanical strength. [9]
4.3.2 Polylactic acid (PLA Overview)
Polylactic acid (PLA) is a rigid thermoplastic polymer that can be semi-crystalline or
totally amorphous, depending on the stereo purity of the polymer backbone. L(-)-lactic
acid is the natural and most common form of the acid, but D(-)-lactic acid can also be
produced by microorganisms or through racemization and this “impurity” acts much
30

like comonomers in other polymers such as polyethylene terephthalate (PET) or
polyethylene (PE).
Figure 14: Poly(lactic acid) (PLA) Source: http://www.uweb.engr.washington.edu/research/tutorials/plagla.html
In PET, diethylene glycol or isophthalic acid is copolymerized into the backbone at low
levels (1–10%) to control the rate of crystallization. In the same way, D-lactic acid units
are incorporated into L-PLA to optimize the crystallization kinetics for specific
fabrication processes and applications.
PLA is a unique polymer that in many ways behaves like PET, but also performs a lot
like polypropylene (PP), a polyolefin. Ultimately it may be the polymer with the
broadest range of applications because of its ability to be stress crystallized, thermally
crystallized, impact modified, filled, copolymerized, and processed in most polymer
processing equipment.
It can be formed into transparent films, fibers, or injection molded into blow moldable
preforms for bottles, like PET. PLA also has excellent organoleptic characteristics and
is excellent for food contact and related packaging applications. [10]
4.4 Disadvantages when using Polyethylene Terepthalate as a raw material
4.4.1 Appearance and crystallisation-related issues
PET becomes increasingly brittle and opaque at increasing crystallization levels.
Extremely crystalline PET is effectively white. This can be clearly seen on the neck of
some returnable bottles already in the market. A further optimization has been the use of
another plastic, PEN (Polyethylene Naphthalate), in manufacturing bottles. This plastic
31

displays considerably better barrier properties than PET, but is significantly more
expensive [6]. Due to this, PEN is not used at the present for perform manufacture
4.4.2 Carbon dioxide permeability
Gas permeability is a major difficulty here, as it can lead to problems within the
beverage. Because these processes occur as diffusion, independent of pressure, even a
carbonated beverage takes up oxygen and at the same time releases carbon dioxide. The
intruding oxygen can damage beverage ingredients, in particular vitamins and flavors.
In addition, PET can absorb flavor components of the beverage. This is a result of the
structure of the plastic. The long polymer molecules are tangled within each other like a
sponge. In this "sponge", flavor components are stored and later released again. When
the crystallization level increases, this sponge structure becomes "untangled" and less
foreign material may be absorbed. This has made the development of returnable PET
bottles possible, despite the possibility of flavor absorption. At the same time,
crystallization of the material also improves its resistance to heat, so that hot-fill PET
bottles can also be produced using the same technology
However, these disadvantages mean that the shelf life of a beverage in PET is usually
shorter than in glass bottles. But through appropriate recipe design, the manufacturer of
flavor systems can offset many of the disadvantages of PET. [11]
Both PLA and PET have a similar problem with CO2 permeability, though the
permeability with PLA is much worse than with PE. See the Disadvantages of PLA for
more information.
4.5 Disadvantages when using Polylactic acid as a raw material
4.5.1 Heat stability
PLA must be commercially composted, it will not decompose under home composting
conditions One of the biggest drawbacks of it is that it has a relatively low melting
32

temperature (173-178 °C) meaning that there is always a danger of the material sticking
to the mould of the injection molding machine.
Typically, a manufactured PLA-based product cannot be microwaved, due to the
abovementioned low melting temperature point, thus eliminating the possibility of re-
using for example a bottle by “sterilizing” it in a microwave oven before use.
PLA films are inferior to ordinary polymer materials in heat stability. The deformation
process for example for LDPE bottle made of PLA can begin at 50-60°С.
4.5.2 Composting
Polylactic acid products require commercial composting environment & controlled
conditions (e.g. 10 days at 140 degrees, moisture, oxygen, microbes) Partly because of
this PLA could take up as much landfill space as conventional plastic packaging. Bottles
made from PLA are not suitable for conventional bottle recycling – they must be sorted.
4.5.3 Using PLA for beverages with Carbon dioxide as a protective gas or for fizz
Oxygen barrier characteristics of PLA are approximately 10 times worse than the ones
of PET, PP, and polyvinylchloride (PVC). This is why PLA packaging is mainly used
for packing dry and some frozen food, and liquids with a short shelf lifespan. The
highdiffusion constant СО2 does not allow using packages made from PLA for bottling
carbonated beverages. This limits the field of bottling application to milk, fruit juices,
water, and vegetable oil.
4.5.4 Moral issues
As PLA is manufactured from corn starch there is always a moral issues associated with
using a basic foodstuff based product for packaging, even though the PLA is
manufactured from genetically modified corn, not the normal No. 2 yellow dent field
corn. Also the production corn pricing - subject to supply & demand are impacted by
corn-based ethanol affects the production of the PLA-based end-product. [12] 33

4.6 Conclusion of the literature survey
New bio- and other plastics are being under development and constantly entering the
market. Materials used for preform manufacture will evolve towards more
environmentally friendly and oxygen resistive materials. Environmental friendliness,
along with the ability of withstanding higher melting temperatures and better resistance
to oxygen/CO2 permeability are key issues to be solved to move on to more nature-
friendly material options. Materials such as Polysole, which is a totally biodegradable
plastic material that can be used for example in blow molding and injection molding
applications. It is made using entirely natural materials and organic additives.
"Polysole® is completely bio-based as the polymer utilizes proprietary additives that are
entirely natural and organic. The company has, ensured that there is no compromise on
the renewable content of the material, which is an industry-leading development." [44]
In today’s booming bio-plastics market, many base biopolymers come from a natural
feedstock, but compounding these biopolymers for additional performance is
accomplished using synthetic additives.
Many of the biopolymers used for engineering applications are blended with other oil-
based polymers, which leads to a significant reduction in the renewable content.
Polysole® is a totally biodegradable plastic material that can be used in film, sheet,
blow molding and injection molding applications. Made using entirely natural materials
and organic additives, Polysole® is a 100% biodegradable and non-toxic thermoplastic.
Its superior process capability and strength offers opportunities for manufacturers of all
kinds to save money, increase product safety and to beat the competition. [13]
However, PET offers much better overall characteristics compared to for example PLA
or Polysole at the moment. PLAs problem with Carbon dioxide permeability, heat
stability and a very low melting point of 173-178 °C compared to the melting point of
PETs 250 – 260 ° C leaves no question which raw material to us. Pet’s biggest problem
is the re-use of the recycled material, as its quality isn’t a similar quality of the virgin
raw material.
34

5 PRODUCT DECISION
Preform production was chosen based on estimated sales figures, less product diversity
and the logistical location of the factory for possible domestic customers. As alcoholic
drink bottles are more demanding on materials used for their manufacture, and the
thread/cap-closure, they are left outside the production scope and this thesis work.
6 MANUFACTURING PROCESSES AND MATERIALS
6.1 Manufacturing method
6.1.1 In general
Several manufacturing methods were considered. These methods include one- and two-
stage blow moulding and thermoforming. All these methods possess drawbacks pre-
venting their effective use. However, the biggest drawback is the existing preform-
based bottling technology used by beverage producers such as Hartwall, Sinebrychoff
and Olvi. This fact alone effectively eliminated the need to research alternatives further.
Other substantial drawbacks are the quality or finish or the product, raw material opti-
misation, possible surface strain and tensions on the end product, production speed, end
product size, subcontracting issues and even technical competence of production staff.
6.1.2 Injection moulding
The most common manufacturing method for preforms is (IM) Injection moulding. See
figure 15 below how an injection moulding machine operates. Injection moulding is a
simple manufacturing process where plastic raw materials such as PET granulates are
fed into a hopper (1). The granules will traverse from the hopper using gravity into a
heated barrel (2, 3) and crushed via a rotating screw into a molten form. If colour is
needed to change colour of the preform, it is added into the molten plastic. The heated
liquid plastic has a temperature of 250 °C (PET) [38]. For PLA the melting point is
35

lower, between 173-178 °C [46]. The screw propels the molten plastic through a nozzle
(4) into a two-sided mould (5) which defines the shape of the preform.
When the mould (5) is filled with the pre-programmed amount of molten plastic, it is
closed by a hydraulic clamp (6) force, generated by an electric motor and a hydraulic
pump (7). The clamp will hold the mould together for the time period which is needed
for the product to cool down. The mould is cooled with external water cooling during
the process to ensure that the preform solidifies fast and homogenously as possible. Af-
ter cooling down the end product(s) they are ejected from the mould by ejector pins (8)
which push the preform(s) out of the mould. The mould is re-opened and filled using
molten plastic fed constantly through the hopper and the traversing screw.
Figure 15 Diagram of an injection moulding machine. Picture source: http://www.cheresources.com/content/articles/bulk-solids/basics-of-injection-molding
Due to the need to manufacture vast quantities of the product, the production process
has to be fast and accurate, as automated and error-resistant as possible and
economically viable. Preform production batches are large. Due to this, the preform
mould has a numerous amount of cavities to make more preforms at once. These
moulds have 4 - 144 cavities, each cavity producing a preform during each production
cycle. The average amount of cavities in a mould is between 48-72 [23] cavities such as
in the Husky moulding machine used by Putoksnis in Lithuania [24] and [25]). At the
present there are moulds available with 144-192 cavities, increasing production
efficiency, but increasing the required clamping force to be 500 or even 600 tonnes (for
192 cavities). As a injection moulding machines operation can run the manufacturing
unmanned, thus production could be run automatically during night-time and weekend
1 2,3
4 5
7
8
6
36

shifts. Production efficiency can be improved by automation such as an robot arm,
pallet conveyor system or a automated hopper feeding the plastic granules to the
injection moulding machines.
Figure 16: 72-cavity mould. Picture source: http://www.mega-machinery.com/preform-mold02.pdf
6.1.3 Drawbacks on injection moulding
The biggest drawbacks of Injection moulding is the actual investment price. This can be
divided into two parts; 1. The price of preform mould. The development and produc-
tion of a good mould is expensive. Depending on the size and quality, the price can
range from 50 000 € up to 300 000 € each. The larger the production batches are, the
lower the end product costs will be. Due to this, products which are manufactured with
short production batches might not be economically viable. 2. The injection moulding
machine, computer-controlled and equipped with a large scale production 24g preform
mould for 0.5 l – 1.5 l bottles costs between 1 – 2 MEUR. The estimated annual
production capacity of such a machine is 100 Million preforms. It must be noted that
when the preform size or neck closure would change, only a different mould must be
purchased, not the whole injection moulding machine.
6.1.4 The future of preform production
The main shape of preforms is unlikely to change much in the coming years. Beverage
producers have made huge investments into their present systems, and no clear
improvements regarding bottling technology is visible at the moment. The main
differences are in volume and weight of the preform. Chapter 14 on Discussion covers
this in more detail, covering some existing cost-cutting alternatives. See figures 17 & 18
37

for examples on some preform sizes and dimensions. In Finland, the most common
preforms for 0,5 l bottles weigh 21-26 g and 41.5-43 g for 1,5 bottle sizes.
Figure 18 Husky HyPET Preform product examples. Picture source HyPET Systems brochure, http://www.husky.ca/documentlibrary.aspx?id=2147483911
7 FACTORY LAYOUT
The factory is laid out over three floors. Each floor is relatively low, so an injection
moulding machines higher than 3 m cannot be installed or operated in the old part with-
out cutting a hole in the roof above. The Husky HYPET range were the most suitable, as
they can be installed as lower layout configurations. The premise has three elevators,
which can be used for transportation of goods between the storeys.
Picture 10 Factory floor height vs. a person’s height. Picture Paul Fletcher
Figure 17 Example measurements of 24 g preform [53]
38

The external cold storage is not dry, so goods stored there would be subjected to humid-
ity. This makes the use of it obsolete, apart from as a docking station for incoming raw
material and supply traffic, and outgoing traffic to customers.
The whole building is too large for the presently planned production plant and produc-
tion capacity. However, as the building is on several floors, the top floors could be used
as a warehouse for the ready products and the raw materials. Heat inside the building
rises upwards, so gravity-controlled air conditioning could possibly be utilised in keep-
ing the ready products and raw materials dry. Keeping the raw materials dry is vital.
PET Preforms start to absorb humidity almost immeadetly after being manufactured by
injection moulding [45]. Also humidity in the raw materials can pose problems,
eventhough the Injection moulding machine(s) are equipped with driers. It is good to
keep the material at as a homogenous state as possible during the production process.
If gravitational air-conditioning will not work, an indoor ventilation solution can be
used for keeping the facilities dry. It could be partly be powered by solar panels which
are installed onto the roof and building windows. In addition to this, the injection
moulding machines produce a lot of heat. This heat could be used to decrease heating
costs, by circulating the heated-up cooling water into the buildings radiator network.
8 LAYOUT OF PRODUCTION FACILITIES
Figure 19 describes the working layout of the factory. As visible from pictures 2 & 7,
the Siporex part of the building offers the best facilities height-wise for the installation
of the machines. It has direct access to the cold storage, which could be used as a dock-
ing station, so that a lorry reverses into it or in front of it and is loaded there. The pro-
duction cells are facilitated in such a way that unloading the preforms into a container
for the fork lift trucks, or to drive to the lifts would be as easy as possible. This could be
done by using a fork trolley, as a sales batch of 1000 preforms weighs either 24 or 41, 5
kg. So weight is not a major problem for transfer inside the factory site.
39

The 2nd and 3rd floor or old part of the main building as in figure 19 below can also be
used as a warehouse facility, or as an intermediate storage, see figures 2 & 3 for the sto-
reys layout drawings. The hoppers of the injection moulding machines would be filled
via transfer pipes from the 2nd floor, so raw materials would be kept there, and PET raw
material would transported there from the outside by using the factory elevators.
Figure 19 Factory layout
New doors must be made or existing door made wider to locations (1) and (2) described
in figure 19. This is due to more space being needed to transport goods to the warehouse
facilities, elevators from where ready goods are transported other storeys warehousing
facilities or to lorries arriving at the factory collecting goods.
1
2
2
40
9 FINANCIAL CALCULATIONS
9.1 Raw materials
9.1.1 Bottle grade PET
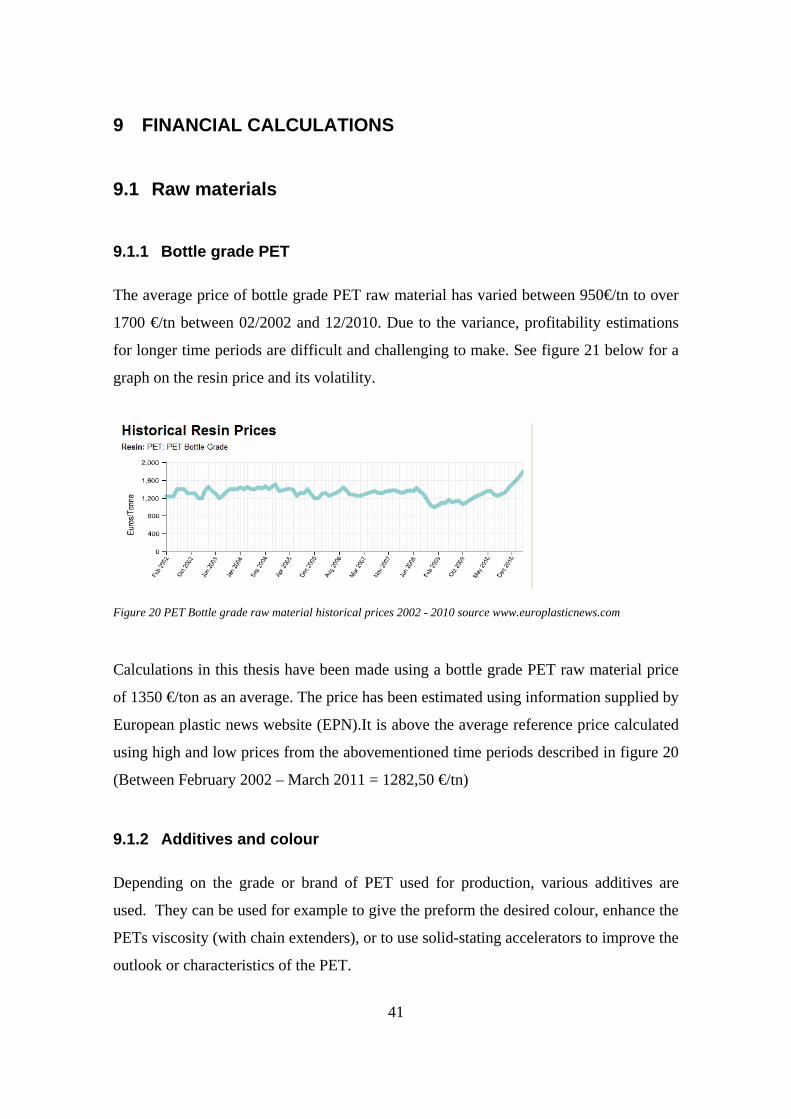
The average price of bottle grade PET raw material has varied between 950€/tn to over
1700 €/tn between 02/2002 and 12/2010. Due to the variance, profitability estimations
for longer time periods are difficult and challenging to make. See figure 21 below for a
graph on the resin price and its volatility.
Figure 20 PET Bottle grade raw material historical prices 2002 - 2010 source www.europlasticnews.com
Calculations in this thesis have been made using a bottle grade PET raw material price
of 1350 €/ton as an average. The price has been estimated using information supplied by
European plastic news website (EPN).It is above the average reference price calculated
using high and low prices from the abovementioned time periods described in figure 20
(Between February 2002 – March 2011 = 1282,50 €/tn)
9.1.2 Additives and colour
Depending on the grade or brand of PET used for production, various additives are
used. They can be used for example to give the preform the desired colour, enhance the
PETs viscosity (with chain extenders), or to use solid-stating accelerators to improve the
outlook or characteristics of the PET.
41

See figure 22 for examples on dosages of
chain extenders are used. Chain extenders
(or coupling agents) can serve to reverse the
MW damage caused by hydrolysis of poly-
esters or can modify the rheology of the
polymer to increase its melt strength [66]. In
general, modification additives are adminis-
tered into the master batch at a dose of cou-
ple of percent, or even fraction of an percent,
as is the case of solid-stating accelerators
Some manufacturers of bottle-grade PET
already have added these aforementioned additives in or have eliminated these steps. As
the additives are not in the general scope of this thesis, they are not discussed further.
The dosage of additives/colour is estimated to be 0.25 – 5 %. Cost estimations for addi-
tives/colour are done in the following way:
- 25 % of the 0.5 l bottle preforms were assumed to be a coloured
- 10% of the 1.5 l bottle preforms were assumed to be coloured
- These assumptions are based on surveying Oy Hartwall Abs product portfolio as
a general example (http://www.hartwall.fi/en/drinks/products/)
As the additives and colour are estimated to be dosed at relatively small amounts, an
estimated cost of 5 € for additives and 15 € for colour is used for ½ l and 15 € and 45 €
is used respectively for 1.5 l bottles.
9.2 Preform price (Product price without investments)
Two preform sizes are used as examples for thesis calculations. At the present, 0.5 l pre-
forms weighing 24 g and 1.5 l preforms weighing 41.5 g are commonly used by the
beverage industry. As discussed in chapter 9.1.1, bottle grade PET is estimated to cost
1350 €/ton FOB destination.
Figure 21 Chain extender dosage. Source: Additives for the Modification of Poly(Ethylene Terephthalate) to Produce Engineering-Grade Polymers by J Scheirs.
42
1 ton of bottle grade PET raw material can produce:
0.5 l preforms 1000 kg /0.024 kg = 41666 preforms
1.5 l preforms 1000 kg/0.0415 kg = 24096 preforms.
It is assumed that the transparent preforms will include some additives and the coloured
preforms will require both the additives and colour. Thus 4 different Product (preform)
prices will be calculated using the formula below:
(PET raw material price+ additives+ colour (if the preform is coloured) /amount of pre-
forms produced)
0.5 l Transparent preform price:(1350 €+5 €)/41666 preforms = 0,0325 €
0.5 l Coloured preform price:(1350 €+5 €+15 €)/41666 preforms = 0,0329 €
1.5 l Transparent preform price:(1350 € +15 €)/24096 preforms= 0,0566 €
1.5 l Coloured preform price: 1350 € +15 €+45 €/24096 preforms = 0,0585 €
According to the expert source working in the beverage industry, the average price (In
October 2012) for 0.5 l preforms is 4.5 ¢ (0,045 €) and 1.5 l preform 6.45 ¢ (0,0645 €)
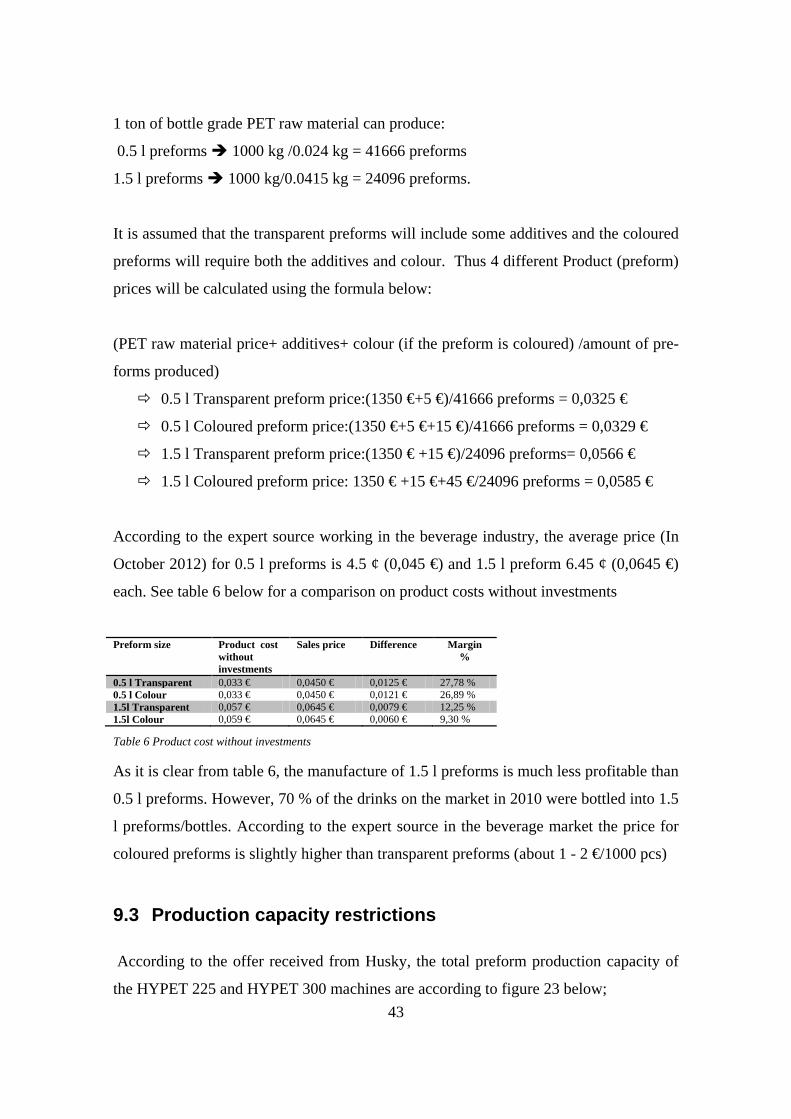
each. See table 6 below for a comparison on product costs without investments
Preform size Product cost
without investments
Sales price Difference Margin %
0.5 l Transparent 0,033 € 0,0450 € 0,0125 € 27,78 % 0.5 l Colour 0,033 € 0,0450 € 0,0121 € 26,89 % 1.5l Transparent 0,057 € 0,0645 € 0,0079 € 12,25 % 1.5l Colour 0,059 € 0,0645 € 0,0060 € 9,30 %
Table 6 Product cost without investments
As it is clear from table 6, the manufacture of 1.5 l preforms is much less profitable than
0.5 l preforms. However, 70 % of the drinks on the market in 2010 were bottled into 1.5
l preforms/bottles. According to the expert source in the beverage market the price for
coloured preforms is slightly higher than transparent preforms (about 1 - 2 €/1000 pcs)
9.3 Production capacity restrictions
According to the offer received from Husky, the total preform production capacity of
the HYPET 225 and HYPET 300 machines are according to figure 23 below; 43

Figure 22 Production capacity of HYPET 225 & 300 [53]
Theoretically, it can be assumed that the 225-ton machine could produce 81 million 0.5
l preforms and the rest of its production capacity could be used in addition to the 300-
ton machines capacity to manufacture 189 million 1.5 l – 2 l preforms. These figures
are comparable to the domestic preform market of year 2010. These figures are well un-
der the annual full capacity figure given by Husky in their preform systems brochure.
(Hypet 225/0.5 l mould with 48 cavities 163 million pcs or 1.5 l 154.4 million pcs with
48 cavities. Hypet 300/0.5 l with 72 cavity mould 236.6 million pcs or 224.4 million pcs
of 1.5 l with 72 cavity mould. [54]
9.4 Background on cost calculations for plastics production
The original heating and electricity consumption figures to use for calculations were
based on the environmental permit of Hämeen Lanka [36], on a vast array of production
machines. These consumption figures are however not applicable to the preform pro-
duction machinery electricity consumption. Table 7 below lists the main electrical ap-
pliances and an estimated calculation on their usage on a working year of 350 days. The
15 days left over from a full year, are considered to be service breaks and public holi-
days when the factory is closed. This is also the maximum estimated production effi-
ciency figure (95%, 8400 hours 350 days) given by the offer received from Husky.
The total electricity consumption was based on the following facts and estimations:
• The factory has 3 elevators • 2 of the 3 floors will be illuminated for 16h/day/working week. Electrical light-
ing is estimated using a 5W/m2 illumination need over a 3000 m2 floor area • 2 electrical forklift trucks will be used to transport the goods for 3 hours per day • 1-2 Injection moulding machines will be used for production purposes, their
utilisation depending solely on the current order book. Their yearly consumption has been calculated using both Injection moulding machines
Electricity consumption for the injection moulding machines was calculated from the
offer received from Husky [53], with a daily consumption of 9 MWh for the 225 ton 44

machine. To estimate the consumption for the 300-ton machine, the electrical consump-
tion of the 225-ton machine was divided by its clamping force and multiplied by 300:
HyPET 225: 9 MWh X 24h X 350 days = 75600 MWh
HyPET 330: 9 MWh/225t = 0,04Mwh/h. 0,04 MWh X 300 = 12 MWh. The 300-ton
injection moulding machine consumption is 12 MWh 12 MWh X 24h X 350 days =
100800 MWh
Electricity consumption calculated with this information adds up to almost 400 MWh as
seen in table 7. By using the information on electrical pricing for industrial use from the
Statistics Finland web-site [49], an annual estimate can be calculated:
Electricity price for annual industrial use: 10,71¢ /kWh X 400,00 MWh 0,107 € X
400 000 KWh 42 800 € ≈ 43 000 €
To allow for some price and other possible power consumption fluctuations, a sum of
46 000 € is used for running the factory at full production capacity on 2 machines.
Equipment Daily usage/h Days/year Amount Yearly consump-tion
Unit
3 Elevators 3 350 3 pcs 12,6 MWh Lighting 16 350 2 floors 168 MWh Forklifts 3 350 2 pcs 42 MWh IM Machine 225 ton 24 350 1 pc 75,6 MWh IM Machine 300 ton 24 350 1 pc 100,8 MWh Total consumption 399,0 MWh 10,71 ¢/Kwh 45 666,74 €
Table 7 Estimated electricity costs for preform production, using a 225-ton and 300-ton injection moulding machines
9.5 Heating expenses
As described in chapter 2.6, the site is equipped with a large oil burner which used
208,3 tons of heavy oil a year for heating the factory. The main factory building has an
area of 3714 m2, spread out over 3 floors (approximately 1200m2/floor). The proposed
preform production requires only 20 % of the factory facility area and needs heating.
This can be done by using the existing oil burner, but heating will be primarily handled
by using cooling water of the injection moulding machines. The warm cooling water
will be fed into the heating batteries and then back into the cooling system of the mould
in the Injection moulding machine. The need for heating oil is calculated by:
45

(208, 3 tonnes / 300 days) [35] X 350 days (current working year planned with plastics
production) = 241,016 tonnes.
By using the information on heavy oil pricing for industrial use from the Statistics
Finland web-site [60], a yearly estimate can be calculated:
241,016 tonnes of oil/100 X 20 % = 48, 2 tonnes oil consumption/year. At this con-
sumption, the yearly cost would be at:
48,2t X 1000kg X 0,612 €/kg [60] = 29500,35 €
To account for fluctuations, a figure of 30 000 € is used for calculations. An assumption
has been made that 50 % of the heating capacity is sufficient until a 50 % market of
proposed preform production is reached. This is due to that necessary working- and
storage space for ready products and raw materials would be substantially smaller, and
can be separated from the cold part of the factory by using Styrofoam or other padding.
9.6 Insurance
An insurance covering possible fire hazards and production stops has been estimated to
cost 100000 €/yr. A 1% annual rise in the fee has been estimated for in the calculations.
9.7 Overhaul of premises
The factory needs to be tidied up, the production and warehousing area to be re-painted
and insulated for noise- and heat insulation, and two doors need to be remade (see chap-
ter 8 Factory layout). An estimated sum of 100 000 € has been earmarked for this. In the
calculations an overhaul of the factory premises is set to happen every 10 years after the
primary overhaul.
46

9.8 Maintenance of production machines and site equipment
Maintenance of production machinery, elevators and fork lift trucks depend on produc-
tion load, so annual cost estimations are related directly to production capacity. An es-
timated 10 (20% production load) - 50 000 € (95%) is needed for the maintenance
9.9 Employee wages
Production has been planned to run in 3 shifts (07-15, 15-23 & 23-07 (unmanned)). The
unmanned shift will be monitored remotely, using alarm triggers and web access from
the foreman’s home. Weekend shifts are not accounted for in these calculations, they
are more expensive to run and the production equipment needs downtime. If incoming
orders increase, weekend shifts are possible. This would require the machines to be ser-
viced at a more frequent basis thus and increasing service and overhaul costs.
Each production cell is manned by one or two workers. The cell consists of an Injection
moulding machine and packing of the preforms into boxes, manually or by a robot arm.
The workers responsibilities also cover primary quality control of the products and
transferring the saleable products into the warehouse.
The production personnel’s wages are based on figures from the Finnish Plastics and
chemistry industries (Muovituoteteollisuus ja kemian tuoteteollisuus) collective bar-
gaining agreement (in force until 31.1.2013) [47] and an article in Taloussanomat [48].
An average wage was calculated based on these hourly wages (10,91 €/h and 13,64 €/h)
(10,91 €+13,64 €)/2 = 12, 28 €/h. Thus the wage on the production floor is 12,28
€/h.
The production is monitored by a shop floor manager, whose working time normally is
set so that his/her working hours overlap on both shifts to ensure proper communication
to both shifts and can carry out possible troubleshooting duties during the daytime and
47

(The shops floor managers working hours could be for example 9 – 17) The shop floor
managers wages are set at 15, 96 €/h. The rest of the wages are described in table 8.
In the beginning, or when the order base will cover a market share of 20 – 30 %, 3 peo-
ple will work on the shop floor and the floor manager will run administration duties,
covering as a back-up for shop-floor duties. If the order base will increase to over 50 %,
more workers may be employed to relieve then manager from dual duties.
Employees: Amount Wage Monthly salary Social sec.payments etc. Yearly salary costs Shift workers 3 12,28 €/h 1 951,73 € 2 400,62 € 86 422,32 € Shop floor manager 1 15,96 €/h 2 537,24 € 3 120,81 € 37 449,72 € Office: sales, marketing & billing 1 17,55 €/h 2 790,97 € 3 432,89 € 41 194,68 € Managing and warehousing director 1 17,55 €/h 2 790,97 € 3 432,89 € 41 194,68 € Total 7 206 261,40 €
Table 8 Wage calculations for factory running under 50 % production capacity
Employees: Amount Wage Monthly salary
Including social sec.payments etc.
Annual salary
Yearly salary costs
Shift workers 4 12,28 €/h 1 951,73 € 2 400,62 € 28 807,44 € 115 229,76 € Shop floor manager 1 15,96 €/h 2 537,24 € 3 120,81 € 37 449,72 € 37 449,72 € Office: sales, marketing etc. 2 17,55 €/h 2 790,97 € 3 432,89 € 41 194,68 € 82 389,36 € Warehousing : manager 1 12,28 €/h 1 951,73 € 2 400,62 € 28 807,44 € 28 807,44 € Managing director 1 20,00 €/h 3 178,71 € 3 909,81 € 46 917,72 € 46 917,72 € Total 12 310 794,00 €
Table 9 Annual wage costs of the workers if the market share rises over 50 % of possible factory production capacity
9.10 Production equipment
Based on planned market share acquisition, two injection moulding machines are
needed to produce the preforms. Husky equipment was chosen because it is the market
leader in preform technology and their offer was used to base the calculations on. The
machines are characterised by the clamping force that they can provide. The clamping
force, indicates the amount of force that the clamping unit can apply to the mould to
keep it securely closed during the injection of the molten plastic [57]
The machines are the Husky HYPET 225, which has a clamping force of 225 tonnes
and the HYPET 300 machine with 300 tonnes. The reason for the larger machine is its
can provide a larger production capacity if necessary with separately purchased 72 cav-
ity moulds for 0.5 both and 1.5 l preforms.
a. The 225-ton Injection moulding machine mainly produces 0.33, 0.5 l, 0.95 and 1.5 l bottle preforms. It has a 48 cavity 24g preform mould for 0.5 l CSD bottles.
48

b. The 300-ton machine would mainly produce 1.5 or/and 2.0 l bottles. The sup-plied 48 cavity 41.5 g preform mould is for the production of 1.5 l CSD bottles.
9.11 Investment loan
A 3 000 000 € loan is needed to cover the purchase of the equipment described in Table
10 below. The purchase of the injection moulding machines is funded by a loan from
Export Development Canada (EDC) as Husky is a Canadian company. Husky sells the
order they receive to EDC, and EDC in turn charges the end customer, whilst offering
extended payment terms and competitively-priced financing.
The 400 000 € loan which is left over can be obtained from a domestic bank, or by fi-
nancing by the counterparts of the company. This is discussed further in chapters 10.1
& 10.2. The estimate of the total machine package price has been made by using an of-
fer for a HYPET-225 machine received from HUSKY Injection Molding Systems UK
Ltd. [53]
Amount Description Price
1 225-ton Husky HYPET Injection moulding machine
1 300-ton Husky HYPET Injection moulding machine
Both machines are equipped with hoppers, robot arms etc. The delivery is on a “turnkey”-basis
Total 2 600 000 €
2-3 Electric forklift trucks, bought used, for example from DKS.fi Total 15000 €
1 Cost of acquiring factory 250 000 €
Cost of investments covered by 3000000 € loan 2865000 €, thus leaving 135000 € for possibly unexpected costs
Table 10 the contents of the whole investment loan
The loan has been planned to be taken for a time period of 9 years, to ensure the possi-
bility of a reasonable payback timetable and market liquidity of the company during the
simulated 10-year time period. Interest rate for the loan has been set at 6.5 %. The Pay-
back for the loan starts during the 2nd year of operation of the 10-year period. See Table
11 for the detailed payback scheme of the loan.
Loan payment no.
1 2 3 4 5 6 7 8 9
Payment date 30.11.2014 30.11.2015 30.11.2016 30.11.2017 30.11.2018 30.11.2019 30.11.2020 30.11.2021 30.11.2022 Interest rate 6.5 % 6.5 % 6.5 % 6.5 % 6.5 % 6.5 % 6.5 % 6.5 % 6.5 % Principal payment 255 714,1 € 272 335,5 € 290 037,3 € 308 889,8 € 328 967,6 € 350 350,5 € 373 123,3 € 397 376,3 € 423 205,7 € Interest 195 000,0 € 178 378,6 € 160 676,8 € 141 824,4 € 121 746,5 € 100 363,6 € 77 590,8 € 53 337,8 € 27 508,4 € Loan balance 2 744 285,9 € 2 471 950,38 € 2 181 913,05 € 1 873 023,3 € 1 544 055,71 € 1 193 705,23 € 820 581,97 € 423 205,7 € 0 €
Table 11 Loan payback scheme 49
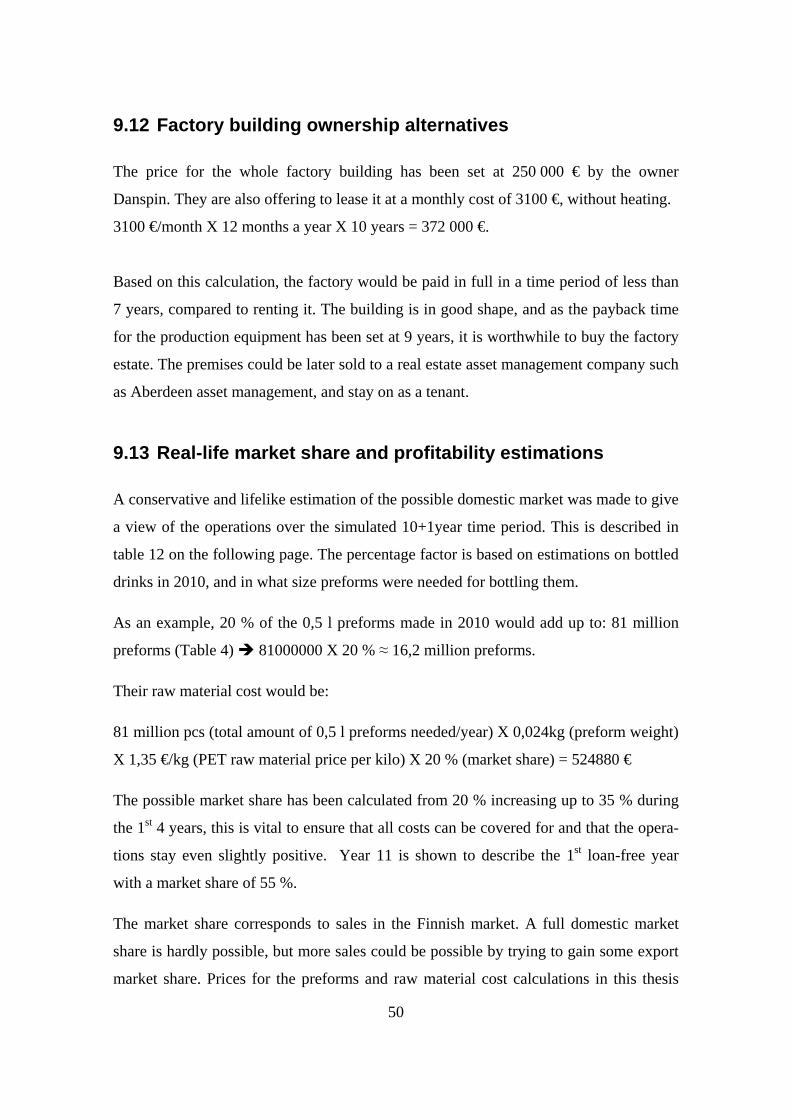
9.12 Factory building ownership alternatives
The price for the whole factory building has been set at 250 000 € by the owner
Danspin. They are also offering to lease it at a monthly cost of 3100 €, without heating.
3100 €/month X 12 months a year X 10 years = 372 000 €.
Based on this calculation, the factory would be paid in full in a time period of less than
7 years, compared to renting it. The building is in good shape, and as the payback time
for the production equipment has been set at 9 years, it is worthwhile to buy the factory
estate. The premises could be later sold to a real estate asset management company such
as Aberdeen asset management, and stay on as a tenant.
9.13 Real-life market share and profitability estimations
A conservative and lifelike estimation of the possible domestic market was made to give
a view of the operations over the simulated 10+1year time period. This is described in
table 12 on the following page. The percentage factor is based on estimations on bottled
drinks in 2010, and in what size preforms were needed for bottling them.
As an example, 20 % of the 0,5 l preforms made in 2010 would add up to: 81 million
preforms (Table 4) 81000000 X 20 % ≈ 16,2 million preforms.
Their raw material cost would be:
81 million pcs (total amount of 0,5 l preforms needed/year) X 0,024kg (preform weight)
X 1,35 €/kg (PET raw material price per kilo) X 20 % (market share) = 524880 €
The possible market share has been calculated from 20 % increasing up to 35 % during
the 1st 4 years, this is vital to ensure that all costs can be covered for and that the opera-
tions stay even slightly positive. Year 11 is shown to describe the 1st loan-free year
with a market share of 55 %.
The market share corresponds to sales in the Finnish market. A full domestic market
share is hardly possible, but more sales could be possible by trying to gain some export
market share. Prices for the preforms and raw material cost calculations in this thesis
50

cover the transport to the Hämeen Lanka production plant and also transport of the
ready products to the domestic beverage producers. See Figures 10, 11 and Table 5, in
chapter 3.5 Transportation of manufactured goods to mineral water and beverage manu-
facturers and harbours for more information.
Cost estimation Year: 2013 2014 2015 2016 2017 2018 2019 2020 2021 2022 2023 Expenses Market share 20 % 35 % 35 % 35 % 40 % 40 % 40 % 45 % 50 % 55 % 55 % 0.5 l PET granules (1350€/tn) 524 880 € 918 540 € 918 540 € 918 540 € 1 049 760 € 1 049 760 € 1 049 760 € 1 180 980 € 1 312 200 € 1 443 420 € 1 443 420 € 0.5 l additives 1 458 € 2 552 € 2 552 € 2 552 € 2 916 € 2 916 € 2 916 € 3 281 € 3 645 € 4 010 € 4 010 € 0,5 l Colour additives 1 944 € 3 402 € 3 402 € 3 402 € 3 888 € 3 888 € 3 888 € 4 374 € 4 860 € 5 346 € 5 346 € 1.5 l PET granules (1350€/tn) 2 117 745 € 3 706 054 € 3 706 054 € 3 706 054 € 4 235 490 € 4 235 490 € 4 235 490 € 4 764 926 € 5 294 363 € 5 823 799 € 5 823 799 €
1.5 l additives 21 178 € 37 061 € 37 061 € 37 061 € 42 356 € 42 356 € 42 356 € 47 650 € 52 944 € 58 239 € 58 239 € 1,5 l Colour additives 9 412 € 16 472 € 16 472 € 16 472 € 18 825 € 18 825 € 18 825 € 21 178 € 23 531 € 25 884 € 25 884 € Estate bought for 250 000 Electricity 9 200 € 16 100 € 16 100 € 16 100 € 18 400 € 18 400 € 18 400 € 20 700 € 23 000 € 25 300 € 25 300 € Heating oil 15 000 € 15 000 € 15 000 € 15 000 € 15 000 € 15 000 € 15 000 € 15 000 € 18 000 € 18 000 € 18 000 € Insurance 100 000 € 101 000 € 102 010 € 103 030 € 104 060 € 105 101 € 106 152 € 107 214 € 108 286 € 109 369 € 110 462 € Overhaul of premises, machines 100 000 € 100 000 € Maintenance of machines 10 000 € 17 500 € 17 500 € 17 500 € 20 000 € 20 000 € 20 000 € 22 500 € 25 000 € 27 500 € 27 500 € Wages 206 261 € 206 261 € 206 261 € 206 261 € 206 261 € 206 261 € 206 261 € 206 261 € 310 794 € 310 794 € 310 794 € Production machinery Covered by loan described below: Loan payment no. 1 2 3 4 5 6 7 8 9 Loan payment date 30.11.2014 30.11.2015 30.11.2016 30.11.2017 30.11.2018 30.11.2019 30.11.2020 30.11.2021 30.11.2022 Loan paid Interest rate 6.5 % 6.5 % 6.5 % 6.5 % 6.5 % 6.5 % 6.5 % 6.5 % 6.5 % Principal payment 255 714 € 272 336 € 290 037 € 308 890 € 328 968 € 350 350 € 373 123 € 397 376 € 423 206 € Interest at 6.5 % rate 195 000 € 178 379 € 160 677 € 141 824 € 121 747 € 100 364 € 77 591 € 53 338 € 27 508 € Loan balance 3 000 000 € 2 744 286 € 2 471 950 € 2 181 913 € 1 873 023 € 1 544 056 € 1 193 705 € 820 582 € 423 206 € Total 3 117 078 € 5 431 169 € 5 432 179 € 5 433 199 € 6 099 686 € 6 100 726 € 6 101 777 € 6 768 295 € 7 542 356 € 8 208 895 € 7 759 275 € Assets Real estate 350 000 € 357 000 € 364 140 € 371 423 € 378 851 € 386 428 € 394 157 € 402 040 € 410 081 € 418 282 € 426 648 € Fork lift trucks 15 000 € 13 500 € 12 150 € 10 935 € 9 842 € 8 857 € 7 972 € 7 174 € 6 457 € 5 811 € 5 230 € Production machinery 2 600 000 € 2 496 000 € 2 396 160 € 2 300 314 € 2 208 301 € 2 119 969 € 2 035 170 € 1 953 763 € 1 875 613 € 1 800 588 € 1 728 565 € Total 2 965 000 € 2 866 500 € 2 772 450 € 2 682 671 € 2 596 994 € 2 515 255 € 2 437 299 € 2 362 978 € 2 292 151 € 2 224 682 € 2 160 443 € ROA 1,27 % 2,93 % 3,00 % 3,07 % 6,82 % 7,01 % 7,20 % 9,92 % 12,36 % 16,99 % 33,21 % Debt-Equity ratio 101,18 % 95,74 % 89,16 % 81,33 % 72,12 % 61,39 % 48,98 % 34,73 % 18,46 % 0,00 % 0,00 % Income 20 % 35 % 35 % 35 % 40 % 40 % 40 % 45 % 50 % 55 % 55 % 0,5 l Preforms sold (pcs) 16200000 28350000 28350000 28350000 32400000 32400000 32400000 36450000 40500000 44550000 44550000 1,5 l Preforms sold (pcs) 37800000 66150000 66150000 66150000 75600000 75600000 75600000 85050000 94500000 103950000 103950000 Amount of sold preforms 54000000 94500000 94500000 94500000 108000000 108000000 108000000 121500000 135000000 148500000 148500000 0,5 l 729 000 € 1 275 750 € 1 275 750 € 1 275 750 € 1 458 000 € 1 458 000 € 1 458 000 € 1 640 250 € 1 822 500 € 2 004 750 € 2 004 750 € 1,5 l 2 438 100 € 4 266 675 € 4 266 675 € 4 266 675 € 4 876 200 € 4 876 200 € 4 876 200 € 5 485 725 € 6 095 250 € 6 704 775 € 6 704 775 € Total 3 167 100 € 5 542 425 € 5 542 425 € 5 542 425 € 6 334 200 € 6 334 200 € 6 334 200 € 7 125 975 € 7 917 750 € 8 709 525 € 8 709 525 € Profit/Loss before taxes 50 022 € 111 256 € 110 246 € 109 226 € 234 514 € 233 474 € 232 423 € 357 680 € 375 394 € 500 630 € 950 250 €
Table 12 Cost estimation for 2013-2023 above and below
9.14 Break-even
A simulated break-even scheme has been calculated in table 13 on the next page. This is
to show what kind of market share is needed to achieve a zero result. To achieve these
figures the following conditions must be met:
1. The amount of production personnel shall be according to Table 8; 2. The average annual market share should be ≈ 32 %
51
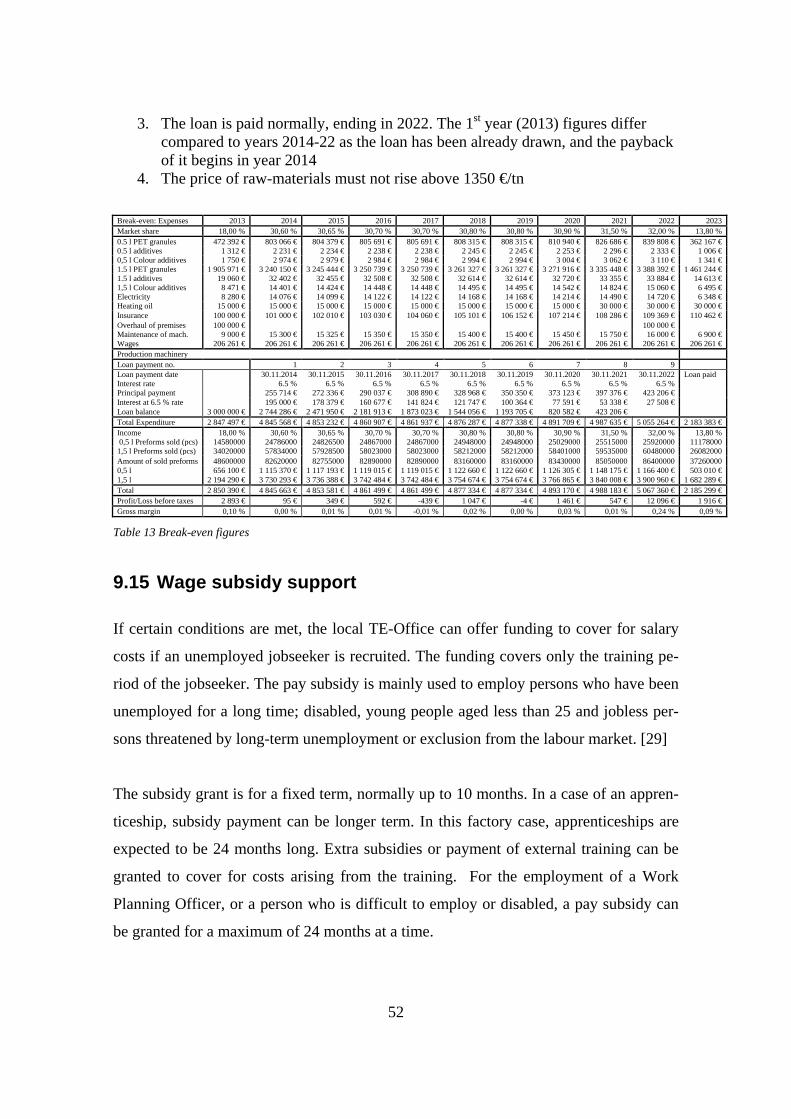
3. The loan is paid normally, ending in 2022. The 1st year (2013) figures differ compared to years 2014-22 as the loan has been already drawn, and the payback of it begins in year 2014
4. The price of raw-materials must not rise above 1350 €/tn Break-even: Expenses 2013 2014 2015 2016 2017 2018 2019 2020 2021 2022 2023 Market share 18,00 % 30,60 % 30,65 % 30,70 % 30,70 % 30,80 % 30,80 % 30,90 % 31,50 % 32,00 % 13,80 % 0.5 l PET granules 472 392 € 803 066 € 804 379 € 805 691 € 805 691 € 808 315 € 808 315 € 810 940 € 826 686 € 839 808 € 362 167 € 0.5 l additives 1 312 € 2 231 € 2 234 € 2 238 € 2 238 € 2 245 € 2 245 € 2 253 € 2 296 € 2 333 € 1 006 € 0,5 l Colour additives 1 750 € 2 974 € 2 979 € 2 984 € 2 984 € 2 994 € 2 994 € 3 004 € 3 062 € 3 110 € 1 341 € 1.5 l PET granules 1 905 971 € 3 240 150 € 3 245 444 € 3 250 739 € 3 250 739 € 3 261 327 € 3 261 327 € 3 271 916 € 3 335 448 € 3 388 392 € 1 461 244 € 1.5 l additives 19 060 € 32 402 € 32 455 € 32 508 € 32 508 € 32 614 € 32 614 € 32 720 € 33 355 € 33 884 € 14 613 € 1,5 l Colour additives 8 471 € 14 401 € 14 424 € 14 448 € 14 448 € 14 495 € 14 495 € 14 542 € 14 824 € 15 060 € 6 495 € Electricity 8 280 € 14 076 € 14 099 € 14 122 € 14 122 € 14 168 € 14 168 € 14 214 € 14 490 € 14 720 € 6 348 € Heating oil 15 000 € 15 000 € 15 000 € 15 000 € 15 000 € 15 000 € 15 000 € 15 000 € 30 000 € 30 000 € 30 000 € Insurance 100 000 € 101 000 € 102 010 € 103 030 € 104 060 € 105 101 € 106 152 € 107 214 € 108 286 € 109 369 € 110 462 € Overhaul of premises 100 000 € 100 000 € Maintenance of mach. 9 000 € 15 300 € 15 325 € 15 350 € 15 350 € 15 400 € 15 400 € 15 450 € 15 750 € 16 000 € 6 900 € Wages 206 261 € 206 261 € 206 261 € 206 261 € 206 261 € 206 261 € 206 261 € 206 261 € 206 261 € 206 261 € 206 261 € Production machinery Loan payment no. 1 2 3 4 5 6 7 8 9 Loan payment date 30.11.2014 30.11.2015 30.11.2016 30.11.2017 30.11.2018 30.11.2019 30.11.2020 30.11.2021 30.11.2022 Loan paid Interest rate 6.5 % 6.5 % 6.5 % 6.5 % 6.5 % 6.5 % 6.5 % 6.5 % 6.5 % Principal payment 255 714 € 272 336 € 290 037 € 308 890 € 328 968 € 350 350 € 373 123 € 397 376 € 423 206 € Interest at 6.5 % rate 195 000 € 178 379 € 160 677 € 141 824 € 121 747 € 100 364 € 77 591 € 53 338 € 27 508 € Loan balance 3 000 000 € 2 744 286 € 2 471 950 € 2 181 913 € 1 873 023 € 1 544 056 € 1 193 705 € 820 582 € 423 206 € Total Expenditure 2 847 497 € 4 845 568 € 4 853 232 € 4 860 907 € 4 861 937 € 4 876 287 € 4 877 338 € 4 891 709 € 4 987 635 € 5 055 264 € 2 183 383 € Income 18,00 % 30,60 % 30,65 % 30,70 % 30,70 % 30,80 % 30,80 % 30,90 % 31,50 % 32,00 % 13,80 % 0,5 l Preforms sold (pcs) 14580000 24786000 24826500 24867000 24867000 24948000 24948000 25029000 25515000 25920000 11178000 1,5 l Preforms sold (pcs) 34020000 57834000 57928500 58023000 58023000 58212000 58212000 58401000 59535000 60480000 26082000 Amount of sold preforms 48600000 82620000 82755000 82890000 82890000 83160000 83160000 83430000 85050000 86400000 37260000 0,5 l 656 100 € 1 115 370 € 1 117 193 € 1 119 015 € 1 119 015 € 1 122 660 € 1 122 660 € 1 126 305 € 1 148 175 € 1 166 400 € 503 010 € 1,5 l 2 194 290 € 3 730 293 € 3 736 388 € 3 742 484 € 3 742 484 € 3 754 674 € 3 754 674 € 3 766 865 € 3 840 008 € 3 900 960 € 1 682 289 € Total 2 850 390 € 4 845 663 € 4 853 581 € 4 861 499 € 4 861 499 € 4 877 334 € 4 877 334 € 4 893 170 € 4 988 183 € 5 067 360 € 2 185 299 € Profit/Loss before taxes 2 893 € 95 € 349 € 592 € -439 € 1 047 € -4 € 1 461 € 547 € 12 096 € 1 916 € Gross margin 0,10 % 0,00 % 0,01 % 0,01 % -0,01 % 0,02 % 0,00 % 0,03 % 0,01 % 0,24 % 0,09 %
Table 13 Break-even figures
9.15 Wage subsidy support
If certain conditions are met, the local TE-Office can offer funding to cover for salary
costs if an unemployed jobseeker is recruited. The funding covers only the training pe-
riod of the jobseeker. The pay subsidy is mainly used to employ persons who have been
unemployed for a long time; disabled, young people aged less than 25 and jobless per-
sons threatened by long-term unemployment or exclusion from the labour market. [29]
The subsidy grant is for a fixed term, normally up to 10 months. In a case of an appren-
ticeship, subsidy payment can be longer term. In this factory case, apprenticeships are
expected to be 24 months long. Extra subsidies or payment of external training can be
granted to cover for costs arising from the training. For the employment of a Work
Planning Officer, or a person who is difficult to employ or disabled, a pay subsidy can
be granted for a maximum of 24 months at a time.
52

The aim is to employ person(s) to become permanent employees, subsidy offered by the
TE-office being partly a training time to rehabilitate the jobseeker back to work and get-
ting accustomed to their possible new work chores. The normal minimum wage subsidy
is 670 €/month. An additional subsidy is paid to jobseekers that are difficult to employ
(for example for rehabilitation or unemployment has lasted over 500 days). The addi-
tional subsidy part is between 60-90 % of the basic subsidy.
To receive additional subsidies to employ a person, the subsidy must be used to improve
the competence and vocational skills of the employee through training or otherwise.
In these cases the different subsidies would be:
- The normal subsidy is 670 €/month
- With the additional part the subsidy would be 1072 €/month (670 €+670 X 0.6 )
- For jobseekers who are difficult to employ, the subsidy would be 1273 €/month
(670 € + 670 € X 0,9 ) [67]
In the factory case, possible wage subsidies could be used. Table 14 displays possible
subsidy compensation related to single person annual wage expenses. Employee Amount Normal annual
salary costs With normal subsidy
With extra subsidy
Subsidy for diffi-cult to employ
Shift workers 1 28 807,44 € 25 568,68 € 20 744,68 € 18 332,68 €
Shop floor manager 1 37 449,72 € 35 651,34 € 30 827,34 € 28 415,34 €
Office: sales, marketing etc.
1 41 194,68 € 40 020,46 € 35 196,46 € 32 784,46 €
Warehousing : manager 1 28 807,44 € 25 568,68 € 20 744,68 € 18 332,68 €
Managing director 1 46 917,72 € 46 697,34 € 41 873,34 € 39 461,34 €
Table 14 Personnel wages with possible subsidy compensations
The scenario is assumed with the following;
- 2 of the shop floor workers are on apprenticeship/persons that are difficult to employ/on rehabilitation. Wage costs are subsidised for the first 2 years of com-pany existence by the TE-Office.
- If the market share increases to 50 % more personnel will be employed, both to the shop and the office to take care of administration/sales and billing. A total of four people will be employed using wage subsidy grants, all for a period of 2 years. The aim is of course to employ these people as permanent workers for the company later on.
53

9.16 Exit strategy
As stated in chapter 9.14, an annual market share of approximately 32 % must be
reached to ensure a sufficient cash flow to pay for expenses such as loan costs which
cannot be decreased by downsizing production or by other means. If operations fail, the
injection moulding machines and the possible raw material stock are the most valuable
assets. As an example, a year’s worth of Bottle grade PET raw material and their addi-
tives can cost over 4,28 MEUR. (Based on the 32 % market share in Table 13) There
are numerous companies making food containers in the near Baltic countries and Swe-
den as well, so selling the raw materials should not be a major problem.
The HyPET injection moulding machines are specially made for preform production,
and are sold quite often used by companies such as Top machine brokers, Elite machin-
ery systems and Plastemart. The building has been empty already for a long time pe-
riod, so it could pose a bigger problem in liquidating it. However, as mentioned in para-
graph 2.1, the factory has been completely emptied during October 2012 so selling it
onwards should be an easier task with it being empty. In addition to this, new fibre optic
cabling is being dug into the ground past the factory site by Elenia, offering a new
world of possibilities being done in the site. As an example, a data centre similar to
Google’s site in Hamina could be ideal to be built into the building as it is very robust
and secure.
10 FINANCIAL PARAMETERS:
Several calculations were made to provide information to define if starting up a pre-
form production plant is profitable. Comparisons were made using ROI, EBIT and TIE
as figures of financial performance.
10.1 Return on investment (ROI)
The most common measure to see if a made investment is profitable is Return On In-
vestment (ROI). As the cash flow for the company is uneven, the ROI is calculated us-
ing the following formula: 54

Figure 23: Calculation of ROI with uneven cash flow. Source Henry Clay Ericsson´s lecture notes
I = initial investment, in monetary units (In this case, 3 000 000 €)
N = economic lifespan of the investment, in years (The calculations have been done on
for 10 years, so 10 years will be used)
F = annual net cash inflow (+) or outflow (-), in monetary units
The investment starts producing on the first day of year 1.
S = start-up cost, in monetary units (Set to 200 000 €; Two overhauls are done to the
factory during this timeframe, the 1st in 2013 and the 2nd during year 2022)
R = salvage value (rest value) of the investment after n years, in monetary units (This is
set to 500 000 €, as the calculations have been made for a 10+1 year period only). The
value is based on research of used machines from companies mentioned in chapter 9.16.
Figure 24 ROI Calculation
Figure 25 ROI Calculation values
The ROI Calculation is carried out as follows:
100 % X (- 200 000 €+50 022 €+111 256 € +110 246 €+109 226 €+234 514 €+233
474 €+232 423 €+357 680 €+375 394 €+500 630 € + 500 000 €) / 3 000 000 € X 10) =
8.72 % 55

Using these values, a ROI of 8.72 % was achieved. This value is not even close to a
normally required value minimum value of 25 % for ROI.
It is to be noted that:
- During year 2013 no loan payment instalments are paid. The 1st loan payment is
paid during year 2014. The estimated market share is for year 2013 is 20 %
- In 2018 half (50%) of the 3 000 000 € loan should be paid and the market share
is estimated to be 40 % if all goes well.
- During year 2022 the last instalment of the loan will be paid. Market share has
been estimated to be 55 % at this time.
10.1.1 ROI Estimation for 20 year time period
If a constant market share of 50 % could be maintained, a ROI of approximately of 14 –
19 % could be estimated for a time period of 20 years. This of course would require that
the fluctuating raw material price must not exceed the calculated PET raw material price
of 1350 €/tn, or other possible cheaper raw material alternatives could be utilised. Also
improvements in preform design, such as described in the chapter 15 Discussion would
be an advantage.
10.2 EBIT
EBIT stands for Earnings before Interest and Taxes. Accountants like to use the term
Net Operating Income for this income statement item, but finance people usually refer
to it as EBIT (pronounced as it is spelled - E, B, I, T). Either way, on an income state-
ment, it is the amount of income that a company has after subtracting operating ex-
penses from sales (hence the term net operating income). Another way of looking at it
is that this is the income that the company has before subtracting interest and taxes
(hence, EBIT). [58]
The EBIT for the 10+1 year period is displayed in the table 16 below. As it can be seen,
the EBIT value reaches 270 000 € on an estimated 35 % market share, during year 4
56

(2016). When the market share rises over 40 %, the EBIT is over the 0.4 MEUR mark.
When the loan is fully paid, the EBIT rises close to a 1 MEUR (950 250 € in 2023)
Table 15 EBIT 2013-2023
10.3 Debt/equity ratio
Debt-equity ratio is used to measure a company’s financial leverage by dividing its total
liabilities by its equity. It indicates what proportion of equity and debt the company is
using to finance its assets. In this case, the liabilities are the loans totalling 3 MEUR
loan for financing the investment of production machinery and other equipment de-
scribed in chapter 9.11 on the Investment loan. The equity calculations are done using
the following assumptions:
The factory value is set at 350 000€. The purchasing cost is 250 000 and an
overhaul costing of 100 000 € is needed (See Chapter 9.7 Overhaul of premises)
and other possible repair work of damages due to the factory being unused. The
value of the factory site is estimated to rise at an average cost-of-living index
based increase of 2 %/year, partly due to its almost uninhabited location.
The production equipment’s value is estimated to depreciate at a 4% yearly rate.
This is based on an assumption that the Injection moulding machines will have
an life time expectancy of 20 years
The 2 fork lift trucks which are bought used at a value of 15000 € are estimated
to have a lifetime expectancy of 10 years, thus a yearly deprecation of 10 %
As an example, the Debt equity ratio during year 2017 is:
1 873 023.3 € (Loan Balance)/ 2 596 994 € (Present value of equity) = 0.7212 72 %.
Or during year 2021: 423 205.7 € / 2 292 151 € = 18.46 %
The Debt/Equity ratio goes to zero after year 2022 as the loan has been paid in full.
57

10.4 Return on Assets (ROA)
Return on assets indicates how profitable the factory would be in relation to its assets. In
this case, the assets are the building, production machinery and the fork lift trucks.
ROA is calculated by: Net Income/Total assets.
For example, for the second operative year (2014) it would be:
83 998 €/ 2 866 500 € = 2,93 %
After the investment loan is paid in full (2023) The ROA rises up to a quite satisfactory
level of over 33 % 717 439 € / 2 160 443 € = 33,21 %.
The ROA indicators for fiscal years 2013 – 2023 are calculated in Table 17 below
Table 16ROA and Debt/Equity ratio calculations
11 OWNERSHIP OF THE FACTORY
11.1 Holding company
A separate holding limited liability company called Padas preform will be formed to run
the operations. Its share capital will be 600 000 €. The ownership is the following:
- 20 % of shares owned by the Padasjoki municipality
- 20 % of shares by the executive staff and employees
- 60 % owned by the entrepreneur him/herself
- A special issue of shares could be arranged towards the public. See table 18 on a
possible scenario on share price and economic indicators related to the market
share estimation and progress of the company.
58
2013 2014 2015 2016 2017 2018 2019 2020 2021 2022 2023 Market share 20 % 35 % 35 % 35 % 40 % 40 % 40 % 45 % 50 % 55 % 55 % Share equity 600000 € 600000 € 600000 € 600000 € 600000 € 600000 € 600000 € 600000 € 600000 € 600000 € 600 000 € Number of shares 200000 200000 200000 200000 200000 200000 200000 200000 200000 200000 200000 Share price 3,00 € 3,00 € 3,00 € 3,00 € 3,00 € 3,00 € 3,00 € 3,00 € 3,00 € 3,00 € 3,00 € EPS 0,25 € 0,56 € 0,55 € 0,55 € 1,17 € 1,17 € 1,16 € 1,79 € 1,88 € 2,50 € 4,75 € PE 11,99 € 5,39 € 5,44 € 5,49 € 2,56 € 2,57 € 2,58 € 1,68 € 1,60 € 1,20 € 0,63 € Selling price per share 1,25 € 2,78 € 2,76 € 2,73 € 5,86 € 5,84 € 5,81 € 8,94 € 9,38 € 12,52 € 23,76 € Total share equity 250108 € 556279 € 551229 € 546129 € 1172571 € 1167368 € 1162113 € 1788399 € 1876969 € 2503148 € 4751 250 €
Table 17 Shareholder scenario with present market share growth assumptions
11.2 Collaborative preform production with beverage producers
There are five main domestic beverage producers; Finn Spring, Olvi, Vip Juicemaker,
Hartwall & Sinebrychoff. Olvi, Hartwall & Sinebrychoff already collaborate in the form
of Palpa, Suomen Palautuspakkaus Oy PALPA. It administers and develops deposit-
based systems for beverage containers in Finland.
A questionnaire was made and sent by email to the leading Finnish beverage and beer
producers. It can be found from the appendix section of this thesis under the heading
“Questionnaire regarding preform procurements in Finland”. According to the feedback
received on the questionnaire, the following assumptions could be made;
1. The vendors would consider/would be interested in buying preforms from a finnish supplier. This would of course be done on a assumption that the formed company is financially healthy and would possibly also have export sales.
2. The domestic preform producer could charge between 1 – 5 % more on preforms compared to foreign competitors , depending on benefits such as applicability and shorter lead times versus the current suppliers.
3. No domestic competitors in preform production exist at this moment 4. Co-ownership of a domestic production plant could be considered.
11.3 Co-ownership of the preform production plant
As stated in chapter 11.2, the companies already have collaboration in the form of
Palpa. They possess joint know-how in recycling of bottles in co-operation with the re-
tail trade (shops) and breweries, the beverage producers could own the production plant
where their preforms are made. Several benefits would arise from a co-venture:
A decrease in logistics costs in warehousing and shorter transportation time and
distances Shorter lead times
59
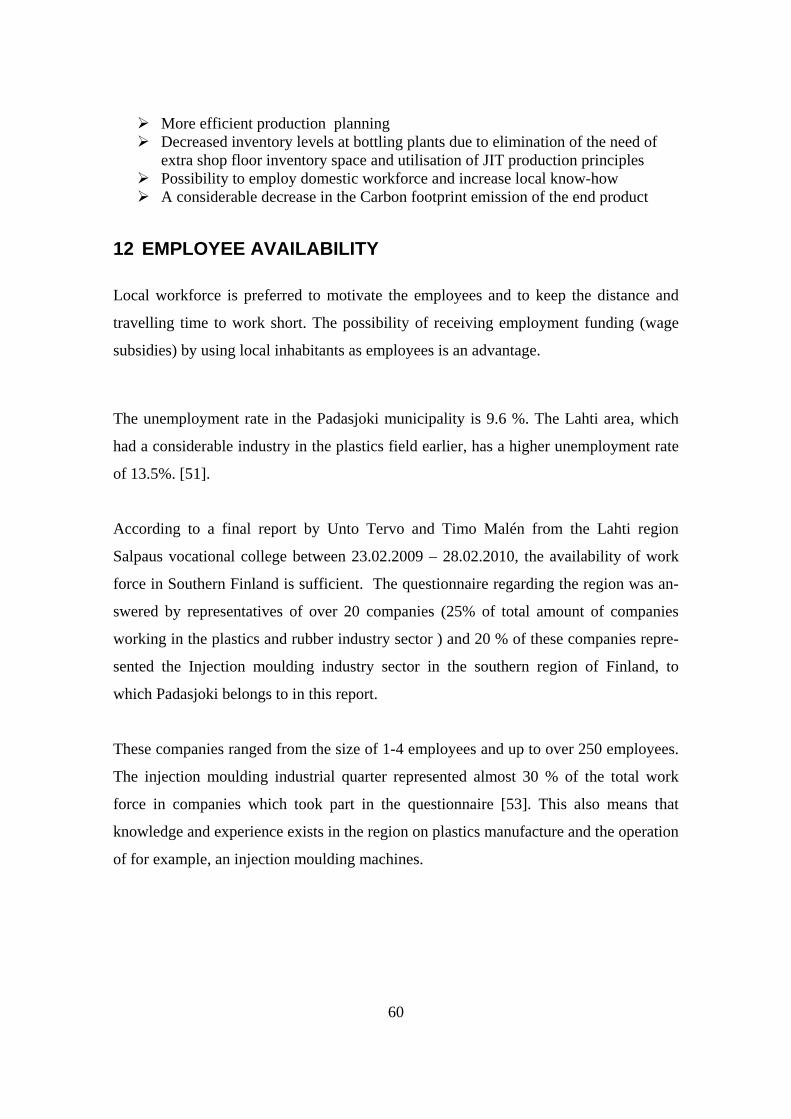
More efficient production planning Decreased inventory levels at bottling plants due to elimination of the need of
extra shop floor inventory space and utilisation of JIT production principles Possibility to employ domestic workforce and increase local know-how A considerable decrease in the Carbon footprint emission of the end product
12 EMPLOYEE AVAILABILITY
Local workforce is preferred to motivate the employees and to keep the distance and
travelling time to work short. The possibility of receiving employment funding (wage
subsidies) by using local inhabitants as employees is an advantage.
The unemployment rate in the Padasjoki municipality is 9.6 %. The Lahti area, which
had a considerable industry in the plastics field earlier, has a higher unemployment rate
of 13.5%. [51].
According to a final report by Unto Tervo and Timo Malén from the Lahti region
Salpaus vocational college between 23.02.2009 – 28.02.2010, the availability of work
force in Southern Finland is sufficient. The questionnaire regarding the region was an-
swered by representatives of over 20 companies (25% of total amount of companies
working in the plastics and rubber industry sector ) and 20 % of these companies repre-
sented the Injection moulding industry sector in the southern region of Finland, to
which Padasjoki belongs to in this report.
These companies ranged from the size of 1-4 employees and up to over 250 employees.
The injection moulding industrial quarter represented almost 30 % of the total work
force in companies which took part in the questionnaire [53]. This also means that
knowledge and experience exists in the region on plastics manufacture and the operation
of for example, an injection moulding machines.
60

Figure 26 Companies which took part in Salpaus´es questionnaire related to their workforce size and their industrial field. Ruiskuvalu = injection moulding. Picture source Loppuraportti_julkinen, received by email from Timo Malén during August 2010.
There are quite a few educational establishments giving training in the plastics field in
the vicinity of the factory area.
According to Tervos and Maléns report [52], the following schools and educational es-
tablishments offer training in the field of plastics:
Hyria Education (Hyvinkää-Riihimäki) Salpaus vocational college
Lahti University of Applied Sciences Jämsä College
Pirkanmaa Vocational Institute Vammalan ammattikoulu
Table 18 schools and educational establishments offering training in the field of plastics in the Häme municipality
Based on Tervos and Maléns research, the grounds for running the preform factory with personnel possessing a suitable work experience or gaining suitable further/education should not be a problem.
13 USE OF THE END PRODUCT
The preform is the manufactured end product for this thesis. The following steps are not
covered in detail as they are not in the scope of this work. However, to clarify how they
are used in beverage production a brief explanation of the process is explained.
The ready preforms are transported to the beverage manufacturer usually by road or by
railways. When the order reaches its destination, the preforms are loaded onto the bev-
erage production line for further processing before bottling. The neck part of the pre-
61
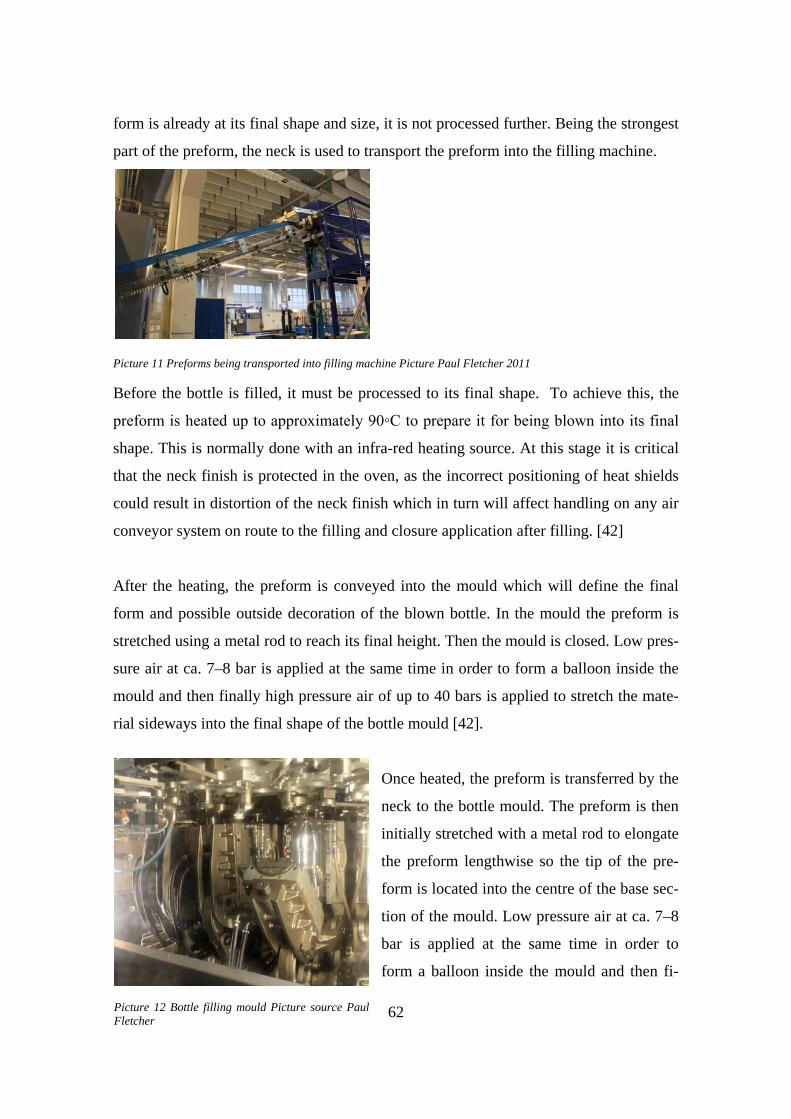
form is already at its final shape and size, it is not processed further. Being the strongest
part of the preform, the neck is used to transport the preform into the filling machine.
Picture 11 Preforms being transported into filling machine Picture Paul Fletcher 2011
Before the bottle is filled, it must be processed to its final shape. To achieve this, the
preform is heated up to approximately 90◦C to prepare it for being blown into its final
shape. This is normally done with an infra-red heating source. At this stage it is critical
that the neck finish is protected in the oven, as the incorrect positioning of heat shields
could result in distortion of the neck finish which in turn will affect handling on any air
conveyor system on route to the filling and closure application after filling. [42]
After the heating, the preform is conveyed into the mould which will define the final
form and possible outside decoration of the blown bottle. In the mould the preform is
stretched using a metal rod to reach its final height. Then the mould is closed. Low pres-
sure air at ca. 7–8 bar is applied at the same time in order to form a balloon inside the
mould and then finally high pressure air of up to 40 bars is applied to stretch the mate-
rial sideways into the final shape of the bottle mould [42].
Once heated, the preform is transferred by the
neck to the bottle mould. The preform is then
initially stretched with a metal rod to elongate
the preform lengthwise so the tip of the pre-
form is located into the centre of the base sec-
tion of the mould. Low pressure air at ca. 7–8
bar is applied at the same time in order to
form a balloon inside the mould and then fi-
Picture 12 Bottle filling mould Picture source Paul Fletcher 62

nally high pressure air of up to 40 bars is applied to stretch the material sideways into
the final shape of the bottle mould. These two operations must be done sequentially in
order to get maximum biaxial orientation of the polymer chains. See figure 12 for a
graphical description of the process.
When the preform has been blown into its final shape as a full-sized and shaped bottle,
it is ready to be filled with the whatever drink is planned for use.
14 CONCLUSION
Plastic goods manufacture has been an important income source to the Finnish industry.
Large scale production such as of mobile phone covers has been moved out of Finland
by the sales of Perlos´s [17] and Eimo´s [18] factories. After Eimo´s factory in Lahti
and Hollola were closed down, 1200 plastics workers became redundant [19].
At the same time new fields of plastics production and research and development have
emerged, and traditional plastic product manufacturers such as Orthex, has acquired
new companies and markets thus simultaneously improved their turnover from 12.3
MEUR (2009) to 13.6 MEUR (2010) and financial profit from 1.8 to 2.2 MEUR [21].
Surgical products, such as PLA-based implants manufactured by such companies as
Bioretec, Commed or Onbone’s wood composite material, manufactured from wood
chips and biodegradable plastic [22] offer a huge potential for the future, but are also
naturally potential targets for corporate buy-outs. However, Finland offers excellent
know-how and resources such as clean air, water and clean room facilities, which makes
Picture 13 Single bottle filling moulds Picture source Paul Fletcher
63

the immeadiate transfer of production and/or production facilities of these goods less
necessary to countries with lower manufacturing costs and labour.
Preform manufacture is not rocket science. The product design itself is easy to copy,
and just by doing a search of manufacturers on the internet will return tens or hundreds
of companies offering end products with advantageous prices from India and China just
as two examples producers. However, the Padasjoki region offers an excellent logistical
taxonomy to all of the domestic beverage producers and transport hubs such as harbours
and railway stations. There is plenty of qualified personnel in the area, and the
municipality is willing to help with re-employment of unemployed people.
14.1 Is it profitable of not ?
As seen in tables 12 and 13, a market share of approximately 30-35 % must be reached
during the second fiscal year at least to help the company survive. This is not an easy
task. In addition to this, long-term contracts with Finnish beverage producers would en-
sure the survival of the company. Another substantial factor in the profitability is the
raw material price. The price of Bottle grade PET as well as PET fluctuates violently
following the oil price. This is partly why new materials are being researched which
would not be so dependent on oil and simultaneously be more environmentally friendly.
The ROI was calculated to be 8.72 % during the 1st 10 year time period, this indicates
that the investment would not ne profitable. A Ballpark ROI estimation for a time pe-
riod of 20 years shows considerably improved values for the ROI value, but the calcula-
tions are based on pure assumptions which are discussed in chapter 10.1.1. The produc-
tion of preforms can be profitable, but it involves huge risks related to raw material
price fluctuation. This can of course be buffered by using the empty space as a ware-
house and fill it with surplus stock of raw materials. In addition to this, some export
share would be welcome, and somewhat necessary. Also investing into alcoholic drink
preform production and preform-based test tubes could be profitable in the future.
Based on the calculated figures for the first 10 years, it is not profitable for a private
company to produce preforms in Finland.
64
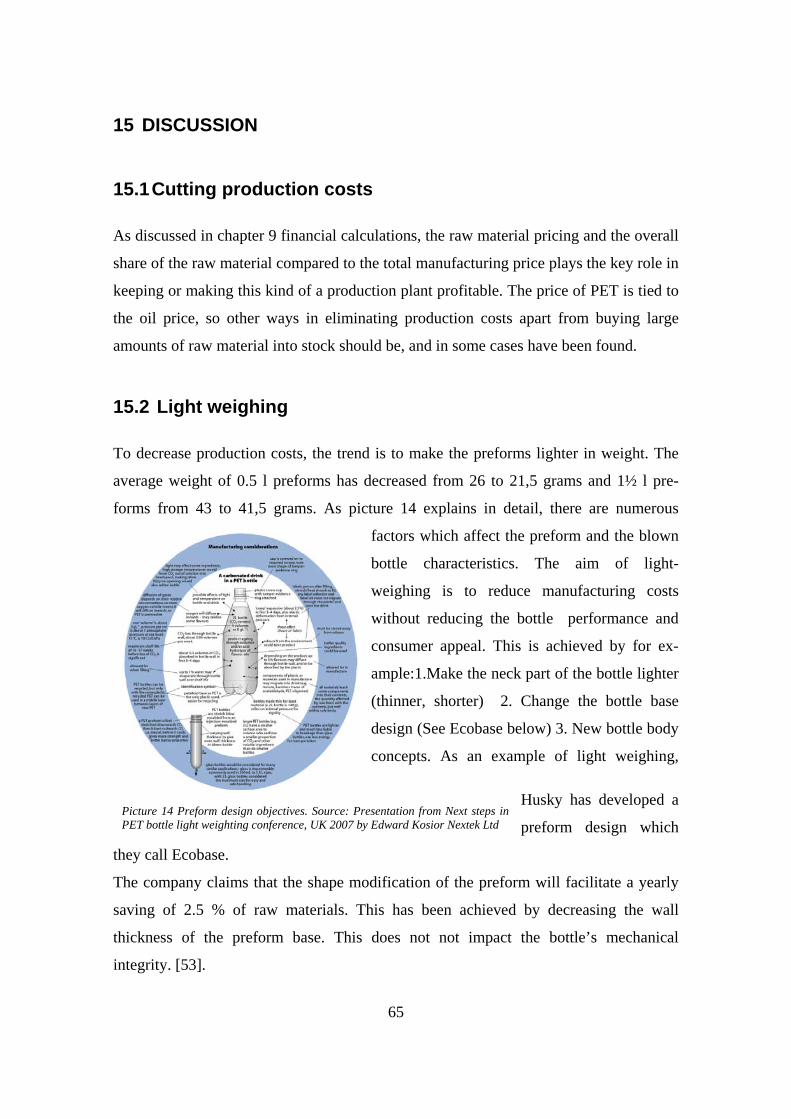
15 DISCUSSION
15.1 Cutting production costs
As discussed in chapter 9 financial calculations, the raw material pricing and the overall
share of the raw material compared to the total manufacturing price plays the key role in
keeping or making this kind of a production plant profitable. The price of PET is tied to
the oil price, so other ways in eliminating production costs apart from buying large
amounts of raw material into stock should be, and in some cases have been found.
15.2 Light weighing
To decrease production costs, the trend is to make the preforms lighter in weight. The
average weight of 0.5 l preforms has decreased from 26 to 21,5 grams and 1½ l pre-
forms from 43 to 41,5 grams. As picture 14 explains in detail, there are numerous
factors which affect the preform and the blown
bottle characteristics. The aim of light-
weighing is to reduce manufacturing costs
without reducing the bottle performance and
consumer appeal. This is achieved by for ex-
ample:1.Make the neck part of the bottle lighter
(thinner, shorter) 2. Change the bottle base
design (See Ecobase below) 3. New bottle body
concepts. As an example of light weighing,
Husky has developed a
preform design which
they call Ecobase.
The company claims that the shape modification of the preform will facilitate a yearly
saving of 2.5 % of raw materials. This has been achieved by decreasing the wall
thickness of the preform base. This does not not impact the bottle’s mechanical
integrity. [53].
Picture 14 Preform design objectives. Source: Presentation from Next steps in PET bottle light weighting conference, UK 2007 by Edward Kosior Nextek Ltd
65

Picture 15 Ecobase preform on the left. Potential weight savings and case study application on the right side. Picture sources HYPET Preform system brochure
15.3 RPET
RPET or rPET is the abbreviation for recycled PET. See figure 25 below on how it is
manufactured. In addition to pellets which are used for making bottle preforms, other
end-products such as fibers, films and other packaging products are made. Enviromen-
tal activists together with governments and brand own-
ers such as Coca Cola have created a pressure for raw
material producers to manufacture rPET and in-crease
their efforts into existing and new and improved recy-
cling technologies. Surprisingly enough, the good quali-
ty of the rPET and increased demand in China, the
Americas and Europe has increased the material price
(1400 €/ton) [55] close to virgin PET (1500 €/ton) [56].
In addition to decreasing the CO2 emission footprint, the re-use of for PET material via
recycling helps save the environment from littering. At the present, the largest problems
with using RPET for preform manufacture, is its high price and lack of availability.
Another big problem are the possible impurities and material defects that can exist in
the flake material or pellets used for manufacturing preforms. Some producers of the
RPET raw material don’t sort the raw material according to the materials crystallinity,
or the container-type, for example by not separating washing liquid containers from for
example food stuff containers or beverage bottles, thus making a possible that the pre-
Figure 27 Flow chart on RPET manufacturing process. Source: http://www.bepet.com/article-on-recycling.htm
66

form and the blown bottle will appear as smeared or it is actually contaminated from
other chemicals used for producing the containers.
Picture 16 Contaminated RPET preform source: Large scale demonstration of the viability of Recycled PET (rPET) in Retail Packaging Coca-Cola Enterprises Ltd 2006
15.4 Buffer stocking of raw materials
To be able to maintain operations at a profitable level, raw materials should be bought
for a ½ -1 year time period in advance if the raw material price decreases considerably.
A dry atmosphere is vital for PET or almost any plastic granules and a constant state of
temperature in the warehouse facilities are necessary. The factory estate is so large, that
the top (3rd) or second floor could be kept as plain warehouse for the raw materials. This
would also make it easier to maintain a constant temperature and humidity.
There are other plastics companies in the area and the
unnecessary 2nd and 3rd floor space could be used as an
storage room facility or wholesales unit for local manu-
facturers in need of for example PET granules. The
building is constructed in such a manner that a constant
temperature and low humidity level should be easy to
sustain. To improve the warehousing facilities, heating
using renewable energy such as solar panels or a heat pump could be used.
Picture 17 Location of companies/factories making plastic products in the vicinity of the factory. Picture source: Fonecta finder search.
67

REFERENCES
1) Matti Kankare: Kiinalaiset ostavat Perloksen. [www] Published 13.8.2007,
Accessed 4th February 2011. http://www.talouselama.fi/uutiset/article166855.ece
5) Wikipedia: Preform [www] Last edited 18th August 2010. Accessed 20th
December 2010 http://en.wikipedia.org/wiki/Preform
6) David P. Steen and Philip R. Ashurst: Carbonated Soft Drinks: Formulation and
Mnufacture Blackwell publishing 2006
7) Patuto, Joseph, RMIT University Investigation of recycled PET and its
application for blow moulded containers requiring thermal stability at elevated
temperatures 2007 [pdf] Accessed 22nd December 2010
http://researchbank.rmit.edu.au/view/rmit:6770
8) Preforms/PET-bottles: [www] Created 2010, Accessed 21st December 2010
http://www.motan-colortronic.com/us/solutions/injectionmoulding/preformspet-
bottles.html
9) David E. Henton, Patrick Gruber, Jim Lunt, and Jed Randall: Polylactic Acid
Technology [pdf] Created 11th February 2005. Accessed 22nd December 2010
http://sharepdf.net/view/15880/polylactic-acid-technology
10) PET-Polyethylene Terephthalate, Production of Drink Bottles: [www] Accessed
20th December 2010 http://www.wildflavors.com/?page_ID=D7E591BC-C908-
43FD-DE8A094CE7E401A6
11) Paul Fletcher, Suman Kunwar, Kamal Raj Sharma Banjade: Specialty plastics
report on Polylactic acid & Polyamide, [pdf] Arcada 14.10.2009, Accessed 20th
December 2010
12) Has Solegear found the Holy Grail of bio-plastics? [www] Created 16th
November 2010 Accessed 20th December 2010
http://www.globe-net.com/articles/2010/november/16/has-solegear-found-the-
holy-grail-of-bio-plastics.aspx?sub=11
13) Wild S, Roglic G, Green A, Sicree R, King H (May 2004). "Global prevalence
of diabetes: estimates for 2000 and projections for 2030". Diabetes Care 27 (5):
1047–53. doi:10.2337/diacare.27.5.1047. PMID 15111519. [www] Accessed
4th February 2011 http://www.ncbi.nlm.nih.gov/pubmed/15111519
68
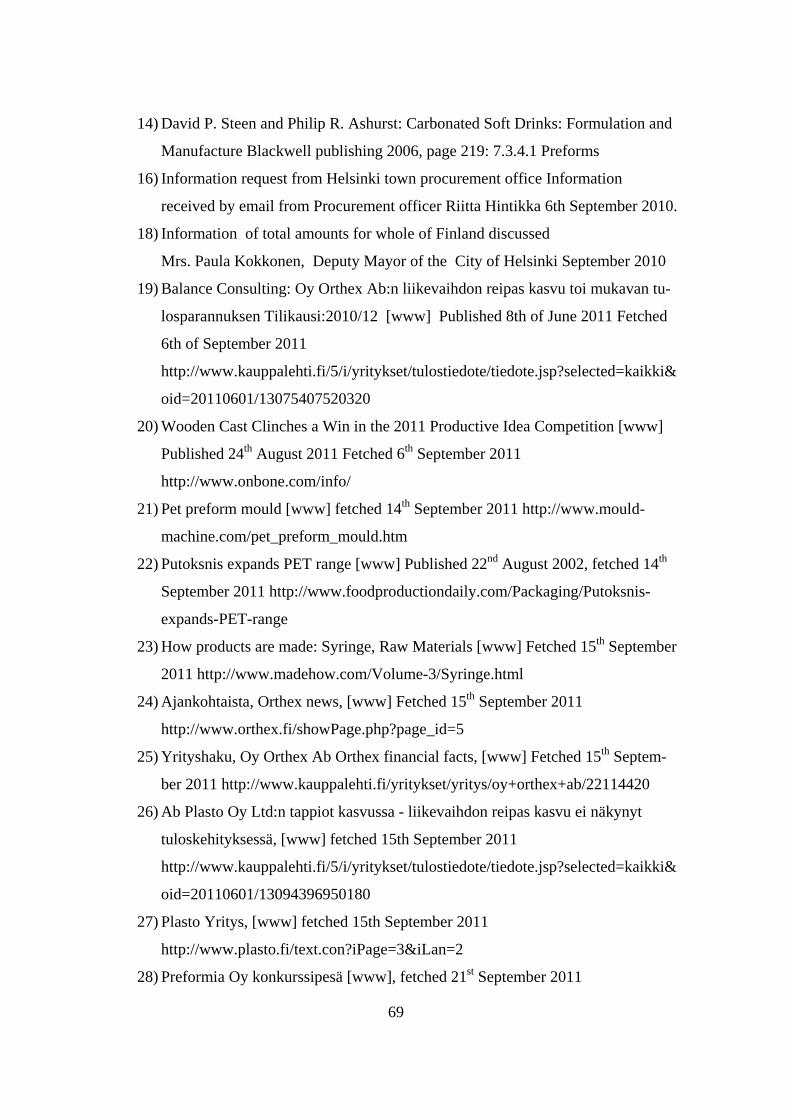
14) David P. Steen and Philip R. Ashurst: Carbonated Soft Drinks: Formulation and
Manufacture Blackwell publishing 2006, page 219: 7.3.4.1 Preforms
16) Information request from Helsinki town procurement office Information
received by email from Procurement officer Riitta Hintikka 6th September 2010.
18) Information of total amounts for whole of Finland discussed
Mrs. Paula Kokkonen, Deputy Mayor of the City of Helsinki September 2010
19) Balance Consulting: Oy Orthex Ab:n liikevaihdon reipas kasvu toi mukavan tu-
losparannuksen Tilikausi:2010/12 [www] Published 8th of June 2011 Fetched
6th of September 2011
http://www.kauppalehti.fi/5/i/yritykset/tulostiedote/tiedote.jsp?selected=kaikki&
oid=20110601/13075407520320
20) Wooden Cast Clinches a Win in the 2011 Productive Idea Competition [www]
Published 24th August 2011 Fetched 6th September 2011
http://www.onbone.com/info/
21) Pet preform mould [www] fetched 14th September 2011 http://www.mould-
machine.com/pet_preform_mould.htm
22) Putoksnis expands PET range [www] Published 22nd August 2002, fetched 14th
September 2011 http://www.foodproductiondaily.com/Packaging/Putoksnis-
expands-PET-range
23) How products are made: Syringe, Raw Materials [www] Fetched 15th September
2011 http://www.madehow.com/Volume-3/Syringe.html
24) Ajankohtaista, Orthex news, [www] Fetched 15th September 2011
http://www.orthex.fi/showPage.php?page_id=5
25) Yrityshaku, Oy Orthex Ab Orthex financial facts, [www] Fetched 15th Septem-
ber 2011 http://www.kauppalehti.fi/yritykset/yritys/oy+orthex+ab/22114420
26) Ab Plasto Oy Ltd:n tappiot kasvussa - liikevaihdon reipas kasvu ei näkynyt
tuloskehityksessä, [www] fetched 15th September 2011
http://www.kauppalehti.fi/5/i/yritykset/tulostiedote/tiedote.jsp?selected=kaikki&
oid=20110601/13094396950180
27) Plasto Yritys, [www] fetched 15th September 2011
http://www.plasto.fi/text.con?iPage=3&iLan=2
28) Preformia Oy konkurssipesä [www], fetched 21st September 2011
69

http://www.ytj.fi/yritystiedot.aspx?yavain=2334474&kielikoodi=1&tarkiste=ED
EE1E241BE9D0A9A92A67BE77D9840D2B6F37A2&path=1547;1631;1678
29) TEM/TSA Pay subsidy in 2009 [pdf] fetched 22nd October 2010, published 23rd
December 2008 www.mol.fi/mol/en/99.../tme0014eteksti.pdf
30) WORKING HOURS ACT (605/1996) [pdf] Chapter 3. Regular working hours
Section 6. General provision, fetched 23rd September 2011
http://www.finlex.fi/pdf/saadkaan/E9960605.PDF
32) Nordicnet: Plastex ab, [www] fetched 10th October 2011
http://www.nordicnet.fi/yritykset/Plastex-Ab-Oy/72877/
33) Pyry Lapintie Hs.fi: [www] Lasisia alkoholipulloja korvataan muovipulloilla
published 18.5.2011, fetched 10th October 2011
http://www.hs.fi/kotimaa/artikkeli/Lasisia+alkoholipulloja+korvataan+muovipul
loilla/1135266228046
34) STT: Hämeen Lanka lopettaa Padasjoella [www] published 13.3.2007, fetched
4t 2011 http://www.taloussanomat.fi/perusteollisuus/2007/03/13/hameen-lanka-
lopettaa-padasjoella/20076327/12
35) Ymparisto.fi: Padasjokelaiselle Hämeen Lanka Oy:lle ympäristölupa [www]
fetched 4th oct 2011 , published 16th June 2004
http://www.ymparisto.fi/default.asp?contentid=83584&lan=fi
36) YMPÄRISTÖLUPAPÄÄTÖS Hämeen Lanka [pdf] fetched 4th oct 2011, pub-
lished 8th June 2004
http://www.ymparisto.fi/download.asp?contentid=18824&lan=fi
37) Email from Production assistant Maija Vainio from Orthex 16th September 2010
38) Wikipedia: Polyethylene terephthalate [www] fetched 5th October 2011 Last
edited 1st October 2011
http://en.wikipedia.org/wiki/Polyethylene_terephthalate#cite_note-GESTIS-2 ??
39) S.L. Belcher; Applied Plastics Engineering Handbook, page 284. Chapter 16.4.2
Stretch Blow Molding fetched 24th of October 2011
42) David P. Steen and Philip R. Ashurst: Carbonated Soft Drinks: Formulation and
Manufacture Blackwell publishing 2006 accessed 25th October 2011 page 196,
7.3.4.2 Bottle blowing
70

44) Globe.net: Has Solegear found the Holy Grail of bio-plastics? [www] fetched 8th
of November 2011. Created November 16, 2010 http://www.globe-
net.com/articles/2010/november/16/has-solegear-found-the-holy-grail-of-bio-
plastics/?sub=15
45) Markus Portman Arcada final thesis Arcada; Polyetyleenitereftalaattiesimuottien
kosteusanalyysi ja kosteuden vaikutus puhallusvalussa. Published February
2010, Accessed from Theseus February 16th 2011
https://publications.theseus.fi/handle/10024/6928
46) Wikipedia: Polylactic acid [www] Published 11th January 2011 fetched 13th
January 2011 http://en.wikipedia.org/wiki/Poly(lactic_acid)#Chemical_and
_physical_properties
47) III Työpalkat: Muovituoteteollisuus ja kemian tuoteteollisuus työehtosopimus
[pdf] fetched 17th January 2012 http://www.finlex.fi/data/tes/stes4184-
TT53Muokemtuo0911.pdf Page 32.
48) http://www.taloussanomat.fi/tyomarkkinat/2010/06/18/1000-ammatin-palkat--
katso-parjaatko-vertailussa/20108646/12 Tuotantotyöntekijä, muovi- ja kemia,
fetched 17th January 2012
49) Tilastokeskuksen PX-Web-tietokannat, [www] Fetched 6th April
2012http://pxweb2.stat.fi/database/statfin/ene/ehi/ehi_fi.asp
51) Päijät-Hämeen kunnat, Työttömyysaste published 27th February 2012 fetched
9th April 2012 http://www.verkkotietokeskus.fi/index.php/tyoemarkkinat/54-
tyoettoemyysaste?layout=default
52) Loppuraportti_julkinen (pdf) received by email from Lecturer in plastics Timo
Malén at Koulutuskeskus Salpaus during August 2010.
53) Electronic offer received from Business Manager Simon Cowlishaw HUSKY
Injection Molding Systems UK Ltd Beverage Packaging UK & Nordic Regions
on the 9th March 2012
54) Husky HyPET Preform system brochure [pdf] fetched 30th January 2012
http://www.husky.ca/EN-US/documentlibrary.aspx?id=4015
55) Debbie Galante Block Plastics Technology Magazine RPET Prices Follow Oil
and Virgin Resin Prices Upwards [www] Published April 2012, fetched 24th
71
April 2012 http://www.ptonline.com/articles/rpet-prices-follow-oil-and-virgin-
resin-prices-upwards
56) Email Price query from Jaakko Iisalo, Sales Manager Telko 16th January 2012
57) How to Calculate Clamping force [www] Published 2006, fetched 29th April
2012 http://mould-technology.blogspot.com/2008/10/how-to-calculate-
clamping-force.html
58) Larry Guin, Professor of Finance, Department of Economics & Finance, Murray
State University [www] fetched 29th april 2012
http://campus.murraystate.edu/academic/faculty/lguin/FIN330/EBIT_EPS.htm
60) Wikipedia: Times interest earned [www] fetched 29th April 2012, Last edited
1st November 2011 http://en.wikipedia.org/wiki/Times_Interest_Earned
61) Tilastokeskuksen PX-Web-tietokannat, Polttonesteiden kuluttajahinnat [www]
last modified 20th March 2012, accessed 31st April 2012
http://pxweb2.stat.fi/Dialog/varval.asp?ma=040_ehi_tau_104_fi&ti=Polttoneste
den+kuluttajahinnat+%28sis%E4lt%E4%E4+alv%3An%29&path=../Database/S
tatFin/ene/ehi/&lang=3&multilang=fi
63) Tyypilliset tuet (linjaukset 2012) [www] accessed September 18th 2012
http://www.tem.fi/?s=3093
64) http://www.mol.fi/mol/fi/01_tyonantajat/06_2rekrytoinnin_tuki/02_palkkatuki/0
1_palkkatukiedellytykset/index.jsp
65) Email received from Kurt H. Jensen, Technical director, Danspin A/S. 16th Oc-
tober 2012
66) J. SCHEIRS Additives for the Modification of Poly(Ethylene Terephthalate) to
Produce Engineering-Grade Polymers [pdf] Published 2003, fetched 12th Octo-
ber 2012
67) Palkkatuki - tukea palkkauskustannuksiin [pdf] Published 27.2.2012, fetched 1st
September 2012
http://www.mol.fi/mol/fi/99_pdf/fi/01_esitteet/palkkatuki_esiteteksti.pdf
72

Appendices
Appendix 1. Site survey report
visit to Padasjoki 5.10.2010
Present on trip
Paul Fletcher final thesis student
Henry Clay Ericsson Thesis supervisor
Tuomas Häme Janitor, Hämeen Lanka
Heikki Jaakkola Director of Padasjoki municipality
Backround
We left for the trip from Ruskeasuo at 11.00 heading towards Padasjoki. The purpose
of the trip was to survey the Hämeen Lanka premises and to conduct a meeting with the
municipal director Mr Jaakkola later on in the afternoon.
Survey of premises
We arrived at the site in good time before the agreed meeting time with Mr Häme , and
surveyed the building from the outside. Several things were discovered immeadetly:
- The building is in good condition from the outside, even the clock was on time
- Warehouse space is large, later on we found out that it was over 2000 m2, a 1/3 of the actual factory space. The warehouse has been built from Siporex and has a tin roof
- The yard is overgrown, no visible communal water pipes
At 13.30 Mr Häme arrived and told us briefly about the history of Hämeen Lanka.
The factory was founded in 1948 by his grandfather to make carpet rags from wool,
which was imported from the United Kingdom and New Zealand. The factory
employed 120 people at its heyday. Hämeen Lanka´s competitor Danspin bought the
factory in 2007, and early during that year production was moved to Estonia. The
73
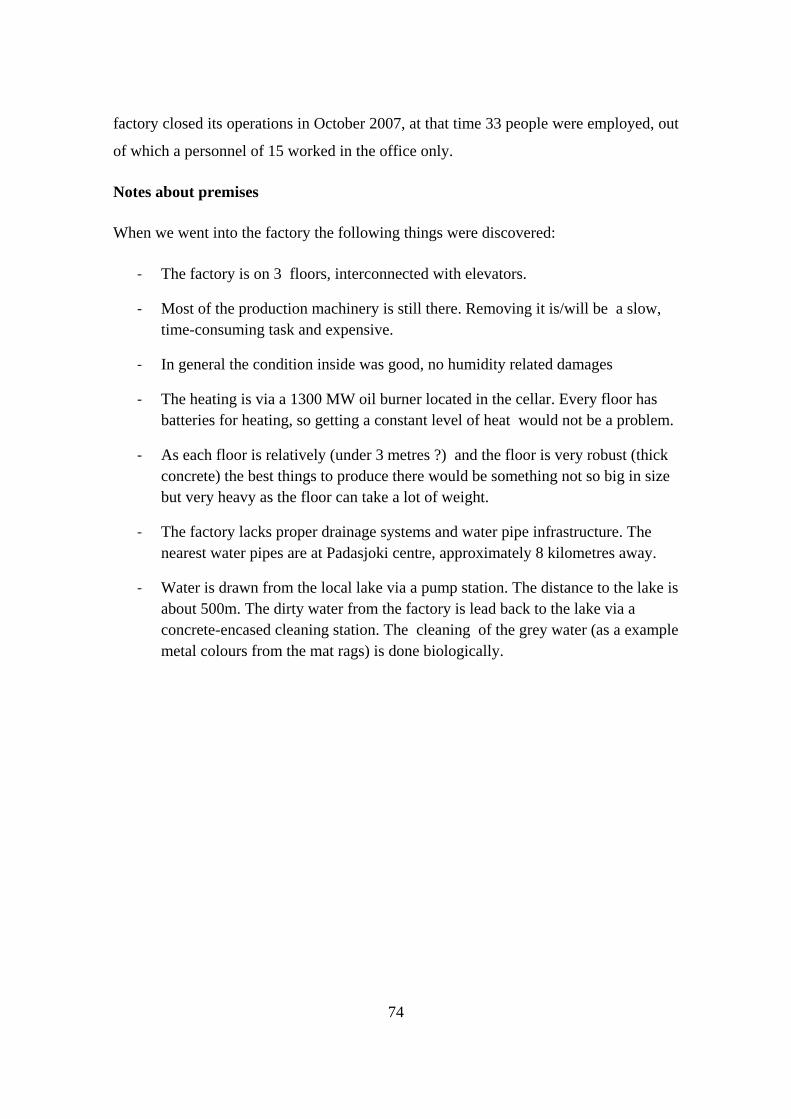
factory closed its operations in October 2007, at that time 33 people were employed, out
of which a personnel of 15 worked in the office only.
Notes about premises
When we went into the factory the following things were discovered:
- The factory is on 3 floors, interconnected with elevators.
- Most of the production machinery is still there. Removing it is/will be a slow, time-consuming task and expensive.
- In general the condition inside was good, no humidity related damages
- The heating is via a 1300 MW oil burner located in the cellar. Every floor has batteries for heating, so getting a constant level of heat would not be a problem.
- As each floor is relatively (under 3 metres ?) and the floor is very robust (thick concrete) the best things to produce there would be something not so big in size but very heavy as the floor can take a lot of weight.
- The factory lacks proper drainage systems and water pipe infrastructure. The nearest water pipes are at Padasjoki centre, approximately 8 kilometres away.
- Water is drawn from the local lake via a pump station. The distance to the lake is about 500m. The dirty water from the factory is lead back to the lake via a concrete-encased cleaning station. The cleaning of the grey water (as a example metal colours from the mat rags) is done biologically.
74
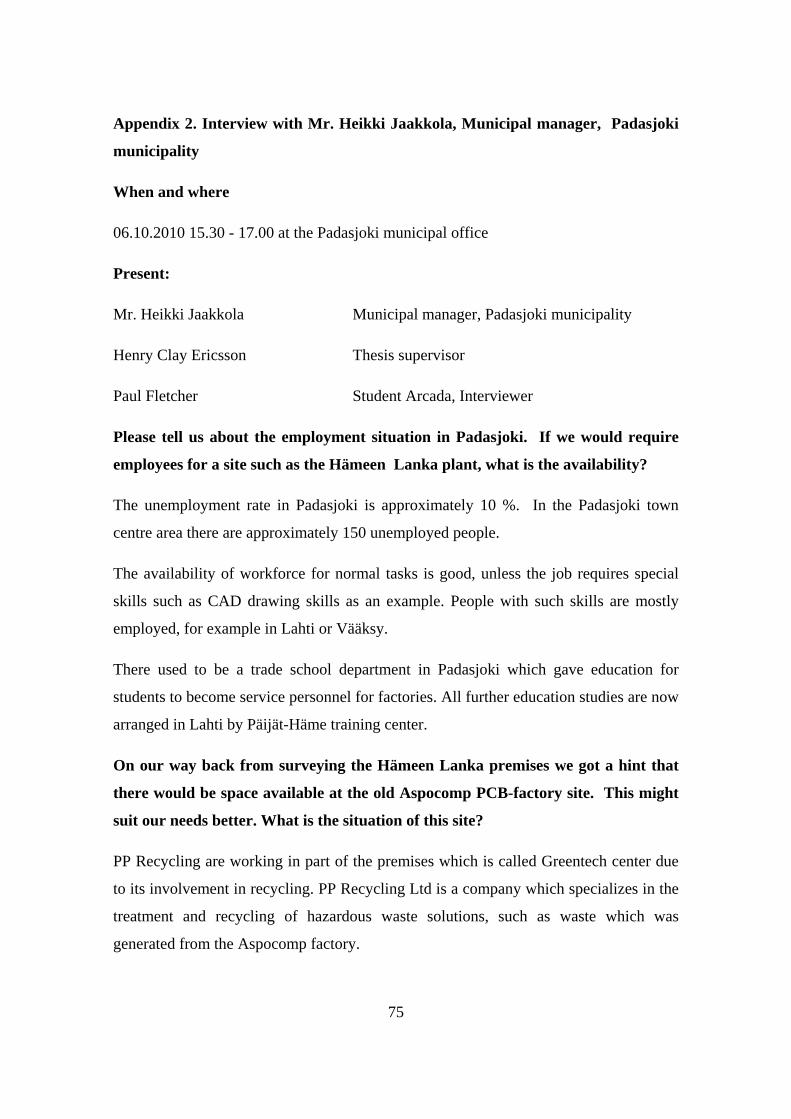
Appendix 2. Interview with Mr. Heikki Jaakkola, Municipal manager, Padasjoki
municipality
When and where
06.10.2010 15.30 - 17.00 at the Padasjoki municipal office
Present:
Mr. Heikki Jaakkola Municipal manager, Padasjoki municipality
Henry Clay Ericsson Thesis supervisor
Paul Fletcher Student Arcada, Interviewer
Please tell us about the employment situation in Padasjoki. If we would require
employees for a site such as the Hämeen Lanka plant, what is the availability?
The unemployment rate in Padasjoki is approximately 10 %. In the Padasjoki town
centre area there are approximately 150 unemployed people.
The availability of workforce for normal tasks is good, unless the job requires special
skills such as CAD drawing skills as an example. People with such skills are mostly
employed, for example in Lahti or Vääksy.
There used to be a trade school department in Padasjoki which gave education for
students to become service personnel for factories. All further education studies are now
arranged in Lahti by Päijät-Häme training center.
On our way back from surveying the Hämeen Lanka premises we got a hint that
there would be space available at the old Aspocomp PCB-factory site. This might
suit our needs better. What is the situation of this site?
PP Recycling are working in part of the premises which is called Greentech center due
to its involvement in recycling. PP Recycling Ltd is a company which specializes in the
treatment and recycling of hazardous waste solutions, such as waste which was
generated from the Aspocomp factory.
75

Now that the Aspocomp plant has closed down, PP Recycling has a problem of
acquiring suitable materials for treatment, having to bring the material over long
distances, making their work less profitable.
At the moment the company is under company reorganization, and we will have to wait
and see if the company will be declared bankrupt or the operations will carry on or not.
The site does have empty space for hire, but situation with PP Recycling has to be
solved first.
Opposite the Greentech center in the premises of Padasmaila, there is also some space
available to be rented. Padasmaila is the manufacturer of the world famous Montreal
ice hockey sticks. The ownership situation in Montreal has also changed; the company
is no longer Finnish. It is owned by the American sports company Warrior.
The biggest problem with the Hämeen Lanka site is the lack of proper sanitation
facilities and water pipes connected to the communal water works. Is there any
kind of plans to improve this situation?
About 5 years ago the municipality made a questionnaire to the people living round the
Kaukela area about improving the water works infrastructure.
The result was that people do not want communal water piping, as almost everyone has
their own wells and water can be drawn from the lakes in the vicinity such as the
Kaukila and Miestämä lakes.
The nearest municipal running water is in Arrakoski, several kilometers away from the
Hämeen Lanka Premises
If needed there is possibility to extend the infrastructure. During the last few years the
municipality has drawn water pipes in the south direction of Padasjoki, into the
Nyystölä and Maakeski direction.
76

If new jobs would be created into the Hämeen Lanka premises, how could the municipality help the start-up of the company? The municipality has a fund (Padasjoen kehitysrahasto Oy) from where risk- or
finalization funding can be granted by using convertible bonds. Such funding with a 10-
year payback time has been offered to Montreal and Aspcomp.
The municipal board will decide if the project is profitable and offer funding
accordingly.
Also the municipality has space for rent at the industrial estate. The price is
advantageous, normally it is around 5 €/m2 for special cases this can also be negotiated
to be lower, down to 3 €/m2.
Considering the town planning aspect, if the company would become operational on the
municipal industrial estate, and the town planning would require changes, these can be
negotiable.
Start-up support for new companies is supported mainly by LAKES, which is located in
The Lahti science and industrial park (Lahti Regional Development Company). The
Padasjoki contact person there is Mr. Tuomo Jalkanen)
Did the current owner of Hämeen Lanka contact the municipality for co-operation
of keeping the site operational before its close-down? What kinds of matters were
discussed and what happened?
Of course we had meetings about the possibilities of the factory carrying on their
operations. The operations at the site where decreased at the beginning of 2007, when
Danspin moved part of the production and machinery to Estonia.
The negotiations related to the closure were not fruitful, as the demands made by
Danspin exceeded what the municipality could offer. Negotiations were mainly held
about improving the drainage and supporting the factory operations financially. The
results of the negotiations were not positive, and the factory was closed down in
October 2007.
77

What kinds of future improvements have been planned/are being carried out in
the municipality?
The broadband connection cabling is being upgraded to optical fiber at the moment by
Sonera. Optical fiber will improve the broadband internet connection speeds up to 100
Mb/second at least in the center of Padasjoki town center.
On the municipal side extensive research into renewable natural resources is in the long-
term environmental planning. At the moment VAPO has a peat-burning plant on the
local industrial estate, and wind power plants are being built in the vicinity of the
Padasjoki Marina.
Acknowledgements
The interview finished at 17.00. I wish to express my thanks to Mr Jaakkola for his time
and Mr Henry Clay Ericsson for his time, driving and discussions.
78

Appendix 4 Questionnaire regarding preform procurements in Finland
T H E Q U E S T I O N S
1. Would your company be willing to buy/collaborate on preform issues
from a production facility in Finland ?
Yes/No/Maybe (If your answer is of a negative manner, some kind of
short description would be appreaciated.
2. Would your company possibly buy their preforms from a finnish factory
if their prices would be a) 2-3 % b) 5 % c) 7-8 %
higher than your present suppliers such as Putoksnis, Rexam etc This price would
include the same terms as offered by your present suppliers such as Putoksnis etc.
The benefits of a local supplier would be of course local production smaller
transportation costs, shorter lead- and delivery times, a smaller carbon footprint and
even a possible buffer warehouse at the factory. The imaginary factory would be located
X km from your X factory.
3. I have spent quite a lot of time on ground research concering possible manufacturers
of preforms in Finland. As far as I know there are no suppliers of these in Finland hence
Preformia which has been closed down and Pernod-Ricard Finland/Graham packaging
Company Oy (ExRyttylän Muovi) Graham Packaging, which makes packaging only for
Altia . If any suppliers come to you mind, please let me know.
4. Do you at your company have such a vision that a preform production
plant in Finland could exist, which would be jointly-owned by for example the five
largest beverage manufacturers in Finland ? Each manufacturer would own a share, and
even some research work could be carried out together ? For example the production
plant could cover for the manufacture of bulk-preforms. It seems to me there are some
preform/blown bottle types which are uniform undependant of the supplier or cork
thread. Similar co-operation already exists in the form of PALPA (
http://www.palpa.fi/beverage-containers) 79

If the answer to this question is negative, a short explanation why sowould be very
much appreciated.
Thank you for for your possible feeback in advance.
80