four decades of economic development of bangladesh… · four decades of economic development of...
TRANSCRIPT

Journal of the Asiatic Society of Bangladesh (Hum.), Vol. 58(2), 2013, pp. 335-362
FOUR DECADES OF ECONOMIC DEVELOPMENT OF BANGLADESH: AN ASSESSMENT*
Mohammed Helal** and Md. Amzad Hossain***
1. Introduction There has been a huge economic progress in Bangladesh since its independence. None can dare to call it a “bottomless basket” anymore. Rather many countries in the world borrow from this basket. Nonetheless, it could have achieved much more had it utilized its labor force efficiently. Lack of energy infrastructure and skill in our labor force may hold us flourishing at the pace we desire. To accelerate economic growth and to sustain our economic progress, we need to control our population growth, add skill to our labor force, conserve cultivable land, and mitigate environmental pollution. To ensure improvements in these counts, good governance is essential. Bangladesh has become independent in 1971 from Pakistan at the expense of 3 million lives in a bloody war of liberation. The war almost completely destroyed the physical infrastructure of the country. Bangladesh is endowed with limited mineral resources, if considered in the context of her large population. Bangladesh had in essence two endowments- land and labor. Capitalizing these two endowments Bangladesh has come a long way since its birth when U.S. Secretary of State, Henry Kissinger had disparagingly called it a “bottomless basket”. Bangladesh is now an emerging economy in South Asia, with her annual exports of some $25 billion mainly from Knitwear and garment products, remittances equivalent to $14 billion in 2012 and a gross domestic product (GDP) growth of over 6.0 percent despite its confrontational politics and global economic slowdown over the last few years.1 The outside world has to borrow from Bangladesh as reflected by the fact that export earning and remittance earning together account for more than one-third of her GDP. Our dependency on foreign aid for the development project has reduced from 88% in 1972 to * The paper was presented at the National Seminar on “Bangladesh at 40:
Achievements and Challenges”, organized by the Asiatic Society of Bangladesh in Dhaka during 14-15 March 2013
** Assistant Professor, Department of Economics, University of Dhaka *** Lecturer, Department of Economics, University of Dhaka 1 Bangladesh Bank, “Monthly Economic Trends: March 2013”, Vol. XXXVIII, No. 3,
2013.

336 Helal and Hossain
only 2% in 2010.2 PPP adjusted per capita GDP stood at 1909 US dollar in 2011. The International Monetary Fund (IMF) has ranked Bangladesh as the 43rd largest economy in the world in PPP terms. Goldman Sachs has included Bangladesh among the next eleven (N-11) emerging economies of the 21st century after Brazil, Russia, India and China.3 Thus, the country has made a commendable progress since independence.
However, it could have done much better if we had political stability and required infrastructure to foster economic growth. It could have registered growth of 8% or more, like neighboring India, had it not lacked good governance. Bangladesh is one of the leading manpower exporting countries in the world. Most of the Bangladeshi workers employed overseas are unskilled and they are engaged in low-paid derogatory works. We could have raised our overseas earnings substantially with an adequate investment on human resource development. Bangladesh could not realize the benefits she was expected to achieve from the huge growth in her young labor force which is known as “demographic dividend”. This failure was due to her inability to absorb and employ the extra workers productively.
This paper aims at exploring what the country has achieved over the last forty years since independence and what she missed. The paper uses data from different secondary sources such as World Bank, United Nations, Bangladesh bank, Bangladesh Bureau of Statistics and so on. The organization of the paper is as follows: First, introduction; second, highlights of some of the major achievements in the economy; third, citation of some progress in social development indicators those likely to have fostered the growth of the macroeconomic variables and reduced poverty and inequality; fourth, identification of some unexplored potential; fifth, raising of challenges in regard to realization of the potential; Finally, conclusion.
2. Achievement in major macroeconomic fronts
Bangladesh is a country with an area of 147,570 square kilometers accommodating a population over 160 million. She is the 8th4 largest in the 2 BBS, “Statistical Yearbook of Bangladesh 2010”, Dhaka, Bangladesh Bureau of
Statistics. Statistics Division, Ministry of Planning, Government of the People's Republic of Bangladesh.
3 http://www.dailysun.com/index.php?view=details&archiev=yes&arch_date=26-03-2012&type=daily-sun news&pub_no=96&menu_id=43&news_type_id=1&news_id=18931
4 http://en.wikipedia.org/wiki/List_of_countries_by_population [accessed February 24,2013]

Four Decades of Economic Development of Bangladesh 337
world in terms of population whereas it ranks 94th 5 in terms of the size of the area. The population density of over 1000 people per square kilometer implies an extreme pressure on our scarce land in Bangladesh. The burgeoning population is creating further pressure on the land. Besides, Bangladesh is not endowed with a huge amount of natural resources to supplement the land scarcity. The main natural resource of Bangladesh is natural gas. Even in terms of proven gas reserve, Bangladesh ranks 47th in the world.6 The perception that “Bangladesh is floating on gas” has been proved wrong in the recent decades. Different prediction suggests that unmet demand for gas may kick in 2020 and the gas reserve of Bangladesh may exhaust by 2025/30. Table 1 shows the population density and reserve of natural gas and petroleum oil per capita in Bangladesh, Pakistan, India and China. Table 1 reveals the scarcity of land and natural resources compared to some neighboring states.
Table 1: Per capita natural gas/oil reserve and population density
Countries Natural Gas
reserve per capita (cubic meter)
Oil reserve per capita
(in barrels)
Population density
(per square km)
Bangladesh 1281.16 0.18 1034 India 888.29 0.26 382 Pakistan 4601.49 49.53 229 China 2289.44 15.03 141
Obviously, Bangladesh is abundant in labor. The success story of Bangladesh since independence can therefore be attributed to the labor force. Relatively large population as perceived before in Bangladesh, is no longer a burden. Bangladesh is now one of the biggest exporters of manpower in the world. Capitalizing on its abundant labor force Bangladesh has made a considerable progress in economic growth and development.
2.1 Maintaining an outstanding economic growth rate
There has been a radical change in GDP since independence. GDP per capita increased from US dollar 200 in the 1970s to around US dollar 1900 in 2011 in
5 http://en.wikipedia.org/wiki/List_of_countries_and_dependencies_by_area [accessed
February 24,2013] 6 http://en.wikipedia.org/wiki/List_of_countries_by_natural_gas_proven_reserves
[accessed February 24,2013]

338 Helal and Hossain
-50
510
1980 1990 2000 2010year
Least developed countries BangladeshSouth Asian countries world
02
46
8G
row
th r
ate
(%)
1980 1990 2000 2010year
Bangladesh Pakistan
purchasing power parity (PPP) terms. This has been possible due to the sharp increase in GDP over the period. Average GDP growth rate was 2-3 percent in the 1970s which rose to around 3.5 percent during the 1980s. Along with maintaining economic stabilization with a significantly reduced and declining dependence on foreign aid, the economy appeared to begin a transition from stabilization to growth in the 1990s.7 GDP growth rate accelerated to 4.5 per cent in the first half of the 1990s and to 5 per cent in the second half of that decade. It hovered around 6 percent over the first decade of 21st century. Since our population growth rate was below 1.5 percent per annum during this decade, over a 4.5 percent growth in per capita GDP was very commendable. Bangladesh is now progressing towards attending a growth rate of 7-8 percent per annum which will graduate Bangladesh towards a middle income country very soon.
Figure 1: Trend of GDP Growth rate
Source: World Bank Dataset.
Bangladesh has performed reasonably well in terms of economic growth in comparison with other countries. The GDP growth rate of Bangladesh crossed that of world average in the last half of 1980s and remained so since then (Figure 1). Although the growth of South Asian countries remained higher for most of the period, the same was subject to much less fluctuation in Bangladesh. Lately, the growth in South Asia is declining but Bangladesh retains an upward growth trend. The GDP growth of Bangladesh has also been more stable than the average growth rate of the least developed countries.
7 W. Mahmud, “Bangladesh: Development Outcomes and Challenges in the Context
of Globalization”, Paper presented at the conference on The Future of Globalization: Explorations in Light of Recent Turbulence co-sponsored by the Yale Center for the Study of Globalization and the World Bank, October 10-11, 2003, Yale University.

Four Decades of Economic Development of Bangladesh 339
Interestingly, Bangladesh is also performing well in comparison to Pakistan from which it achieved independence in 1971. Just after the independence Pakistan achieved a much higher growth rate than that of Bangladesh. However things started to change in the 1990s when the growth rate of Bangladesh exceeded that of Pakistan. Since then the growth rate of Bangladesh has been continually higher than that of Pakistan except for a brief stint from 2004 to 2006. More importantly, the growth rate of Bangladesh economy has less volatility than that of Pakistan. 2.2 Achieving Self-sufficiency in food grain production In Bangladesh every year almost 0.20 million people are adding to the total population whereas the estimated annual reduction of agricultural land is about 0.08 million hectares due to constructions of houses, offices, roads, mills, factories etc. The amount of cultivable land decreased from around 9 million hectares in the 1970s to around 7.6 million hectare in 2009 (FAO, 2012). On the other hand, population has almost doubled since independence rising to 150 million in 2012 from 67 million in 1971. Accordingly per capita arable land declined from .13 hectare to 0.05 hectare in 2012 raising concern over food security. Despite the pressure on limited amount of arable land, the recent trend in food grain production has been quite satisfactory. Since the rice production has increased at a higher rate than the rate of population growth during the last decade, and that there are both public and private imports each year though at a limited amount, the daily per capita food availability of food grains in Bangladesh has reached the standard food grain requirement or target consumption level of 454 gram in 1997-98 and it is always above the threshold level afterwards. Fig. 2: Trend in arable land, food grain availability & requirement (per capita)
Source: World Bank and authors’ estimation from BBS 2010.
340 Helal and Hossain
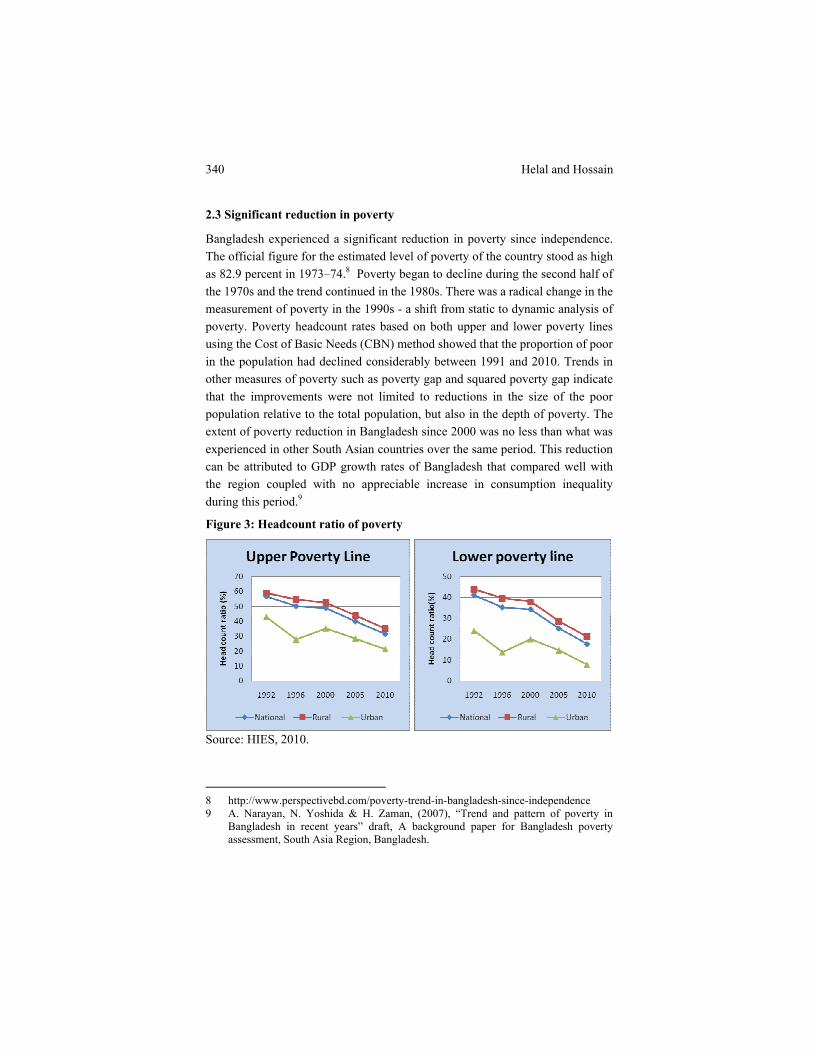
2.3 Significant reduction in poverty
Bangladesh experienced a significant reduction in poverty since independence. The official figure for the estimated level of poverty of the country stood as high as 82.9 percent in 1973–74.8 Poverty began to decline during the second half of the 1970s and the trend continued in the 1980s. There was a radical change in the measurement of poverty in the 1990s - a shift from static to dynamic analysis of poverty. Poverty headcount rates based on both upper and lower poverty lines using the Cost of Basic Needs (CBN) method showed that the proportion of poor in the population had declined considerably between 1991 and 2010. Trends in other measures of poverty such as poverty gap and squared poverty gap indicate that the improvements were not limited to reductions in the size of the poor population relative to the total population, but also in the depth of poverty. The extent of poverty reduction in Bangladesh since 2000 was no less than what was experienced in other South Asian countries over the same period. This reduction can be attributed to GDP growth rates of Bangladesh that compared well with the region coupled with no appreciable increase in consumption inequality during this period.9
Figure 3: Headcount ratio of poverty
Source: HIES, 2010.
8 http://www.perspectivebd.com/poverty-trend-in-bangladesh-since-independence 9 A. Narayan, N. Yoshida & H. Zaman, (2007), “Trend and pattern of poverty in
Bangladesh in recent years” draft, A background paper for Bangladesh poverty assessment, South Asia Region, Bangladesh.

Four Decades of Economic Development of Bangladesh 341
The proportion of population living below the upper poverty line declined by 44 percent between 1991 and 2010. The decline in headcount ratio (HCR), the percentage value of poverty incidence, was rapid since 2000. HCR fell by 17 percent between 2000 and 2005 and a further 21 percent between 2005 and 2010. The proportion of population below the lower poverty line, the threshold for extreme poverty, declined by 57 percent between 1991 and 2010. The number of extreme poor (per capita consumption below the lower poverty line) came down to 17.6 percent of the population in 2010 from 41.1 percent in 1991/92. Altogether, Bangladesh is well on track on achieving the goal of reducing poverty below 29 percent by 2015 (MDG 1A).
Figure 4: Depth of poverty
Source: World Bank dataset.
The depth and severity of poverty has been measured by poverty gap and squared poverty gap, respectively. The HCR of poverty gives only the percentage value of poverty incidence, but it does not measure the distance of the poor households from the poverty line. Figure 4 shows poverty gap by two different measures. The figure also suggests that depth of poverty decreased significantly from that of 1980’s. Table (2) reveals that both depth and severity of poverty (with respect to the upper poverty line) have declined significantly since 1991. The substantial fall in poverty gap and squared poverty gap indicates that consumption of those below the (upper) poverty line improved considerably. A fall in the poverty gap measure indicates that the average “distance” of the poor from the poverty line has fallen whereas a decline in squared poverty gap

342 Helal and Hossain
indicates that the distribution of consumption among the poor has become more equitable.10
Table 2: Depth and severity of poverty
Poverty gap Squared Poverty gap Year
National Urban Rural National Urban Rural 2000 12.8 9 13.7 4.6 3.3 4.9 2005 9 6.5 9.8 2.9 2.1 3.1
Source: HIES report 2010.
2.4 Restraining the increase in inequality Although there has been a tendency of inequality to rise after independence, the inequality has stagnated after 2000, in fact declining. For this reason absolute poverty and depth and severity of poverty declined significantly since 2000. Table 3 shows the estimates of consumption inequality and income inequality for the HIES years. Consumption GINI increased from 0.26 in 1983/84 to a peak of 0.33 in 1996. It then stagnated and fell to 0.32 in 2010. On the other hand, income GINI rose to a peak of 0.47 in 2005 and then declined to 0.46 in 2010.
Table 3: Consumption and income GINI
Year Consumption GINI Income GINI
1984 0.26 0.37
1986 0.27 0.37
1989 0.29 0.38
1992 0.28 0.39
1996 0.33 0.44
2000 0.33 0.45
2005 0.33 0.47
2010 0.32 0.46
Source: World Bank data.
10 Narayan, A., Yoshida, N. & Zaman, H. (2007), “Trend and pattern of poverty in
Bangladesh in recent years” draft, A background paper for Bangladesh poverty assessment, South Asia Region, Bangladesh
Four Decades of Economic Development of Bangladesh 343
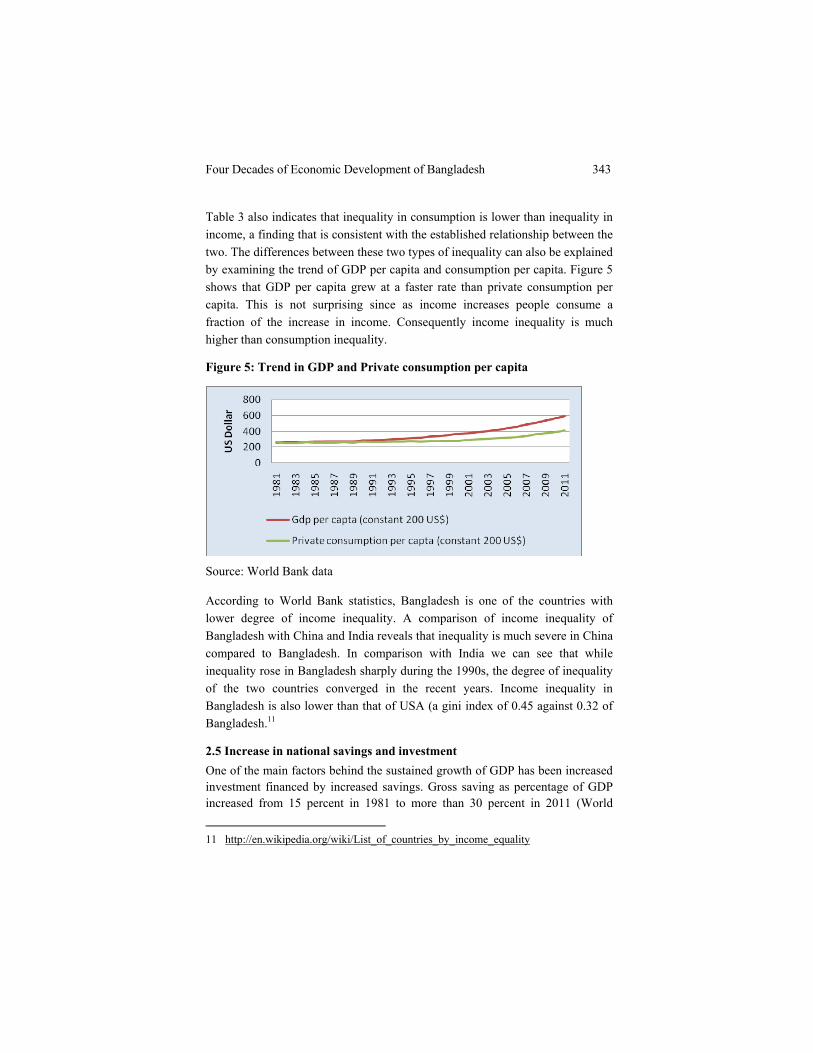
Table 3 also indicates that inequality in consumption is lower than inequality in income, a finding that is consistent with the established relationship between the two. The differences between these two types of inequality can also be explained by examining the trend of GDP per capita and consumption per capita. Figure 5 shows that GDP per capita grew at a faster rate than private consumption per capita. This is not surprising since as income increases people consume a fraction of the increase in income. Consequently income inequality is much higher than consumption inequality.
Figure 5: Trend in GDP and Private consumption per capita
Source: World Bank data
According to World Bank statistics, Bangladesh is one of the countries with lower degree of income inequality. A comparison of income inequality of Bangladesh with China and India reveals that inequality is much severe in China compared to Bangladesh. In comparison with India we can see that while inequality rose in Bangladesh sharply during the 1990s, the degree of inequality of the two countries converged in the recent years. Income inequality in Bangladesh is also lower than that of USA (a gini index of 0.45 against 0.32 of Bangladesh.11
2.5 Increase in national savings and investment One of the main factors behind the sustained growth of GDP has been increased investment financed by increased savings. Gross saving as percentage of GDP increased from 15 percent in 1981 to more than 30 percent in 2011 (World
11 http://en.wikipedia.org/wiki/List_of_countries_by_income_equality

344 Helal and Hossain
Bank). Accordingly, investment increased from 17 percent of GDP in 1981 to around 26 percent of GDP In 2011. The increased investment increased the share of investment value added to GDP.
Figure 6: Trend of inequality in different countries
2530
3540
45GI
NI in
dex
1980 1990 2000 2010year
Bangladesh ChinaIndia
Source: World Bank data
Figure 7: Saving and Investment as a percentage of GDP
Source: World Bank
3. Factors behind the reduction of poverty and inequality Analysis thus far indicates that there has been a great improvement in the living standards of the poorer section of the population over the last 42 years as revealed by a substantial decline in the depth and severity of poverty. This is also reflected in the growth of per capita income of the bottom quintile groups. Thus

Four Decades of Economic Development of Bangladesh 345
while it is evident that income inequality rose during this period, the per capita income of the bottom quintile groups increased which resulted in a decline in depth and severity of poverty (Figure 8). The income of the bottom 20 percent increased twofold, from around 109 US dollar in 1984 to around 327 US dollar in 2010.
Figure 8: Trend in per capita income by income quintile
Source: Calculated from World Bank data
The income inequality, as shown by Gini Index, has also been stagnant since 2000 with consumption Gini being around 0.33 and income gini being around 0.46 .This is due to the fact that the per capita income of the bottom quintiles have increased more compared to that of the top 20 percent of people (Table 3). The per capita income of the bottom 20 percent of the population increased by around 66 percent over the period stretching from 2000 to 2010 while the income of the top 20 percent of the population increased by 60 percent during the same period.
Table 3: Growth in per capita income of different income quintiles
Year 2000 2010 % increase
First quintile 162.87 327.79 66
Second quintile 225.69 456.61 68
Third quintile 295.28 593.19 68
Fourth quintile 396.28 785.13 67
Fifth quintile 800.64 1528.56 60
346 Helal and Hossain
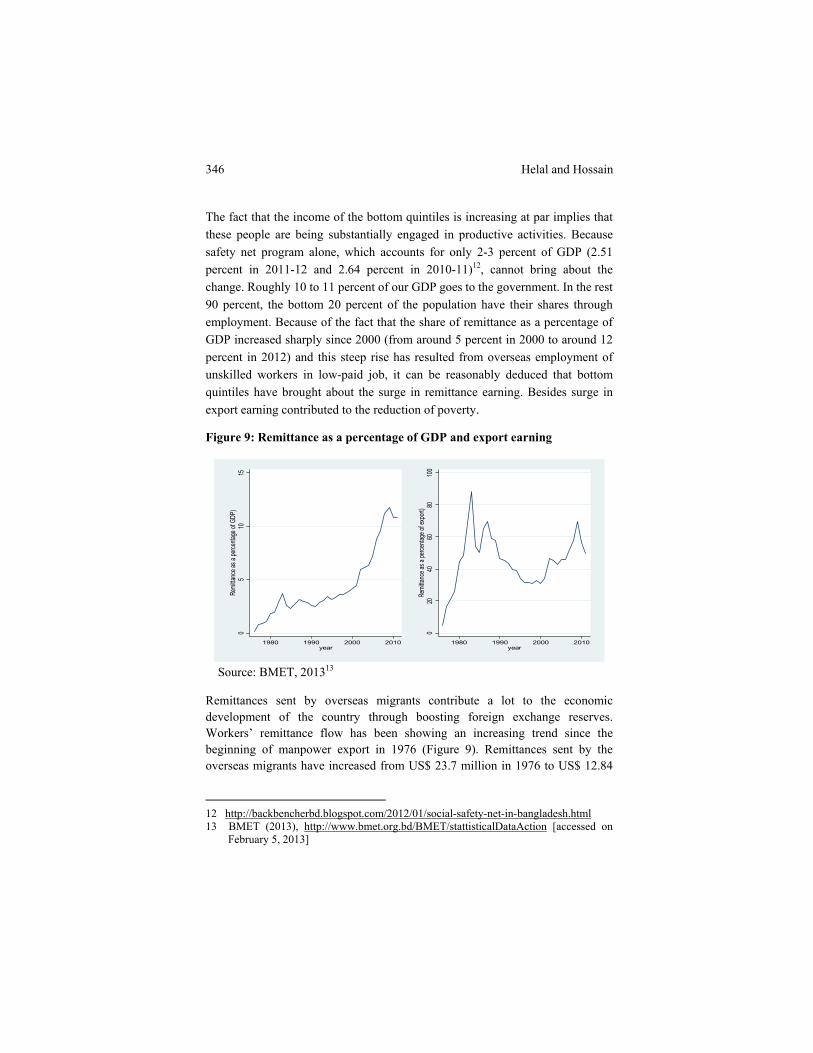
The fact that the income of the bottom quintiles is increasing at par implies that these people are being substantially engaged in productive activities. Because safety net program alone, which accounts for only 2-3 percent of GDP (2.51 percent in 2011-12 and 2.64 percent in 2010-11)12, cannot bring about the change. Roughly 10 to 11 percent of our GDP goes to the government. In the rest 90 percent, the bottom 20 percent of the population have their shares through employment. Because of the fact that the share of remittance as a percentage of GDP increased sharply since 2000 (from around 5 percent in 2000 to around 12 percent in 2012) and this steep rise has resulted from overseas employment of unskilled workers in low-paid job, it can be reasonably deduced that bottom quintiles have brought about the surge in remittance earning. Besides surge in export earning contributed to the reduction of poverty.
Figure 9: Remittance as a percentage of GDP and export earning
05
1015
Remi
ttanc
e as a
perce
ntage
of G
DP)
1980 1990 2000 2010year
020
4060
8010
0Re
mitta
nce a
s a pe
rcenta
ge of
expo
rt)
1980 1990 2000 2010year
Source: BMET, 201313
Remittances sent by overseas migrants contribute a lot to the economic development of the country through boosting foreign exchange reserves. Workers’ remittance flow has been showing an increasing trend since the beginning of manpower export in 1976 (Figure 9). Remittances sent by the overseas migrants have increased from US$ 23.7 million in 1976 to US$ 12.84
12 http://backbencherbd.blogspot.com/2012/01/social-safety-net-in-bangladesh.html 13 BMET (2013), http://www.bmet.org.bd/BMET/stattisticalDataAction [accessed on
February 5, 2013]
Four Decades of Economic Development of Bangladesh 347
0200
000400
000600
000800
000Tot
al over
seas e
mploy
ment
1980 1990 2000 2010year
0500
0100
00150
00rem
ittance
earnin
g (in m
illion U
S$)
1980 1990 2000 2010year
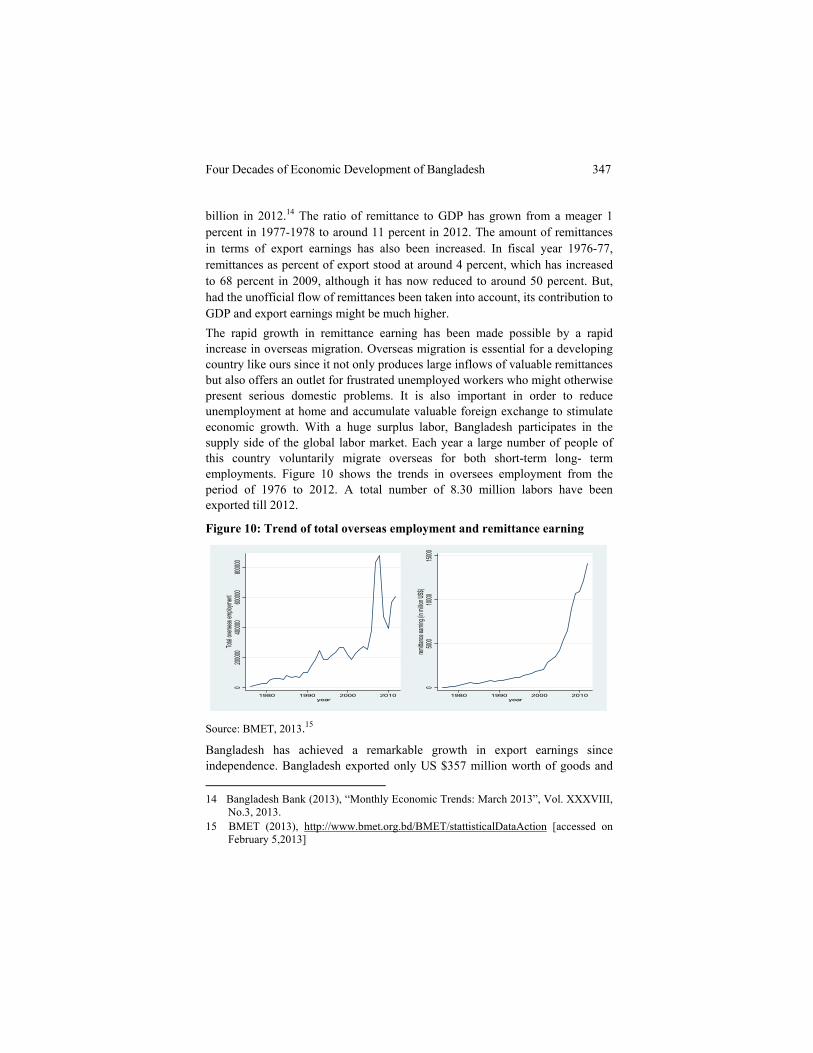
billion in 2012.14 The ratio of remittance to GDP has grown from a meager 1 percent in 1977-1978 to around 11 percent in 2012. The amount of remittances in terms of export earnings has also been increased. In fiscal year 1976-77, remittances as percent of export stood at around 4 percent, which has increased to 68 percent in 2009, although it has now reduced to around 50 percent. But, had the unofficial flow of remittances been taken into account, its contribution to GDP and export earnings might be much higher. The rapid growth in remittance earning has been made possible by a rapid increase in overseas migration. Overseas migration is essential for a developing country like ours since it not only produces large inflows of valuable remittances but also offers an outlet for frustrated unemployed workers who might otherwise present serious domestic problems. It is also important in order to reduce unemployment at home and accumulate valuable foreign exchange to stimulate economic growth. With a huge surplus labor, Bangladesh participates in the supply side of the global labor market. Each year a large number of people of this country voluntarily migrate overseas for both short-term long- term employments. Figure 10 shows the trends in oversees employment from the period of 1976 to 2012. A total number of 8.30 million labors have been exported till 2012.
Figure 10: Trend of total overseas employment and remittance earning
Source: BMET, 2013.15
Bangladesh has achieved a remarkable growth in export earnings since independence. Bangladesh exported only US $357 million worth of goods and 14 Bangladesh Bank (2013), “Monthly Economic Trends: March 2013”, Vol. XXXVIII,
No.3, 2013.
15 BMET (2013), http://www.bmet.org.bd/BMET/stattisticalDataAction [accessed on February 5,2013]

348 Helal and Hossain
services in 1972 whereas it was around US $26 billion in 2011. As a result, export share in GDP increased from a meager 5 percent in 1972 to 22 percent in 2011. The large increase in export earnings has been largely facilitated by export of readymade garments. This export-oriented industry is the highest foreign exchange earner in the country. Even the recent global recession did not put any significant adverse impact on this sector’s earnings. Not only has this sector been a tool of poverty alleviation and therefore, an economic boost to the country as a whole, but it has also been a vehicle of social change. Almost 85 percent of the workers employed in this industry are female. Thus, it has brought women out of their homes and thereby bringing in women empowerment to a great extent. 4. Progress in social indicators The success story of poverty reduction in Bangladesh has also been reflected in the significant progress in different social indicators. Bangladesh had in essence three types of endowment since independence – these are land, labor and capital. Due to population pressure land were becoming scarcer every year and the lack of adequate capital was always a chronic case. Thus, the growth must have been facilitated by growth in labor and land productivity. The growth in labor productivity has been made possible by increased human capital resulting from progress in different social development indicators. This section gives an overview of the progress made in different social development indicators since independence. 4.1 Commendable progress in reducing malnutrition Bangladesh has made a significant progress in reducing under nutrition in regard to all anthropometric indicators, albeit the progress markedly slowed down after 2000. There has been significant improvement in underweight (low weight for height) status over the time. The level of underweight has declined from 65 percent to 36 percent between 1991 and 2011. Thus Bangladesh is in a position to achieve the goal of reducing Prevalence of underweight children under-five years of age (6-59 months) to 33 percent by 2015 (MDG 1.c). Furthermore stunting (low height for age), which is less responsive to immediate shortage or increase in calorie intake and thus representing the country’s long term under nutrition and developmental scenario, shows an encouraging picture. The prevalence of stunting reduced from 71 percent in 1983 to 41 percent in 2011 (BDHS 2011). Wasting however, is showing a rather alarming trend. The prevalence of wasting is still above the 15% emergency level that warrants implementation of a public health intervention as recommended by WHO.16
16 WHO (2000), “The Management of Nutrition in Major Emergencies”, Geneva,
World Health Organization.

Four Decades of Economic Development of Bangladesh 349
Figure 11: Malnutrition trend in Bangladesh
Source: World Bank and BDHS 2011
4.2 Progress in enrollment in primary education Bangladesh has made quite a good progress in primary school enrollment. Gross primary school enrollment, defined as the total enrolment of students in a grade or level of education, regardless of age, expressed as percentage of the corresponding eligible official age-group population in a given school year, increased from 61 percent in 1972 to about 103 percent in 2010. Net primary school enrollment, refers to the number of pupils in the official school age group in a grade, cycle or level of education in a given school year expressed as percentage of the corresponding population of eligible official age group, also increased from 68 percent in 1973 to 94 percent in 2010.17 Thus Bangladesh is quite close to reach the goal of achieving 100 percent net primary school enrollment (MDG Goal 2A).
4.3 Significant progress in other social development indicators In addition to reducing income-poverty, Bangladesh has made remarkable progress in human development indicators since independence. Bangladesh is in fact among the few developing countries which are on target towards achieving
17 Data from 1990 to 2006 has been take from BANBEIS, others are taken from United
Nations Educational, Scientific, and Cultural Organization (UNESCO) Institute for Statistics http://www.indexmundi.com/facts/bangladesh/school-enrollment

350 Helal and Hossain
the Millennium Development Goals in respect of most of the social development indicators. Amartya Sen suggested that, Bangladesh performs better than India regarding almost of all social development indicators. The decline in infant and child mortality rates, for example, is among the fastest in the developing world. Child mortality rate declined from 270 per 1000 live births in 197018 to 140 per 1000 live births in 1990 and 49 per 1000 live births in 2011. Thus Bangladesh is progressing towards achieving the goal of reducing child mortality rate below 48 per 1000 live births by 2015. Bangladesh’s progress in reducing child mortality rate has been commended, including a UN Award. Bangladesh has also made remarkable progress in reducing maternal mortality rate since 1990. Maternal mortality rate declined from 800 per 100000 live births in 1980s to 240 per 100000 live births in 2010. Despite this progress Bangladesh is not likely to achieve the goal of reducing maternal mortality below 144 per 100000 live births (MDG goal 5.1). Bangladesh has already eliminated gender disparity in primary and secondary school enrolment (MDG goal 3A) and has made a remarkable progress in providing universal basic education. The ratio of girls to boys in primary and secondary school increased from 51 percent in 1990 to 113 percent in 2010. In this regard Bangladesh compares well to the average performance of South Asia, LDCs or the World. Figure 12: Gender disparity in primary and secondary school and
contraceptive prevalence rate
4060
8010
012
0
1990 1995 2000 2005 2010year
Bangladesh Least Developed countries South asia World
Ratio of girls to boys in primary and secondary education (%)
2030
4050
60
1990 1995 2000 2005 2010year
Bangladesh Least Developed countries South asia World
Contraceptive prevalence rate
Source: World Bank
18 Ministry of Health and Family Welfare, Bangladesh Demographic Data Sheet,
http://www.dgfp.gov.bd/data%20sheet.htm

Four Decades of Economic Development of Bangladesh 351
The success in reducing the population growth rate through the adoption of birth control measures is also quite unique for countries at similar per capita income levels like LDCs and the countries of South Asia. Contraceptive prevalence rate increased from 40 percent in 1990 to 58 percent in 2007. Accordingly, adolescence birth rate per 100 women declined to 59 in 2007 from 77 in 1990s. Population growth has declined to 1.32 percent per year which was around 2-3 percent during the 1970s and 1980s. Figure 13: Access to pure drinking water and sanitary facilities
5060
7080
90
1990 1995 2000 2005 2010year
Bangladesh LDC South asia World
Access to pure drinking water(% of people)
2030
4050
60
1990 1995 2000 2005 2010year
Bangladesh LDC South asia World
Access to sanitary facilities(% of population)
Source: World Bank
Significant progress has occurred in case of access to pure drinking water and sanitary facilities. Proportion of population using an improved drinking water sources was 77 percent in 1990 whereas the proportion now stands at 82 percent. Proportion of population using an improved sanitation facility rose from 39 percent in 1990 to 56 percent in 2010.
4.4 Revolution in communication technology Bangladesh has experienced a massive progress with respect to using communication technology. This progress has mainly been brought about by mobile phone technology. Since its start in 1992, the use of mobile phone increased rapidly and access to mobile phones surpassed fixed line phone access in 2001. But the significant change in mobile phone use came since 2003. The number of mobile phone user per 100 people increased from 1 percent in 2003 to around 56 percent in 2011. Use of telephone has also increased from 8 per 10000 people in 1975 to 106 per 10000 people in 2011, although its growth rate has been much less than that of mobile phone.

352 Helal and Hossain
Figure 14: Access to mobile phone and telephone
4.5 Increase in production and consumption of energy The development of energy sector is integral to the development of a country. A country’s growth lags behind because of poor energy infrastructure. Although the energy infrastructure of Bangladesh lags behind that of its neighboring countries there has been a significant increase in energy use since independence. Per capita electric power consumption was only around 10 Kilowatt-hour in 1971. The use of electric consumption has increased tremendously since then and stood at about 279 Kilowatt-hour in 2011.
Fig. 15: Trend in electricity production and consumption per capita (KWhr)
0100
200
300
E
lect
ric
pow
er
consu
mptio
n (
kWh p
er
capita
)
1970 1980 1990 2000 2010year

Four Decades of Economic Development of Bangladesh 353
5. State of Realization of full Potential Despite all the progress discussed above, Bangladesh has not been able to realize the full potential of its abundant labor. Bangladesh has not been able to realize the “demographic dividend” due to its inability to absorb additional labors productively. Bangladesh is one of the leading manpower exporting countries in the world. Most of its workers employed overseas are less skilled and are engaged in low-paid derogatory works. If we could equip our workers going abroad with little technical know-how or even equip them with foreign languages, it could have been quite easy for them to double or triple their overseas earnings. The country has not been able to extract the full potential of its land resources due to lack of appropriate human capital and technology adoption.
5.1 Not realizing the full potential of Labor: Demographic dividend The population aged below 14 and above 64 constitutes the dependent population of a country. Figure 17 shows a gradual decline in dependency ratio in Bangladesh over the last few years, creating opportunities for development known as “Demographic dividend”. This dividend is a window of opportunity that is created when faster rate of economic growth and human development coupled with effective policies cause a decline in fertility rate. This is followed by a significant reduction in child and infant mortality rates. This is also followed by an increase in average life expectancy allowing the families to have fewer children to reach their desired number of offspring. However, this drop in fertility rates is not immediate. This time lag produces a generational population bulge that surges through society. For a period of time this “bulge” is a burden on society and increases the dependency ratio. Eventually this group begins to enter the productive labor force. With fertility rates continue to fall and older generations having shorter life expectancies, the dependency ratio declines dramatically. This demographic shift initiates the demographic dividend.
Figure 16: trend in dependency ratio
Source: World Bank data

354 Helal and Hossain
This 'dividend' at present provides an opportunity to Bangladesh to make use of its working-age population for productive socio-economic activities. There are four steps to reap the benefits from the demographic dividend. The first is the increased labor supply. The magnitude of this benefit however depends on the ability of the economy to absorb and productively employ the additional workers. The second one is the increase in savings. As the number of dependents decreases individuals can save more. This increase in national savings rates in turn increases the stock of capital and leads to higher productivity if the accumulated capital is invested. The third one is human capital. Decreases in fertility rates result in healthier women and fewer economic pressures at home which allows parents to invest more resources per child, leading to better health and educational outcomes. The final one is the increasing domestic demand brought about by the increasing GDP per capita and the decreasing dependency ratio. But the opportunity and the reality are not synonymous. How much benefit Bangladesh will realize from this demographic dividend depends, among others, on the employment opportunities in the economy. If there is little employment opportunities, a large part of the increased labor force will remain unemployed, hindering the benefit to be reaped from demographic dividend. A time series plot of youth unemployment in Bangladesh over the last few years shows an increase youth unemployment. Historically, from 2000 to 2010, Bangladesh unemployment rate averaged 4.6 percent reaching an all time high of 5.1 percent in December 2009 although the rate somewhat decreased to 4.5 in 2010.Thus realizing the dividend by means of increased labor supply is not that much obvious, given the present circumstances. Figure 17: Trend in unemployment
Source: Bangladesh economic review, 2010 and BBS

Four Decades of Economic Development of Bangladesh 355
Realization of the demographic potential through increased investment depends on how much of the savings converts into investment. Saving as a percentage of GDP is increasing continually. But investment as a percentage of GDP is not increasing that much, particularly over the last decade (when the investment share of GDP stagnated at 25 percent). The barriers to boosting investment can be attributed to macro-economic strains, infrastructural deficit, corruption, abrasive tax administration and political instability. The following table compares the ranking of Bangladesh with its South-Asian counterparts and China with regard to different infrastructural facilities and policies related to doing business (i.e. investment). As can be seen from the table Bangladesh performs poorly in all of the indicators apart from protecting indicators. For these reasons investment in Bangladesh has not been up to the mark which makes it difficult to realize the benefit from demographic dividend quite challenging. Table 4: Ease of doing business ranking in different countries, 2012
Bangladesh Pakistan Sri Lanka India China
Starting a Business 95 98 33 173 151 Dealing with Construction Permits 83 105 112 182 181
Getting Electricity 185 171 103 105 114
Registering Property 175 126 143 94 44
Getting Credit 83 70 70 23 70
Protecting Investors 25 32 49 49 100
Paying Taxes 97 162 169 152 122
Trading Across Borders 119 85 56 127 68
Enforcing Contracts 182 155 133 184 19
Resolving Insolvency 119 78 51 116 82
Ease of Doing Business Rank 129 107 81 132 91 Source: IFC, 2013.19
However, as the example of Sri Lanka, and many other countries outside the region, clearly illustrates this demographic dividend does not last forever as illustrated by the experience of Sri Lanka and many other countries. At some point this people in the working age population will transform itself into elderly population. According to a World Bank estimate this demographic dividend will last until around 2033 when the adult dependency reaches significant 19 IFC (2013), “Doing Business 2013: Smarter regulations for Small and Medium size
Enterprises”, 10th edition, The World Bank.

356 Helal and Hossain
proportions.20 The demographic dividend might, in fact, be a cost if policies are not formulated accurately, leading to unemployment and an adverse impact on old age security. Thus it is high time to utilize the golden years in a way to achieve economic growth and build a good social security system. 5.2 Not realizing the full potential of labor: Overseas employment Bangladesh is one of the countries who earn highest remittance from overseas employment. Following an increasing trend of overseas employment, an increasing trend in the flow of remittances sent by expatriate workers’ has been observed. However, most of the workers are engaged in low-paid derogatory jobs requiring minimal level of skill. Figure 19 shows various categories of Bangladeshis like professionals, skilled, semi-skilled, and unskilled labor force employed in different countries. Doctors, engineers, teachers and nurses are considered as professional workers, while manufacturing or garment workers, drivers, computer operators and electricians as skilled. Tailors and masons are considered as semi-skilled, and housemaids, agricultural workers, hotel workers and menial workers as unskilled workers (Farid et al., 2009)21. Of the total overseas employment during 1976 to 2012, the highest 52 percent are unskilled worker followed by 31 percent of skilled, 14 percent of semi-skilled and 2.21 percent of professional (BMET, 2012). This trend has not been changed even in the recent years. For instance in 2012, the highest 62 percent are unskilled worker followed by 35 percent of skilled, 3 percent of semi-skilled and only 0.13 percent of professional workers. Since unskilled workers are engaged in low paid job the remittance earning is much lower than what could be earned if we could have exported more skilled manpower. Figure 18: Composition of Bangladeshi overseas employment by skill
Source: BMET, 2013.22 20 http://www.thedailystar.net/newDesign/news-details.php?nid=129240 21 Farid et al., “Trends in International migration and remittances inflows: Case study
Bangladesh”, J. Bangladesh Agril. Univ., Vol. 7, No. 2, 2009, pp. 387–394 22 BMET (2013), http://www.bmet.org.bd/BMET/stattisticalDataAction [accessed on
February 5, 2013]

Four Decades of Economic Development of Bangladesh 357
A study by South Asian Centre for Policy Studies (SACEPS) reveals that Migrants from South Asia represent several categories of skills. They range from the professional, the middle and clerical, skilled, semi skilled, unskilled to a separate category of housemaids. While India accounts for large segment of professionals and skilled categories, Bangladesh, Nepal and Pakistan mainly cater to the market of semi skilled and unskilled workers. Housemaids constitute the overwhelming bulk of the Sri Lankan migrant workforce (SACEPS 2009). Even compared with Srilanka and Pakistan, Bangladesh accounts for a large portion of unskilled labor. The proportion of unskilled overseas workers accounts for 52 percent for Bangladesh, whereas the share is 40 percent23 for Srilanka and around 40-45 percent for Pakistan.24
6. Challenges towards realizing the potential 6.1 Challenges towards realizing the potential of Labor 6.1.1 A huge investment on human capital development The substantial reduction in poverty in Bangladesh is praiseworthy. A major reason for this decline is the rising per capita income, growing from less than 2 percent a year in the 1970s to around 5 percent a year in the 2000s. Yet, it is worrisome that an estimated 47 million people are still below the national poverty line. Continued growth in per capita income will help reduce poverty further. Thus, Bangladesh must seek inclusive economic growth and put in more resources for reduction of poverty to pursue sustainable economic development. Clearly, a major vehicle with which the government can maintain a high economic growth is by making investment on the poor targeting human capital development. This will equip the poor to get more and better jobs. An educated and healthy labor force can thus help increase economic growth while improving income distribution.
However public spending on health and education has been quite low in Bangladesh. Public spending on education is a mere 2.4 percent of GDP while it is only 1 percent of GDP on health. On the contrary, the average public spending of the world on education and health is around 5 percent and 6 percent of GDP, respectively. Bangladesh also spends much less on education than South Asia as a whole.
23 N. Arunatilake, S. Jayaratne, P. Jayawardena, R. Jayaweera, & D. Weerakoon,
(2010), “Impact of Remittances on the Household of the Emigrant and on the Economy of the Migrant’s Country: Sri Lanka”
24 U. Kock, & Y. Sun (2011), “Remittances in Pakistan - Why have they gone up and why aren’t they coming down?” IMF, WP/11/200.

358 Helal and Hossain
02
46
Perce
ntage
of GD
P
1995 2000 2005 2010indicatorcode
Bangladesh LDCSouth Asia World
Public Expenditure on Health
23
45
Perce
ntage
of GD
P
2000 2005 2010Year
Bangladeh LDCSouth Asia World
Public expenditure on Education
Figure 19: Public expenditure on health and education as a share of GDP
Source: World Bank
Thus Bangladesh needs to create and expand access to opportunities through more investment in health, education and safety net programs for the poorest. It also needs to expand and improve the education and health services. This will require major improvements in the delivery of public education and health services through education policies, governance and institutional reforms.
6.1.2 Providing energy infrastructure at a reasonable cost
To create the capacity of the economy to absorb and productively employ the increased young labor force, Bangladesh requires a big investment on infrastructure - energy, power generation, roads, railway and ports to attract further investment and ensure industrial development and employment creation through private sector participation. Particularly energy infrastructure is crucial to industrial development. The deficiencies in power, gas, and basic infrastructure are the major supply-side bottlenecks for industry sector growth in Bangladesh.
Only 41 percent of total population of Bangladesh has access to electricity (World Bank, 2012). To sustain accelerated industrial growth, the government needs to urgently address shortages in power and gas supplies. To meet this end energy source diversification is badly needed. Energy production in Bangladesh is too much reliant on natural gas. In 2010, 80 percent of the total electricity used to be generated by natural gas, whereas the respective share of oil, coal and hydroelectricity was 5 percent, 4 percent and 3 percent.25 However, because of
25 26 27 Mof (2011), “Power and energy sector roadmap: an update”, Finance division,
Ministry of finance, Government of the people’s republic of Bangladesh.

Four Decades of Economic Development of Bangladesh 359
infrequent and insufficient gas supplies, the electricity production has been hampered recently. For example, in 2010 due to shortage of gas supply approximately 500-800 MW electricity could not be produced26. In this context, it is required to reduce over-dependence on natural gas and to increase use of alternative source for electricity generation.
One such source could be coal since Bangladesh has an actual coal reserve of 3 billion metric ton,27 which is distributed in five mines across Bangladesh. Moreover coal is a relatively cheaper energy source and power generation from coal is also cheaper. According to the data of Nuclear Energy Institute, the cost of per kilowatt-hour electricity production was 3.06 cents from coal, 4.86 cents from Gas, 2.14 cents from nuclear and 15.18 cents from oil. Although Bangladesh has substantial deposit of quality coal, there is a concern about the method of extraction as well as the technological security which has led many experts to recommend that the quick resolution of energy problems lies on coal import.
Accordingly, the government has taken initiatives to set up 10 imported coal-based plants with a capacity of 7000 megawatt which would require 20 million of imported coal worth $2 billion28. However there is serious concern regarding imported coal-based power plant. The import cost per ton of coal may go much higher than anticipated. The C&F cost per ton of coal (import from Indonesia) to Chittagong stands at between US$130 which may rise to US$170 per ton after paying various fees and port taxes.29 To make the matter worse none of the ocean-going vessels carrying coal to Bangladesh from the source will be able to berth that leads us to assume that a deep sea port is going to be developed, a time consuming and costly affair. All these may cause the cost of electricity generation go up further. The lesson learnt from quick rental experiment teaches such fluctuation in the energy price can be quite harmful to the macroeconomic stability. The government should weigh the cost and benefit of going for an imported coal based policy. Besides, the government should think of the efficient use of its own high quality coal reserve.
6.2 Challenges towards realizing the land potential 6.2.1 Land degradation
One of the main challenges towards realizing the land potential is degradation of land in Bangladesh as it is a threat to agricultural productivity. Land degradation
28 http://www.thefinancialexpressbd.com/more.php?news_id=120535&date=2012-02-18 29 http://www.thefinancialexpressbd.com/more.php?news_id=95121&date=2012-01-20
360 Helal and Hossain
refers to the wearing down or away, and the general lowering and reduction of the earth's surface by the natural processes of weathering and erosion. Improper farming practice, land transformation and deforestation, urbanization, intensive farming method, drought, population pressure etc are contributing to land degradation in Bangladesh. An integrated soil and nutrient management approach, therefore, is needed to ensure efficient and judicious use of all major sources of plant nutrients so as to get maximum economic benefit without any deleterious effect on physical, chemical and biological properties.30 Further research is needed to avoid the land degradation in Bangladesh.
6.2.2 Unplanned Urbanization: Removing extreme pressure from Dhaka
The urbanization of Bangladesh is closely associated with the intense development of Dhaka City which has experienced a massive migration from the rural areas of Bangladesh in recent decades. Since 1971, Dhaka experienced a tremendous growth to meet the needs of the newly independent country's capital. Its existence as a major urban centre caused to propel the growth of population further. The city's population rose to 2 million in 1974 from 0.7 million in 1961 and within a decade it leapt to 3 million in 1981. Then Dhaka city experienced its highest rate of physical and population growth during 1981-1991 when its population just doubled. The population of Dhaka city exceeded 10 million in 2001.31The city is now estimated to have a population of 15 million.
To keep pace with the high population growth, the urbanization began encroaching on the low lying areas within the city limits and even the adjacent areas of its outskirts. But this massive influx has not been matched by the simultaneous creation of infrastructure due to resource constraints. Consequently this unprecedented growth has turned into a symbol of chaos and confusion and caused unexpected sprawling of slums and squatters. Life has been difficult due to tremendous traffic congestion, housing scarcity, water pollution and extreme water-logging problem. It seems that life in Dhaka city has become very much stressed in all respects. Once an important urban agglomeration, Dhaka has already booked its spot as the second worst place to live in.
It is high time to give a serious thought to Dhaka's future. In this circumstance, decentralization is the best and only way to solve the problems. The government should look into the matter and take steps to decentralize business facilities while preparing the urban strategy plans. Besides DAP (Detailed Area Plan) can be implemented for development control and making Dhaka livable. But the
30 http://www.banglapedia.org/HT/L_0045.HTM 31 S. Hossain, “Rapid urban growth and poverty in Dhaka city”, Bangladesh e-Journal
of Sociology, Vol. 5; No. 1, January 2008.
Four Decades of Economic Development of Bangladesh 361
most important thing is that the influx of migrants has to be stopped. To this end, an indiscriminate economic growth is required across the country. 6.2.3 Environment and climate change The climate change poses a major development challenge for Bangladesh. There is a risk associated with Bangladesh's vulnerability to natural disasters. Bangladesh is one of the countries who will be the greatest sufferer of the climate change due to its geographical location. According to the United Nations Human Development Report 2007/2008, one meter rise in sea level would inundate 18% of land area in Bangladesh, directly threatening 11% of the population.32 Climate change will also affect all four dimensions of food security and have an impact on human health, livelihood assets, food production and distribution channels, as well as changing purchasing power and market flows. Its impacts will be both short term, resulting from more frequent and more intense extreme weather, and long term, caused by changing temperatures and precipitation patterns. Agriculture-based livelihood systems that are already vulnerable face immediate risk of increased crop failure, new patterns of pests and diseases, lack of appropriate seeds and planting material, and loss of livestock. People living on the coasts and floodplains and in hilly regions are most at risk. As an indirect effect, low-income people everywhere, but particularly in urban areas, will be at risk of food security owing to loss of assets and lack of adequate insurance coverage. Development partners need to strongly support the country to undertake a holistic approach to mitigate the effects of climate change and to adapt with the impacts of environmental degradation, and natural disasters.
6.2.4 Facing the very competitive globe To remain competitive for reaping the potential economic benefits from the globalized world, Bangladesh must transform its sluggish and complex bureaucratic structure of the Government. The pyramid bureaucratic structure inherited from the colonial days is characterized by red tapism, inefficiency, centralization, lack of delegation and job description. Too many tiers in the decision making process, archaic filing and noting system, lack of e-governance and poor pay structure which are out of place in the modern states.33 For the complex bureaucracy the country has been incapable of promoting business and investment at the expected level. Thus the government needs to take essential measures for transforming this bureaucracy.
32 UNDP (2007-08), “Human Development Report 2007-08: Fighting Climate Change:
Human solidarity in a divided world”. 33 Du, Hua, “Bangladesh economy: Opportunity and challenges”, Journal of the
American Chamber of Commerce in Bangladesh; Vol. 1, No 3, October, 2008.

362 Helal and Hossain
7. Conclusion
Since independence Bangladesh has made commendable progress in various macroeconomic and social development indicators which is reflected in various development indexes of World Bank and the United Nations. However, we could have achieved much more had we utilized the full potential of our labor force. The percentage of population aged below 14 and above 64, which constitute the dependent population of a country, is shrinking in Bangladesh. Increase in working-age population creates a greater opportunity for productive socio-economic activities in Bangladesh. This opportunity is known as “demographic dividend” which is realized in 4 steps to economic growth and development.
An increased labor supply results in increased savings and capital stock coupled with decreases in fertility rates and better women health, more child care, and consequently, an increase in GDP per capita resulting in an increased demand stimulating the economic growth and development further. Bangladesh could not realize the full potential of this dividend. A substantial part of the labor force could not be employed in good and better jobs due to lack of appropriate skill in labor and infrastructure deficiency. An unemployed labor is practically dependant even though he or she is not dependant in terms of age consideration.
Over time this demographic feature or advantage goes away. Thus, it is high time that we realized this advantage. Challenges towards realizing the potential are critical and manifolds. Proper utilization of natural resources such as land is very crucial. Environmental sustainability is a must for Bangladesh. Capable political leadership, business friendly policies, efficient bureaucracy, decentralization, strong local governments and opportunities for participation of the poorest are essential to confront the challenges.
Beside domestic resource mobilization and support by multilateral lending institutions, foreign private investment will be highly beneficial to offset shortage in investment. Bangladesh needs to invest more on human resource and skill development in order to create and sustain a competitive edge in the globalized world. Only then Bangladesh will become an economically sound country and could even emerge as one of the next eleven fast growing countries in the World as predicted by Goldman Sachs.