fourier theory
DESCRIPTION
Fourier theory. A sine wave. 5*sin (2 4t). Amplitude = 5. Frequency = 4 Hz. seconds. A sine wave signal. 5*sin(2 4t). Amplitude = 5. Frequency = 4 Hz. Sampling rate = 256 samples/second. Sampling duration = 1 second. seconds. An undersampled signal. The Nyquist Frequency. - PowerPoint PPT PresentationTRANSCRIPT
Fourier theory
0 0.1 0.2 0.3 0.4 0.5 0.6 0.7 0.8 0.9 1-8
-6
-4
-2
0
2
4
6
8
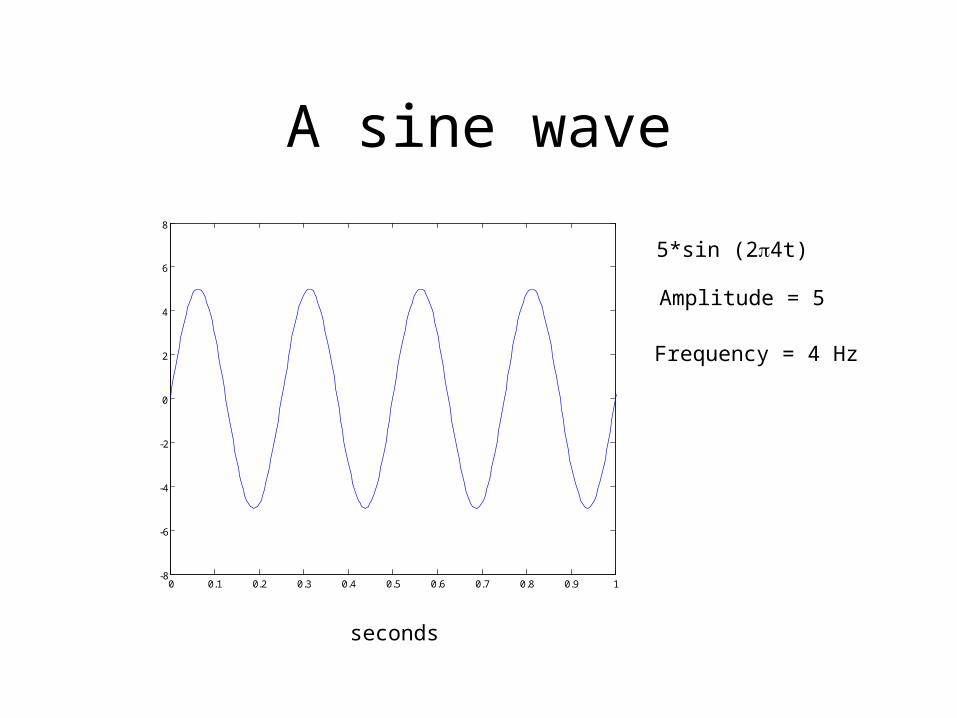
5*sin (24t)
Amplitude = 5
Frequency = 4 Hz
seconds
A sine wave

0 0.1 0.2 0.3 0.4 0.5 0.6 0.7 0.8 0.9 1-8
-6
-4
-2
0
2
4
6
8
5*sin(24t)
Amplitude = 5
Frequency = 4 Hz
Sampling rate = 256 samples/second
seconds
Sampling duration =1 second
A sine wave signal
0 0.2 0.4 0.6 0.8 1 1.2 1.4 1.6 1.8 2-2
-1.5
-1
-0.5
0
0.5
1
1.5
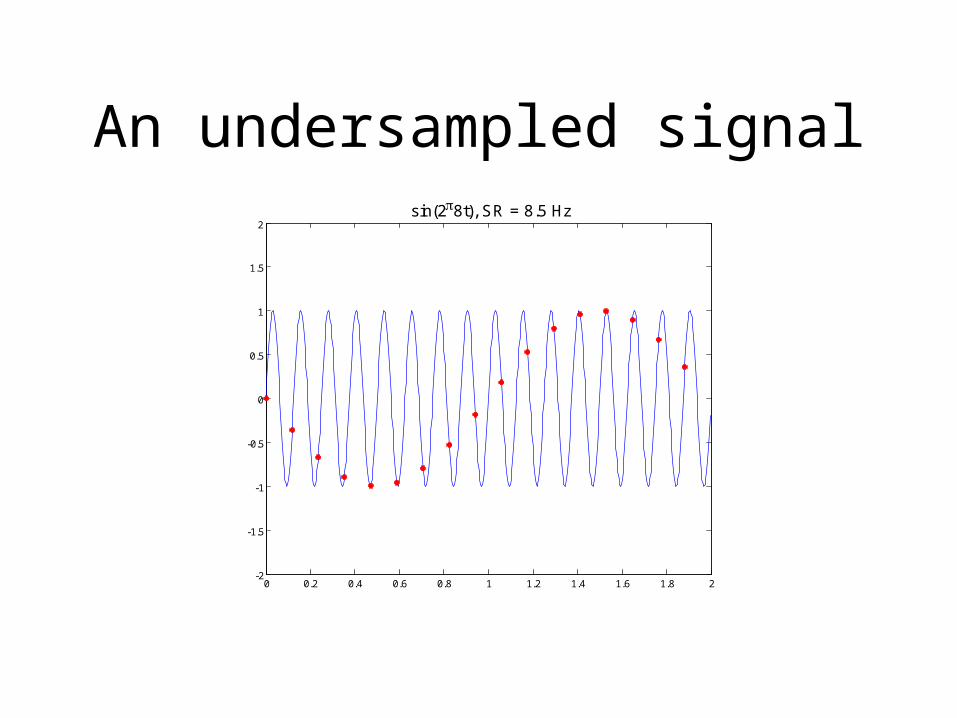
2sin(28t), SR = 8.5 Hz
An undersampled signal

The Nyquist Frequency
• The Nyquist frequency is equal to one-half of the sampling frequency.
• The Nyquist frequency is the highest frequency that can be measured in a signal.
Fourier series
• Periodic functions are expanded into sines and cosines
What is a Transform?
• A transform inputs one function and outputs another.
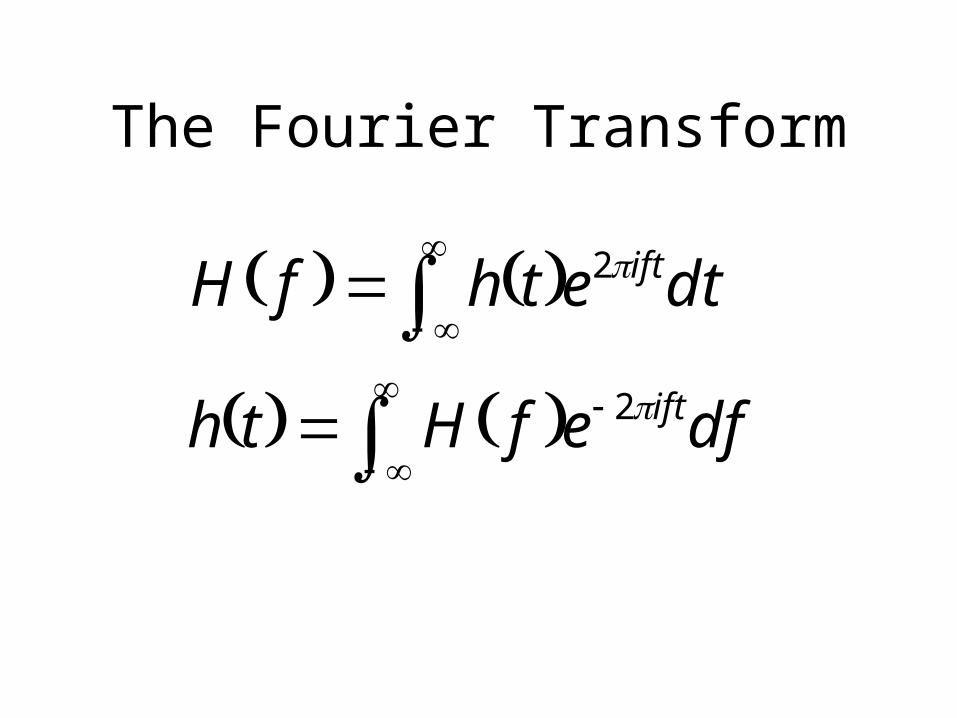
The Fourier Transform
dfefHth
dtethfH
ift
ift
2
2
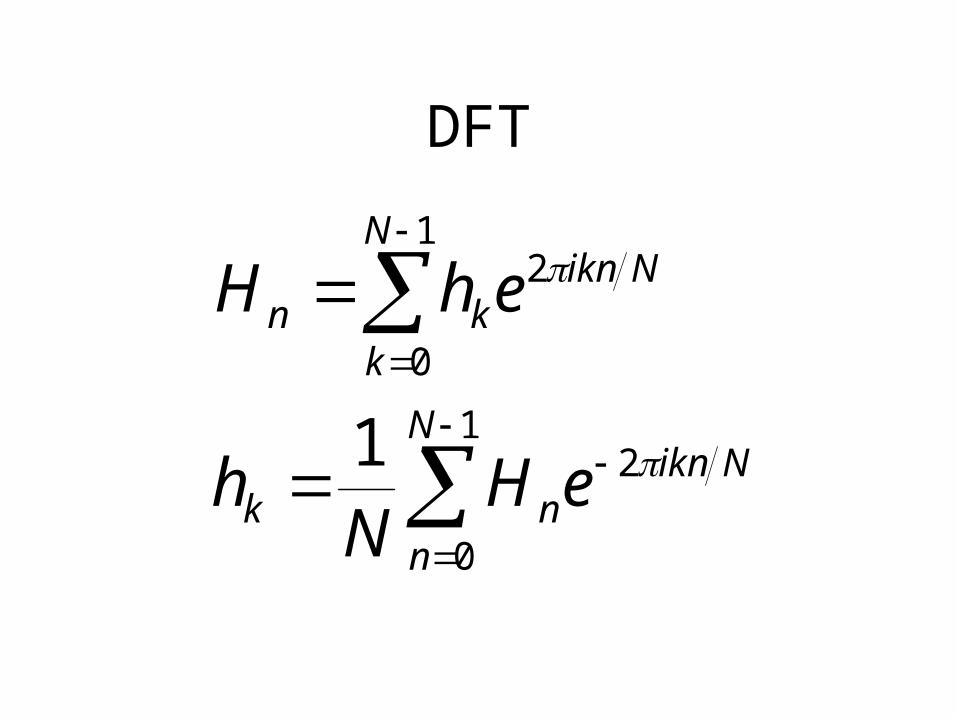
DFT
1
0
2
1
0
2
1 N
n
Niknnk
N
k
Niknkn
eHN
h
ehH
DFT
• In 1969, the 2048 point analysis of a seismic trace took 13 ½ hours. Using the FFT, the same task on the same machine took 2.4 seconds!

Fast Fourier Transform
• an efficient DFT algorithm
• used by Gauss in 18??
• published by Cooley & Tukey in 1965
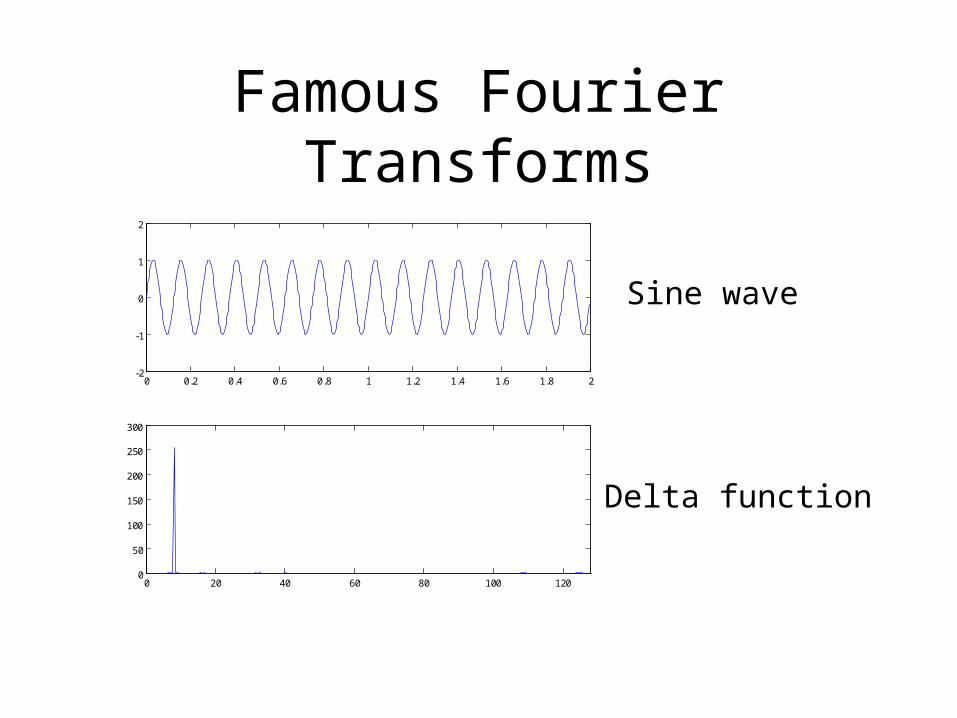
0 0.2 0.4 0.6 0.8 1 1.2 1.4 1.6 1.8 2-2
-1
0
1
2
0 20 40 60 80 100 1200
50
100
150
200
250
300
Famous Fourier Transforms
Sine wave
Delta function

Famous Fourier Transforms
0 5 10 15 20 25 30 35 40 45 500
0.1
0.2
0.3
0.4
0.5
0 50 100 150 200 2500
1
2
3
4
5
6
Gaussian
Gaussian
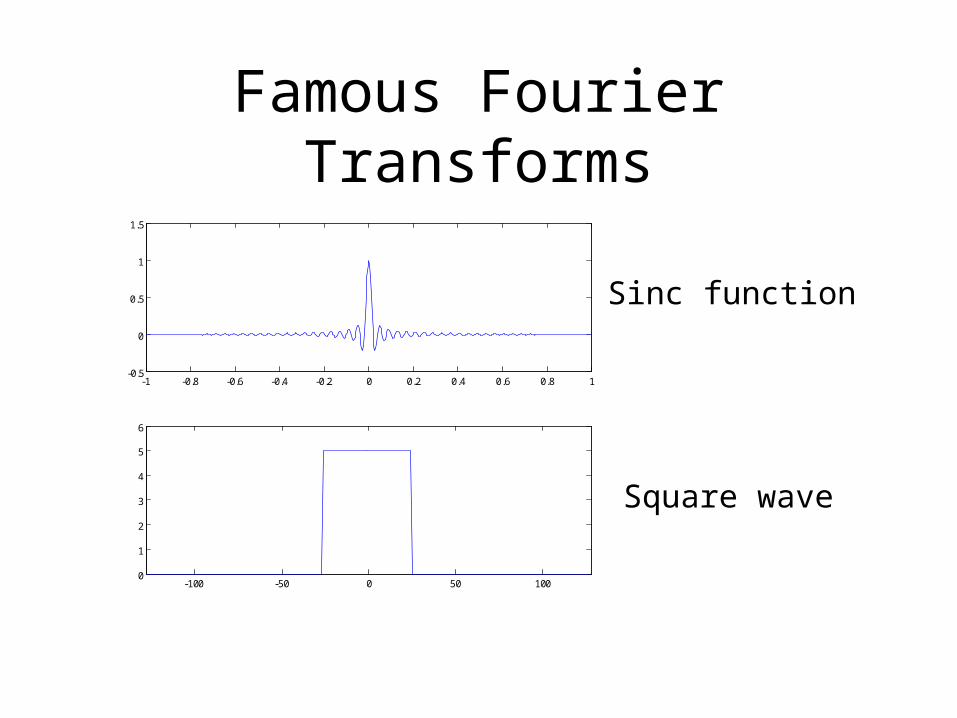
Famous Fourier Transforms
-1 -0.8 -0.6 -0.4 -0.2 0 0.2 0.4 0.6 0.8 1-0.5
0
0.5
1
1.5
-100 -50 0 50 1000
1
2
3
4
5
6
Sinc function
Square wave
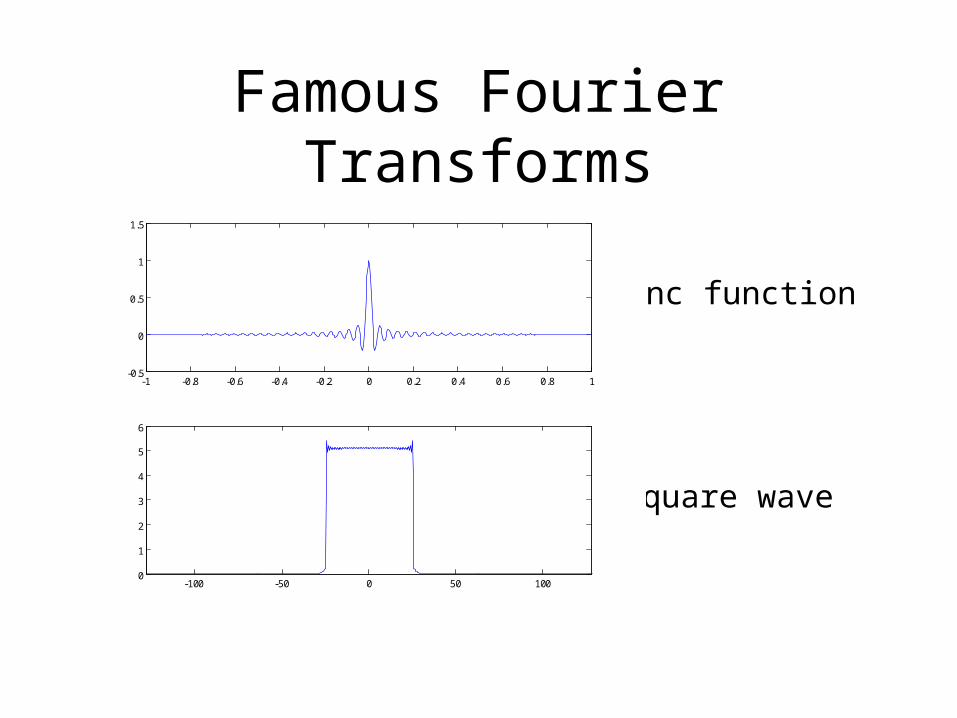
Famous Fourier Transforms
Sinc function
Square wave
-1 -0.8 -0.6 -0.4 -0.2 0 0.2 0.4 0.6 0.8 1-0.5
0
0.5
1
1.5
-100 -50 0 50 1000
1
2
3
4
5
6
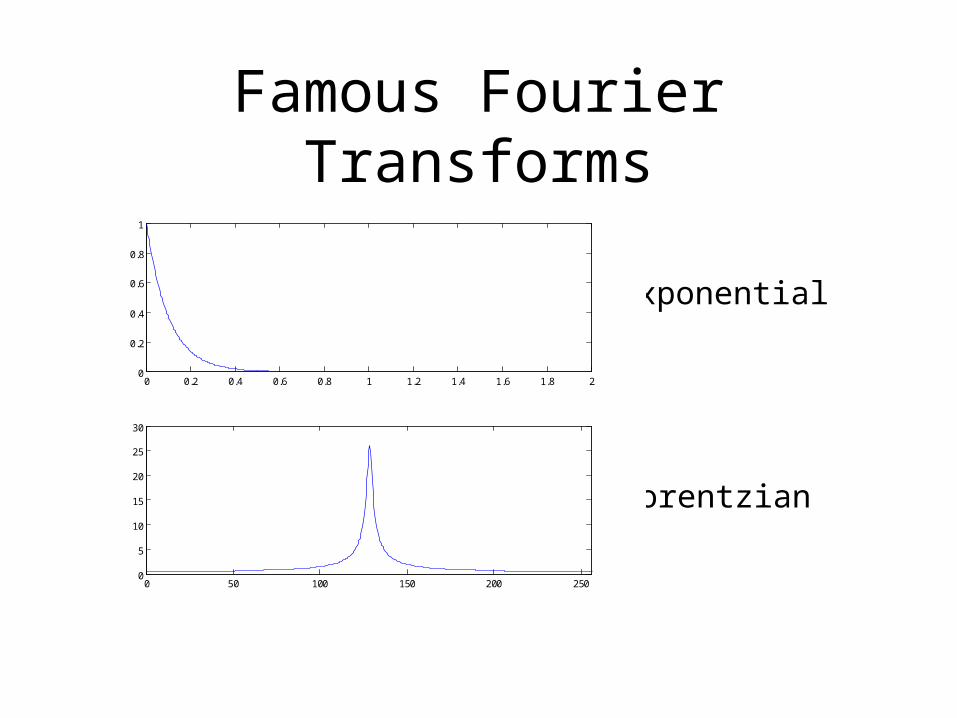
Famous Fourier Transforms
Exponential
Lorentzian
0 50 100 150 200 2500
5
10
15
20
25
30
0 0.2 0.4 0.6 0.8 1 1.2 1.4 1.6 1.8 20
0.2
0.4
0.6
0.8
1

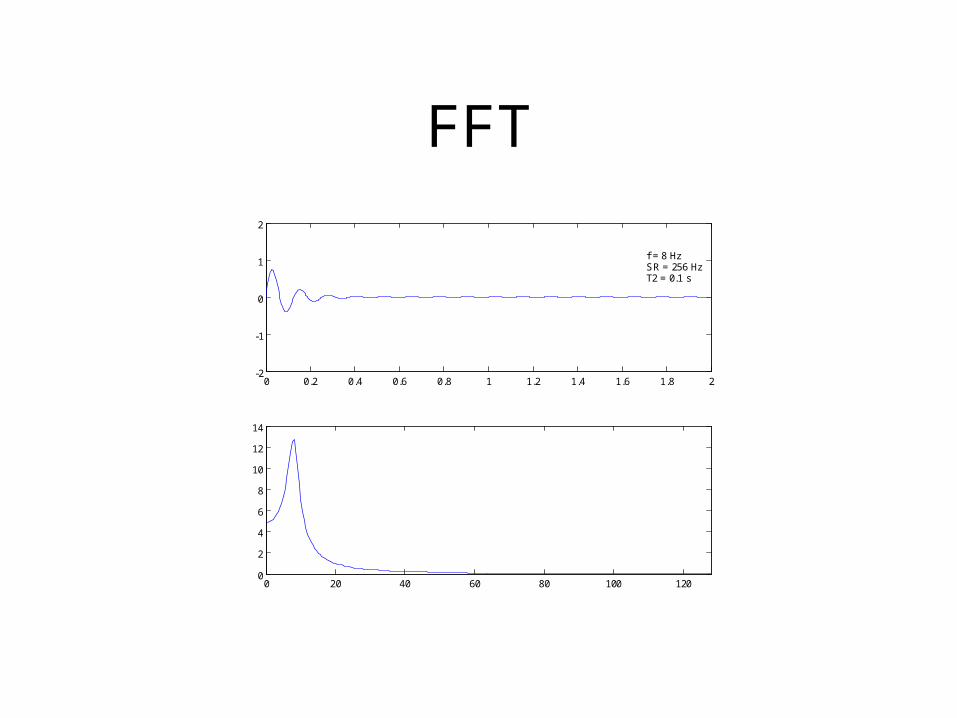
FFT
0 0.2 0.4 0.6 0.8 1 1.2 1.4 1.6 1.8 2-2
-1
0
1
2
0 20 40 60 80 100 1200
10
20
30
40
50
60
70
f = 8 Hz SR = 256 HzT2 = 0.5 s
2exp2sin
Tt
fttF
FFT
0 0.2 0.4 0.6 0.8 1 1.2 1.4 1.6 1.8 2-2
-1
0
1
2
0 20 40 60 80 100 1200
2
4
6
8
10
12
14
f = 8 HzSR = 256 HzT2 = 0.1 s
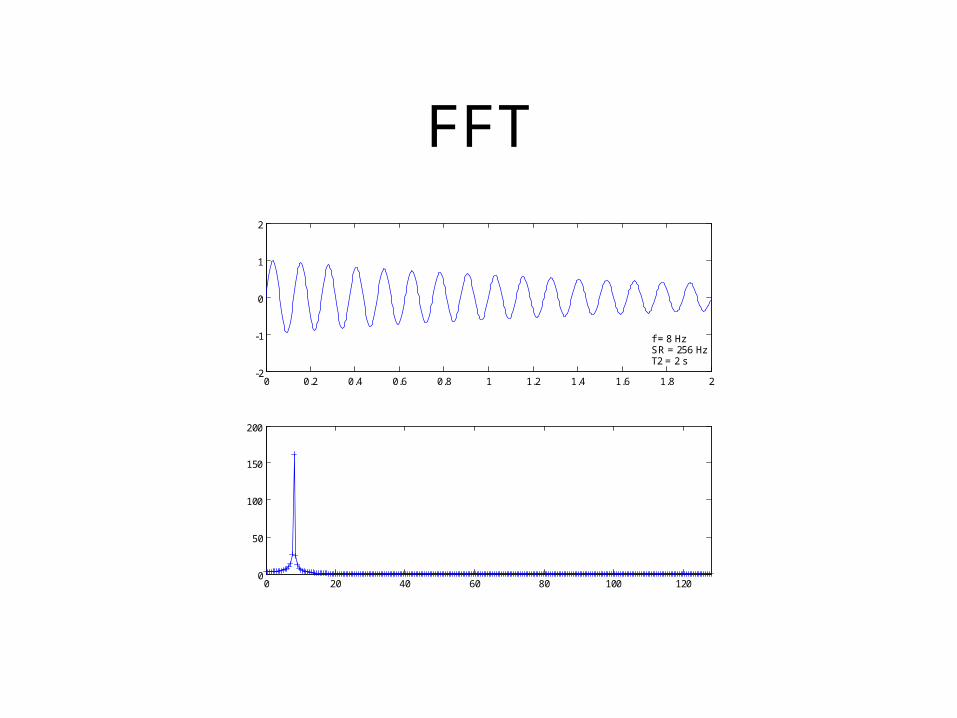
FFT
0 0.2 0.4 0.6 0.8 1 1.2 1.4 1.6 1.8 2-2
-1
0
1
2
0 20 40 60 80 100 1200
50
100
150
200
f = 8 Hz SR = 256 HzT2 = 2 s
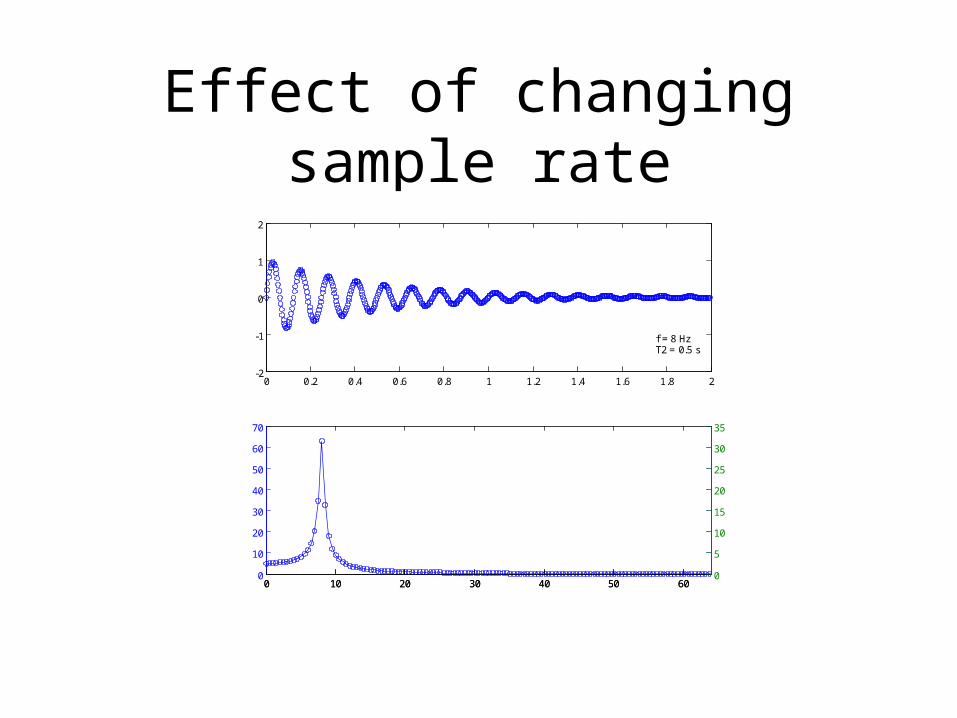
Effect of changing sample rate
0 10 20 30 40 50 600
10
20
30
40
50
60
70
0 0.2 0.4 0.6 0.8 1 1.2 1.4 1.6 1.8 2-2
-1
0
1
2
0 10 20 30 40 50 600
5
10
15
20
25
30
35
f = 8 Hz T2 = 0.5 s
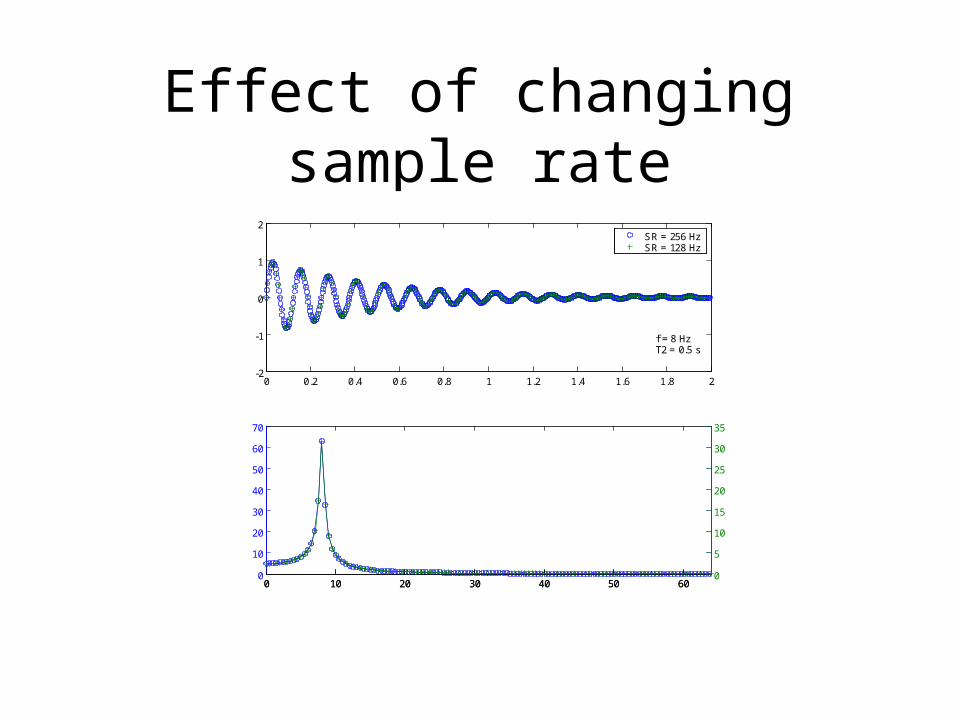
Effect of changing sample rate
0 10 20 30 40 50 600
10
20
30
40
50
60
70
0 0.2 0.4 0.6 0.8 1 1.2 1.4 1.6 1.8 2-2
-1
0
1
2
0 10 20 30 40 50 600
5
10
15
20
25
30
35
SR = 256 HzSR = 128 Hz
f = 8 HzT2 = 0.5 s
Effect of changing sample rate
• Lowering the sample rate:– Reduces the Nyquist frequency, which– Reduces the maximum measurable frequency
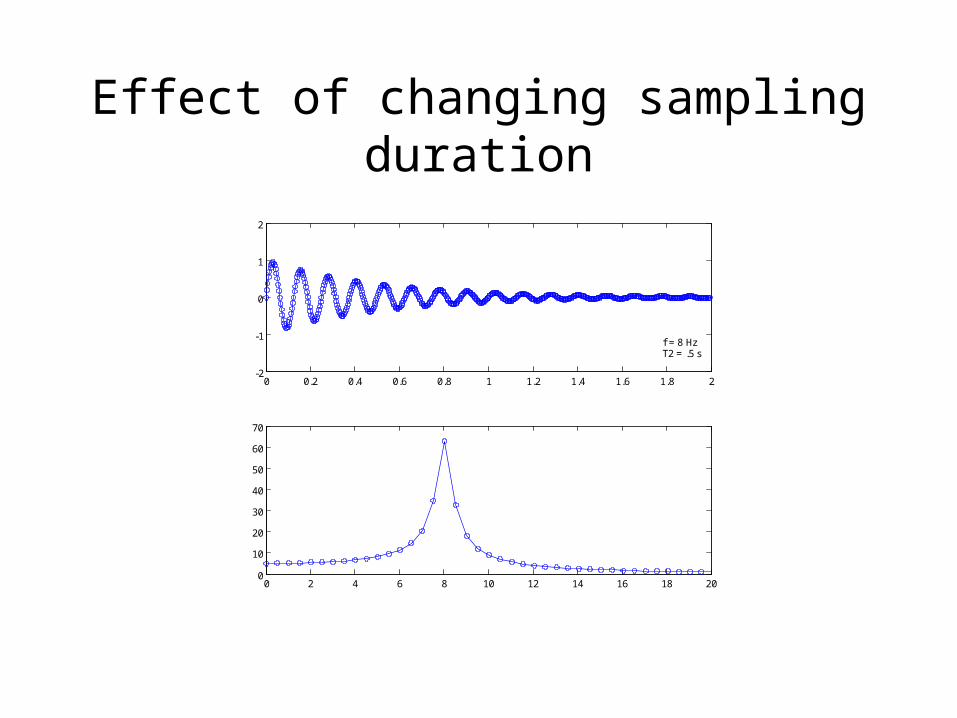
Effect of changing sampling duration
0 0.2 0.4 0.6 0.8 1 1.2 1.4 1.6 1.8 2-2
-1
0
1
2
0 2 4 6 8 10 12 14 16 18 200
10
20
30
40
50
60
70
f = 8 Hz T2 = .5 s
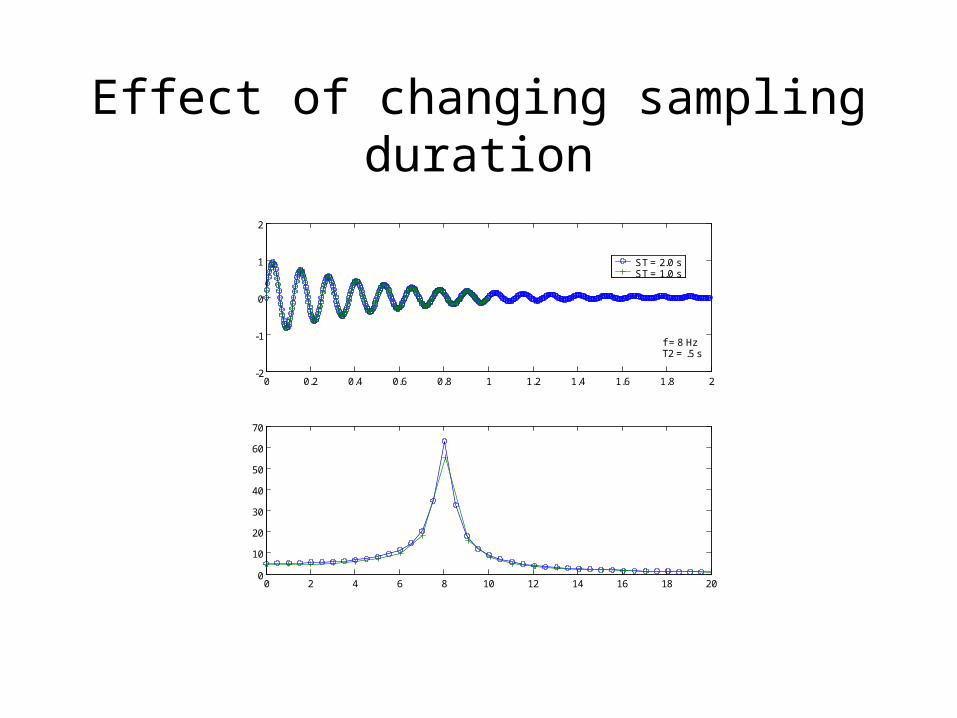
Effect of changing sampling duration
0 0.2 0.4 0.6 0.8 1 1.2 1.4 1.6 1.8 2-2
-1
0
1
2
0 2 4 6 8 10 12 14 16 18 200
10
20
30
40
50
60
70
ST = 2.0 sST = 1.0 s
f = 8 HzT2 = .5 s

Reducing the sampling duration
• Lowers the frequency resolution
• Does not affect the range of frequencies you can measure
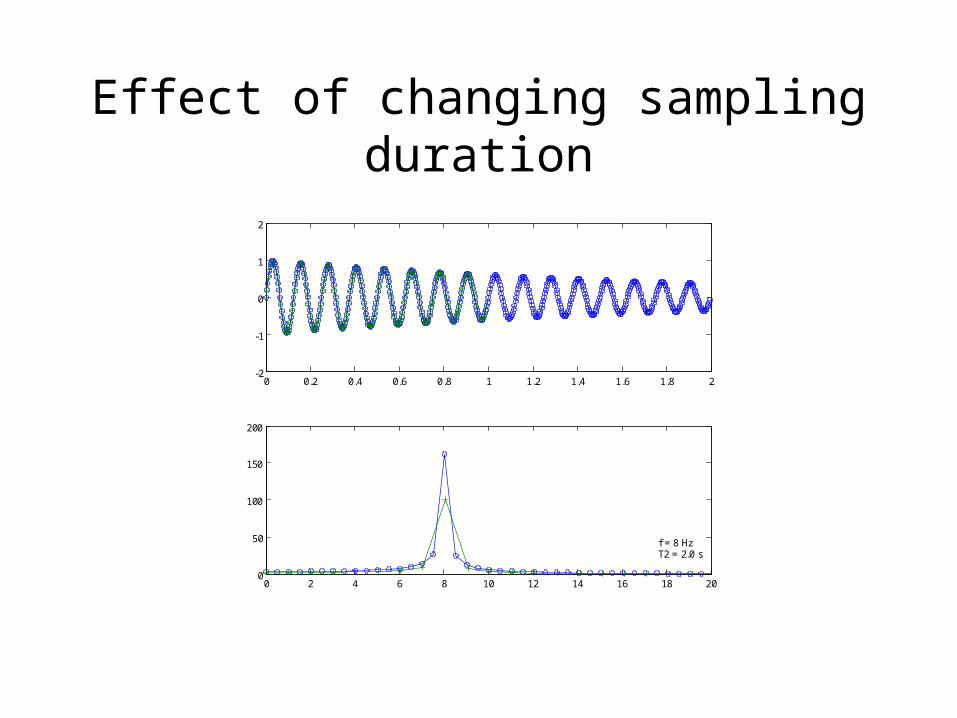
Effect of changing sampling duration
0 0.2 0.4 0.6 0.8 1 1.2 1.4 1.6 1.8 2-2
-1
0
1
2
0 2 4 6 8 10 12 14 16 18 200
50
100
150
200
f = 8 Hz T2 = 2.0 s
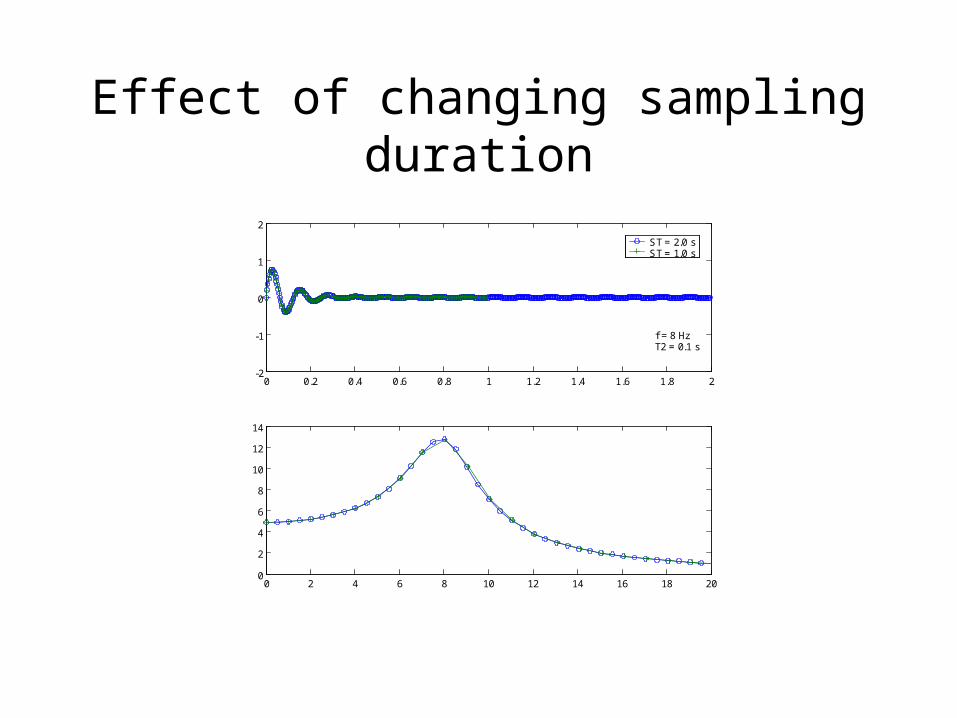
Effect of changing sampling duration
0 0.2 0.4 0.6 0.8 1 1.2 1.4 1.6 1.8 2-2
-1
0
1
2
0 2 4 6 8 10 12 14 16 18 200
2
4
6
8
10
12
14
ST = 2.0 sST = 1.0 s
f = 8 Hz T2 = 0.1 s
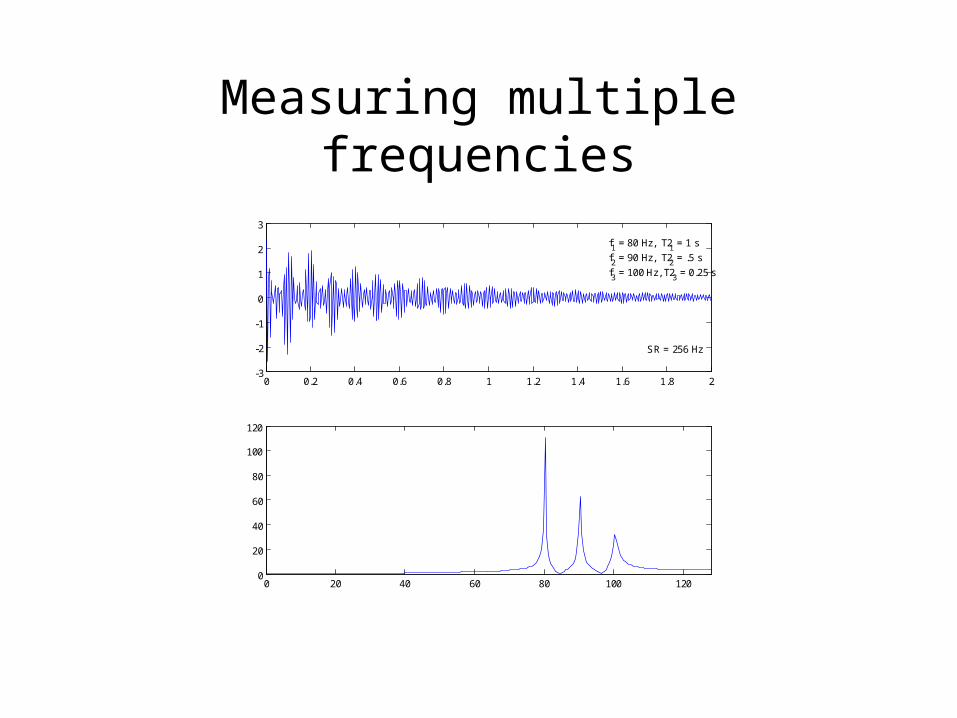
Measuring multiple frequencies
0 0.2 0.4 0.6 0.8 1 1.2 1.4 1.6 1.8 2-3
-2
-1
0
1
2
3
0 20 40 60 80 100 1200
20
40
60
80
100
120
f1 = 80 Hz, T21 = 1 s
f2 = 90 Hz, T22 = .5 s
f3 = 100 Hz, T2
3 = 0.25 s
SR = 256 Hz

Measuring multiple frequencies
0 0.2 0.4 0.6 0.8 1 1.2 1.4 1.6 1.8 2-3
-2
-1
0
1
2
3
0 20 40 60 80 100 1200
20
40
60
80
100
120
f1 = 80 Hz, T21 = 1 s
f2 = 90 Hz, T22 = .5 s
f3 = 200 Hz, T2
3 = 0.25 s
SR = 256 Hz