fourier transform infrared spectroscopic imaging of colon ... · for the classification of...
TRANSCRIPT

RESEARCH PAPER
Fourier transform infrared spectroscopic imaging of colon tissues:evaluating the significance of amide I and C–H stretching bandsin diagnostic applications with machine learning
Cai Li Song1& Martha Z. Vardaki2 & Robert D. Goldin3
& Sergei G. Kazarian1
# The Author(s) 2019
AbstractFourier transform infrared (FTIR) spectroscopic imaging of colon biopsy tissues in transmission combinedwith machine learningfor the classification of different stages of colon malignancy was carried out in this study. Two different approaches, an opticaland a computational one, were applied for the elimination of the scattering background during the measurements and comparedwith the results of the machine learning model without correction for the scattering. Several different data processing pathwayswere implemented in order to obtain a high accuracy of the prediction model. This study demonstrates, for the first time, that C–Hstretching and amide I bands are of little to no significance in the classification of the colon malignancy, based on the Giniimportance values by random forest (RF). The best prediction outcome is found when supervised RF classification was carriedout in the fingerprint region of the spectral data between 1500 and 1000 cm−1 (excluding the contribution of amide I and IIbands). An overall prediction accuracy higher than 90% is achieved through the RF. The results also show that dysplastic andhyperplastic tissues are well distinguished. This leads to the insight that the important differences between hyperplastic anddysplastic colon tissues lie within the fingerprint region of FTIR spectra. In this study, computational correction performed betterthan optical correction, but the findings show that the disease states of colon biopsies can be distinguished effectively withoutelimination of Mie scattering effect.
Keywords Fourier transform infrared spectroscopic imaging . Colon polyps and cancer . Correcting lens approach . Machinelearning . K-means clustering . Random forest supervised classification
Introduction
Colon cancer is a disease in the large intestine in which abnor-mal cells divide uncontrollably. Most cases of the colon cancerbegin as a small adenomatous polyp which lines the inner
surface of the colon [1]. In the UK, colon cancer is the fourthmost common cancer with 16,000 deaths every year, making itthe second most common cause of cancer death in 2016 [2].Early detection of colon cancer can help reduce mortality andmorbidity. The current diagnostic approach for this disease in-cludes biopsy collection followed by histopathology during co-lonoscopy or surgery. In recent years, FTIR spectroscopy hasbeen shown as a promising technique to enhance the clinicaldiagnosis in a label-free way by investigating the chemicalcontent of the biopsy samples [3–6].
Although FTIR spectroscopy has the potential as a clinicalprognostic tool, there are several challenges associated with it,most notably the reflection and scattering contribution (‘dis-persion artefact’) that arise from the spatial inhomogeneity ofthe sample. In fact, the dispersion artefact is found to be large-ly dominated by resonant Mie scattering in pure transmissionexperiment, as opposed to measurement in transflection modewhere the reflection artefact becomes significant [7]. The
Electronic supplementary material The online version of this article(https://doi.org/10.1007/s00216-019-02069-6) contains supplementarymaterial, which is available to authorized users.
* Sergei G. [email protected]
1 Department of Chemical Engineering, South Kensington Campus,Imperial College London, London SW7 2AZ, UK
2 Michael Smith Laboratories, The University of British Columbia,Vancouver, BC V6T 1Z4, Canada
3 Department of Cellular Pathology, St. Mary’s Campus, ImperialCollege London, W2 1NY, London, UK
https://doi.org/10.1007/s00216-019-02069-6
Received: 18 June 2019 /Revised: 23 July 2019 /Accepted: 1 August 2019
Analytical and Bioanalytical Chemistry (2019) 411:6969–6981
/Published online: 16 August 2019

scattering contribution can lead to spectral distortion, for ex-ample, a decrease in the absorbance of the amide I band, andto a greater extent, manifest itself as a derivative-like baselineat the high wavenumber side of the amide I band. It can alsoresult in significant frequency shifting of spectral bands thatare used extensively to classify biological specimens. To beable to interpret FTIR spectra correctly, it requires the correc-tion of the dispersion artefact aforementioned. The origin ofdispersion artefact and their subsequent effect is detailed inpublished articles [7, 8].
Resonant Mie scattering (RMieS) algorithm developed byBassan et al. was proved to be successful at correcting the‘dispersion arterfact’ [7]. This algorithm is used in this manu-script; however, the correction algorithm is computationallyintensive and time consuming. In addition, physical alterationof imaging set-up for measurements in transmission byemploying an additional lens on top of the window that formspseudo-hemisphere has shown to be effective at producingaberration-free and high-quality spectra from tissues and fromcells [9–12]. The other challenge in FTIR spectroscopic mea-surements is the presence of spectral bands of water vapour inthe sample spectra, which hampers the analysis of proteinsecondary structure in the amide I region (1700–1600 cm−1)[13–15]. This water vapour interference can be minimised bycomputational subtraction of the pure water vapour spectrumfrom the sample spectrum, with algorithm described by Brunnet al. [16].
FTIR spectra contain a wealth of information about thesample. As such, in analysis of spectra of biological systems,multivariate statistics and machine learning algorithms arefrequently applied to extract the important information. Thetwo main strategies in chemometrics used to analyse FTIRspectral data are unsupervised learning and supervised learn-ing. The variety of the methods is detailed by Goodacre [17].The aim of this paper is to utilise the well-established machinelearning approach, random forest in this case, to examine thespectral ranges that could potentially contain the most impor-tant spectral biomarkers that distinguish between colon spec-imens of various degree of malignancy.
Materials and methods
Sample preparation
The samples are formalin-fixed paraffin-embedded (FFPE)colon biopsies at different disease stages of malignancy (hy-perplasia, dysplasia, and cancer), provided by St. Mary’sHospital (Imperial College London, UK), following standardclinical protocols. The samples were microtomed at 3 μmthickness from a specimen block and mounted onto a 2-mm-thick CaF2 window (Crystran Ltd., UK) for FTIR analysis.The adjacent section was mounted onto a glass slide, stained
with haematoxylin and eosin (H&E) and assessed by a trainedpathologist. The sections deposited on CaF2 windows weredeparaffinised as per the procedure described by Song et al.[18, 19] and stored with a desiccant before use.
FTIR spectroscopic imaging measurements
The experiments were carried out in transmission mode at × 15magnification (NA = 0.4), with a Hyperion 3000 FTIR micro-scope coupled to Tensor 27 FTIR spectrometer (Bruker Corp.).A liquid nitrogen cooled 64 × 64-pixel focal plane array (FPA),which has a field of view of 170 × 170 μm2, is used for simul-taneous acquisition of FTIR spectral dataset. As imaging wascombined with mapping, 3 × 3 individual images were stitchedinto one, resulting in a total measured area of 510 × 510μm2 foreach tissue. The spectral images from 12 sample areas wereacquired. A new background was recorded before measuringeach individual image. All measurements were taken in themid-IR range from 3900 to 900 cm−1, at 4 cm−1 spectral reso-lution and with 521 co-added scans. An additional CaF2 lens,which has been shown to significantly reduce Mie scattering[12], was also employed for imaging of the exact same tissueareas. The design and set-up of the lens for combining imagingwith mapping were described in details by Kimber et al. [20].To put it briefly, the added lens is kept in focus with an externalholder whilst the stage is shifted in x- and y-direction for dif-ferent areas to be measured.
The additional lens implemented to correct for the chromat-ic aberration in infrared measurement is referred to as‘correcting lens’ from this point onwards in this paper. Tothe authors’ knowledge, the assessment of the performanceof the correcting lens has not been closely examined withadvanced machine learning approaches.
Data processing and chemometric analyticalprocedure
The spectral data were processed with MATLAB R2018b(The MathWorks, Inc.). The spectral data in the range of1800–1000 cm−1 and 3000–2800 cm−1 were used for furtheranalysis. The region between 2800 and 1800 cm−1 contains noimportant spectral information whilst the region > 3000 cm−1
is sensitive to water content within the tissues. Baseline cor-rection and water vapour subtraction were not applied to thedata. Second derivatives of the obtained spectra were calcu-lated with Savitzky-Golay 9-point smoothing, which werethen vector normalised. The spectra, second derivatives, andnormalised second derivative data were then separately sub-jected to unsupervised machine learning, in this instance, theK-means clustering algorithm (tested for 2 to 6 clusters, eachwith 5 replicates and infinite iteration until the solution con-verges to a local minimum). A total of 2000 individual samplespectra were recorded and used for machine learning. Only
Song C.L. et al.6970

eight chemical images of the different tissue sections areshown here for demonstration purpose. Training and testmodels were created, each made up of 500 random spectrasampled from each cluster without replacement, for tissue atthe same disease stage. In other words, the model consists of2000 spectral data (500 for healthy (H), 500 for hyperplasticpolyps (HY), 500 for dysplastic polyps (D), and 500 for can-cer sections (C)) which are identified by H&E staining. Themodels were from different individuals ensuring that the inter-patient variability is included in the study. Employing ma-chine learning to study imaging data has been demonstratedin previous works [17, 21].
The training model, after undergoing data dimensionalityreduction with PCA, was subsequently supplied to randomforest (RF) classifier to generate a prediction model on the testmodel. RF operates by constructing multiple decision trees forclassification on the data, gets prediction from each tree andthus outputs the class mode by means of voting. In this study,bootstrapping as well as a five-fold cross validation of thedataset is implemented [22]. Among various supervised ma-chine learning classifiers, RF is preferable since it is faster andinsensitive to over-fitting [23]. The prediction accuracy of theRFmodel is presented in the form of a confusion matrix. Inter-model predictability was carried out with independent trainingand test set. The size of training to test models was varied from1:1 to 1:6. The analytical procedure is repeated with the mea-surement data obtained from the added correcting lens, as wellas for no-lens data but corrected with RMieS algorithm (pro-vided by Peter Gardner’s Lab, University of Manchester) [7,24–26]. The parameters of the RMieS algorithm are given inElectronic SupplementaryMaterial (ESM) (Table S1). Severalmachine learning parameters, namely the number of clusters,the spectral range for supervised and unsupervised classifica-tion, the size of training and test models, and the variance ofretained PCA, have been tried and tested, to optimise the pre-diction model. The important features are selected from theGini index—a score of the feature importance that is derivedfrom the training of the RF classifier, which technically cor-relates to the optimal ‘Gini impurity’ split at each nodes withinthe binary trees [27]. Based on the selected features or spectralrange, a flowsheet depicting all the different pathways to re-training machine leaning in categorising the different stages ofthe colon cancer is shown in Fig. 1. The prediction accuracy ofthe test models was used as the criteria to cross-check thespectral range highlighted by the machine learning as the‘key biomarker’ that can be utilised to understand differentdegree of malignancy of colon.
Figure 1 shows all the pathways that are tested with unsu-pervised and supervised approach via training and re-testingof the spectral data based on Gini importance (see figure insection ‘Gini index obtained fromRF classifier’). The featuresin this study are not independent of one another; thus, impor-tant spectral range is discussed instead of the single features.
The paper starts off by describing Mie scattering and the im-plementation of correcting lens on the FTIR spectra of colontissue, followed by the unsupervised learning on the secondderivative spectra without RMieS correction. With supervisedclassifier, the performance of both model with and withoutany RMieS correction is compared and discussed to establisha proof of concept that RMieS correction might not be neces-sary in this case study. On top of that, this paper serves todemonstrate that amide I band plays a very little role in thedifferences between specimens via feature selection in ma-chine learning. The results are detailed as follows.
Results and discussion
Physical and computational correction of Miescattering effect
Mie scattering effect is significantly reduced at the edges ofthe tissues when correcting lens is added, shown in Fig. 2,where increase in absorbance of the amide I band and reduc-tion in the sharp derivative-like distortion to the spectra at ~1710 cm−1 are observed. Correction with added lens slightlyshifted the peak position of the amide I band by ~ 1 cm−1 from1652 to 1653 cm−1. With the added lens, which acts like animmersion objective as reported by Kimber et al. [20], theimage has ~ 40% increase in magnification (total area of360 × 360 μm2 compared with 510 × 510μm2 for imagewith-out lens) and is flipped due to the arrangement of the tissueduring measurement whereby the tissue is placed facingdownwards with the correcting lens added on top of it.Computation correction with RMieS algorithm was more ef-ficient at recovering a flat baseline of the spectra (Fig. 3) com-pared with correction with the added lens but was more timeconsuming. The peak position of amide I band was correctedto where the peak is supposed to be at 1654 cm−1 with thecomputational method.
Data processing
Eight different tissue regions, which comprise of 4 trainingand 4 test models (as described in data processing procedure),are measured and analysed. The number of areas taken in totalis 12 (four disease states for three patients). Chemical imagesshowing the distribution of integrated absorbance, estimatedwith trapezoidal rule of integration, at the spectral bands of1272–1184 cm−1, 1712–1589 cm−1, and 2944–2880 cm−1,which are assigned to asymmetric phosphate stretching ofnucleic acid, amide I, and CH stretching of lipid respectively[28], are represented in Fig. 4 (top: training model; bottom:test model; only eight samples were selected for comparisonhere), alongside the H&E stain images, which were used bypathologists to assign the stage of tissue malignancy. The
Fourier transform infrared spectroscopic imaging of colon tissues: evaluating the significance of amide I... 6971

cumulative distribution curves of the pixel count of each inte-grated absorbance (with the data sorted into 100 bins) are alsoshown for easier comparison of the chemical images.Although the pixel count is by no means an accurate indicatorof the specific variation between disease stages as it is depen-dent on the area of measurement, it provides a quantitativemeans for direct comparison of the chemical images whichis not quite so distinct even after normalisation of the colourscale.
As can be seen in the curves of pixel count Fig. 4, theintegrated absorbance of nucleic acid band at 1271–1184 cm−1 is lowest for healthy colon biopsy when a 95%confidence interval is taken, likewise for amide I band. Theopposite is observed for the lipid spectral band within 2944–2880 cm−1, whereby the lowest integrated absorbance is
achieved in cancer tissues. This is in agreement with thehigh nucleic acid-to-cytoplasmic ratio observed in coloncancer tissues [29] as well as the loss of normal glandulararchitecture. The inner lining or mucosa of healthy colonis lined with columnar epithelium and large number ofgoblet cells, where numerous secretory vesicles contain-ing mucus (glycoprotein) are present, in addition to thesecreted mucin in the intestinal epithelial surface layer.Mucus is a complex biochemical layer made up of carbo-hydrates, antimicrobial peptides, immunoglobulins, elec-trolytes, and lipids [30]. For diseased tissue, however, thegoblet cells are not differentiated well to perform its func-tion; instead, they become highly metastasizing cells withhigh metabolic rate, which might progress to cancer (anaggregation of undifferentiated cells).
Fig. 1 Schematic overview of the data processing and machine learning steps explored in this study. The best pathway leading to the optimised result ishighlighted in grey
Song C.L. et al.6972

The difference between different stages of cancer isalso highlighted in the mean average spectrum obtainedafter taking their second derivatives. The evaluation of thevariation is not very straightforward, thus the need formachine learning to perform the task of classification ofcolon disease. The interpretation of the second derivativespectra is not included in the main discussion as machinelearning only requires the input of ‘features’, which is theabsorbance at various wavenumbers, and ‘label’, the stageof disease. The second derivative spectral bands and theircorresponding band assignment are, nonetheless, providedin ESM Fig. S4 and Table S2 to demonstrate the potentialvariation that might be picked up by the machine learningclassification model. The most significant differences liein the peak shift and the intensity of the trough of thesecond derivative data.
Gini index obtained from RF classifier
The choice of spectral wavenumbers for classification, asmentioned earlier, is based on the Gini index (Fig. 5). Theresults show that the fingerprint region (< 1500 cm−1) containsthe most important features (greater than Gini index of 0.015).This was followed by the lipid region (3000–2800 cm−1) ofsecondary importance. Surprisingly, the best prediction accu-racy is obtained when unsupervised training is applied on thespectral range of secondary importance, whilst the most im-portant features are used for supervised training. A similarmachine learning study was performed by Kuepper et al. oncolon cancer; however, the spectral range used for the trainingis inclusive of the amide I band [31]. It should be realised thatthe amide I region shows no significant importance, based onthe Gini values demonstrated here.
Fig. 3 The raw spectra of 100random pixels before and afterRMieS correction, shown on theleft and on the right respectively.Severe Mie scattering effect canbe seen in the figure on the leftprior to correction
Fig. 2 Top: false colour K-meanscluster images of healthy colontissue without the lens (left) andwith the lens (right) obtained bymapping from nine stitchedimages. Each of the chemicalimages has a size of 510 ×510 μm2. Cluster represented inlight blue shade (box) indicatesthe edges of the tissue. Bottom:the average measured spectrafrom the areas representing theedges of the tissue
Fourier transform infrared spectroscopic imaging of colon tissues: evaluating the significance of amide I... 6973

Unsupervised learning
K-means clustering are used for intra-tissue classification, bymaximising inter-distance variance between data within a tis-sue. It is important to recognise here that the optimum param-eters for clustering in this study, after assessing the outcome ofthe supervised predictive model by comparing different spec-tral ranges and the number of clusters (results not shown), arebased on the second derivative of the spectra between 3000and 2800 cm−1 (introduced as the ‘lipid region’ henceforth,although strictly speaking, the spectral band within this region
is not limited to lipid; it is assigned to the C-H stretching ofmethyl and methylene groups) [28]. The three clusters identi-fied are considered sufficient in this study following thesereasoning: first of all, the various tissue morphologycategorised by the clusters are fed into supervised machinelearning independently as a way of phasing out unnecessaryregions of the tissue since not all morphology or clusters showessentially distinct spectra between different stages of colondisease; the highest performance is obtained with the spectrafrom high lipid region, which can be easily classified with just3 clusters. Secondly, the higher the number of unsupervised
Fig. 4 FTIR spectroscopic images of the colon biopsy used in the trainingmodels (top) and test models (bottom), depicting the distribution ofdifferent components by evaluating the integrated absorbance at variousspectral ranges, which are labelled at the top of each column. The first
column gives the H&E-stained images identified by the pathologist. Eachimage has a size of 510 × 510 μm2.The colorscale of the images isnormalised across each component (column-wise) for comparison oftheir absorbances.
Training model H & E Nucleic acids
1271 – 1184 cm-1Amide I
1712 – 1589 cm-1Lipids
2944 – 2880 cm-1
Hea
lthy
H
yper
plas
ia
Dys
plas
ia
Can
cer
Normalised colorscale
Pixel Count (Cumulative distribution function)
Song C.L. et al.6974

clusters implemented, the higher the degree of similarity of thespectral data within each cluster; the lower the tolerance fordissimilarity of the test datasets, in other words, overfitting ofdata is introduced. In addition, since K-means is an unsuper-vised imaging approach, higher number of clusters have atendency to cluster data that are close to each other whichshould have been treated as one (the sum of squared distancesbetween each cluster decreases exponentially with increasingnumber of clusters). Besides, the main objective of this studyis to assess the importance of lipid and amide bands in theprediction ability of the RFmachine learning, the least numberof clusters which can output a good predictive performance isdesirable, in this case, three clusters for the intra-tissue
differentiation can warrant a prediction outcome greater than90% accuracy. Most importantly, higher category of classifi-cation (> 3 groups) is not needed as the lipid region is ofsecondary importance, as discussed before. Although thehigher number of clusters are useful at exploration of the var-ious histopathological architecture of colon adenocarcinoma,as analysed by Lasch et al. using similar multivariate imagingapproaches [32], the tissue morphology is not explored in thispaper. The false colour images generated from K-means clus-tering and their corresponding second derivatives are shownin Fig. 6.
From the mean second derivative spectra by averaging allthe pixels within the same cluster, the tissue regions are
Test Model H & E Nucleic acids
1271 – 1184 cm-1Amide I
1712 – 1589 cm-1Lipids
2944 – 2880 cm-1
Hea
lthy
Hyp
erpl
asia
D
yspl
asia
C
ance
r
Normalised colorscale
Pixel Count (Cumulative distribution function)
Fig. 4 (continued)
Fourier transform infrared spectroscopic imaging of colon tissues: evaluating the significance of amide I... 6975

effectively classified into low and high lipid absorbance re-gion (cluster 1 and cluster 2 respectively), which are fed intothe supervised learning algorithm separately. This reinforcesthe findings by Song et al. [18] that spectral bands of lipid arestill useful biomarkers for intra-tissue classification, despitethe lower Gini importance index. The lipid spectral regioncontains a wealth of information. Bassan et al. has also dem-onstrated that the high wavenumber spectral range (O−H, N−H, and C−H stretches occurring at ca. 3800–2500 cm−1) isuseful for the generation of false colour classification image ofbreast tissue microarrays on glass substrate [33]. They are freefrom interference with the spectral bands of water vapour andMie scattering, with the only possible variation coming fromthe deparaffinisation process on the formalin-fixed tissues.This variation is controlled and minimised by strictly adheringto the deparaffinisation protocol.
It is possible that the cancerous tissues are more susceptibleto change during solvent-based removal of material, required
prior to the paraffin embedding process. The FFPE processrequires fixation of fresh tissue in formalin for 6 to 24 h, follow-ed by multiple washes in ethanol/water with increasing ethanolconcentration until water has been removed. Xylene, or possi-bly isopropanol, is then used to remove the ethanol, taking withit much of the fats within the natural tissue. Finally, the tissue issoaked in molten paraffin, usually at 60 °C. Precautions weretaken to conduct the de-waxing process in a closely controlledmanner, so that each of the three samples were treated in thesame way; however, the manner in which the FFPE was firstconducted is out of our control, including the amount of fats andother materials that may have been removed in that process.That said, surprisingly, similar observations weremade on pros-tate cancer tissues that are supplied by different pathologists butde-waxed with the same procedure [18] that this wavenumberregion (3000–2800 cm−1) is different between normal and can-cer samples. Thus, the explanation that tissues of different ma-lignancy retain various amount of fats after deparaffinisationessentially still offers a different kind of ‘key biomarker’ forcancer differentiation in FTIR imaging study.
Supervised machine learning
Random forest classifier was shown to be an efficient super-vised machine learning technique for the classification ofspectral data in previous studies [17, 34, 35]. In this study,second derivative data (for measurements with and withoutcorrecting lens) from various spectral ranges were used totrain the algorithm—model 1, between 1800 and 1000 cm−1
and 3000–2800 cm−1 (all range); model 2, 1800–1000 cm−1
only (fingerprint region with amide bands); model 3, 1500–1000 cm−1 only (fingerprint region); and model 4, 3000–2800 cm−1 only (lipid region). To clarify, re-training and re-testing of the RF models is still required after Gini selection to
Fig. 5 Plot of Gini importance values obtained fromRF prediction modelagainst wavenumber of colon biopsy tissue, overlaid on the average FTIRspectrum of healthy colon tissues (normalised between 0 and 0.040) forclarification purpose
Fig. 6 Representative colour-coded K-means clustered images of healthycolon biopsy sections of a test and b training model. Cluster representedin light blue is for areas dominated by goblet cells (denoted as cluster 2),dark blue for basal membrane (denoted as cluster 1), and yellow for areas
without tissue. c Average second derivative spectra of the correspondingclusters in the high wavenumber spectral region (3000–2800 cm−1), fol-lowing the colour code in K-means cluster
Song C.L. et al.6976

subjectively assess the prediction performance; hence, the re-sults are organised in the way shown in the workflow (Fig. 1)in this manuscript.
The overall prediction accuracy for each model is shown inFig. 7. A typical fingerprint region of infrared measurement isloosely defined to be between ~ 1600 and 1500 cm−1 to500 cm−1 [13, 36]. To avoid confusion to readers, in thispaper, the fingerprint region is referring to spectral range with-in 1500–1000 cm−1 inclusive. At this part of the analysis, nocomputational correction of Mie scattering is applied.
Figure 7 shows that overall prediction accuracy is higherfor data in cluster 2, region of higher lipid absorbance, thancluster 1. A comparison of the performance of measurementswith and without correcting lens can be achieved by analysingcluster 2, which reveals that apart from model 1 and model 4,the measurements with correcting lens, despite its ability tominimise Mie scattering at the edges of the tissues, generallyunderperform compared with measurements without theadded lens. The lowest accuracy of cluster 2 prediction isobtained frommodel 3 with added lens. This is because whilstthe added lens approach removes the scattering effect and thusimproves the quality of amide I band, the spectra collected inthe range of 1100–1000 cm−1 suffer from enhanced noise,which is not an issue with computational approach. This hap-pens because the additional stacking of lens on top of the CaF2substrate (from the way the correcting lens is set-up) reducesthe throughput of light. Due to the lower photon counts thatpass through the sample and the fact that CaF2 has a cut-off at~ 900 cm−1 in transmission, the spectral quality in the lowwavenumber region deteriorates significantly compared withthe set-up without correcting lens.
Model 2 (with lens) gives a slightly better performancewhen amide bands are factored into consideration as addedlens is shown to improve the absorbance of the spectral bandof amide I. Model 4 which considers the data exclusively fromthe lipid region is undeterred by the noise introduced by theextra lens configuration and model 1 which takes into consid-eration all the spectral regions shows similar performance withand without additional lens, for reasons discussed above.Instead of CaF2, a pseudo-hemispherical ZnS lens with infra-red cut-off at ~ 700 cm−1 was suggested to improve the spec-tral quality [20]. However, Mie scattering correction does notplay a significant role in optimising the performance of thesupervised learning, reinforced by the finding that the highestprediction accuracy of 92.7% can be achieved with model 3(fingerprint region). In other words, the second derivativespectral data within 1500–1000 cm−1 from cluster of highlipid absorbance region alone is sufficient to achieve effectivediscrimination of all the different grades of colon cancer as thefingerprint region is least affected by Mie scattering. The in-terference of the water vapour spectra within this region is alsominimal (as shown in ESM Fig. S5). Therefore, removal ofMie scattering effect is not necessary as the amide spectralrange (1700–1500 cm−1) does not need to be included in dataanalysis at all, as demonstrated here.
On the other hand, model 4 gives the lowest predictionaccuracy; this infers that lipid spectral region (or high wave-number region) alone is not reliable for supervised training ofthe classification model in the study of colon biopsy.Nevertheless, the possibility of classifying between normaland cancer state of a biopsy, without classification of thestages of disease, based solely on the lipid region is not ruled
Fig. 7 The bar chart shows the overall prediction accuracy in percentage of various models for measurement with and without correcting lens (andwithout computational correction for Mie scattering effect) for cluster 1 of low lipid absorbance and cluster 2 of high lipid absorbance
Fourier transform infrared spectroscopic imaging of colon tissues: evaluating the significance of amide I... 6977
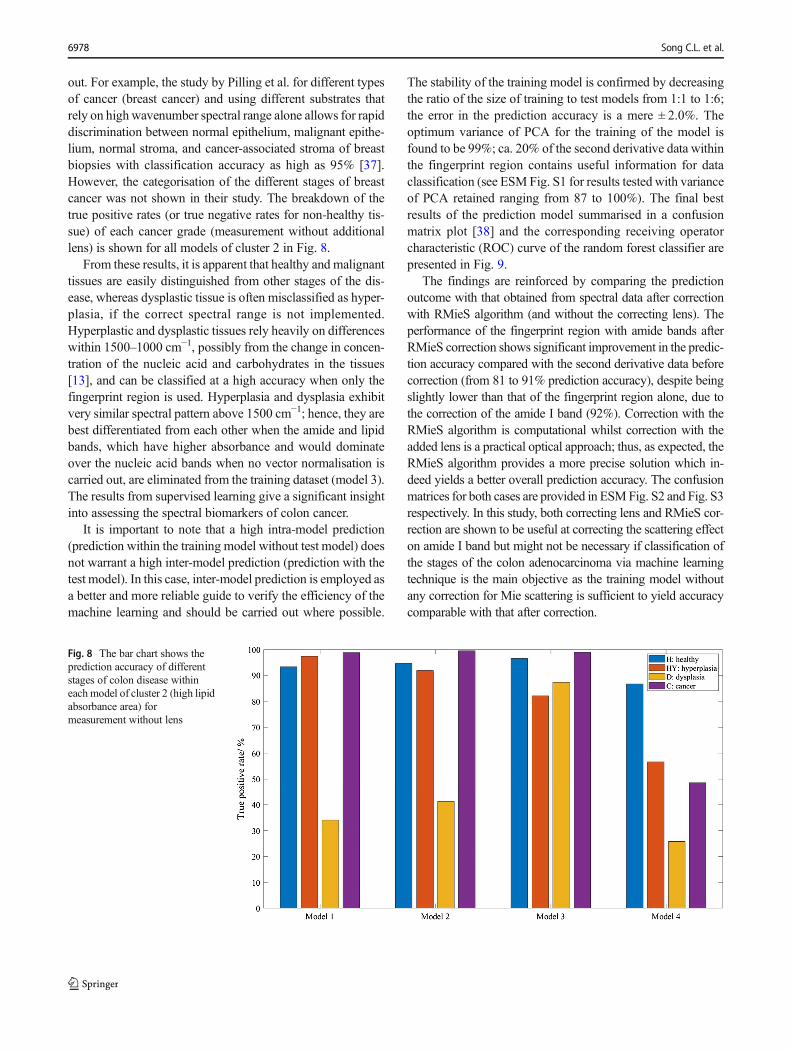
out. For example, the study by Pilling et al. for different typesof cancer (breast cancer) and using different substrates thatrely on highwavenumber spectral range alone allows for rapiddiscrimination between normal epithelium, malignant epithe-lium, normal stroma, and cancer-associated stroma of breastbiopsies with classification accuracy as high as 95% [37].However, the categorisation of the different stages of breastcancer was not shown in their study. The breakdown of thetrue positive rates (or true negative rates for non-healthy tis-sue) of each cancer grade (measurement without additionallens) is shown for all models of cluster 2 in Fig. 8.
From these results, it is apparent that healthy and malignanttissues are easily distinguished from other stages of the dis-ease, whereas dysplastic tissue is often misclassified as hyper-plasia, if the correct spectral range is not implemented.Hyperplastic and dysplastic tissues rely heavily on differenceswithin 1500–1000 cm−1, possibly from the change in concen-tration of the nucleic acid and carbohydrates in the tissues[13], and can be classified at a high accuracy when only thefingerprint region is used. Hyperplasia and dysplasia exhibitvery similar spectral pattern above 1500 cm−1; hence, they arebest differentiated from each other when the amide and lipidbands, which have higher absorbance and would dominateover the nucleic acid bands when no vector normalisation iscarried out, are eliminated from the training dataset (model 3).The results from supervised learning give a significant insightinto assessing the spectral biomarkers of colon cancer.
It is important to note that a high intra-model prediction(prediction within the training model without test model) doesnot warrant a high inter-model prediction (prediction with thetest model). In this case, inter-model prediction is employed asa better and more reliable guide to verify the efficiency of themachine learning and should be carried out where possible.
The stability of the training model is confirmed by decreasingthe ratio of the size of training to test models from 1:1 to 1:6;the error in the prediction accuracy is a mere ± 2.0%. Theoptimum variance of PCA for the training of the model isfound to be 99%; ca. 20% of the second derivative data withinthe fingerprint region contains useful information for dataclassification (see ESMFig. S1 for results tested with varianceof PCA retained ranging from 87 to 100%). The final bestresults of the prediction model summarised in a confusionmatrix plot [38] and the corresponding receiving operatorcharacteristic (ROC) curve of the random forest classifier arepresented in Fig. 9.
The findings are reinforced by comparing the predictionoutcome with that obtained from spectral data after correctionwith RMieS algorithm (and without the correcting lens). Theperformance of the fingerprint region with amide bands afterRMieS correction shows significant improvement in the predic-tion accuracy compared with the second derivative data beforecorrection (from 81 to 91% prediction accuracy), despite beingslightly lower than that of the fingerprint region alone, due tothe correction of the amide I band (92%). Correction with theRMieS algorithm is computational whilst correction with theadded lens is a practical optical approach; thus, as expected, theRMieS algorithm provides a more precise solution which in-deed yields a better overall prediction accuracy. The confusionmatrices for both cases are provided in ESMFig. S2 and Fig. S3respectively. In this study, both correcting lens and RMieS cor-rection are shown to be useful at correcting the scattering effecton amide I band but might not be necessary if classification ofthe stages of the colon adenocarcinoma via machine learningtechnique is the main objective as the training model withoutany correction for Mie scattering is sufficient to yield accuracycomparable with that after correction.
Fig. 8 The bar chart shows theprediction accuracy of differentstages of colon disease withineach model of cluster 2 (high lipidabsorbance area) formeasurement without lens
Song C.L. et al.6978

Conclusion and outlook
Spectral data of colon biopsies obtained with a correctinglens for FTIR imaging show a significant reduction inspectral aberrations due to inhibiting Mie scattering, aswas shown in our studies with other types of cancer tis-sues. Optical modification of the FTIR spectroscopic im-aging with a CaF2 correcting lens has the advantage thatthe Mie scattering correction algorithm does not need tobe performed. However, for this study the correction ef-fect was not as good compared to the computational meth-od. Here, we report the insignificance of the role of amideI band in machine learning for the first time. Importantly,the findings show that the disease states can be distin-guished without resorting to the correction of Mie scatter-ing effect. By using K-means clustering and RF classifierwith PCA reduction, our work has demonstrated that op-timisation of the training model by refining the selectedrange of FTIR spectral data can alter the predictionoutcome.
The novelty of this work showed that the best predictionoutcome for the studied colon biopsy samples were obtainedwhen unsupervised learning of the C-H stretching bands iscoupled with supervised learning of the spectral region be-tween 1500-1000 cm-1. Hence, whilst the C-H stretching re-gion is useful for intra-tissue segmentation, only the spectralrange of 1500–1000 cm−1 is important for supervised machine
learning. The amide I band can be excluded from data analysisaltogether, as evidenced in the Gini indices obtained in thiswork. In addition, reliance on the C-H stretching spectral re-gion (3000–2800 cm−1) alone in supervised learning gives theworst prediction. This exploratory study involving a manage-able number of datasets successfully highlights the extractionof the most meaningful parts of the spectral data, which sets aframework for further validation of the predictive ability of amore sophisticated deep learning model in future work.
To summarise, further application of this method toan unknown colon biopsy sample is straightforward andpotentially fully automated with simple programming.Initial K-means clustering (with the number of clustersset to two) on the C-H stretching bands alone will pickup regions of high lipid absorbance which will subse-quently be fed into the already trained RF model thatpredicts the outcome of the malignancy stage of thespecimen. The findings, though significant, are limitedto FTIR spectroscopic imaging of the colon biopsy.Furthermore, Mie scattering is more pronounced insingle-cell imaging than tissue; the results of this studyare strictly limited to differentiation of disease progres-sion in colon tissue specimens.
Acknowledgements We thank Prof. Peter Gardner (University ofManchester, UK) for providing us with the RMieS–EMSC algorithm[24] for correction of Mie scattering in this study.
Fig. 9 a The confusion matrix plot (MATLAB R2018b) shows the bestresult that can be obtained from the fingerprint region of the spectral datawith model 3 (C, cancer; D, dysplasia; H, healthy; HY, hyperplasia). Therows show the predicted class and the columns represent the true class.The diagonal cells correspond to correctly classified observations, whilstthe off-diagonal cells correspond to observations that are incorrectly clas-sified. Both the number of observations and the percentage of the totalnumber of observations are shown in each cell. The column on the right ofthe plot shows the percentages of all the examples predicted to belong to
each class that are correctly and incorrectly classified. The row at thebottom of the plot shows the percentages of all the examples belongingto each class that are correctly and incorrectly classified. Overall accuracyof the prediction of the classifier model is given in the cell in the bottomright of the plot. b The ROC curve illustrates the diagnostic ability of theclassifier system. The area under the curve (AUC) is ~ 1.0, which corre-sponds to a perfect classifier for the data in this study to distinguishbetween diseases
Fourier transform infrared spectroscopic imaging of colon tissues: evaluating the significance of amide I... 6979

Compliance with ethical standards The Research EthicsCode for the colon polyp is 14/EE/0024 and was approved by ImperialCollege London Research and Ethics Committee.
Conflict of interest The authors declare that they have no conflict ofinterest.
Open Access This article is distributed under the terms of the CreativeCommons At t r ibut ion 4 .0 In te rna t ional License (h t tp : / /creativecommons.org/licenses/by/4.0/), which permits unrestricted use,distribution, and reproduction in any medium, provided you giveappropriate credit to the original author(s) and the source, provide a linkto the Creative Commons license, and indicate if changes were made.
References
1. Tests to Detect Colorectal Cancer and Polyps [Internet]. NationalCancer Institute. 2016 [cited 2019 Jan 8]. Available from: https://www.cancer.gov/types/colorectal/screening-fact-sheet
2. Bowel cancer statistics [Internet]. Cancer Research UK. 2015 [cited2019 Jan 8]. Available from: https://www.cancerresearchuk.org/health-professional/cancer-statistics/statistics-by-cancer-type/bowel-cancer
3. Barlev E, Zelig U, Bar O, Segev C, Mordechai S, Kapelushnik J, etal. A novel method for screening colorectal cancer by infrared spec-troscopy of peripheral blood mononuclear cells and plasma. JGastroenterol. 2016;51(3):214–21.
4. Hermes M, Morrish RB, Huot L, Meng L, Junaid S, Tomko J, et al.Mid-IR hyperspectral imaging for label-free histopathology andcytology. J Opt. 2018;20(2):023002.
5. Li Q, Hao C, Kang X, Zhang J, Sun X, Wang W, et al. ColorectalCancer and Colitis Diagnosis Using Fourier Transform InfraredSpectroscopy and an Improved K-Nearest-Neighbour Classifier.Sensors [Internet]. 2017;17(12). Available from: https://www.ncbi.nlm.nih.gov/pmc/articles/PMC5750796/
6. Li Q-B, Xu Z, Zhang N-W, Zhang L, Wang F, Yang L-M, et al. Invivo and in situ detection of colorectal cancer using Fourier trans-form infrared spectroscopy. World J Gastroenterol: WJG.2005;11(3):327–30.
7. Bassan P, Byrne HJ, Bonnier F, Lee J, Dumas P, Gardner P.Resonant Mie scattering in infrared spectroscopy of biological ma-terials – understanding the ‘dispersion artefact’. Analyst.2009;134(8):1586.
8. Bassan P, Byrne HJ, Lee J, Bonnier F, Clarke C, Dumas P, et al.Reflection contributions to the dispersion artefact in FTIR spectraof single biological cells. Analyst. 2009;134(6):1171.
9. Kimber JA, Kazarian SG. Spectroscopic imaging of biomaterialsand biological systems with FTIR microscopy or with quantumcascade lasers. Anal Bioanal Chem. 2017;409(25):5813–20.
10. Chan KLA, Kazarian SG. Aberration-free FTIR spectroscopic im-aging of live cells in microfluidic devices. Analyst. 2013;138(14):4040.
11. Sroka-Bartnicka A, Kimber JA, Borkowski L, Pawlowska M,Polkowska I, Kalisz G, et al. The biocompatibility of carbon hy-droxyapatite/β-glucan composite for bone tissue engineering stud-ied with Raman and FTIR spectroscopic imaging. Anal BioanalChem. 2015;407(25):7775–85.
12. Chan KLA, Kazarian SG. Correcting the Effect of Refraction andDispersion of Light in FT-IR Spectroscopic Imaging inTransmission through Thick Infrared Windows. Anal Chem.2013;85(2):1029–36.
13. Baker MJ, Trevisan J, Bassan P, Bhargava R, Butler HJ, DorlingKM, et al. Using Fourier transform IR spectroscopy to analyzebiological materials. Nat Protoc. 2014 Aug;9(8):1771–91.
14. Baker MJ, Byrne HJ, Chalmers J, Gardner P, Goodacre R,Henderson A, et al. Clinical applications of infrared and Ramanspectroscopy: state of play and future challenges. Analyst.2018;143(8):1735–57.
15. GoughKM, Leblond F. Optical diagnosis – highlighting the clinicalapplications of vibrational spectroscopy. Analyst. 2017;142(8):1177–8.
16. Bruun SW, Kohler A, Adt I, SockalingumGD,Manfait M,MartensH. Correcting Attenuated Total Reflection—Fourier TransformInfrared Spectra for Water Vapor and Carbon Dioxide. ApplSpectrosc. 2006;60(9):1029–39.
17. Goodacre R. Explanatory analysis of spectroscopic data using ma-chine learning of simple, interpretable rules. Vib Spectrosc.2003;32(1):33–45.
18. Song CL, Ryu M, Morikawa J, Kothari A, Kazarian SG. Thermaleffect on dispersive infrared spectroscopic imaging of prostate can-cer tissue. J Biophotonics. 2018;11(12):e201800187.
19. Song CL, Kazarian SG. Three-dimensional depth profiling of pros-tate tissue bymicro ATR-FTIR spectroscopic imagingwith variableangles of incidence. Analyst. 2019;144(9):2954–64.
20. Kimber JA, Foreman L, Turner B, Rich P, Kazarian SG. FTIRspectroscopic imaging and mapping with correcting lenses for stud-ies of biological cells and tissues. Faraday Discuss. 2016;187:69–85.
21. Berisha S, Lotfollahi M, Jahanipour J, Gurcan I, Walsh M,Bhargava R, et al. Deep learning for FTIR histology: leveragingspatial and spectral features with convolutional neural networks.Analyst. 2019;144(5):1642–53.
22. Breiman L. Random Forests. Mach Learn. 2001;45(1):5–32.23. Chen H, Lin Z, Wu H, Wang L, Wu T, Tan C. Diagnosis of colo-
rectal cancer by near-infrared optical fiber spectroscopy and ran-dom forest. Spectrochim Acta A Mol Biomol Spectrosc. 2015;135:185–91.
24. Bassan P, Kohler A, Martens H, Lee J, Byrne HJ, Dumas P, et al.Resonant Mie Scattering (RMieS) correction of infrared spectrafrom highly scattering biological samples. Analyst. 2010;135(2):268–77.
25. Kohler A, Sulé-Suso J, Sockalingum GD, Tobin M, Bahrami F,Yang Y, et al. Estimating and Correcting Mie Scattering inSynchrotron-Based Microscopic Fourier Transform InfraredSpectra by Extended Multiplicative Signal Correction. ApplSpectrosc. 2008;62(3):259–66.
26. Martens H, Stark E. Extended multiplicative signal correction andspectral interference subtraction: New preprocessing methods fornear infrared spectroscopy. J Pharm Biomed Anal. 1991;9(8):625–35.
27. Menze BH, Kelm BM, Masuch R, Himmelreich U, Bachert P,Petrich W, et al. A comparison of random forest and its Gini im-portance with standard chemometric methods for the feature selec-tion and classification of spectral data. BMC Bioinformatics.2009;10(1):213.
28. Movasaghi Z, Rehman S. ur Rehman DrI. Fourier TransformInfrared (FTIR) Spectroscopy of Biological Tissues. ApplSpectrosc Rev. 2008;43(2):134–79.
29. Li S, Chen G, Zhang Y, Guo Z, Liu Z, Xu J, et al. Identification andcharacterization of colorectal cancer using Raman spectroscopy andfeature selection techniques. Opt Express. 2014;22(21):25895.
30. Bansil R, Turner BS. The biology of mucus: Composition, synthe-sis and organization. Adv Drug Deliv Rev. 2018;124:3–15.
31. Kuepper C, Großerueschkamp F, Kallenbach-Thieltges A, MosigA, Tannapfel A, Gerwert K. Label-free classification of colon can-cer grading using infrared spectral histopathology. Faraday Discuss.2016;187:105–18.
Song C.L. et al.6980

32. Lasch P, Haensch W, Naumann D, Diem M. Imaging of colorectaladenocarcinoma using FT-IR microspectroscopy and cluster analy-sis. Biochim Biophys Acta (BBA) - Mol Basis Dis. 2004;1688(2):176–86.
33. Bassan P, Mellor J, Shapiro J, Williams KJ, Lisanti MP, Gardner P.Transmission FT-IR Chemical Imaging on Glass Substrates:Applications in Infrared Spectral Histopathology. Anal Chem.2014;86(3):1648–53.
34. Smith BR, Ashton KM, Brodbelt A, Dawson T, Jenkinson MD,Hunt NT, et al. Combining random forest and 2D correlation anal-ysis to identify serum spectral signatures for neuro-oncology.Analyst. 2016;141(12):3668–78.
35. Balbekova A, Lohninger H, van Tilborg GAF, Dijkhuizen RM,Bonta M, Limbeck A, et al. Fourier Transform Infrared (FT-IR)and Laser Ablation Inductively Coupled Plasma–MassSpectrometry (LA-ICP-MS) Imaging of Cerebral Ischemia:
Combined Analysis of Rat Brain Thin Cuts Toward ImprovedTissue Classification. Appl Spectrosc. 2018;72(2):241–50.
36. Stuart BH. Infrared Spectroscopy: Fundamentals and Applications:Stuart/Infrared Spectroscopy: Fundamentals and Applications[Internet]. Chichester, UK: John Wiley & Sons, Ltd; 2004 [cited2019 Feb 11]. (Analytical Techniques in the Sciences). Availablefrom: http://doi.wiley.com/10.1002/0470011149
37. Pilling MJ, Henderson A, Shanks JH, Brown MD, Clarke NW,Gardner P. Infrared spectral histopathology using haematoxylinand eosin (H&E) stained glass slides: a major step forward towardsclinical translation. Analyst. 2017;142(8):1258–68.
38. MATLAB Statistics and Machine Learning Toolbox Release2018b, The MathWorks, Inc., Natick, Massachusetts, UnitedStates.
Fourier transform infrared spectroscopic imaging of colon tissues: evaluating the significance of amide I... 6981