fourth five-year review report for the a. o. polymer site
TRANSCRIPT
FOURTH FIVE-YEAR REVIEW REPORT FORA.O. POLYMER SUPERFUND SITESUSSEX COUNTY, NEW JERSEY
Prepared by
U.S. Environmental Protection AgencyRegion 2
New York, New York
.-'"
-_J_~-~~---~-d---~).~Date
534014
1111111111111111111111111111111111111111

1
Table of Contents LIST OF ABBREVIATIONS & ACRONYMS ......................................................................................... 2 I. INTRODUCTION ................................................................................................................................... 3
FIVE-YEAR REVIEW SUMMARY FORM ......................................................................................... 4 II. RESPONSE ACTION SUMMARY ...................................................................................................... 5
Basis for Taking Action .......................................................................................................................... 5 Response Actions .................................................................................................................................... 6 Status of Implementation ........................................................................................................................ 6 IC Summary Table .................................................................................................................................. 7 Systems Operations/Operation & Maintenance ...................................................................................... 7
III. PROGRESS SINCE THE LAST REVIEW ......................................................................................... 8 IV. FIVE-YEAR REVIEW PROCESS ...................................................................................................... 9
Community Notification, Involvement & Site Interviews ...................................................................... 9 Data Review ............................................................................................................................................ 9 Site Inspection ....................................................................................................................................... 11
V. TECHNICAL ASSESSMENT ............................................................................................................ 11 QUESTION B: Are the exposure assumptions, toxicity data, cleanup levels, and remedial action objectives (RAOs) used at the time of the remedy selection still valid? .............................................. 12 QUESTION C: Has any other information come to light that could call into question the protectiveness of the remedy? ............................................................................................................... 13
VI. ISSUES/RECOMMENDATIONS ..................................................................................................... 13 VII. PROTECTIVENESS STATEMENT ................................................................................................ 13 VIII. NEXT REVIEW .............................................................................................................................. 14 APPENDIX A – CHRONOLOGY OF EVENTS .................................................................................... 15 APPENDIX B – REFERENCE LIST ....................................................................................................... 16 APPENDIX C - TABLES ......................................................................................................................... 17 APPENDIX D - FIGURES ....................................................................................................................... 18

2
LIST OF ABBREVIATIONS & ACRONYMS 1,1-DCA 1,1-dichloroethane 1,1-DCE 1,1-dichloroethene 1,1,1-TCA 1,1,1-trichloroethane 1,2-DCE 1,2-dichloroethene ARAR Applicable or Relevant and Appropriate Requirement CEA Classification Exception Area CERCLA Comprehensive Environmental Response, Compensation, and Liability Act CFR Code of Federal Regulations CIS-1,2-DCE Cis-1,2-dichloroethene COC Contaminant of Concern CWs Compliance Wells EPA United States Environmental Protection Agency ESD Explanation of Significant Differences FID Flame Ionization Detector FYR Five-Year Review GPM Gallons Per Minute HHRA Human Health Risk Assessment ICs Institutional Controls ISTR In-Situ Thermal Remediation MCLs Maximum Contaminant Limits NCP National Oil and Hazardous Substances Pollution Contingency Plan NJDEP New Jersey Department of Environmental Protection NJGWQS New Jersey Groundwater Quality Standards NPL National Priorities List OU Operable Unit O&M Operation and Maintenance PRP Potentially Responsible Party RAOs Remedial Action Objectives RD/RA Remedial Design/Remedial Action RI/FS Remedial Investigation/Feasibility Study ROD Record of Decision RME Reasonable Maximum Exposure RPM Remedial Project Manager SVE Soil Vapor Extraction SVI Soil Vapor Intrusion SVOCs Semi-Volatile Organic Compounds TBC To be considered TCE Trichloroethene UAO Unilateral Administrative Order UU/UE Unlimited Use/Unrestricted Exposure VISLs Vapor Intrusion Screening Levels VOCs Volatile Organic Compounds WRA Well Restriction Area

3
I. INTRODUCTION The purpose of a five-year review (FYR) is to evaluate the implementation and performance of a remedy in order to determine if the remedy is and will continue to be protective of human health and the environment. The methods, findings, and conclusions of reviews are documented in FYR reports such as this one. In addition, FYR reports identify issues found during the review, if any, and document recommendations to address them. The U.S. Environmental Protection Agency (EPA) is preparing this FYR review pursuant to the Comprehensive Environmental Response, Compensation, and Liability Act (CERCLA) Section 121, consistent with the National Contingency Plan (NCP) (40 CFR Section 300.430(f)(4)(ii)), and considering EPA policy. This is the fourth FYR for the A.O. Polymer Superfund Site. The triggering action for this policy review is the completion date of the previous FYR. The FYR has been prepared due to the fact that the remedial action will not leave hazardous substances, pollutants, or contaminants on site above levels that allow for unlimited use and unrestricted exposure, but requires five or more years to complete. The Site consists of two OUs, and two OUs will be addressed in this FYR. OU1 addresses subsurface soil contamination above the groundwater table in the former waste lagoon area, and OU2 addresses the groundwater contamination at the Site. The A.O. Polymer Superfund Site FYR was led by Brittany Hotzler, EPA Remedial Project Manager. Participants included Rich Puvogel, EPA Section Chief, Katherine Ryan Mishkin, EPA Hydrogeologist, Julie McPherson, EPA Human Health Risk Assessor, and Pat Seppi, EPA Community Involvement Coordinator. The potentially responsible party (PRP) was notified of the initiation of the five-year review. The review began on 10/2/17. Site Background The A.O. Polymer Superfund Site, located at 44 Station Road in the Township of Sparta, Sussex County, New Jersey, is the location of a former manufacturing facility. The Site, at the time of listing on the National Priorities List (NPL), occupied approximately 4.18 acres near the Sparta Rail Road Station, along the New York, Susquehanna and Western (NYS&W) Railway. The 4.18 acres, comprising the original area of the NPL Site, is bounded to the north and east by Station Park, a municipal recreation area, and to the southeast by Station Road. Several small businesses and three houses are located on Station Road near the Site, and the Wallkill River flows 500 feet to the southeast. The Site was located on two lots delineated by a Sussex County tax map as Block 19, Lot 45-B (3.22 acres) and Lot 45-C (0.96 acres). Lot 45-B was deleted from the NPL and Lot 45-C remains on the NPL. The Site was operated as a specialty polymer and resin manufacturing facility for approximately 30 years. Mohawk Industries began operation at the Site in the early 1960s, and was involved in the production of various resins using a polymerization process until 1978, when A.O. Polymer purchased the facility. Mohawk also engaged in the reclamation of cleaning fluids for electronic components, which contained various Freon compounds in alcohol. The Site was composed of a 3.76-acre Facility Area and a 0.42-acre Disposal Area. The Facility Area consisted of office and laboratory facilities, a main reactor building, assorted storage buildings and tanks, and a non-contact water cooling pond. The office, reactor building, lab, and tanks were used by A.O. Polymer in its manufacturing processes from 1978 until the Site was abandoned in 1994. The Disposal Area is located in the northern area of the Site, and consisted of unlined pits into which chemical wastes, primarily solvents containing volatile and semi-volatile organic compounds (VOCs) were discarded. In 1973, the first complaints of odors emanating from well water and air near the Site were registered by citizens living or working near the Site. Complaints intensified in 1978, which initiated formal investigations by the Sparta Health Department and the New Jersey Department of Environmental Protection (NJDEP). In 1978, NJDEP began investigating reports of drum stockpiling at the Site. These investigations identified on-site waste
4
disposal and storage practices as the source of groundwater contamination in residential wells. Waste handling practices included the disposal of liquid chemical waste into unlined disposal pits, improper storage of over 800 deteriorating drums, and burial of crushed and opened drums containing waste materials, including volatile and semi-volatile organic compounds (SVOCs). On September 1, 1983, the Site was placed on the National Priorities List (NPL). EPA deleted the Facility Area portion of the Site from the NPL on August 26, 2002, and it has since been developed into an office park and storage and recreation facility. As mentioned previously, the 0.42-acre Disposal Area still remains on the NPL.
FIVE-YEAR REVIEW SUMMARY FORM
SITE IDENTIFICATION
Site Name: A.O. Polymer
EPA ID: NJD030253355
Region: 2 State: NJ City/County: Sparta/Sussex
SITE STATUS
NPL Status: Final
Multiple OUs? Yes
Has the site achieved construction completion? Yes
REVIEW STATUS
Lead agency: EPA
Author name (Federal or State Project Manager): Brittany Hotzler
Author affiliation: United States Environmental Protection Agency
Review period: 10/2/2017 - 5/3/2018
Date of site inspection: 10/16/2017
Type of review: Policy
Review number: 4
Triggering action date: 11/18/2013
Due date (five years after triggering action date): 11/18/2018
5
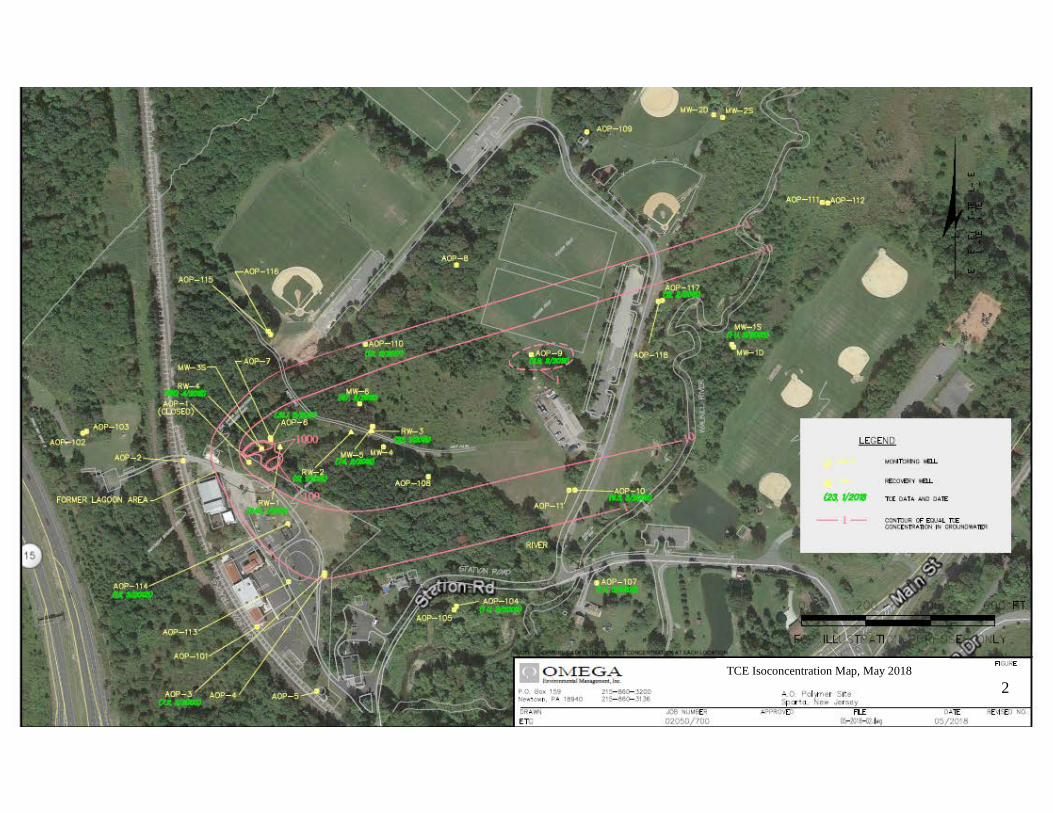
II. RESPONSE ACTION SUMMARY Basis for Taking Action Concern regarding the extent of groundwater contamination resulted in additional investigations by NJDEP. In January 1982, NJDEP’s Division of Water Resources installed 11 monitoring wells on and adjacent to the Site to determine the extent of groundwater contamination. Sampling confirmed that contamination had reached the Allentown formation, which is a source of potable water in the area. Sampling also indicated that groundwater contamination had migrated to Station Park, 300 yards north of the Site. In 1984, a remedial investigation and feasibility study (RI/FS) was initiated by NJDEP. Soil samples taken during the RI in the Disposal Area indicated residual VOC contamination, located from approximately 10 feet below ground surface down to the water table, at a depth of approximately 25 feet. At the time of the RI, the volume of contaminated soil beneath the disposal pits was estimated to be 7,500 cubic yards. After initial indications of groundwater contamination were confirmed, NJDEP expanded the RI monitoring well network to a total of 29 monitoring wells. Of the 29 monitoring wells, 15 were screened in the overburden and 14 were screened in the bedrock. The 1991 RI data defined the extent of the groundwater contamination, as shown in Figure 1. Groundwater contamination in the water table aquifer consists primarily of VOCs, including trichloroethene (TCE), cis-1,2-dichloroethene (cis-1,2-DCE), 1,1-dichloroethane (1,1-DCA), and 1,1,1-trichloroethane (1,1,1-TCA). The compounds were detected at levels above the New Jersey Groundwater Quality Standards (NJGWQS). Of the 14 bedrock monitoring wells sampled, 13 had no elevated levels of contaminants. Only one bedrock monitoring well indicated the presence of contaminants, but at significantly lower concentrations than those found in the overburden. This bedrock well is located in the top ten feet of a bedrock subsurface wall oriented southeast, with a vertical relief of more than 100 feet, and groundwater flow in this area moves from the bedrock to the overburden. Samples from bedrock monitoring wells upgradient, downgradient, and sidegradient from this position showed no detection of contaminants. The results of the human health risk assessment, conducted as part of the RI, determined that at least 60 chemicals exist in the soil and groundwater at the Site, many of which were suspected or known human carcinogens. The potential carcinogenic risk to people ingesting groundwater in the vicinity of the Site was calculated to be 4x10⁻⁴ under the RME (reasonable maximum exposure), and the hazard index, which reflects noncarcinogenic effects, exceeded 1.0, thereby exceeding EPA’s noncancer hazard threshold of 1. Residual subsurface soil contaminants that enter the groundwater eventually discharge to the wetland area and the Wallkill River. At the time of the RI, the groundwater contaminant plume was discharging to the wetland area located on the west side of the river, as well as to the river itself, as evidenced by detections of 1,1-dichloroethene (1,1-DCE) and total 1,2-dichloroethene (1,2-DCE) in surface water samples from the wetland and river. Eight surface water samples were taken during the RI from four points in the river and wetland area. Samples taken upstream from the contaminant discharge plume were consistent with background levels. It is believed that VOCs entering the Wallkill River from the contaminated groundwater are quickly attenuated by dilution, volatilization, and degradation, as reflected by the low levels that were detected in the downstream samples. An environmental assessment was conducted as part of the RI, and was limited to a qualitative evaluation of potential impacts associated with chemicals in surface water. Potential impacts associated with contamination in the surface soil, subsurface soil, and groundwater were not evaluated because either no pathways exist by which receptors could be exposed to chemicals in these media or, in the case of surface soils, due to the relatively low chemical concentrations and limited distribution of chemicals of potential concern. Potential impacts in aquatic invertebrates and amphibians were orders of magnitude below the lowest-observed-effect levels.
6
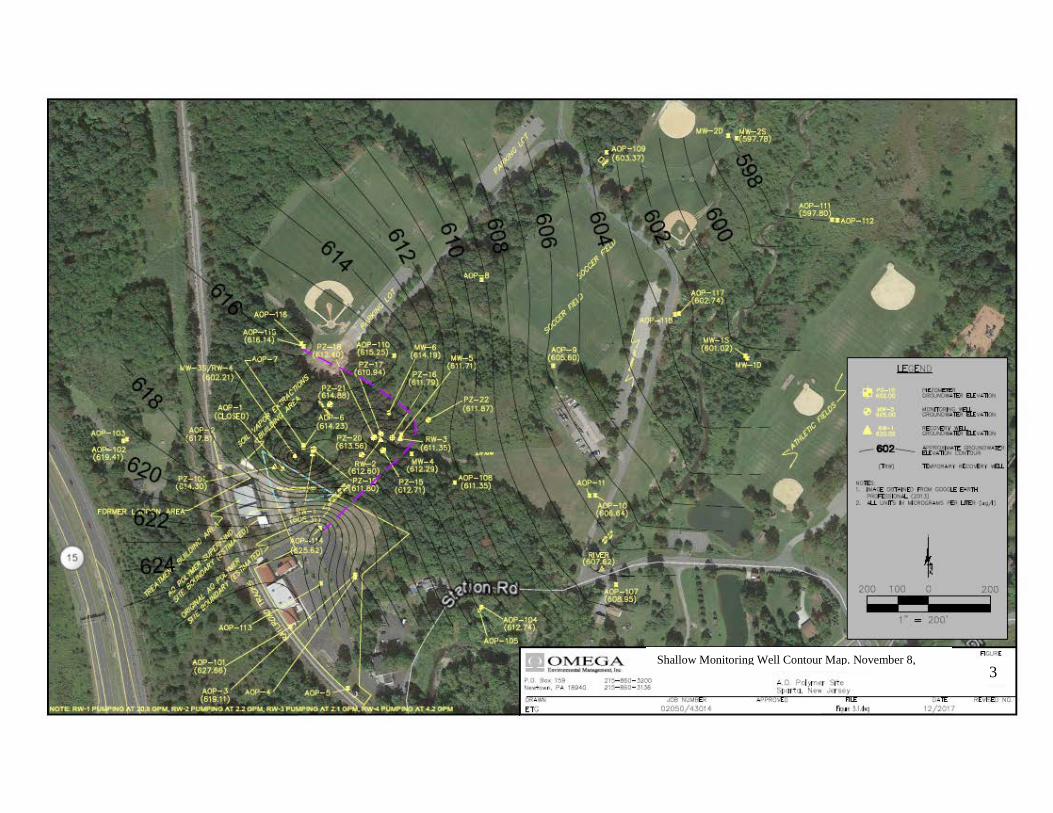
Response Actions In December 1978, NJDEP inspectors and Sparta Health Department officials collected samples from potable wells surrounding the Site. Analysis of these samples revealed VOCs in three domestic wells located on Station Road. In June 1979, the owners of the three affected wells filed damage claims with the New Jersey Hazardous Spill Fund, and in January 1980, these homes were connected to a municipal water supply. In 1980 and 1981, surficial cleanup at the Site was initiated by NJDEP, including the removal of surface drums and the excavation and removal of contaminated soil located in the Disposal Area. The Disposal Area of the Site was excavated to a depth of approximately 10 feet, and backfilled with clean soil. This cleanup resulted in the removal and off-site disposal of 1,150 drums, 1,700 cubic yards of contaminated soil, and 120 cubic yards of crushed drums and debris. In 1993, manufacturing operations ceased at the Site, and the Site was abandoned by its owner in 1994, leaving behind unsecured hazardous waste. In April 1994, EPA initiated a removal action to address the immediate environmental hazards posed by the abandoned facility. During EPA’s removal activities, 121 cubic yards of soil, 91 cubic yards of asbestos-containing materials, 34,000 pounds of hazardous wastes, 37,600 pounds of non-hazardous wastes, and 3,491 gallons of bulked hazardous liquids were removed from the Site. After removal activities were completed, EPA collected confirmatory soil samples to determine if any remaining areas of the Site were in need of remediation. An analysis of earlier RI/FS soil samples, and the post-removal action soil samples taken from within the Facility Area, indicated that soil in the Facility Area did not exceed New Jersey Residential Direct Contact Soil Cleanup Criteria. Based on the results of the RI/FS, EPA issued a Record of Decision (ROD) on June 28, 1991. The ROD did not have remedial action objectives (RAOs), however, the ROD stated that the selected remedy would not result in hazardous substances remaining on site above health-based levels. Therefore, the soil and groundwater remedies have goals that support unlimited use and unrestricted exposure (UU/UE). The selected remedy called for a soil vapor extraction (SVE) system to remove VOC contamination from soil in the Disposal Area, as well as a groundwater extraction and treatment system to address contaminated groundwater through a system of extraction wells and treatment utilizing a powdered activated carbon treatment system (PACT). The soil cleanup levels in the ROD are based on state soil action levels, including total VOCs at one milligram/kilogram (1 mg/kg) and total SVOCs at 10 mg/kg. Groundwater cleanup levels in the ROD are the more restrictive of federal MCLs or NJGWQS. Status of Implementation After the 1991 ROD was signed, EPA became the lead agency in charge of response activities at the Site. EPA identified PRPs and issued a unilateral administrative order (UAO) to one PRP to conduct the remedial design and remedial action (RD/RA). Design of the SVE system started on April 2, 1992, and was completed on May 11, 1994. By October 1994, construction of the SVE system was completed, and the system was operational and functional in January 1995. The groundwater treatment component of the selected remedy called for pumping the contaminated groundwater from the aquifer, treating it with a PACT system, and then returning the treated groundwater to the aquifer. Results from pump tests and groundwater modeling during design indicated that the remedy objectives would be met by installing two extraction wells, RW-1, with an expected extraction rate of approximately 40 gallons per minute (40 gpm), and RW-2, with an expected extraction rate of approximately 30 gpm. Treatability studies conducted on the PACT system showed that this treatment system could not meet the discharge limitations, and, therefore, an Explanation of Significant Differences (ESD) was issued on September 17, 1996. The ESD called for allowing the use of an air stripper to remove contaminants from groundwater and allowing surface water discharge to be implemented, instead of using groundwater reinjection. In addition, the ESD called for only the most-contaminated part of the plume to be treated via the extraction and treatment system, thereby allowing the remaining low-level contaminant concentrations outside the capture zone (Figure 3)
7
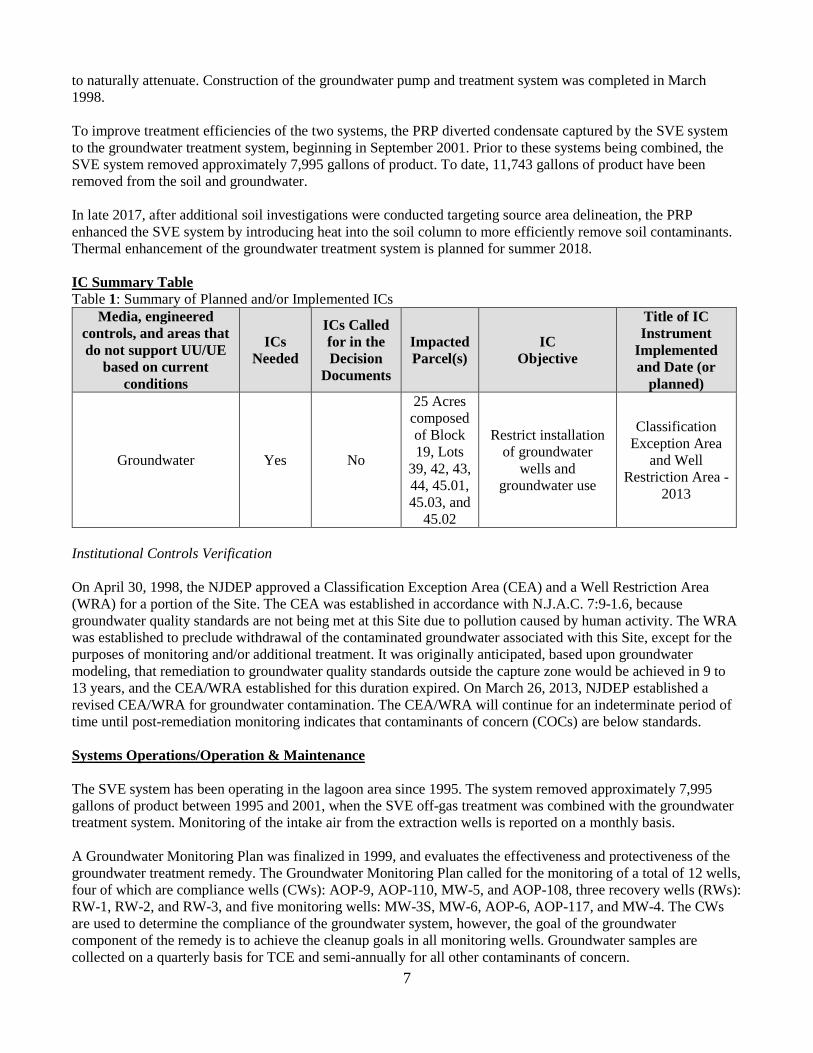
to naturally attenuate. Construction of the groundwater pump and treatment system was completed in March 1998. To improve treatment efficiencies of the two systems, the PRP diverted condensate captured by the SVE system to the groundwater treatment system, beginning in September 2001. Prior to these systems being combined, the SVE system removed approximately 7,995 gallons of product. To date, 11,743 gallons of product have been removed from the soil and groundwater. In late 2017, after additional soil investigations were conducted targeting source area delineation, the PRP enhanced the SVE system by introducing heat into the soil column to more efficiently remove soil contaminants. Thermal enhancement of the groundwater treatment system is planned for summer 2018. IC Summary Table Table 1: Summary of Planned and/or Implemented ICs
Media, engineered controls, and areas that do not support UU/UE
based on current conditions
ICs Needed
ICs Called for in the Decision
Documents
Impacted Parcel(s)
IC Objective
Title of IC Instrument
Implemented and Date (or
planned)
Groundwater Yes No
25 Acres composed of Block 19, Lots
39, 42, 43, 44, 45.01, 45.03, and
45.02
Restrict installation of groundwater
wells and groundwater use
Classification Exception Area
and Well Restriction Area -
2013
Institutional Controls Verification On April 30, 1998, the NJDEP approved a Classification Exception Area (CEA) and a Well Restriction Area (WRA) for a portion of the Site. The CEA was established in accordance with N.J.A.C. 7:9-1.6, because groundwater quality standards are not being met at this Site due to pollution caused by human activity. The WRA was established to preclude withdrawal of the contaminated groundwater associated with this Site, except for the purposes of monitoring and/or additional treatment. It was originally anticipated, based upon groundwater modeling, that remediation to groundwater quality standards outside the capture zone would be achieved in 9 to 13 years, and the CEA/WRA established for this duration expired. On March 26, 2013, NJDEP established a revised CEA/WRA for groundwater contamination. The CEA/WRA will continue for an indeterminate period of time until post-remediation monitoring indicates that contaminants of concern (COCs) are below standards. Systems Operations/Operation & Maintenance The SVE system has been operating in the lagoon area since 1995. The system removed approximately 7,995 gallons of product between 1995 and 2001, when the SVE off-gas treatment was combined with the groundwater treatment system. Monitoring of the intake air from the extraction wells is reported on a monthly basis. A Groundwater Monitoring Plan was finalized in 1999, and evaluates the effectiveness and protectiveness of the groundwater treatment remedy. The Groundwater Monitoring Plan called for the monitoring of a total of 12 wells, four of which are compliance wells (CWs): AOP-9, AOP-110, MW-5, and AOP-108, three recovery wells (RWs): RW-1, RW-2, and RW-3, and five monitoring wells: MW-3S, MW-6, AOP-6, AOP-117, and MW-4. The CWs are used to determine the compliance of the groundwater system, however, the goal of the groundwater component of the remedy is to achieve the cleanup goals in all monitoring wells. Groundwater samples are collected on a quarterly basis for TCE and semi-annually for all other contaminants of concern.

8
RW-1 achieved its expected extraction rate, however, the maximum extraction rate at RW-2 was only 10 gpm. As a result, a third recovery well, RW-3, was installed in 2002 in an attempt to increase extraction of groundwater contaminants and, therefore, increase efficiency of the capture zone. RW-3 was installed approximately 50 feet downgradient of RW-2, and produced a maximum flow rate of 17 gpm. Since beginning operation, RW-3 has averaged a maximum flow rate of 8.3 gpm. Three CWs are screened in the overburden and one is screened in the shallow bedrock. Using a model, it was estimated that with efficient capture of groundwater contamination near its source, the cleanup goals would be achieved in the CWs in 9 to 13 years. However, TCE concentrations in the CWs exceeded cleanup goals at the end of the 13-year period. In response to the data trends found in MW-3S, the PRP converted MW-3S into a recovery well in February 2012. In January 2017, RW-4 was installed immediately adjacent to MW-3S, and was designed to replace MW-3S due to its low flow rate and inability to pump continuously throughout the year. Climate Change Potential site impacts from climate change have been assessed, and the performance of the remedy is not currently at risk due to the expected effects of climate changes in the region and near the Site. III. PROGRESS SINCE THE LAST REVIEW This section includes the protectiveness determinations and statements from the last FYR as well as the recommendations from the last FYR and the current status of those recommendations.
Table 2: Protectiveness Determinations/Statements from the 2013 FYR
OU # Protectiveness Determination Protectiveness Statement
1 Protective The OU1 remedy protects human health and the environment.
2 Protective The OU2 remedy protects human health and the environment because the pump and treat system is
effectively containing the plume and no residents are exposed to contaminated groundwater.
Sitewide Protective The OU1 and OU2 remedies protect human health and the environment because the pump and treat system is effectively containing the plume and no residents are
exposed to contaminated groundwater. The last FYR did not identify any issue or make any recommendation for the protection of public health and/or the environment. During this FYR period, additional soil and groundwater investigations were completed by the PRP to refine delineation of the soil source area and groundwater plume. Additional soil sampling completed in the source area in 2015 showed that VOCs remain in the soil in three areas of the overburden at concentrations above ROD standards. In the unsaturated zone, the ROD standard of 1 ppm total VOCs in soil was achieved at seven out of twelve soil borings, and only two borings exceeded the 10 ppm ROD standard for total SVOCs. Sampling also revealed that VOC and SVOC concentrations remained elevated primarily in the numerous silt and clay layers, and that the SVE system could not effectively remediate these low permeability layers. An enhancement to the SVE system was proposed in July 2017, which included the implementation of In-situ thermal remediation (ISTR) technology to more efficiently remove soil contaminants. The SVE enhancement was implemented in late 2017, and a proposed thermal enhancement of the groundwater treatment system is planned for the summer 2018, after additional groundwater investigations have been completed.
9
Additionally, as part of the groundwater remedy, RW-4 was installed immediately adjacent to MW-3S in January 2017, and was designed to replace MW-3S due to its low flow rate and inability to pump continuously throughout the year. IV. FIVE-YEAR REVIEW PROCESS Community Notification, Involvement & Site Interviews On October 2, 2017, EPA Region 2 posted a notice on its website indicating that it would be reviewing site cleanups and remedies at 31 Superfund sites in New York and New Jersey, including the A.O. Polymer Superfund site. The announcement can be found at the following web address: https://wcms.epa.gov/sites/production/files/2017-10/documents/five_year_reviews_fy2018_final.pdf. In addition to this notification, a public notice was made available via email to the Township of Sparta on 5/21/2018, with a request that the notice be posted to the township’s website and in appropriate municipal offices. The purpose of the public notice was to inform the community about the FYR and to list where the final report will be posted. The notice also included the RPM and the CIC address and telephone numbers for questions or comments related to the FYR process or the Site. Once the FYR is completed, the results will be made available on EPA’s A.O. Polymer webpage and at the local site repositories located at the Sparta Township Library, 22 Woodport Road, Sparta, New Jersey, 07871, and at EPA Region 2, 290 Broadway, 18th Floor, New York, New York, 10007. There is daily contact between the plant operator and the PRP’s contractor, and monthly contact between EPA and the PRP’s contractor, including numerous meetings, phone calls, and correspondence. During the FYR process, EPA reached out to the Township of Sparta to conduct an interview to document any perceived problems or successes with the remedy that has been implemented to date, however, the Township did not respond to EPA’s request. Data Review Soil and SVE system In November 2017, the SVE system was enhanced with the addition of ISTR technology to more efficiently remove contaminants from the soil. Table 3 shows the most recent contaminant concentrations for the 12 SVE wells, measured prior to the implementation of the ISTR technology. Contaminant concentrations, as measured by a flame ionization detector (FID), are reported as parts per million of methane, and are indicative of the combined concentration of VOCs and SVOCs removed by the SVE system. Groundwater Well Sampling The Groundwater Monitoring Plan has been reduced, in terms of the number of monitoring wells since the early stages of groundwater monitoring, to eliminate wells that demonstrated consistent detections below applicable standards. Groundwater COCs that are relied on as indicator compounds to track groundwater cleanup progress include: TCE, cis-1,2-DCE, 1,1-DCA, and 1,1,1-TCA. Of these indicator compounds, TCE and cis-1,2-DCE are found at the highest concentrations. The wells in the sampling program during this FYR period include:
- Monitoring wells: MW-4, MW-6, AOP-6, AOP-117, MW-3S (recently converted to RW-4 in 2017) - Compliance wells: AOP-9, AOP-108, AOP-110, MW-5 - Extraction wells: RW-1, RW-2, RW-3, RW-4, RW-4

10
The groundwater pump and treat system effectively treats groundwater to below applicable standards prior to discharge in the Wallkill River, and discharge continues to meet surface water discharge permit equivalency requirements. Monitoring Wells Monitoring wells MW-4 and MW-6 were originally installed to assist in the assessment of groundwater capture. During this review period, MW-4 was sampled infrequently due to a lack of water in the well. Concentrations of TCE and cis-1,2-DCE showed a decreasing trend for the three sampling events taken in 2013 and 2014, ranging from 6.3 micrograms per liter (µg/L) to 0.81 µg/L for TCE, and 8.8 µg/L to 1.5 µg/L for cis-1,2-DCE. MW-6, located downgradient to compliance well MW-5, is also within the capture zone of the pumping system. TCE concentrations have historically decreased slowly at this well, which is consistent with the low permeability of the formation in this area. Concentrations of TCE have been decreasing more rapidly during FYR period, as shown by Figure 4, decreasing from 340 µg/L to 67 µg/L. Prior to the start of the groundwater remedy, the concentration of TCE in AOP-6, an overburden well, was 35,000 µg/L. Concentrations of VOCs in AOP-6 have declined steadily since the start of the pumping system. The most-recent concentrations of TCE in AOP-6, located within the capture zone, are below the groundwater criterion, at 0.46 µg/L. Additionally, the daughter products of TCE (cis-1,2-DCE and vinyl chloride) were non-detect in the most-recent sampling round. In contrast, the concentration of TCE in MW-3S, located 60 feet upgradient and screened at an elevation just above AOP-6, varied during this review period (290 -1,900 µg/L). AOP-117 is an overburden monitoring well located downgradient of the source area. While TCE and cis-1,2-DCE remain above NJGWQS at this well, a steady decline in their concentrations was observed within this FYR period: TCE, from 25 µg/L to 8.6 µg/L; and cis-1,2-DCE, from 64 µg/L to 11 µg/L. Overburden wells located farther downgradient to AOP-117, specifically MW-1S, and AOP-111, have historically been, and continue to be, non-detect for contaminants. Compliance Wells AOP-108, and AOP-110 are overburden wells situated within the plume boundary. During this review period, individual VOC concentrations at these monitoring wells were mostly below their respective NJ DEP GWQS, with AOP-108 as the exception. At AOP-108, TCE ranged from 55 µg/L to 12 µg/L during this review period. Contaminant concentrations in shallow bedrock well AOP-9 have also declined during the last five years for TCE, from 25 µg/L to 3.5 µg/L, and cis-1,2-DCE, from 190 µg/L to 35 µg/L. As shown by Figure 5, the concentration of TCE in AOP-9 has decreased rapidly in the past two years, and is nearing the 1 ppb NJGWQS. MW-5 is located within the capture zone of the pumping system, approximately 10 feet away from recovery well RW-3. Even though concentrations of TCE tend to fluctuate at MW-5, during this FYR period there has been a decreasing trend, as shown in Figure 6. It is hypothesized that the elevated concentrations previously seen at MW-5 were caused by contaminated groundwater that was pulled towards RW-3 (installed in December 2002). Concentrations of cis-1,2-DCE and 1,1,1-TCA have also exhibited a decreasing trend, from 240 micrograms per liter (µg/L) to non-detect for cis-1,2-DCE, and from 110 µg/L to 5.1 µg/L for 1,1,1-TCA. EPA requested additional sampling of wells not currently in the sampling program in 2003, 2010, and 2013. The wells sampled include:
• 2003: AOP-3, AOP-4, AOP-10, AOP-11, AOP-104, AOP-105, AOP-107, AOP-112, AOP-114, AOP-118, MW-1D, and MW-1S
• 2010: AOP-101 and AOP-113 • 2013: AOP-118
11
Results from the additional sampling show that VOCs were either non-detect, or not detected above NJGWQSs, sidegradient or across the Wallkill River (downgradient of the plume). Extraction Wells All four recovery wells are screened in the overburden, and sampling at these wells has focused primarily on the key COCs. MW-3S was converted to an extraction well in response to the data trends found in that well in February 2013, and in January 2017, RW-4 was installed immediately adjacent to MW-3S, and was designed to replace MW-3S due to its low flow rate and inability to pump continuously throughout the year. Since January 2017, concentrations of TCE at RW-4 have ranged from as high as 14,000 µg/L to as low as 2,400 µg/L, and concentrations of cis-1,2-DCE have ranged from as high as 500 µg/L to as low as 90 µg/L, with both contaminants showing an overall decreasing trend in concentration. Data trends for the other three extraction wells over the last five years have indicated decreasing concentration trends. RW-1, which had previously shown some of the highest concentrations for TCE at the start of the previous FYR period, showed a decrease in concentrations of both TCE and cis-1,2-DCE, from 380 µg/L to 230 µg/L for TCE, and from 69 µg/L to 50 µg/L for cis-1,2-DCE. RW-2 also demonstrated a decreasing contamination trend, with TCE from 59 µg/L to 47 µg/L, and cis-1,2-DCE from 50 µg/L to 27 µg/L. In RW-3, all constituents have shown an overall decreasing trend during the FYR process. Summary During this FYR period, additional soil sampling in the source area showed that VOC and SVOC concentrations remained elevated, and that the SVE system could not effectively remediate contaminants trapped within low permeability layers of silt and clay. An ISTR enhancement of the SVE system was implemented in late 2017, to more efficiently remove the remaining contamination from the soil source area. Currently, a number of groundwater monitoring wells in the source area remain above NJGWQS with variable trends. A number of compliance wells continue to show elevated concentrations, however, the general trend is decreasing. Concentrations in wells downgradient of the capture zone have been non-detect, indicating that the plume is not migrating. Newly installed RW-4 demonstrates the highest contaminant concentrations in the well network. All wells demonstrate a decreasing trend over the FYR period. An enhancement to the groundwater treatment system is expected in summer 2018. Site Inspection The inspection of the Site was conducted on October 16, 2017. In attendance were EPA Remedial Project Manager Brittany Hotzler, EPA Hydrogeologist Katherine Ryan Mishkin, EPA Section Chief Rich Puvogel, and John Triantafyllos, the PRP consultant from Omega Environmental Management, Inc. The purpose of the inspection was to assess the protectiveness of the remedy. V. TECHNICAL ASSESSMENT QUESTION A: Is the remedy functioning as intended by the decision documents? The enhanced SVE system is currently operational, and continues to remove contamination from the subsurface soils. The pump and treat system removes contamination from the groundwater via four recovery wells and effectively treats groundwater below applicable standards prior to discharge in the Wallkill River. The pump and treatment system is functioning as intended, since it continues to reduce the contaminant mass in groundwater. In January 2017, an additional recovery well, RW-4, was installed immediately adjacent to MW-3S. MW-3S, which had

12
been converted into a temporary recovery well in February 2013, removed a significant amount of mass despite its low flow rate and inability to pump continuously throughout the year, due to its shallow depth. RW-4 was designed to replace MW-3S and to sustain pumping throughout the year. Although the pump and treat is effectively capturing contaminant mass, concentrations of contaminants in monitoring wells within the capture zone remain elevated. Concentrations immediately outside the capture zone are an order of magnitude lower than concentrations inside the capture zone, indicative of the effectiveness of the groundwater treatment system. Concentrations in the wells downgradient of the capture zone have been non-detect, indicating that the plume is not migrating. Several of the COCs have not been detected in the past five years in the groundwater plume, however, several contaminants identified continue to exceed their respective NJGWQS (i.e., TCE and PCE) in the downgradient plume. The groundwater remedial goals have not been attained as of yet, however, the wells monitored in the plume have generally shown an overall decrease in concentrations within the past five years. AOP-117, the most downgradient well sampled, shows concentrations of contaminants that are generally below their respective NJGWQS, except for TCE. The only two contaminants that slightly exceeded their respective NJGWQS in this well are chloroform and cis-1-2 DCE, which were found to slightly exceed the screening criteria, while being within the respective acceptable cancer risk range. Currently, residents in the area are connected to the public water supply, and, although not required in a CERCLA decision document, a CEA and WRA are in place that prevents any new wells from being installed. The actions taken interrupt the exposure to groundwater as a drinking water source. QUESTION B: Are the exposure assumptions, toxicity data, cleanup levels, and remedial action objectives (RAOs) used at the time of the remedy selection still valid? Summary: Although other specific parameters may have been changed since the time the risk assessment was completed, the process that was used remains valid and is not expected to affect the remedy. The exposure assumptions, toxicity data, cleanup levels and RAOs identified for all OUs remain valid. There have been no physical changes to the Site that would adversely affect the protectiveness of the remedy. The soil remedy selected in the 1991 ROD included an SVE system and cleanup goals of 1 ppm total VOCs and 10 ppm total SVOCs. Many of the NJDEP soil cleanup standards for individual VOCs and SVOCs established after the ROD are below the ROD cleanup goals of 1 ppm total VOCs and 10 ppm total SVOCs. The soil cleanup goals chosen at the time of the ROD remain protective, as they fall within an acceptable risk range for these contaminants. Although soil and groundwater remedial actions have not yet been completed, treatment continues and exposure has been interrupted. Soil vapor intrusion (SVI) was identified as a potential exposure pathway in the last two FYRs (2007 and 2013). A comparison of the maximum detected concentrations of volatiles over the last five years, with the most protective values obtained in the Vapor Intrusion Screening Levels (VISLs), indicate that several contaminants continue to exceed their respective screening criteria. This does not indicate that a vapor intrusion exposure would occur if a building were to be erected over the plume. There is currently a building overlying the plume area where site-related COCs exceed their respective VISLs. However, this building is used for storage and is not occupied for any continued use. Due to the use of the building and limited exposure to the building interior, it is unlikely to pose a significant vapor intrusion exposure risk. In the event that additional buildings are erected over

13
the plume or the use of this building changes, additional analysis may be required. As a result, the conclusions of the vapor intrusion assessment in the previous FYRs remain valid. Although no RAOs were selected in the 1991 ROD, it was determined that remediation would be conducted to meet levels protective of human health. This remains valid. Ecological risk was evaluated as part of the human health risk assessment in the RI/FS. The findings of the ecological risk assessment remain valid, as no pathways exist by which receptors could be exposed to chemicals in the groundwater, surface water, surface soil, and subsurface soil at the Site. QUESTION C: Has any other information come to light that could call into question the protectiveness of the remedy? No. VI. ISSUES/RECOMMENDATIONS
Issues/Recommendations
OU(s) without Issues/Recommendations Identified in the Five-Year Review:
OU1, OU2 VII. PROTECTIVENESS STATEMENT
Protectiveness Statement(s)
Operable Unit: OU1
Protectiveness Determination: Protective
Planned Addendum Completion Date: N/A
Protectiveness Statement: The OU1 remedy protects human health and the environment.
Protectiveness Statement(s)
Operable Unit: OU2
Protectiveness Determination: Protective
Planned Addendum Completion Date: N/A
Protectiveness Statement: The OU2 remedy is protective of human health and the environment.
Sitewide Protectiveness Statement
Protectiveness Determination: Protective
Planned Addendum Completion Date: N/A
Protectiveness Statement: The sitewide remedies are protective of human health and the environment.
14
VIII. NEXT REVIEW The next FYR report for the A.O. Polymer Superfund Site is required five years from the completion date of this review.

15
APPENDIX A – CHRONOLOGY OF EVENTS
Event Date
Operator of the Site expands business from the manufacture of resins to include solvent reclamation 1964
Citizens living and working near the Site register first complaints of odors emanating from the Site and well water 1973
Complaints of odors and foul smelling water intensify, touching off formal investigations by the Sparta Health Department and NJDEP 1978
Owners of affected wells in the vicinity of the Site file claims to the New Jersey Hazardous Spill Fund and are subsequently connected to the municipal water supply 1979
Cleanup at the Site was initiated by NJDEP, including removal of 1,150 drums and excavation and removal of 1,700 cubic yards of contaminated soil in the Disposal Area 1980
NJDEP installed monitoring wells in and around the Site 1982
Site was placed on the National Priorities List 1983
The Remedial Investigation and Feasibility Study are initiated by NJDEP 1984
Record of Decision for soil and groundwater remedy is issued 1991
Production activities at the facility cease and the Site operator abandons unsecured hazardous material in the Facility Area of the Site 1994
Construction of the soil remediation system (soil vapor extraction) is completed and was operational and functional 1995
ESD was issued, modifying the ROD to allow the use of an air stripper in the groundwater treatment process, and discharge to surface water 1996
Construction of the groundwater treatment system was completed 1998
EPA removal activities at the Facility Area of the Site were completed, resulting in the removal of 34,000 pounds of hazardous wastes 1998
Facility Area of the Site was deleted from the NPL 2002
First Five-year Review Completed 2003
Second Five-year Review Completed 2008
Third Five-year Review Completed 2013

16
APPENDIX B – REFERENCE LIST
Remedial Investigation Report 4/1991
A.O. Polymer Record of Decision 6/1991
Pre-Design Report 12/1995
NJDEP CEA Approval Letter 4/1998
Remedial Action Report Ground Water Treatment System 9/1998
Ground Water Monitoring Plan 1/1999
A.O. Polymer Five-Year Review Report 9/2003
Grab Groundwater Sampling Letter Report 1/2005
Additional Grab Groundwater Sampling Letter Report 2/2006
Groundwater Monitoring Progress Report 5/2013
Monthly Progress Report 3/2013
Soil and Groundwater Investigation in the Lagoon Area Letter Report 12/2015
Groundwater Monitoring Progress Report 7/2017
Monthly Progress Report 7/2017

17
APPENDIX C - TABLES
TABLE 3
A.O. Polymer Site SVE System / Monthly Monitoring Report
July 2017 Concentrations are ppm as methane
Aug-16
Sept-16
Oct-16
Nov-16
Dec-16
Jan-17
Feb-17
Mar-17
Apr-17 May-17
Jun-17 Jul-17
SV-1 OFF***
OFF***
OFF***
OFF***
OFF***
OFF***
OFF***
OFF***
OFF*** OFF*** OFF*** OFF***
SV-2 OFF***
OFF***
OFF***
OFF***
OFF***
OFF***
OFF***
OFF***
OFF*** OFF*** OFF*** OFF***
SV-3 14 15 23 32 OFF***
OFF***
OFF***
4 OFF*** OFF*** OFF*** OFF***
SV-4 OFF***
OFF***
OFF***
234 11 100 78 OFF***
OFF*** 1 1 2
SV-5 OFF***
OFF***
OFF***
OFF***
OFF***
OFF***
OFF***
OFF***
OFF*** OFF*** OFF*** OFF***
SV-6 OFF***
OFF***
OFF***
OFF***
OFF***
OFF***
OFF***
OFF***
OFF*** OFF*** OFF*** OFF***
SV-7 OFF***
OFF***
OFF***
OFF***
OFF***
OFF***
OFF***
OFF***
OFF*** OFF*** OFF*** OFF***
SV-8 54 49 8 51 31 116 OFF***
48 OFF*** 1 OFF*** OFF***
SV-9 OFF***
OFF***
OFF***
OFF***
OFF***
OFF***
OFF***
OFF***
3 OFF*** OFF*** OFF***
SV-10
10 22 2 36 47 37 23 3 4 1 1 1
SV-11
OFF***
OFF***
OFF***
OFF***
OFF***
OFF***
OFF***
OFF***
OFF*** OFF*** OFF*** OFF***
SV-12
OFF***
OFF***
OFF***
OFF***
OFF***
OFF***
OFF***
OFF***
OFF*** OFF*** OFF*** OFF***
MW-3S
188 OFF***
136 109 77 1 1 1
*** Valve closed. No flow from well.

18
APPENDIX D - FIGURES

19
•• NS
-·-ER SITE
A. O. POLY~ JERSEY
SPARTA, N OR PO RATED NOLOGY INC ICt' T&E;H PITTS8'-"°" • ....
"'
ISOCONC EN K GARONER 990 'OR • .
DATE•MAY 23, _' 34
~90 -003-12 SCALE'!"• 200
TCE TOUl MAP TRATION CON
20
TCE Isoconcentration Map, May 2018 2
21
3 Shallow Monitoring Well Contour Map. November 8,

22
Figure 4
Expanded Time-Concentration Graph for MW-6, TCE

23
Figure 5
Time-Concentration Graph for TCE at AOP-9 since Aug. 2004
(ppm
)

24
Figure 6 Expanded Time-Concentration Graph for MW-5, TCE