fourth quarter 2015 earnings call - genesee & wyoming · fourth quarter 2015 earnings call...
TRANSCRIPT

1 Genesee & Wyoming Inc.
Fourth Quarter 2015 Earnings Call
February 9, 2016

2 Genesee & Wyoming Inc.
Forward-Looking Statements This presentation contains “forward-looking statements” regarding future events and the future performance of
Genesee & Wyoming Inc. that involve risks and uncertainties that could cause actual results to differ materially
from those expressed or forecasted, including, but not limited to, risks related to the operation of our railroads,
severe weather conditions and other natural occurrences, economic and market conditions (including employee
strikes or work stoppages), the credit risk of customers and counterparties, customer demand, railroad network
congestion, derailments, currency fluctuations, changes in commodity prices, increased competition in the
relevant market, and others, many of which are beyond our control. The Company refers you to the documents
that it files from time to time with the Securities and Exchange Commission, such as the Company’s Forms 10-Q
and 10-K, which contain additional important factors that could cause its actual results to differ from its current
expectations and from the forward-looking statements discussed during this presentation. Forward-looking
statements speak only as of the date of this presentation or the date they were made. Genesee & Wyoming Inc.
does not undertake, and expressly disclaims, any duty to update any forward-looking statement contained in this
presentation whether as a result of new information, future events or otherwise, except as required by law.

3 Genesee & Wyoming Inc.
G&W Safety Performance – 2015
3.04
2.80
2.112.01
1.06 1.060.93 0.91 0.91
0.51
FRAGroup 2
FRAGroup 3
Freightliner KCS Class I Avg NS BNSF UP CSX G&W *
Injury Frequency Rate per 200,000 man-hours G&W and Freightliner through December; others through November
* Excludes Freightliner

4 Genesee & Wyoming Inc.
Q4 2015 Results Versus Q4 2014
(1) Adjusted Diluted Earnings Per Common Share (EPS) is a non-GAAP financial measure. Reconciliations of non-GAAP financial measures accompany this presentation.
($ per share) Q4 2015 Q4 2014 Variance % Ex-FXDiluted EPS 1.47$ 1.53$ (0.06)$ Adjustments:Out of Period Benefit of Final Allocation of Fair Values to Freightliner's Assets & Liabilities (0.03)$ -$ (0.03)$ Business Development and Related Costs 0.03 0.02 0.01 Net Gain on Sale of Assets - (0.02) 0.02 Application of Full Year Effective Tax Rate 0.02 0.06 (0.04) Impact of Reduction in U.K. Effective Tax Rate (0.17) - (0.17) Short Line Tax Credit (0.47) (0.47) - Total Adjustments (0.62)$ (0.41)$ (0.21)$ Adjuted Diluted EPS (1) 0.85$ 1.12$ (0.27)$ (24%) (21%)
• Adjusted Diluted EPS in-line with revised Q4 2015 guidance of $0.80 - $.85(1) • Adjusted Diluted EPS of $0.85 decreased 24% (or 21%, excluding FX)(1)
• Three trends driving rail shipment weakness: i. Collapse in global commodity prices (e.g., iron ore, copper, manganese, crude oil) ii. Shift of U.S. and U.K. power generation away from coal to cheaper natural gas iii. Strong U.S. dollar impacting industrial customers (e.g., steel) as well as agricultural
products
5 Genesee & Wyoming Inc.
($ in millions, except per share amounts)Q4 2015
Actual
Original Q4 2015
Guidance (October 2015)
Variance to Mid-Point
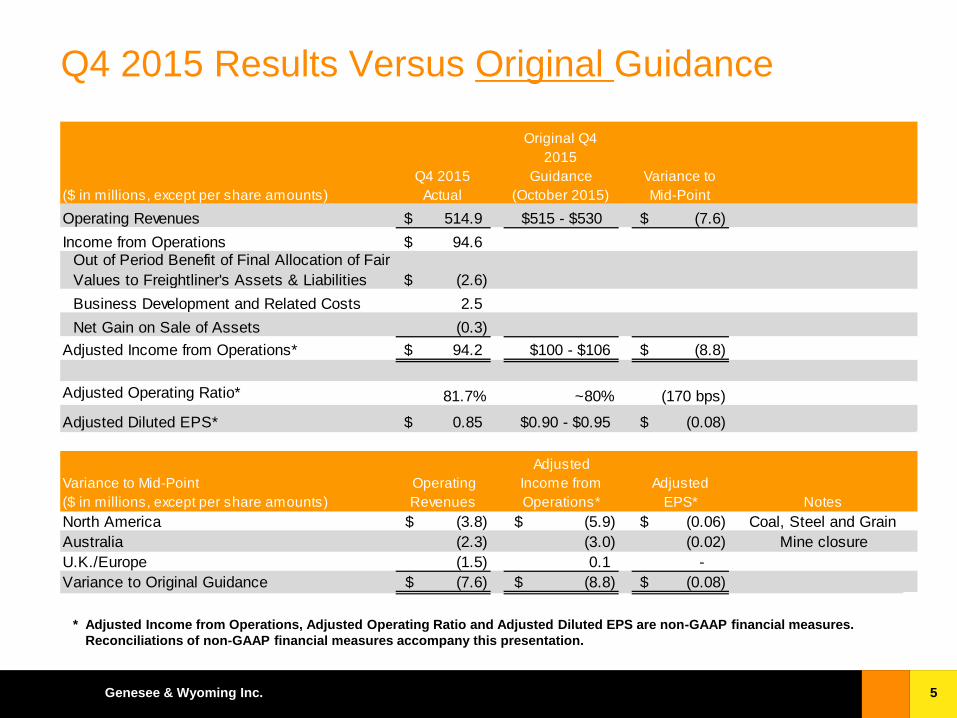
Operating Revenues 514.9$ $515 - $530 (7.6)$ Income from Operations 94.6$
Out of Period Benefit of Final Allocation of Fair Values to Freightliner's Assets & Liabilities (2.6)$ Business Development and Related Costs 2.5 Net Gain on Sale of Assets (0.3)
Adjusted Income from Operations* 94.2$ $100 - $106 (8.8)$
Adjusted Operating Ratio* 81.7% ~80% (170 bps)
Adjusted Diluted EPS* 0.85$ $0.90 - $0.95 (0.08)$
Variance to Mid-Point ($ in millions, except per share amounts)
Operating Revenues
Adjusted Income from Operations*
Adjusted EPS* Notes
North America (3.8)$ (5.9)$ (0.06)$ Coal, Steel and GrainAustralia (2.3) (3.0) (0.02) Mine closureU.K./Europe (1.5) 0.1 - Variance to Original Guidance (7.6)$ (8.8)$ (0.08)$
Q4 2015 Results Versus Original Guidance
* Adjusted Income from Operations, Adjusted Operating Ratio and Adjusted Diluted EPS are non-GAAP financial measures. Reconciliations of non-GAAP financial measures accompany this presentation.

6 Genesee & Wyoming Inc.
(US$ in millions)Q4 2015
ActualQ4 2014
Actual Change % Change% Change
(ex. FX)Same Railroad
(ex. FX)
Operating Revenues 298.6$ 338.3$ (39.7)$ (11.7%) (10.5%) (11.4%)
Income from Operations 73.2$ 90.3$ (17.1)$ (18.9%) (18.1%)
Operating Ratio 75.5% 73.3% (220 bps)
North American Operations: Q4 2015 Overview
• North American operating revenues included $3.0 million from Pinsly Arkansas
• Same railroad operating revenues (ex. FX) declined 11.4% which included: – 37% decline in coal, primarily due to competition from low priced natural gas – 23% decline in metals (steel and scrap), primarily due to competition from imported
steel • Cost reductions, including locomotives removed from service, headcount reductions
and G&A cuts have been implemented and are ongoing – ~43% incremental margin loss on lower same railroad revenue

7 Genesee & Wyoming Inc.
(US$ in millions)Q4 2015
ActualQ4 2014
Actual % Change% Change
(ex. FX)Same Railroad
(ex. FX)
Operating Revenues 55.2$ 72.4$ (23.8%) (9.4%) (28.8%)
Income from Operations 10.5$ 23.8$ (55.8%) (47.6%)
Operating Ratio 81.0% 67.2%
Australian Operations: Q4 2015 Overview
• Manganese mine ceased shipments in November 2015 • Australian operating revenues included $11.8 million from Freightliner Australia (FLA)
(freight-related revenues)
• Same Railroad Australian operating revenues (ex. FX) declined 28.8%, primarily due to lower iron ore shipments (2 fewer iron ore mines in 2015)
• Australian income from operations down 55.8%, or 47.6% ex. FX • Further cost reduction initiatives underway

8 Genesee & Wyoming Inc.
U.K./European Operations: Q4 2015 vs. Q3 2015
• U.K. coal shipments lower due to warm winter weather, high stockpiles and natural gas competition– decision made to restructure coal business in 2016
• U.K. intermodal peak season ended mid-Q4 • Income from operations seasonally weaker than Q3 2015
(US$ in millions)Q4 2015
ActualQ3 2015
Actual Variance %
Operating Revenues 161.0$ 170.7$ (9.7)$ (5.7%)
Income from Operations 10.9$ 12.0$ (1.1)$ (9.4%)
Business Development and Related Costs 0.9$
Out of Period Benefit of Final Allocation of Fair Values to Freightliner's Assets & Liabilities (2.6)$
Adjusted Income from Operations* 9.1$ 12.0$ (2.9)$ (24.0%)
Adjusted Operating Ratio* 94.3% 93.0% (130 bps)
* Adjusted Income from Operations and Adjusted Operating Ratio are non-GAAP financial measures. Reconciliations of non-GAAP financial measures accompany this presentation.

9 Genesee & Wyoming Inc.
G&W Summary Outlook for 2016
Consolidated G&W – Adjusted diluted EPS expected to decline approximately 10% (a)
– Free cash flow expected to increase approximately 10% to $285 million, prior to capital for new business investments(a)
– Deleverage from 3.7x net debt/EBITDA to 3.4x net debt/EBITDA (assuming no share repurchase or acquisitions/investments) (b)
North America Segment (80% of operating income) – Carloads down 3%; Core pricing up 3%; Operating income slightly down
– Coal revenue down 15% - 20% to $75 million - $80 million due primarily to natural gas competition
– Strong U.S. dollar continues to impede volumes due to cheaper imports (steel) and less competitive exports (paper, agricultural products)
(a) Does not reflect any impact of potential severance and restructuring related expenses in the U.K. and Australia.
(b) EBITDA is a non-GAAP financial measure. Reconciliations of non-GAAP financial measures accompany this presentation.

10 Genesee & Wyoming Inc.
G&W Summary Outlook for 2016 (cont.)
Australia Segment (11% of operating income) – Operating income down 25%(a) primarily due to lower iron ore and manganese shipments
as well as weaker currency
– Remaining iron ore exposure in Australia approximately US$44 million of revenue
– Additional cost reductions underway, coinciding with recent manganese mine closure
U.K./Europe Segment (9% of operating income) – Operating income flat(a) in 2016, with second half operating income expected to increase
15% after U.K. coal business restructured
– U.K. coal revenues down from annualized US$30 million in 2015 to approximately US$15 million in 2016; workforce restructuring complete by mid-2016 (see details next slide)
– Expected growth in aggregates and U.K. Intermodal (partial redeployment of coal equipment to serve new customer contracts; also bidding on other new business)
– Eliminating marginal routes in Freightliner’s continental Europe intermodal business
(a) Does not reflect any impact of potential severance and restructuring related expenses in the U.K. and Australia.

11 Genesee & Wyoming Inc.
Detail on Restructuring U.K. Coal Business in First Half 2016
• G&W original acquisition expectations for U.K. coal to fade by 2022 have now changed; we
expect dramatically lower coal shipments in 2016 and a need to restructure the business • Three parts of U.K. Coal Business Restructuring
1. Transition of leased locomotives to other revenue services under open access (well underway)
2. Restructure workforce (expected to be completed mid-2016)
3. Allow expiration of coal wagon leases (and/or convert some wagons for other service)
• In 2016, U.K. coal contribution forecast to be US$15 million of EBITDA lower than expected
• After U.K. workforce restructuring, annual EBITDA shortfall is US$10 million lower than expected
• Of the shortfall, US$5 million is leased equipment that we will redeploy in new service or return to lessors
(majority by 2018)
• Lost EBITDA from U.K. coal of roughly US$5 million – EBITDA originally expected to fade by 2022
• While U.K. coal business has fallen off much more rapidly than expected, replacement business is proving available in other markets to fill US$5 million gap

12 Genesee & Wyoming Inc.
Key Priorities for G&W in 2016
1. Safety - Freightliner integration to G&W safety culture
2. Strong Free Cash Flow - approximately 10% increase over 2015(a)
3. New Commercial Development (U.S., U.K., Australia, Europe)
4. U.S. Short Line Tax Credit Extension
5. Acquisitions and Investments Worldwide (weighed against intrinsic value of GWR shares)
(a) Free Cash Flow is a non-GAAP financial measure. Reconciliations of non-GAAP financial measures accompany this
presentation.

13 Genesee & Wyoming Inc.
North American Operations Operating Revenues: Q4 2015 vs. Q4 2014 ($ millions)
($39.7)
(11.7%)
14 Genesee & Wyoming Inc.
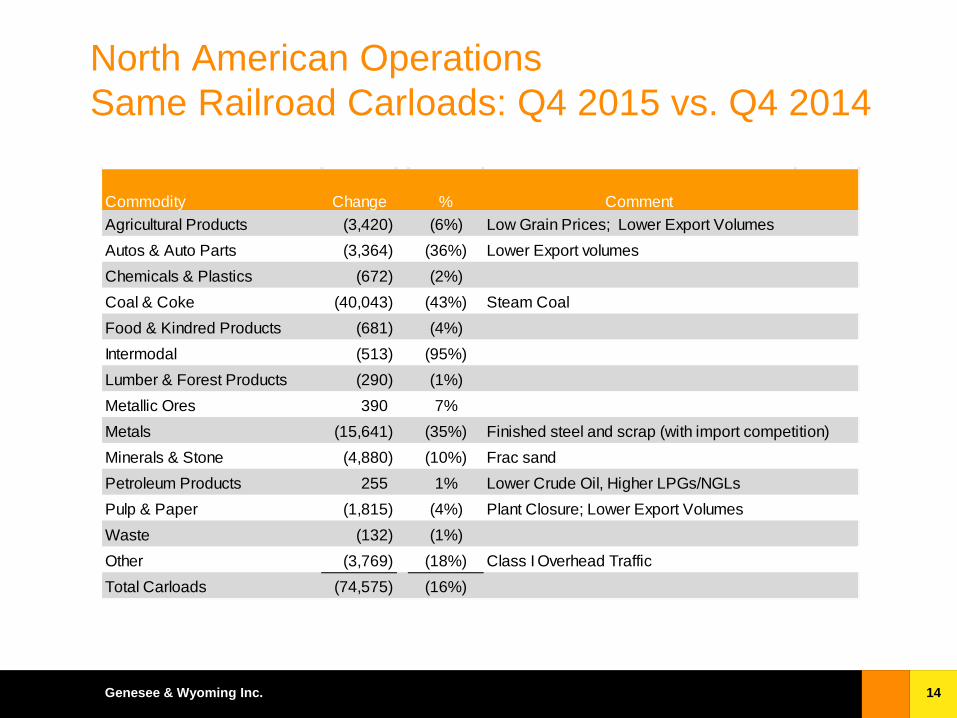
North American Operations Same Railroad Carloads: Q4 2015 vs. Q4 2014
Commodity Change % CommentAgricultural Products (3,420) (6%) Low Grain Prices; Lower Export VolumesAutos & Auto Parts (3,364) (36%) Lower Export volumesChemicals & Plastics (672) (2%)Coal & Coke (40,043) (43%) Steam CoalFood & Kindred Products (681) (4%)Intermodal (513) (95%)Lumber & Forest Products (290) (1%)Metallic Ores 390 7%Metals (15,641) (35%) Finished steel and scrap (with import competition) Minerals & Stone (4,880) (10%) Frac sandPetroleum Products 255 1% Lower Crude Oil, Higher LPGs/NGLsPulp & Paper (1,815) (4%) Plant Closure; Lower Export VolumesWaste (132) (1%)Other (3,769) (18%) Class I Overhead TrafficTotal Carloads (74,575) (16%)

15 Genesee & Wyoming Inc.
North American Operations Same Railroad Freight Revenues Average Revenues Per Carload
Q4 2015 Q4 2014 Change
Average Revenues Per Carload $588 $569 3.3%
Changes in Commodity Mix (a) 2.6%
Fuel Surcharge (6.1%)
FX (Depreciation of C$) (1.1%)
Average Revenues Per Carload (excl. Mix, Fuel, FX) (b)(c) 7.9%
(a) Changes in Commodity Mix illustrates changes between commodity groups, not within a commodity group
(b) Average Revenues per Carload impacted by changes in customer mix in Other (Class I Overhead Traffic) and Metals commodity groups
(c) North American same railroad core pricing increased approximately 3.5%

16 Genesee & Wyoming Inc.
Australian Operations Operating Revenues: Q4 2015 vs. Q4 2014 ($ millions)
$55.2
($11.5)
($12.2)
($5.2)$11.8
$40
$50
$60
$70
$80
Q4 2014 FX Iron Ore Other FreightlinerAustralia
Q4 2015
(23.8%)
($17.2)
$72.4

17 Genesee & Wyoming Inc.
U.K./Europe Operations Operating Revenues: Q4 2015 vs. Q3 2015 ($ millions)
($3.5)
($10.7)$1.0 $3.5
$170.7
$161.0
$120
$140
$160
$180
Q3 2015 FX Intermodal Coal Other Q4 2015
(5.7%) ($9.7)
18 Genesee & Wyoming Inc.
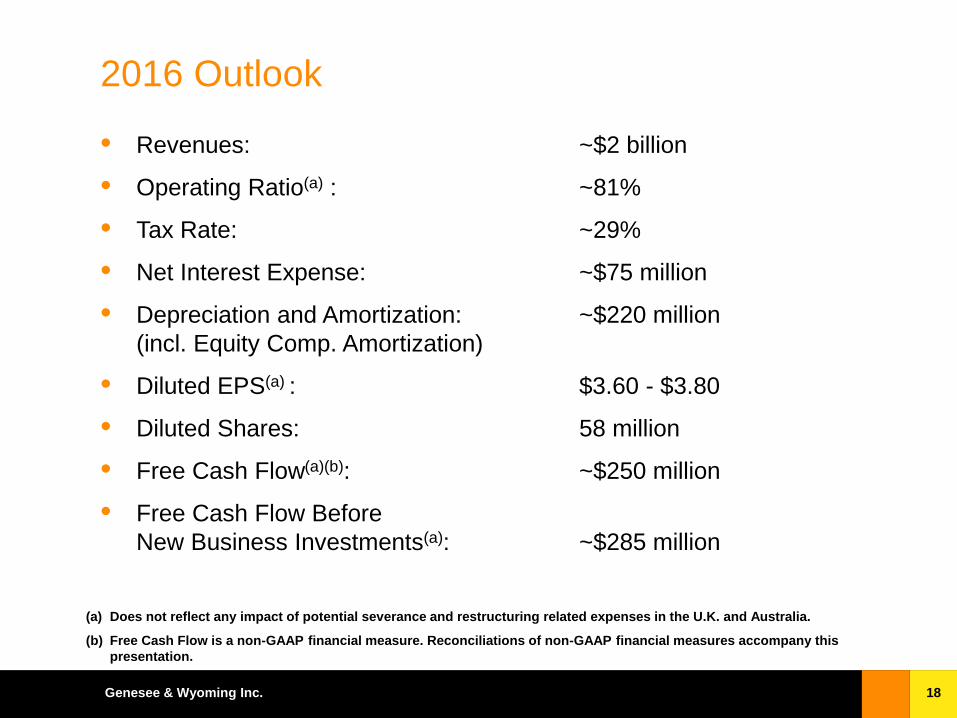
2008 Guidance
• Revenues: ~$2 billion
• Operating Ratio(a) : ~81%
• Tax Rate: ~29%
• Net Interest Expense: ~$75 million
• Depreciation and Amortization: ~$220 million (incl. Equity Comp. Amortization)
• Diluted EPS(a) : $3.60 - $3.80
• Diluted Shares: 58 million
• Free Cash Flow(a)(b): ~$250 million
• Free Cash Flow Before New Business Investments(a): ~$285 million
2016 Outlook
(a) Does not reflect any impact of potential severance and restructuring related expenses in the U.K. and Australia.
(b) Free Cash Flow is a non-GAAP financial measure. Reconciliations of non-GAAP financial measures accompany this presentation.
19 Genesee & Wyoming Inc.
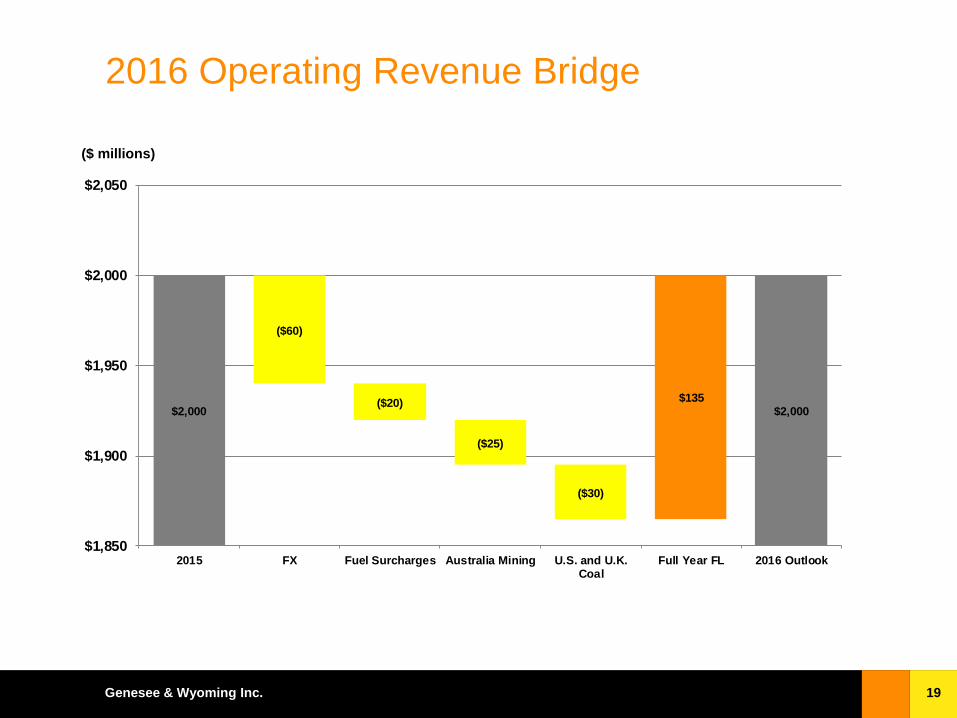
2016 Operating Revenue Bridge
$2,000 $2,000
($60)
($20)
($25)
($30)
$135
$1,850
$1,900
$1,950
$2,000
$2,050
2015 FX Fuel Surcharges Australia Mining U.S. and U.K.Coal
Full Year FL 2016 Outlook
($ millions)

20 Genesee & Wyoming Inc.
2016 Income from Operations Bridge
$402
$380
($7)
($7)
($15)
($15) $17
$5
$300
$325
$350
$375
$400
2015 Adjusted(1)
FX Net FuelSurcharge
AustraliaMining
U.S. andU.K.Coal
Cost Saves Full Year FL/Other
2016 Outlook(2)
($ millions)
(1) Adjusted income from operations is a non-GAAP financial measure. Reconciliations of non-GAAP financial measures accompany this presentation.
(2) Reflects mid-point of 2016 annual outlook. Does not reflect any impact of potential severance and restructuring related expenses in the U.K. and Australia.

21 Genesee & Wyoming Inc.
North American Operations Operating Revenues: 2016 Outlook vs. 2015 ($ millions)
(1) Reflects mid-point of 2016 annual outlook.
22 Genesee & Wyoming Inc.
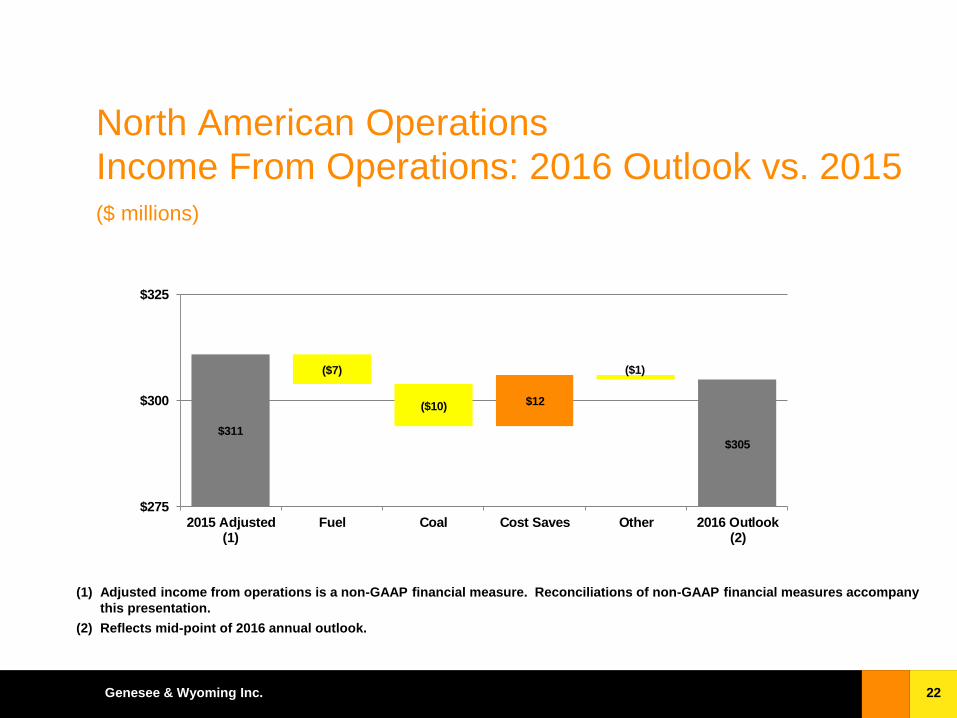
North American Operations Income From Operations: 2016 Outlook vs. 2015 ($ millions)
$311$305
($7)
($10)
($1)
$12
$275
$300
$325
2015 Adjusted(1)
Fuel Coal Cost Saves Other 2016 Outlook(2)
(1) Adjusted income from operations is a non-GAAP financial measure. Reconciliations of non-GAAP financial measures accompany this presentation.
(2) Reflects mid-point of 2016 annual outlook.
23 Genesee & Wyoming Inc.
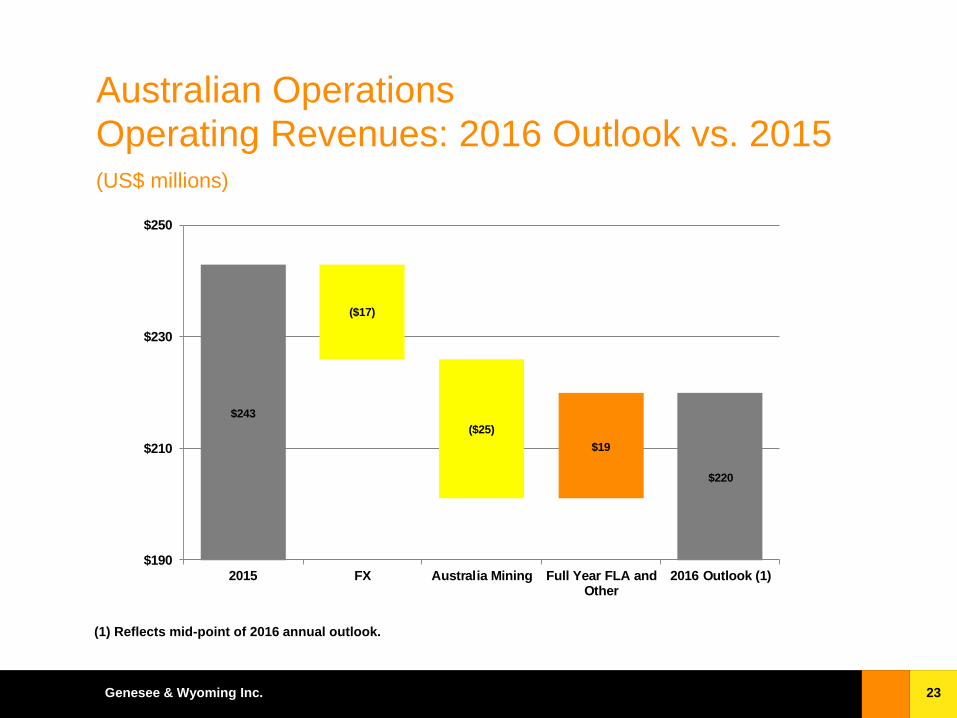
Australian Operations Operating Revenues: 2016 Outlook vs. 2015 (US$ millions)
$243
$220
($17)
($25)$19
$190
$210
$230
$250
2015 FX Australia Mining Full Year FLA andOther
2016 Outlook (1)
(1) Reflects mid-point of 2016 annual outlook.

24 Genesee & Wyoming Inc.
Australian Operations Income from Operations: 2016 Outlook vs. 2015 (US$ millions)
$57
$42.5
($4)
($15)
$5
$30
$40
$50
$60
2015 Adjusted (1) FX Australia Mining Full Year FLA/Other
2016 Outlook (2)
(1) Adjusted income from operations is a non-GAAP financial measure. Reconciliations of non-GAAP financial measures accompany this presentation.
(2) Reflects mid-point of 2016 annual outlook. Does not reflect any impact of potential severance and restructuring related expenses.

25 Genesee & Wyoming Inc.
U.K./Europe Operations Operating Revenues: 2016 Outlook vs. 2015 (US$ millions)
$516
$580($32)
($30)
($15)
$125
$16
$425
$475
$525
$575
2015 FX Europe RouteRationalization
UK Coal Full Year New Business/ Other
2016 Outlook(1)
(1) Reflects mid-point of 2016 annual outlook.
26 Genesee & Wyoming Inc.
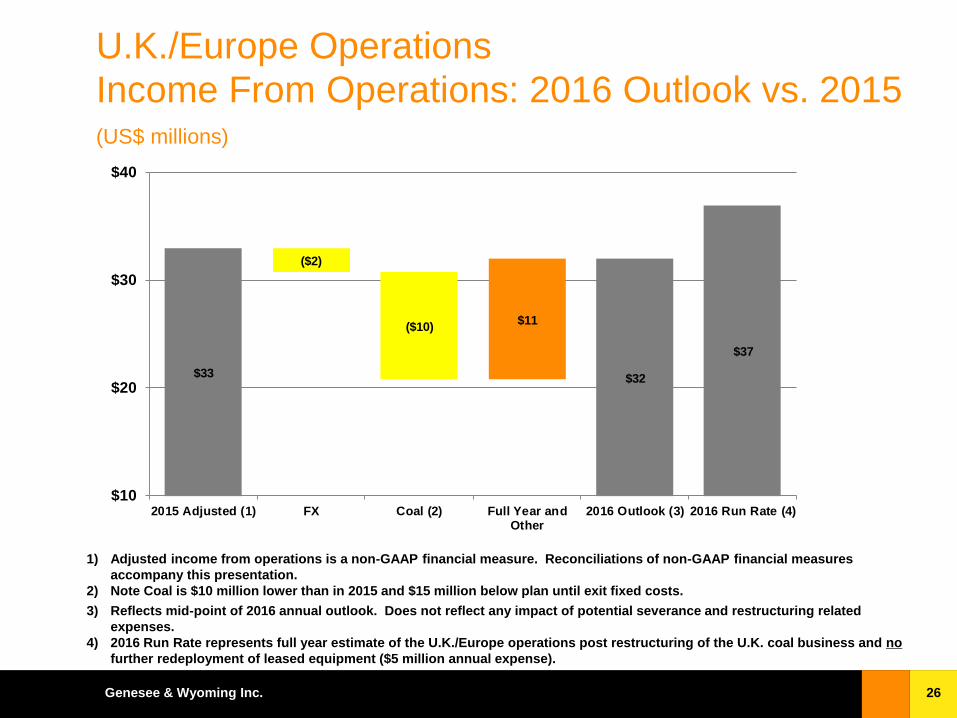
U.K./Europe Operations Income From Operations: 2016 Outlook vs. 2015 (US$ millions)
$33 $32
$37
($2)
($10) $11
$10
$20
$30
$40
2015 Adjusted (1) FX Coal (2) Full Year andOther
2016 Outlook (3) 2016 Run Rate (4)
1) Adjusted income from operations is a non-GAAP financial measure. Reconciliations of non-GAAP financial measures accompany this presentation.
2) Note Coal is $10 million lower than in 2015 and $15 million below plan until exit fixed costs. 3) Reflects mid-point of 2016 annual outlook. Does not reflect any impact of potential severance and restructuring related
expenses. 4) 2016 Run Rate represents full year estimate of the U.K./Europe operations post restructuring of the U.K. coal business and no
further redeployment of leased equipment ($5 million annual expense).

27 Genesee & Wyoming Inc.
Capital Expenditures
(in millions) 2016 2015 Change
Major Renewals & Improvements Capital
Track and Structure $112 $160 $48
Equipment 50 51 1
Other 13 22 9
Subtotal - Core Capital (a) $175 $233 $58
Grant Matching Capital 15 13 (2)
Subtotal - Core + Grant Matching Capital (b) $190 $246 $56
New Business and Investments 35 69 34
Total Capital Expenditures (b) $225 $315 $90
(a) Efficiencies from Railroad Engineering Services (RES), G&W’s new engineering department, yields approximately $10 million savings in core track capital. (b) 2016 Depreciation and Amortization = $204 million
(c) 2016 Capital is net of $65 million of funding from government grants (requiring match of $15 million). 2015 Capital is net of $36 million of funding from government grants (requiring match of $13 million).

28 Genesee & Wyoming Inc.
2016 Free Cash Flow and EBITDA (in millions)
Net Income (1) 215$ EBIT *(1) 380$ Plus: Depreciation and Amortization (2) 220$ 220$ Deferred Taxes 40$ Changes in working Capital TBD Other TBDOperating Cash Flow 475$ EBITDA* 600$
Less: Capital Expenditures (190)$ Plus: Asset Sales TBDPlus: Prior Year Grant Payments TBDLess: Current Year Grant Delays TBDInvesting Cash Flows Before New Bus. Investments (190)$
Free Cash Flow Before New Bus. Investments 285$ Less: New Business Investments (35)$
Free Cash Flow* 250$
Outlook 2016
(1) Reflects mid-point of 2016 annual outlook. Does not reflect any impact of potential severance and restructuring related expenses in the U.K. and Australia.
(2) Includes amortization of non-cash equity compensation expense of $16 million; D&A of $204 million. * EBIT, EBITDA and Free Cash Flow are non-GAAP financial measures. Reconciliations of non-GAAP financial measures
accompany this presentation.

29 Genesee & Wyoming Inc.
Outlook – First Quarter 2016 (February 9, 2016)
(in millions, except per share amounts) North America Australia U.K./Europe
Consolidated Q1 2016Outlook
Operating Revenues ~$290 ~$50 ~$135 ~$475
Operating Ratio(1) ~78% ~84% ~98% ~84%
Income from Operations(1) ~$65 ~$8 ~$3 ~$76
Net Interest Expense ~$18
Depreciation and Amortization (2) $40 $7 $7 $54
Effective Tax Rate ~29%
Diluted EPS (1) $0.70 - $0.75
Diluted Shares 57.9
(1) Does not reflect any impact of potential severance and restructuring related expenses in the U.K. and Australia. (2) Includes amortization of non-cash equity compensation expense of $4 million and D&A of $50 million.
FX: A$1.00 = US$0.70, C$1.00 = US$0.70, €1.00 = US$1.08, £1.00 = US$1.42, PLN1.00 = US$0.242

30 Genesee & Wyoming Inc.
Balance Sheet • Net Debt of $2.3 billion at December 31, 2015 • 3.7x Net Debt/Adjusted EBITDA* at December 31, 2015
($ in millions) 12/31/2015Cash & Equivalents 36$
Debt:Senior Secured Credit Facility, due March 2020 2,178$
Other Debt 127$ TOTAL DEBT 2,305$
Total Equity 2,480$ TOTAL CAPITALIZATION 4,785$
Total Debt/Total Capitalization 48%
Net Debt/Total Capitalization 48%
* EBITDA is a non-GAAP financial measure. Reconciliations of non-GAAP financial measures accompany this presentation.

31 Genesee & Wyoming Inc.

32 Genesee & Wyoming Inc.
Supporting Information for 2016 Outlook (February 9, 2016)
North America Australia U.K./Europe
Revenues $1,175 - $1,225 $215 - $225 $570 - $590
Operating Ratio* 74% - 75% 80% - 82% ~95%
Income from Operations* $295 - $315 $40 - $45 $30 - $34
2016 Carload Volume -3% -5% 30%
2016 Same Railroad Volumes Flat
Freight Pricing +3% fixed/variable Flat
FX C$1.00 = US$0.70 A$1.00 = US$ 0.70£1.00 = US$1.42 €1.00 = US$1.08
Q1 2016 Carload Volumes 370,000 - 380,000 45,000 - 50,000 260,000 - 265,000
% Change versus prior year (10%) - (12%) (10%) - (15%) NM
* Does not reflect any impact of potential severance and restructuring related expenses in the U.K. and Australia.

33 Genesee & Wyoming Inc.
Reconciliation of Non-GAAP Financial Measures

34 Genesee & Wyoming Inc.
Non-GAAP Financial Measures This presentation contains references to Adjusted Income from Operations, Adjusted Operating Expenses, Adjusted Operating Ratio, Adjusted Net Income, Adjusted Diluted Earnings Per Common Share (EPS), Free Cash Flow, Earnings Before Interest and Taxes (EBIT), Earnings Before Interest, Taxes, Depreciation and Amortization (EBITDA), Adjusted EBITDA and Net Debt to Adjusted EBITDA, which are “non-GAAP financial measures” as this term is defined in Item 10(e) of Regulation S-K under the Securities Act of 1933 and the Securities Exchange Act of 1934 and Regulation G under the Securities Exchange Act of 1934. In accordance with these rules, G&W has reconciled these non-GAAP financial measures to their most directly comparable U.S. GAAP measures.
Management views these non-GAAP financial measures as important measures of G&W’s operating
performance or, in the case of Free Cash Flow, an important financial measure of how well G&W is managing its
assets and a useful indicator of cash flow that may be available for discretionary use by G&W. Management also
views these non-GAAP financial measures as a way to assess comparability between periods. Key limitations of
the Free Cash Flow measure include the assumptions that G&W will be able to refinance its existing debt when it
matures and meet other cash flow obligations from financing activities, such as principal payments on debt.
These non-GAAP financial measures are not intended to represent, and should not be considered more
meaningful than, or as an alternative to, their most directly comparable GAAP measures. These non-GAAP
financial measures may be different from similarly-titled non-GAAP financial measures used by other companies.
The following tables set forth reconciliations of each of these non-GAAP financial measures to their most directly comparable GAAP measure (in millions, except percentages and per share amounts).

35 Genesee & Wyoming Inc.
Adjusted Net Income and Adjusted Diluted EPS
Three Months Ended December 31, 2015 Net Income Diluted EPSAs reported 84.9$ 1.47$ Add back certain items:
Business development and related costs 1.7 0.03 Net gain on sale of assets (0.2) - Out of period benefit of final allocation of fair values to Freightliner's assets & liabilities (1.6) (0.03) Impact of reduction in U.K. effective tax rate (9.7) (0.17) 2015 Short-Line Tax Credit (27.4) (0.47) Application of full year effective rate on Q1 - Q3 results 1.3 0.02
As adjusted 49.1$ 0.85$
Three Months Ended December 31, 2014 Net Income Diluted EPSAs reported 87.4$ 1.53$ Add back certain items:
Business development and related costs 1.0 0.02 Net gain on sale of assets (1.0) (0.02) Retroactive Short-Line Tax Credit for Q1 - Q3 2014 (27.0) (0.47) Application of full year effective rate on Q1 - Q3 results 3.5 0.06
As adjusted 63.8$ 1.12$ FX (0.05) As adjusted excluding FX 1.07$

36 Genesee & Wyoming Inc.
Adjusted Diluted EPS
Three Months Ended December 31, 2015 Outlook (Revised - December 11, 2015) Diluted EPSAs reported $0.75 - $0.80Add back certain items:
Business development and related costs 0.03 Australian severance costs 0.02
As adjusted $0.80 - $0.85
Three Months Ended December 31, 2015 Outlook (October 30, 2015) Diluted EPSAs reported $0.85 - $0.90Add back certain items:
Business development and related costs 0.03 Australian severance costs 0.02
As adjusted $0.90 - $0.95

37 Genesee & Wyoming Inc.
Adjusted Income from Operations, Adjusted Operating Expenses and Adjusted Operating Ratio – by Segment
Three Months Ended December 31, 2015
North American
OperationsAustralian Operations
U.K./European Operations Total
Operating revenues 298.6$ 55.2$ 161.0$ 514.9$ Operating expenses 225.4 44.7 150.1 420.2 Income from operations (a) 73.2$ 10.5$ 10.9$ 94.6$ Operating ratio (b) 75.5% 81.0% 93.2% 81.6%
Operating expenses 225.4$ 44.7$ 150.1$ 420.2$ Business development and related costs (1.2) (0.5) (0.9) (2.5) Net gain on sale of assets 0.3 0.0 0.0 0.3 Out of period benefit of final allocation of fair values to Freightliner's assets & liabilities - - 2.6 2.6
Adjusted operating expenses 224.6$ 44.2$ 151.9$ 420.6$
Adjusted income from operations 74.1$ 11.0$ 9.1$ 94.2$ Adjusted operating ratio 75.2% 80.1% 94.3% 81.7%
(a) Income from operations is calculated as operating revenues less operating expenses.(b) Operating ratio is calculated as operating expenses divided by operating revenues.

38 Genesee & Wyoming Inc.
Adjusted Income from Operations, Adjusted Operating Expenses and Adjusted Operating Ratio – by Segment (cont.)
Three Months Ended December 31, 2014
North American
OperationsAustralian Operations
U.K./European Operations Total
Operating revenues 338.3$ 72.4$ 5.0$ 415.6$ Operating expenses 248.0 48.6 5.5 302.2 Income from operations (a) 90.3$ 23.8$ (0.6)$ 113.5$ Operating ratio (b) 73.3% 67.2% 111.5% 72.7%
Operating expenses 248.0$ 48.6$ 5.5$ 302.2$ Business development and related costs (1.6) (0.0) - (1.6) Net gain on sale of assets 1.4 0.2 0.0 1.7
Adjusted operating expenses 247.9$ 48.8$ 5.6$ 302.2$
Adjusted income from operations 90.4$ 23.6$ (0.6)$ 113.4$ Adjusted operating ratio 73.3% 67.4% 112.0% 72.7%
(a) Income from operations is calculated as operating revenues less operating expenses.(b) Operating ratio is calculated as operating expenses divided by operating revenues.

39 Genesee & Wyoming Inc.
Adjusted Income from Operations, Adjusted Operating Expenses and Adjusted Operating Ratio – by Segment (cont.)
Twelve Months Ended December 31, 2015
North American
OperationsAustralian Operations
U.K./European Operations Total
Operating revenues 1,241.8$ 243.0$ 515.6$ 2,000.4$ Operating expenses 944.3 188.1 483.7 1,616.1 Income from operations (a) 297.5$ 54.8$ 31.9$ 384.3$ Operating ratio 76.0% 77.4% 93.8% 80.8%
Operating expenses 944.3$ 188.1$ 483.7$ 1,616.1$ Business development and related costs (3.2) (2.7) (1.1) (7.0) Freightliner acquisition related costs (12.6) (0.0) - (12.6) Net gain on sale of assets 2.0 0.0 0.2 2.3
Adjusted operating expenses 930.5$ 185.4$ 482.9$ 1,598.8$
Adjusted income from operations 311.3$ 57.6$ 32.7$ 401.6$ Adjusted operating ratio 74.9% 76.3% 93.7% 79.9%
(a) Income from operations is calculated as operating revenues less operating expenses.

40 Genesee & Wyoming Inc.
Adjusted Income from Operations, Adjusted Operating Expenses and Adjusted Operating Ratio – by Segment (cont.)
North America Australia U.K./Europe TotalOperating revenues $300 - $305 $55 - $60 $160 - $165 $515 - $530Operating expenses 224 - 225 43 - 48 152 - 155 418 - 427Income from operations (a) $76 - $80 ~$12 $8 - $10 $97 - $103Operating ratio (b) ~74% ~78% 94% - 95% ~81%
Operating expenses $224 - $225 $43 - $48 $152 - $155 $418 - $427Business development and related costs (2) - - (2) Australian severance costs - (2) - (2)
Adjusted operating expenses 222 - 223 41 - 46 152 - 155 315 - 424
Adjusted income from operations $78 - $82 ~$14 $8 - $10 $100 - $106Adjusted operating ratio ~74% ~76% 94% - 95% ~80%
(a) Income from operations is calculated as operating revenues less operating expenses.(b) Operating ratio is calculated as operating expenses divided by operating revenues.
Three Months Ended December 31, 2015 Outlook (October 30, 2015)

41 Genesee & Wyoming Inc.
Adjusted Diluted EPS
Twelve Months Ended December 31, 2015 Diluted EPSAs reported 3.89$ Add back certain items:
Business development and related costs 0.10 Freightliner acquisition-related costs 0.16 Net gain on sale of assets (0.03) Impact of reduction in U.K. effective tax rate (0.17) Loss on settlement of Freightliner acquisition-related foreign currency forward purchase contracts 0.20 2015 Short Line Tax Credit (0.47)
As adjusted 3.68$ FX (0.05) As adjusted excluding FX 3.63$

42 Genesee & Wyoming Inc.
2016 Free Cash Flow
Twelve Months Ended
December 31, 2016 - Outlook
Net cash provided by operating activities 475$ Net cash used in investing activities (225) Net cash used for acquisitions - Free cash flow 250$ New business investments 35 Free cash flow before new business investments 285$

43 Genesee & Wyoming Inc.
Net Debt/Adjusted EBITDA Twelve Months
Ended December 31,
2015Acquisition
LTM*Combined
Company LTMNet income 225.0$ Add back:
Provision for income taxes 75.9 Other income, net (1.9) Interest expense 67.1 Interest income (0.5) Depreciation and amortization expense 188.5
EBITDA 554.1$ 19.5$ 573.6$ Add back certain items
Non-cash compensation cost related to equity awards 14.6$ Loss on settlement of Freightliner acquisition-related foreign currency forward purchase contracts 18.7 Freightliner acquisition-related costs 16.8 Net gain on sale of assets (2.3)
Adjusted EBITDA 602.0$ 19.5$ 621.5$
Net debt 2,269$
Net debt/adjusted EBITDA ratio 3.7 : 1.0
* Includes Freightliner - 1/1/2015 - 3/24/2015 and other investments

44 Genesee & Wyoming Inc.
EBIT, EBITDA and Net Debt/Adjusted EBITDA
2016 (Outlook)Net income 215$ Add back:
Provision for income taxes 90 Other income, net - Interest expense 75 Interest income -
EBIT 380$ Depreciation and amortization expense 204
EBITDA 584$ Add back certain items:
Non-cash compensation cost related to equity awards 16 Adjusted EBITDA 600$
Net debt 2,023$
Net debt/adjusted EBITDA ratio 3.4 : 1.0

45 Genesee & Wyoming Inc.