fourth quarter 2017 financial results conference...
TRANSCRIPT

Fourth Quarter 2017 Financial Results
Conference Call
January 24, 2018
Forward-Looking Statements
2
This presentation contains certain “forward-looking statements” (as such term is defined in Section 21E of the Securities
Exchange Act of 1934, as amended). All statements, other than statements of historical facts, that address activities, events or
developments that the Company expects, projects, believes or anticipates will or may occur in the future, including, without
limitation, future operating or financial results and future revenues and expenses, future, pending or recent acquisitions,
general market conditions and shipping industry trends, the financial condition and liquidity of the Company, cash available for
dividend payments, future capital expenditures and dry-docking costs and newbuild vessels and expected delivery dates, are
forward-looking statements. Although the Company believes that its expectations stated in this presentation are based on
reasonable assumptions, actual results may differ from those projected in the forward-looking statements. Important factors
that, in our view, could cause actual results to differ materially from the future results discussed in the forward-looking
statements include, without limitation, global supply and demand for containerships, the financial stability of the Company’s
counterparties and charterers, global economic weakness, disruptions in the world financial markets, the loss of one or more
customers, a decrease in the level of Chinese exports, the availability of debt financing, our ability to expand through
newbuildings and secondhand acquisitions, risks associated with the operation of the Framework Agreement with our joint
venture partner, delay in the delivery of newbuildings, rising crew and fuel costs, increases in capital expenditure requirements
or operating costs, a decrease in containership values, increased competition in the industry, re-chartering risk, fluctuations in
interest rates, actions taken by governmental and regulatory authorities, potential liability for future litigation and environmental
liabilities, the availability of adequate insurance coverage, potential disruption of shipping routes due to accidents or political
conditions and the other factors discussed in the Company’s Annual Report on Form 20-F (File No. 001-34934) under the
caption “Risk Factors”. All forward-looking statements reflect management’s current views with respect to certain future
events, and the Company expressly disclaims any obligation to update or revise any of these forward-looking statements,
whether because of future events, new information, a change in the Company’s views or expectations, or otherwise.
Q4 2017 New Chartering Agreements
33
Notes
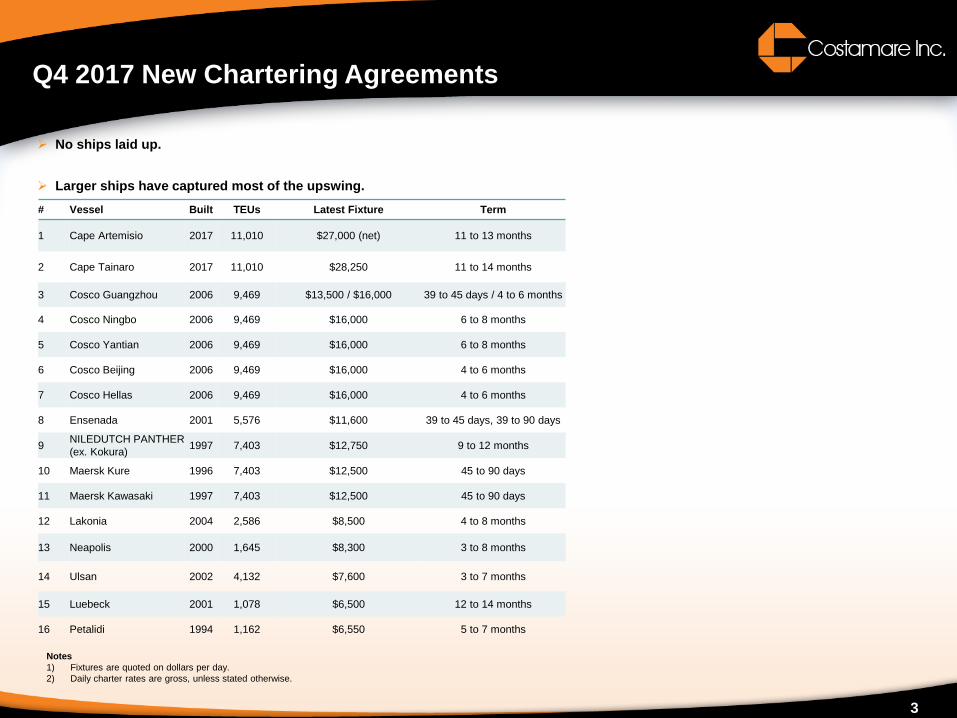
1) Fixtures are quoted on dollars per day.
2) Daily charter rates are gross, unless stated otherwise.
No ships laid up.
Larger ships have captured most of the upswing.
# Vessel Built TEUs Latest Fixture Term
1 Cape Artemisio 2017 11,010 $27,000 (net) 11 to 13 months
2 Cape Tainaro 2017 11,010 $28,250 11 to 14 months
3 Cosco Guangzhou 2006 9,469 $13,500 / $16,000 39 to 45 days / 4 to 6 months
4 Cosco Ningbo 2006 9,469 $16,000 6 to 8 months
5 Cosco Yantian 2006 9,469 $16,000 6 to 8 months
6 Cosco Beijing 2006 9,469 $16,000 4 to 6 months
7 Cosco Hellas 2006 9,469 $16,000 4 to 6 months
8 Ensenada 2001 5,576 $11,600 39 to 45 days, 39 to 90 days
9NILEDUTCH PANTHER
(ex. Kokura)1997 7,403 $12,750 9 to 12 months
10 Maersk Kure 1996 7,403 $12,500 45 to 90 days
11 Maersk Kawasaki 1997 7,403 $12,500 45 to 90 days
12 Lakonia 2004 2,586 $8,500 4 to 8 months
13 Neapolis 2000 1,645 $8,300 3 to 8 months
14 Ulsan 2002 4,132 $7,600 3 to 7 months
15 Luebeck 2001 1,078 $6,500 12 to 14 months
16 Petalidi 1994 1,162 $6,550 5 to 7 months

4
Recent Transactions –Newbuild vessel delivery/ New
acquisition
Newbuild vessel
delivery
On January 23, 2018, we accepted delivery of the 3,800 TEU containership Polar
Argentina (ex Hull Nr YZJ2015-1206), which was acquired pursuant to our joint venture
with York. The vessel commenced its 7-year charter with Hamburg Süd. Costamare holds
a 49% interest in the entity that owns the vessel.
New acquisition
In October 2017, the Company agreed to purchase the 2005-built 2,556 TEU container
vessel CMA CGM L'Etoile. On November 3, 2017, we accepted delivery of the vessel.
The vessel is chartered to CMA CGM for a period, expiring at the charterers’ option,
between March 10, 2018 and June 10, 2018, at a daily rate of $10,250. The acquisition
was funded with cash from operations.

5
Recent Transactions – Dividend Declarations
5
Dividend
Declarations
On January 2, 2018, we declared a dividend for the fourth quarter ended December 31,
2017, of $0.10 per share on our common stock, payable on February 6, 2018, to
stockholders of record as of January 23, 2018.
As long term committed shareholders, members of the Konstantakopoulos family have
each decided to reinvest in full the fourth quarter cash dividend under our dividend
reinvestment plan available to all common stockholders.
On January 2, 2018, we declared a dividend of $0.476563 per share on our Series B
Preferred Stock, a dividend of $0.531250 per share on our Series C Preferred Stock and
a dividend of $0.546875 per share on our Series D Preferred Stock, which were all paid
on January 16, 2018 to holders of record as of January 12, 2018.

Q4 2017 Income Statement Snapshot
Q4 2017 RESULTS
Q4 2017 RESULTS – Non Cash and Other Adjustments
Notes
All numbers in thousands, except ownership days, number of vessels, share and per share data.
(*) Non-GAAP Items, see Appendix for reconciliation.66
4Q 2016 4Q 2017 % Change
Ownership Days 4,876 4,843 (0.7%)
Average Number of Vessels 53.0 52.6 (0.8%)
Voyage Revenues $110,134 $100,618 (8.6%)
Net Interest and Finance Costs 17,228 15,766 (8.5%)
Adjusted Net Income Available to Common Stockholders(*) 23,039 18,408 (20.1%)
Weighted Average Number of Shares 81,498,030 107,661,705
4Q 2016 4Q 2017
Net Income Available to Common Stockholders ($16,274) ($2,596)
Accrued charter revenue (2,836) (2,752)
Impairment loss - 17,959
Loss on Asset held for sale 37,161 2,379
(Gain) Loss on derivative instruments (2,346) (313)
Amortization of Prepaid lease 2,200 2,054
Non-cash G&A and other non-cash items 4,837 864
Swaps breakage cost 297 -
JV Impairment loss (%) - 896
Realized (gain) loss on Euro/USD FX contracts - (83)
Adjusted Net Income Available to Common Stockholders(*) 23,039 18,408
Adjusted EPS(*) $0.28 $0.17

High Quality & Stable Cash Flows
Revenue Contribution (All Vessels)(1)(2)
Notes
1. Based on contracted revenues as of January 24, 2017. Revenues include our ownership percentage of contracted revenues for six secondhand vessels purchased and twelve
newbuilds ordered pursuant to the Framework Agreement with York; eleven of the twelve newbuilds have already been delivered.
2. Assumes earliest re-delivery dates after giving effect to the exercise of any owners’ extension options.
3. Hamburg Süd has been acquired by Maersk Lines.
7
As of January 24, 2017, contracted
revenues of approximately
$1.2Bn(1)(2)
TEU-weighted average remaining
time charter duration for the fleet is
about 2.9 years(1)(2)
1.5%
14.7%
39.2%
38.1%
Other
1.4%3.8%
(3)
1.3%

8
Prudent Balance Sheet Management
8
Total Cash and Cash Equivalents as of December 31, 2017 of $219m.
Disciplined management of our Balance Sheet, with $1.01bn of Net Debt1 as of December 31st.
Expected Leverage Ratio2 of 50%, for FY 2017 based on compliance certificates to be delivered to financing
banks.
Gross Total Debt3 decreased from $1.9bn to $1.2bn in less than 5 years, whilst since 2013 Costamare has
raised approximately $0.75bn of new debt related to vessel acquisitions.
Notes
1. Total Bank Debt plus Finance Leases minus Cash and Cash Equivalents.
2. Net Debt / (Total Market Value Adjusted Assets minus Cash and Cash Equivalents).
3. Bank Debt plus Finance Leases.
1,868
1,767
1,557
1,422
1,230
1,715
1,590
1,394
1,212
1,011
800
1,000
1,200
1,400
1,600
1,800
2,000
2013 2014 2015 2016 2017
$m
l
Total Debt (Bank Debt & Finance Leases) Net Debt
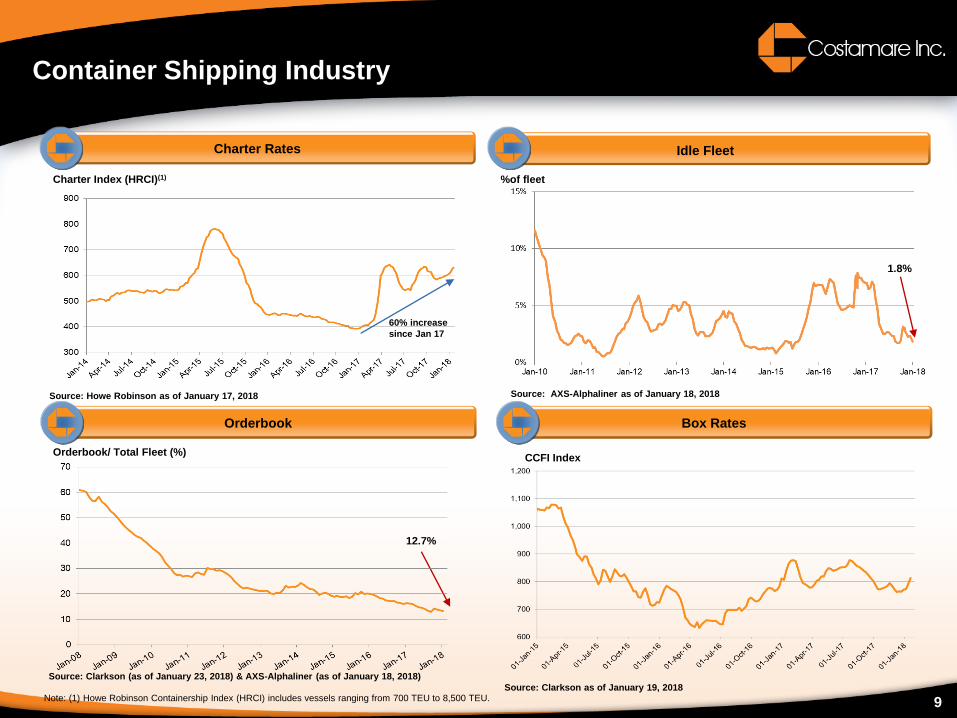
Container Shipping Industry
Idle Fleet
%of fleet
Source: AXS-Alphaliner as of January 18, 2018
Note: (1) Howe Robinson Containership Index (HRCI) includes vessels ranging from 700 TEU to 8,500 TEU.
Charter Rates
Source: Howe Robinson as of January 17, 2018
Charter Index (HRCI)(1)
Orderbook
Source: Clarkson (as of January 23, 2018) & AXS-Alphaliner (as of January 18, 2018)
Orderbook/ Total Fleet (%)
9
Box Rates
Source: Clarkson as of January 19, 2018
CCFI Index
12.7%
60% increase
since Jan 17
1.8%

10
Performance
Adjusted EPS of $0.17.
Fleet
No vessels laid up.
16 vessels in new or extended timecharters.
Delivery of 3,800 TEU containership (Polar Argentina) on 7-year charter with Hamburg Süd.
Acquisition of the 2005-built 2,556 TEU container vessel (CMA CGM L'Etoile) with cash from operations.
Strong Balance Sheet
Expected Leverage Ratio of 50%, for FY 2017 based on compliance certificates to be delivered to financing banks.
Total Debt reduction of $0.7bn since 2013.
4 vessels currently unencumbered.
Capital Expenditure Commitments
Remaining equity commitment of USD1.1m related to one newbuilding (under our joint venture with York).
Containership Market
Idle fleet represents 1.8% of existing fleet.
Average charter rates (Howe Robinson Index) have increased by 60% since January 2017.
Takeaways

Q & A
11

Appendix – I
Net Income to Adj. Net Income Available to Common Stockholders and Adj. EPS Reconciliation
Note: Adjusted Net Income available to common stockholders and Adjusted
Earnings per Share represent Net Income after earnings allocated to preferred
stock, but before non-cash "Accrued charter revenue" recorded under charters
with escalating charter rates, realized gain on Euro/USD forward contracts, loss on
sale / disposal of vessels, loss on asset held for sale, vessels’ impairment loss,
vessel impairment loss by a jointly owned company with York included in equity
(gain)/loss on investments, non-recurring, non-cash write-off of loan deferred
financing costs, swap breakage cost, non-cash general and administrative
expenses and non-cash other items, amortization of prepaid lease rentals, net and
non-cash changes in fair value of derivatives. "Accrued charter revenue" is
attributed to the timing difference between the revenue recognition and the cash
collection. However, Adjusted Net Income available to common stockholders and
Adjusted Earnings per Share are not recognized measurements under U.S. GAAP.
We believe that the presentation of Adjusted Net Income available to common
stockholders and Adjusted Earnings per Share are useful to investors because
they are frequently used by securities analysts, investors and other interested
parties in the evaluation of companies in our industry. We also believe that
Adjusted Net Income available to common stockholders and Adjusted Earnings
per Share are useful in evaluating our ability to service additional debt and make
capital expenditures. In addition, we believe that Adjusted Net Income available to
common stockholders and Adjusted Earnings per Share are useful in evaluating
our operating performance and liquidity position compared to that of other
companies in our industry because the calculation of Adjusted Net Income
available to common stockholders and Adjusted Earnings per Share generally
eliminates the effects of the accounting effects of capital expenditures and
acquisitions, certain hedging instruments and other accounting treatments, items
which may vary for different companies for reasons unrelated to overall operating
performance and liquidity. In evaluating Adjusted Net Income available to common
stockholders and Adjusted Earnings per Share, you should be aware that in the
future we may incur expenses that are the same as or similar to some of the
adjustments in this presentation. Our presentation of Adjusted Net Income
available to common stockholders and Adjusted Earnings per Share should not be
construed as an inference that our future results will be unaffected by unusual or
non-recurring items.
(1) Items to consider for comparability include gains and charges. Gains positively
impacting Net Income are reflected as deductions to Adjusted Net Income.
Charges negatively impacting Net Income are reflected as increases to Adjusted
Net Income.
12
Three-month period ended
December 31,
(Expressed in thousands of U.S. dollars,
except share and per share data)
2016 2017
Net Income / (Loss) $ (11,008) $ 2,670
Earnings allocated to Preferred Stock
(5,266)
(5,266)
Net Income / (Loss) available to
common stockholders
(16,274)
(2,596)
Accrued charter revenue
(2,836)
(2,752)
Non-cash general and administrative
expenses and non-cash other items
4,837
864
Amortization of prepaid lease rentals,
net
2,200
2,054
Realized Gain on Euro/USD forward
contracts (1)
-
(83)
Loss on sale / disposals of vessels (1)
-
-
Loss on asset held for sale
37,161
2,379
Vessels’ impairment loss
-
17,959
Vessel impairment loss by a jointly
owned company with York included in
equity (gain)/loss on investments
-
896
Non-recurring, non-cash write-off of
loan deferred financing costs
-
-
Swap breakage cost
297
-
Gain on derivative instruments,
excluding interest accrued and realized
on non-hedging derivative instruments
(1)
(2,346)
(313)
Adjusted Net Income available to
common stockholders $ 23,039 $ 18,408
Adjusted Earnings per Share $ 0.28 $ 0.17
Weighted average number of shares
81,498,030 107,661,705