fourth quarter 2020 - bmv
TRANSCRIPT

January | 2021
Fourth Quarter 2020Conference Call Presentation

Contents
Main Drivers under COVIDAsset Quality, Liquidity, ICAP, Loan Loss Provisions
Results vs. Guidance
Status of Relief Program
Loan growth Portfolio and Deposits
High Asset Quality and outstanding Risk Profile
Cost of Funding and Liquidity
Capital Adequacy Ratio
Efficiency Ratio
Guidance 2021
3
4
5
6
7
8
9
10
11
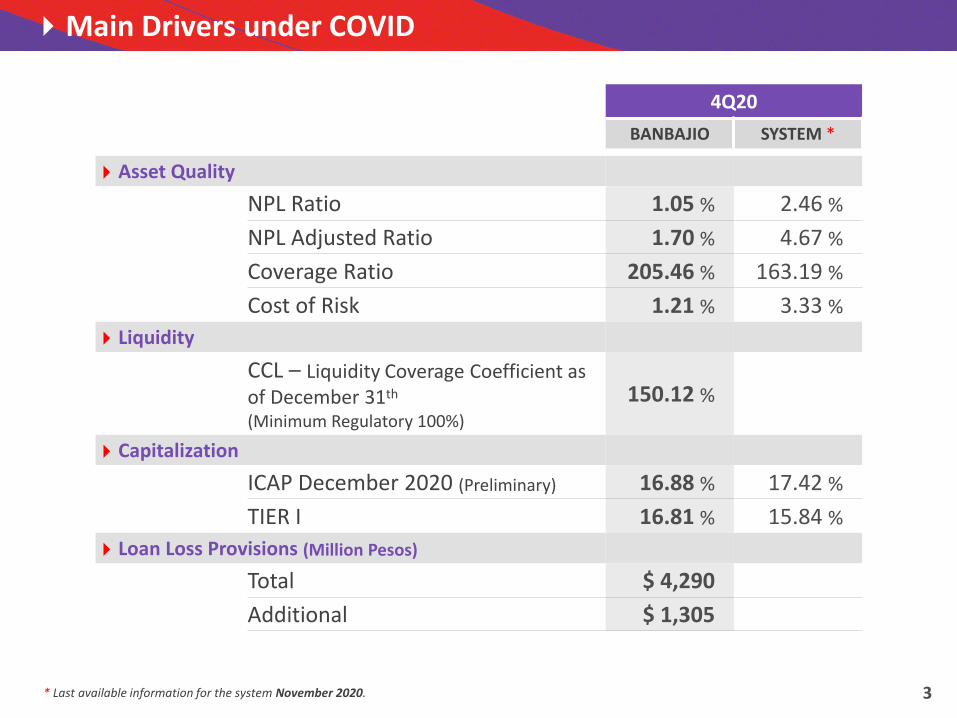
Main Drivers under COVID
4Q20
BANBAJIO SYSTEM *
Asset Quality
NPL Ratio 1.05 % 2.46 %
NPL Adjusted Ratio 1.70 % 4.67 %
Coverage Ratio 205.46 % 163.19 %
Cost of Risk 1.21 % 3.33 %
Liquidity
CCL – Liquidity Coverage Coefficient asof December 31th
(Minimum Regulatory 100%)
150.12 %
Capitalization
ICAP December 2020 (Preliminary) 16.88 % 17.42 %
TIER I 16.81 % 15.84 %
Loan Loss Provisions (Million Pesos)
Total $ 4,290
Additional $ 1,305
* Last available information for the system November 2020. 3
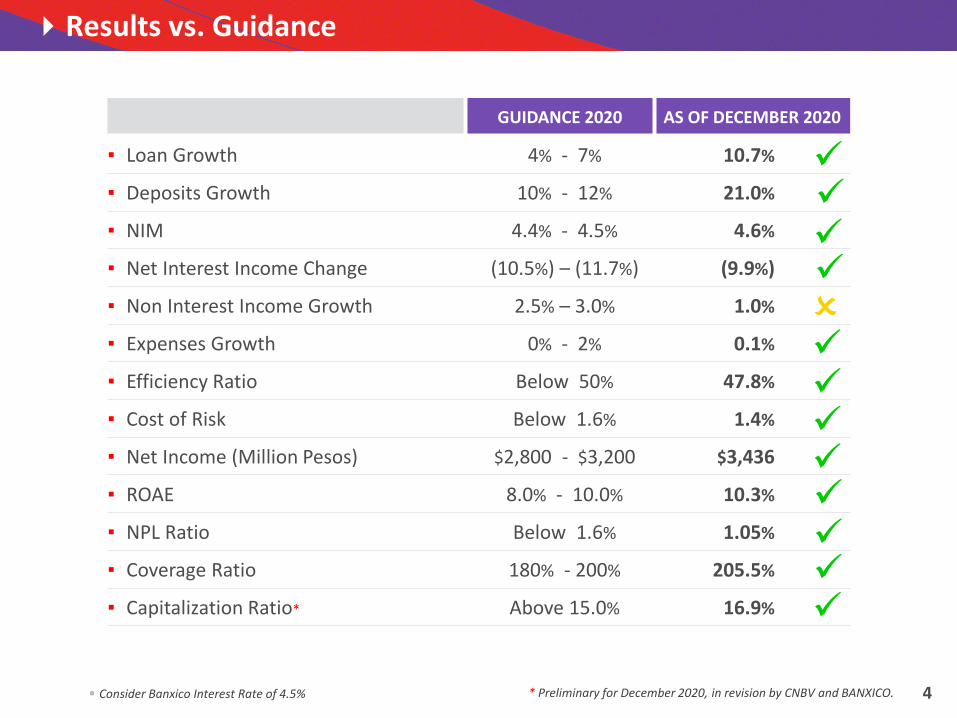
GUIDANCE 2020 AS OF DECEMBER 2020
▪ Loan Growth 4% - 7% 10.7%
▪ Deposits Growth 10% - 12% 21.0%
▪ NIM 4.4% - 4.5% 4.6%
▪ Net Interest Income Change (10.5%) – (11.7%) (9.9%)
▪ Non Interest Income Growth 2.5% – 3.0% 1.0%
▪ Expenses Growth 0% - 2% 0.1%
▪ Efficiency Ratio Below 50% 47.8%
▪ Cost of Risk Below 1.6% 1.4%
▪ Net Income (Million Pesos) $2,800 - $3,200 $3,436
▪ ROAE 8.0% - 10.0% 10.3%
▪ NPL Ratio Below 1.6% 1.05%
▪ Coverage Ratio 180% - 200% 205.5%
▪ Capitalization Ratio* Above 15.0% 16.9%
• Consider Banxico Interest Rate of 4.5% * Preliminary for December 2020, in revision by CNBV and BANXICO.
Results vs. Guidance
4
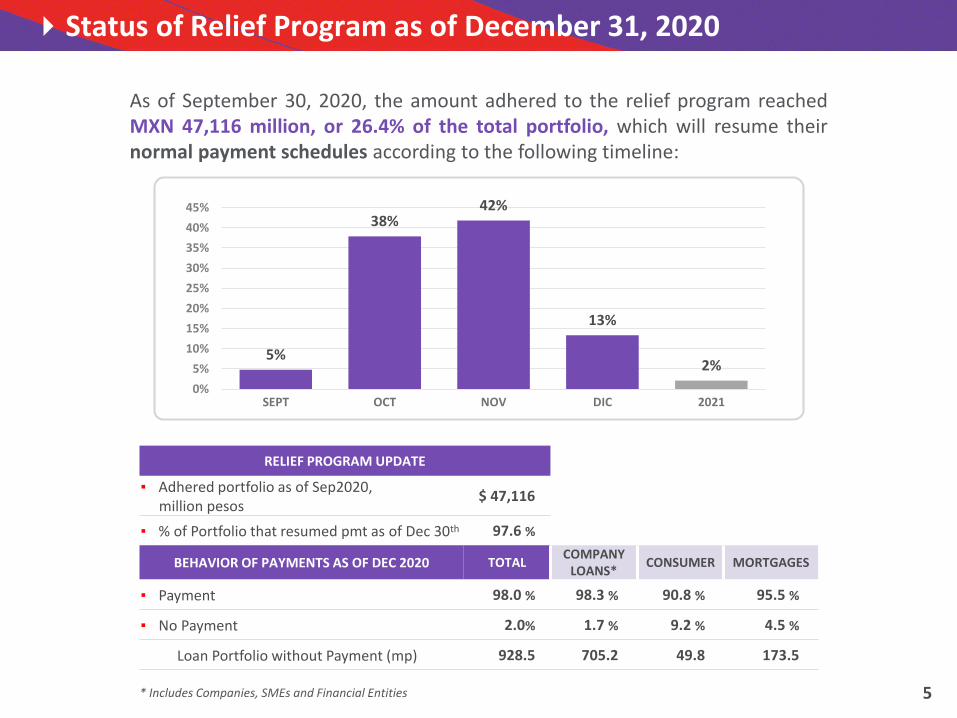
Status of Relief Program as of December 31, 2020
As of September 30, 2020, the amount adhered to the relief program reachedMXN 47,116 million, or 26.4% of the total portfolio, which will resume theirnormal payment schedules according to the following timeline:
RELIEF PROGRAM UPDATE
▪ Adhered portfolio as of Sep2020,million pesos
$ 47,116
▪ % of Portfolio that resumed pmt as of Dec 30th 97.6 %
BEHAVIOR OF PAYMENTS AS OF DEC 2020 TOTALCOMPANY
LOANS*CONSUMER MORTGAGES
▪ Payment 98.0 % 98.3 % 90.8 % 95.5 %
▪ No Payment 2.0% 1.7 % 9.2 % 4.5 %
Loan Portfolio without Payment (mp) 928.5 705.2 49.8 173.5
5%
38%42%
13%
2%
0%
5%
10%
15%
20%
25%
30%
35%
40%
45%
SEPT OCT NOV DIC 2021
* Includes Companies, SMEs and Financial Entities 5
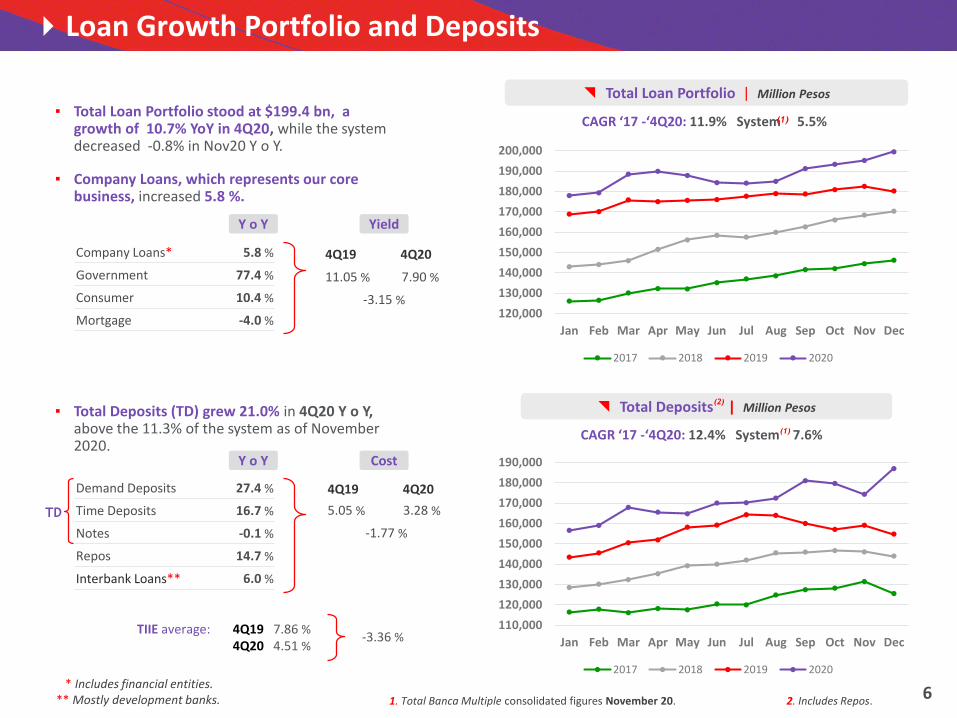
◥ Total Loan Portfolio | Million Pesos
CAGR ‘17 -‘4Q20: 11.9% System 5.5%
1. Total Banca Multiple consolidated figures November 20.
(1)▪ Total Loan Portfolio stood at $199.4 bn, a
growth of 10.7% YoY in 4Q20, while the system decreased -0.8% in Nov20 Y o Y.
▪ Company Loans, which represents our core business, increased 5.8 %.
Company Loans* 5.8 %
Government 77.4 %
Consumer 10.4 %
Mortgage -4.0 %
Y o Y
◥ Total Deposits | Million Pesos
CAGR ‘17 -‘4Q20: 12.4% System 7.6%(1)
Demand Deposits 27.4 %
Time Deposits 16.7 %
Notes -0.1 %
Repos 14.7 %
Interbank Loans** 6.0 %
▪ Total Deposits (TD) grew 21.0% in 4Q20 Y o Y, above the 11.3% of the system as of November 2020.
Y o Y
4Q19 4Q20
11.05 % 7.90 %
-3.15 %
Yield
4Q19 4Q20
5.05 % 3.28 %
-1.77 %
Cost
TIIE average: 4Q19 7.86 %4Q20 4.51 %
* Includes financial entities.** Mostly development banks.
-3.36 %
(2)
2. Includes Repos.
Loan Growth Portfolio and Deposits
TD
120,000
130,000
140,000
150,000
160,000
170,000
180,000
190,000
200,000
Jan Feb Mar Apr May Jun Jul Aug Sep Oct Nov Dec
2017 2018 2019 2020
110,000
120,000
130,000
140,000
150,000
160,000
170,000
180,000
190,000
Jan Feb Mar Apr May Jun Jul Aug Sep Oct Nov Dec
2017 2018 2019 2020
6
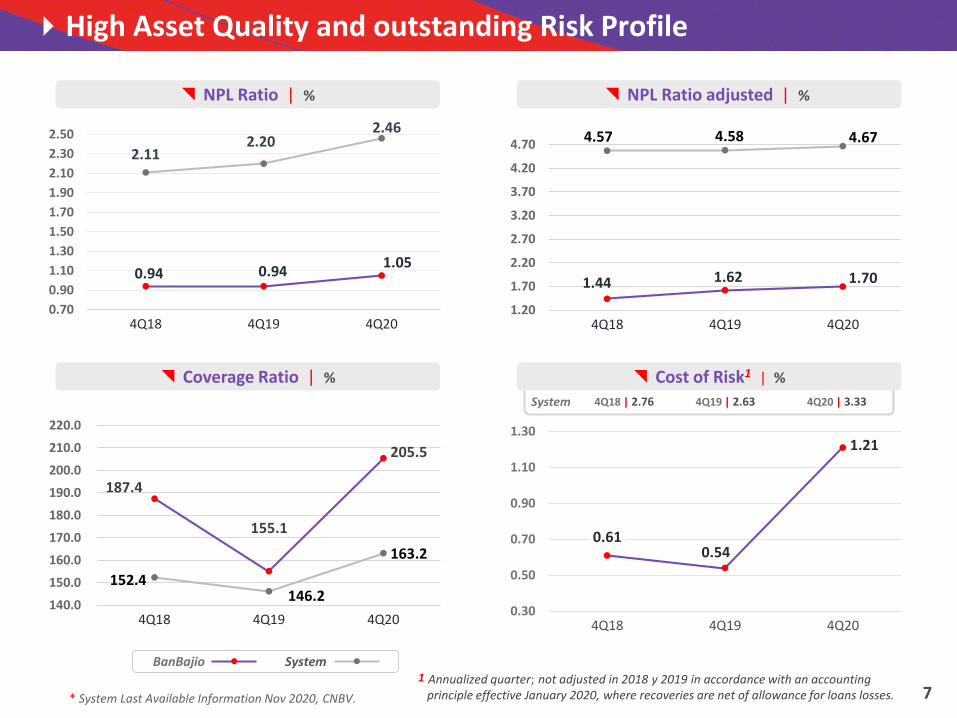
0.94 0.94 1.05
2.11 2.20
2.46
0.70
0.90
1.10
1.30
1.50
1.70
1.90
2.10
2.30
2.50
4Q18 4Q19 4Q20
◥ NPL Ratio | % ◥ NPL Ratio adjusted | %
◥ Coverage Ratio | % ◥ Cost of Risk1 | %
187.4
155.1
205.5
152.4 146.2
163.2
140.0
150.0
160.0
170.0
180.0
190.0
200.0
210.0
220.0
4Q18 4Q19 4Q20
1.44 1.62 1.70
4.57 4.58 4.67
1.20
1.70
2.20
2.70
3.20
3.70
4.20
4.70
4Q18 4Q19 4Q20
* System Last Available Information Nov 2020, CNBV.
BanBajio System1 Annualized quarter; not adjusted in 2018 y 2019 in accordance with an accounting
principle effective January 2020, where recoveries are net of allowance for loans losses.
High Asset Quality and outstanding Risk Profile
0.610.54
1.21
0.30
0.50
0.70
0.90
1.10
1.30
4Q18 4Q19 4Q20
7
4Q18 | 2.76 4Q19 | 2.63 4Q20 | 3.33System
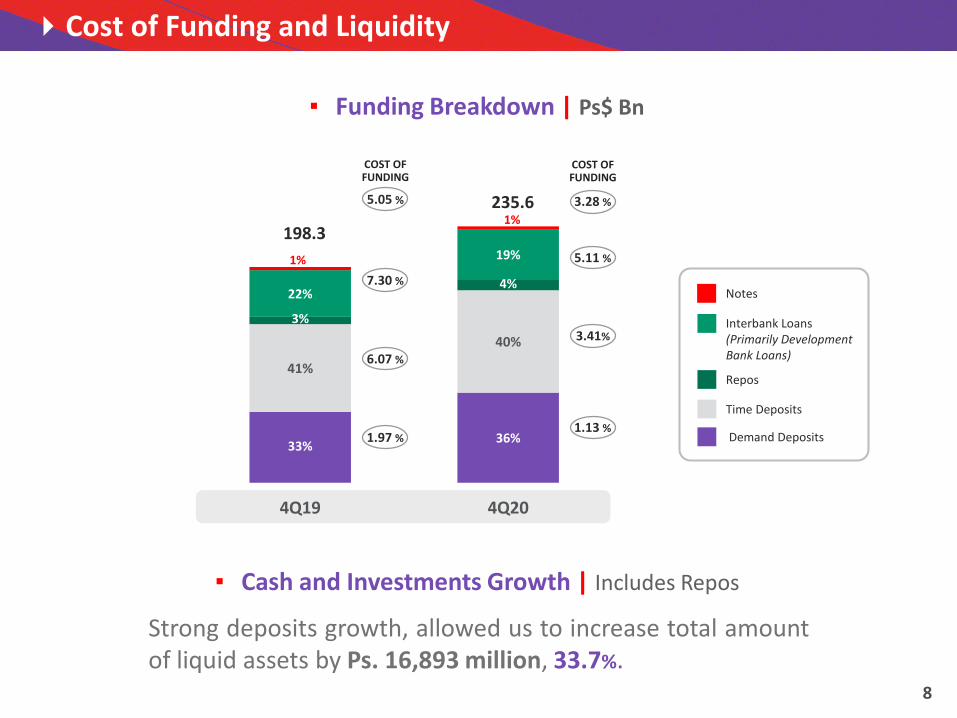
33%36%
41%
40%
3%
4%22%
19%1%
1%198.3
235.6
4Q19 4Q20
Cost of Funding and Liquidity
▪ Funding Breakdown | Ps$ Bn
Strong deposits growth, allowed us to increase total amountof liquid assets by Ps. 16,893 million, 33.7%.
▪ Cash and Investments Growth | Includes Repos
COST OFFUNDING
5.11 %
3.41%
1.13 %
3.28 %
7.30 %
6.07 %
1.97 %
5.05 %
COST OFFUNDING
8
Demand Deposits
Time Deposits
Interbank Loans(Primarily DevelopmentBank Loans)
Repos
Notes
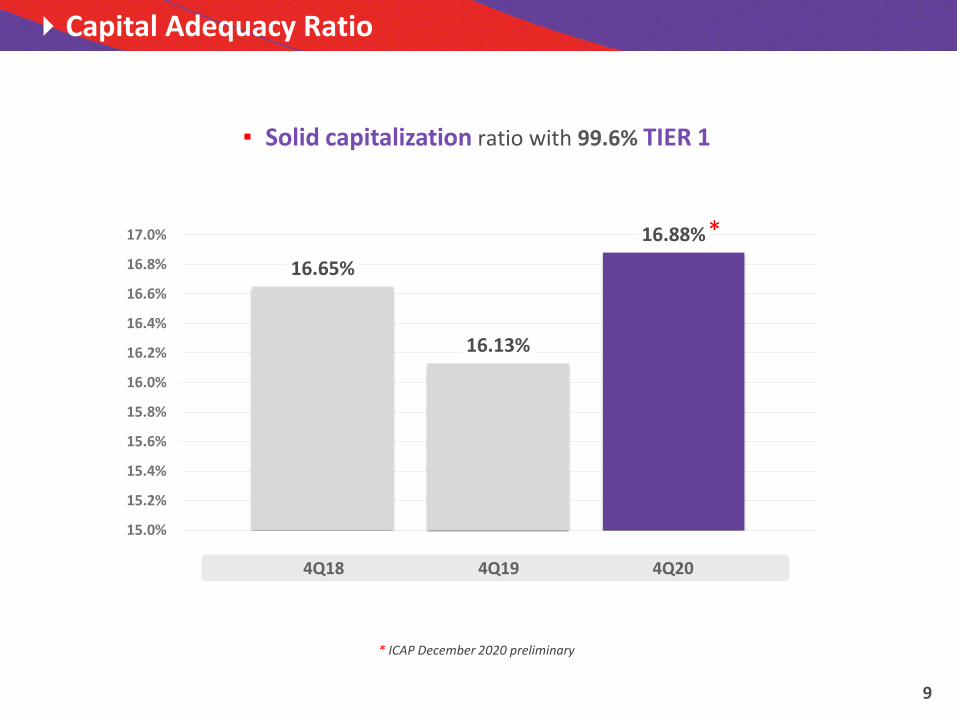
▪ Solid capitalization ratio with 99.6% TIER 1
* ICAP December 2020 preliminary
16.65%
16.13%
16.88%
15.0%
15.2%
15.4%
15.6%
15.8%
16.0%
16.2%
16.4%
16.6%
16.8%
17.0% *
4Q18 4Q19 4Q20
Capital Adequacy Ratio
9

42.9%44.0%
51.9%51.8%51.1%
55.5%
4Q18 4Q19 4Q20
BanBajio Peers Average (2)
Operating Expenses/Total Revenues (1) | %
▪ Efficiency Ratio for 4Q20 stood at 51.9% and 47.8% for 12M20,System 54.2%.
◥ Efficiency Ratio Evolution vs. Peers
Ps$ MM | Quarterly
◥ Total Revenues and Expenses (1)
Source: Company information
Notes:(1) Total Revenues (excluding Loan Loss Provisions).(2) Peers Include: Banorte, Banregio, BBVA Bancomer, Citibanamex, HSBC, Santander and Scotiabank
consolidated figures; last available information for the October and November 2020 period.
$500
$1,000
$1,500
$2,000
$2,500
$3,000
$3,500
$4,000
4Q18 1Q19 2Q19 1Q20 2Q20 3Q20 4Q20
Revenues Expenses
3,299
1,713
Efficiency Ratio
10

2021
▪ Loan Growth 6% - 8%
▪ Deposits Growth 7% - 10%
▪ NIM 3.9% - 4.0%
▪ Net Interest Income Change (4.4%) - (5.4%)
▪ Non Interest Income Growth 12% - 15%
▪ Expenses Growth 6.2% - 7.6%
▪ Efficiency Ratio Below 52%
▪ Cost of Risk 0.6% - 0.8%
▪ Net Income (Million Pesos) $3,650 - $3,800
▪ ROAE 9.9% - 10.5%
▪ NPL Ratio Below 1.8%
▪ Coverage Ratio Above 120%
▪ Capitalization Ratio* Above 16.0%
* Does not include possible dividend payment
Guidance 2021
11
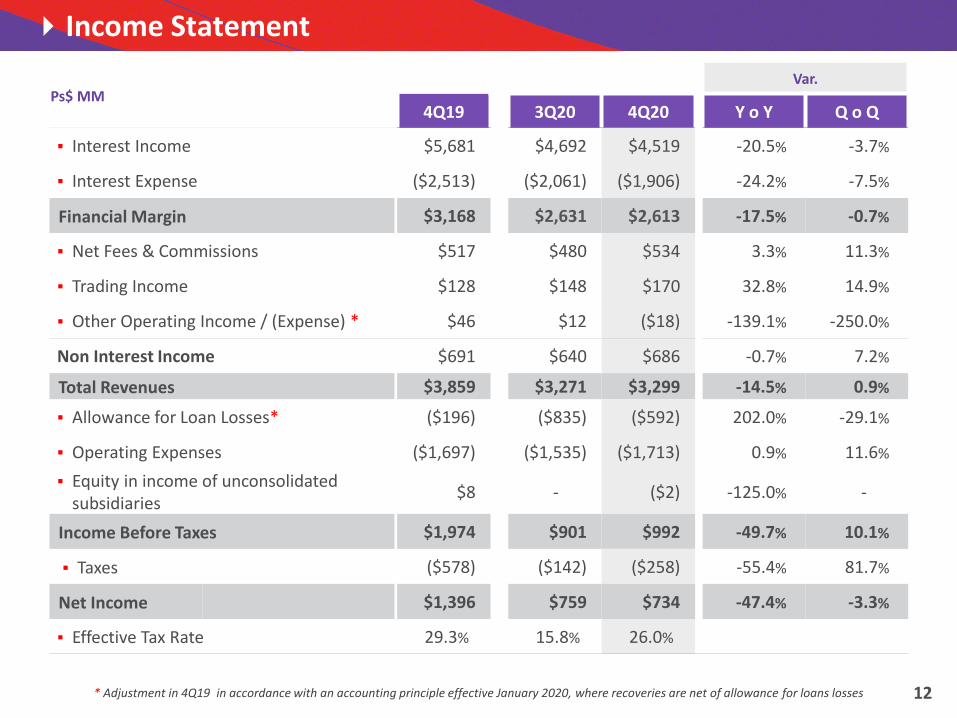
Ps$ MMVar.
4Q19 3Q20 4Q20 Y o Y Q o Q
▪ Interest Income $5,681 $4,692 $4,519 -20.5% -3.7%
▪ Interest Expense ($2,513) ($2,061) ($1,906) -24.2% -7.5%
Financial Margin $3,168 $2,631 $2,613 -17.5% -0.7%
▪ Net Fees & Commissions $517 $480 $534 3.3% 11.3%
▪ Trading Income $128 $148 $170 32.8% 14.9%
▪ Other Operating Income / (Expense) * $46 $12 ($18) -139.1% -250.0%
Non Interest Income $691 $640 $686 -0.7% 7.2%
Total Revenues $3,859 $3,271 $3,299 -14.5% 0.9%
▪ Allowance for Loan Losses* ($196) ($835) ($592) 202.0% -29.1%
▪ Operating Expenses ($1,697) ($1,535) ($1,713) 0.9% 11.6%
▪ Equity in income of unconsolidated subsidiaries
$8 - ($2) -125.0% -
Income Before Taxes $1,974 $901 $992 -49.7% 10.1%
▪ Taxes ($578) ($142) ($258) -55.4% 81.7%
Net Income $1,396 $759 $734 -47.4% -3.3%
▪ Effective Tax Rate 29.3% 15.8% 26.0%
* Adjustment in 4Q19 in accordance with an accounting principle effective January 2020, where recoveries are net of allowance for loans losses
Income Statement
12
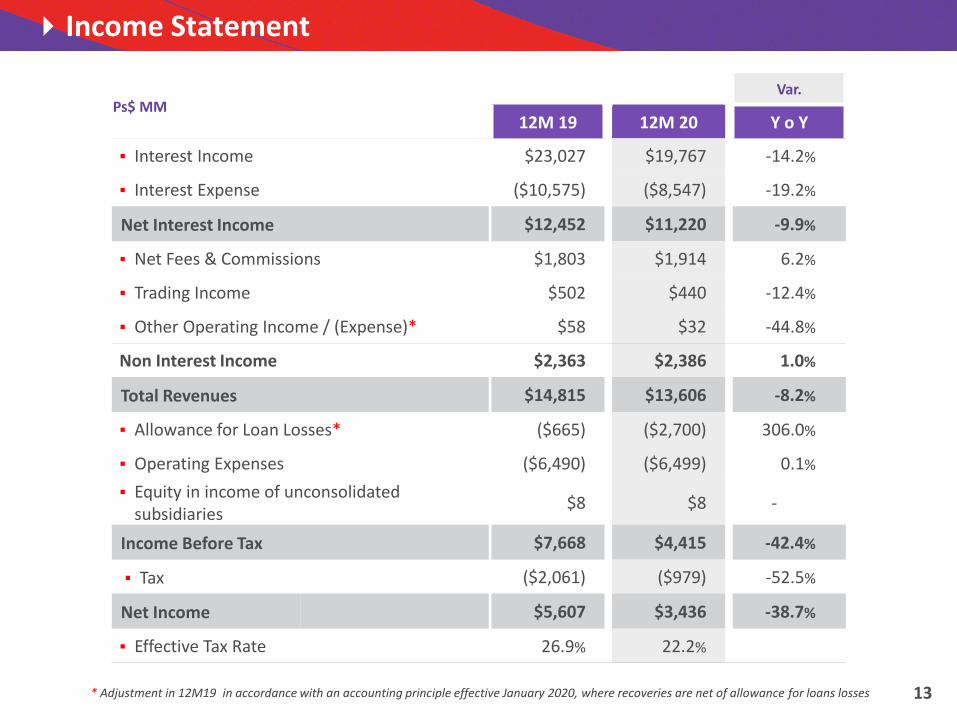
Ps$ MMVar.
12M 19 12M 20 Y o Y
▪ Interest Income $23,027 $19,767 -14.2%
▪ Interest Expense ($10,575) ($8,547) -19.2%
Net Interest Income $12,452 $11,220 -9.9%
▪ Net Fees & Commissions $1,803 $1,914 6.2%
▪ Trading Income $502 $440 -12.4%
▪ Other Operating Income / (Expense)* $58 $32 -44.8%
Non Interest Income $2,363 $2,386 1.0%
Total Revenues $14,815 $13,606 -8.2%
▪ Allowance for Loan Losses* ($665) ($2,700) 306.0%
▪ Operating Expenses ($6,490) ($6,499) 0.1%
▪ Equity in income of unconsolidated subsidiaries
$8 $8 -
Income Before Tax $7,668 $4,415 -42.4%
▪ Tax ($2,061) ($979) -52.5%
Net Income $5,607 $3,436 -38.7%
▪ Effective Tax Rate 26.9% 22.2%
* Adjustment in 12M19 in accordance with an accounting principle effective January 2020, where recoveries are net of allowance for loans losses
Income Statement
13
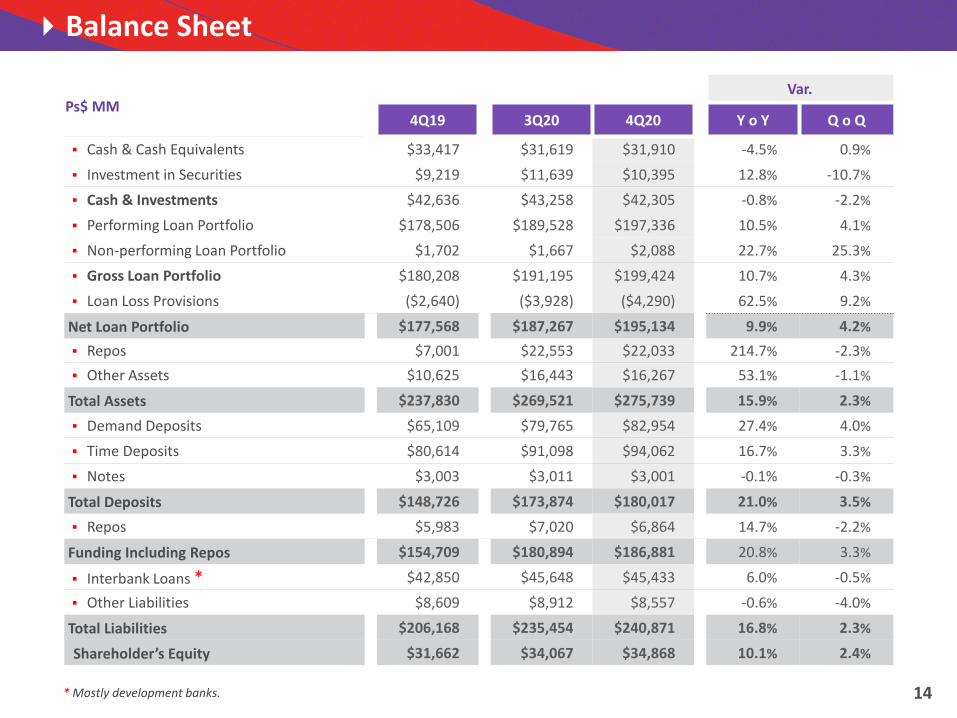
Ps$ MMVar.
4Q19 3Q20 4Q20 Y o Y Q o Q
▪ Cash & Cash Equivalents $33,417 $31,619 $31,910 -4.5% 0.9%
▪ Investment in Securities $9,219 $11,639 $10,395 12.8% -10.7%
▪ Cash & Investments $42,636 $43,258 $42,305 -0.8% -2.2%
▪ Performing Loan Portfolio $178,506 $189,528 $197,336 10.5% 4.1%
▪ Non-performing Loan Portfolio $1,702 $1,667 $2,088 22.7% 25.3%
▪ Gross Loan Portfolio $180,208 $191,195 $199,424 10.7% 4.3%
▪ Loan Loss Provisions ($2,640) ($3,928) ($4,290) 62.5% 9.2%
Net Loan Portfolio $177,568 $187,267 $195,134 9.9% 4.2%
▪ Repos $7,001 $22,553 $22,033 214.7% -2.3%
▪ Other Assets $10,625 $16,443 $16,267 53.1% -1.1%
Total Assets $237,830 $269,521 $275,739 15.9% 2.3%
▪ Demand Deposits $65,109 $79,765 $82,954 27.4% 4.0%
▪ Time Deposits $80,614 $91,098 $94,062 16.7% 3.3%
▪ Notes $3,003 $3,011 $3,001 -0.1% -0.3%
Total Deposits $148,726 $173,874 $180,017 21.0% 3.5%
▪ Repos $5,983 $7,020 $6,864 14.7% -2.2%
Funding Including Repos $154,709 $180,894 $186,881 20.8% 3.3%
▪ Interbank Loans * $42,850 $45,648 $45,433 6.0% -0.5%
▪ Other Liabilities $8,609 $8,912 $8,557 -0.6% -4.0%
Total Liabilities $206,168 $235,454 $240,871 16.8% 2.3%
Shareholder’s Equity $31,662 $34,067 $34,868 10.1% 2.4%
* Mostly development banks.
Balance Sheet
14