fourth quarter 2021 - raiffeisen bankengruppe
TRANSCRIPT

1
Investor presentation Fourth quarter 2021

2
Content
1 Macro data and banking sector Page 3
2 Raiffeisenlandesbank Oberoesterreich AG Page 9
3 Key figures Page 17
4 Funding Page 26
5 Cover Pool Page 30
6 Highlights Page 33
7 Contacts Page 35

3
MACRO DATA AND BANKING SECTOR

4
Source: EU-Commission, Statistik Austria, IWF;TFM/WPR-ER, 9/17/2021
Graphics: Forecast values IWF from 7/27/2021
DATA AND FACTS ON AUSTRIA
Gross domestic product in % Inflation in % Unemployment rate in %
General Data Austria 2020 Eurozone share
Population 8,901,064 2.6 %
Surface area (in km²) 83,879 3.0 %
Nominal GDP (in EUR bn) 379.0 3.3 %
GDP per capita (in EUR) 42,502 27.9 %
Budget balance (% of GDP) -8.9 -7.2
State debt ratio (% of GDP) 83.9 100.0
above average for euro zone
-9.0
-6.0
-3.0
0.0
3.0
6.0
2018 2019 2020 2021p 2022p
Österreich Eurozone
0.0
0.5
1.0
1.5
2.0
2.5
2018 2019 2020 2021p 2022p
Österreich Eurozone
0.0
2.0
4.0
6.0
8.0
10.0
12.0
2018 2019 2020 2021p 2022p
Österreich Eurozone

5Source: Statistik Austria; TFM/WPR-ER, 9/17/2021
DATA AND FACTS ON UPPER AUSTRIAGROSS REGIONAL PRODUCT AND RATING
Austria Upper Austria Styria Vorarlberg Vienna Tyrol Carinthia Salzburg Lower
Austria
Moody‘s Aa1 Aa1 Aa3 Aa1
S&P AA+ AA+ AA AA+ AA
Average gross regional product in Upper Austria in the last seven years was 0.2 % above that of Austria.
1.6 1.4
0.0 %
0.5 %
1.0 %
1.5 %
2.0 %
2.5 %
3.0 %
3.5 %
4.0 %
2012 2013 2014 2015 2016 2017 2018 2019 2012-19
Oberösterreich Österreich

6
5.6
8.4
0.0 %
2.0 %
4.0 %
6.0 %
8.0 %
10.0 %
12.0 %
2014 2015 2016 2017 2018 2019 2020 2014-20
Upper Austria Austria
Average unemployment in Upper Austria in the last seven years was 2.8 % below that for the whole of Austria.
DATA AND FACTS ON UPPER AUSTRIALABOUR MARKET
Source: Statistik Austria; TFM/WPR-ER, 9/17/2021

7
DATA AND FACTS 2020INDUSTRY LOCATION UPPER AUSTRIA
* Ranking of Upper Austria amongst the nine federal regions
Upper Austria in figures Upper Austria Ranking * As in % of AustriaPopulation 1,493,377 3 16.7
Surface area in km² 11,983 4 14.3
People in employment (in thousand) 665.7 2 17.9
Production value (industry) in EUR billions 38.2 1 24.9
Exports (goods) in EUR billions 36.7 1 25.8
The production value (industry incl. construction) of around EUR 38.2 billion equates to a relative share in the total production value (industry incl. construction) of Austria of 24.9 %
Industrial sectors/production data Upper Austria in EUR billions Austria in EUR billions As in % of Austria
Machinery and metal goods 10.6 35.9 29.5
Vehicles (automotive) 7.3 15.4 47.4
Chemical industry 4.9 14.6 33.6
Non-ferrous metal 2.5 10.1 24.8
Food 2.1 7.5 28.0
Construction 1.9 4.1 46.3
Source: Statistik Austria; TFM/WPR-ER, 9/17/2021

8
April 2021
Source: Balance Sheet Reports 12/31/2020
THE LARGEST AUSTRIAN BANKSREPORTING DATE 31 DECEMBER 2020
Ranking Banking institution Balance sheet in billion EUR Employees CET 1 Ratio in %
1 Erste Group Bank AG 277.4 45,690 14.2
2 Raiffeisen Bank International AG - RBI 166.0 45,414 13.6
3 Unicredit Bank Austria AG 101.7 5,215 17.3
4 BAWAG P.S.K. AG 53.1 4,071 14.0
5 Raiffeisenlandesbank Oberösterreich AG 48.6 1,442 15.5
6 Österreichische Kontrollbank AG 35.5 523 77.4
7 Raiffeisenlandesbank Niederösterreich AG 27.7 1,178 13.9
8 Oberbank AG 24.4 2,168 17.8
9 HYPO NOE Gruppe (Konzern) 16.4 613 17.9
10 Raiffeisenlandesbank Steiermark AG 16.0 636 19.4

9
RLB OberoesterreichAG

10
SHAREHOLDER STRUCTURE RAIFFEISEN BANKING GROUP
RaiffeisenBank
International
8 Raiffeisen-landes-banken
370 Raiffeisen-
banken
Austria Upper Austria
Across Austria, 343 independent Raiffeisenbanks
Majority shareholders in RBI
100 %
58.80 %Free Float
41.20 %Raiffeisen
BankInternational
Raiffeisen-landesbank
OOE
75 Raiffeisen-
banken
100 %
9.5 %
Across Upper Austria, 75 independent
Raiffeisenbanks with a total of 404 branches
Shareholder in RBI
April 2021

11April 2021
INSTITUTIONAL PROTECTION SCHEME (IPS)RAIFFEISEN GROUP
contractual or statutory liability agreement, liquidity and solvency of the banks is secured IPS has a suitable early detection system and carries out its own risk assessments annual consolidated financial statements or report no multiple use of capital the members need to commit to an essentially homogeneous business profile
non-deduction of the participation in the central bank 0% weighting of liabilities within the IPS OTC derivatives can be entered into between IPS members without an external clearing house
IPS in accordance with Article 113 (7) and Article 49 (3) Capital Requirements Regulation (CRR)
Essential requirements of the CRR:
Benefits of membership for the participating banks

12April 2021
THE BASIS FOR A SUCESSFUL FUTURE – KEY DATA ONRAIFFEISENLANDESBANK OBEROESTERREICH GROUP
Facts Austria's fifth largest bank Austria's largest Raiffeisenlandesbank Rooted in Austria's strongest business region Outstanding regional strength in Upper Austria and in the region of Southern Germany
Key income figures 2020 (in EUR M)
Balance sheet total: 48,569 Pre-tax profit: 182
Raiffeisenlandesbank Oberoesterreich AG operates in the strongest growing region of Austria. Average economic growth in Upper Austria was 0.2 % above the average for Austria as a whole in the last eight years. Furthermore, overall production value at about 24.9 % far exceeds the average for Austria.
Equity figures 2020 (in %)
CET 1 Ratio: 15.5 Total Capital Ratio: 17.1

13April 2021
BRANCHES IN CENTRAL EUROPERAIFFEISENLANDESBANK OBEROESTERREICH GROUP
Raiffeisen Banking Group Upper Austria’s market shares by target group:
Industrial companies 85.2% SMEs 37.8% Private customers 55.8%
Austria Upper Austria Salzburg Vienna
Southern Germany Augsburg Heilbronn Munich Nuremberg Passau Regensburg Stuttgart Ulm Wuerzburg
Czech Republic Prague

14April 2021
STRATIGIC BUSINESS FIELDSRAIFFEISENLANDESBANK OBEROESTERREICH GROUP
RaiffeisenlandesbankOberoesterreich AG is focused on meeting the needs of its customers and places its Corporate and Private customer business as well as Financial Market business at the centre of its activities. Cooperation with the independent Raiffeisenbanks operating in Upper Austria forms a central component in strengthening the market position in the region.
Treasury Financial Marketsasset-liability-management and customer treasury
Corporatescorporate and institutional customers
Retail & Private Bankingprivate-, commercial- and affluent private customers
Raiffeisenbankenstrategic collaboration
Equity investmentparticipations based on regional responsibility

15
activ factoring AG, München
Raiffeisen-IMPULS-Leasing Gesellschaft m.b.H.
KEPLER-FONDS Kapitalanlagegesellschaft m.b.H.
Oberösterreichische Landesbank AG
Raiffeisenbank a.s., Prag
Oberösterreichische Versicherung AG
Raiffeisen Bank International AG 1)
Stand: September 2021
100 %
100 %
GRZ IT Center GmbH
VIVATIS Holding AG 2)
efko Frischfrucht und Delikatessen GmbH
Österreichische Salinen AG
AMAG Austria Metall AG
Energie AG 3)
voestalpine AG 4)
REAL-TREUHAND Management GmbH
RealRendite Immobilien GmbH
RealBestand Immobilien GmbH & Co KG
9.96 %16.50 %
13.54 %
13.97 %
100 %
100 %
41.25 %
51.00 %64.00 %
41.14 %
25.00 %
87.24 %
100 %
100 %
9.51 %
Raiffeisen Bank International AG Raiffeisenbank a.s., Prag Oberösterreichische Landesbank AG
AMAG Österreich. Salinen AG voestalpine AG 2) proportion of shares with voting rights <15%, 10.24 % RLB indirectly via RLB OOE Invest
3) cumulative shares incl. Raiffeisen Banking Group Upper Austria4) over PS RLB OOE
REAL ESTATE
1) proportion of shares with voting rights
BANKS AND FINANCIAL INSTITUTIONS
SHAREHOLDINGS WITH AT-EQUITY VALUATION (extract)
OPPORTUNITY- AND PARTNER CAPITAL
OUTSOURCING & BANK-RELATED INVESTMENTS
INVESTMENT PORTFOLIORAIFFEISENLANDESBANK OBEROESTERREICH GROUP

16April 2021
RATING AND SUPERVISIONRAIFFEISENLANDESBANK OBEROESTERREICH GROUP
Moody‘sLong-term creditworthiness A3Short-term creditwothiness P-2Outlook stableMortgage Covered Bond Rating AaaISS ESGSustainability rating (ISS-ESG) C (Prime)
Raiffeisenlandesbank Oberoesterreich AG is the only Austrian Raiffeisenlandesbank which qualifies as a significant bank and is therefore supervised by the European Central Bank (ECB)

17
KEY FIGURES
18April 2021
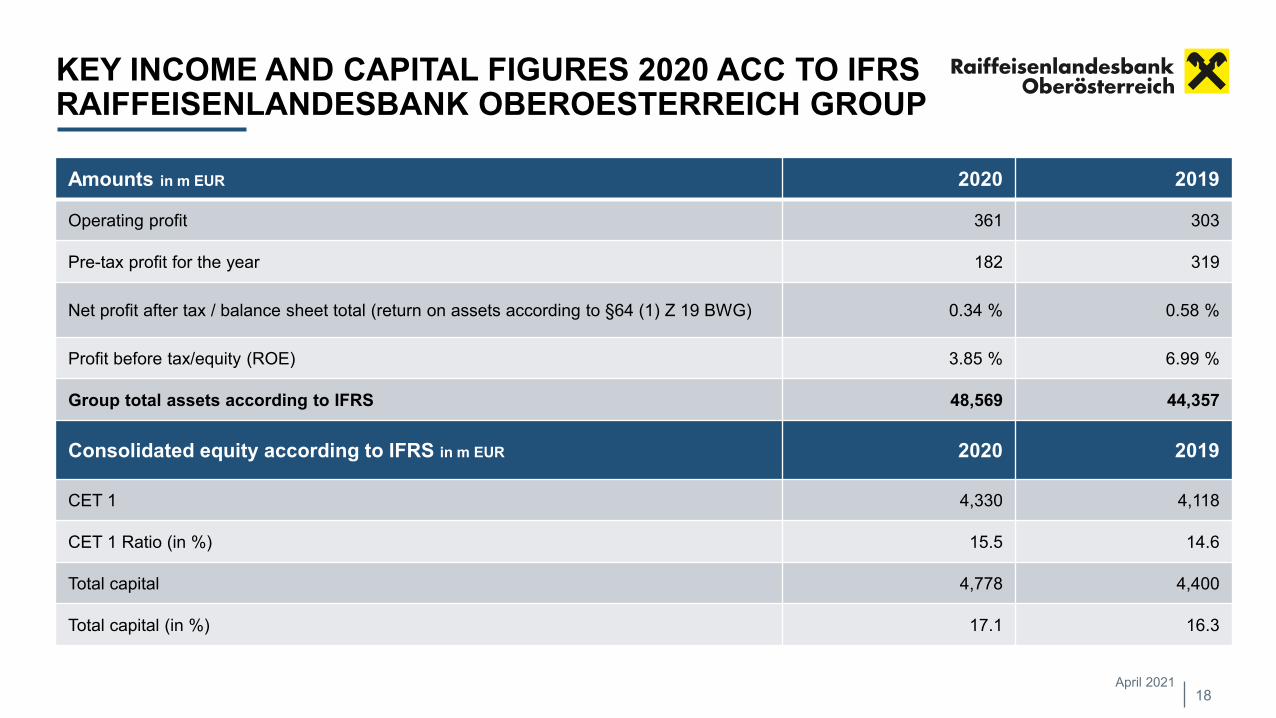
KEY INCOME AND CAPITAL FIGURES 2020 ACC TO IFRS RAIFFEISENLANDESBANK OBEROESTERREICH GROUP
Amounts in m EUR 2020 2019
Operating profit 361 303
Pre-tax profit for the year 182 319
Net profit after tax / balance sheet total (return on assets according to §64 (1) Z 19 BWG) 0.34 % 0.58 %
Profit before tax/equity (ROE) 3.85 % 6.99 %
Group total assets according to IFRS 48,569 44,357
Consolidated equity according to IFRS in m EUR 2020 2019
CET 1 4,330 4,118
CET 1 Ratio (in %) 15.5 14.6
Total capital 4,778 4,400
Total capital (in %) 17.1 16.3

19April 2021
Amounts in m EUR 30 June 2021 30 June 2020
Total assets 50,615 47,896
Operating profit -227.6 -83.1
Pre-tax profit for the period -297.7 -216.0
Total comprehensive income for the period -243.0 -258.1
Consolidated equity according to IFRS in m EUR 30 June 2021 30 June 2020
Common Equity Tier 1 4,238 3,813
Common Equity Tier 1 Ratio (in %) 14.9 13.3
Total Capital 4,704 4,281
Total Capital Ratio (in %) 16.6 15.0
INTERIM RESULTS 2021 UNDER IFRSRAIFFEISENLANDESBANK OOE GROUP

20April 2021
GROUP BALANCE SHEET ACC TO IFRS - 2015-2020 RAIFFEISENLANDESBANK OBEROESTERREICH GROUP
318
244
534
369319
182
0
100
200
300
400
500
600
2015 2016 2017 2018 2019 2020
282 260
558
368303
361
0
100
200
300
400
500
600
2015 2016 2017 2018 2019 2020
13.814.6
15.8 15.114.6
15.5
5.0
10.0
15.0
20.0
2015 2016 2017 2018 2019 2020
304
205
492
299256
163
0
100
200
300
400
500
600
2015 2016 2017 2018 2019 2020
PRE-TAX PROFIT FOR THE YEAR (in EUR M) AFTER-TAX PROFIT FOR THE YEAR (in EUR M)
OPERATING PROFIT (in EUR M) CET 1 RATIO (in %)

21Stand: April 2021; Figures of 12/31/2020
NON-PERFORMING-LOANSRAIFFEISENLANDESBANK OBEROESTERREICH GROUP
8.4
5.9
4.4
2.6
1.8 1.8
0
5
10
2015 2016 2017 2018 2019 2020
NPL RATIO– IN %
The NPL target of below 2% was reached in 2019 and has remained stable at 1.8% in the challenging "Corona- Year" 2020

22April 2021; Figures of 12/31/2020
RISK-WEIGHTED-ASSETSRAIFFEISENLANDESBANK OBEROESTERREICH GROUP
15,000
17,500
20,000
22,500
25,000
27,500
30,000
2015 2016 2017 2018 2019 2020
IN TEUR 31.12.2020 31.12.2019Own funds requirements for credit, counterparty and dilution risk 26,305,882 26,606,112Own funds requirements for processing and delivery risks 0 11Own funds requirements for position, foreign currency and commodity risks 81,906 120,784Own funds requirements for operational risks 1,420,634 1,303,539Own funds requirements for adjustments to credit avaluation (CVA) 96,162 93,410Risk weighted assets 27,904,584 28,123,857
in E
UR
M

23April 2021
LIQUIDITY AND EQUITY FIGURESRAIFFEISENLANDESBANK OBEROESTERREICH GROUP
2015 2016 2017 2018 2019 2020
Liquidity Coverage Ratio (LCR) in % 98 117 128 128 123 161
Net Stable Funding Ratio (NSFR) in % 101 106 107 110 112 122
2015 2016 2017 2018 2019 2020
CET 1 in Mio. EUR 3,165 3,402 3,911 3,977 4,118 4,330
Tier 2 (T 2) in Mio. EUR 680 562 502 423 466 448
Total Capital in Mio. EUR 3,845 3,964 4,413 4,400 4,584 4,779
RWA in Mio. EUR 22,894 23,276 24,797 26,276 28,124 27,905
CET 1 Ratio in % 13.8 14.6 15.8 15.1 14.6 15.5
Total Capital Ratio in % 16.8 17.0 17.8 16.8 16.3 17.1
CRR circle of the RBG OOE Verbund eGen / Figures as of 12/31 each year
24April 2021
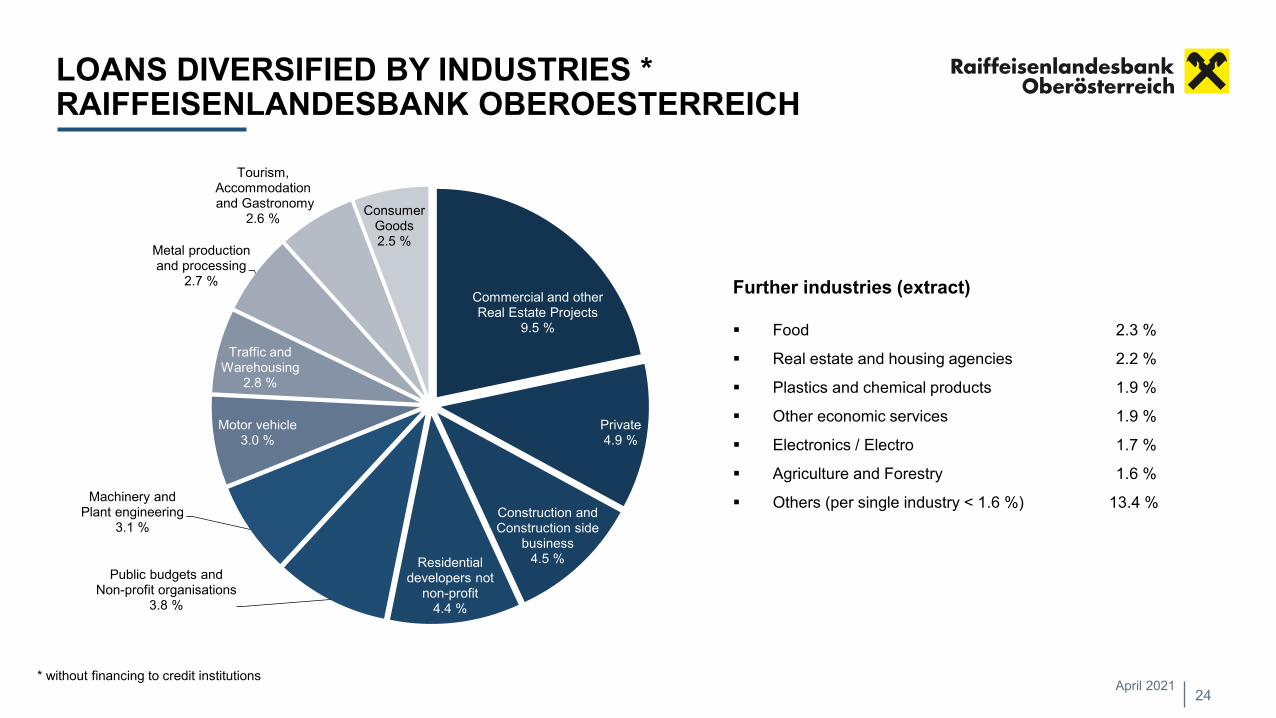
LOANS DIVERSIFIED BY INDUSTRIES *RAIFFEISENLANDESBANK OBEROESTERREICH
Further industries (extract)
Food 2.3 %
Real estate and housing agencies 2.2 %
Plastics and chemical products 1.9 %
Other economic services 1.9 %
Electronics / Electro 1.7 %
Agriculture and Forestry 1.6 %
Others (per single industry < 1.6 %) 13.4 %
Commercial and other Real Estate Projects
9.5 %
Private4.9 %
Construction and Construction side
business 4.5 %Residential
developers not non-profit
4.4 %
Public budgets and Non-profit organisations
3.8 %
Machinery and Plant engineering
3.1 %
Motor vehicle3.0 %
Traffic and Warehousing
2.8 %
Metal production and processing
2.7 %
Tourism, Accommodationand Gastronomy
2.6 % Consumer Goods2.5 %
* without financing to credit institutions

25April 2021
LOANS DIVERSIFIED BY COUTRYRAIFFEISENLANDESBANK OBERÖSTERREICH
Österreich
Deutschland
More than 85 % of all loans and advances to customers are from Austria and Germany
Austria68.7 %
Germany17.4 %Czech Republic
3.3 %
Slovakia1.4 %
Romania1.2 %
Poland1.0 %
USA1.0 %
France0.8 %
Others 5.3 %

26
FUNDING

27April 2020
FUNDING AND ISSUANCE STRUCTURERAIFFEISENLANDESBANK OBEROESTERREICH
Own issues 23.5 %
Customer deposits 29.6 %
Interbank deposits 27.2 %
Interbank deposits RBG OOE* 19.7 %
Senior 60.3 %
Covered 29.5 %
Subordinated 10.2 %
Funding
*Raiffeisen Bank Group Upper Austria
28End of fiscal year 2020
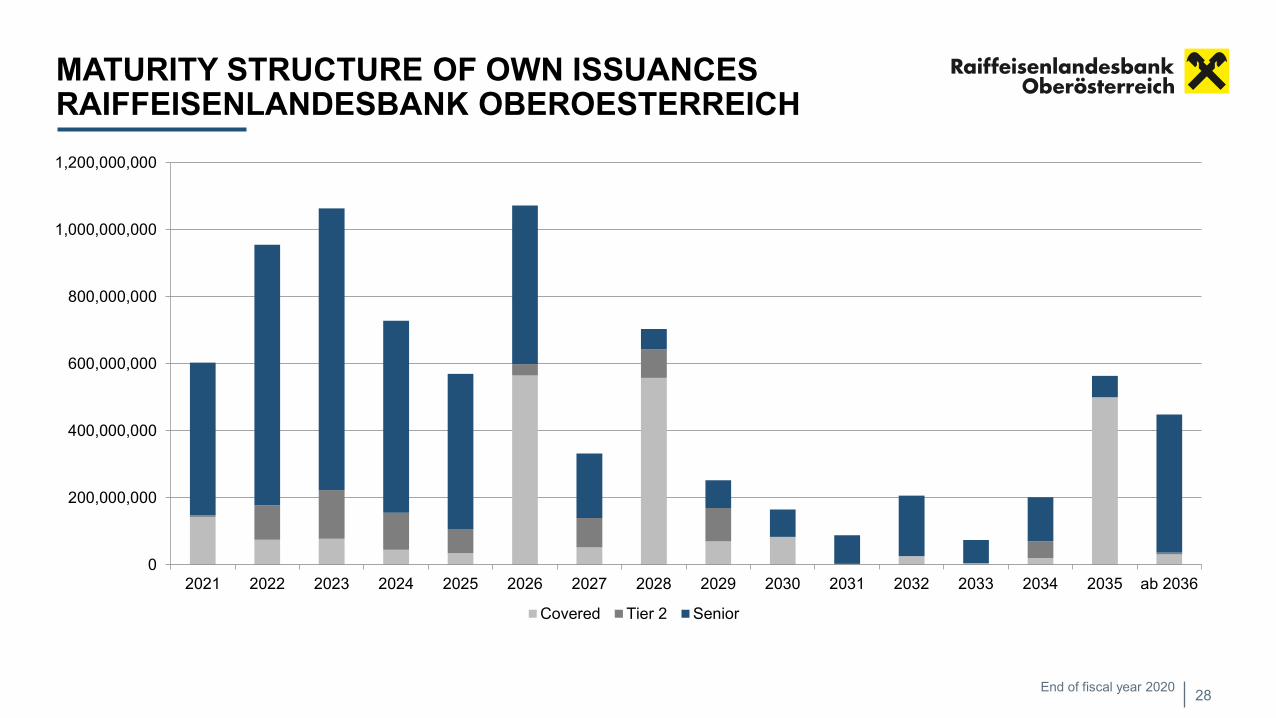
MATURITY STRUCTURE OF OWN ISSUANCES RAIFFEISENLANDESBANK OBEROESTERREICH
0
200,000,000
400,000,000
600,000,000
800,000,000
1,000,000,000
1,200,000,000
2021 2022 2023 2024 2025 2026 2027 2028 2029 2030 2031 2032 2033 2034 2035 ab 2036
Covered Tier 2 Senior

29
Raiffeisenlandesbank Oberoesterreich entered the capital market for the first time in September 2016 with a EUR 500 million 10-year mortgage backed benchmark bond.
The first Senior Unsecured EUR 500 million benchmark bond followed in November 2017. It was the first Senior Unsecured benchmark bond in Austria since Mai 2014.
In July 2018 a further EUR 500 million issue of a 10-year mortgage backed benchmark bond was placed.
Raiffeisenlandesbank Oberoesterreich was one of the first issuers in 2020 and placed a 10-year mortgage backed benchmark bond in January.
All the issues had a volume of EUR 500 million and were substantially oversubscribed and well placedin the capital market.
BENCHMARK ISSUESRAIFFEISENLANDESBANK OBEROESTERREICH
September 2021

30
COVER POOL

31
Mortgage Covered Bond Rating (Moody‘s): Aaa
Loans are exclusively denominated in EUR – no currency risk
100 % Austrian debt, thereof 76 % in Upper Austria
No NPL’s in the cover pool
No derivatives in the cover pool
High granularity - around 31,978 loans in the cover pool
Broad-based new mortgage loans through 75 local Raiffeisenbanks in Upper Austria
RLB OOE is a member of the Pfandbriefforum in Austria - www.pfandbriefforum.at
COVER POOL FACTSRAIFFEISENLANDESBANK OBEROESTERREICH
April 2020
ISS-ESG Sustainability Rating: C (Prime) / Sustainalytics ESG Rating: 19.3 – Low Risk

32April 2021
MORTGAGE COVER POOL RAIFFEISENLANDESBANK OBEROESTERREICHin EUR M as of 31 December 2020Cover Pool Volume 4,015
thereof RLB OOE 780
thereof Raiffeisenbanken Oberoesterreich 3,235
Outstanding bond volume * 1,957
Coverage absolute 2,257
Coverage in line with Moody‘s 2,058
Necessary coverage according to Moody‘s 105
Weighted average LTV according to Austrian definition** 54
Share of 10 largest loans of cover pool in % 1,4
* Not including accumulated interest, zero coupon bonds current value with accumulated interest** LTV Austrian definition: Amount in coverage per loan/total sum of current property values minus preferential mortgagesNote:All information and assessments relate to the reporting date as of 12/2020. The structure of both cover pools changes constantly – with due regard to the legal Austrian framework conditions (section 1 sub-section 5 of the Covered Bond Act).

33
HIGHLIGHTS
34
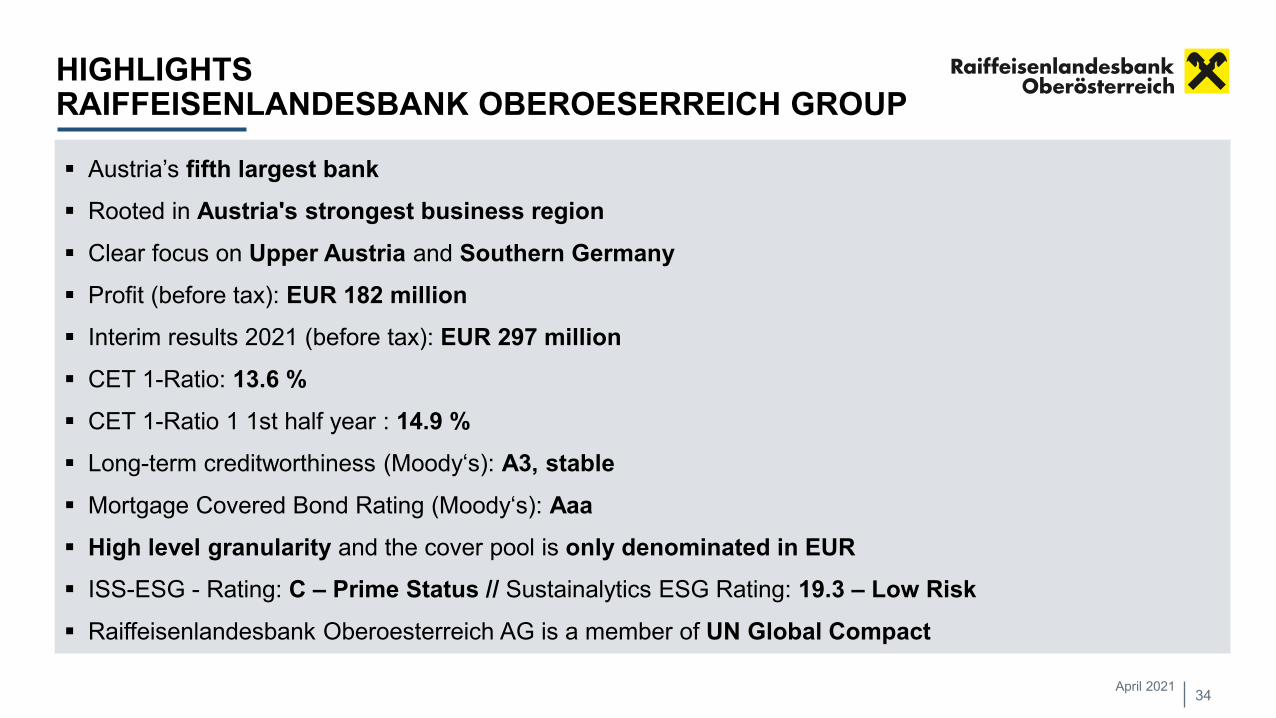
Austria’s fifth largest bank Rooted in Austria's strongest business region Clear focus on Upper Austria and Southern Germany Profit (before tax): EUR 182 million Interim results 2021 (before tax): EUR 297 million CET 1-Ratio: 13.6 % CET 1-Ratio 1 1st half year : 14.9 % Long-term creditworthiness (Moody‘s): A3, stable Mortgage Covered Bond Rating (Moody‘s): Aaa High level granularity and the cover pool is only denominated in EUR ISS-ESG - Rating: C – Prime Status // Sustainalytics ESG Rating: 19.3 – Low Risk Raiffeisenlandesbank Oberoesterreich AG is a member of UN Global Compact
April 2021
HIGHLIGHTSRAIFFEISENLANDESBANK OBEROESERREICH GROUP

35
CONTACT DETAILS

36
CONTACT DETAILS
Christian RatzHead of Treasury Financial Markets
+43 732 65 [email protected]
Andreas ZakSenior Manager Financial Markets
+43 732 65 [email protected]
Josef BuhlHead of Financial Markets
+43 732 65 [email protected]
Mario EnnsbrunnerFinancial Markets
+43 732 65 [email protected]
Reinhard IlkFinancial Markets
+43 732 65 [email protected]
Jennifer Ann RadnerHead of Correspondent Banking
+43 732 65 [email protected]

37
RISK INFORMATION AND EXCLUSION OF LIABILITY
This document is neither a marketing communication nor a financial analysis. It is merely information on general economic data and institution-related data. This document is based on public information and has been prepared by Raiffeisenlandesbank Oberösterreich AG for information purposes only. The information, analyses and forecasts contained therein are based on the state of knowledge and the market assessment at the time of preparation - subject to changes and amendments. Raiffeisenlandesbank Oberösterreich AG assumes no liability for the accuracy, timeliness and completeness of the content or for the occurrence of forecasts. The contents are non-binding and do not constitute a recommendation to buy or sell. Since every investment decision requires individual adjustment to the investor's personal circumstances (e.g. risk tolerance), this information does not replace personal advice and risk clarification by the customer advisor in the course of an advisory meeting. It is expressly pointed out that financial instruments and investments sometimes involve considerable risks. Information on performance refers to the past and is therefore not a reliable indicator of future performance. Currency fluctuations in non-euro investments may increase or decrease the performance. Detailed risk information and disclaimer at www.rlbooe.at/disclaimer
Status: 9/15/2021