fourth quarter and full year 2018 earnings
TRANSCRIPT

February 8, 2019Fourth Quarter and Full Year 2018 Earnings

Safe Harbor
FORWARD-LOOKING STATEMENTS: This presentation contains forward-looking statements concerning management's expectations, goals, objectives and similar matters, which are subject to risks and uncertainties. These forward-looking statements may include comments concerning our product and entertainment plans, anticipated product performance, business opportunities,plans and strategies, costs, financial goals and expectations for our future financial performance and achieving our objectives, as well as the anticipated impact of foreign exchange rates. There are many factors that could cause actual results and experience to differ materially from the anticipated results or other expectations expressed in these forward-looking statements, including consumer and retailer interest in and acceptance of our products and product lines, changes in marketing and business plans and strategies as well as future global economic conditions, including foreign exchange rates. Some of those factors are set forth in the Company's Annual Reports on Form 10-K, in the Company's Quarterly Reports on Form 10-Q, in the Company's Current Reports on Form 8-K, the risk factors in the earnings release for the fourth quarter and full year 2018 and in the Company's other public disclosures.
The Company undertakes no obligation to make any revisions to the forward-looking statements contained in this presentation to reflect events or circumstances occurring after the date of this presentation.
REGULATION G: Information required by Securities and Exchange Commission Regulation G, regarding non-GAAP financial measures, as well as other financial and statistical information, will be available at the time of the conference call on the Investor Relations’ section of Hasbro’s website at: investor.hasbro.com, under the subheading “Financials & Filings – Quarterly Results.”
2
Brand Blueprint
3

MANAGED DISRUPTIVE YEARPOSITIONED FOR PROFITABLE GROWTH
2018 was a disruptive year• Managed through the loss of Toys“R”Us revenues in the U.S., Europe and Asia Pacific while taking strategic steps to
drive long-term success.• Expanding with existing retailers; Growing online revenues; Adding new retail doors
• Europe continues to address changing consumer behaviors, a rapidly evolving retail landscape and reducing retail inventory amidst challenging economic conditions in most economies, notably in the U.K.
• Retailers’ inventory down meaningfully in U.S. and Europe • Modernizing global organization-streamlined and focused our teams, cutting costs across the business
• Re-shaped the organization to be a more agile, modern and digitally driven play and entertainment company
Positioned for Profitable Growth in 2019 • New Innovation across all brand portfolios; New Gaming experiences across all formats• Robust entertainment and innovation for 2019, including POWER RANGERS launch, new brand innovation and film
slate which appeals to broad demographics• Right-sized expense model
Strong financial position despite a challenging year • $1.18 billion in cash at year end; Generated $646.0M in operating cash flow• Board of Directors increased dividend by 8%, or $0.05 per share, to $0.68 per share • Returned approximately $559.4M through dividend payments and share repurchases in 2018
4

FY 2018 Net Revenues $4.6B, down 12% year-over-year• Revenue decline due to the loss of Toys“R”Us revenues in the U.S., Europe and Asia Pacific, including a larger than expected impact from liquidated
inventory in the markets; rapidly evolving retail landscape and reduced retailer inventory, amidst challenging economic conditions in key markets, notably the U.K.
• $43.0M negative impact from foreign exchange • U.S. and Canada segment down 10%; International segment down 17%; Entertainment and Licensing segment up 5%
Full-Year 2018 Brand Portfolio Revenue Performance
• Franchise Brands down 9%; Partner Brands down 22%; Hasbro Gaming down 12%; Emerging Brands up 1%• BEYBLADE, MARVEL, LOST KITTIES, DUNGEONS & DRAGONS, MONOPOLY and MAGIC:THE GATHERING grew for the full year
2018
Operating Profit: $331.1M in FY 2018 vs. $810.4M in FY 2017• FY 2018 operating profit includes pre-tax charges of $267.3 million excluded in the reconciliation of as reported to adjusted operating
results*
Net Earnings: FY 2018 was $220.4M, or $1.74 per diluted share vs. $396.6M, or $3.12 per diluted share in FY 2017• Adjusted Net Earnings for FY 2018 were $488.8 million, or $3.85 per diluted share, excluding aggregate after-tax charges of $268.4
million, or $2.11 per diluted share*• Adjusted Net Earnings for FY 2017 were $693.1 million, or $5.46 per diluted share, excluding charges of $296.5M, or $2.33 per diluted
share relating to U.S. tax reform*
Strong Financial Position & Balance Sheet
• $1.18B in cash at year end; Board increased 2019 quarterly dividend by 8%• Generated $646.0M in operating cash flow• Returned $559.4M to shareholders through dividend payments and share repurchases in FY 2018
FULL-YEAR SNAPSHOT
5*A reconciliation of reported to adjusted operating profit can be found on slide 28 and a reconciliation of reported to adjusted net earnings and EPS can be found on slide 29

Q4 2018 Net Revenues $1.39B, down 13% year-over-year• Revenue decline due to the loss of Toys“R”Us revenues in the U.S., Europe and Asia Pacific, including a larger than expected impact from
liquidated inventory in the markets; rapidly evolving retail landscape and reduced retailer inventory amidst challenging economic conditions in key markets, notably the U.K
• $35.1M unfavorable impact from foreign exchange• U.S. and Canada segment down 9%; International segment down 14%; Entertainment and Licensing segment down 31%
Fourth Quarter 2018 Brand Portfolio Revenue Performance
• Franchise Brands down 8%; Partner Brands down 20%; Hasbro Gaming down 22%; Emerging Brands up 5%• LOST KITTIES, DUNGEONS & DRAGONS, BEYBLADE, MARVEL, MAGIC: THE GATHERING, and MONOPOLY grew in the quarter
Operating Profit: $10.5M in Q4 2018 vs. $271.1M in Q4 2017• Adjusted operating profit of $190.0M excludes pre-tax charges of $179.5M*• Adjusted operating profit margin of 13.7%
Net Earnings: Q4 2018 was $8.8M, or $0.07 per diluted share, vs. a loss of $5.3M, or $0.04 per diluted share, in Q4 2017
• Adjusted Net Earnings for Q4 2018 were $169.6 million, or $1.33 per diluted share, excluding net after-tax charges of $160.8M or $1.26 per diluted share*
• Adjusted Net Earnings for Q4 2017 were $291.2 million, or $2.30 per diluted share, excluding charges of $296.5M, or $2.35 per diluted share relating to U.S. tax reform*
FOURTH QUARTER SNAPSHOT
6
*A reconciliation of reported to adjusted operating profit can be found on slide 28 and a reconciliation of reported to adjusted net earnings and EPS can be found on slide 29
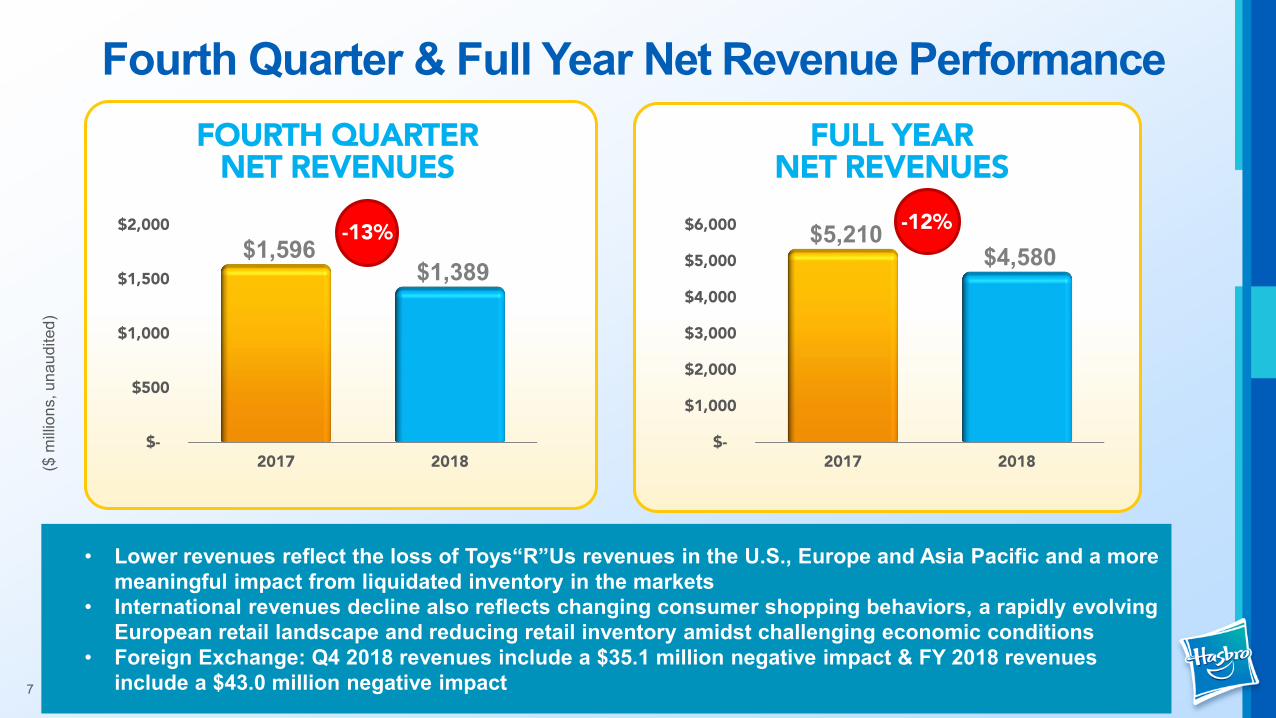
Fourth Quarter & Full Year Net Revenue Performance
• Lower revenues reflect the loss of Toys“R”Us revenues in the U.S., Europe and Asia Pacific and a more meaningful impact from liquidated inventory in the markets
• International revenues decline also reflects changing consumer shopping behaviors, a rapidly evolving European retail landscape and reducing retail inventory amidst challenging economic conditions
• Foreign Exchange: Q4 2018 revenues include a $35.1 million negative impact & FY 2018 revenues include a $43.0 million negative impact7
v
($ m
illion
s, u
naud
ited)
$-
$1,000
$2,000
$3,000
$4,000
$5,000
$6,000
2017 2018
$5,210 $4,580
-12%
FOURTH QUARTER NET REVENUES
$-
$500
$1,000
$1,500
$2,000
2017 2018
$1,596 $1,389
-13%
FULL YEAR NET REVENUES

($ m
illion
s, u
naud
ited)
Fourth Quarter Segment Net Revenues
U.S. & CANADAReflects the loss of Toys“R”Us revenues,
more meaningful impact from liquidation of inventory in the marketplace; Meaningful
decline in retail inventory
INTERNATIONAL ENTERTAINMENT & LICENSING
Unfavorable impact from changes in revenue recognition, including the timing
of revenue recognition for minimum license contracts
$-
$200
$400
$600
$800
U.S. and Canada International Entertainment and Licensing
$751 $723
$123
$686 $618
$85
2017 2018
-9% -14%
-31%
8
G11 Toy Industry Declined 6% in Q4 2018*
Reflects loss of Toys”R”Usrevenues in Europe &
Asia Pacific; Macroeconomic factors; Meaningfully lowered retail inventory
*According to NPD

($ m
illion
s, u
naud
ited)
Full Year Segment Net Revenues
ENTERTAINMENT & LICENSING
• Favorable impact from changes in revenue recognition in 2018;
• Signed multi-year digital content deal;• Reflects loss of consumer products revenue
at Toys”R”Us
$-
$500
$1,000
$1,500
$2,000
$2,500
$3,000
U.S. and Canada International Entertainment and Licensing
$2,691
$2,234
$286
$2,433
$1,848
$299
2017 2018
-10% -17%
+5%
9
U.S. & CANADA• Reflects the loss of Toys“R”Us revenues &
the impact from the liquidation of inventory in the market;
• Retailer efforts to lower inventory; • Retail inventory down significantly
INTERNATIONAL• Reflects loss of Toys”R”Us revenues in
Europe & Asia Pacific; • Macroeconomic factors; • Meaningfully lowered retail inventory

International Segment RevenuesQ4 2018
AS REPORTED
Q4 2018ABSENT FX
FY 2018AS
REPORTEDFY 2018
ABSENT FX
Europe -22% -18% -24% -24%
Latin America -- +7% -6% --
Asia Pacific -3% -- -5% -5%
INTERNATIONAL -14% -10% -17% -15%
Emerging Markets• Q4 2018 down 12%; FY 2018 down 12%• Absent FX, Q4 2018 emerging markets down approximately 3%; FY 2018 down
approximately 7%10

($ millions, unaudited)
Q4 2018
Q4 2017
%CHANGE
Full Year 2018
Full Year 2017
%CHANGE
Franchise Brands $730 $796 -8% $2,446 $2,690 -9%
Partner Brands 273 343 -20% 987 1,272 -22%
Hasbro Gaming* 267 343 -22% 788 893 -12%
Emerging Brands 119 114 +5% 359 355 +1%
TOTAL $1,389 $1,596 -13% $4,580 $5,210 -12%
Fourth Quarter & Full Year Brand Portfolio Performance
• Franchise Brands: Growth in MAGIC: THE GATHERING andMONOPOLY offset by declines in other Franchise Brands
• Partner Brands: Growth in BEYBLADE and MARVEL offset by declines in other Partner Brands
• Hasbro Gaming: Growth in DUNGEONS AND DRAGONS, DON’T STEP IN IT, JENGA and new game launches offset by other portfolio games, including PIE FACE and SPEAK OUT
• Emerging Brands: Growth in POWER RANGERS licensing revenues, LOST KITTIES and YELLIES
*Hasbro’s total gaming category, including all gaming revenue, most notably MAGIC: THE GATHERING and MONOPOLY which are included in Franchise Brands in the table above, was $479M for Q4 2018, down 12% vs. $546M in Q4 2017. Hasbro’s total gaming category for FY 2018 was $1.4B, down 4% vs. $1.5B in FY 2017
Hasbro believes its gaming portfolio is a competitive differentiator and views it in its entirety.
Full Year 2018
11
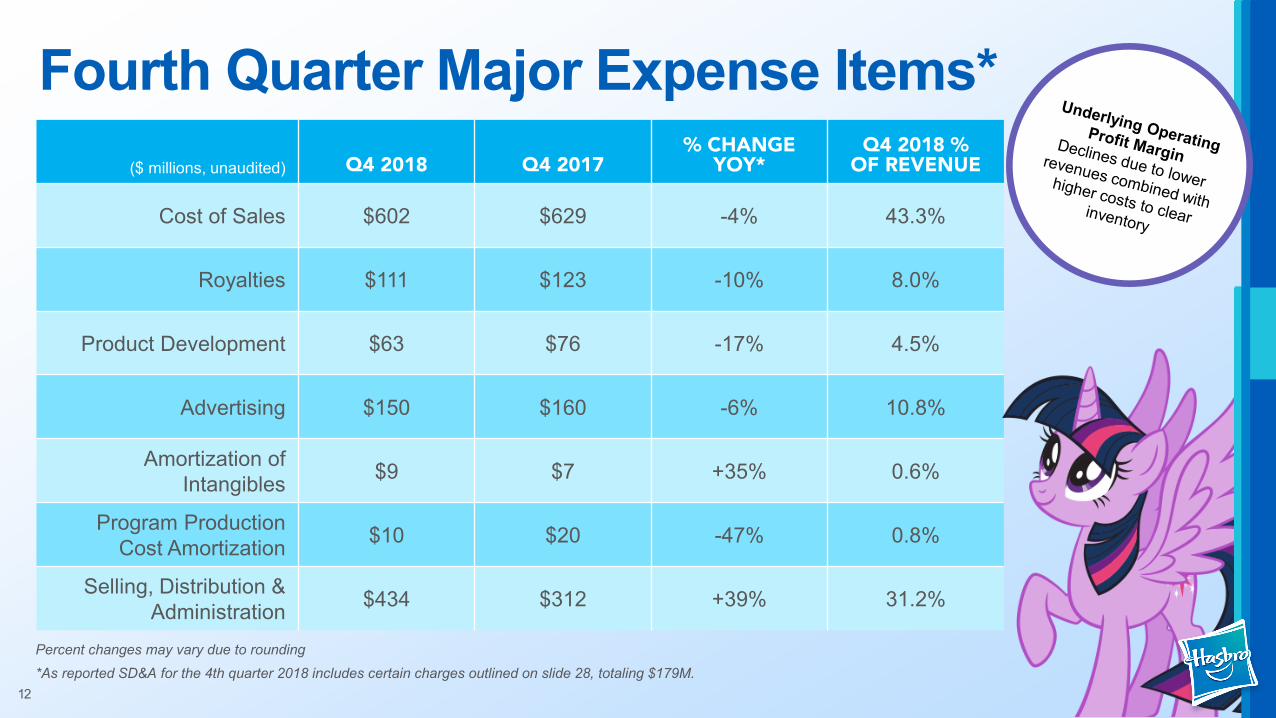
($ millions, unaudited) Q4 2018 Q4 2017% CHANGE
YOY*Q4 2018 %
OF REVENUE
Cost of Sales $602 $629 -4% 43.3%
Royalties $111 $123 -10% 8.0%
Product Development $63 $76 -17% 4.5%
Advertising $150 $160 -6% 10.8%
Amortization of Intangibles $9 $7 +35% 0.6%
Program Production Cost Amortization $10 $20 -47% 0.8%
Selling, Distribution & Administration $434 $312 +39% 31.2%
Fourth Quarter Major Expense Items*
Percent changes may vary due to rounding
12*As reported SD&A for the 4th quarter 2018 includes certain charges outlined on slide 28, totaling $179M.
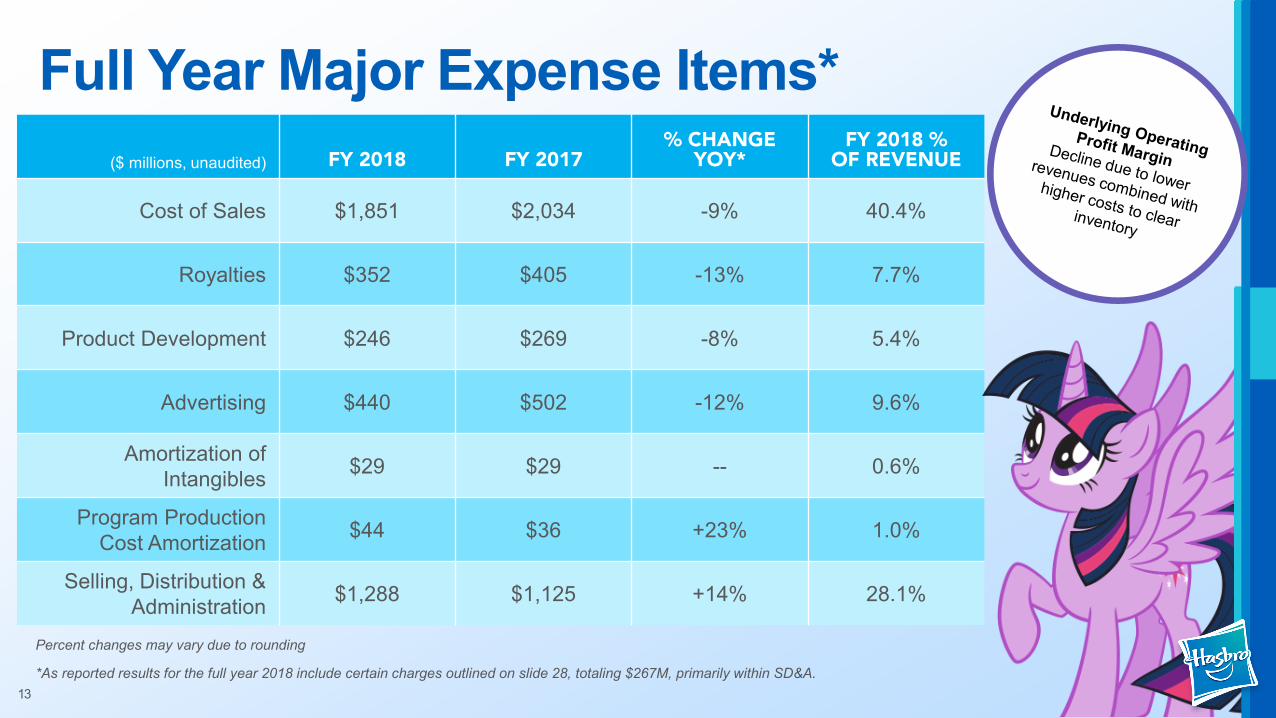
($ millions, unaudited) FY 2018 FY 2017% CHANGE
YOY*FY 2018 %
OF REVENUE
Cost of Sales $1,851 $2,034 -9% 40.4%
Royalties $352 $405 -13% 7.7%
Product Development $246 $269 -8% 5.4%
Advertising $440 $502 -12% 9.6%
Amortization of Intangibles $29 $29 -- 0.6%
Program Production Cost Amortization $44 $36 +23% 1.0%
Selling, Distribution & Administration $1,288 $1,125 +14% 28.1%
Full Year Major Expense Items*
Percent changes may vary due to rounding
13*As reported results for the full year 2018 include certain charges outlined on slide 28, totaling $267M, primarily within SD&A.
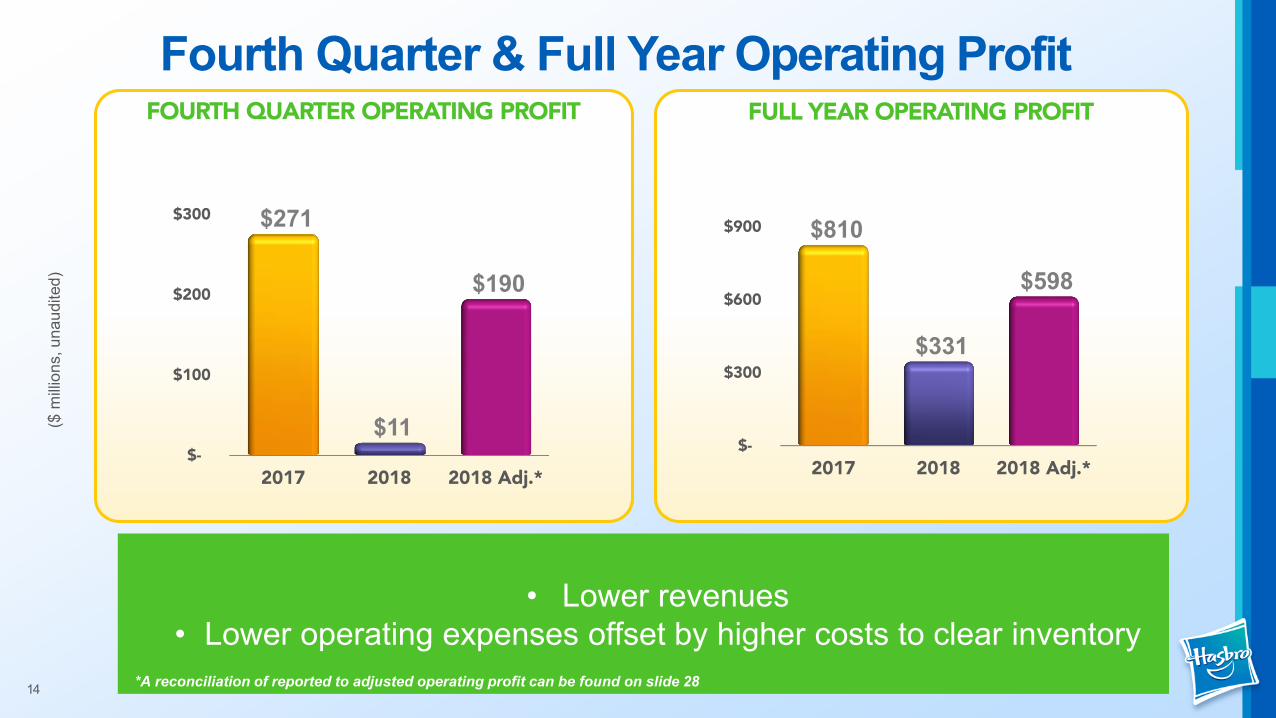
• Lower revenues• Lower operating expenses offset by higher costs to clear inventory
($ m
illion
s, u
naud
ited)
FOURTH QUARTER OPERATING PROFIT
Fourth Quarter & Full Year Operating Profit
$-
$100
$200
$300
2017 2018 2018 Adj.*
$271
$11
$190
$-
$300
$600
$900
2017 2018 2018 Adj.*
$810
$331
$598
FULL YEAR OPERATING PROFIT
*A reconciliation of reported to adjusted operating profit can be found on slide 2814
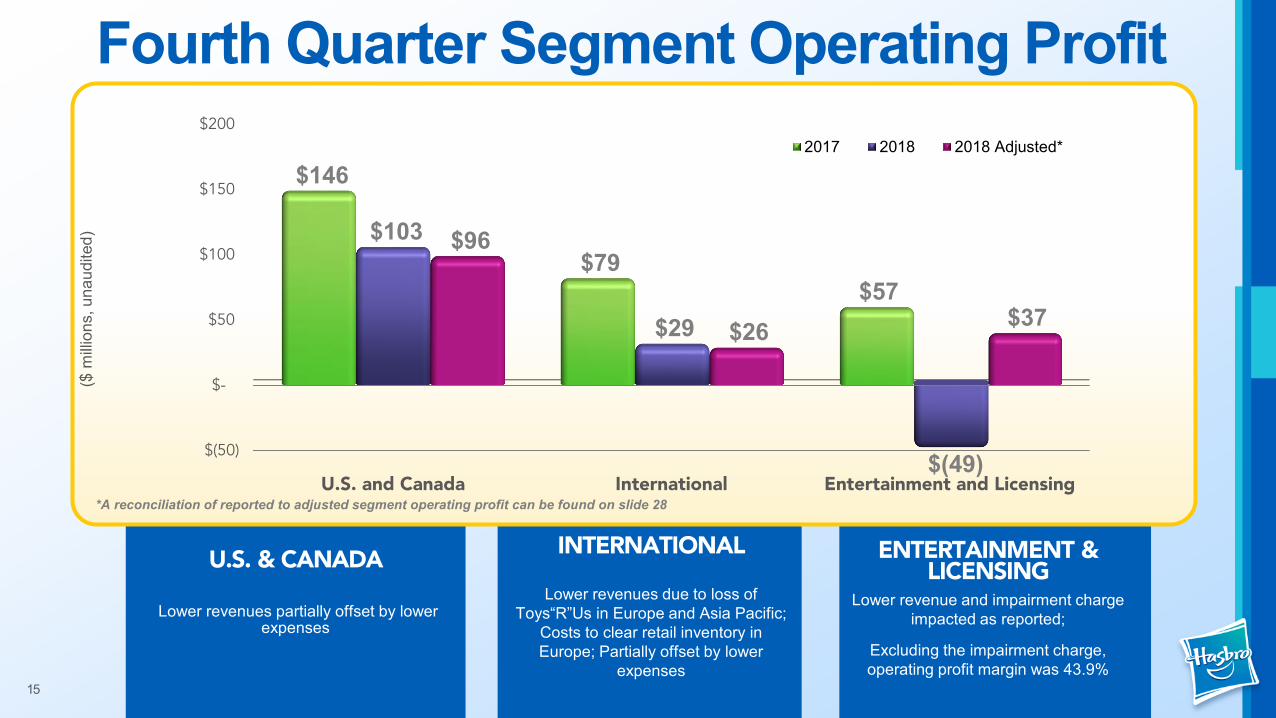
$(50)
$-
$50
$100
$150
$200
U.S. and Canada International Entertainment and Licensing
$146
$79 $57
$103
$29
$(49)
$96
$26 $37
2017 2018 2018 Adjusted*
($ m
illion
s, u
naud
ited)
Fourth Quarter Segment Operating Profit
U.S. & CANADA
Lower revenues partially offset by lower expenses
INTERNATIONAL
Lower revenues due to loss of Toys“R”Us in Europe and Asia Pacific;
Costs to clear retail inventory in Europe; Partially offset by lower
expenses
ENTERTAINMENT & LICENSING
Lower revenue and impairment charge impacted as reported;
Excluding the impairment charge, operating profit margin was 43.9%
15
*A reconciliation of reported to adjusted segment operating profit can be found on slide 28

$-
$50
$100
$150
$200
$250
$300
$350
$400
$450
$500
$550
U.S. and Canada International Entertainment and Licensing
$510
$229
$96
$382
$39 $17
$428
$47 $104
2017 2018 2018 Adjusted*
($ m
illion
s, u
naud
ited)
Full Year Segment Operating Profit
U.S. & CANADA• Lower revenues• Pre-tax charges of $45.8M
associated with Toys“R”Us• Higher level of close out sales
INTERNATIONAL• Lower revenues• Costs to clear retail inventory• Pre-tax charges $7.6M associated
with Toys”R”Us
ENTERTAINMENT & LICENSING
• Higher revenues• Pre-tax charge of $86.3M related to
Backflip goodwill impairment• Underlying operating profit margin
excluding impairment charges increased to 34.7%
*A reconciliation of reported to adjusted segment operating profit can be found on slide 28
16

Other (Income) Expense, net FY 2018 FY 2017 FY 2016
Interest Income $(22.4) $(22.2) $(9.4)
Foreign Currency Losses (Gains) 10.8 (1.3) $32.9
Earnings from Discovery Family Channel (21.1) (23.3) (23.8)
Revaluation of Tax Sharing Liability -- (19.9) --
Pension 5.8 -- --
Gain on Certain Investments (3.0) (3.3) (6.2)
Other $(0.3) (4.1) 4.6
Total* $(30.2) $(74.1) $(1.8)
*May not total due to rounding for presentation format
2018 Drivers• 2017 $19.9M gain on
revaluation of tax sharing liability as a result of U.S. tax reform
• 2018 Foreign currency losses versus gains in 2017
• Pension expense now recognized in other expense
Non-OP
17

FOURTH QUARTER NET EARNINGS (LOSS)AS REPORTED & AS ADJUSTED
($ m
illion
s, u
naud
ited)
$(10)
$90
$190
$290
2017 2018 2017 Adj. 2018 Adj.
$(5)$9
$291
$170
$1.33per
dilutedshare
$0.07 per diluted
share
Fourth Quarter & Full Year Net Earnings
• Adjusted Net Earnings for Q4 2018 were $169.6 million, or $1.33 per diluted share, excluding net after-tax charges of $160.8 million, or $1.26 per diluted share.
• Adjusted Net Earnings for Q4 2017 were $291.2 million, or $2.30 per diluted share excluding a $296.5 million, or $2.35 per diluted share, impact from U.S tax reform.
*A reconciliation of reported to adjusted Net Earnings and EPS can be found on slide 2918
• Adjusted Net Earnings for FY 2018 were $488.8 million, or $3.85 per diluted share, excluding aggregate after-tax charges of $268.4 million, or $2.11 per diluted share.
• Adjusted Net Earnings for FY 2017 were $693.1 million, or $5.46 per diluted share, excluding a $296.5 million, or $2.33 per diluted share, impact from U.S. tax reform.
$-
$100
$200
$300
$400
$500
$600
$700
2017 2018 2017 Adj. 2018 Adj.
$397
$220
$693
$489
$3.12 per
diluted share
$1.74per
dilutedshare
$3.85per
dilutedshare
FULL YEAR NET EARNINGS AS REPORTED & AS ADJUSTED
Loss of $0.04 per diluted share
$2.30per
dilutedshare
$5.46per
dilutedshare

($ millions, unaudited) Dec. 30, 2018 Dec. 31, 2017 NOTES
Cash $1,182 $1,581 Strong cash position; Access to cash reduces need for short-term borrowings
Depreciation $139 $143
Amortization of Intangibles $29 $29 Includes ~$11M from the acquisition of POWER RANGERS
Program Production Costs $132 $482018 Film and TV programming spend target was ~$145M-$150M; Partially funded Bumblebee film
Capital Expenditures $140 $135 Targeted $135M to $155M for the full year 2018
Dividends Paid $309 $277In February 2019, quarterly dividend increased 8% to $0.68 per share; In February 2018, the quarterly dividend increased 11% to $0.63 per share
Stock Repurchases $250 $151 $428M remains in authorizations at year end; Repurchased $58M in Q4 2018
Operating Cash Flow $646 $724 Generating strong cash flow
Accounts Receivable $1,188 $1,405 Receivables decreased 15% and DSOs decreased 2 days to 78 days
Inventory $443 $433Inventory up 2%; up 7% absent negative impact from FX; Retail inventory down meaningfully in U.S. and Europe
Key Cash Flow & Balance Sheet Data
19
YEAR TO DATE ENDED:

Capital• Invest in the long-term profitable growth
of Hasbro
• Return excess cash to shareholders through dividend and stock repurchase program
• Committed to goal of maintaining an investment grade rating and access to commercial paper market
20

ANN
UAL
DIV
IDEN
D R
ATE
Returning Cash to Shareholders:DIVIDEND GROWTH
$-
$0.50
$1.00
$1.50
$2.00
$2.50
$3.00
2009 2010 2011 2012* 2013* 2014 2015 2016 2017 2018 2019
0%25%
20%20%
11%8%
7%11%
12%11%
8%
13%10-YEAR
CAGR
*2012 and 2013 annual dividend rates have been adjusted to move accelerated payment paid in 2012 to 2013
% reflects increase in quarterly dividend rate
8%2019 Quarterly Dividend Increase
Dividend in 15 of last 16 years
10 Years
$2.1B21

$ M
ILLI
ON
S, U
NAU
DIT
EDReturning Cash to Shareholders:
SHARE REPURCHASES
$-
$100
$200
$300
$400
$500
$600
$700
$800
2009 2010 2011 2012 2013 2014 2015 2016 2017 2018
$91
$637
$423
$100 $103
$460
$85 $151 $150
$250
$2.5B10-year total
FY 2018 End$428M Remains
in Authorization
Q4 2018 Repurchases
$58M22
FY 2018 Repurchases
$250M

We believe every day is a chance to do better.
PlayingPurposewith
Environmental Sustainability
Diversity and Inclusion
Product Safety
Human Rights and Ethical Sourcing
CORPORATE SOCIALRESPONSIBILITY
23

SUPPLEMENTARYFINANCIAL
INFORMATION

Fourth Quarter & Full Year Consolidated Statements of Operations
($ millions, unaudited)Dec. 30,
2018% Net
RevenuesDec. 31,
2017% Net
RevenuesDec. 30,
2018% Net
RevenuesDec. 31,
2017% Net
Revenues
NET REVENUES $1,389 100.0% $1,596 100.0% $4,580 100.0% $5,210 100.0%
Cost of Sales 602 43.3% 629 39.4% 1,851 40.4% 2,034 39.0%
Royalties 111 8.0% 123 7.7% 352 7.7% 405 7.8%
Product Development 63 4.5% 76 4.8% 246 5.4% 269 5.2%
Advertising 150 10.8% 160 10.0% 440 9.6% 502 9.6%
Amortization of Intangibles 9 0.6% 7 0.4% 29 0.6% 29 0.6%
Program Production Cost Amortization 10 0.8% 20 1.2% 44 1.0% 36 0.7%
Selling, Distribution & Administration 434 31.2% 312 19.5% 1,288 28.1% 1,125 21.6%
OPERATING PROFIT $11 0.8% 271 17.0% $331 7.2% 810 15.6%
Interest Expense 22 1.6% 25 1.5% 91 2.0% 98 1.9%
Other Income, Net (7) (0.5)% (32) (2.0)% (30) (0.7)% (74) (1.4)%
(LOSS) EARNINGS BEFORE INCOME TAXES (5) (0.4)% 279 17.5% 270 5.9% 786 15.1%
Income Tax (Benefit) Expense (14) (1.0)% 284 17.8% 50 1.1% 390 7.5%
NET EARNINGS (LOSS) 9 0.6% (5) (0.3)% 220 4.8% 397 7.6%
Diluted EPS $0.07 $(0.04) $1.74 $3.12
QUARTER ENDED
25
FULL YEAR ENDED
*Subtotals/totals and percent changes may vary due to rounding
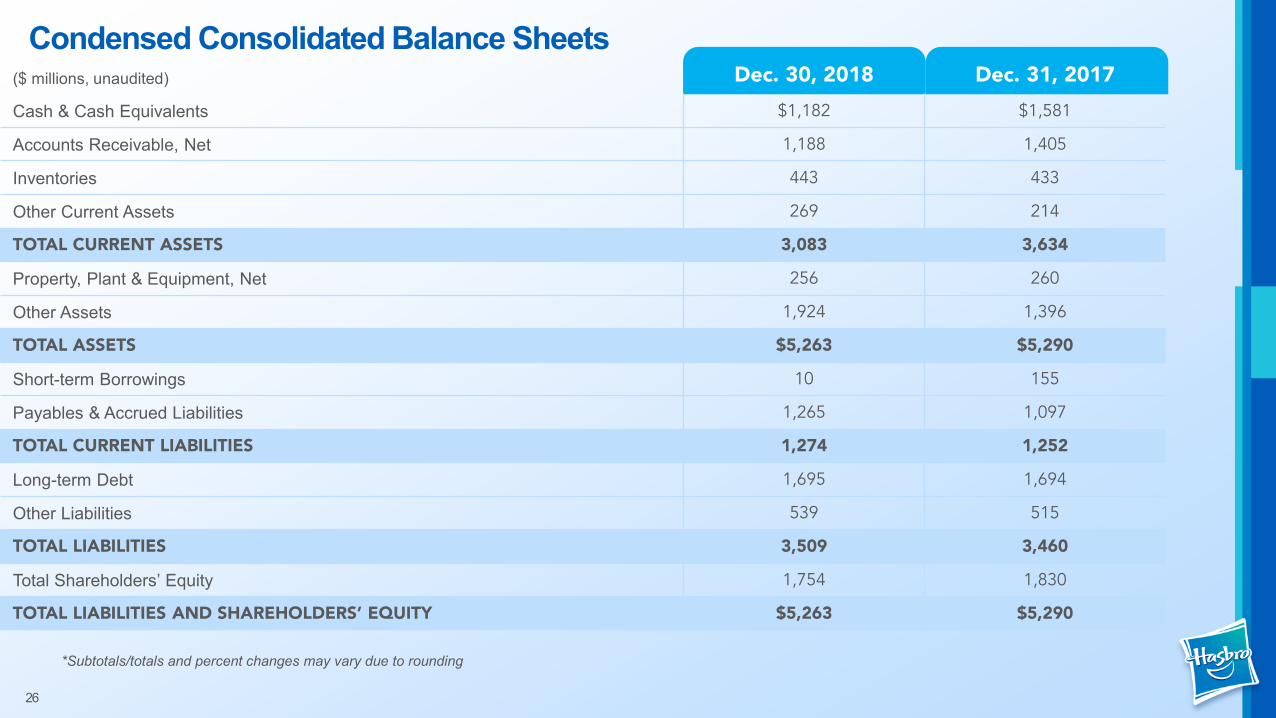
($ millions, unaudited) Dec. 30, 2018 Dec. 31, 2017
Cash & Cash Equivalents $1,182 $1,581
Accounts Receivable, Net 1,188 1,405
Inventories 443 433
Other Current Assets 269 214
TOTAL CURRENT ASSETS 3,083 3,634
Property, Plant & Equipment, Net 256 260
Other Assets 1,924 1,396
TOTAL ASSETS $5,263 $5,290
Short-term Borrowings 10 155
Payables & Accrued Liabilities 1,265 1,097
TOTAL CURRENT LIABILITIES 1,274 1,252
Long-term Debt 1,695 1,694
Other Liabilities 539 515
TOTAL LIABILITIES 3,509 3,460
Total Shareholders’ Equity 1,754 1,830
TOTAL LIABILITIES AND SHAREHOLDERS’ EQUITY $5,263 $5,290
Condensed Consolidated Balance Sheets
26
*Subtotals/totals and percent changes may vary due to rounding

($ millions, unaudited) Dec. 30, 2018 Dec. 31, 2017
NET CASH PROVIDED BY OPERATING ACTIVITIES $646 $724
CASH FLOWS FROM INVESTING ACTIVITIES:
Additions to Property, Plant and Equipment (140) (135)
Investments & Acquisitions, Net of Cash Acquired (155) -
Other 9 3
NET CASH UTILIZED BY INVESTING ACTIVITIES (286) (131)
CASH FLOWS FROM INVESTING ACTIVITIES:
Proceeds from Borrowings with Maturity Greater Than 3 Months - 494
Repayments of Borrowings with Maturity Greater Than 3 Months - (350)
Net Repayments of Short-term Borrowings (142) (18)
Purchases of Common Stock (250) (151)
Stock-based Compensation Transactions 30 29
Dividends Paid (309) (277)
Employee Taxes Paid for Shares Withheld (58) (32)
Other (7) (7)
NET CASH UTILIZED BY FINANCING ACTIVITIES (737) (312)
Effect of Exchange Rate Changes on Cash (21) 18
Cash and Cash Equivalents at Beginning of Year 1,581 1,282
CASH AND CASH EQUIVALENTS AT END OF YEAR $1,182 $1,581
Condensed Consolidated Cash Flow-Full Year Ended
27

SupplementalFinancialDataReconciliation of As Reported to Adjusted Operating Profit and Margin Results (Unaudited)(Thousands of Dollars)
28
Pre-tax adjustments
Post-tax adjustments
Pre-tax adjustments
Post-tax adjustments
Incremental costs impact of Toys"R"Us (1) (10,068)$ (8,543)$ 60,360$ 52,829$ Severance (2) 72,000 62,249 89,349 77,948 Asset Impairments (3) 117,556 96,928 117,556 96,928
179,488$ 150,634$ 267,265$ 227,705$
As ReportedNon-GAAP Adjustments Adjusted As Reported
Non-GAAP Adjustments Adjusted
Adjusted Company Results External Net Revenues 1,389,161$ -$ 1,389,161$ 4,579,646$ -$ 4,579,646$ Operating Profit 10,547 179,488 190,035 331,052 267,265 598,317 Operating Margin 0.8% 12.9% 13.7% 7.2% 5.8% 13.1%
Adjusted Segment Results U.S. and Canada Segment: External Net Revenues 685,605$ -$ 685,605$ 2,433,412$ -$ 2,433,412$ Operating Profit 102,649 (6,518) 96,131 382,013 45,759 427,772 Operating Margin 15.0% -1.0% 14.0% 15.7% 1.9% 17.6%
International Segment: External Net Revenues 618,492 - 618,492 1,847,585 - 1,847,585 Operating Profit 29,111 (3,550) 25,561 39,470 7,601 47,071 Operating Margin 4.7% -0.6% 4.1% 2.1% 0.4% 2.5%
Entertainment and Licensing Segment: External Net Revenues 85,064 - 85,064 298,540 - 298,540 Operating Profit (48,880) 86,253 37,373 17,311 86,253 103,564 Operating Margin -57.5% 101.4% 43.9% 5.8% 28.9% 34.7%
Corporate and Eliminations:
Non-GAAP Adjustments Impacting Operating ProfitQuarter Ended
December 30, 2018Year Ended
December 30, 2018
The Corporate and Eliminations segment included non-GAAP adjustments of $103.3 million for the quarter ended December 30, 2018 and $127.7 million for the year ended December 30, 2018, consisting of $72.0 million in Q4 2018 and $89.3 million in FY 2018 of severance; $31.3 million for both Q4 2018 and FY 2018 of asset impairments; and $7.0 million of royalty expense related to Toys"R"Us losses in FY 2018.
(1) In the first quarter of 2018, Toys"R"Us announced a liquidation of its U.S. operations, as well as other retail impacts around the globe. As a result, the Company recognized incremental bad debt expense on outstanding Toys"R"Us receivables, royalty expense, inventory obsolescence as well as other related costs. In the fourth quarter of 2018, the Company made adjustments to the charges previously recorded based on its final settlement with Toys"R"Us.
(2) In the first quarter of 2018, the Company incurred $17.3 million of severance charges, primarily outside the U.S., related to actions associated with a new go-to-market strategy designed to be more omni-channel and e-commerce focused. Additionally, in the fourth quarter of 2018, the Company recorded an additional $72.0 million of severance charges. All 2018 severance charges constitute the "2018 Restructuring Program." These charges were included in Corporate and Eliminations.
(3) In the fourth quarter of 2018, the Company conducted its annual impairment test. The results of such test resulted in a write-off of goodwill from its Backflip business of $86.3 million, as well as impairments of certain definite-lived intangible assets totaling $31.3 million.
Reconciliation of Operating Profit ResultsQuarter Ended December 30, 2018 Year Ended December 30, 2018

SupplementalFinancialDataReconciliation of Reported to Adjusted Net Earnings and Earnings Per Share(Unaudited)
29
(all adjustments reported after-tax) December 30, 2018Diluted Per Share
AmountDecember 31,
2017Diluted Per Share
Amount Net Earnings (Loss), as Reported 8,766$ 0.07$ (5,298)$ (0.04)$ Incremental costs impact of Toys"R"Us (8,543) (0.07) - - Severance 62,249 0.49 - - Impact of Tax Reform (1) 10,196 0.08 296,512 2.35 Asset Impairments 96,928 0.76 - - Net Earnings, as Adjusted 169,596$ 1.33$ 291,214$ 2.30$
(all adjustments reported after-tax) December 30, 2018Diluted Per Share
AmountDecember 31,
2017Diluted Per Share
Amount Net Earnings, as Reported 220,434$ 1.74$ 396,607$ 3.12$ Incremental costs impact of Toys"R"Us 52,829 0.42 - - Severance 77,948 0.61 - - Impact of Tax Reform (1) 40,650 0.32 296,512 2.33 Asset Impairments 96,928 0.76 - - Net Earnings, as Adjusted 488,789$ 3.85$ 693,119$ 5.46$
Reconciliation of EBITDA Quarter Ended Year EndedDecember 30,
2018December 31,
2017December 30,
2018December 31,
2017 Net Earnings (Loss) 8,766$ (5,298)$ 220,434$ 396,607$ Interest Expense 22,435 24,516 90,826 98,268 Income Taxes (including Tax Reform) (13,894) 283,884 49,968 389,543 Depreciation 34,340 35,165 139,255 143,018 Amortization of Intangibles 8,830 6,564 28,703 28,818 EBITDA 60,477$ 344,831$ 529,186$ 1,056,254$ Non-GAAP Adjustments 179,488 (19,911) 267,265 (19,911) Adjusted EBITDA 239,965$ 324,920$ 796,451$ 1,036,343$
Quarter Ended
Reconciliation of Net Earnings and Earnings per Share
(1) The Company made adjustments to provisional U.S. Tax Reform amounts recorded in the fourth quarter of 2017 based on additional regulations issued in 2018.
Year Ended
30

31