foxo/4e-bp signaling in drosophila muscles regulates
TRANSCRIPT

Supplemental Information
EXTENDED EXPERIMENTAL PROCEDURES
Fly StocksFly stocks used are: y w; UAS-foxo-TM (constitutive active); y w; UAS-foxo transgene #1 #a (Hwangbo et al., 2004); y w; UAS-foxo
transgene #2, and y w; foxo21 and y w; foxo25 (Junger et al., 2003; Zheng et al., 2007); y w, UAS-foxo transgene #b (Puig et al., 2003); y
w, UAS-4E-BP CA ((Miron et al., 2001); Bloomington #24854; recombined on y w); 4E-BP/Thor-lacZ (Bloomington #9558); y w; UAS-
Pten ((Huang et al., 1999); recombined on y w); y w; Mhc-GFP (WeeP26; Clyne et al., 2003); UAS-Lamp1-GFP (Pulipparacharuvil
et al., 2005); y w; UAS-GFP-Atg5 (Bloomington #8731; (Rusten et al., 2004)); UAS-HD-Q72-GFP and UAS-HD-Q103-GFP (gift of
Sheng Zhang, University of Texas); y w; Dmef2-Gal4 (Ranganayakulu et al., 1996); w; UAS-srcGFP (Bloomington #5432);
S106GS-Gal4 (Giannakou et al., 2004); and w; Mhc-Gal4 (Schuster et al., 1996). RNAi stocks to knock-down Atg7 (JF02787) and
white (JF01786) mRNA levels were provided by the DRSC/TRiP at Harvard Medical School. UAS-Hsp70 transgenic flies were gener-
ated by cloning the Hsp70 coding sequence in the pUAST vector followed by injection into w1118 embryos.
Antibodies and Immunostaining ProceduresAntibodies used are: anti-b-galactosidase (Promega, 1:200), anti-GFP (Abcam, 1:200), anti-polyubiquitin (FK2; Assay
Designs,1:200), anti-Hsp70 (1:200; gift of Susan Lindquist), anti-Ref(2)P (1:1000; gift of Ioannis Nezis (Nezis et al., 2008)), anti-Tropo-
myosin (Babraham Institute, 1:100), and/or anti-Dilp2 and anti-Dilp5 (Geminard et al., 2009) antibodies.
After incubation with primary antibodies over night, the samples were washed, and incubated with Alexa488 or Alexa635-conju-
gated phalloidin (1:100), to visualize F-actin, andwith Alexa-conjugated secondary antibodies (Molecular Probes, 1:200). Nuclei were
visualized by DAPI staining (1 mg/ml). Samples were processed with a Leica SP2 laser scanning confocal microscope.
Detailed Behavioral and Metabolic AssaysCAFE feeding behavior assays were done as previously (Ja et al., 2007; Xu et al., 2008). In brief, twelve hours before the assay, 7 flies
were transferred from normal food to 1.5% agar vials and fed 5% sucrose solution maintained in 5 ml calibrated glass micropipettes
(VWR, #53432-706). At the start of the assay, the old micropipette was replaced with a new one. The amount of liquid food consumed
was recorded every 2 hr and corrected on the basis of the evaporation observed in a vial without flies.
Feeding assays on blue colored food were done by providing food containing 5% sucrose, 1% agar, and 0.5% brilliant blue for 24
hr. Blue dye ingestion was quantified by measuring the absorbance at 625 nm of batches of 4 flies, as done previously (Xu et al.,
2008). For measurement of body weight, groups of 7 flies were weighted on a precision balance and the average body weight
calculated.
The quantification of the glucose concentration in the hemolymph was done according to Geminard et al., (2009). In brief, at least
15 flies were decapitated, placed in a perforated 0.5 ml tube, centrifuged for 6 min at 1500 g, and the hemolymph collected in an
underlying 1.5 ml tube at 4�C. The hemolymph was diluted 1:10 in distilled water and the glucose concentration was determined
with the Glucose Hexokinase Assay kit (Sigma #GAHK-20) after trehalose conversion into glucose with porcine trehalase (Sigma
#T8778) and incubation at 37�C overnight. All experiments were done with male flies.
Cell Culture and Luciferase AssaysFor transcriptional assays, S2R+ cells were transfected with the following plasmids: pMT-foxo (Puig et al., 2003), actin-firefly Lucif-
erase, and either wild-type of mutant versions of Renilla Luciferase reporters based on the promoters of Hsp70, Hsp40, and Hsp90.
Renilla Luciferase reporters were constructed andmutagenized via a standard PCR-based approach. Luciferase activity refers to the
ratio of Renilla to firefly Luciferase luminescence.
List of qPCR PrimersAlpha-Tubulin84B (CG1913):
50-GCTGTTCCACCCCGAGCAGCTGATC-30 and 50-GGCGAACTCCAGCTTGGACTTCTTGC-30
Thor/4E-BP (CG8846):
50-TCCTGGAGGCACCAAACTTATC-30 and 50-GGAGCCACGGAGATTCTTCA-30
Hsp70Bbb (CG5834):
50-GGAGACACACACTTGGGCGGCGAG-30 and 50-TCTCGATGGTGGCCTCCGTGCTAG-30
Hip (CG2947):
50-TCCCGAGGTGTCAGCCGCCATTCAGGAC-30 and 50-CAAACCGTCATCGACGAAGTCGGCGGAG-30
Hop (CG2720):
50-AAGGCCTTCGAAGCGTACAACGAGGGTC-30 and 50-TCCTCTACCCGAGGTTCAGCGGGCTTTG-30
Hsp40 (DnaJ-like-1, CG10578):
50-CTACAAGATTCTGGGCCTCGAGCGC-30 and 50-CGTAATTGTCGAAGATGTCGCGCTTC-30
Hsp90 (Hsp83, CG1242):
50-AGAAGCAGAGACCTTTGCATTCCAG-30 and 50-AGCTTGATGTACAGCTCCTTGCCAG-30
CHIP (CG5203):
Cell 143, 1–13, November 24, 2010 ª2010 Elsevier Inc. S1

50-TTGCTACTCAAAGGCCATCATAAAG-30 and 50-TATGCCCGTTGAAGGTGCTTTATAG-30
Chap1 (CG14224):
50-ACGGTCGAAGTTGACGAAGATTCTGG-30 and 50-AAAGGGCGTTTGGCGCACGTCAG-30
Hsc70.1 (CG8937):
50-GAATCCCAACAACACGATCTTTGATG-30 and 50-AGGTAGGCCTCCGCGGTCTCTC-30
Atg1 (CG10967):
50-CGTCTACAAAGGACGTCATCGCAAGAAAC-30 and 50-CGCCAAGTCGCCGCCATTGCAATACTC-30
Atg5 (CG1643):
50-CCTGCGAATCTATACAGACGATGAC-30 and 50-AGCTCAGATGCTCGGACATCCATTG-30
Atg6 (CG5429):
50-TGCACGCAATGGCGGAGTTATCTTTGC-30 and 50-CAGCTCCGCTTTCAGCTTAAAAGCAGC-30
Atg7 (CG5489):
50-TGCCTTTCTGCTTCAGCAATGTCC-30 and 50-GGCCCCATTTTGCCATTTTTATTTAG-30
Atg8a (CG32672):
50-TCGCAAATATCCAGACCGTGTGCCCGTC-30 and 50-GCCGATGTTGGTGGAATGACGTTGTTCAC-30
Image AnalysisFor image analysis, single-channel confocal images were converted into grayscale and the number and area of protein aggregates
was measured in an automated way with the ‘‘Analyze Particle’’ function of ImageJ on the basis of polyubiquitin immunoreactivity. A
cut-off of 10 pixels was applied to exclude background staining from the analysis. A similar approach was used to count vesicles.
In immunoelectron microscopy images, the total number of gold particles was counted to estimate the presence of protein
aggregates.
Quantification of the intensity of antibody staining was done by measuring the mean fluorescence intensity with the Histogram
function of Photoshop (Adobe) in single confocal images taken with the same settings.
Transmission and Immunogold-Electron MicroscopyFor transmission electron microscopy (TEM), thoraces were dissected and incubated in fixative (2% formaldehyde, 2.5% glutaral-
dehyde and 0.06% picric acid in 100 mM cacodylate buffer, pH 7.2) and processed as previously described (Bai et al., 2007).
For immunogold-electron microscopy, thoraces were fixed for 40 min in 0.1% Triton X-100 and 4% paraformaldehyde in 0.1M
Sodium Phosphate buffer pH 7.4 and embedded in LRWhite resin (Electron Microscopy Sciences). �80 nm thick LRWhite sections
were picked up on formvar/carbon coated copper grids for immunolabeling.
The gold-labeling was carried out at room temperature on a piece of parafilm. Anti-ubiquitin (1:50 P4D1, Cell Signaling) antibodies
and protein A gold were diluted in PBS with 0.1% Triton X-100 and 1% BSA. The diluted antibody solution was centrifuged 1 min at
14000 rpm prior to labeling to avoid possible aggregates. Grids were floated on drops of PBSwith 0.1% Triton X-100 and 1%BSA for
10 min to block for unspecific labeling, transferred to 5ml drops of primary antibody and incubated for 30 min. The grids were then
washed in 4 drops of PBS for a total of 15 min, transferred to 5ml drops of Protein-A gold for 20 min, washed in 4 drops of PBS for 15
min and 6 drops of double distilled water. Grids were picked up with metal loops and the excess liquid was removed by streaking on
a filter paper. Post-staining of the LR White sections was done with 0.3% lead citrate. The grids were examined in a TecnaiG2 Spirit
BioTWINmission electron microscope and images were recorded with an AMT 2k CCD camera (courtesy of Maria Ericsson, Harvard
Medical School EM Facility).
Western Blot and Biochemical Analysis of Detergent-Insoluble FractionsBiochemical Analysis of detergent-insoluble fractions was done as previously (Cumming et al., 2008; Nezis et al., 2008; Tofaris et al.,
2003). In brief, either fly heads and abdomens, or thoraces were dissected from at least 15 male flies and homogenized in ice-cold
PBS with 1% Triton X-100 containing protease and phosphatase inhibitors. Homogenates were centrifuged at 14000 rpm at 4�C and
supernatant collected (Triton X-100 soluble fraction). The remaining pellet was washed in ice-cold PBS with 1% Triton X-100. The
pellet was then resuspended in RIPA buffer containing 8M urea and 5% SDS, centrifuged at 14000 rpm at 4�C, and collected super-
natants (Triton X-100 insoluble fraction) were analyzed on 4%–20% SDS-PAGE. Western blots were probed with anti-ubiquitin anti-
bodies (P4D1, Cell Signaling; 1:1000) and either anti-a-Tubulin or anti-Histone H3 antibodies (Cell Signaling, 1:1000) as loading
controls.
For densitometry of western blots, band intensity was quantified with the Histogram function of Photoshop.
SUPPLEMENTAL REFERENCES
Bai, J., Hartwig, J. H., and Perrimon, N. (2007). SALS, aWH2-domain-containing protein, promotes sarcomeric actin filament elongation frompointed ends during
Drosophila muscle growth. Dev. Cell 13, 828-842.
Clyne, P. J., Brotman, J. S., Sweeney, S. T., and Davis, G. (2003). Green fluorescent protein tagging Drosophila proteins at their native genomic loci with small P
elements. Genetics 165, 1433-1441.
S2 Cell 143, 1–13, November 24, 2010 ª2010 Elsevier Inc.

Cumming, R. C., Simonsen, A., and Finley, K. D. (2008). Quantitative analysis of autophagic activity in Drosophila neural tissues bymeasuring the turnover rates of
pathway substrates. Methods Enzymol. 451, 639-651.
Curran, S. P., Wu, X., Riedel, C. G., and Ruvkun, G. (2009). A soma-to-germline transformation in long-lived Caenorhabditis elegansmutants. Nature 459, 1079-
1084.
Hess, N. K., Singer, P. A., Trinh, K., Nikkhoy, M., and Bernstein, S. I. (2007). Transcriptional regulation of theDrosophila melanogastermuscle myosin heavy-chain
gene. Gene Expr. Patterns 7, 413-422.
Huang, H., Potter, C. J., Tao, W., Li, D. M., Brogiolo, W., Hafen, E., Sun, H., and Xu, T. (1999). PTEN affects cell size, cell proliferation and apoptosis during
Drosophila eye development. Development 126, 5365-5372.
Miron, M., Verdu, J., Lachance, P. E., Birnbaum, M. J., Lasko, P. F., and Sonenberg, N. (2001). The translational inhibitor 4E-BP is an effector of PI(3)K/Akt
signaling and cell growth in Drosophila. Nat. Cell Biol. 3, 596-601.
Puig, O., Marr, M. T., Ruhf, M. L., and Tjian, R. (2003). Control of cell number by Drosophila FOXO: downstream and feedback regulation of the insulin receptor
pathway. Genes Dev. 17, 2006-2020.
Pulipparacharuvil, S., Akbar, M. A., Ray, S., Sevrioukov, E. A., Haberman, A. S., Rohrer, J., and Kramer, H. (2005). Drosophila Vps16A is required for trafficking to
lysosomes and biogenesis of pigment granules. J. Cell Sci. 118, 3663-3673.
Ranganayakulu, G., Schulz, R. A., andOlson, E. N. (1996).Wingless signaling induces nautilus expression in the ventral mesoderm of theDrosophila embryo. Dev.
Biol. 176, 143-148.
Schuster, C. M., Davis, G. W., Fetter, R. D., and Goodman, C. S. (1996). Genetic dissection of structural and functional components of synaptic plasticity. I. Fas-
ciclin II controls synaptic stabilization and growth. Neuron 17, 641-654.
Teleman, A.A., Hietakangas, V., Sayadian, A. C., and Cohen, S. M. (2008). Nutritional control of protein biosynthetic capacity by insulin via Myc in Drosophila. Cell
Metab. 7, 21-32.
Tofaris, G. K., Razzaq, A., Ghetti, B., Lilley, K. S., and Spillantini, M. G. (2003). Ubiquitination of alpha-synuclein in Lewy bodies is a pathological event not asso-
ciated with impairment of proteasome function. J. Biol. Chem. 278, 44405-44411.
Zheng, X., Yang, Z., Yue, Z., Alvarez, J. D., and Sehgal, A. (2007). FOXO and insulin signaling regulate sensitivity of the circadian clock to oxidative stress. Proc.
Natl. Acad. Sci. USA 104, 15899-15904.
Cell 143, 1–13, November 24, 2010 ª2010 Elsevier Inc. S3

Figure S1. Mhc-Gal4 Drives Transgene Expression Specifically in Muscles, Related to Figure 1 and Figure 6
(A–D) Overview of flies overexpressing EGFPwith theMhc-Gal4 driver (UAS-srcEGFP/+Mhc-Gal4/+; magnification is 10x). GFP fluorescence (green) is detected
to identify the tissueswhereMhc-Gal4 can drive transgene expression. (A and D) StrongGFP fluorescence is detected inmuscles of the thorax (direct and indirect
flight muscles) and in leg muscles. Weaker GFP fluorescence is detected in head and abdominal muscles (not shown).
(E–G) In UAS-srcEGFP/+ Mhc-Gal4/+ flies, no EGFP fluorescence is detected in the adipose tissue (E, peripheral fat body of the abdomen), the eye (F), and the
brain (G). Similar results were obtained by driving the expression of other transgenes encoding GFP-tagged proteins (not shown).
(H–K) Transgene expression is maintained with age specifically in muscles, as assessed by monitoring GFP expression at 5 (H–I) and 8 weeks (J–K) of age. No
GFP expression was detected in nonmuscle tissues (H–K).
Altogether, these observations indicate that Mhc-Gal4 drives transgene expression specifically in skeletal muscles but not in other tissues, including the adipose
tissue, retina, and brain. This observation is consistent with previous studies reporting thatMhc is specifically expressed inmuscles and thatMhc-Gal4 is amuscle
specific Gal4 driver (Demontis and Perrimon, 2009; Hess et al., 2007; Schuster et al., 1996).
S4 Cell 143, 1–13, November 24, 2010 ª2010 Elsevier Inc.

Figure S2. Mhc-Gal4Drives foxoOverexpression inMuscleswithout AffectingDevelopmental Growth andDifferentiation, Related to Figure 1
(A–D) Staining of indirect flight muscles with phalloidin (F-actin) and anti-Tropomyosin antibodies, and Mhc-GFP (WeeP26) fluorescence. The distribution of the
sarcomeric components F-actin, Tropomyosin, and Mhc is similar in Mhc-Gal4/Mhc-GFP and UAS-foxo/+ Mhc-Gal4/Mhc-GFP flies, indicating that muscle
differentiation and sarcomere assembly are unaltered. Scare bar, 20 mm. (C–D) Higher magnification panels display Mhc-GFP fluorescence of Mhc-Gal4/
Mhc-GFP and UAS-foxo/+ Mhc-Gal4/Mhc-GFP flies.
(E) foxo overexpression does not substantially affect developmental growth, as estimated by measuring the variation (%) in average body weight of 1-week-old
flies (n[flies per batch] = 25, n[batch] = 2; standard deviation is indicated).
Cell 143, 1–13, November 24, 2010 ª2010 Elsevier Inc. S5

Figure S3. Overexpression in Adulthood of Wild-Type and Constitutive Active foxo Preserves Muscle Proteostasis, Related to Figure 1 and
Figure 2
(A–H) Staining of indirect flight muscles with overexpression of either wild-type or constitutive active (ca) foxo. Transgene expression is temporally controlled with
the temperature sensitive tubulin-Gal80ts to achieve adult onset transgene expression with the muscle Dmef2-Gal4 driver at 29�C. Overexpression of both wild-
type (B and F) and constitutive active foxo (C and G) results in preservation of proteostasis, as exemplified by decreased deposition of protein aggregates (Poly-
ubiquitin and Ref(2)P immunoreactivities) at 5 weeks of age, in comparison with controls (the Dmef2-Gal4 driver [A and E], and the UAS-foxo transgene alone)D
and H]). Scale bar is 20 mm.
(I) Fold change in the cumulative area of protein aggregates at 1 (yellow) and 5 (green) weeks of age from muscles of different animals indicates significant pres-
ervation of proteostasis in response to overexpression of wild-type or constitutive active foxo (*p < 0.05; SEM is indicated with n).
(J) Dmef2-Gal4 drives transgene expression specifically in all muscles (including thoracic and abdominal muscles) at both 1 and 5 weeks of age.
S6 Cell 143, 1–13, November 24, 2010 ª2010 Elsevier Inc.

Figure S4. FOXO Induces the Expression of Hsp70 and Associated Folding Cochaperones, Related to Figure 2
(A) Hsp70 is a key player in proteostasis via its association with co-chaperones (Hsp40 and Hsp90) and co-factors involved in protein folding (Hip and Hop) and
degradation (CHIP and Chap). The mRNA levels of Hsp70 increase in thoracic muscles at 1 week of age in response to foxo overexpression (red; UAS-foxo/+;
Mhc-Gal4/+) in comparison with controls (blue;Mhc-Gal4/+). A significant increase is also detected in the mRNA levels of the co-chaperones Hsp40 and Hsp90
and co-factors involved in protein folding (Hop) but not in protein degradation (Chip, Chap) and Hsc70. Error bars represent SEM with n = 4 and *p < 0.05; **p <
0.01. Regulated genes have several putative FOXO binding sites (numbers in box) in their proximal (1 kb) promoter region (green: Fork-head Responsive Element
(FRE); yellow: Insulin Responsive Element [IRE]).
(B) Luciferase assays in cell culture using wild-type (wt) and mutant versions (DFRE) of the promoter regions of FOXO-regulated chaperones. Green and yellow
Cell 143, 1–13, November 24, 2010 ª2010 Elsevier Inc. S7

boxes indicate FREs and IREs in wild-type (wt) reporters, respectively, while a red star denotes mutation of a FOXO binding site in the mutant version of the
promoter (arrow denotes ATG). (B) Relative Luciferase activity of wt and DFRE mutant reporters, normalized to an actin5c promoter-based Luciferase reporter.
Foxo overexpression increases the transcriptional activity of thewt Luciferase reporters, which is suppressed by the removal of FOXO binding sites (DFREmutant
reporters). Error bars represent semwith n = 4 and *p < 0.05; **p < 0.01; ***p < 0.001. Table S2 provides information on the promoter regions used for the construc-
tion of Luciferase reporters.
(C) Western blot analysis of Triton X-100 insoluble fractions from thoraces of syngenic flies with or without Hsp70 overexpression in muscles. Thoraces from
young flies (1 week old, black) are compared with thoraces from old flies (6 weeks old, red). Note a similar deposition of Ubiquitin-conjugated proteins in old flies
independent of Hsp70 overexpression. Quantification of ubiquitin-conjugated proteins levels normalized to Tubulin levels is indicated (normalized value).
(D) Immunostaining of indirect flight muscles from wild-type old flies (5 weeks of age) with an anti-Hsp70 antibody. Hsp70 immunoreactivity (green) is detected in
the cytoplasm of young flies (not shown) and old flies, where it is additionally detected in polyubiquitin protein aggregates (red). Association of Hsp70 with protein
aggregates may possibly decrease their toxicity (proteotoxicity). F-actin (blue, phalloidin staining) identifies myofibrils. Scale bar is 20 mm.
S8 Cell 143, 1–13, November 24, 2010 ª2010 Elsevier Inc.

Figure S5. Minor Contribution of Hsp70 Overexpression in Muscles to the Systemic Regulation of Aging, Related to Figure 4 and Figure 6
(A) Hsp70 overexpression has a partial effect on muscle function (not shown) and life span in comparison with syngenic control flies. Median and maximum life
span:Mhc-Gal4/+ = 56 and 80 days (n = 774);Mhc-Gal4/UAS-Hsp70 = 62 and 84 days (n = 626); p < 0.01). Relative Hsp70mRNA levels are detected in thoraces
from control (blue) and Hsp70 overexpressing (red and green) flies by qPCR (sem is indicated with n = 4; *p < 0.05 and **p < 0.01).
(B and C) Accumulation of polyubiquitinated proteins in nonmuscle tissues of flies overexpressing Hsp70 in Muscles. (B) Western blot of Triton X-100 insoluble
fractions from abdominal and head tissues of syngenic flies with or without Hsp70 overexpression in muscles (Mhc-Gal4/+; and Mhc-Gal4/UAS-Hsp70) at 1
(young) and 6 weeks (old) of age. Note a similar accumulation of Ubiquitin-conjugated proteins with age, indicating that Hsp70 overexpression in muscles is
not sufficient per se to mitigate the loss of proteostasis in non-muscle tissues. Normalized values (based on a-Tubulin levels) are shown.
(C) Immunostaining of adipose tissue (peripheral fat body of the abdomen) from flies with or without Hsp70 overexpression in muscles at 6 weeks of age. Hsp70
immunoreactivity (green) is detected in the cytoplasm and associated with some polyubiquitin protein aggregates (red) that accumulate in both conditions. F-
actin staining is shown in blue. Scale bar, 20 mm.
Cell 143, 1–13, November 24, 2010 ª2010 Elsevier Inc. S9
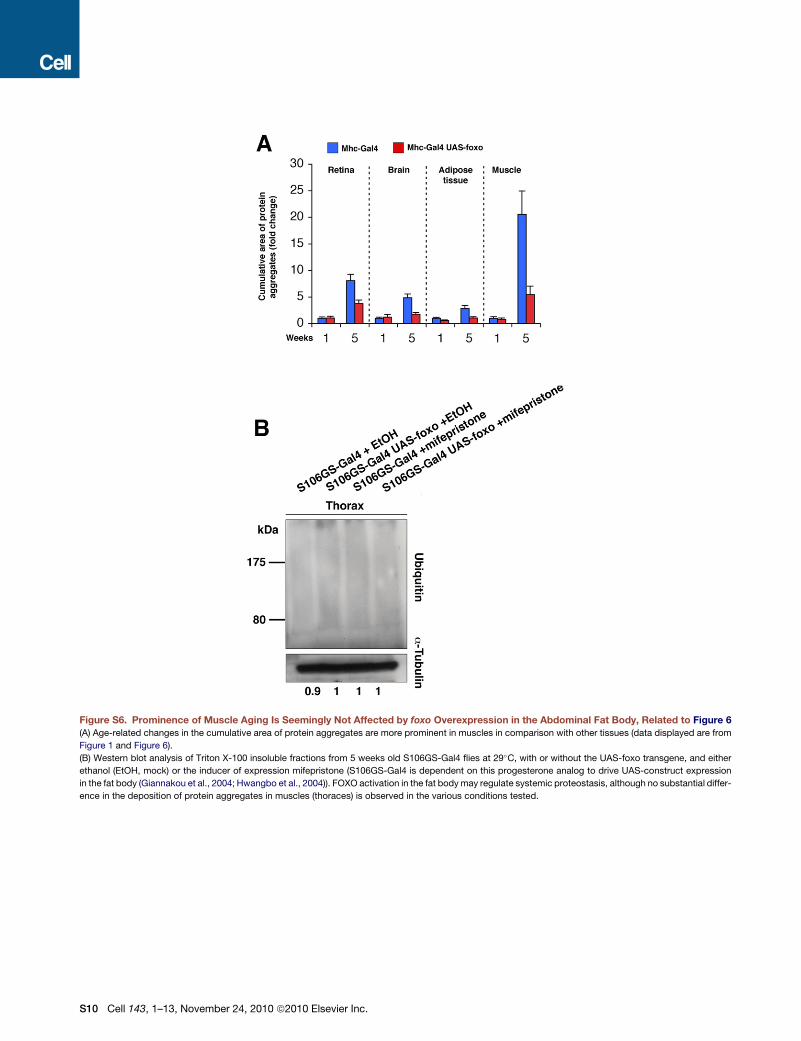
Figure S6. Prominence of Muscle Aging Is Seemingly Not Affected by foxo Overexpression in the Abdominal Fat Body, Related to Figure 6
(A) Age-related changes in the cumulative area of protein aggregates are more prominent in muscles in comparison with other tissues (data displayed are from
Figure 1 and Figure 6).
(B) Western blot analysis of Triton X-100 insoluble fractions from 5 weeks old S106GS-Gal4 flies at 29�C, with or without the UAS-foxo transgene, and either
ethanol (EtOH, mock) or the inducer of expression mifepristone (S106GS-Gal4 is dependent on this progesterone analog to drive UAS-construct expression
in the fat body (Giannakou et al., 2004; Hwangbo et al., 2004)). FOXO activation in the fat bodymay regulate systemic proteostasis, although no substantial differ-
ence in the deposition of protein aggregates in muscles (thoraces) is observed in the various conditions tested.
S10 Cell 143, 1–13, November 24, 2010 ª2010 Elsevier Inc.

Figure S7. Expression of Mutant Human Huntington’s Disease Proteins in Muscles Is Sufficient to Decrease Life Span, Related to Figure 4
and Figure 7
(A and B) GFP-positive protein aggregates are detected in muscles from both young (2 days old) and older flies (21 days old) upon overexpression in muscles of
GFP-tagged, aggregation-prone human Huntington’s disease proteins. Note that Huntington’s disease protein aggregates are distinct from aggregates of
endogenous damaged proteins (identified via polyubiquitin immunoreactivity, red) in both confocal and transmission electron microscopy (inset in B). Scale
bars, 20 mm (A, confocal microscopy) and 500 nm (inbox in B, electron microscopy).
(C) Overexpression of Huntington’s disease proteins inmuscles is sufficient to decrease life span, indicating thatmuscle proteostasis is limiting for life expectancy
(p < 0.001, with n[Mhc-Gal4/+] = 1264, n[UAS-HD-Q72-GFP/+; +/+; Mhc-Gal4/+] = 372, and [UAS-HD-Q103-GFP/+; +/+; Mhc-Gal4/+] = 490).
Cell 143, 1–13, November 24, 2010 ª2010 Elsevier Inc. S11