fp investor meeting final 12-03-07...
TRANSCRIPT

1
Capital Markets

2
Overview of AIGFP Overview of AIGFP ““Super SeniorSuper Senior”” BusinessBusiness
3
What the Presentation Will Cover TodayWhat the Presentation Will Cover Today
• “Super Senior” Definition
• Portfolio Underwriting Standards
• Experience: Actual vs. Expectations
• Accounting Valuation Methodology
• Questions and Answers
• Portfolio Statistics
- No expected realized losses
- Divergence of accounting valuation from economic realities
- Performance difference among sub-prime vintages is not artificial
- Careful portfolio selection combined with remote attachment points

4
• There is no uniform definition for “Super Senior” risk across the market. AIGFP defines “Super Senior” risk as the risk associated with that portion of its bespoke, highly negotiated credit derivatives portfolio where, even under worst-case assumptions for the replenishment and performance of the underlying assets, there is no expected loss.
• Following due diligence, the “Super Senior” portion of AIGFP’s credit derivatives portfolio is constructed using an AIGFP proprietary model that incorporates highly conservative assumptions (including recovery rates significantly below those used by the rating agencies and underlying ratings that, in all cases, are equal to, or lower, than those publicly assigned). All underlying obligations are individually stressed and modeled to create an overall loss distribution for the entire portfolio. While agency models and attachment points are useful verification tools, AIGFP always builds and models each “Super Senior” transaction with its own, more conservative assumptions.
• The attachment point for the “Super Senior” portion of each portfolio, as determined by the AIGFP model, is calculated as a minimum threshold above which there is no expected loss to AIGFP, even under extreme recessionary conditions. These modeled conditions are worse than any experienced in history since World War II and are assumed to adversely affect the performance of each underlying obligor throughout the life of the transaction. Each transaction is then negotiated to ensure that the final attachment point exceeds the modeled attachment point, giving AIGFP an additional cushion of subordination to its risk position.
AIG Financial ProductsAIG Financial Products““Super SeniorSuper Senior”” Portfolio ConstructionPortfolio Construction
5
The portfolio reflects a large notional amount, but poses remote risk. The “Super Senior”risk portion is the last tranche to suffer losses, which are allocated sequentially within the capital structure. The structure would have to take losses that erode all of the tranches below the “Super Senior” level before AIGFP would be at risk.
Attachment Point
Realized Credit Losses are Allocated Sequentially: Equity, BB, BBB, A, AAA, “Super Senior”
Equity
BB rated
BBB rated
A rated
AAA rated
Underlying portfolio typically
comprises 125-200
obligations from
various sectors
including RMBS, ABS,
CMBS, etc.
Protection Seller makes payment to asset vehicle if losses exceed subordination
Asset vehicle makes periodic payments for credit protection
Hypothetical Example of Underlying CDO Reflecting the Various Rated Risk Layers
“Super Senior”
Risk Segment
Avg. 15 to 37%
Avg. 63 to 85%
Typical Tranche Structure of a MultiTypical Tranche Structure of a Multi--Sector Sector CDO including CDO including ““Super SeniorSuper Senior”” SegmentSegment
TRANSACTION GROSS NOTIONAL
AIG Financial Products
(Protection Seller)
AIGFP NET NOTIONAL EXPOSURE*
* AIGFP Net Notional Exposure is “net of transaction subordination”

6
Summary Statistics Summary Statistics ““Super SeniorSuper Senior”” Credit Derivatives*Credit Derivatives*
11919283,9941,158Average Number of Obligors / Transaction
4.4***4.2***2.4**2.2**Expected Maturity(Years)
European Mortgage
$21.6$84.4$167.7$354.3Gross Notional ($ Billion)
$17.1$62.4145.4$280.6AIGFP Net Notional Exposure($ Billion)
14.8%
14
23.2%
104
Multi-Sector CDOsTransactions w/Mixed TransactionsCollateral, including w/No Sub-Prime Sub-Prime Collateral
13.2%
37
20.8%
93
CorporateTransaction Type
Number of TransactionsWeighted Average Subordination (%)
**Majority of transactions have Regulatory Capital Calls from January 2008***Sourced from Transaction Trustee Reports
*All data is as of November 25, 2007, unless otherwise indicated.
7
All of our Trades Combine the Strengths of Careful Asset Due Diligence, Selection and Review with those of the Rigors and Framework Provided by our Bespoke Modeling
• Across every transaction in our portfolio, we achieve positive selection of assets through a number of means.
• We investigate the motivations of the originating banks, with many deals being driven by regulatory capital management rather than risk transfer.
• Initially we undertake due diligence on banks, investment managers and originators to ensure that they have the required experience, track record and an appropriate approach to risk.
• For each transaction we agree specific collateral eligibility criteria, rating requirements, concentration limits and portfolio maintenance characteristics.
• When appropriate we review and agree all of the collateral on a name-by-name basis.
• We aim to avoid or reduce exposure to certain risk factors and so achieve highly diversified portfolios that outperform the broader originator portfolios.
• For each transaction we agree specific structural features including performance covenants.
• Each transaction type and portfolio is then subject to specific credit analysis and rigorous detailed modeling.
Overall Approach to Overall Approach to ““Super SeniorSuper Senior”” TransactionsTransactions

8
Credit Underwriting Credit Underwriting -- Corporate TransactionsCorporate Transactions
Each and Every Transaction Passes Through the Same Process of Careful Selection and Due Diligence
• An analysis of each name in the portfolio to assign an internal rating (‘AIGFP rating’) to each name. The AIGFP rating (which in all cases is equal to, or lower than, those publicly assigned)is then used for modeling purposes.
• Review of current market spreads for each name, where available, to ensure rating reflects all current available information.
• For the Small & Medium Enterprise Loan (SME) deals we review all of the originating banks’underwriting standards, including for example:
– The extent to which account officers are empowered to make lending decisions
– Whether credit officers can be overruled and if so by whom and how often
– Current breakdown of the overall loan book and our portfolio by geography and industry
– The bank’s internal rating procedures, its construction and criteria along with a review of its application to both loan and obligor ratings
– Establish proof that the Bank’s internal rating system is seasoned enough to enable them to have built transition matrices so as to help validate the ratings
• Investigation of any industry or geographic concentrations in the loan pool and review of any potentially mitigating factors.
9
Credit Underwriting Credit Underwriting -- European Residential MortgagesEuropean Residential Mortgages
• Understanding of the bank’s lending philosophy, and the extent (if any) to which this has changed in recent times
• Underwriting standards and credit approval procedures including:– What (and how many) individual officers are empowered to make lending
decisions– What loan size can be approved by different individuals/groups– To what extent has the approval system become automated and, if so, what are
the procedures for permitting any overrides– What criteria do the credit officers or automated system use to make the lending
decision
• Loss and recovery experience of the Bank
• Historic experience - annual losses over past 10 years, or as far back as the bank can provide records
• Monitoring of delinquencies, work out and recovery procedures
• What groups and procedures are in place to monitor and manage delinquencies
• Bank policies on workout and foreclosure
Thorough Review of all Underwriting, Processes and Performance
10
• Review and analysis of the Investment Manager (on all transactions) including:- What is the ownership structure of the organisation?- Review of all personnel and their suitability to both the assets and the structure- What is the track record and the past performance of the manager in all asset classes?- What risk retention / incentive policy is in place for key employees?
• Analysis of all of the collateral portfolio including:- The eligibility criteria for all securities - What is the single security / obligor concentration limits proposed? - How diverse is the portfolio geographically?- How diverse is the portfolio when measured by sector or industry? - What is the maturity / expected amortization profile of the assets and the portfolio overall?- Review of agency ratings of securities and portfolio weighted average rating factor- Currency and interest rate exposures and hedging requirements
• Analysis of all of the key transaction terms including:- The term of any proposed reinvestment period - What, if any, are the management trading discretions? - What portfolio quality triggers we have in place- The Over-Collateralisation (O/C) and Interest Coverage tests - All of the early amortization events and the procedures to follow
Credit Underwriting Credit Underwriting –– MultiMulti--Sector CDO TransactionsSector CDO TransactionsHighly Selective Review of Manager, Collateral and Proposed Structure
11
AIGFP AIGFP -- Portfolio Models OverviewPortfolio Models Overview
• Over the last decade, AIGFP has developed many models for portfolio fundamental credit risk analysis:
– Different asset classes are analyzed with different models, e.g., Dutch residential mortgages, German SMEs, etc.
– Data has been mostly collected from counterparty banks, OECD and Central Banks over the last decade.
• Model-building is guided by a few principles:– AIGFP always builds its own models for each asset class, and never relies on third party
models, though these are used for robustness checks.
– Models are simple, data-driven, and actuarial. They are not pricing models, but models to analyze fundamentals.
– Individual portfolio obligations are simulated.
• Models are calibrated to be worse than the worst post-WWII recession, in each country (the “Worst Case”):
– Models produce portfolio loss distributions by simulating individual underlying portfolio obligation credit performance.
– Underwriting standards are based on quantiles of the loss distribution.
Simple, Specific, Highly Conservative Models

12
Credit Modeling Credit Modeling -- Residential Mortgage PortfoliosResidential Mortgage Portfolios
• AIGFP’s prime residential mortgage portfolio consists of loans originated and held by European banks:
– Banks supply historical data; combined with data from other sources
– Due diligence with originating bank to understand data
– Transactions rejected if data not credible
– Macroeconomic data used to calibrate to the Worst Case; stress added to historical data to produce the Worst Case scenario
• Mortgage models simulate each individual loan in the portfolio:
– All individual loan characteristics reviewed and stressed, including:• Loan to Value• Borrower employment status• Property location
– Prepayment is beneficial to AIGFP as this causes the portfolio to amortize, reducing our exposure
Stressed Analysis of Line by Line Data on all Transactions
13
Credit Modeling Credit Modeling -- Corporate Portfolios & Corporate Portfolios & MultiMulti--Sector CDOsSector CDOs
• Corporate portfolios are modeled based on simulating rating transitions of individual firms:
– The ratings used are those assigned by AIGFP credit officers if possible, or we review and stress originating banks own internal rating system following its prior review and stress by at least one major rating agency.
– Transactions are treated as occurring entirely during the Worst Case recession scenario.
• Multi-Sector CDOs are rated to the worst possible portfolio that the CDO managersmay construct:
– CDO managers can select final portfolio following review of reference obligations and criteria agreed with AIGFP and agencies; AIGFP models worst portfolio as per criteria.
– Model takes as inputs agency ratings and adds stress to these ratings.– Modeling takes account of AIGFP portfolio management covenants.
• AIGFP’s use and view of agency ratings:
– Agencies can rank relative risk, but we do not rely on their associated default probabilities.– AIGFP stresses ABS/RMBS/CMBS/CDO ratings and all recovery rates.– The AIGFP Worst Case associates loss likelihoods for each rating.
We Always Construct the Worst Case Portfolio
14
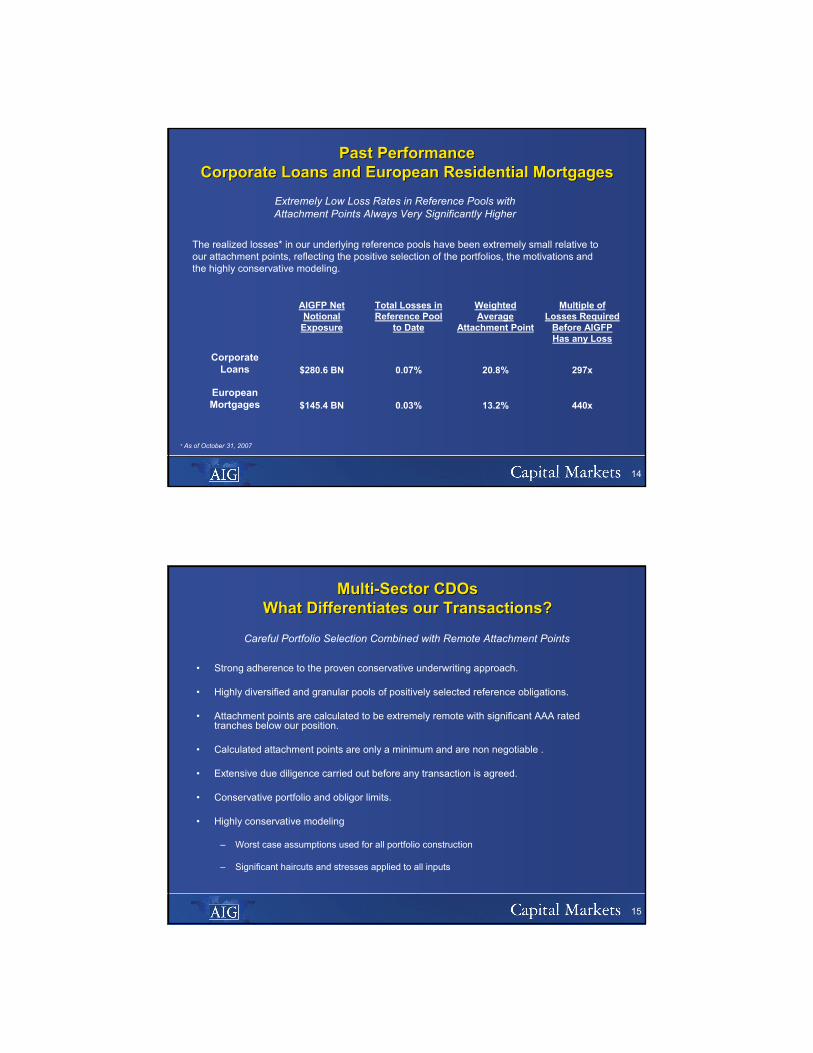
Past PerformancePast PerformanceCorporate Loans and European Residential MortgagesCorporate Loans and European Residential Mortgages
440x13.2%0.03%$145.4 BNEuropean Mortgages
297x20.8%0.07%$280.6 BNCorporate
Loans
Multiple of Losses Required
Before AIGFP Has any Loss
Weighted Average
Attachment Point
Total Losses in Reference Pool
to Date
AIGFP Net Notional
Exposure
The realized losses* in our underlying reference pools have been extremely small relative to our attachment points, reflecting the positive selection of the portfolios, the motivations and the highly conservative modeling.
* As of October 31, 2007
Extremely Low Loss Rates in Reference Pools with Attachment Points Always Very Significantly Higher
15
MultiMulti--Sector Sector CDOsCDOsWhat Differentiates our Transactions?What Differentiates our Transactions?
• Strong adherence to the proven conservative underwriting approach.
• Highly diversified and granular pools of positively selected reference obligations.
• Attachment points are calculated to be extremely remote with significant AAA rated tranches below our position.
• Calculated attachment points are only a minimum and are non negotiable .
• Extensive due diligence carried out before any transaction is agreed.
• Conservative portfolio and obligor limits.
• Highly conservative modeling
– Worst case assumptions used for all portfolio construction
– Significant haircuts and stresses applied to all inputs
Careful Portfolio Selection Combined with Remote Attachment Points

16
MultiMulti--Sector Sector CDOsCDOsWhat Differentiates our Reference Obligations?What Differentiates our Reference Obligations?
• We stopped committing to any new Multi-Sector CDOs with sub-prime collateral at the end of 2005:
– Through our continuous surveillance of the market we began to see evidence that underwriting standards were beginning to decline in a material way.
– Very limited reinvestment has given us some small exposures.– Total 2006 and 2007 sub-prime collateral makes up just 5.3% of the Gross Transaction
Notional of our multi-sector CDOs with mixed collateral, including sub-prime.
• Issuance vintage is key in determining underlying asset performance: – Collateral has already experienced significant price appreciation.– Some originators appear to have utilized more robust underwriting standards than in later
vintages.
• Transaction lives expected to be short:– Many deals already amortizing our exposure.– All managed deals have triggers to end reinvestment.– Triggers to further divert cashflows to accelerate amortization if deals underperform.
• Ongoing surveillance from both managers and AIGFP:– Regular manager dialogue.– Continuous review, surveillance and stress testing of all reference obligations.– Continuous monitoring of all covenants.
Very Little Exposure to the Problematic Vintages of 2006 & 2007
17
SubSub--Prime RMBS: Models vs. RealityPrime RMBS: Models vs. RealityMoodyMoody’’s: 2005 and 2006s: 2005 and 2006
2006 Vintage2005 Vintage
Downgrade Experience vs. Model Stress
15.3%
3.8%
0.8%
0.0%
0.0%
AIGFP Experience
40.3 – 47.1
31.8 – 35.7
26.6 – 29.3
32.4 – 37.8
31.5 – 37.5
AIGFP Model Stress*
86.4%32.3 – 40.393.7%18.9%Ba
74.4%27.2 – 31.882.8%5.1%Baa
47.8%23.8 – 26.656.1%0.6%A
0.0%27.0 – 32.40.0%0.0%Aa
0.0%26.3 – 31.50.0%0.0%Aaa
AIGFP Experience
AIGFP Model Stress**
% of All Moody’s
Rated Sub-Prime
% of All Moody’s
Rated Sub-Prime
* AIGFP model predictions over 24 - 36 months** AIGFP model predictions over 12 – 24 months
AIGFP Models Significantly Stress for our Core Exposures
Rating Agency transition data provided as of October 2007 by JPMorgan Chase & Co.AIGFP Experience data compiled from Bloomberg

18
2006 Vintage2005 Vintage
Downgrade Experience vs. Model Stress
15.3%
3.8%
0.8%
0.0%
0.0%
AIGFP Experience
40.3 – 47.1
31.8 – 35.7
26.6 – 29.3
32.4 – 37.8
31.5 – 37.5
AIGFP Model Stress*
86.4%32.3 – 40.370.9%28.0%BB
74.4%27.2 – 31.850.1%27.9%BBB
47.8%23.8 – 26.629.0%6.3%A
0.0%27.0 – 32.44.9%1.4%AA
0.0%26.3 – 31.50.5%0.0%AAA
AIGFP Experience
AIGFP Model Stress**
% of All S&P’s Rated Sub-Prime
% of All S&P’s Rated Sub-Prime
* AIGFP model predictions over 24 - 36 months** AIGFP model predictions over 12 – 24 months
SubSub--Prime RMBS: Models vs. RealityPrime RMBS: Models vs. RealityS&P: 2005 and 2006S&P: 2005 and 2006
Rating Agency transition data provided as of October 2007 by JPMorgan Chase & Co.AIGFP Experience data compiled from Bloomberg
Vintages for our Core Exposures perform Significantly Better than those of 2006
19
SubSub--Prime ARMS Delinquencies by Prime ARMS Delinquencies by Vintage of OriginationVintage of Origination
0%
5%
10%
15%
20%
25%
30%
35%
1 12 24 36 48 60Deal age (months)
2001 2002 2003 2004 2005
2006 2007
60+
delin
quen
cies
Data provided as of October 2007 by JPMorgan Chase & Co.
The Performance Differences Among Vintages are Not Artificial
Delinquencies are based on current collateral balance

20
Our Multi-Sector CDO Exposure to Sub-Prime Collateral by Vintage
47.3%2.0%2.3%26.4%14.2%2.4%
Total2007200620052004Pre 2004High Grade Transactions
63.6%2.9%4.1%33.7%19.3%3.6%
Total2007200620052004Pre 2004Mezzanine Transactions
Percentages shown are of Gross Transaction Notional
21
FAQsFAQs??Q. What if you write off all 2006 and 2007 sub-prime, regardless of rating, with zero recovery?
A. If we wrote off all of 2006 and 2007 sub-prime collateral from every rating category, with absolutely zero recovery, then the high grade transactions would show a loss of $314 million across 3 transactions and the remaining transactions would have an average remaining subordination of 12.9%The mezzanine transactions would show a loss of $7 million across just 1 transaction and the remaining transactions would have an average remaining subordination of 31.5%
Q. What if late 2005 sub-prime is also impacted; what would happen to all of your transactions if you wrote off all BBB rated and below sub-prime collateral from the entire 2nd half of 2005 and still wrote off all of 2006 and 2007 as well, regardless of rating, again all with zero recovery?
A. If we wrote off all BBB rated and lower sub-prime collateral from the entire 2nd half of 2005 and still wrote off all sub-prime collateral from 2006 and 2007 as well, regardless of rating, with zero recovery, then the high grade transactions would have no further loss and the weighted average remaining subordination would drop only marginally, to 12.4% The mezzanine deals would now show a loss of $59 million across 3 transactions and the remaining transactions would have an average remaining subordination of 26.4%
Q. What if we wrote off all of the BBB rated and lower sub-prime collateral from the 2nd half of 2005, all of the sub-prime from 2006 and 2007 regardless of rating and, in addition, write off all CDO’s rated A or lower regardless of vintage or collateral, all with zero recovery?
A. If we wrote off all of the BBB rated and lower sub-prime collateral from the 2nd half of 2005, all the sub-prime from 2006 and 2007 regardless of rating, and all of the CDO’s rated A or lower, regardless of vintage or collateral, all with zero recovery, then the high grade transactions would show a loss of $421 million across 6 transactions and the remaining transactions would have an average remaining subordination of 10.7%The mezzanine deals would show a loss of $169 million across 4 transactions and the remaining transactions would have an average outstanding subordination of 21.4%

22
Accounting Valuations
• GAAP Fair Value standards
• The challenges of acquiring market information
• Why do we use a model?
• Economics versus Accounting
• Valuation Outlook for the remainder of 2007
23
Binomial Expansion TechniqueBinomial Expansion Technique
• Why do we have to use a model?
– There is no readily available market pricing for our multi-sector CDO transactions.
– There is limited market pricing for reference collateral.
– The market recognizes a basis between the prices of cash and synthetic securities.
– Our multi-sector CDO transactions are complex structures and are highly customized.
The Challenges of Valuation

24
Binomial Expansion Technique*Binomial Expansion Technique*
• The BET methodology was originally developed by Moody’s for rating portfolio credit products and is transparent, widely used by market participants and in the public domain.
• All model parameters are derived from independent market sources– Market implied credit spreads for collateral pool– Diversity Score– Weighted Average Life– Recovery Rates for each reference obligation
Simple and Established Model Using Market Data Inputs
* Moody’s Investors Service, December 13, 1996
25
Binomial Expansion TechniqueBinomial Expansion Technique
• We use market credit spreads for the reference obligations to calculate a probability of loss.
• We replace a large collateral pool of correlated assets with a smaller pool of idealized homogeneous, independent assets.
• The size of the idealized pool, i.e. the number of assets, is given by the Diversity Score.
• The Binomial Expansion Technique allows us to derive a loss distribution through time for the portfolio.
• Monte Carlo simulation will enable us to value all of the important features of each transaction.
Market Credit Spreads used to Derive Default Probabilities

26
AIGFP’s “Super Senior” Credit Derivative Business is a “Money Good” Portfolio
• All of our trades combine the strengths of careful asset due diligence, selection and review with those of the rigors and framework provided by our bespoke modeling.
• Each and every transaction passes through the same process of careful selection and due diligence and credit review; including a second review and approval by the AIG Head Office Credit Risk Management Team.
• Simple, specific, highly conservative models.
• We always construct and stress test to the Worst Case portfolio.
• Very little exposure to the problematic vintages of 2006 and 2007.

A0
Capital Markets
Appendix**All data is as of November 25, 2007, unless otherwise indicated* AIGFP Net Notional Exposure is Net of All Transaction Subordination

A1
Summary Statistics Summary Statistics ““Super SeniorSuper Senior”” Credit DerivativesCredit Derivatives
11919283,9941,158Average Number of Obligors / Transaction
4.4**4.2**2.4*2.2*Expected Maturity(Years)
European Mortgage
$21.6$84.4$167.7$354.3Gross Notional ($ Billion)
$17.1$62.4145.4$280.6AIGFP Net Notional Exposure($ Billion)
14.8%
14
23.2%
104
Multi-Sector CDOsTransactions w/Mixed TransactionsCollateral, including w/No Sub-Prime Sub-Prime Collateral
13.2%
37
20.8%
93
CorporateTransaction Type
Number of TransactionsWeighted Average Subordination (%)
*Majority of transactions have Regulatory Capital Calls from January 2008**Sourced from Transaction Trustee Reports

A2
Summary of Key Statistics for MultiSummary of Key Statistics for Multi--Sector Sector CDOsCDOs with with Mixed Collateral, Including SubMixed Collateral, Including Sub--PrimePrime
($ ($ Billion))
• Total Gross Transaction Notional: 53.5• AIGFP Net Notional Exposure: 43.9• Number of Transactions: 45• Average Attachment: 15.3%
Sub-Prime Reference Obligations
• Gross Sub-Prime Notional: 25.3• AIGFP Net Sub-Prime Notional: 17.4• Average Sub-Prime: 47.3%• Avg. HPA for Sub-Prime Collateral: 20.6%• Average Cum. Loss Rate: 1.3%• Average FICO: 627
• Total Gross Transaction Notional: 30.8• AIGFP Net Notional Exposure: 18.5• Number of Transactions: 59• Average Attachment: 37.0%
Sub-Prime Reference Obligations
• Gross Sub-Prime Notional: 19.6• AIGFP Net Sub-Prime Notional: 8.6• Average Sub-Prime: 63.6%• Avg. HPA for Sub-Prime Collateral: 20.9%• Average Cum. Loss Rate: 1.2%• Average FICO: 626
High Grade Collateral(Predominantly AA Rated)
Mezzanine Collateral(Predominantly BBB Rated)
Information shown is sourced from LoanPerformance except in the following circumstances:• Underlying Reference Obligation data is sourced from Intex• Loss Data is sourced from CSFB’s “Locus” system• Sector Categorization is compiled from Individual Transaction Trustee Reports and Moody’s and S&P data
A3
““Super SeniorSuper Senior”” ExposureExposureCorporate LoansCorporate Loans

A4
245.71.90.1325.231.688.3U.S.A. Majority
Regional Exposure Portfolio
188.81.7Nil17.527.577.3W. Europe Majority
63.30.9Nil13.84.512.5Asia/Australia Majority
21.11.1Nil29.00.41.0Emerging Market
Number of
Deals
Weighted Average Maturity (years)
Realized PoolLosses to Date
%
Current Average
Subordination
Percentage of Total
AIGFP Net Notional Exposure
($ BN)
To Maturity
ToFirst Call *
Primarily Single Country Exposure Portfolio
109.22.50.0923.06.618.6Germany
265.43.60.1119.923.365.4U.S.A.
146.12.1Nil15.42.05.6Netherlands
111.90.90.0711.61.54.1Portugal
114.01.2Nil24.40.82.4UK
11.21.2Nil21.00.72.1France
13.41.9Nil9.00.61.8Australia/New Zealand
17.21.2Nil18.00.41.2Finland
16.46.40.2712.10.10.3Belgium
937.42.20.0720.8100.0280.6Total
Corporate Loan Portfolio by Primary JurisdictionCorporate Loan Portfolio by Primary Jurisdiction
* The vast majority of deals have regulatory calls from January 2008. We expect that these calls will be exercized over the next 12-18 months as the different originating banks in Europe are able to adopt the new Basle II Capital standards. The call date listed in the chart is the first non regulatory call.
A5
““Super SeniorSuper Senior”” ExposureExposureEuropean Residential MortgagesEuropean Residential Mortgages

A6
To MaturityTo First Call*
137.58.60.008.71.11.7Spain
413.04.90.0121.715.422.4Netherlands
131.41.40.0010.01.31.9UK
332.00.80.009.226.538.5Denmark
731.72.10.018.225.837.5France
1941.72.60.1116.823.233.7Germany
Number of Transactions
Weighted Average Maturity(years)
Realized Losses to Date
% of Pool
Current Average
Subordination%
% of TotalExposure
AIGFP Net Notional
Exposure($ BN)
234.82.10.0012.96.79.7Sweden
3730.22.40.0313.2100.0145.4Total
European Residential Mortgages Summary by GeographyEuropean Residential Mortgages Summary by Geography
* All of these deals have regulatory calls from January 2008. We expect that these calls will be exercized over the next 12-18 months as the different originating banks in Europe are able to adopt the new Basle II Capital standards. The call date listed in the chart is the first non regulatory call.
A7
““Super SeniorSuper Senior”” MultiMulti--Sector CDO ExposureSector CDO ExposureConsisting of Mixed Collateral, Consisting of Mixed Collateral,
including Subincluding Sub--Prime: Prime:
Mezzanine Collateral Underlying SummaryMezzanine Collateral Underlying Summary

A8
27Static Transactions
30.8 BNGross Notional ($)
40Number of Transactions that are Amortizing
Avg: 314 MM
Min: 34 MM
Max: 940 MM
18.5BNAIGFP Net Notional Exposure ($)
Summary of Transaction Current StatusSummary of Transaction Current Status
59Number of Transactions
Min:2.4%
Max:31.6%
13.9%Average Subordinated AAA Tranche Thickness
Min: 7.4%
Max: 63.7%
37.0%Average % of AIGFP Subordination that is AAA Rated by at least one agency
Min: 24.5%
Max: 69.6%
37.0%Weighted Average AIGFP Attachment Point
172Average Number of Obligors
32Managed Transactions
Information used in this presentation is sourced from LoanPerformance except in the following circumstances:• Underlying Reference Obligation data is sourced from Intex• Rating Information is sourced from Bloomberg• Loss Data is sourced from CSFB’s “Locus” system• Sector Categorization is compiled from Individual Transaction Trustee Reports and Moody’s and S&P data
“Super Senior” Multi-Sector CDO Exposure - Mezzanine Collateral Underlying Summary

A9
Summary of Reference Obligations in our Summary of Reference Obligations in our Transactions:Transactions:
1.1%
NR<BBBBBBBAAAAAA
8.2%
0.9%
Non ABS
TotalOther ABS
CMBSCDOOther RMBS
Sub-Prime
100.0%4.4%7.5%6.3%17.3%63.6%Classifications
100.0%9.0%62.6%12.3%4.5%2.3%Rating
Percentages shown are of Gross Transaction Notional
“Super Senior” Multi-Sector CDO Exposure - Mezzanine Collateral Underlying Summary

A10
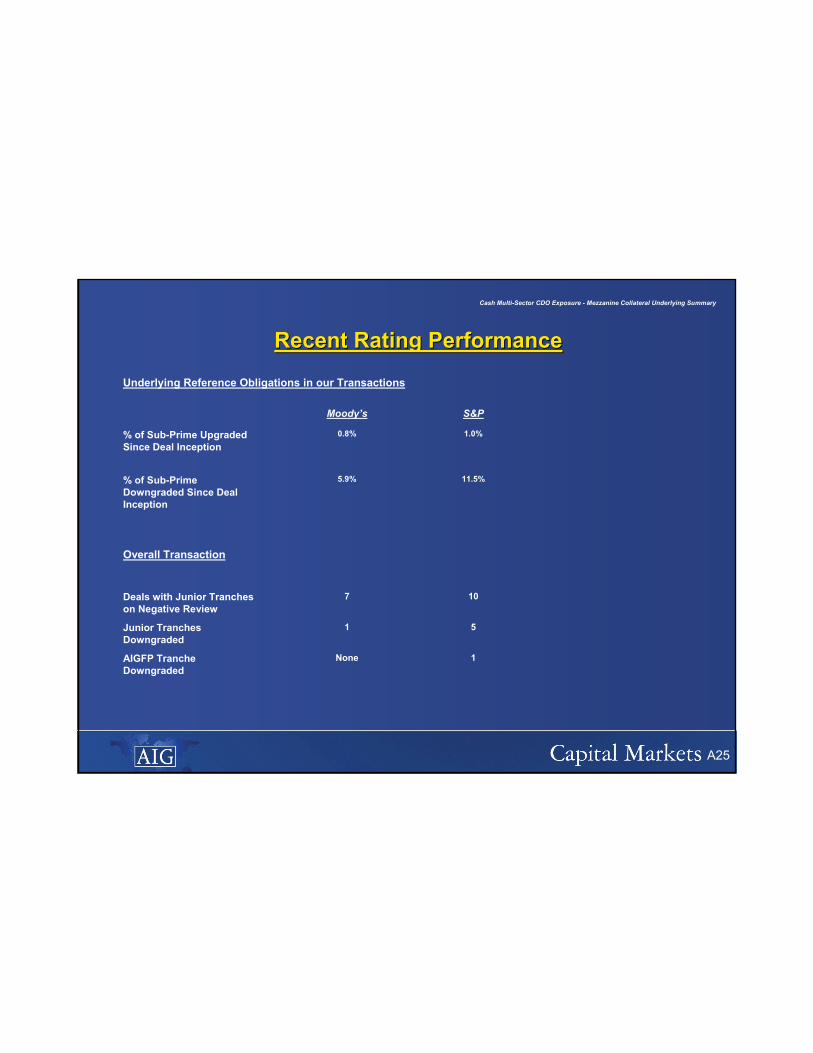
11.5%6.6%% of Sub-Prime Downgraded Since Deal Inception
Recent Rating PerformanceRecent Rating Performance
NoneNoneAIGFP Tranche Downgraded
Underlying Reference Obligations in our Transactions
63Junior Tranches Downgraded
219Deals with Junior Tranches on Negative Review
Overall Transaction
0.4%0.7%% of Sub-Prime Upgraded Since Deal Inception
S&PMoody’s
“Super Senior” Multi-Sector CDO Exposure - Mezzanine Collateral Underlying Summary
A11
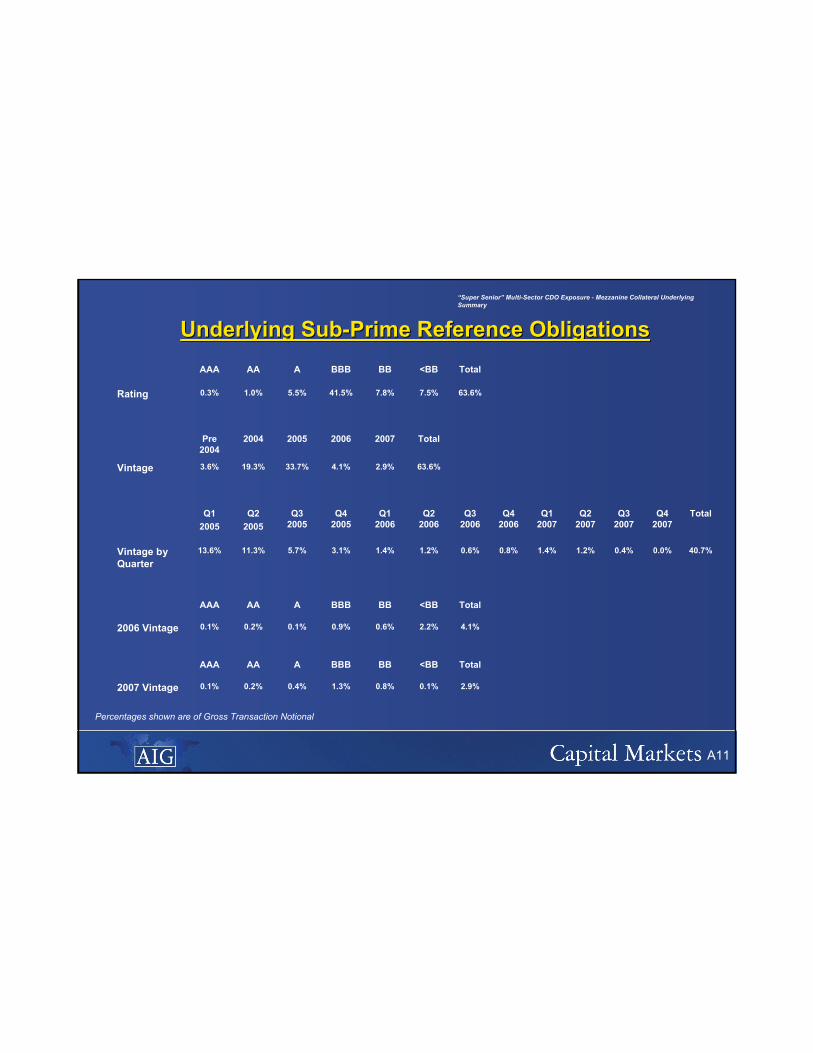
Underlying SubUnderlying Sub--Prime Reference ObligationsPrime Reference Obligations
0.0%
Q4 2007
Total<BBBBBBBAAAAAA
Total<BBBBBBBAAAAAA
1.2%
Q2 2007
1.4%
Q1 2007
TotalQ3 2007
Q4 2006
Q3 2006
Q2 2006
Q1 2006
Q4 2005
Q3 2005
Q2 2005
Q1 2005
Total2007200620052004Pre 2004
Total<BBBBBBBAAAAAA
2.9%0.1%0.8%1.3%0.4%0.2%0.1%2007 Vintage
4.1%2.2%0.6%0.9%0.1%0.2%0.1%2006 Vintage
40.7%0.4%0.8%0.6%1.2%1.4%3.1%5.7%11.3%13.6%Vintage by Quarter
63.6%2.9%4.1%33.7%19.3%3.6%Vintage
63.6%7.5%7.8%41.5%5.5%1.0%0.3%Rating
“Super Senior” Multi-Sector CDO Exposure - Mezzanine Collateral Underlying Summary
Percentages shown are of Gross Transaction Notional

A12
626Average FICO Score
Additional SubAdditional Sub--Prime BreakdownPrime Breakdown
81.1Average LTV at Inception
Fixed3 Yr ARM
2 Yr ARM
Floating
38.8%Current Average 12 mos CPR Rate
38.1%12.6%45.3%61.9%Average Loan Type
5.0%Texas3.8%Countrywide
5.7%Florida4.9%Ameriquest
4.6%New York3.6%Option 1
0.7%Michigan2.9%Fremont
1.2%Current Weighted Average Loss Rate on Sub-Prime
22.5%CaliforniaState Concentration5.6%New CenturySub-Prime Originators
Min:11.9%
Max: 46.3%
20.8%Avg. HPA on Reference Sub-Prime Bonds
0.8%Avg. % of Sub-Prime Collateral with 2nd Lien >90%
2.0%Avg. % of Sub-Prime Collateral that is 2nd Lien
Percentages shown are of Total Sub-Prime
“Super Senior” Multi-Sector CDO Exposure - Mezzanine Collateral Underlying Summary

A13
17.3%
Total
6.3%0.2%0.8%2.5%1.9%0.5%0.4%Vintage
20072006200520042003Pre 2003Other RMBS by Vintage
Underlying CDO Reference Obligations BreakdownUnderlying CDO Reference Obligations Breakdown
Total
0.2%
NR
0.4%1.3%6.8%6.4%2.1%0.3%
20072006200520042003Pre 2003
6.3%0.1%0.2%3.8%1.1%0.7%0.2%Rating
Total<BBBBBBBAAAAAA
6.3%1.3%0.8%0.3%3.2%0.7%Classifications
TotalOtherCMBSOther ABS
MezzHigh Grade
“Super Senior” Multi-Sector CDO Exposure - Mezzanine Collateral Underlying Summary
Percentages shown are of Gross Transaction Notional

A14
““Super SeniorSuper Senior”” MultiMulti--Sector CDO ExposureSector CDO ExposureConsisting of Mixed Collateral,Consisting of Mixed Collateral,
including Subincluding Sub--Prime: Prime:
High Grade Collateral Underlying SummaryHigh Grade Collateral Underlying Summary

A15
21Static Transactions
53.5 BNGross Notional ($)
28Number of Transactions that are Amortizing
Avg: 976 MM
Min: 91 MM
Max: 2.2 BN
43.9 BNAIGFP Net Notional Exposure ($)
Summary of Transaction Current StatusSummary of Transaction Current Status
45Number of Transactions
Min: 0.0%
Max: 39.7%
7.4%Average Subordinated AAA Tranche Thickness
Min: 0.0%
Max: 86.1%
43.1%Average % of AIGFP Subordination that is AAA Rated
Min: 10.0%
Max: 46.2%
15.3%Weighted Average AIGFP Attachment Point
203Average Number of Obligors
24Managed Transactions
“Super Senior” Multi-Sector CDO Exposure – High Grade Collateral Underlying Summary
Information used in this presentation is sourced from LoanPerformance except in the following circumstances:• Underlying Reference Obligation data is sourced from Intex• Rating Information is sourced from Bloomberg• Loss Data is sourced from CSFB’s “Locus” system• Sector Categorization is compiled from Individual Transaction Trustee Reports and Moody’s and S&P data

A16
Summary of Underlying Reference Obligations in our Summary of Underlying Reference Obligations in our Transactions:Transactions:
2.1%
NR<BBBBBBBAAAAAA
0.2%
0.3%
Non ABS
TotalOther ABS
CMBSCDOOther RMBS
Sub-Prime
100.0%2.3%6.9%15.0%28.2%47.3%Classifications
100.0%0.6%2.5%27.1%38.6%28.9%Rating
“Super Senior” Multi-Sector CDO Exposure – High Grade Collateral Underlying Summary
Percentages shown are of Gross Transaction Notional

A17
1.6%0.8%% of Sub-Prime Downgraded Since Deal Inception
Recent Rating PerformanceRecent Rating Performance
NoneNoneAIGFP Tranche Downgraded
Underlying Reference Obligations in our Transactions
None1Junior Tranches Downgraded
14Deals with Junior Tranches on Negative Review
Overall Transaction
0.8%0.8%% of Sub-Prime Upgraded Since Deal Inception
S&PMoody’s
“Super Senior” Multi-Sector CDO Exposure – High Grade Collateral Underlying Summary

A18
Underlying SubUnderlying Sub--Prime Reference ObligationsPrime Reference Obligations
0.0%
Q4 2007
Total<BBBBBBBAAAAAA
Total<BBBBBBBAAAAAA
0.8%
Q2 2007
0.7%
Q1 2007
TotalQ3 2007
Q4 2006
Q3 2006
Q2 2006
Q1 2006
Q42005
Q3 2005
Q2 2005
Q1 2005
Total2007200620052004Pre 2004
Total<BBBBBBBAAAAAA
2.0%0.0%0.1%0.2%0.4%0.8%0.5%2007 Vintage
2.3%0.0%0.1%0.2%0.5%0.8%0.7%2006 Vintage
30.6%0.5%0.3%0.3%0.5%1.2%4.3%5.8%9.5%6.7%Vintage by Quarter
47.3%2.0%2.3%26.4%14.2%2.4%Vintage
47.3%0.1%0.4%1.8%19.3%21.6%4.1%Rating
Percentages shown are of Gross Transaction Notional
“Super Senior” Multi-Sector CDO Exposure – High Grade Collateral Underlying Summary

A19
627Average FICO Score
81.2Average LTV at Inception
Fixed3 Yr ARM
2 Yr ARM
Floating
38.0%Current Average 12 monthCPR Rate
37.9%14.2%44.0%62.1%Average Loan Type
Additional SubAdditional Sub--Prime BreakdownPrime Breakdown
4.8%Texas4.1%New Century
6.2%Florida4.6%Ameriquest
4.3%New York2.8%Lehman
0.7%Michigan2.6%Fremont
1.3%Current Weighted Average Loss Rate on Sub-Prime
23.0%CaliforniaState Concentration
4.8%CountrywideSub-Prime Originators
Min:10.8%
Max: 44.0%
20.6%Avg. HPA on Reference Sub-Prime Bonds
0.6%Avg. % of Sub-Prime Collateral with 2nd Lien >90%
1.9%Avg. % of Sub-Prime Collateral that is 2nd Lien
Percentages shown are of Total Sub-Prime
“Super Senior” Multi-Sector CDO Exposure – High Grade Collateral Underlying Summary

A20
28.2%
Total20072006200520042003Pre 2003Other RMBS by Vintage
15.0%0.3%1.5%4.8%6.3%1.3%0.8%Vintage
Underlying CDO Reference Obligations BreakdownUnderlying CDO Reference Obligations Breakdown
Total
0.4%
NR
0.9%2.4%16.1%7.4%1.0%0.4%
20072006200520042003Pre 2003
15.0%0.0%0.1%0.3%1.5%7.6%5.1%Rating
Total<BBBBBBBAAAAAA
15.0%2.4%1.1%0.6%8.1%2.8%Classifications
TotalOtherCMBSOtherABS
MezzanineHighGrade
Percentages shown are of Gross Transaction Notional
“Super Senior” Multi-Sector CDO Exposure – High Grade Collateral Underlying Summary

A21
0.4100.0%
1.2*100.0%
Monoline
*$222 MM has a Further Secondary Monoline Wrap
U.S. RMBS Accounts for just 5.4% of Total RMBS Exposure
6.3100.0%
0.22.6%
0.57.5%
1.117.3%
4.572.5%
CMBS
6.4100.0%
0.00.7%
0.11.9%
0.46.9%
0.914.7%
4.975.7%
RMBS
Total BBBBBAAAAAAExposure
Exposure to Other Specified Asset Classes
Credit Derivatives or Cash Investments($ Billion)

A22
Cash MultiCash Multi--Sector CDO ExposureSector CDO ExposureConsisting of Mixed Collateral, Consisting of Mixed Collateral,
including Subincluding Sub--Prime: Prime:
Mezzanine Collateral Underlying SummaryMezzanine Collateral Underlying Summary

A23
5544AAA
S&PMoody’sRating of Exposure
52AA
30Static Transactions
014NR
Avg: 40 MM
Min: 4 MM
Max: 200 MM
2.4 BNAIGFP Net Notional Exposure
Summary of Transaction Current StatusSummary of Transaction Current Status
60Number of Transactions
29Number of Transactions that are Amortizing
Min: 11.7%
Max: 59.6%
27.9%Weighted Average AIGFP Attachment Point
159Average Number of Obligors
30Managed Transactions
Information used in this presentation is sourced from LoanPerformance except in the following circumstances:• Underlying Collateral Data is sourced from Intex• Rating Information is sourced from Bloomberg• Loss Data is sourced from CSFB’s “Locus” system• Sector Categorization is sourced from Individual Transaction Trustee Reports along with Moody’s and S&P data
Cash Multi-Sector CDO Exposure - Mezzanine Collateral Underlying Summary

A24
Summary of Reference Obligations in our Summary of Reference Obligations in our Transactions:Transactions:
0.9%
NR<BBBBBBBAAAAAA8.2%
0.5%
Non ABS
TotalOther ABS
CMBSCDOOther RMBS
Sub-Prime
100.0%5.1%7.0%4.7%16.1%66.6%Classifications
100.0%10.4%59.1%14.0%5.1%2.3%Rating
Cash Multi-Sector CDO Exposure - Mezzanine Collateral Underlying Summary
Percentages shown are of Gross Transaction Notional
A25
11.5%5.9%% of Sub-Prime Downgraded Since Deal Inception
Recent Rating PerformanceRecent Rating Performance
1NoneAIGFP Tranche Downgraded
Underlying Reference Obligations in our Transactions
51Junior Tranches Downgraded
107Deals with Junior Tranches on Negative Review
Overall Transaction
1.0%0.8%% of Sub-Prime Upgraded Since Deal Inception
S&PMoody’s
Cash Multi-Sector CDO Exposure - Mezzanine Collateral Underlying Summary

A26
Underlying SubUnderlying Sub--Prime Reference ObligationsPrime Reference Obligations
0.0%
Q4 2007
Total<BBBBBBBAAAAAA
Total<BBBBBBBAAAAAA
0.8%
Q2 2007
0.8%
Q1 2007
TotalQ3 2007
Q4 2006
Q3 2006
Q2 2006
Q1 2006
Q4 2005
Q3 2005
Q2 2005
Q1 2005
Total2007200620052004Pre 2004
Total<BBBBBBBAAAAAA
2.0%0.0%0.4%1.0%0.3%0.2%0.1%2007 Vintage
2.7%1.4%0.3%0.6%0.1%0.2%0.1%2006 Vintage
38.3%0.3%0.6%0.4%0.7%1.0%2.6%5.2%10.9%15.0%Vintage by Quarter
66.6%2.0%2.7%33.6%25.0%3.3%Vintage
66.6%7.8%8.8%41.6%7.1%0.9%0.4%Rating
Cash Multi-Sector CDO Exposure - Mezzanine Collateral Underlying Summary
Percentages shown are of Gross Transaction Notional

A27
628Average FICO Score
Additional SubAdditional Sub--Prime BreakdownPrime Breakdown
81.0Average LTV at Inception
Fixed3 Yr ARM
2 Yr ARM
Floating
40.7%Current Average 12 mos CPR Rate
39.2%13.2%43.7%60.8%Average Loan Type
5.3%Texas4.6%Countrywide
5.2%Florida5.8%Ameriquest
4.8%New York3.5%Fremont
0.8%Michigan3.3%Option One
1.3%Current Weighted Average Loss Rate on Sub-Prime
22.6%CaliforniaConcentration by State6.6%New CenturyTop 5 Sub-Prime Originators
Min:12.2%
Max: 33.4%
20.1%Avg. HPA on Underlying Sub-Prime Bonds
0.9%Avg. % of Sub-Prime Reference Collateral with 2nd
Lien >90%
3.7%Avg. % of Sub-Prime Reference Collateral that is 2nd Lien
Cash Multi-Sector CDO Exposure - Mezzanine Collateral Underlying Summary
Percentages shown are of Total Sub-Prime

A28
16.1%
Total
4.7%0.1%0.9%2.3%1.0%0.2%0.2%Vintage
20072006200520042003Pre 2003
Other RMBS by Vintage
Underlying CDO Reference Obligations Underlying CDO Reference Obligations BreakdownBreakdown
Total
0.1%
NR
0.2%0.9%5.5%7.1%2.1%0.3%
20072006200520042003Pre 2003
4.7%0.1%0.2%2.9%0.7%0.6%0.1%Rating
Total<BBBBBBBAAAAAA
4.7%0.6%0.7%0.5%2.5%0.4%Classifications
TotalOtherCMBSOther ABS
MezzHigh Grade
Cash Multi-Sector CDO Exposure - Mezzanine Collateral Underlying Summary
Percentages shown are of Gross Transaction Notional

A29
Cash MultiCash Multi--Sector CDO ExposureSector CDO ExposureConsisting of Mixed Collateral,Consisting of Mixed Collateral,
including Subincluding Sub--Prime: Prime:
High Grade Collateral Underlying SummaryHigh Grade Collateral Underlying Summary

A30
88AAA
S&PMoody’sRating of Exposure
4Static Transactions
Avg: 133 MM
Min: 14 MM
Max: 250 MM
1.1 BNAIGFP Net Notional Exposure ($)
Summary of Transaction Current StatusSummary of Transaction Current Status
8Number of Transactions
2Number of Transactions that are Amortizing
Min: 11.4%
Max: 37.0%
15.6%Weighted Average AIGFP Attachment Point
180Average Number of Obligors
4Managed Transactions
Information used in this presentation is sourced from LoanPerformance except in the following circumstances:• Underlying Collateral Data is sourced from Intex• Rating Information is sourced from Bloomberg• Loss Data is sourced from CSFB’s “Locus” system• Sector Categorization is sourced from Individual Transaction Trustee Reports along with Moody’s and S&P data
Cash Multi-Sector CDO Exposure – High Grade Collateral Underlying Summary

A31
Summary of Underlying Reference Obligations in our Summary of Underlying Reference Obligations in our Transactions:Transactions:
5.5%
NR<BBBBBBBAAAAAA
0.4%
0.3%
Non ABS
TotalOther ABS
CMBSCDOOther RMBS
Sub-Prime
100.0%2.3%15.4%12.0%24.6%45.4%Classifications
100.0%0.5%4.8%29.0%28.6%31.2%Rating
Cash Multi-Sector CDO Exposure – High Grade Collateral Underlying Summary
Percentages shown are of Gross Transaction Notional

A32
1.6%0.9%% of Sub-Prime Downgraded Since Deal Inception
Recent Rating PerformanceRecent Rating Performance
NoneNoneAIGFP Tranche Downgraded
Underlying Reference Obligations in our Transactions
NoneNoneJunior Tranches Downgraded
None1Deals with Junior Tranches on Negative Review
Overall Transaction
0.7%0.3%% of Sub-Prime Upgraded Since Deal Inception
S&PMoody’s
Cash Multi-Sector CDO Exposure – High Grade Collateral Underlying Summary

A33
Underlying SubUnderlying Sub--Prime Reference ObligationsPrime Reference Obligations
0.0%
Q4 2007
Total<BBBBBBBAAAAAA
Total<BBBBBBBAAAAAA
0.3%
Q2 2007
0.1%
Q1 2007
TotalQ3 2007
Q4 2006
Q3 2006
Q2 2006
Q1 2006
Q42005
Q3 2005
Q2 2005
Q1 2005
Total2007200620052004Pre 2004
Total<BBBBBBBAAAAAA
0.6%0.0%0.0%0.0%0.2%0.2%0.2%2007 Vintage
1.5%0.0%0.0%0.4%0.8%0.1%0.2%2006 Vintage
30.9%0.1%0.1%0.0%0.2%1.2%10.4%8.3%5.2%5.0%Vintage by Quarter
45.4%0.6%1.5%28.8%12.9%1.6%Vintage
45.4%0.0%0.4%3.6%19.1%18.2%4.1%Rating
Cash Multi-Sector CDO Exposure – High Grade Collateral Underlying Summary
Percentages shown are of Gross Transaction Notional

A34
627Average FICO Score
81.0Average LTV at Inception
Fixed3 Yr ARM
2 Yr ARM
Floating
36.6%Current Average 12 monthCPR Rate
35.1%16.6%45.5%64.9%Average Loan Type
Additional SubAdditional Sub--Prime BreakdownPrime Breakdown
4.4%Texas5.2%Lehman
6.7%Florida5.3%Ameriquest
3.8%New York4.6%New Century
0.6%Michigan3.1%First Franklin
1.0%Current Weighted Average Loss Rate on Sub-Prime
24.5%CaliforniaState Concentration
8.2%CountrywideTop 5 Sub-Prime Originators
Min:11.1%
Max: 29.5%
16.3%Avg. HPA on Underlying Sub-Prime Bonds
0.4%Avg. % of Reference Transaction with 2nd Lien >90%
2.5%Avg. % of Reference Transaction Collateral that is 2nd Lien
Cash Multi-Sector CDO Exposure – High Grade Collateral Underlying Summary
Percentages shown are of Total Sub-Prime

A35
24.6%
Total20072006200520042003Pre 2003Other RMBS by Vintage
12.0%0.3%2.0%3.2%4.7%1.2%0.6%Vintage
Underlying CDO Reference Obligations BreakdownUnderlying CDO Reference Obligations Breakdown
Total
0.8%
NR
0.3%1.5%12.8%7.3%1.2%1.5%
20072006200520042003Pre 2003
12.0%0.0%0.0%0.9%2.1%3.3%4.9%Rating
Total<BBBBBBBAAAAAA
12.0%1.9%1.6%1.0%5.2%2.3%Classifications
TotalOtherCMBSOtherABS
MezzanineHighGrade
Cash Multi-Sector CDO Exposure – High Grade Collateral Underlying Summary
Percentages shown are of Gross Transaction Notional

A36
Nightingale Finance Ltd. - SIV• Nightingale Finance Ltd. is a Structured Investment Vehicle (SIV) managed by AIGFP Capital
Management.• AIGFP holds both Capital Notes and Senior Debt of the SIV.• The SIV holds no direct sub-prime assets and only $306 million of CDOs of ABS.• The total net exposure to sub-prime through the $306 million of CDOs of ABS owned is $49
million.• AIGFP has the resources to purchase any additional debt as it matures if required.
Total SIV Liabilities
Senior Debt (AAA/Aaa) $2.05BNREPO Funding $0.16BNCapital Notes (BBB/B3) $0.30BN
Total $2.51BN
AIGFP – Holdings
Capital Notes $35.25MMSenior Debt $1.5BNREPO Facility $158MM
Max additional AIGFP funding exposure $549 MM Dec 07: $01st Qtr 08: $25MM2nd Qtr 08: $357MM3rd Qtr 08: $167MM