fr3131 introduction to gis...• interpolation • data quality • the future. what is a gis? ......
TRANSCRIPT
FNRM 3131
Introduction to GIS in Natural
Resource Management
Instructors: Andrew C. Jenks
215 Green Hall
[email protected], @acjenks
Paul Bolstad
301H Green Hall

Course Topics
• Motivation: why GIS?
• Data Models
• Map Projections and
Coordinate Systems
• Data entry - digitzing
• Data entry - GPS
• Data entry - digital
data
• Image data
• Tables
• Basic Spatial Analysis
• Raster Analyses
• Spatial Models and
Modeling
• Interpolation
• Data Quality
• The Future

What is a GIS?
Geographic Information System -
collection, organization, maintenance,
analysis, and output of spatially-
referenced information.
Two important components - What, and
Where

We usually understand GIS to be computer-
facilitated system
GIS is NOT only software/hardware
Also includes:
•Trained personnel
•Supporting Institution
•Protocols for use


Motivation

Why GIS?
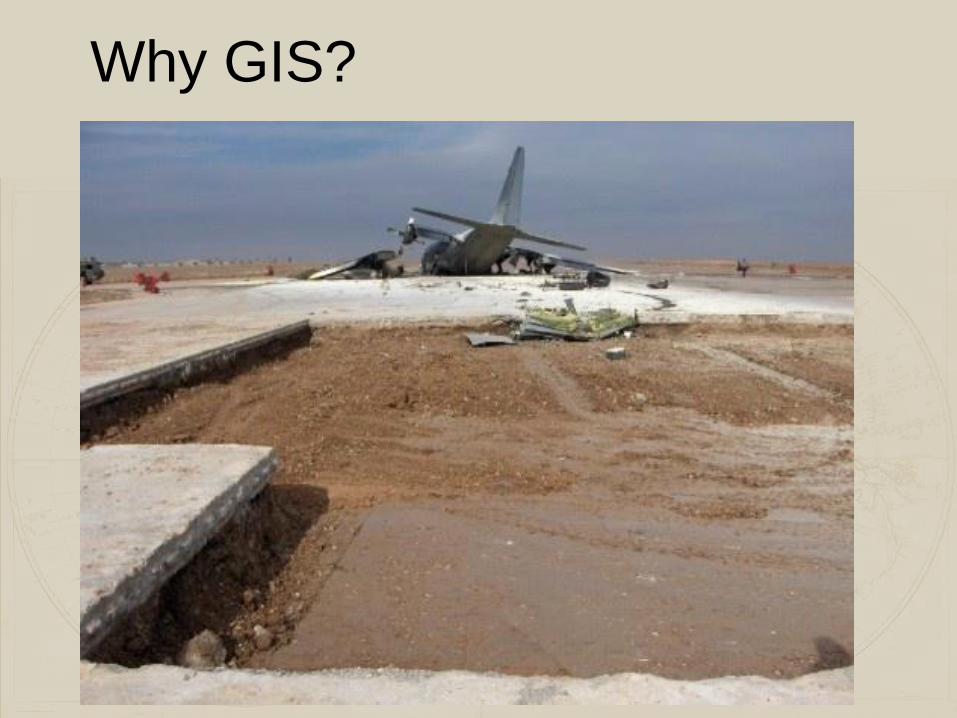
Why GIS?

Pavement quality
inventory and
monitoring


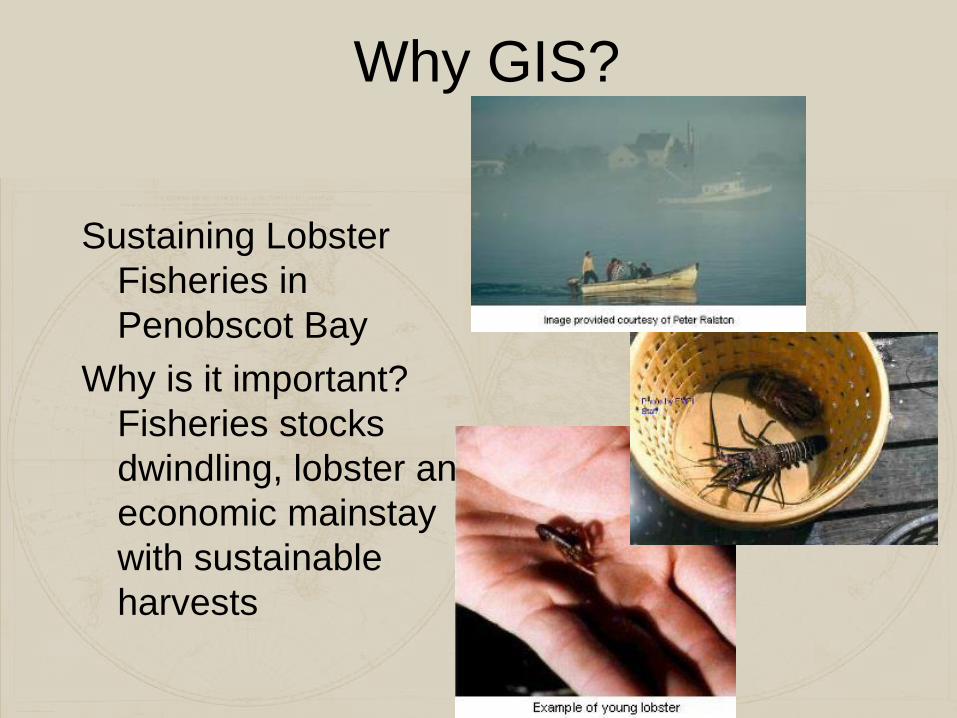
Why GIS?
Sustaining Lobster
Fisheries in
Penobscot Bay
Why is it important?
Fisheries stocks
dwindling, lobster an
economic mainstay
with sustainable
harvests

Lobster habitat (green) in outer Penobscot Bay

http://www.islandinstitute.org/penbaycoll_understandinglife.php
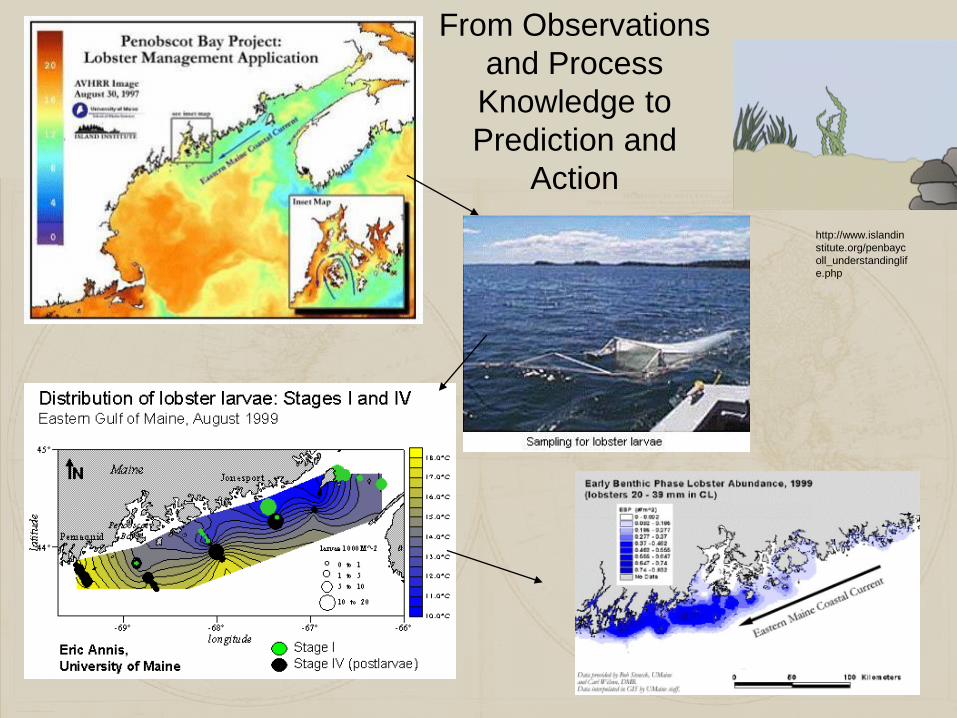
From Observations
and Process
Knowledge to
Prediction and
Action
http://www.islandin
stitute.org/penbayc
oll_understandinglif
e.php

Dynamic Spatial Models
Courtesy Virginia Institute
of Marine Science

GIS Software Tools
GIS started at universities as research tools – Harvard,
Yale, Minnesota, Clark University
GIS software have evolved to robust (sort of) tools
capable of a wide variety of tasks
ESRI (ArcGIS) Quantum GIS (QGIS)
Microimages Autocad MapInfo
ERDAS Idrisi Manifold
GRASS Intergraph

Caveat
Tools for data
management
Tools for generic
analysis
Science and specific
tools often lacking

What is in it for me?
Help us understand your goals and expectations
Please answer these two questions on the Canvas site:
Direct link is: Questionnaire
Or type/paste it in:
https://canvas.umn.edu/courses/72212/modules/items/1268878

Steps for Successful GIS Analysis(Goals defined, methods exist)
•Choose best data model
•Define bounds, geographic region of interest
•Identify existing spatial data
•Determine coordinate system for analyses
•Develop digital database
•Document database (origin, quality)
•Perform analyses
•Report results
•Update Database

• Aldo Leopold
– Sand County Almanac (1949)
• Rachel Carson
– Silent Spring (1962)
Famous Environmental Thinkers/Writers

• Aldo Leopold
– Sand County Almanac (1949)
• Rachel Carson
– Silent Spring (1962)
• Ian McHarg
– Design With Nature (1969)
Famous Environmental Thinkers/Writers

Ian McHarg
Design With
Nature (1969)
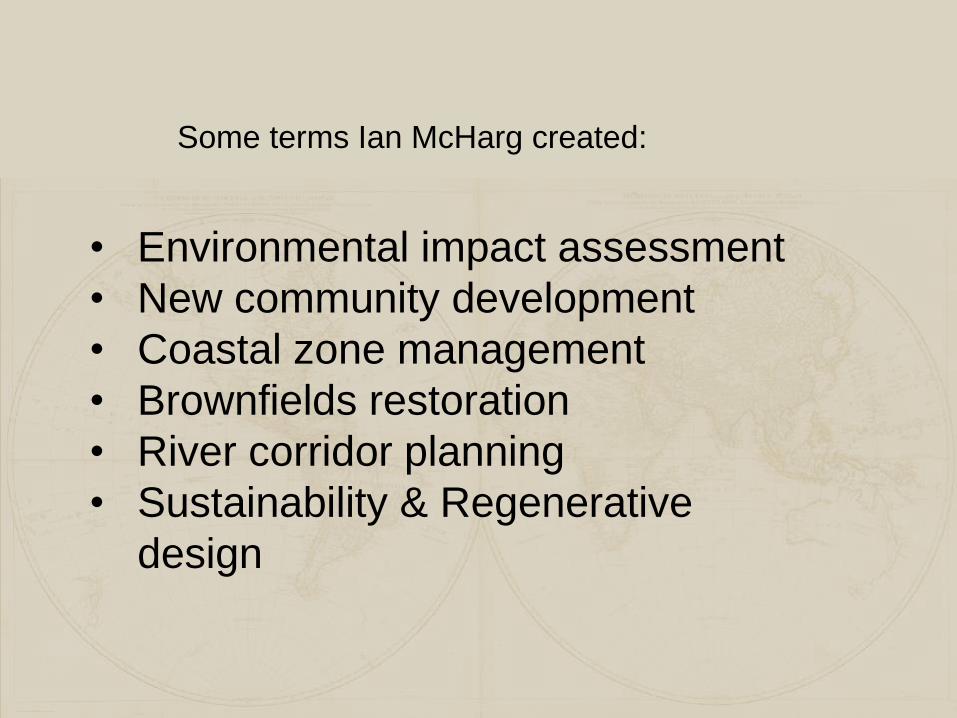
• Environmental impact assessment
• New community development
• Coastal zone management
• Brownfields restoration
• River corridor planning
• Sustainability & Regenerative
design
Some terms Ian McHarg created:

www.larch.umd.edu/classes/...
/Planned_Communities_11_3
_08.pdf

www.larch.umd.edu/classes/...
/Planned_Communities_11_3
_08.pdf

GIS Fundamentals

1.2 , 4.7
5.8 , 3.6
8.9 , 7.2
.
.
Real WorldData Model Data
Structure
phenomena that
exist
An abstraction, relevant
phenomena and properties
computer
representation

Data Model – Define spatial objects in a
database,
And represent relationships among objects
(connection, adjacency, proximity, influence)

REPRESENTATION AND DATA STRUCTURES
We approximate entities with
objects
This approximation is biased
Terms
Entities - "things" in the real
world we represent (Rivers,
buildings, soil types, wetlands)
Objects - our representation in a
data model
Entity
Object
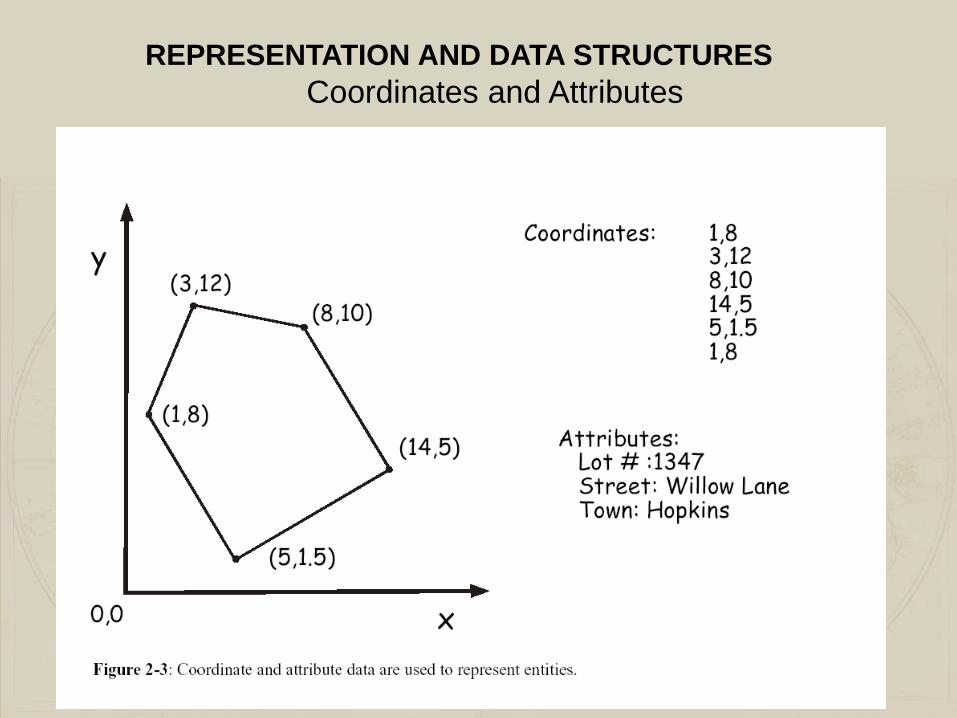
REPRESENTATION AND DATA STRUCTURES
Coordinates and Attributes

Many objects
for a theme,
with
properties
recorded for
each object
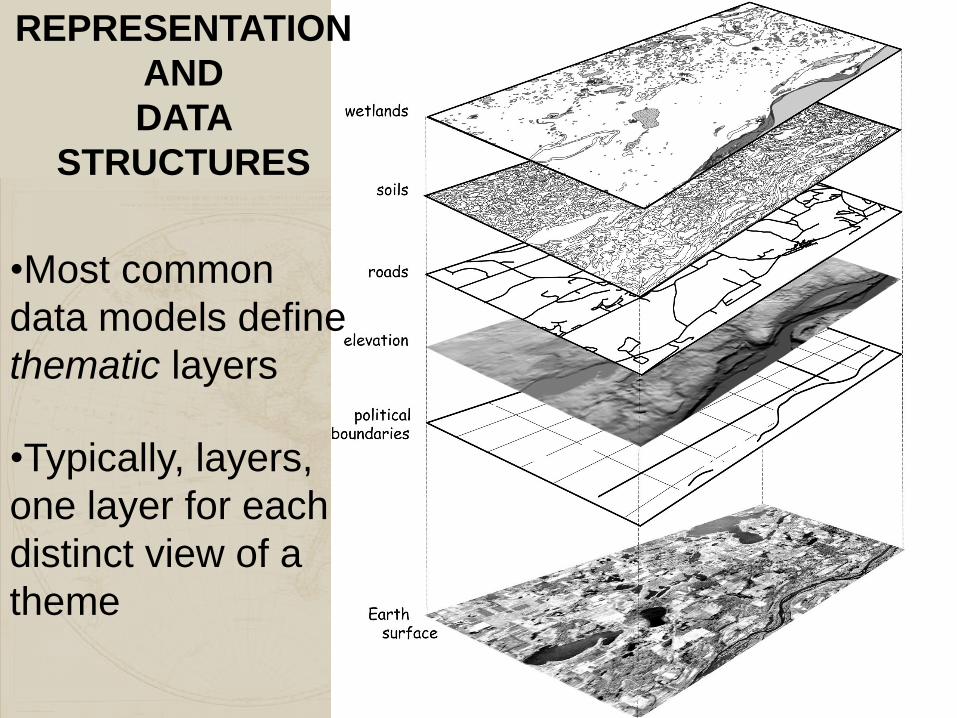
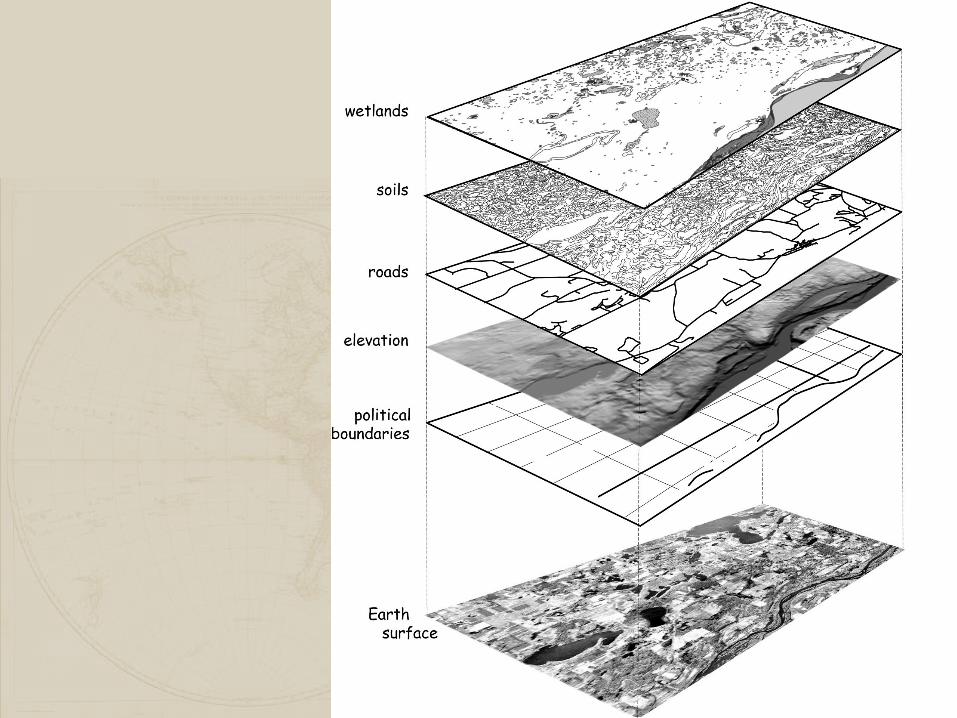
REPRESENTATION
AND
DATA
STRUCTURES
•Most common
data models define
thematic layers
•Typically, layers,
one layer for each
distinct view of a
theme

Cartesian Coordinates

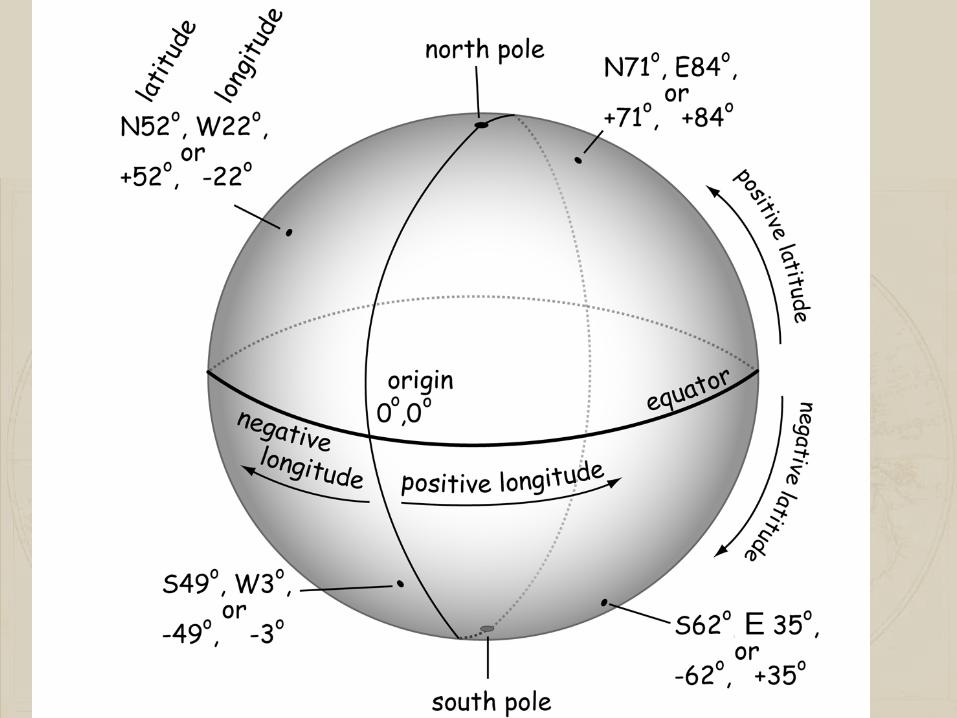
E
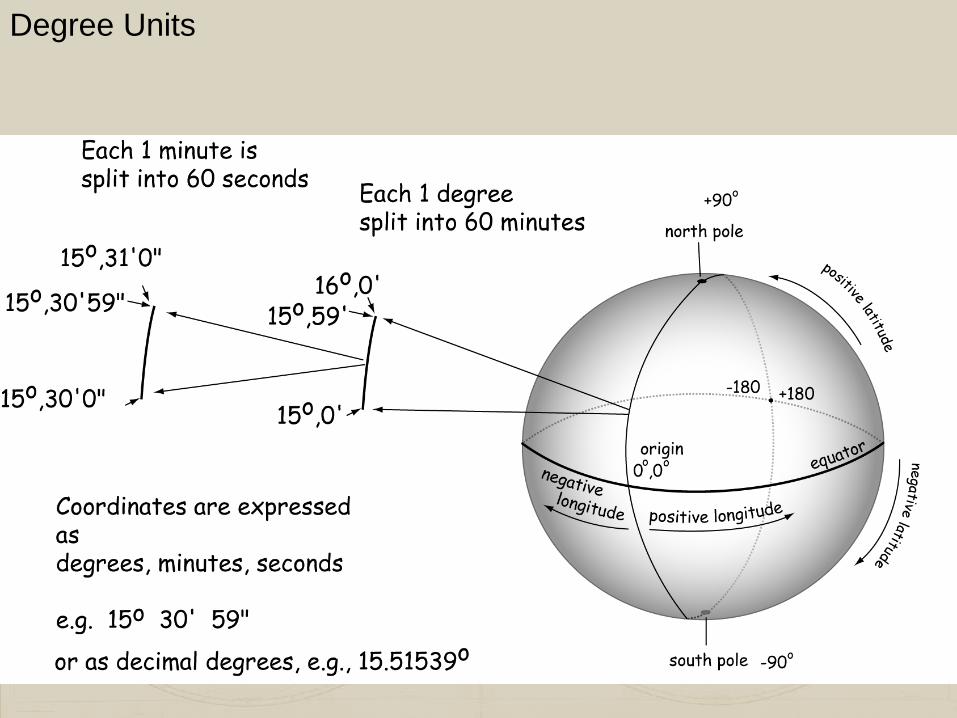
Degree Units

Sexagesimal (base sixty)

Sexagesimal (base sixty)
Originated with ancient Sumerians and Babylonians (2000 BC)
60 has 12 factors ( 1, 2, 3, 4, 5, 6, 10, 12, 15, 30, 60)
Allows many simple fractions also worked well with cuneiform
script
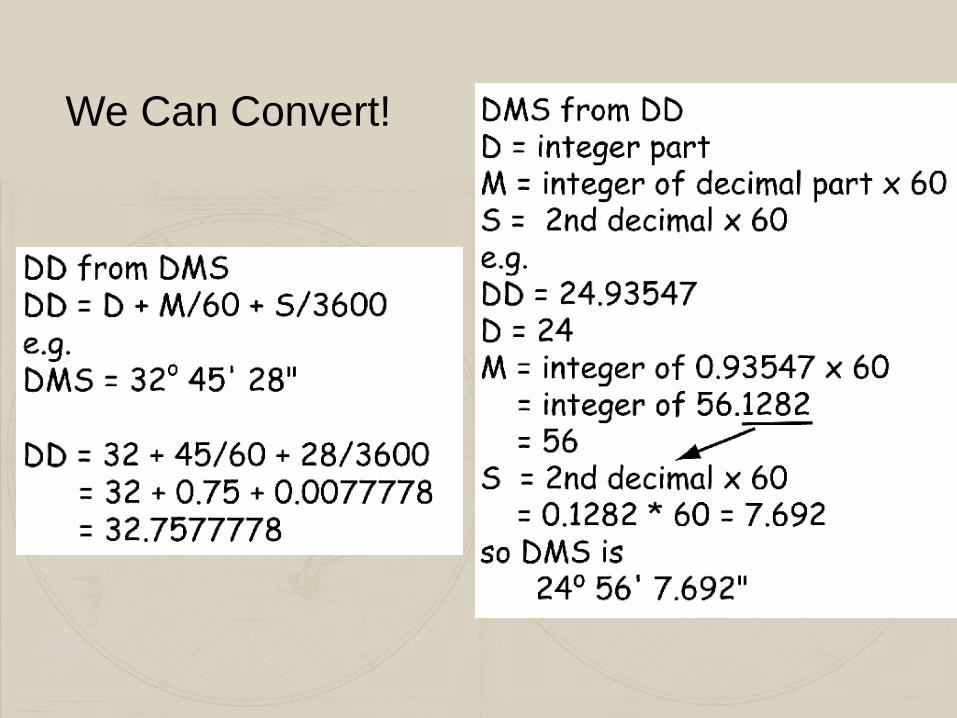
We Can Convert!
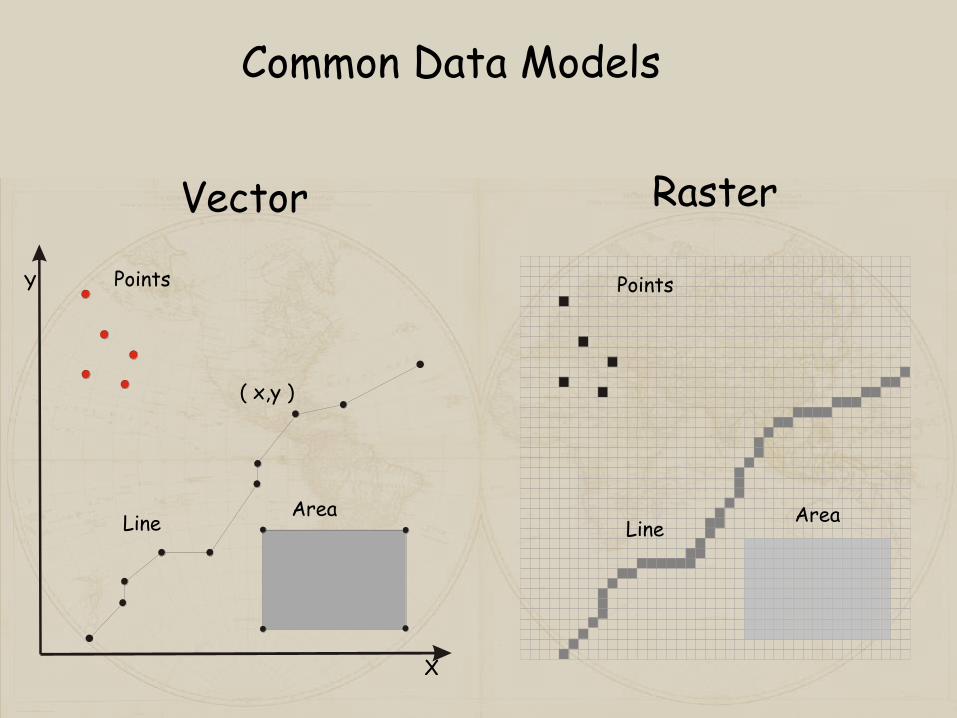
Points
LineArea
Vector Raster
Points
LineArea
( x,y )
X
Y
Common Data Models

Vectors Define Discrete Features

Points Lines
Areas

PointsPoint ID X Y
1 32.7 45.6
2 76.3 19.5
3 22.7 15.8
etc…..
12
3 4
Organization
Lines6
9
1
239
AB
CLine Begin End
ID Point Point A 6 9
B 9 1
C 239 1
etc…..
Polygons
13
22
41954
11
12
52
53
Polygon
ID Lines
A 11, 12, 52, 53,
54
B 52, 53, 9, 41,
22, 13
Three Types of Vector Features

We can get multiple objects
from a single entity, e.g.,
lake may be a
•municipal water source
•recreation area
•flood control sink
•wildlife habitat
We typically store different
object types (even from the
same entity) in different
layers.
REPRESENTATION AND DATA STRUCTURES
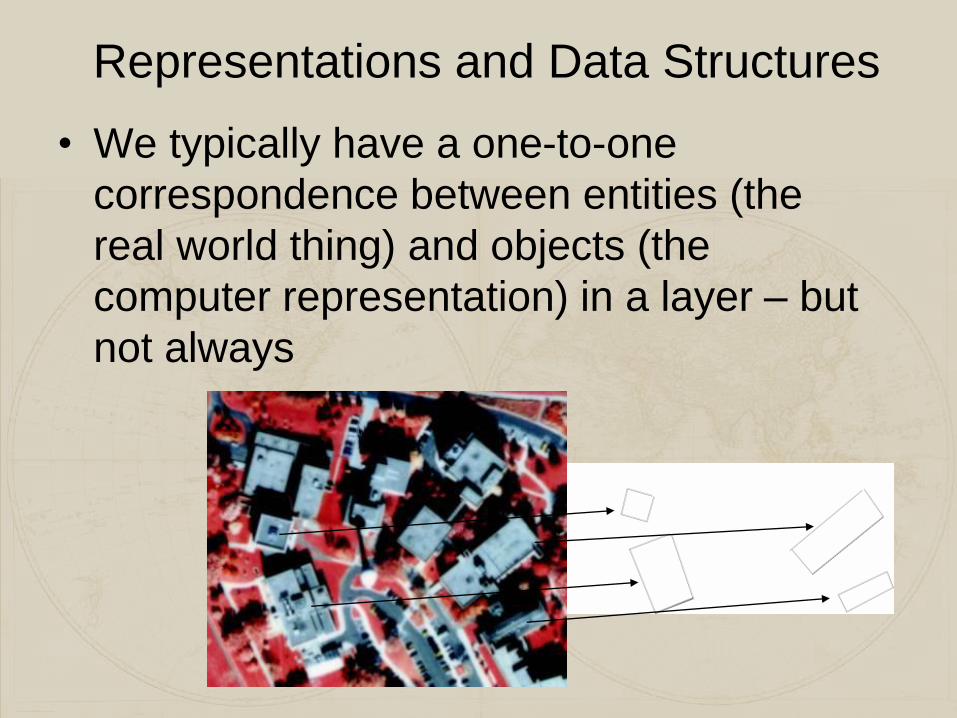
Representations and Data Structures
• We typically have a one-to-one
correspondence between entities (the
real world thing) and objects (the
computer representation) in a layer – but
not always

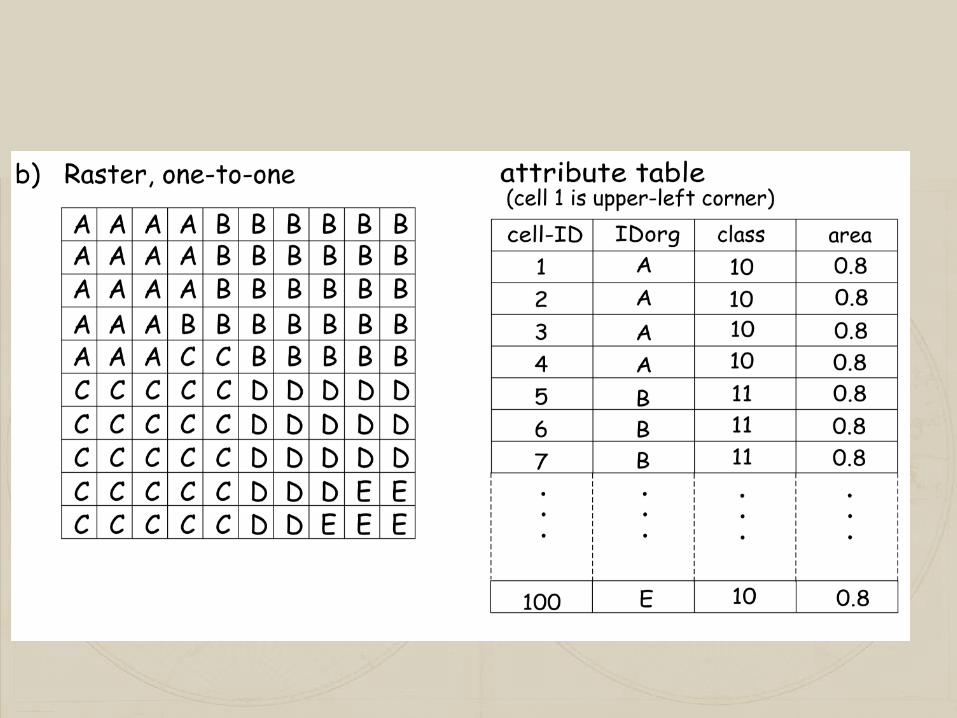
One-to-One

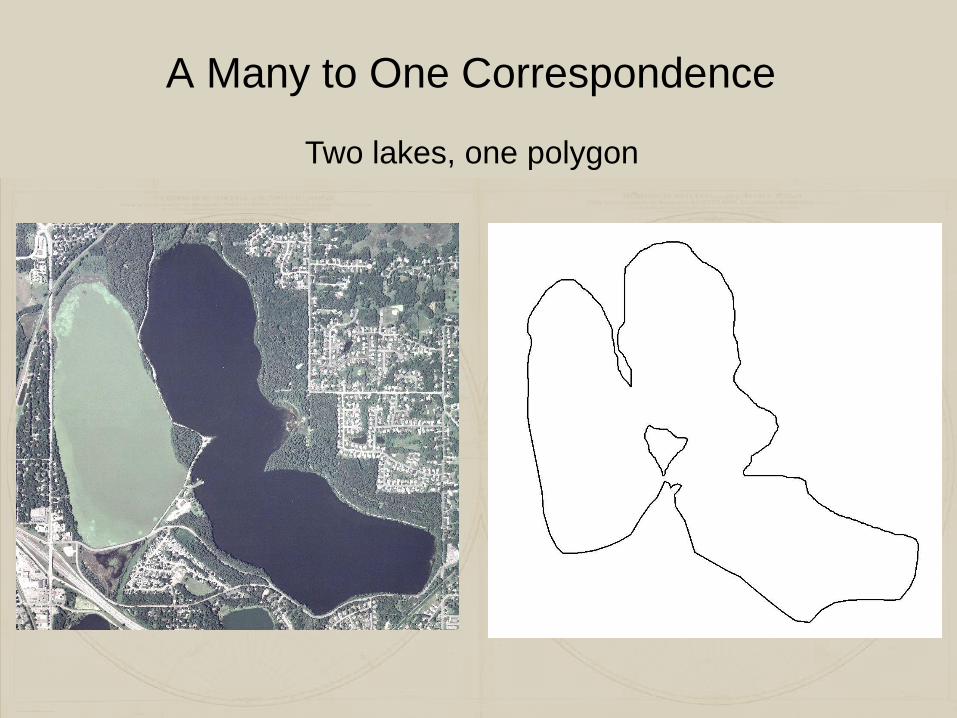
A Many to One Correspondence
Two lakes, one polygon
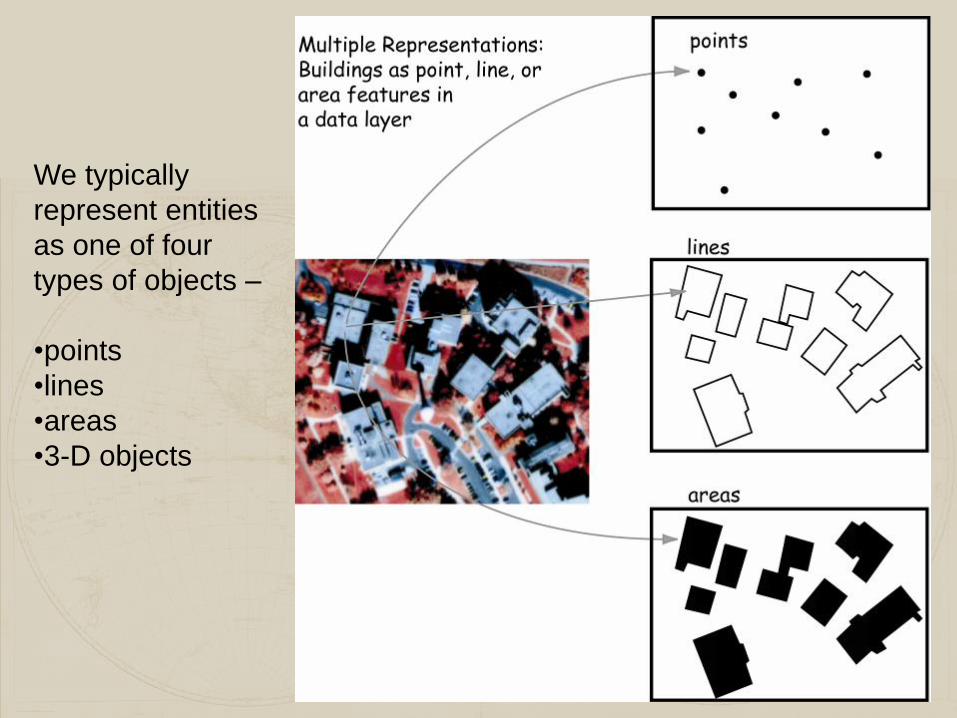
We typically
represent entities
as one of four
types of objects –
•points
•lines
•areas
•3-D objects

Representation – Enforced Uniformity

Vector AssumptionsDimensionality – 0, 1st, 2nd
points have no dimension,
lines have no width

Enforced Uniformity

Assignment
Ambiguity

Vector Topology
Topology – geometric properties that to not change
with shape: Adjacency, connectivity, containment

Why Topology Matters
We frequently deform our data (map
projections)
We can better achieve accuracy in
analysis
Some calculations are faster
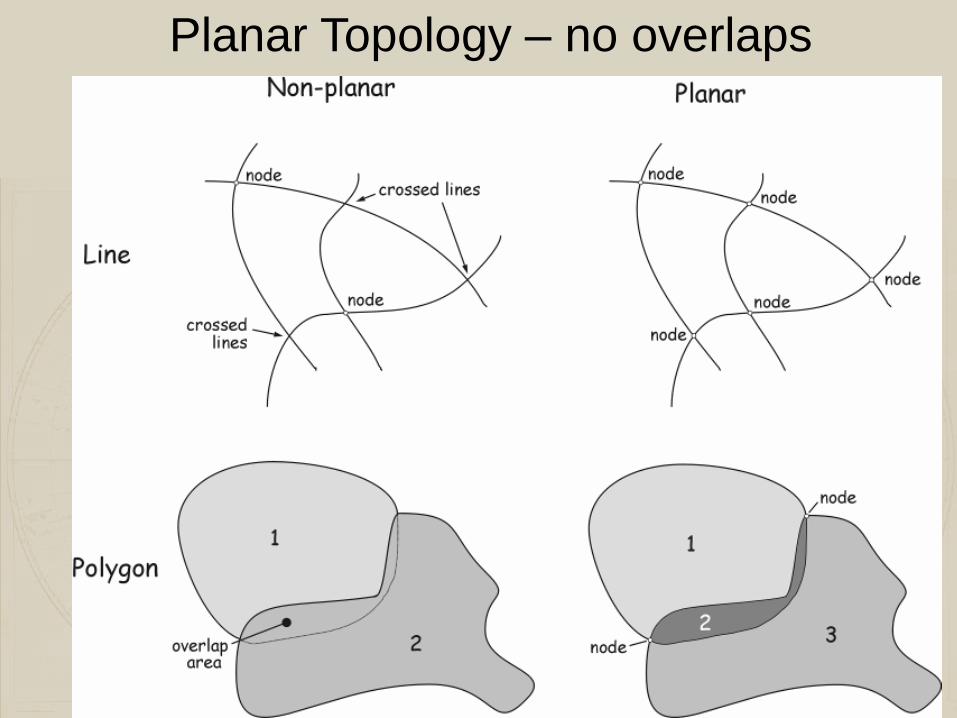
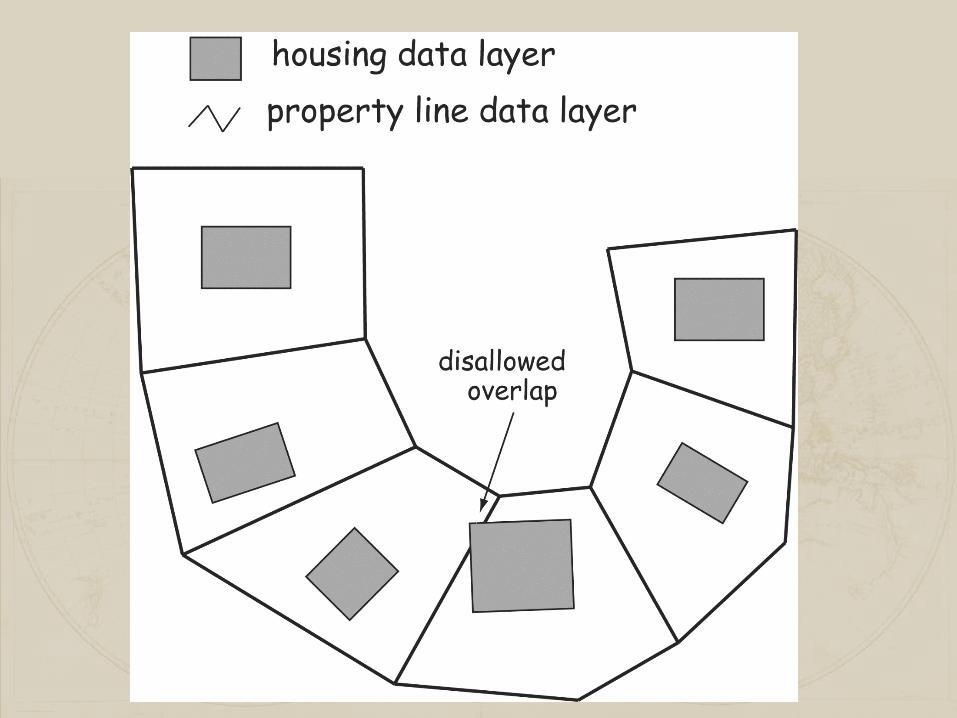
Planar Topology – no overlaps


Can you locate Iran?
How about Afghanistan?


Rasters – Fixed Cell Size, Grid Orientation

Rasters – Discrete or Continuous Features
discrete continuous


.
.
.
.
.
.
.
.
.
.
.
.
.
.
.
.
.
.
.
.
.
.
.
.
.
.
.
.
.
.
.
.
.
.
.
.
.
.
.
.
.
.
.
.
.
.
.
.
2.9
3.6
?
Rasters as
Sampling
Points –
continuous
variables
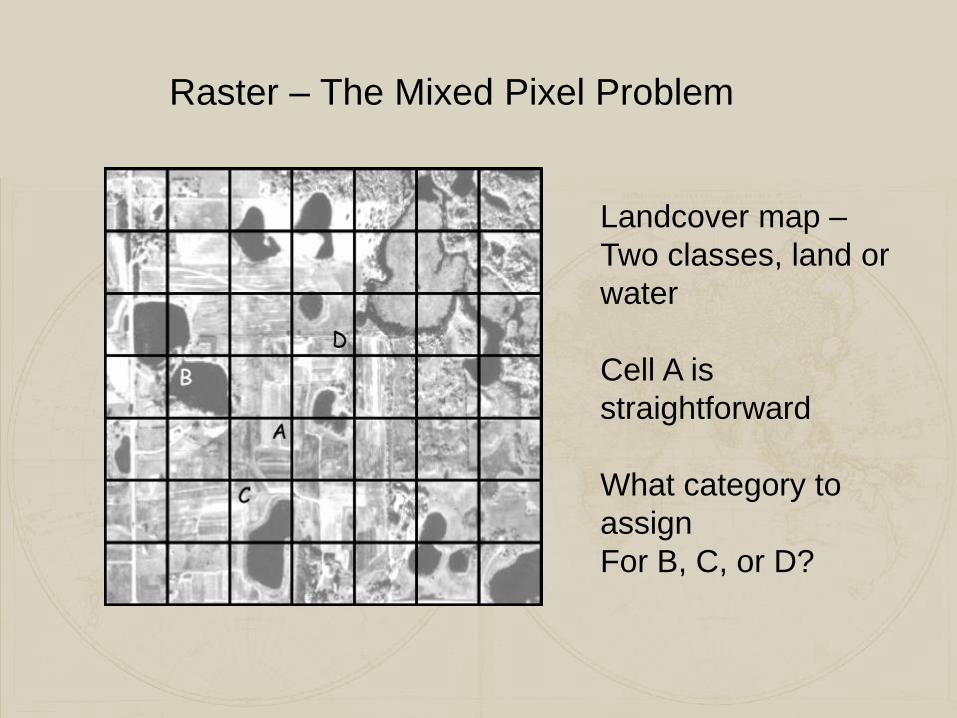
Raster – The Mixed Pixel Problem
Landcover map –
Two classes, land or
water
Cell A is
straightforward
What category to
assign
For B, C, or D?

Raster – The Storage Space/Resolution Tradeoff
Decreasing the Cell Size by one-half
causes a
Four-fold increase in the storage space required

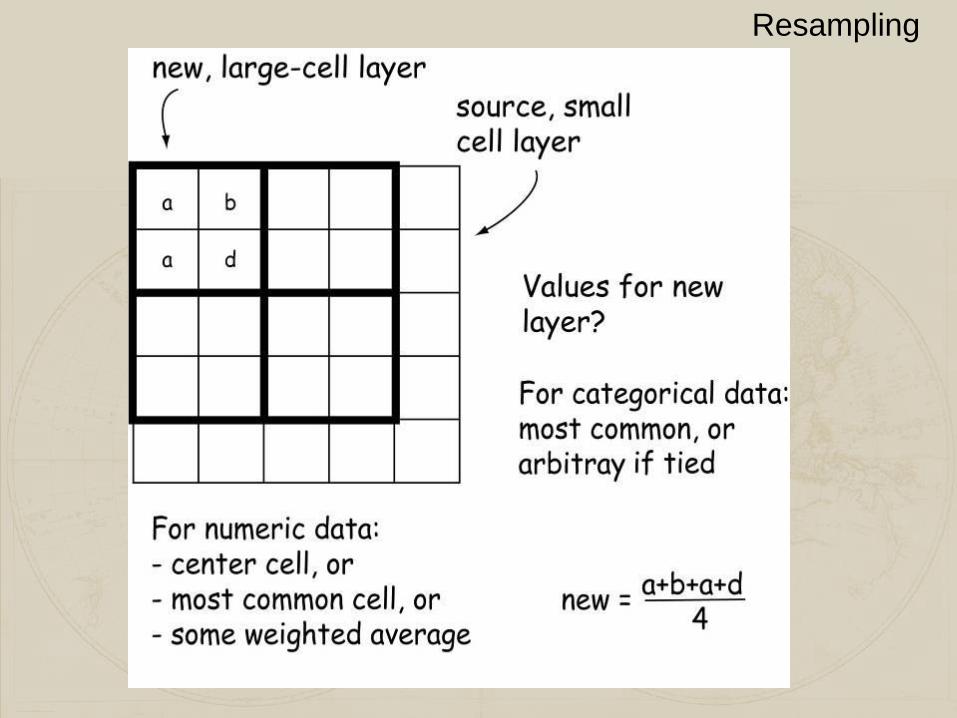
Resampling

What if the cells
aren’t
“well behaved”

Orientation and/or Cell Size May Differ

Resampling - Distance-weighted averaging
bilinear
interpolation


Comparisons, raster v.s. vector
Characteristics
Positional Precision
Attribute Precision
Analytical
Capabilities
Data Structures
Storage
Requirements
Coordinate
conversion
Network Analyses
Output Quality
Can be Precise Defined by cell size
Poor for continuous data Good for continuous data
Good for spatial query, adjacency, area,
shape analyses. Poor for continuous
data. Most analyses limited to
intersections. Slower overlays.
Spatial query more difficult, good for local
neighborhoods, continuous variable
modeling. Rapid overlays.
Often complex Often quite simple
Relatively small Often quite large
Usually well-supported Often difficult, slow
Easily handled Often difficult
Very good, map like Fair to poor - aliasing
Vector Raster
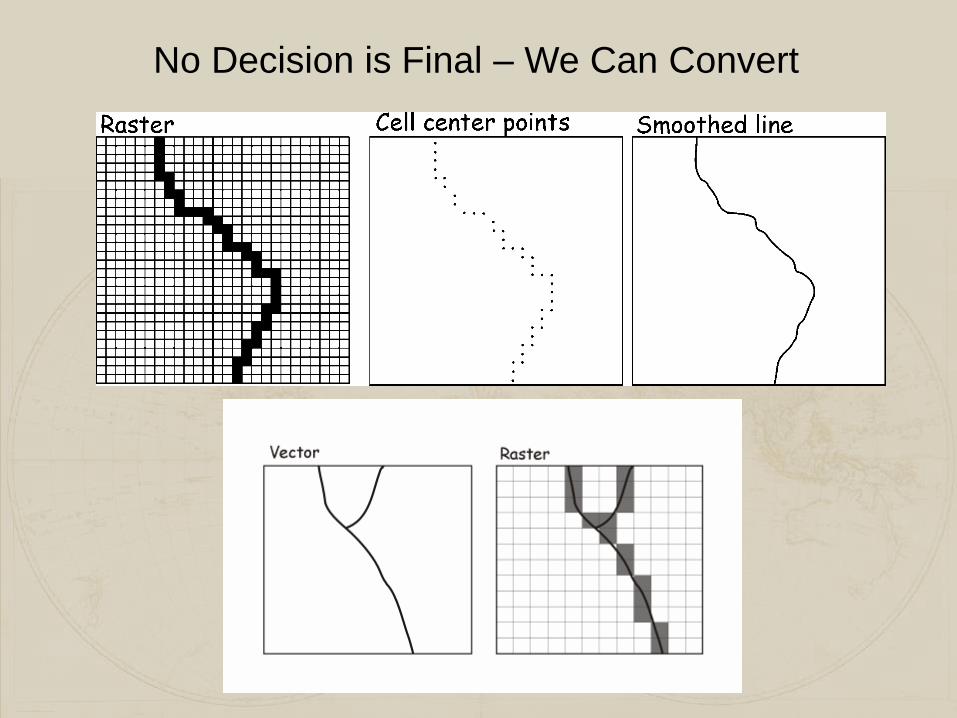
No Decision is Final – We Can Convert
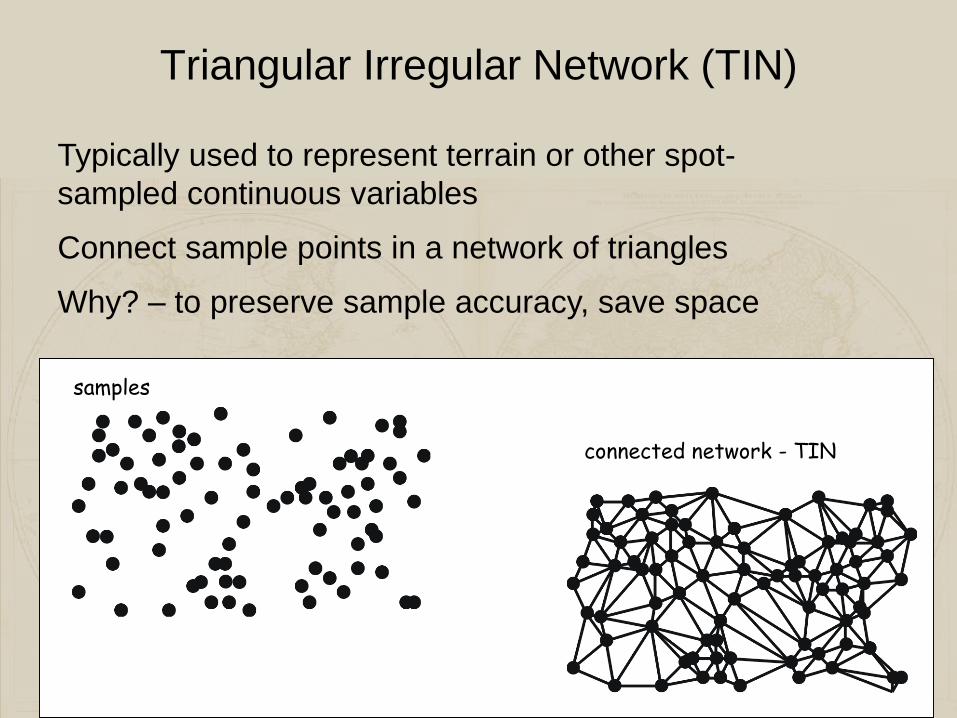
Triangular Irregular Network (TIN)
Typically used to represent terrain or other spot-
sampled continuous variables
Connect sample points in a network of triangles
Why? – to preserve sample accuracy, save space
samples
connected network - TIN

TIN Parts
Points –
sample locations
Edges –
connecting lines
Facets –
triangles, “faces”

TIN – Triangle Formation
TIN triangles defined
such that
•Three points on a
circle
•Circles are empty –
they don’t contain
another point
These are convergent
circles

Multiple
Repre-
sentations

Data and File Structures
1.2 , 4.7
5.8 , 3.6
8.9 , 7.2
.
.
Real WorldData Model Data
Structure
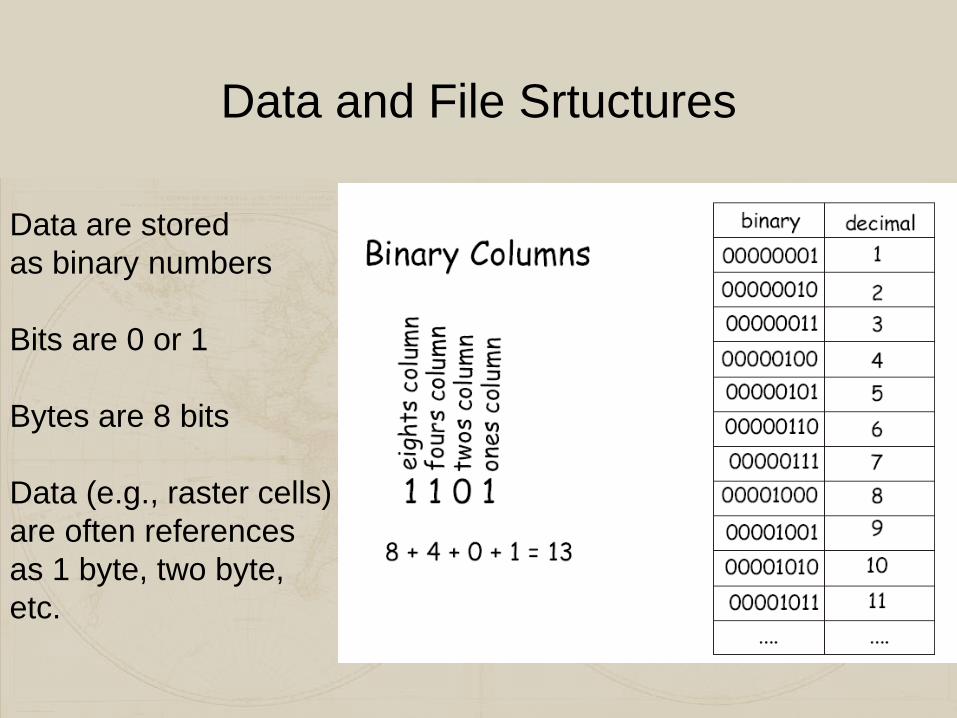
Data and File Srtuctures
Data are stored
as binary numbers
Bits are 0 or 1
Bytes are 8 bits
Data (e.g., raster cells)
are often references
as 1 byte, two byte,
etc.

00000001
00000010
00000011
00000100
00000101
00000110
00000111
00001000
00001001
00001010
00001011
00001100

00000001 1
00000010 2
00000011 3
00000100 4
00000101 5
00000110 6
00000111 7
00001000 8
00001001 9
00001010 10
00001011 11
00001100 12
Cells Have a Type, Size
Type – e.g., Real, unsigned integer, signed
integer, text
Size – 8 bit, 32 bit, 64 bit, long, short,
character width
These control the size of the datasets, and
type of data that may be stored
Mixing types, sizes, often requires some care

Raster data set
properties
We can store a number up
To 2
or
4,293,967,296 in a cell
32

Characters, assign a number to each
character value, e.g.,
ASCII
(American Standard Coding for Information
Interchange)
65 = A, 66 = B, 67 = C……
97 = a, 98 = b, 99 = c ……..
But
50 = 2
51 = 3

Positive Integers are easy
Positive Integers – “as is”, so interpret all 8 bits
for the number
e.g., 8 bit unsigned integer
0 0 0 0 1 1 0 1 is the number 13, as in our
previous example
Negative Integers – interpret 1st bit as sign bit,
e.g.,
0 is positive, 1 is negative number, and interpret
next
bits as number
8 bit signed integer
1 0 0 0 1 1 0 1 is - 13

Floating point numbers (real numbers) are a bit
more complicated
Generally a sign, exponent, and a fraction part
e.g., a 4-byte floating point number has the first
bit as a sign, the next 8 as the exponent, and
the next 23 as the fractional part,
S EEEEEEEE FFFFFFFFFFFFFFFFFFFFFFF
WHY SHOULD YOU CARE?

When you want this… You get this:

Data and
File Structures
Data often have specific
organization to
•reduce size
•speed access
•ease updates

Data and File Structures
Compression
Reducing size – e.g., raster run-length coding

GIS Hardware
Typical of most computer systems, with a little
more storage, a few added tools for
input/output.
Coordinate input devices are the primary
“specialized” hardware.
Digitizing Tablets GPS
receivers.

Summary
• GIS are systems for the creation, maintenance, analysis, and conveyance of spatial data
• We represent abstractions of our world into spatial and attribute components using data models and data structures
• Two major data models – raster and vector