fractals in art and nature: why do we like them? · updated 1 march 2012 fractals in art and...
TRANSCRIPT
Updated 1 March 2012
Fractals in Art and Nature: Why do we like them? Branka Spehar*a, Richard P. Taylorb
aSchool of Psychology, The University of New South Wales, Sydney, NSW 2052, Australia bDepartment of Physics, University of Oregon, Eugene, OR 97403-1274, U.S.A.
ABSTRACT
Fractals have experienced considerable success in quantifying the visual complexity exhibited by many natural patterns, and continue to capture the imagination of scientists and artists alike. Fractal patterns have also been noted for their aesthetic appeal, a suggestion further reinforced by the discovery that the poured patterns of the American abstract painter Jackson Pollock are also fractal, together with the findings that many forms of art resemble natural scenes in showing scale-invariant, fractal-like properties. While some have suggested that fractal-like patterns are inherently pleasing because they resemble natural patterns and scenes, the relation between the visual characteristics of fractals and their aesthetic appeal remains unclear. Motivated by our previous findings that humans display a consistent preference for a certain range of fractal dimension across fractal images of various types we turn to scale-specific processing of visual information to understand this relationship. Whereas our previous preference studies focused on fractal images consisting of black shapes on white backgrounds, here we extend our investigations to include grayscale images in which the intensity variations exhibit scale invariance. This scale-invariance is generated using a 1/f frequency distribution and can be tuned by varying the slope of the rotationally averaged Fourier amplitude spectrum. Thresholding the intensity of these images generates black and white fractals with equivalent scaling properties to the original grayscale images, allowing a direct comparison of preferences for grayscale and black and white fractals. We found no significant differences in preferences between the two groups of fractals. For both set of images, the visual preference peaked for images with the amplitude spectrum slopes from 1.25 to 1.5, thus confirming and extending the previously observed relationship between fractal characteristics of images and visual preference.
Keywords: Fractals, visual preference, aesthetics, 1/f amplitude spectrum,
1. INTRODUCTION Although often associated with art, aesthetic appreciation is by no means exclusively confined to that domain. Extending to a wide range of natural and everyday objects, it can be considered as one of the central and most pervasive qualities of our experience of the world. However, despite a longstanding and continuing interest, there is very little agreement regarding the question of what it is that makes a work of art, or a natural scene, appear visually pleasing? While the experimental aesthetic literature is rich with findings suggesting that certain aspects of spatial structure such as symmetry, balance and complexity influence visual preference, there is considerable disagreement regarding the nature of the relationship between various measures of spatial structure and preference1-4. The widely different kinds of stimuli as well as the considerable diversity in experimental manipulations make it challenging to derive a meaningful relationship between various aspects of spatial structure and preference.
An interest in the role of spatial structure in aesthetic appeal has been re-invigorated in an unexpected way by a discovery that abstract paintings by Jackson Pollock, a famous 20th Century painter, are fractal in their structure5. The finding that artworks, which might appear superficially unstructured, contain a measurable degree of regularity was surprising. Building on this initial analysis, a number of groups have extended the range of fractal analysis techniques to quantify the visual complexity of a wide range of art images6-18.
These fractal analysis techniques can be divided into two groups based on the visual properties of the artwork being assessed. In Taylor et al.5 original study, the different colored layers within a painting were electronically filtered and analyzed separately. For each layer, the fractal shape of the boundary edge between the paint-filled regions and empty regions was quantified using a scaling parameter called the fractal dimension D (discussed in more detail below). Subsequent investigations examined grayscale images of Pollock’s paintings and quantified the variation in intensity across the canvas using a Fourier spectrum analysis. This analysis revealed a 1/fα frequency dependence on amplitude, where the exponent α quantifies the associated scale-invariance of the grayscale structure6,8,10,17,18. An analogous scale-

Updated 1 March 2012
invariance was found in the grayscale surfaces for a wide range of art images9,10,18, in parallel to what is a known characteristic of natural scenes19-21. Natural images tend to have characteristic frequency spectra in which amplitude falls proportionally with increasing frequency and thus on average varies roughly as f‐1 [or with a slope of -1 for log amplitude versus log frequency plot22.
The reasons why art exhibits natural image statistics, and the question of how these statistics are recreated and observed by artists and perceivers alike, have received much attention. Redies and his colleagues17,18 propose that artists seem to have implicit knowledge of natural statistics, a view consistent with the view that the human visual system evolved to recognise and recreate natural image statistics9,10,23-26. On the other hand, Graham & Field10 have suggested that statistical regularities found in art are a product of the way in which paint is applied to the medium. According to this, so called “perceptibility” hypothesis, statistical regularities found in art are a corollary of artistic production, a result of the way in which the artist applies paint to the canvas, which is in turn motivated to create a readily visible image for the human eye. In other words, the statistical regularities in art are attributed to the constraints of the visual and motor systems involved in creating and inspecting works of art.
However, the fractal images have also been widely acknowledged for their instant and considerable aesthetic appeal. A number of investigations have focused on the question of how visual preference is related to spatial characteristics in fractal images. Although early findings indicated that computer generated fractal iterations with an average fractal dimension of 1.26 were preferred over others27, a later study by Spehar, Clifford, Newell, and Taylor28, showed that observers display a consistent aesthetic preference across fractal images, regardless of whether fractal images are generated by nature’s processes, by mathematics, or by the human hand. Preferences for fractals peaked at fractal dimensions between 1.3 and 1.5, whereas lower visual preferences were found for fractals outside of this range.
In general, the high visual preference for fractal patterns has been attributed to the “inherent pleasantness” of fractal-like statistics18,29. Aks and Sprott27 have speculated that higher visual preference for fractal dimensions in the range between 1.3 and 1.5 corresponds to fractals frequently found in natural environments (clouds, landscapes) and that visual preference might be set in this range through continuous visual exposure to fractal patterns characterized by this value. On the other hand, as mentioned above, Graham and Field10 consider fractal-like scaling a corollary of artistic production, rather than a basis of aesthetic judgment. Moreover, they remain skeptical about the notion of the universal appeal of fractal patterns with specific characteristics and correctly point out that relatively consistent preference for images with certain fractal dimension have been observed only within a limited set of fractal patterns.
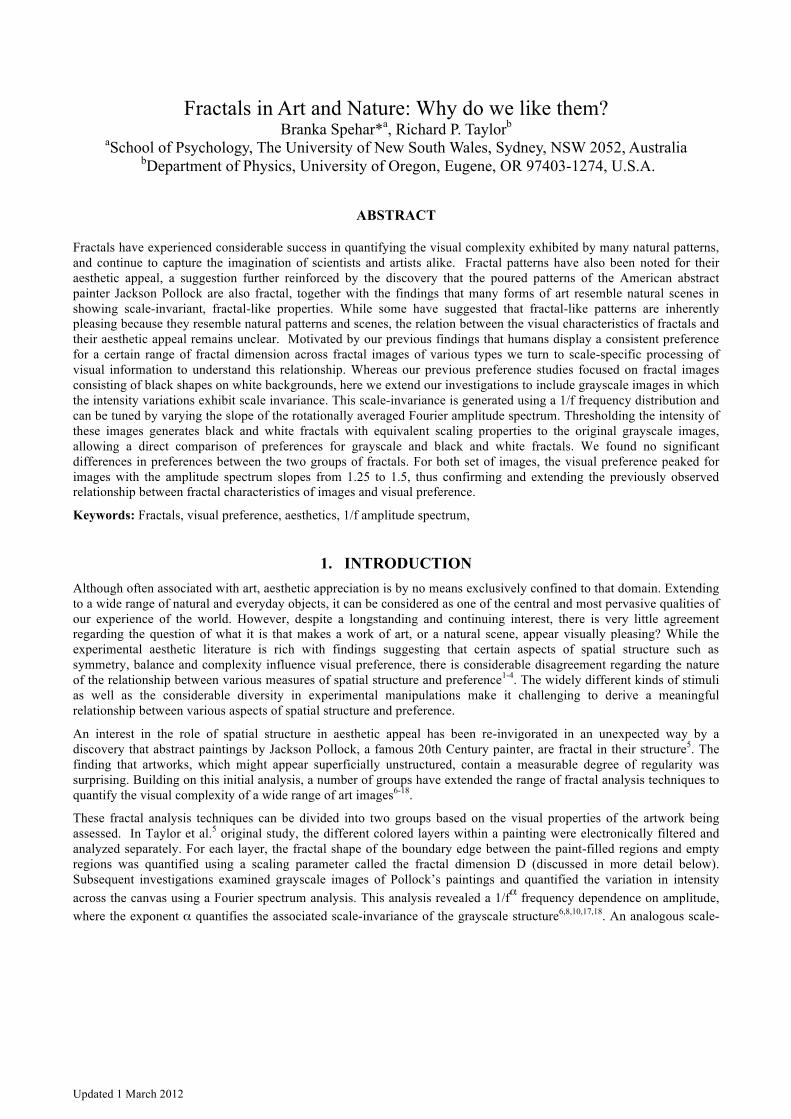
Figure 1. An illustration of the difference between 2-D grayscale and 1-D black and white images. The panel in the middle is a three-dimensional depiction of the grayscale image on the left where the grayscale intensity corresponds to a height of a point in the three-dimensional terrain representation. A corresponding 1-D pattern shown on the right has been thresholded relative to the middle grayscale level of the grayscale image (i.e. created by cutting a slice through the mean height of the three-dimensional terrain in the middle).
Indeed, one important qualification in an attempt to resolve these diverse views is the different use of the term fractal and the associated difference in the visual characteristics assessed. In Figure 1 we use computer-generated images to illustrate these interpretational differences. The left image shows a grayscale image generated using a 1/fα distribution. The middle image highlights the fractal structure by converting the intensity into a height on the vertical axis using a scale of 0 (black) to 255 (white). The right hand image is then generated by thresholding the middle image at a selected
Updated 1 March 2012
height such that pixels below that height are assigned as white and those above are black. Because the fractal variations in the left and middle images form surfaces, it is conventional to label these as ‘two dimensional’ (2D) fractals10. In contrast, because the fractal edges between the black and white regions form lines, the fractals in the right image are labeled as ‘one-dimensional’ (1D) fractals. It is important to note that the black and white fractals (right) have equivalent scaling properties to the original grayscale images (left), and previous research has established the mathematical relationship between the exponent α (quantifying the scale-invariance of the grayscale fractal surface) and the D value (quantifying the scale-invariance of the fractal boundaries lines). Nevertheless, despite their analogous scaling properties, the left and right images are visually distinct. With this in mind, we note that Taylor et al.5 original fractal analysis investigated the 1D fractal lines at the paint boundaries whereas the subsequent analysis, for example by Graham and Field10, and Redies et al.18, focused on the 2D fractals in the grayscale surface. Interestingly, while the presence of 1/f image statistics in the grayscale images of artworks has been widespread and well documented, a direct connection between visual preference and 1/f statistics has been rarely addressed30,31. Juricevic et al.31 have found that images with spatial and chromatic properties departing from the 1/f statistics found in natural scenes were rated as more uncomfortable and as having lower artistic merit. The specific aim of this study was to address to what extent peak visual preference for a particular range of 1-D fractal dimensions extends to images that vary continuously in intensity across two spatial dimensions. For the purposes of directly comparing preferences among 1-D and 2-D images, two comparable types of images were constructed: a set of 2-D grayscale images with varying amplitude spectrum slopes (equivalent to the left image of Figure 1) and a comparable set of thresholded black and white images (right image). The direct comparison between these two set of images will help us to determine whether the visual preference observed with the grayscale fractal images is based mostly on spatial (geometric) or intensity (photometric) based characteristics of these images.
2. METHOD 2.1 Participants
A total of 54 observers with normal or corrected-to-normal vision were tested in two experimental conditions. All were undergraduate students at the University of New South Wales and received course credit for their participation. Informed consent, testing and debriefing procedures were approved by the University of New South Wales Human Research Ethics Advisory Panel. The preferences among grayscale and black and white thresholded images were measured separately and with different observers. A total of 26 observers viewed the grayscale fractal noise patterns while 26 observers viewed black and white theresholded patterns.
2.2 Stimuli
The examples of 2-D grayscale and thresholded 1-D images used in this experiment are shown in Figures 2 and 3. For the grayscale images depicted in Figure 2 as a first step a random noise pattern was created by selecting each pixel value from a Gaussian distribution. A Fourier transform was performed to obtain the amplitude frequency spectrum which was then adjusted to create a range of spectral slopes ranging from -0.5 to -2.5 (in increments of 0.25). For each of the nine different amplitude spectrum slope values, a set of three different seed images was created, resulting in a total of 27 grayscale noise images.
The second set of images was created by thresholding the corresponding grayscale noise images at the mean luminance to create the two-tone black and white patterns. These images are similar in their geometrical characteristics and to the original grayscale images but obviously have different amplitude spectrum slopes. The thresholding process flattens the amplitude spectrum by reducing the amplitude slope compared to the original image.

Updated 1 March 2012
Figure 2. A set of experimental grayscale noise images with varying amplitude spectrum slopes. Increasing from left to right, the corresponding slopes in each row are: -0.5, -0.75 and -1 (top); -1.25, -1.5 and -.75 (middle); and 2.0, 2.25 and 2.50 (bottom).
Figure 3. A set of 1-D black and white images that were created by thresholding the corresponding grayscale images depicted in Figure 2.

Updated 1 March 2012
2.3 Procedure
The visual preference in each case was determined by a forced choice paired comparison paradigm. In this paradigm, each of the three fractal-noise patterns with a given spectrum slope value is paired with all other fractal noise images of different amplitude spectrum slopes. All pairs were presented four times with the fully randomized presentation order. Each trial consisted of two images presented side-by-side. The task of the observers was to indicate (via a key press) which of the two stimuli they visually preferred. The duration of the response interval was unlimited and self-paced by the observers.
Stimuli were presented on a 22-in. Sony Trinitron Multiscan G520 CRT monitor. Participants were seated at a viewing distance of 0.54m, such that stimuli subtended a visual angle of 9x9 degrees. The images were presented on a uniform gray background of the same mean luminance.
2.4 Image analysis
Figure 4 shows a schematic comparison of the two scaling techniques used to measure the fractal characteristics of images. The top graph represents a scaling plot generated by the traditional Fourier analysis method, in which the amplitude A is analyzed as a function of the spatial frequency f = 1/L, where L is the length scale. The scale-invariance of the fractal pattern appears through the power law relationship A ~ (1/L)
-α and is quantified by plotting log A as a
function of log (1/L). Depicted in the bottom graph, the box-counting technique performs an equivalent examination by covering an image with a mesh of identical squares (‘boxes’) of side length L. The technique counts the number of squares, N, that contain part of the image. This count is repeated for increasingly small squares within the mesh. In this approach, reducing box size is equivalent to examining the image at finer spatial frequencies and N assesses the amount of space covered by the pattern at these spatial scales. The scale-invariance of the fractal pattern appears through the power law relationship N ~ (1/L)D (where the exponent D is the fractal dimension) and is quantified by plotting log N as a function of log (1/L)33. Although a detailed comparison of the two techniques can be found elsewhere8, Figure 4 demonstrates the central relationship that a higher D value corresponds to a lower α value: for example, a pattern featuring a large amount of fine structure will have a large Fourier amplitude (corresponding to a low α) and a large box-count (corresponding to a high D) at fine scales.
Figure 4. A schematic comparison of the scaling plots obtained from the box-counting analysis and the Fourier spectral analysis.

Updated 1 March 2012
Figure 5 uses three seed images to illustrate how the Fourier and box-counting techniques were employed in our study. For the grayscale images (left images), α = −2 represents the input value used to generate the slope of the amplitude spectra. We used the box-counting method to establish a quantitative correspondence between α and the corresponding fractal dimension D of each image. First the grayscale images were thresholded at the mean luminance (middle images) and then the box counting was performed on the edges extracted by the Laplacian of Gaussian edge extraction method (right images).
Figure 5. An example of three different seed images for a noise pattern with an amplitude spectrum slope α value of -2 (left column). These images were first thresholded at the mean luminance (middle column) before an edge extraction Laplacian of Gaussian algorithm was applied (right column). The edge patterns were submitted to a box-counting analysis to empirically estimate the corresponding fractal dimension (D) of these images. The fractal dimension values obtained by box counting were 1.082 (top), 1.066 (middle) and 1.083 (bottom).
The measured fractal dimension D values for the three different seed images at each of the different α values were averaged to find an estimated corresponding D value. These empirically derived conversion values from the amplitude spectrum slope α value to the corresponding estimate of D are shown in Table 1.
Table 1. Empirically measured conversion values for a fractal dimension (D) from the amplitude spectrum slope α (see text for more information).
Slope (α)
Input value
Measured fractal dimension (D)
Mean (SD)
-0.5 1.94 (0.018)
-0.75 1.90 (0.019)
-1.0 1.80 (0.017)
-1.25 1.64 (0.020)
-1.5 1.41 (0.025)
-1.75 1.27 (0.028)
-2.0 1.08 (0.009)
-2.25 1.02 (0.026)
-2.5 0.99 (0.033)

Updated 1 March 2012
3. RESULTS The average visual preferences for the two types of images as a function of their amplitude spectrum slope are plotted in Figure 6. Both grayscale and thresholded images yielded a very similar pattern of results with the visual preference peaking for patterns with the un-thresholded amplitude spectrum slopes of -1. 5 and -1.25 and dropping off for patterns with either steeper or shallower slope values. This was confirmed by a two-way ANOVA (amplitude spectrum slope x image type) that revealed a significant main effect of slope (F8= 13.18, p<0.0001), and no significant effect of image type (F1= 0.51, p<0.923) or significant interaction between these two factors (F8=1.49, p<0.159).
Figure 6. The average visual preference as a function of the amplitude spectrum slope α for black and white thresholded (1-D fractals; open circles) and grayscale (2-D fractals; filled squares) images. The error bars represent +/-1 SEM.
The main effect of a pattern’s amplitude spectrum slope was also significant in two additional one-way ANOVAs performed for the grayscale and black and white thresholded patterns separately (F8= 9.641, p<0.0001 and F8= 5.005, p<0.0001, respectively). Post-hoc Bonferonni multiple-comparison t-tests (with alpha adjusted at p<0.05) were performed between visual preference scores for all pairs of different slope values for both types of images. These post-tests revealed that for thresholded black and white images, the visual preference for images with slopes of -1. 5 and -1.25 was significantly higher than for slopes of -0.5, -0.75, -2.25 and -2.5. With the grayscale images, the images with a slope of -1.5 and -1.25 were significantly more preferred than the images with slopes of 0.5, 0.75, 2.25 and 2.5. In addition, the grayscale images with a slope of -1.75 were significantly more preferred than the images with slopes of -0.5, -0.75 and -2.5.
4. DISCUSSION The aim of this study was to investigate the relationship between visual preference and the slope of amplitude spectrum in random grayscale images. We previously observed a systematic relationship between visual preference and a specific, intermediate, range of fractal dimension in a wide range of binary (i.e black and white), 1-D fractal images28,33. However, it is not clear whether this systematic relationship would hold if other fractal images, specifically if 2-D grayscale images, were considered. Although such fractal-like, scale invariance is both ubiquitous in natural images and evident in a wide range of artistic images, its relationship with aesthetic appreciation and visual preference was previously uncertain.
We measured and directly compared visual preferences among grayscale (2-D) and black and white (1-D) fractal images that varied in their spatial characteristics. The grayscale images varied in their amplitude spectrum slopes ranging from

Updated 1 March 2012
0.5 to 2.5 and a simple thresholding relative to the mean luminance was used to create the corresponding 1-D comparison images. The results revealed a close correspondence in visual preference between the two sets of images with visual preference peaking for images with amplitude spectrum slopes α of -1.5 and -1.25.
To facilitate a direct comparison with our previous findings with 1D, black and white fractals, Figure 7 re-plots the results obtained in this study as a function of the empirically measured fractal dimension (D) for the corresponding images (as described previously in section 2.4). When plotted against D, the visual preference values peak for the images with fractal dimension in the range from 1.3 to 1.6, which is in an excellent agreement with our previously measured preference for binary fractal images28,33. Again, as already shown in Figure 6, the visual preference for the 2D grayscale images peaks in the same range.
Figure 7. The average visual preference re-plotted as a function of measured fractal dimension (D) values for the corresponding 1-D (open circles) and 2-D (filled squares) fractal images. The error bars represent +/-1 SEM. Right panel:
Our results not only demonstrate the systematic dependence of visual preference on spatial characteristics of 2-D fractal images, but also the very close agreement in the pattern of visual preference for both black and white and grayscale images. We emphasize that the equivalent pattern of visual preference for these images is evident despite the differences in amplitude spectrum slopes α, of these images. The process of thresholding the grayscale images with a given value of amplitude spectrum slope α makes the amplitude spectrum slope of such images shallower than in the corresponding grayscale image. If visual preference in these patterns is guided by the slope α of their amplitude spectrum, the preference for black and white images should show a different pattern than with grayscale images. Instead, we believe that our results suggest that visual preference in both cases is most likely dependent on the geometric properties of these images, as determined by their fractal dimension characteristics.
To support these assertions, in Figure 8 we present data that directly compares visual preference for black and white fractal images and the corresponding images containing the extracted edge contours. As evident from the top and bottom panels in Figure 8, despite the very different visual appearance of the two sets of images, the original and edge images produced very similar preference results. In both cases, the visual preference was the highest for patterns with fractal dimension D in the intermediate range. Taken together, these results suggest that visual preference for the range of fractal images analyzed here is driven by the geometrical structural characteristics of fractal contours present in these images regardless of the type of intensity variations in which they are embedded.

Updated 1 March 2012
Figure 8. A direct comparison of visual preference between black and white (top panel) and contour only (bottom panel) fractal images.
In order to provide a more formal support for the assertion that the preference in both sets of images is primarily contour-driven, we extracted a series of constituent contour edges from each of our grayscale images and measured their fractal characteristics. As a first step in this analysis, each of the grayscale images was thresholded at a number of different intensity values. The threshold intensity values corresponded to the mean luminance (50%) and to a number of levels above and below that intensity value, ranging from 30% to 70%. Figures 9 and 10 illustrate this analysis for grayscale images with amplitude spectrums slopes of -2 and -1.5 respectively. In both figures, the top left panel represents the original grayscale image and the top right panel depicts a series of contours, each of constant grayness, corresponding to different threshold values. The three bottom panels show examples of thresholded images at levels of 30%, 50% and 70%.
Within a given grayscale pattern, the fractal characteristics of all the contours are expected to be identical10. This was verified empirically by performing the box counting analysis on each set of contours. As detailed in Figures 9 and 10, the measured fractal dimensions for a set of nested constituent contours corresponding to a given grayscale fractal noise image were the same within measurement uncertainty.

Updated 1 March 2012
Figure 9. The grayscale image in the top left panel has an amplitude spectrum slope of -2. The three thresholded black and white images depicted in the bottom panels have fractal dimensions (determined by box-counting) of 1.09 (red), 1.075 (green) and 1.084 (purple). The top right panel depicts all thresholded contours for this image. The average measured fractal dimension for all thresholded conotours for this image is 1.082.
Figure 10. The grayscale image in the top left panel has an amplitude spectrum slope of -1.5. The three thresholded black and white images depicted in the bottom panels have fractal dimensions (determined by box-counting) of 1.42 (red), 1.44 (green) and 1.39 (purple). The average for all thresholded contours (shown in the top right panel) for this image is 1.425.

Updated 1 March 2012
Each of the grayscale images can therefore be pictured as a series of nested contour patterns at different threshold intensities. We believe that the fractal characteristics of either explicit contours (as they exist in black and white thresholded images), or their somewhat more “implicit” counterparts (as in the grayscale images) are the primary determinant of visual preference in both types of images. In other words, the aesthetic appeal of grayscale and thresholded images is accounted for by their fractal contour characteristics, despite differences in their visual appearance and photometric characteristics. Consistent with this general idea, Rogowitz & Voss34 also suggested that boundary contours in fractal images were the driving force behind the perception of namable and recognizable objects in computer generated fractal patterns. Although they were not investigating visual preference, they found that fractal patterns with low fractal dimension were superior in evoking the perception of namable and recognizable objects and this result was evident whether the patters were filled-in shapes or simple edge contours.
REFERENCES
[1] Arnheim, R. [Art and Visual Perception: The new version], Berkeley: University of California Press, (1974). [2] Fechner, G. T. [Vorschule der Asthtik (Elements of Aesthetics)], Leipzig, Germany: Breitkopf & Hartel, (1876). [3] Berlyne, D. E. [Aesthetics and Psychobiology], New York: Appleton-Century-Crofts, (1971). [4] Martindale, C., Moore, K., and Borkum, J. “Aesthetic preference—Anomalous findings for Berlyne's psychobiological theory” American Journal of Psychology, 103, 53–80 (1990). [5] Taylor, R. P., Micolich, A. P., and Jonas, D. “Fractal Analysis of Pollock's Drip Paintings” Nature, 399, 422-422 (1999). [6] Alvarez-Ramirez, J., Ibarra-Valdez, C., Rodriguez, E., and Dagdug, L. “1/f-noise structure in Pollock’s drip paintings” Physica A 387, 281–295 (2008). [7] Coddington, J., Elton, J., Rockmore, D., and Wang, Y. “Multi-fractal analysis and authentication of Jackson Pollock paintings” Proc. SPIE 6810, 1–12 (2008). [8] Fairbanks, M.S. & Taylor, R.P. “Measuring the scaling properties of temporal and spatial patterns: From the human eye to the foraging albatross” In S.J. Guastello & R.A.M. Gregson, [Nonlinear dynamical systems analysis for the behavioral sciences: real data]. New York: Taylor & Francis, (2010). [9] Graham, D. J., and Field, D. J. “Statistical Regularities of Art Images and Natural Scenes: Spectra, Sparseness and Nonlinearities“ Spatial Vision, 21, 149-164 (2007). [10] Graham, D. J., and Field, D. “Variations in intensity for representa-tive and abstract art, and for art from Eastern and Western Hemispheres” Perception 37, 1341–1352 (2008). [11] Irfan, M., and Stork, D. “Multiple visual features for the computer authentication of Jackson Pollock’s drip paintings: beyond box counting and fractals” SPIE Electron. Imaging 7251, 72510Q1–72510Q11 (2009). [12] Lee, S., Olsen, S., and Gooch, B. “Non-photorealistic animation and rendering,” in Proceedings of the 4th International Symposium on Non-Photorealistic Animation and Rendering (New York, NY: Association for Computing Machinery), 97–104. (2006). [13] Lee, S., Olsen, S., and Gooch, B. “Simulating and analyzing Jackson Pollock’s paintings” J. Math. Arts 1, 73–83 (2007). [14] Mureika, J. R. “Fractal Dimensions in fractal color space: a comparison study using Jackson Pollock’s art” Chaos 15, 043702-1-6 (2005). [15] Mureika, J. R., Cupchik, G. C., and Dyer, C. C., “Multifractal Fingerprints in the Visual Arts” Leonardo, 37(1), 53-56 (2004). [16]Mureika, J. R., Dyer, C. C., and Cupchik, G. C. “Multifractal structure in nonrepresentational art” Phys. Rev. E Stat. Nonlin. Soft Matter Phys. 72, 0461010-1-15 (2005). [17] Redies, C., "A universal model of esthetic perception based on the sensory coding of natural stimuli" Spat Vis 21, 97-117 (2007). [18] Redies, C., Häsenstein, J., and Denzler, J., "Fractal-like image statistics in visual art: similarity to natural scenes" Spat Vis 21, 137 - 148 (2007). [19] Burton, G.J., and Moorhead, I.R. “Color and spatial structure in natural scenes” Applied Optics, 26, (1), 157-170 (1987). [20] Field, D. J. “Relations between the statistics of natural images and the response profiles of cortical cells” Journal of the Optical Society of America A, 4, 2379–2394 (1987).

Updated 1 March 2012
[21] Tolhurst, D. J., Tadmor, Y., and Chao, T. “Amplitude spectra of natural images” Ophthalmic and Physiological Optics” 12, 229–232 (1992). [22] Field, D. J., and Brady, N. “Visual sensitivity, blur and the sources of vari-ability in the amplitude spectra of natural scenes” Vision Res. 37, 3367–3383 (1997). [23] Attneave, F., "Some informational aspects of visual perception" Psychological Review, 61(3), 183-193 (1954). [24] Barlow, H. B., "Single units and sensation: a neuron doctrine for perceptual psychology" Perception, 1(4), 371-394 (1972). [25] Hyvärinen, A., and Hoyer, P. O. "A two-layer sparse coding model learns simple and complex cell receptive fields and topography from natural images" Vision Research, 41(18), 2413-2423 (2001). [26] Tadmor, Y., and Tolhurst, D. J. “Discrimination of Changes in the Second-order Statistics of Natural and Synthetic Images” Vision Research, 34(4), 541-554 (1994). [27] Aks, D., and Sprott, J. C. “Quantifying aesthetic preference for chaotic patterns” Empirical Studies of the Arts, 14(1), 1-16 (1996). [28] Spehar, B., Clifford, C., Newell, B., and Taylor, R. P. “ Universal aesthetic of fractals” Chaos Graph. 37, 813–820 (2003). [29] Orians, G. “An ecological and evolutionary approach to landscape aesthetics” In E. C. Penning-Rowsell & D. Lowenthal (Eds.) [Landscape meanings and values] London: Allen and Unwin, 3–25 (1986). [30] Graham, D. J., Redies, C., "Statistical regularities in art: Relations with visual coding and perception" Vision Res 50(16), 1503 – 1509 (2010). [31] Juricevic I, Land L, Wilkins A, Webster MA. “Visual discomfort and natural image statistics” Perception, 39, 884-99 (2010). [32] Taylor, R. P., and Sprott, J. C. “Biophilic fractals and the visual journey of organic screen-savers” Nonlinear Dynamics Psychol. Life Sci. 12, 117–129 (2008). [33] Taylor R.P., Spehar B., Van Donkelaar P., and Hagerhall C.M., “Perceptual and physiological responses to Jackson Pollock’s fractals” Frontiers in Human Neuroscience 5: Article 60. doi: 10.3389/fnhum.2011.00060 (2011) [34] Rogowitz, B.E., and Voss, R. “ Shape perception and low-dimension fractal boundary contours” Proceedings of SPIE, 1249, 387-394 (1990).