fraction sundae & graphs final project - dysart high … sundae & graphs final project . 2...
TRANSCRIPT

1
Fraction Sundae & Graphs
Final Project

2
Table of Contents
Teacher Directions………………………….3
Student Directions………………………..…4
Student Materials…………………………...7

3
Teacher Directions
Materials for students
Copies of ice cream scoops template
Copies of bowl and Ice Cream Flavors key
Copies of graphs
Copies of rubric (one for each student)
Directions
See the student directions below.
Technology Extension
Have students create their sundaes in MS
Word/OfficeWriter.
Have students choose their own pictures from the internet
and/or clipart and use them on the pictograph.
Have students create graphs through GoogleDocs.

4
Student Directions What You Need to Do Example
Choose what type of ice cream your
sundae will have.
Color the scoops according to the “Ice
cream Flavors” Key.
Cut out the scoops. Glue the ice cream
bowl and the scoops onto large
construction paper.
On the “Fractions of Flavors” chart, write
the name of each flavor in your sundae
and its fraction. Glue to construction
paper.

5
What You Need to Do Example Create a bar graph displaying your flavor
data.
Create a pictograph displaying your flavor
data.
Create a line graph displaying your flavor
data.
Create a circle graph displaying flavor
data.

6
What You Need to Do Example Glue all graphs onto construction paper.

7
Student Materials
Ice Cream Scoops ...............................…..8
Bowl and Ice Cream Flavors Key..….…….9
Fractions of Flavor Chart……………...….10
Graphs………………………………...……11
Rubric……………………………………….13
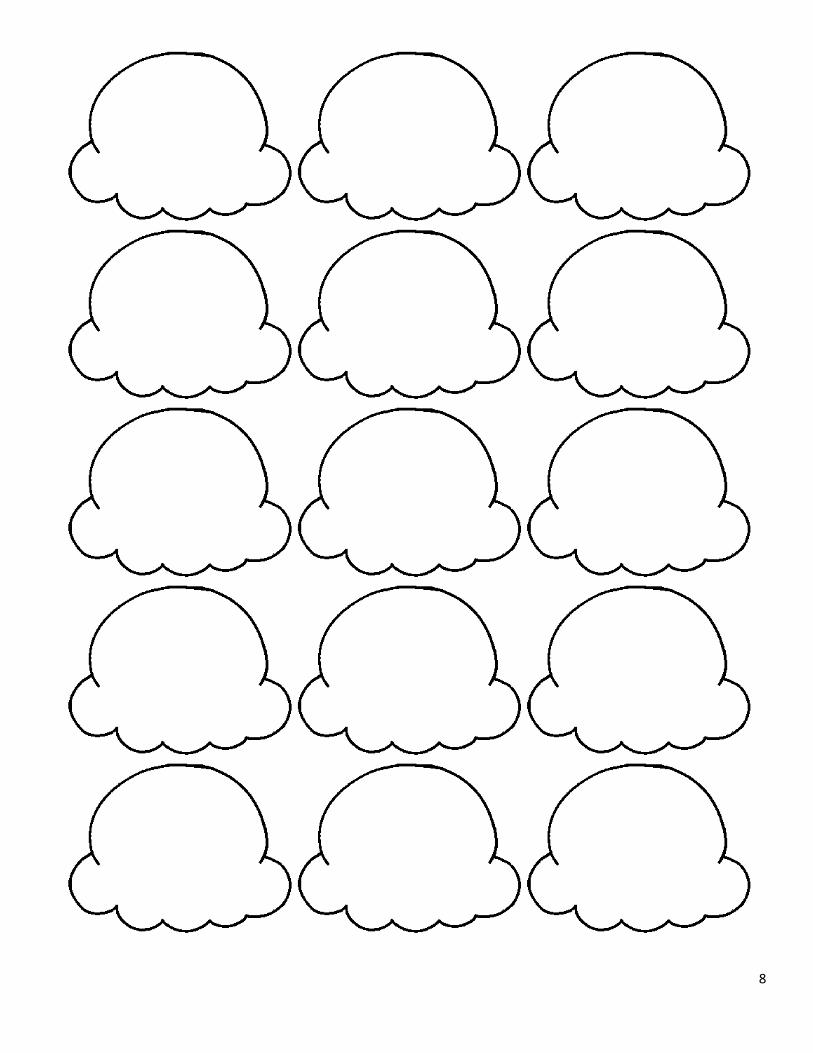
8
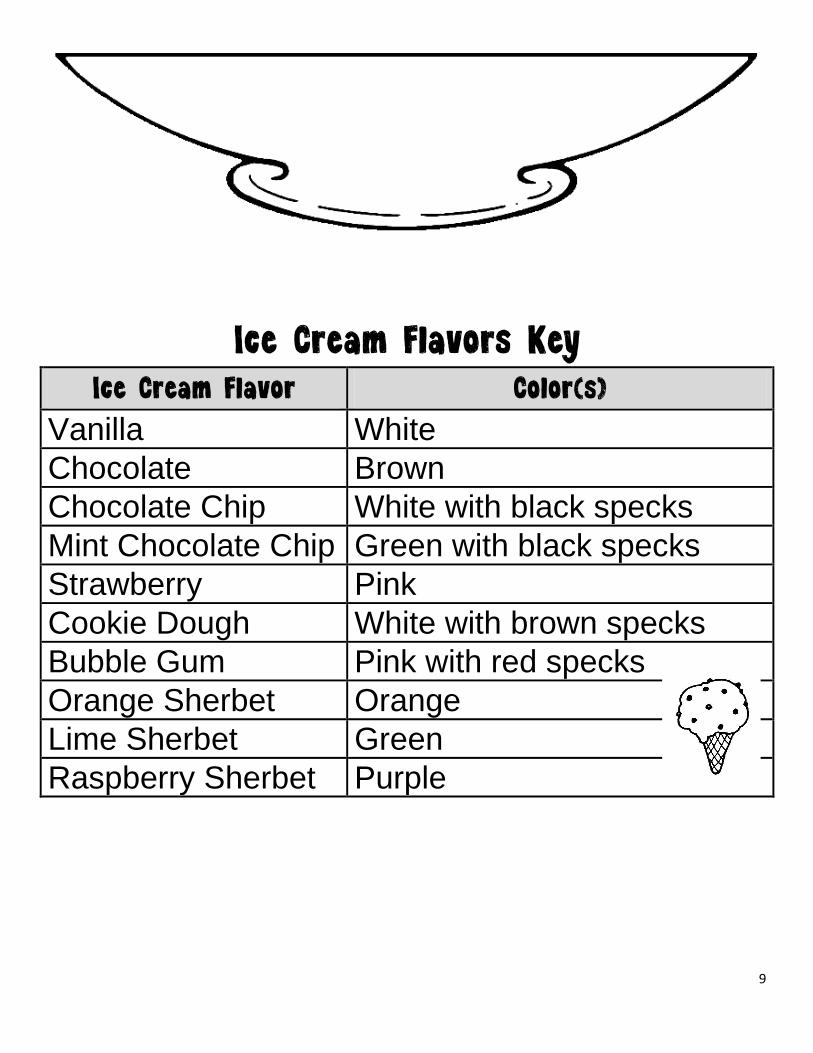
9
Ice Cream Flavors Key Ice Cream Flavor Color(s)
Vanilla White
Chocolate Brown
Chocolate Chip White with black specks
Mint Chocolate Chip Green with black specks
Strawberry Pink
Cookie Dough White with brown specks
Bubble Gum Pink with red specks
Orange Sherbet Orange
Lime Sherbet Green
Raspberry Sherbet Purple

10
Fractions of Flavors Flavor Fraction

11

12

13
Fractions and Graphing Project Grading Rubric
Objective Points Possible
Points Earned
Scoops are colored according to key. 5
Scoops and bowl are glued to paper. 5
“Fractions of Flavor” chart created. 5
Bar graph created. 5
Line graph created. 5
Pictograph created. 5
Circle graph created. 5
All graphs are glued to paper. 5
Total
40