fractography of composite delamination - … · introduction delamination is a major failure mode...
TRANSCRIPT
>, r ,/ /._ /
J /" .... : ,: ..
FRACTOGRAPHY OF COMPOSITE DELAMINATION
NAG-1-705
FINAL REPORT
October 15, 1989
to
National Aeronautics and Space Administration
Langley Research Center
from
MATERIALS SCIENCE AND ENGINEERING DEPARTMENT
UNIVERSITY OF UTAH
W. D. Bascom
Principal Investigator
(NASA-C_-I_-_£Ol)
_3FL,_,_ [ _,_ r r _N Fi n-ol99
FRAC'I'qGqApHy _3F COMP,'_]SITL
Pe_or t (' Ut,_h Univ.)
CSCL 11_
(;J/Z4
NgO-I 3599
Unc 1 ._s0734o7Z
https://ntrs.nasa.gov/search.jsp?R=19900004283 2018-07-11T09:34:31+00:00Z
TABLE OF CONTENTS
INTRODUCTION .......................................................................................................... 2
MODE I DELAMINATION ........................................................................................ 2
EXPERIMENTAL ............................................................................................. 2
RESULTS ............................................................................................................ 5
Discussion ......................................................................................................... 0
MODE II DELAMINATION ...................................................................................... 1 2
EXPERIMENTAL ............................................................................................. 1 2
RESULTS ............................................................................................................ 1 5
Unidirectional Laminates .............................................................. 1 5
Cross-ply Laminates ........................................................................ 1 7DISCUSSION ..................................................................................................... 1 8
IMPACT TESTS ........................................................................................................... 1 9
INTRODUCTION .............................................................................................. 1 9
EXPERIMENTAL ............................................................................................. 1 9
Materials .............................................................................................. 1 9
Impact Apparatus ............................................................................ 2 2
C-scan .................................................................................................... 2 4
Specimen Sectioning and Damage Mapping .......................... 24Test Method ........................................................................................ 2 5
RESULTS ............................................................................................................ 2 6
AS4/3501-6 (0/90) laminate ..................................................... 26
AS4/3501-6 (± 45o) Laminates ................................................. 3 3
IM6/3501-6 (0/90) and IM6/3501-6 (+45)
Laminates ............................................................................................ 3 6
AS4/PEEK (90/0) Laminate ......................................................... 40
AS4/PEEK (±45) Laminate ............................................................ 48
AS4/polycarbonate (90/0) Laminate ...................................... 50
AS4/polycarbonate(±45) laminate ........................................... 5 3
Effect of Sample Dimensions and Thickness ......................... 5 5
Fatigue Testing vs RIIE Testing .................................................. 5 8STATIC LOADING ................................................................................................... 6 1
AS4/3501-6 .................................................................................................... 6 2
AS4/PEEK ......................................................................................................... 6 6
POST-IMPACT TENSILE MODULUS .................................................................... 7 4
DISCUSSION ................................................................................................................. 7 6
CONCLUSIONS ............................................................................................................. 8 1
_CES ................................................................................................................. 8 2
APPENDIX 1 ................................................................................................................ 8 5
APPENDIX 2 ................................................................................................................ 8 6
Computer Program for Plotting Damage Maps ................................ 8 7

INTRODUCTION
Delamination is a major failure mode of carbon fiber organic-
matrix composites. It can occur under a variety of loading
conditions; tensile and compression loading of angle ply laminates
(1,2), Mode I and Mode II loading of notched specimens (3), thermalstresses and environmental stresses (4). Specifically relevant to
this report, is the fact that delamination is one of the primary
failure modes in low level impact loading. This problem is
especially serious in that low level impacts produce relatively little
damage on the laminate surface but the internal damage can be
sufficiently sever as to reduce the residual compression strength byas much as 50%. Considerable work has been done on impact damage
much of which has been reviewed in a recent anthology (5).
Efforts to develop predictive models of the delamination of
carbon fiber composites are hampered by a lack of information about
the micromechanics of impact damage and delamination growth.
Crack formation and propagation in these materials cannot beobserved in sufficient detail to determine micro-damage using
currently available NDE methods such as acoustic backscattering or
X-ray imaging. Consequently, destructive methods are required.
In the work reported here, delamination of composites in ModeI, Mode II and after low energy impact loads were investigated using
metallographic techniques of potting the failed specimens,sectioning and examining the cut sections for damage modes. This
technique has been used to investigate impact damage (6) and more
recently microdamage due to compressive failure (7).
MODE I DELAMINATION
EXPERIMENTAL
Width tapered double cantilever beam (WTDCB) specimens were
cut from a plate of Hercules IM6/2502 carbon fiber/epoxy matrix
composite. The plate was fabricated by hand lay-up of 24 plys of
unidirectional tape and autoclave cured at 177oC (350OF)for 2 hrs.
2
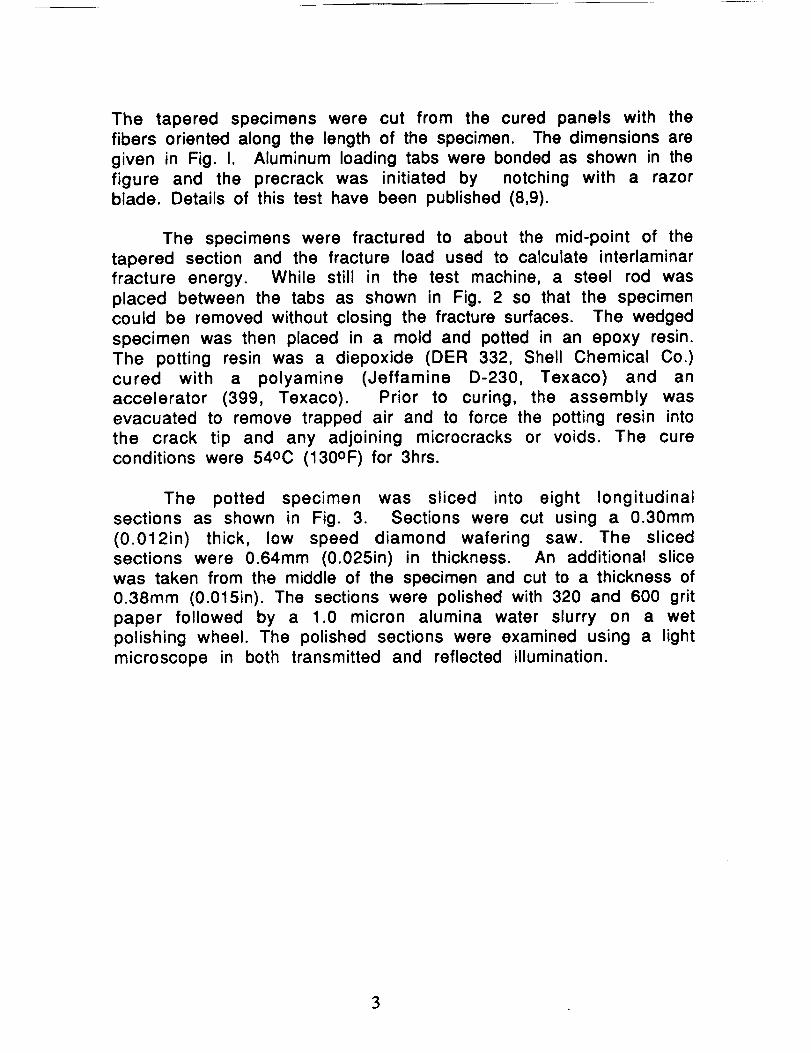
The tapered specimens were cut from the cured panels with the
fibers oriented along the length of the specimen. The dimensions are
given in Fig. I. Aluminum loading tabs were bonded as shown in the
figure and the precrack was initiated by notching with a razorblade. Details of this test have been published (8,9).
The specimens were fractured to about the mid-point of the
tapered section and the fracture load used to calculate interlaminarfracture energy. While still in the test machine, a steel rod was
placed between the tabs as shown in Fig. 2 so that the specimencould be removed without closing the fracture surfaces. The wedged
specimen was then placed in a mold and potted in an epoxy resin.
The potting resin was a diepoxide (DER 332, Shell Chemical Co.)
cured with a polyamine (Jeffamine D-230, Texaco) and an
accelerator (399, Texaco). Prior to curing, the assembly wasevacuated to remove trapped air and to force the potting resin into
the crack tip and any adjoining microcracks or voids. The cureconditions were 54oc (130OF) for 3hrs.
The potted specimen was sliced into eight longitudinal
sections as shown in Fig. 3. Sections were cut using a O.30mm
(O.012in) thick, low speed diamond wafering saw. The sliced
sections were O.64mm (0.025in) in thickness. An additional slice
was taken from the middle of the specimen and cut to a thickness of
O.38mm (O.015in). The sections were polished with 320 and 600 grit
paper followed by a 1.0 micron alumina water slurry on a wet
polishing wheel. The polished sections were examined using a light
microscope in both transmitted and reflected illumination.
3

J-1.5in.
Razor
Notch
\
0.75in._
1.5in.
', 6in. =
BondedAluminumTabs
0.175in.
f" 124ply)
0 degreefiberdirection
Figure 1 - Dimensions of the WTDCB test specimen
0 degree fiber direction
Figure 2 - Schematic of the partially fractured WTDCB specimen wedged open with asteel rod.
4
--.--- 0.025 in.thick
0.050 in.thick
Section cut formicroscopic study.
• (8 Slices)
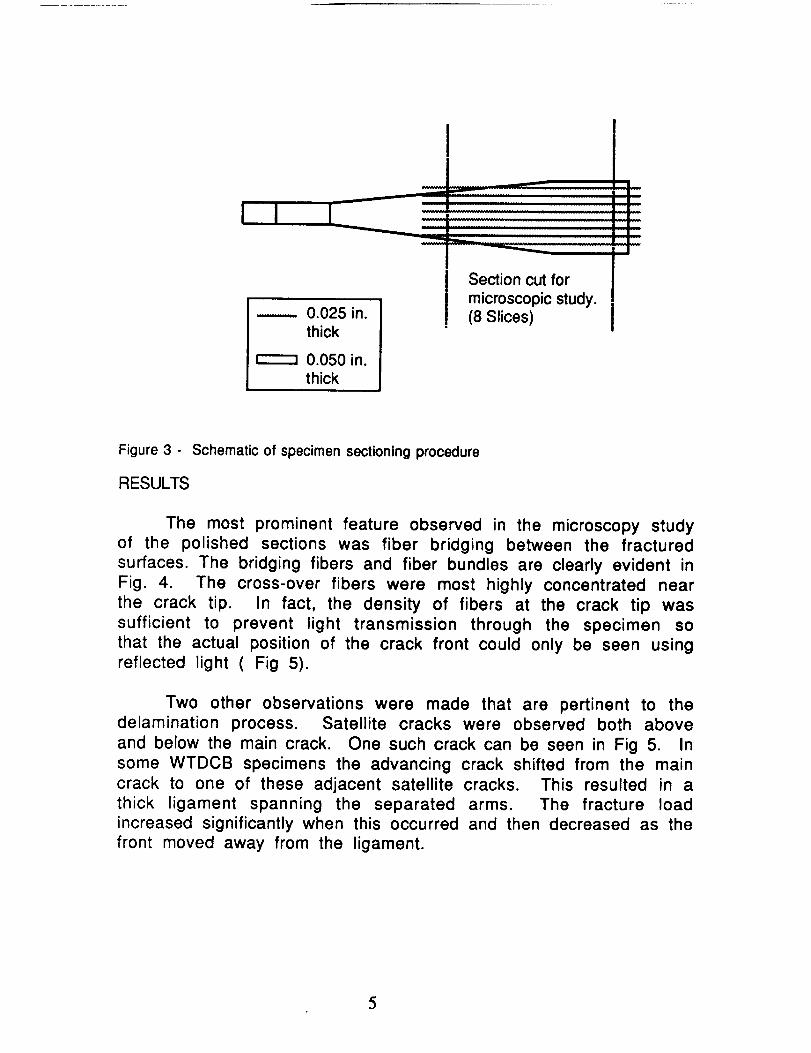
Figure 3 - Schematic of specimen sectioning procedure
RESULTS
The most prominent feature observed in the microscopy study
of the polished sections was fiber bridging between the fractured
surfaces. The bridging fibers and fiber bundles are clearly evident in
Fig. 4. The cross-over fibers were most highly concentrated near
the crack tip. In fact, the density of fibers at the crack tip was
sufficient to prevent light transmission through the specimen so
that the actual position of the crack front could only be seen usingreflected light ( Fig 5).
Two other observations were made that are pertinent to thedelamination process. Satellite cracks were observed both above
and below the main crack. One such crack can be seen in Fig 5. In
some WTDCB specimens the advancing crack shifted from the main
crack to one of these adjacent satellite cracks. This resulted in a
thick ligament spanning the separated arms. The fracture load
increased significantly when this occurred and then decreased as the
front moved away from the ligament.
5

,5
,,¢:
,5
en
°i
"oE
A
t-._(2
EI:
I--I
I,I.
6ORIOINAL PAGE
BLACK AND WHITE PHOTOGRAPH
ORIGINAL PAGEBLACK AND V,,:HtrE PHOTOGRAPH
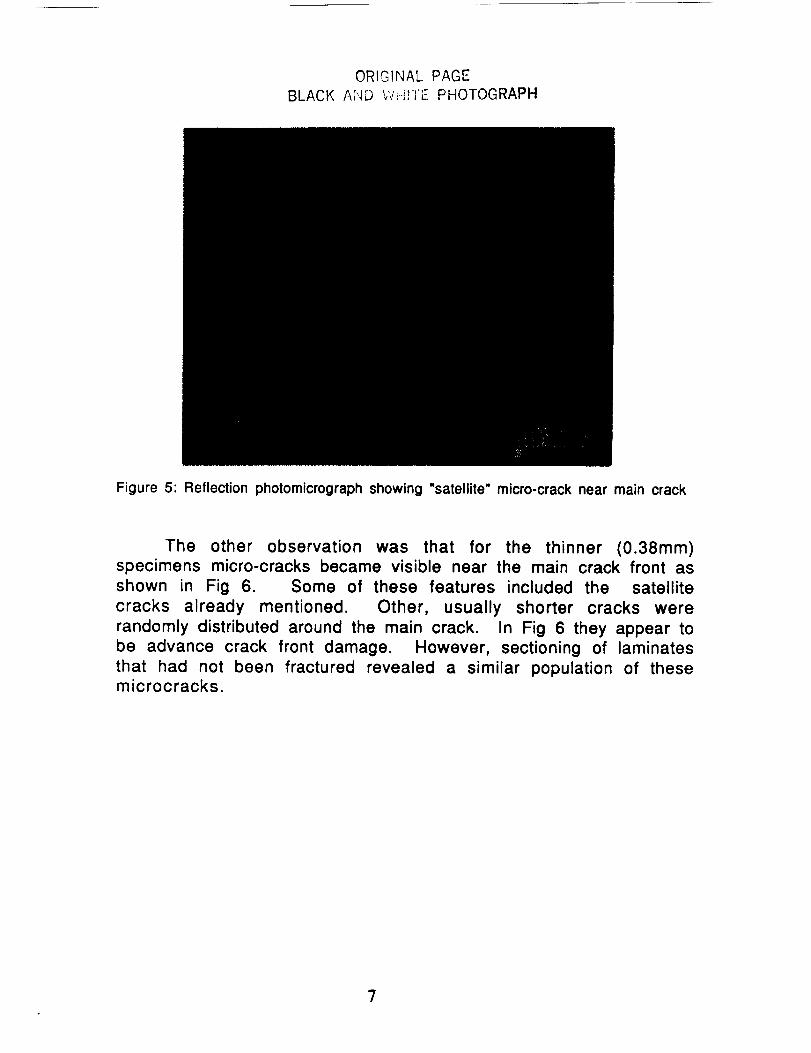
Figure 5: Reflection photomicrograph showing "satellite" micro-crack near main crack
The other observation was that for the thinner (0.38mm)specimens micro-cracks became visible near the main crack front as
shown in Fig 6. Some of these features included the satellite
cracks already mentioned. Other, usually shorter cracks were
randomly distributed around the main crack. In Fig 6 they appear to
be advance crack front damage. However, sectioning of laminates
that had not been fractured revealed a similar population of thesemicrocracks.
?

OPrnW_L PAGEBLACK "
..... OTOGRAPH
°F,5
"_.¢=
EE
d.8,,_o
"'8
E_
o_.go,.,,.-,o._o o_.__"E=Ec c1_',_I-- o
i l-ID U)
I--_o
•-_ a_II In
8 ORIGINAL PAGE
BLACK AND WHITE PHOTOGRAPH

Measurements were made of the distance from the loading pins
to the crack tip (as determined by both reflected and transmitted
illumination) for each of the eight sections. The results are given in
Table I. It would appear that the crack front is essentially linear
across the width of the specimen which would imply that the stress
condition is essentially plane strain with no detectable planestress condition at the specimen edges. Locally, the stress state in
the matrix and on the individual fibers is much more complex.
Table I: Distance From Crack Front to Loading Pin Centers
Section No. Distance (mm)Transmission Reflection
1 112.0 113.5
2 112.5 113.5
3 113.0 113.5
4 112.5 113.5
5 111.0 113.5
6 111.0 112.5
7 110.0 111.0
8 109.0 111.0
Transverse sections of potted IM6/2502 laminates were cut
about 0.3ram behind the crack front. A photomicrograph of one
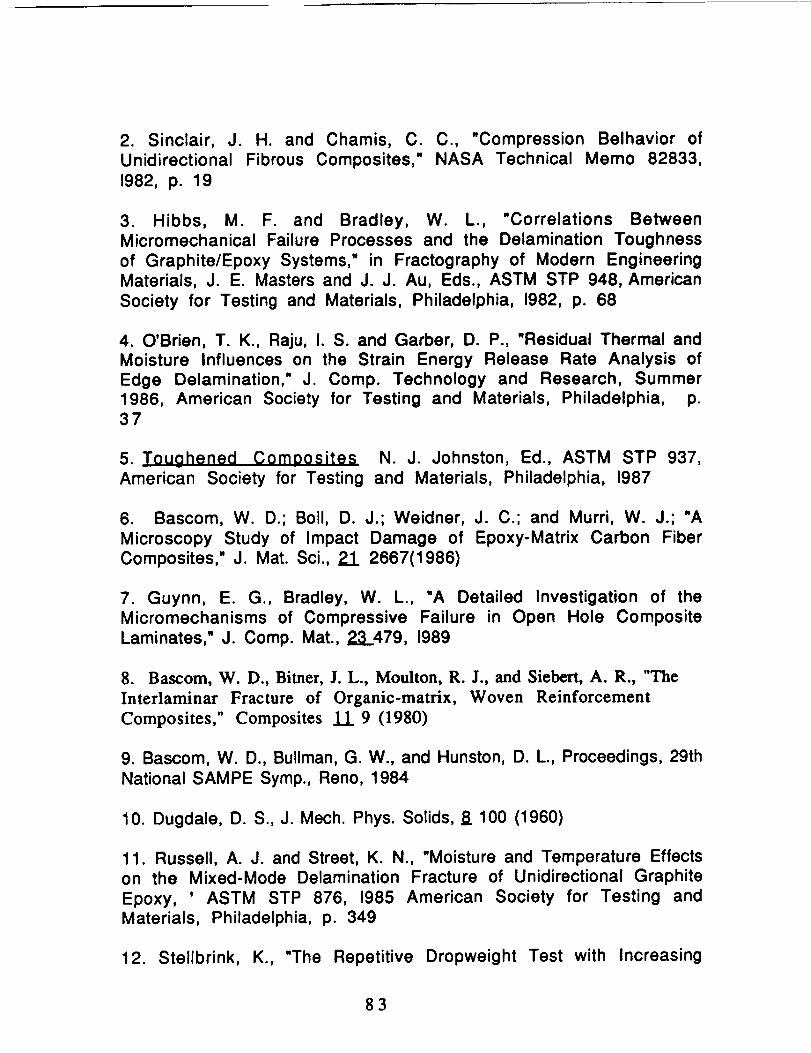
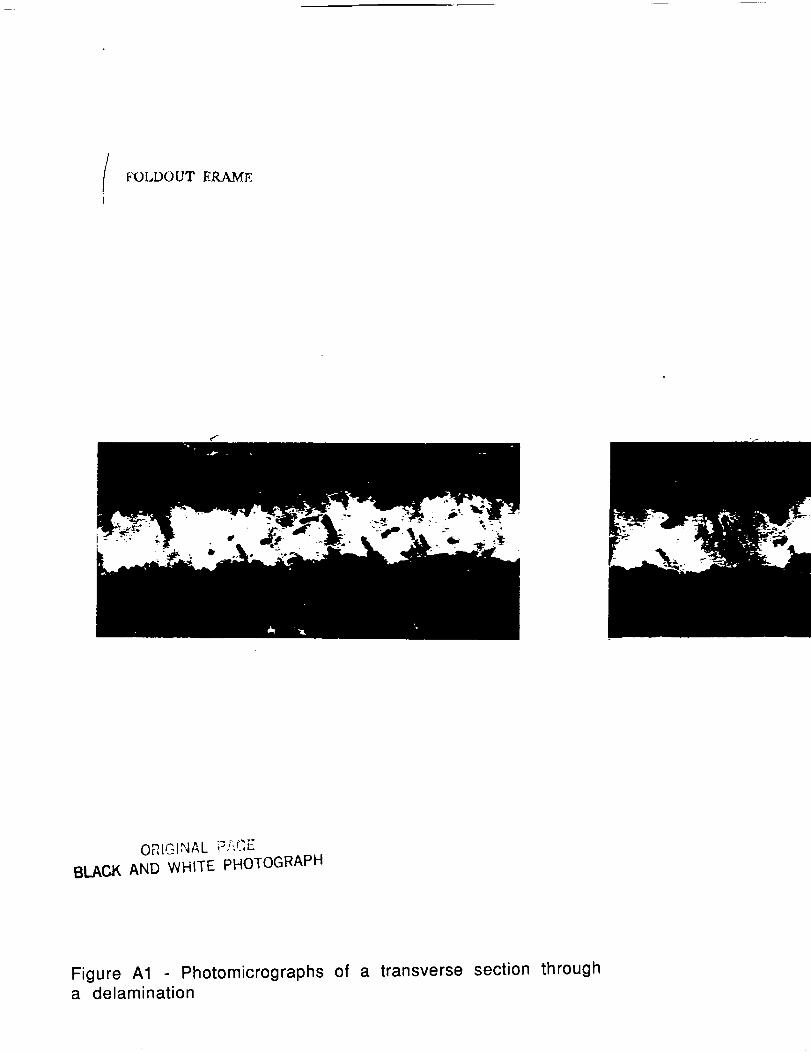
portion of the transverse section is presented in Fig. 7. The bridgingfibers appear in the crack opening as white circles or groups of
circles. A collage of photographs taken at five equally spaced
positions along a transverse section are shown in Fig. A1 (Appendix
A). Bridging fibers appear as dark objects in the crack opening sincethe section was viewed using transmitted illumination whereas in
Fig. 7 reflected illumination was used.
9

100 MICRONS
Figure 7 o Reflection photomicrograph of a transverse section through the delaminatedspecimen about 3ram behind the crack front.
The first (LHS) and the last (RHS) photographs in Fig. A1 were
taken near the specimen edges. It is clear that going from left to
right the crack opening decreases significantly to the extent that atthe right hand edge, the crack is essentially closed. Actually, there
was a ligament of fibers extending across the crack opening at the
right hand side of the specimen. The resistance of this ligament to
the advancement of the crack front could have redirected the plane
of the delamination. Inspection of the specimen indicated that thisdid not occur. None the less, the effect of these ligaments of
bridging fiber bundles must effect the delamination fracture energy
and any calculation of the crack opening displacement.
DISCUSSION
The principal observations of this study were the massive
fiber bundle crossover at the crack tip of the delaminated specimens
and the ligaments of fiber bundles that persist behind the main
crack front. The density of crossovers decreased away from the
]0ORIGINAL PAGE
BLACK AND WHITE PHOTOGRAPH
crack front where the fibers had pulled out and/or fractured.
Clearly, there are two energy consuming processes involved; thepull-out (or more exactly the peel-out) of fibers from both sides of
the delamination and the breaking of these fibers. For the material
studied here, must of the bridging involved fiber bundles and veryfew individual filaments.
Fiber bridging may be more prevalent and possibly unique in
the delamination of unidirectional laminates compared to angle plylaminates. Although, the unidirectional laminates are fabricated
from prepreg plys, there is considerable nesting and intermingling ofthe filaments during the compaction steps of the vacuum
bag/autoclave processing. In viewing the cut sections it is not
possible to identify the individual plies. In angle ply laminates,
there is little opportunity for fiber nesting and the plies withdifferent orientation can be easily identified in sectioned and
polished specimens (8). This distinction between unidirectional and
angle-ply laminates is significant in that crack propagation through
a resin rich layer probably requires less energy than through a"maze" of bridging fibers and fiber bundles. Actually, the situationis more complex as discussed in the next section on Mode IIdelamination.
One of the objectives of this investigation was to examine forevidence of micro-cracking or other damage in advance of the main
crack front. No precrack damage was found. The micro-cracks
observed ahead of the crack front shown in Fig. 6 were found at a
comparable density well away from the delamination in undamagedregions of the composite. Presumably these microcracks are voids
or resin rich areas. It is also possible that some of these
microcracks are artifacts resulting from the sectioning and
polishing. If the microcracks are in fact laminate defects, then this
sectioning technique can be used to determine laminate quality.
Other fiber-matrix combinations were fractured and sectioned
to determine if the density of cross-over fibers varies with matrix
fracture energy and fiber strength. The 2502 epoxy matrix has a
relatively high fracture energy (270 Jim2) and the IM6 is arelatively strong fiber (4.9 GPa). None the less, tests with an
AS4/3501-6 laminate for which the matrix fracture energy is130J/m2 and the fiber strength is 3.6 GPa also exhibited
considerable fiber bridging.
]]
The zone of bridging fibers and fiber bundles evident in Figs. 4
and A1 suggest the line zone of crack tip damage assumed in the
Dugdale model of crack tip plasticity (10). Accordingly, the length
of the plastic zone R is given by,
R=_" _y
Where KIc is the stress intensity factor and _y the tensile yieldstrength of the material. The stress intensity factor is given in
terms of the strain energy release rate, GIc, by,
EG_KIc2 = l_-vv2 Eq. 2
where E is the tensile modulus and v Poisson's ratio.
typical values for carbon fiber, epoxy matrix composites, i.e.,Taking some
E = ]..25 x ]011 Pa
Gc = 721 Pa. m
Cy =40x 106 Paa
gives a value for R of about 25mm. which is more than three times
the length of the crack shown in Fig.4. This distance seems
excessively long but may reflect the influence of bridging fibers andligaments well behind the crack front.
MODE II DELAMINATION
EXPERIMENTAL
The test fixture shown in Figure 8 was constructed to load
end-notched carbon fiber laminates in order to induce pure Mode II
cracking and then pot the cracked specimen in a clear epoxy for
a The tensile strength of the 2502 epoxy is used here for (_y which probablyunder estimates the yield strength.
12

sectioning and microscopy. As shown in Figure 9 the specimen is
clamped at one end and deflected downward at the other end by
turning a bolt with a short wooden dowel contacting the specimen.
Crack growth at the edge of the specimen was observed using a
telescope and when the crack reached about half the length of thespecimen a mold was built around the free end of the laminate
(including the dowel), filled with the potting resin and heat cured.
Figure 8 - Flexture load frame for Mode II delamination
]3

A B
F
wooden _
dowel _
]
I I
Figure 9 - Schematic of Mode II loading and the end notch configurations.
The test laminate was a unidirectional 16ply, AS4/3501-6
composite l in. wide and 4in. in length. Excessive bending of thespecimen near the clamped end resulted in failure before a
delamination could be produced. This problem was solved by
supporting the specimen with two laminates 0.5in. wide and 2.25in.
and 3.25in. long respectively. Using this configuration, a mid-plane
crack could be initiated without any breakage at the clamped end.
Two loading configurations are shown in Figure 9. In one case
(Figure 9A) the laminate was precracked using a knife blade, theupper section cut away and the dowel positioned against the
protruding lower section. In order to minimize Mode I loading, a
wire was wrapped around the specimen. Judging from visual
observations the Mode I opening displacements are minimal at the
crack front that had propagated one-half the length of the specimen.
The same test procedure was used to investigate Mode II
delamination of a cross-ply (0/90)8s laminate. In these experimentsthe laminate did not have to be end cut but was precracked using a
razor blade (Fig 9B). The specimen was loaded to about 0.5 in.
deflection at which point a crack propagated about 3/4 of the
specimen length. The specimen was then potted, cut into sections
14

about 2mm thick and the sections polished.
RESULTS
Unidirectional Laminates: The loading configurations shown in
Figure 9B should produce a pure Mode II delamination. However, wewere unable to induced a crack in this fashion. The fractography
results reported here are for cracks produced using the "split end"
configuration, Fig. 9B.
The general appearance of the cut sections is shown in Figure
10. Two major cracks developed in the specimen; the major crack
along the central plane and a pure Mode II crack in the upper half ofthe specimen. The crack in the upper half of the specimen is
designated as a "pure" Mode II crack based on the fact that there was
relatively little displacement of the crack faces. In principle, aMode II crack should not be visible since it involves only shear
displacements. None the less, the cracks generated in this study are
the result of primarily Mode II loads.
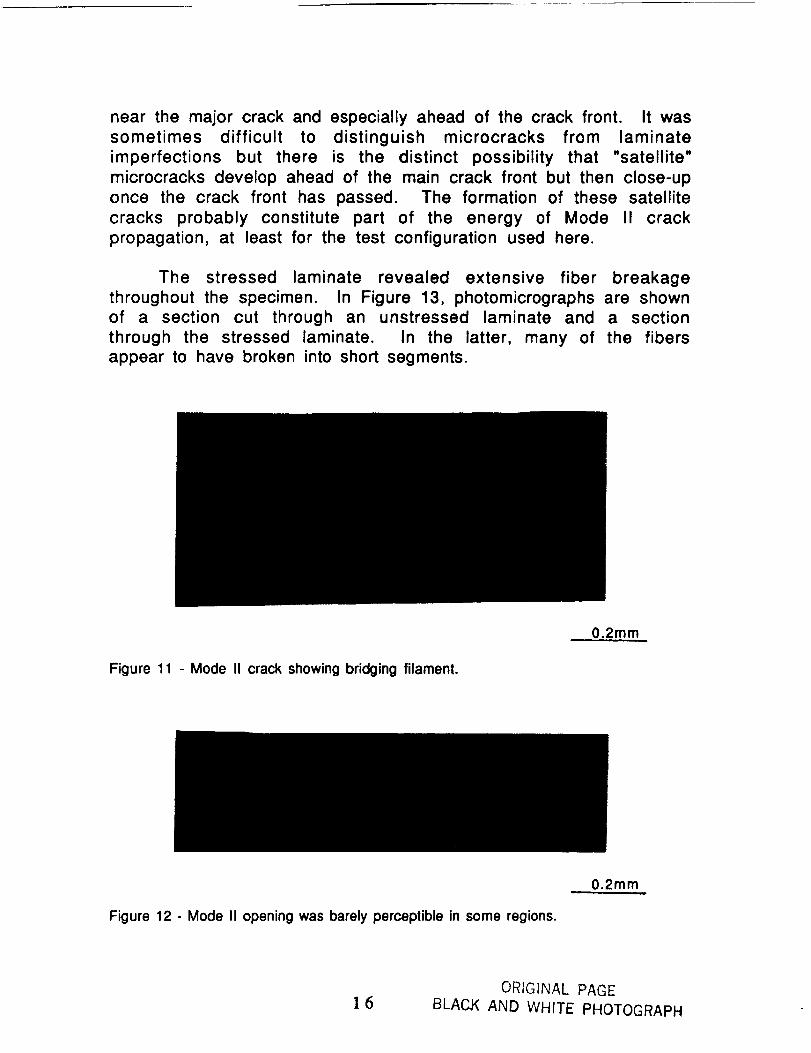
For the most part, these cracks progressed through the matrix
with relatively little fiber bridging. Occasionally, there was
evidence of fibers spanning the crack (Figure 11). The Mode II crack
was not continuous. As shown in Figure 12, the crack is distinct on
the left and right hand sides of the photomicrograph but disappearsin the center.
mode II crack
mixed mode crack
micro cracks
Figure 10 Schematic of cracking in a Mode II specimen
As shown schematically in Figure 10, there were microcracks
15
near the major crack and especially ahead of the crack front. It was
sometimes difficult to distinguish microcracks from laminate
imperfections but there is the distinct possibility that "satellite"
microcracks develop ahead of the main crack front but then close-up
once the crack front has passed. The formation of these satellite
cracks probably constitute part of the energy of Mode II crack
propagation, at least for the test configuration used here.
The stressed laminate revealed extensive fiber breakage
throughout the specimen. In Figure 13, photomicrographs are shown
of a section cut through an unstressed laminate and a section
through the stressed laminate. In the latter, many of the fibers
appear to have broken into short segments.
0.2mm
Figure 11 - Mode II crack showing bridging filament.
0.2ram
Figure 12 - Mode II opening was barely perceptible in some regions.
]6ORtGINAL PAGE
BLACK AND WHITE PHOTOGRAPH

BLACK AND V¢I-iIYE PHOToGRApH
A O.04mm
B 0.04mm
Figure 13 - Fiber fracture in tested specimen (A) not observed in untested laminate.
Cross-ely Laminates: Crack propagation occurred at a bending
stress of 9.6x10⁶ psi. and was always through a 0 o ply as shown in
A2 (Appendix I). In one specimen it was observed that the majorcrack shifted to the next 0 o ply (Fig A3). There was no evidence of
any transverse cracking through the adjacent 90 o ply. In general,the crack propagated near the edge of the 0 o ply, close to the resin
rich area between plys but always at least a few fiber diameters
into the ply. In addition there was no evidence of fiber bridging.
17
DISCUSSIONOR!GtNAL PAGE
BLACK AND WHITE PHOTOGRAPH
It is difficult to draw general conclusions about Mode II
propagation from these studies because of the rather specific
loading conditions necessitated by the need to be able to pot the
cracked specimens. The high loads required to initiate propagation of
the unidirectional specimen resulted in fiber breakage which is not
generally typical of Mode II testing. In addition, loading was not
pure Mode II but mixed mode albeit predominantly Mode II. Indeed, as
stated earlier, a pure Mode II crack should not be visible since there
is no crack opening. The only crack that was purely Mode II was in
the unidirectional specimen and, in fact, was difficult to discern
(Fig 12)
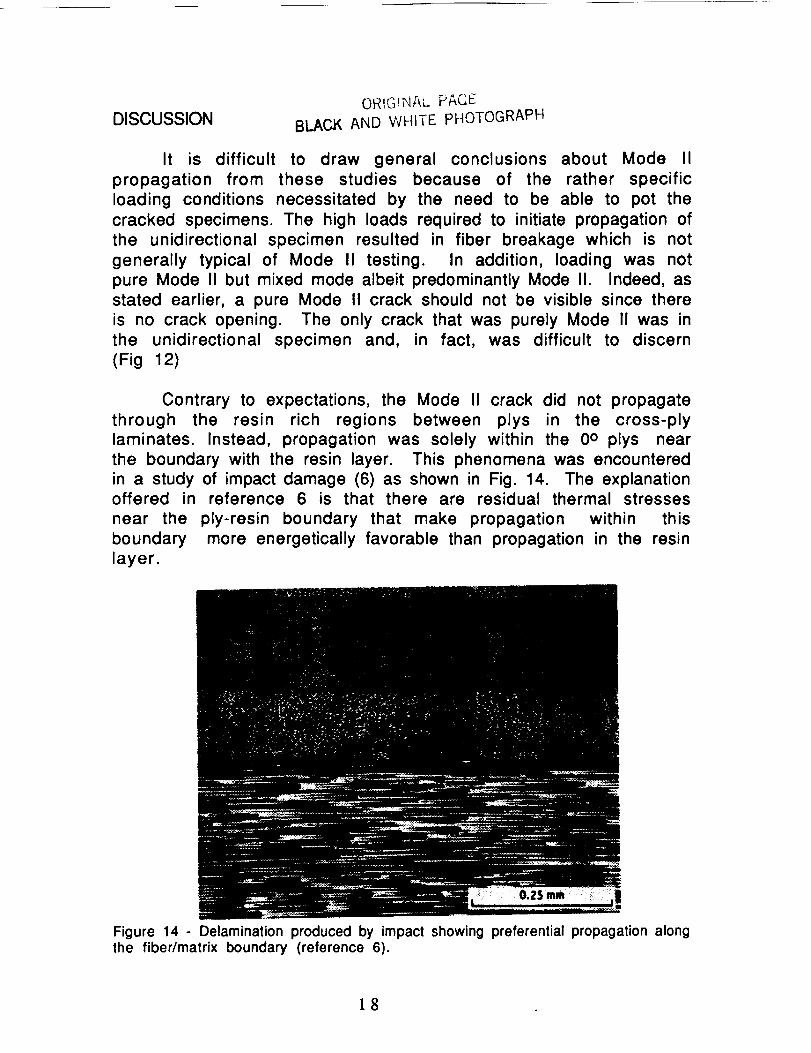
Contrary to expectations, the Mode II crack did not propagate
through the resin rich regions between plys in the cross-ply
laminates. Instead, propagation was solely within the 0 o plys near
the boundary with the resin layer. This phenomena was encountered
in a study of impact damage (6) as shown in Fig. 14. The explanationoffered in reference 6 is that there are residual thermal stresses
near the ply-resin boundary that make propagation within this
boundary more energetically favorable than propagation in the resin
layer.
Figure 14 - Delamination produced by impact showing preferential propagation alongthe fiber/matrix boundary (reference 6).
18

No fiber cross-over was observed in any of the Mode II
laminates. This fact suggests a lower crack resistance under Mode
II loading than under Mode I loading. The Mode I study indicated
fiber pull-out and fiber fracture as important energy dissipative
effects which are evidently absent in Mode II cracking. Russel and
Street (11) have presented evidence that crack propagation in Mode
II occurs at a lower energy than in Mode I
IMPACT TESTS
INTRODUCTION
This part of the study was predicated on reports in the
literature (12) that repetitive impact of a laminate specimen with
increasing impact energy revealed changes in the type of impact
damage, e.g., delamination vs fiber breakage. If correct, this
technique would be a useful tool for determining the impact energy
at which different damage modes occur for different laminatematerials.
As shown in the following sections, the claims made in
reference 12 are unfounded b. Instead, the changes in the response of
the laminate to repetitive impact with increasing impact energy are
the result of changes in the extent of damage rather than the type of
damage. None the less, the results reported here revealed some
subtle effects in the impact resistance of thermoset matrix
laminates vs thermoplastic laminates, the effects of ply
orientation, static vs dynamic loading, differences in laminate
thickness and simple fatigue ( repetitive impact at constant impact
loading) vs repetitive impact with increasing impact energy (RILE)
EXPERIMENTAL
Materials: Four different composite materials were studied,
AS4/3501-6, IM6/3501-6, AS4/PEEK and AS4/polycarbonate. Themanufacture, thickness and stacking sequence of the various
b We have learned of a manuscript being reviewed for publication that makesthe same claims as in reference 12. The reviewer could not, of course, provide
any further information.
19

specimens are summarized in Table 11. The AS4/3501-6 andIM6/3501-6 laminates were cured in an autoclave at the University
of Utah, Mechanical & Industrial Engineering Dept. according to themanufacturer's recommended cure schedule. Each impact plate
specimen was cut from a large panel (15cm x 15cm) to 5cm x 8cm
dimension using a diamond cutting saw. For a 5cm x 8cm coupon, 1.5
cm at each end were clamped to the support so that the unsupporteddimension was 5cm x 5cm. In order to measure the effect of sample
dimensions on impact response, specimens with unsupporteddimension of 10cm x 10cm were also tested. To investigate the
effect of laminate thickness, 32 ply and 16 ply specimens were
tested. Ultrasonic C-scan acoustic imaging available at Hercules
Aerospace, Magna, Utah was used to check the quality of each panel
before they were impacted and to determine the location of the
damage after they were impacted.
2O

m
.Q
u)(1)
,4--*
u)OQ.EO
O
Or-
o"(pcn
c_r-
o
(n
"DE
E.9u)r-
Eo_
a
(D
,i,-
ol ol o_
A
E o oO X X X X 0 X
®.N "- U'_ _ U') _ ,.-U)
l-
.en
0 _'3 _- t'_ _-- t'_
° ° :
-- , vo _ w
_D
A
c
o
X
o
t-o
o
¢'- C
v _
®LT.z"1-
21

Imoact ADoaratus: The instrumented impact tester used in
this study is similar to that described by Zoller (13). The free-fall
drop weight is within a cylindrical drop tower as shown in Fig. 15 .
When the drop weight bounces up, it is caught by a ratchet
mechanism. This impactor consists of four main parts; load
transducer, oscilloscope, IBM PC and printer. A piezoelectric crystal
accelerometer (PCB Piezotronics 305A02) is mounted inside the
drop weight. During the impact the output of the transducer is fed
to a transient signal recorder. A Data Precision D6000 digital
oscilloscope records the acceleration versus time during the impact
event. The output is filtered using Fourier transformation to removedata above 7000 Hz. Then the data is back transformed to
acceleration versus time. Fourier transforming the data reported
here showed that a reproducible resonance between 7000 and 8000
was independent of sample size indicating it is a resonance
frequency characteristic of the equipment and not of the testsample. However, due to a natural vibrational frequency of some of
the composite specimens between 6000~7000 Hz, the cut-off
filtering frequency could not be less than 7000 Hz.
Acceleration, a(t), is calculated from the digitized voltage-
time information j(t) and the sensitivity of the accelerometer, s, in
mv/g,
a(t)=l -(j(t)/s)
then velocity v(t) and displacement u(t) are obtained from,
v(t) = Vo + J" a(t) dt
u(t) = Uo + J"v(t) dt
Also the absorbed energy U(t) and the force exerted on the sample
are obtained from,
U(t) = mgho- (1/2) m {vo2-v(t) 2}
F(t) = m {g-a(t)}
The accuracy of the initial velocity measurement is important in
calculating the absorbed energy and displacement(14). Impact
velocity v o was measured by two photoswitches. Finally the
following data and plots are printed; percent of transferred energy,
22

Figure 15 - Drop-weight impact test equipment.
23ORIGINAL PAGE
BLACK AND WHITE PHOTOGRAPH

impact energy, maximum force, maximum deflection, time of zero
velocity, and impact time. Force vs displacement, energy vs time
and amplitude of vibration verse frequency can also be plotted.
Ultrasonic transmission C-scan was used to
determine the overall panel quality and the location of damage.
Ultrasonic equipment was available at Hercules Aerospace, Magna,Utah. Alcohol or an alcohol-water mixture acted as a coupling fluid
between a piezoelectric transducer and the specimen.
Specimen sectioning and Damage Ma.o0ing: The impacted
specimens were potted in an epoxy mixed with an amine curative andan amine accelerator to preserve the damage and were cured at room
temperature over night. The epoxy mixture contained diglycidylether
bisphenol A epoxy (Shell 828), polyamine (Jeffamine 230) and
accelerator (Texaco 399) in the ratio of 10 : 5 : 1. Slices were cut
from the sample at 0.075 inch (0.19 cm) intervals from the center of
the damaged region (Fig.16). One face of each slice was polished
sequentially with #320 and #400 grit papers followed by wet
polishing with 1 _mand 0.3 _m AI20 3 paste on a velvet cloth. The
polished surface was examined using reflected light microscopy for
the type and extent of damage in each ply. Each of the damaged
regions were plotted in three dimensions using a computer program
(Appendix 2).
o ° fiber direction,,d
(
\
Cuts Visible dent
Figure 16 - Schematic of sectioning through the impact damage area.
24
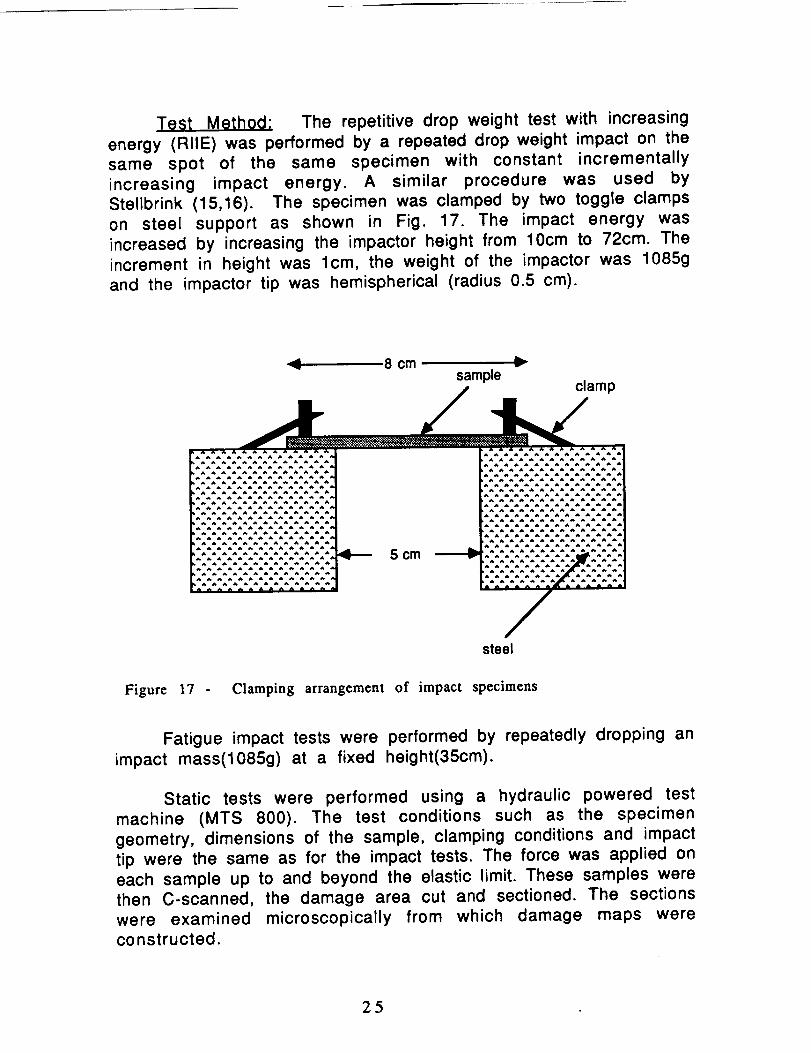
Test Method: The repetitive drop weight test with increasing
energy (RILE) was performed by a repeated drop weight impact on the
same spot of the same specimen with constant incrementally
increasing impact energy. A similar procedure was used byStellbrink (15,16). The specimen was clamped by two toggle clamps
on steel support as shown in Fig. 17. The impact energy was
increased by increasing the impactor height from 10cm to 72cm. The
increment in height was lcm, the weight of the impactor was 1085g
and the impactor tip was hemispherical (radius 0.5 cm).
_ _ _ A _ A _ "
Ih,..8 cm vsample
clamp
ii!ii i ii!ii,iiiiiiiiiii i, A A_ A
"-'°m-- iiiiiiiiiiiiii iiii!i/
steel
Figure 17 - Clamping arrangement of impact specimens
Fatigue impact tests were performed by repeatedly dropping an
impact mass(1085g) at a fixed height(35cm).
Static tests were performed using a hydraulic powered test
machine (MTS 800). The test conditions such as the specimen
geometry, dimensions of the sample, clamping conditions and impact
tip were the same as for the impact tests. The force was applied on
each sample up to and beyond the elastic limit. These samples werethen C-scanned, the damage area cut and sectioned. The sections
were examined microscopically from which damage maps were
constructed.
25

The post-impact residual tensile modulus was determined
using the MTS test machine. The strain rate was 0.005mm/sec.
Extensional stiffness was calculated from the slope of the load vs
displacement plot.
RESULTS
AS4/3501-6 (0/90! laminate: The stiffness was calculated
by two different methods. One was from the maximum force divided
by the maximum deflection and the other was from the impact time,
i.e., the stiffness k from the mass-spring model is given by k=
(m_2)/t2 where m is the total mass (impactor + sample) and t the
impact time. Stiffness vs accumulated impact energy (T.I.E.) isshown in Fig.18 and percent of transferred energy vs cumulative
impact energy (,T.,I.E.) is shown in Fig.19. Three distinct stages of
more or less constant stiffness were found, ..5200 N/mm, ~2100
N/mm and ~630 N/mm. The stiffness calculated by the twodifferent methods gave essentially the same value.
In Fig.19, the percent of transferred energy of the first and
second stages were 35%. The third stage showed an energyabsorption of ..60%. There was a significant peak in the percent of
transferred energy between stage one and two. This phenomena wasobserved for other laminate materials and geometries.
26

6000
5OOO
E4000E
Zv
3000(9C
.¢:- 20OO03
1000
_nini Pan
n,,n
i giinH hi,, _ Beauo
0 n | n
0 100 200
Z I.E.(J)
Figure 18 - Stiffness vs cumulative impact energy for AS4/3501-6, (0/90)1s,
v
e-LM
t,--
(/)¢-
I-
60
4O
2O
0 i I I
0 100 200
Z I.E. (J)
Figure 19 - Percent transfered energy vs cumulative impact energy for AS4/3501-6(0/90)1 6s
2?
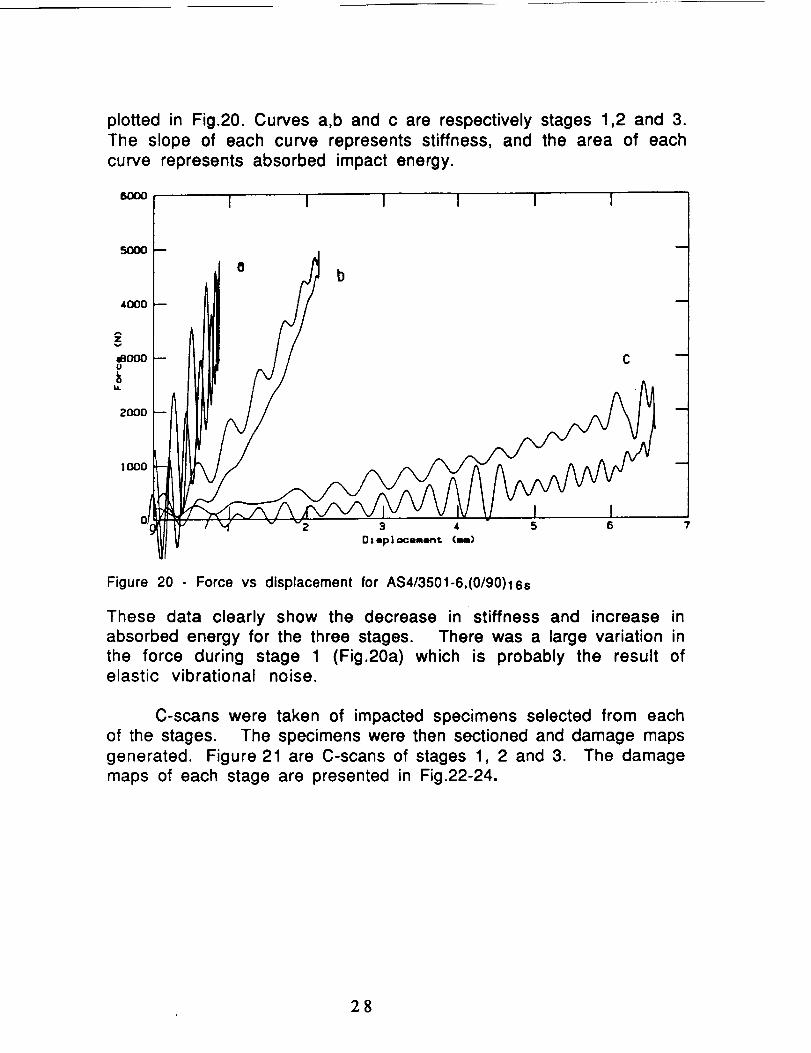
plotted in Fig.20. Curves a,b and c are respectively stages 1,2 and 3.
The slope of each curve represents stiffness, and the area of each
curve represents absorbed impact energy.
6O00
5000
40OO
I I I I I I
£v
aBO00U
2OOO
t ()O0
I I5 6
Figure 20 - Force vs displacement for AS4/3501-6,(0/90)16s
These data clearly show the decrease in stiffness and increase in
absorbed energy for the three stages. There was a large variation in
the force during stage 1 (Fig.2Oa) which is probably the result ofelastic vibrational noise.
C-scans were taken of impacted specimens selected from each
of the stages. The specimens were then sectioned and damage maps
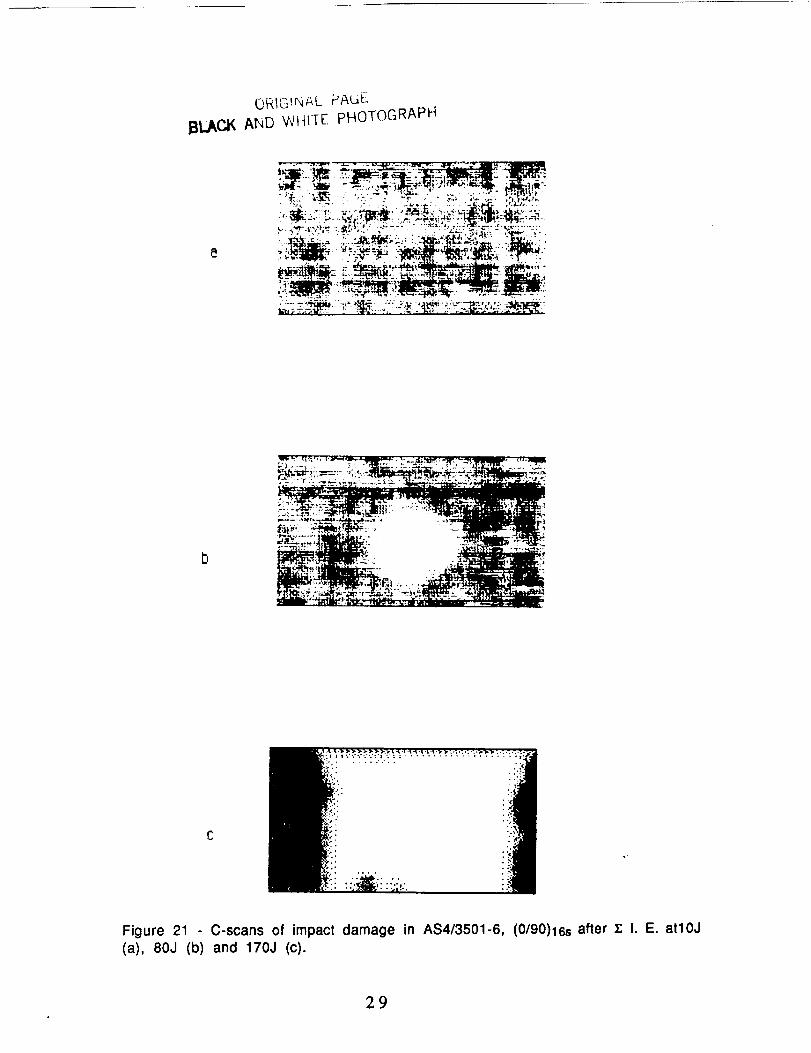
generated. Figure 21 are C-scans of stages 1, 2 and 3. The damage
maps of each stage are presented in Fig.22-24.
28
ORIGINAL PAGE
BI3k, C-_ AND WHI-TE pHOTOGRAPH
• -'_.;_. -_- -. .., . _l,,._:: : ..... ,'.cJ_...
- . P , , • --it I _ --,_" - _114_1 o
, ._. ,:-.,_ ._,.,.. ,_ ...... .. -_,_..:.:_ ..
-,
•.';I .................... I:_
.°.:
Figure 21 C-scans of impact damage in AS4/3501-6, (0/90)16s after _. I. E. atl0J
(a), 80J (b) and 170J (c).
29

In the first stage obtained after 7 impacts, the damage was
concentrated on the front surface (Fig. 22) and the amount of the
damage was very small. Only a few transverse cracks were found.
The damage at this stage from the C-scan was hardly detectable
(Fig. 21a).
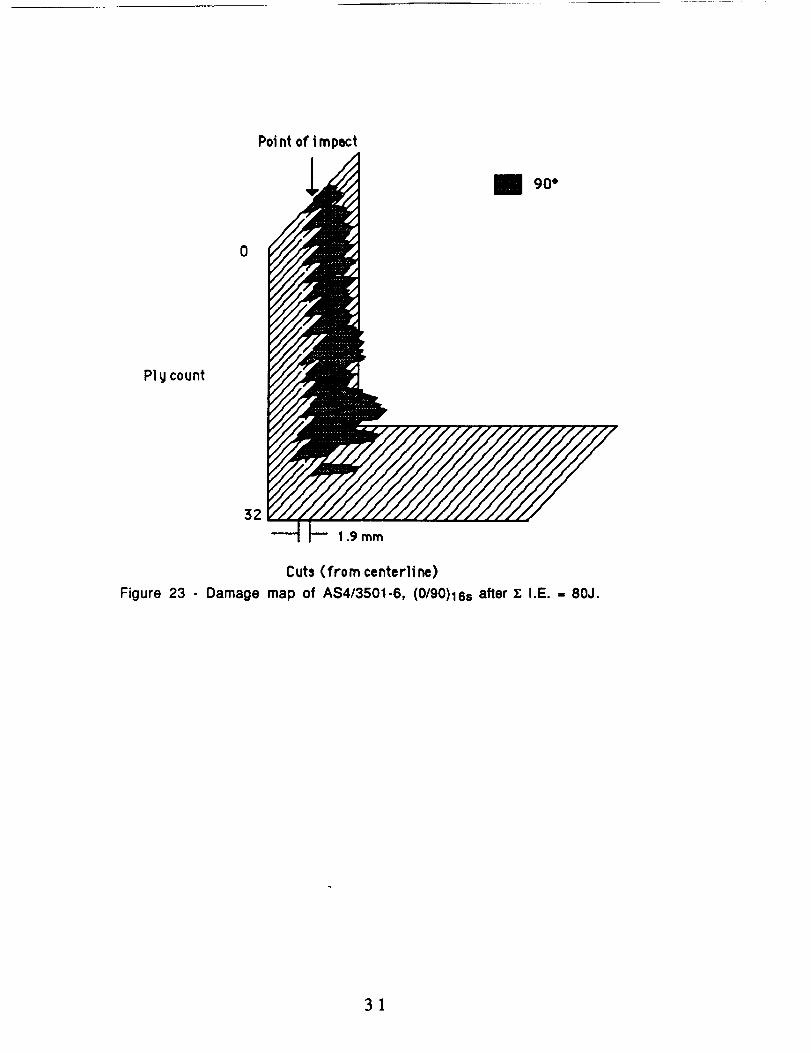
In the second stage, the damage was through the thickness of
the sample (Fig.23) and the C-scan clearly showed a damaged area
(Fig. 21b). Most damage was transverse cracking and delamination inthe 90 ° plies as shown in Fig. 25a.
In the third stage, the damage had propagated to the edges of
the sample (Fig. 21c) and fiber breakage was observed (Fig. 25b).
p]y count
32
Point of | mpact
1.9 mm
Cuts ( from center ]ine)
Figure 22 - Damage map of AS4/3501-6, (0/90)16s after _. I.E. = 10J.
3O
Poi nt of"i mpect
PIy count
0
3Z
1.9 mm
Cuts (from centerlJne)
Figure 23 - Damage map of AS4/3501-6, (0/90)16s after T., I.E. = 80J.
3]

Po!nt of i m pact
P1y count
0
321.9 mm
Cuts (from center]ine)
Figure 24 - Damage map of AS4/3501-6, (0/90)16s after I; I.E. ,, 170J.
32
BLAcr', /,.,_ , , ., : _ 'r:,_*.._T_,_ApH:_ -" ' "
A
B
Figure 25 - Photomicrographs (80X) of impact damage after T. I. E. = 30J (A) and 150J(B)
AS4/3501-6 (;t; 45°_ Laminates: Very similar results were
obtained for laminates with (+ 45o) fiber orientation. The stiffness
vs cumulative impact energy and the percent transfered energy vs
cumulative impact energy are shown in Figs. 26 and 27.
33

"ff 3ooo •EZco
2000c
(D
i000
00
%I , I i I ,
100 200 300
E I.E.(J)
4OO
Figure 26- Stiffness vs cumulative impact energy for AS4/3501-6, ('t-45)le.
I00 4
o_ 80
=o •W 60 •
!40 t ** • *
200 100 200 300 400
I.E.(J)
Figure 27 - Percent transfered energy vs cumulative impact energy for AS4/3501-6
(---45)1Ss
34
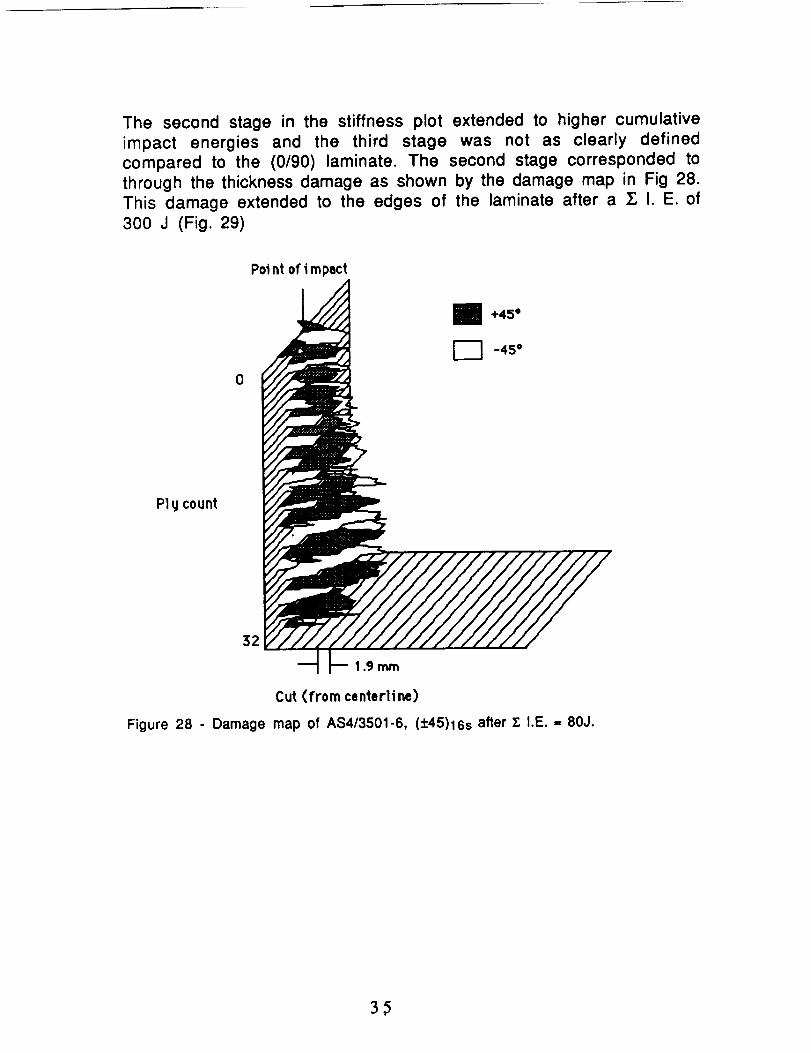
The second stage in the stiffness plot extended to higher cumulative
impact energies and the third stage was not as clearly defined
compared to the (0/90) laminate. The second stage corresponded to
through the thickness damage as shown by the damage map in Fig 28.
This damage extended to the edges of the laminate after a Z; I. E. of
300 J (Fig. 29)
Point of impact
P1tj count
0
32
1.9 mm
Cut (from center11he)
Figure 28 - Damage map of AS4/3501-6, (±45)16s after Z; I.E. = 80J.

Point of impact
0
P1y count
32
1.9 mm
Cuts ( from centerlJne)
Figure 29 - Damage map of AS4/3501-6, (+45)16s after T. I.E. I 310J.
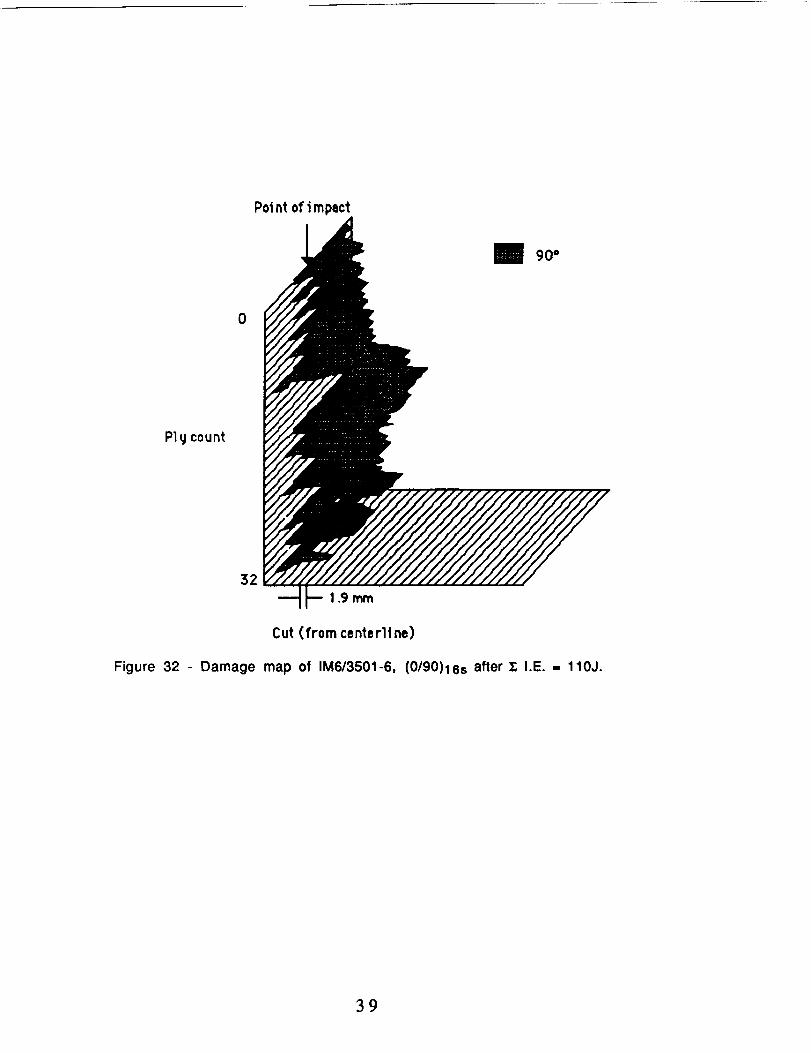
IM6/3501-6 (0/901 and IM6/3501-6 f+451 Laminates: The
stiffness and percent transfered energy vs cumulative impact energy
for IM6/3501-6, (0/90) and (:1:45) are presented in Figs 30 and 31.
Three distinct stages were observed in the stiffness plot for the
(0/90) laminate (Fig 30) and as with the AS4 materials the second
and third stage corresponded to through the thickness damage and
extension of the damage to the edges of the specimen. The
corresponding damage maps are shown in Figs 32 and 33.
36

5OO0
E40OO
_3OO0
•_= 2000r,/3
1000
00
rl
=
, I
IO0
3",I.E.CJ)
a'ga!
II _•11 II
2OO
Figure 30A - Stiffness vs cumulative impact energy for IM6/3501-6, (0/90)16,
100
8Oo_V
¢-UJ
4O
20
9
• 0 o
e
OO= •qlD_lllDe e eee • eeee oe• •••
0 I l I
0 100 200
y_.I.E.(J)
Figure 30B - Percent transfered energy vs cumulative impact energy for IM6/3501-6(0/90)1Ss
37

4OOO
3°t0":..2000 JdB¢.-
o_
oO
1000
0 , I i I ,
0 1_ 2_ 3_
,T_,I.E.(J)
Figure 31A - Stiffness vs cumulative impact energy for IM6/3501-6, (+45)16s
r,/}
[..
8O
6O
4O
2O
0 , I , I
0 100 200 300
Z I.E.(J)
• Trans %
Figure 31B - Percent transfered energy vs cumulative impact energy for IM6/3501-6(+45)1 6s
38
Poi nt of i mpect
Pl 9 count
0
32
Figure 32 - Damage map of IM6/3501-6,
90 °
1.9 mm
Cut (from center11 ne)
(0/90)16s after ]; I.E. = 110J.
39

Point of i mpact
90 °
0o
P1y count
0
32
I .9 mm
Cut (from centerltne)
Figure 33 - Damage map of IM6/3501-6, (0/90)165 after 2; I.E. = 190J.
In the case of the (+45) laminate the cumulative impact energy was
not taken to a high enough level to develop a third stiffness plateau
(Fig. 31A).
A$4/PEEK (90/0) Laminate: Figure 34A and 34B present the
stiffness and percent of transferred energy vs T. I.E. for AS4/PEEK
(0/90) laminates respectively. Unlike the results with the 3501-6matrix laminates there were no distinct stages of relatively
constant stiffness except for an initial plateau. Up to 80J of _ I.E.,
the stiffness was about 4300N/mm and the percent of transferred
energy between 30-40% (Fig.34B). Subsequently, the stiffnessstarted to decrease gradually with high energy absorption (~70%)
and the percent of transferred energy was very scattered comparedwith the 3501-6 materials The stiffness calculated from maximum
force divided by maximum deflection was more scattered than that
calculated from impact time (Fig.34A). The last impact showed
almost zero stiffness and about 100% of energy absorption. The load
v s displacement curves are plotted in Fig .35.
4O

4000 o m0
2OOO
1000
D
0 I I = I I I D
0 100 200 300 400
X I.E. (l)
Figure 34A - Stiffness vs cumulative impact energy for AS4/PEEK, (0/90)1s,
100
80
6O
4O
2O
_Oe• •• •e •
qF
O•
N = I , I , I Iv
0 100 200 300
I_ I.E. (/)
400
Figure 34B - Percent transfered energy vs cumulative impact energy for AS4/PEEK,(0/90)1e,
41

oooo
70Oo
8OOO
50oo
2o0o
lOOO
1 ! I
- bC
-- 0
OJ opl ocomu_t (mat)
i4
Figure 35 - Force vs displacement plots for AS4/PEEK,(0/90)16s at I; I.E. of 50J (a),
150J (b) and 230J (c).
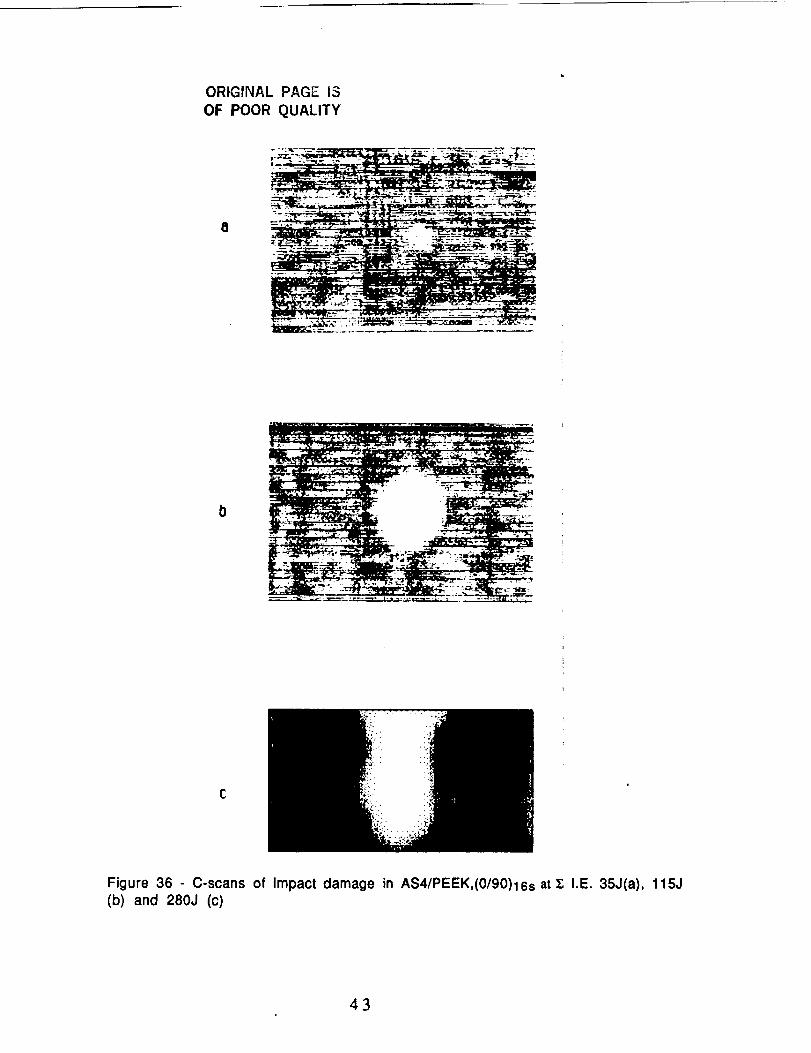
The results of the C-scans are given in Fig. 36 and the damage
maps in Figs. 37, 38 and 39. In the initial stage (T_, I.E.- 35 J), the
damage was small but clearly evident from the C-scan. (This C-scan
was done at a higher impact energy than for the corresponding
AS4/3501-6 laminate.) The map shows that damage was confined to
the front and back plies, and was primarily transverse cracking.
Damage at a T., I.E. of 115 (J) was more localized compared to the
3501-6 systems. The major damage was in the mid plane of the
laminate (Fig.38) and usually consisted of transverse-cracking and
clelamination (Fig.40) as well as some fiber breakage (Fig.41).
42
ORIGINAL PAGE IS
OF POOR QUALITY
8
Figure 36 - C-scans of impact damage in AS4/PEEK,(0/90)16s at Z; I.E. 35J(a), 115J(b) and 280J (c)
43

Point of impact
P1Wcount
52
Cut (from center|i ne)
Figure 37 - Damage map of AS4/PEEK, (0/90)16s after Z I.E. = 35J.
44

Point of impact
Ply count
0
3Z
1.9ram
Cut (from center11 he)
Figure 38 - Damage map of AS4/PEEK, (0/90)16s after T.,I.E. = 115J.
45

Point of i mpact
90 °
0 o
Ply count
32
I .9 mm
Cut (from centerl|ne)
Figure 39-Damage map of AS4/PEEK,(0/90b,,,, at ZI.E.- 280 J
Figure 40 - Damage of AS4/PEEK, (0,90)16s at _; I. E. = 115J (80X)
46 _,.,.._ WHITE F_t-IOTO,GRAP_

BLA(
Figure 41 - Damage of AS4/PEEK, (0,90)16s at T., I. E. - 115J ($0X)
Damage at T_, I.E. of 280 (J) extended to the edge of the samplebut was confined to the midsection (Fig.36c) whereas in the 3501-6
matrix laminate the damage spread more or less uniformly.
Extensive fiber breakage was observed (Fig.42).
Figure 42 - Damage of AS4/PEEK, (0,90)16s at z; I. E. = 280J ($0X)
47

A$4/PEEK (+45! Laminate: Stiffnesses and percent transferred
energy vs T. I.E. are presented in Fig 43. In the initial plateau, thestiffness was about 3000 N/mm which was less than for the (90/0)
orientation but extended over a wider range of _, I.E. Then thestiffness started to decrease at a higher energy absorption but the
rate of decrease was lower.
4OO0D
=tL. .. %
"_ 2000 m_
U3
1000
0 m I I I I
0 I_ 2_ 3_
5".I.E.O)
Figure 43A - Stiffness vs cumulative Impact energy for AS4/PEEK, (+45)1ss
48
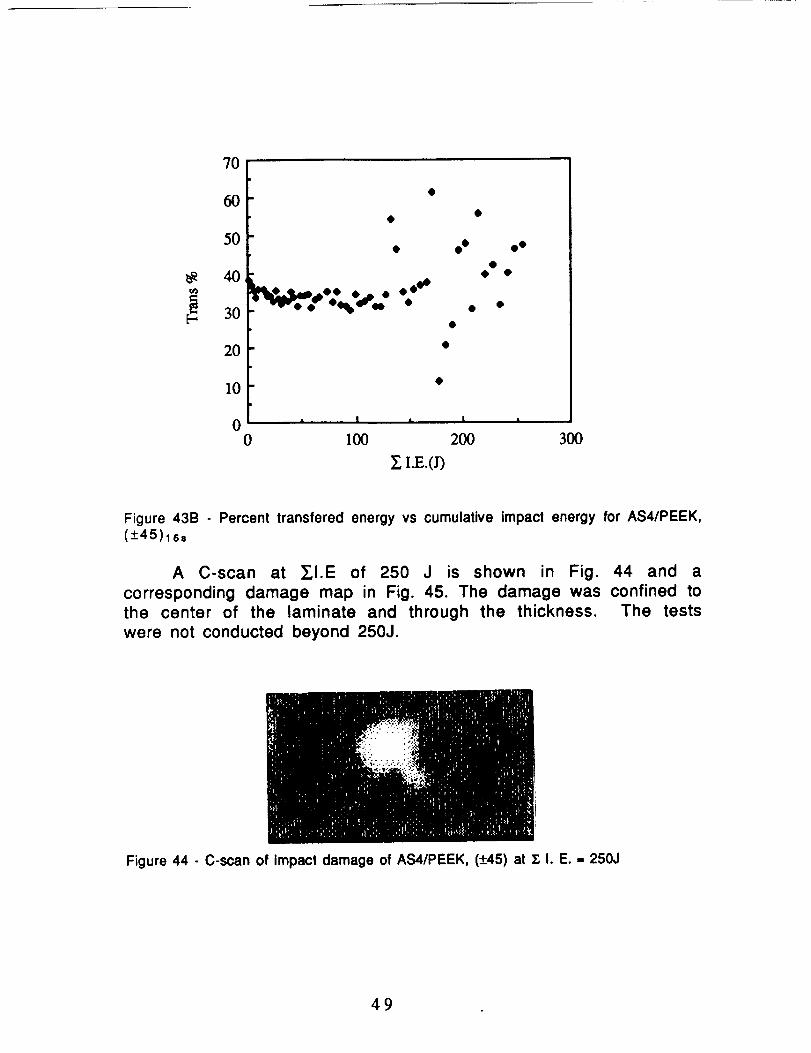
7O
60
50
_. 40
30
20
10
00
• 0 0 0 °
0 ° •
• .
, I , I i
1_ 2_ 3_
ZI.E.(D
Figure 43B - Percent transfered energy vs cumulative impact energy for AS4/PEEK,(+-45)18,
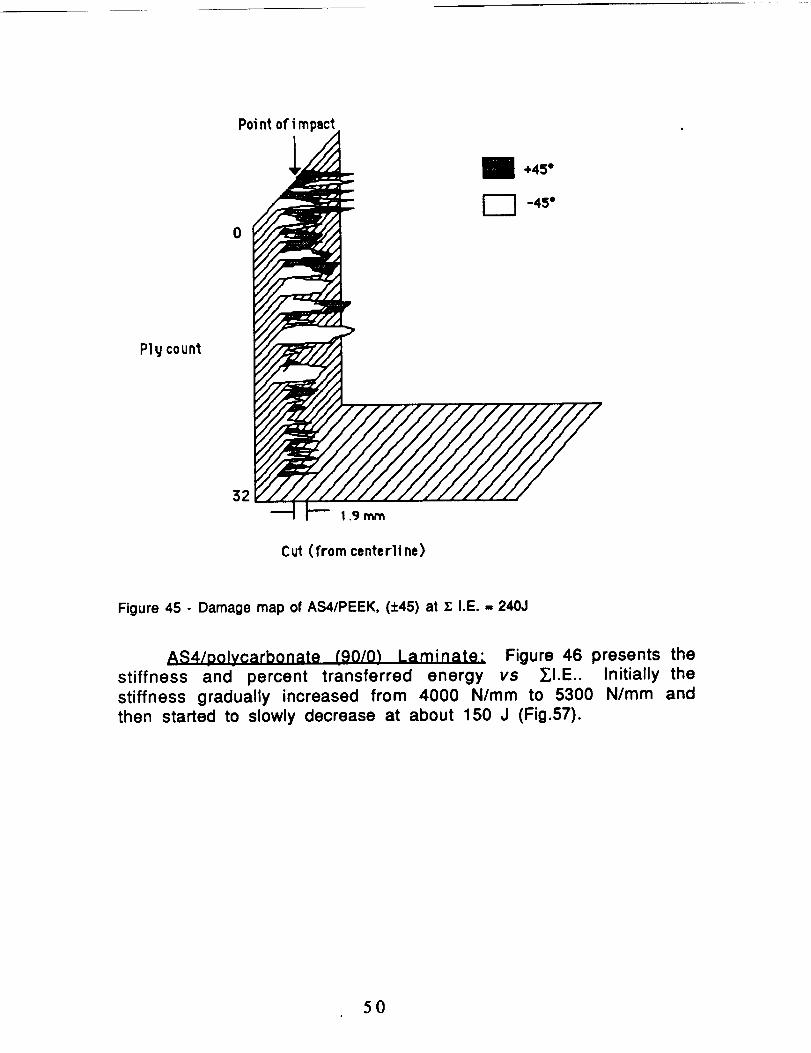
A C-scan at ZI.E of 250 J is shown in Fig. 44 and a
corresponding damage map in Fig. 45. The damage was confined tothe center of the laminate and through the thickness. The tests
were not conducted beyond 250J.
Figure 44 - C-scan of impact damage of AS4/PEEK, (+45) at Z; I. E. = 250J
49
Poi nt of i mpect
0
Ply count
32
Cut (from centerlJ ne)
Figure 45 - Damage map of AS4/PEEK, (+45) at 2; I.E. = 240J
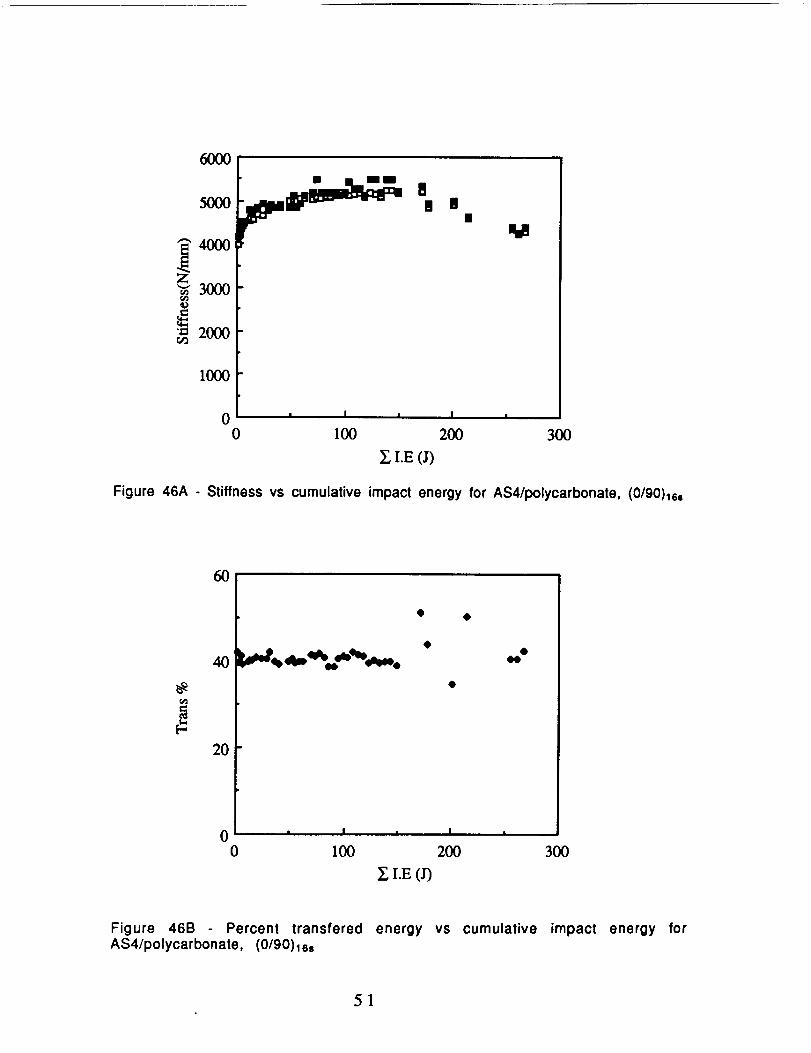
AS4/Dolvcarbonate (90/0_ Laminate: Figure 46 presents the
stiffness and percent transferred energy vs _I.E.. Initially the
stiffness gradually increased from 4000 N/mm to 5300 N/mm and
then started to slowly decrease at about 150 J (Fig.57).
SO
6OOO[ .'----',,,,"--,-%
I ',
" 4000
"_ 3O00o
"= 200003
1000
V
0 = I = I =
0 1_ 2_ 3_
3". I.E (J)
Figure 46A - Stiffness vs cumulative impact energy for AS4/polycarbonate, (0/90)lss
6O
4O
2O
0 • I , I ,
0 100 200 300
Z I.E (J)
Figure 46B - Percent transfered energy vs cumulative impact energy forAS4/polycarbonate, (0/90)1ss
51

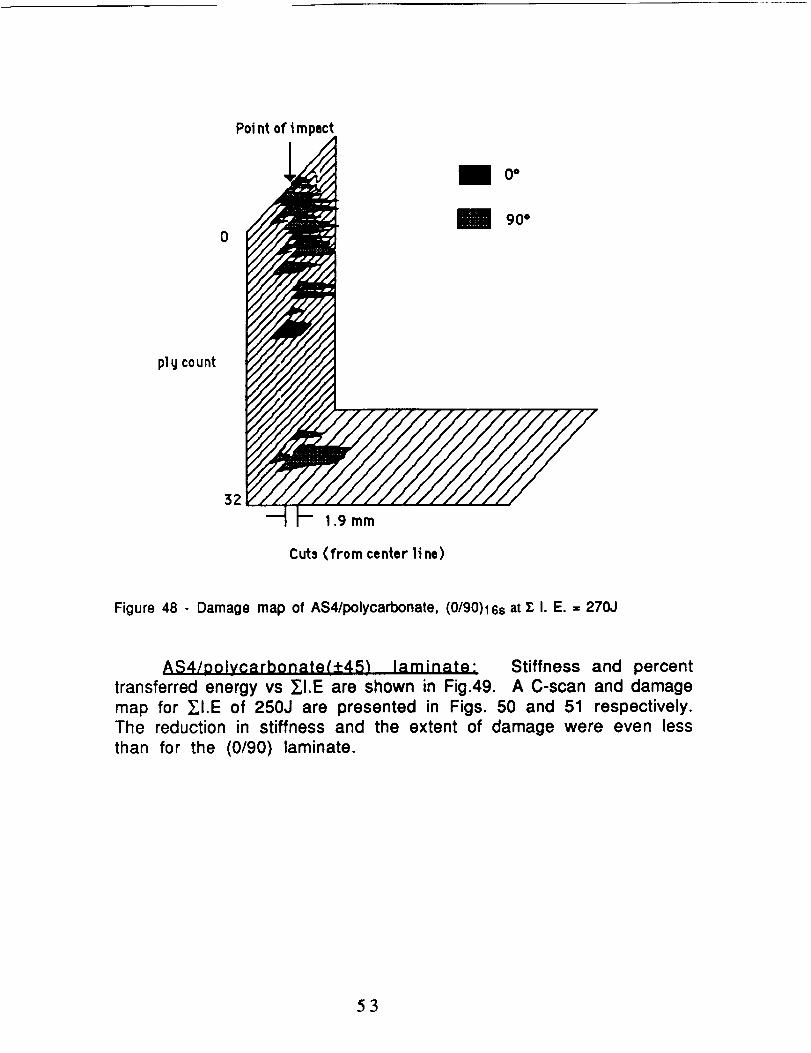
The C-scan and the damage map at ,T_,I.E. of 270 J are shown in
Figs.47 and 48 respectively. The damage was highly localized and
restricted to the front and the back plys. Some fiber breakage was
observed. This material appears to be more damage resistant thanthe other composite materials in these tests.
Figure 47 - C-scan of impact damage of AS4/polycarbonate, (0/90)16s at z I. E. =270J
52
Poi nt of i mpect
0
pig count
3Z
1.9 mm
Cuts (from center line)
Figure 48 - Damage map of AS4/polycarbonate, (0/90)16s at _, I. E. = 270J
A$4/Dolvcarbonate(+45 ) laminate: Stiffness and percent
transferred energy vs ,T,,I.E are shown in Fig.49. A C-scan and damage
map for T_,I.E of 250J are presented in Figs. 50 and 51 respectively.
The reduction in stiffness and the extent of damage were even less
than for the (0/90) laminate.
53

.5OOO
40OO
_3000v
r._
{ 20oor,/3
1000
0 , I i I ,
0 1_ 2_ 3_
5" I.E.(J)
Figure 49A - Stiffness vs cumulative impact energy for AS4/polycarbonate, (:t:45)1s,
50
4O
30
2O
10
0 t I , I ,
0 100 200 300
5' I.E.(/)
Figure 49B Percent transfered energy vs cumulative impact energy forAS4/polycarbonate (+45)16,
54
Ply count
Point of i mpect
32
1.9 mm
Cuts ( from center line)
+ 45"
- 45 °
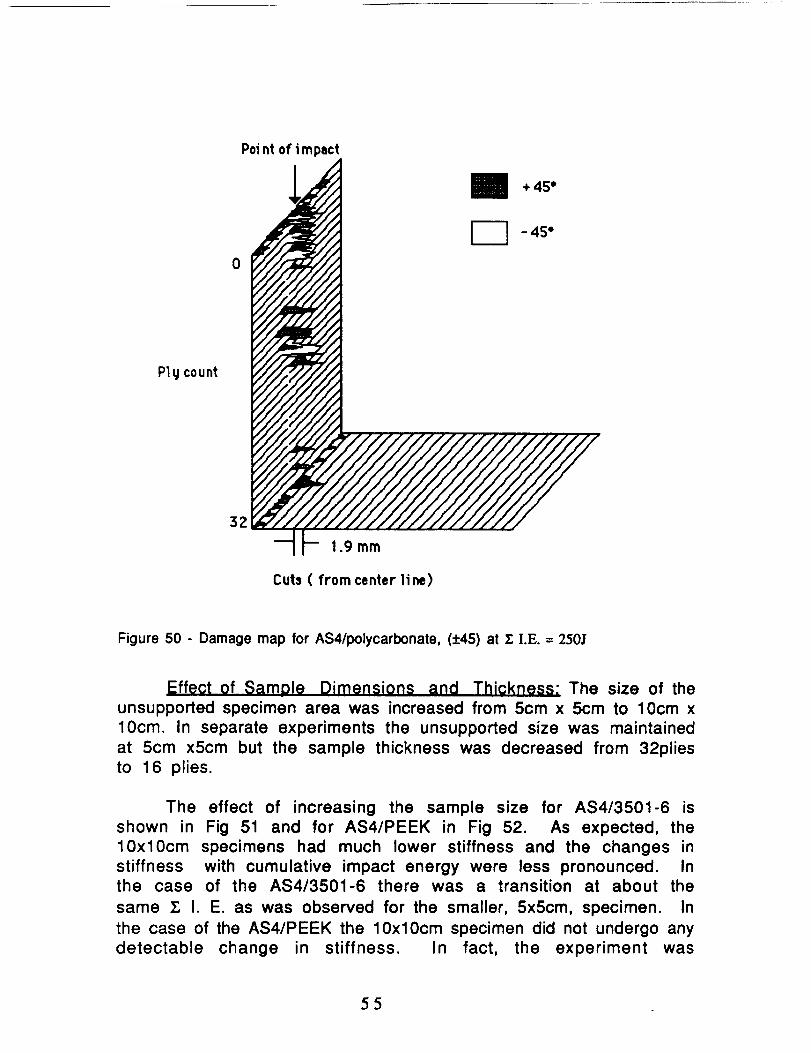
Figure 50 - Damage map for AS4/polycarbonate, (+45) at ]; I.E. = 250J
Effect of Sample Dimensions and Thickness: The size of the
unsupported specimen area was increased from 5cm x 5cm to 10cm x
10cm. In separate experiments the unsupported size was maintained
at 5cm x5cm but the sample thickness was decreased from 32plies
to 16 plies.
The effect of increasing the sample size for AS4/3501-6 is
shown in Fig 51 and for AS4/PEEK in Fig 52. As expected, the10xl0cm specimens had much lower stiffness and the changes in
stiffness with cumulative impact energy were less pronounced. Inthe case of the AS4/3501-6 there was a transition at about the
same T., I. E. as was observed for the smaller, 5x5cm, specimen. In
the case of the AS4/PEEK the 10xl0cm specimen did not undergo any
detectable change in stiffness. In fact, the experiment was
55

extended to almost 4000 J without any observable change in
stiffness.
6OOO
500O
3OOO
• 2000
1000
• 10xl0(cm)• 5 x 5 (cm)
_eeee •ee4e • 4_ • o• • •
%%.•., I i I i t i ,
0 50 100 150 200 250
5".I.E. (J)
Figure 51 - Comparison of stiffness vs x I. E. for plates of AS4/3401-6, (0/90}16swith unsupported dimensions of 5cm x5cm and 10cm x 10cm.
5OOO
4OO0
r=Q
o 2000
r,/31000
m m
...• ; ¢.:..,
m ==m
m 5x5 cm
• lOxlO arn
____• eeeeeeeee • e=eee
M
I I l
0 100 200 300 400
EI.E.
Figure 52 - Comparison of stiffness vs X I. E. for plates of AS4/PEEK, (0/90)16s withunsupported dimensions of 5cm x5cm and 10cm x 10cm.
56

60OO
5OOO
4000
3000
"= 2000
1000
0
== 16plies ]a 32 plies
a a¢= =a =a ===a=
m D
• QOQOOD
0 I ,
0 100 200
,Y,I.E.O)
Figure 53 - Comparison of stiffness vs cumulative impact energy for AS4/3501-6(0/90)s laminates having 16 plies and 32 plies
Decreasing the AS4/3501-6 specimen thickness from 32 plies
to 16 plies caused the initial change in stiffness to occur at a T.,I. E.
of about 5 J, Subsequently, there was a short plateau in stiffness(second stage) followed by a transition to a lower stiffness (third
stage). Evidently, reducing the specimen thickness results in the
same sequence of damage modes but over a much shorter range of
cumulative impact energy than for the thicker, 32 ply specimen.
A damage map of a 16 ply specimen from the second stage (T.,
I.E. = 10J) is shown in Fig. 54. The damage was through the
thickness of the specimen and had a conical profile..
57

Point of impact
PI 9 count
161.9 mm
Cut (from centerline)
Figure 54 - Damage map for AS4/3501-6 (0190)8=at T,,I. E. = l OJ
Fatioue Testino vs RIlE Testina: Specimens of AS4/3501-6
were tested in a "fatigue" mode in which the specimen was impacted
repetitively but at a constant impact load. The results of these
tests are compared with the repetitive impact with increasing load
(RILE) in Fig 55. In the fatigue test, the stiffness dropped after thefirst impact to the second stage level of the RIlE test but then
remained constant with further loading.
58

.° !
i 4000 t!_ l • f=dq_ I
3OOO
2OOO
0 100 200 300 400
_i.g.
Figure 55 - Comparison of the change in stiffness vs cumulative impact energy for
fatigue loading vs repetitive impact with increasing energy (RILE) for AS4/3501-
6(0/90)1 6s.
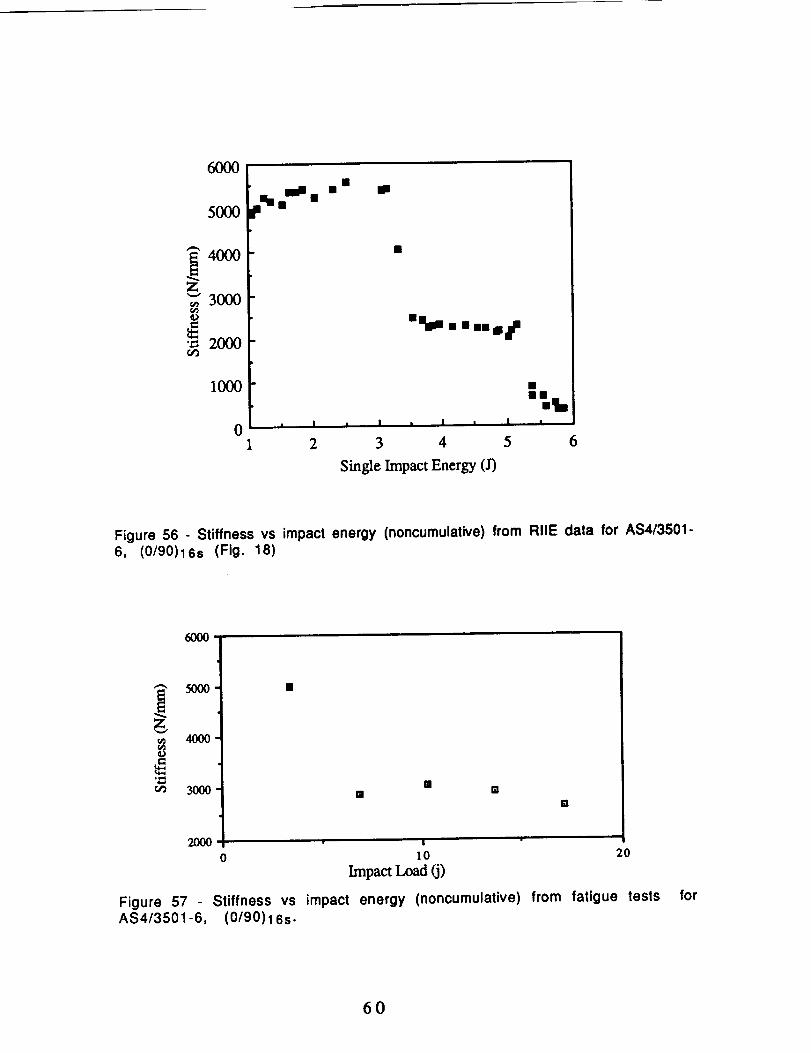
These data can be viewed from a different perspective by plottingthe change in stiffness with actual impact energy rather than withcumulative impact energy. The data plotted in Fig. 56 are from theRIlE testing and the data plotted in Fig. 57 are from the fatiguetesting A comparison of Figs.56 and 57 show that the loss instiffness occurs at about 3 J whether this level of energy is arrivedby incrementally increasing the impact load (RILE test) or is theinitial load in the fatigue test.
59
6OOO
5OOO
4000
30OOr,_
•= 2000
1000
I
• i_I i • i•Bt
0 . I , I i I i ' "
1 2 3 4 5 6
Single Impact Energy (J)
Figure 56 - Stiffness vs impact energy (noncumulative) from RIlE data for AS4/3501-6, (0/90)16s (Fig. 18)
60oo
50o0
4ooo¢)
u_ 3000
2O0O
II B
|
10
Impact Load (j)
Ii
20
Figure 57 - Stiffness vs impact energy (noncumulative) from fatigue testsAS4/3501-6, (0/90)16s.
for
6O

Figure 58 shows the fatigue data vs the RIlE data for
AS4/PEEK (90/0)lee. In the fatigue test, even after 1200(J), the
stiffness did not drop significantly compared to the RIlE data.
However, the initial decline in fatigue stiffness was relatively
gradual compared to the AS4/3501-6 fatigue data (Fig. 55)
4OOO
3000- •v •
2000 •
]000
0 ' _' '0 500
• RDTE• FATIGUE
i I ,
Figure 58 - Comparison of the change in stiffness vs cumulative impact energy forfatigue loading vs repetitive impact with increasing energy (RILE) forAS4/PEEK(0.90)I 6s
STATIC LOADING
A comparison was made between dynamic impact damage vs
damage resulting from static three point bend loading. The strainrate of the static test was 0.005mm/sec.. The loader was
hemispherical with a tip having the same radius as the impact
loader (0.5cm) and the specimens were supported identically as in
the dynamic tests. Load was applied to failure and from the
resulting load displacement plot, specimens were loaded to key
points along the initial load displacement curve and then C-scanned,
potted, sectioned and the sections examined to develop damage
6]

maps. These tests were performed on (0/90)16s panels of AS4/3501-
6, AS4/PEEK and AS4/polycarbonate.
AS4/3501-6 Three distinct regions were observed in the
static load displacement plot (Fig.59). In the first region, the
stiffness was 5000 N/mm, which was similar to the stiffness (max
load/max deflection) in the dynamic test (Fig 18). This stiffness
abruptly decreased to 2300 N/mm, which was approximately thesame as the stiffness of the second region in Fig 18. The third stagestiffness was 500 N/mm.
_ooo I l I I
6000
5000
4000
30DOJ
2OOO
1000
1 I I I-ZOO00 1 2 3 4
DZSPLACENENT0410
Figure 59 - Static force-displacement plot for AS4/3501-6, (0/90)16s
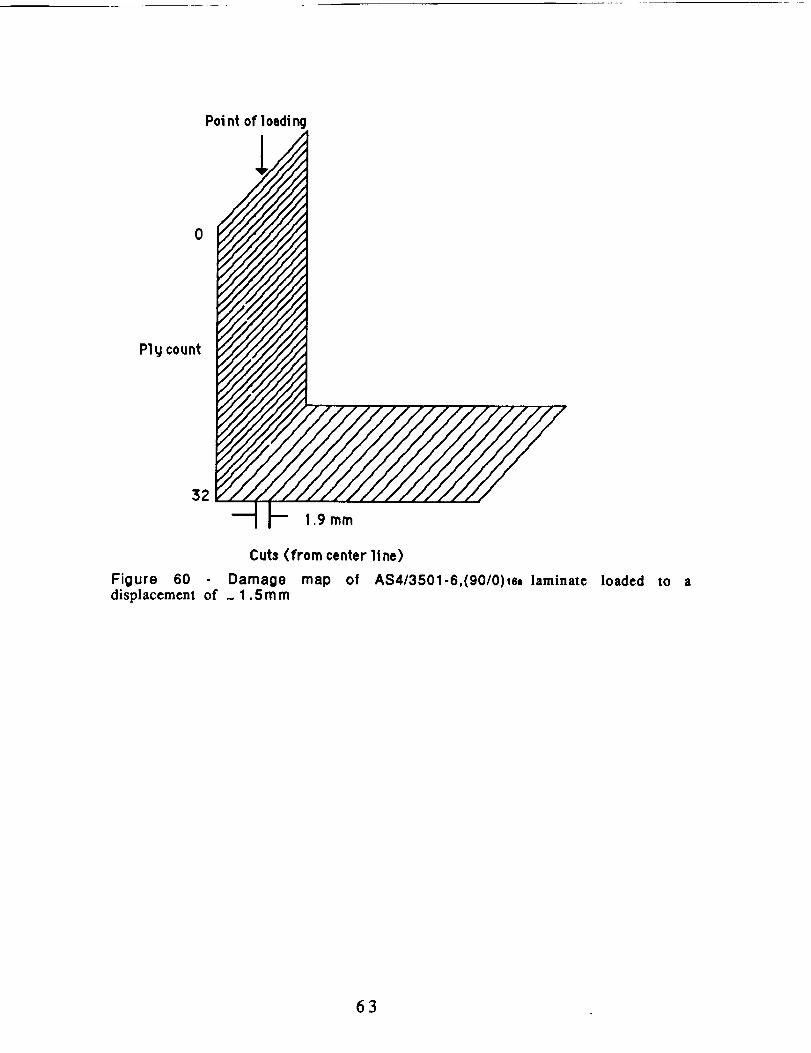
The damage patterns from C-scans were similar to those of
the dynamic test (compare Fig. 59 with Fig. 21). Damage maps of
each of the stages from the static test are presented in Figs. 60-62.
In the first damage stage of the static test, there was no contact
damage on the front surface. In the second stage of this test, the
pattern of damage was the same as that for dynamic loading, i.e.,
through the thickness and consisting of transverse cracking anddelamination
62
Point of Ioedi ng
0
Ply count
32
Figure 60
1.9 mm
Cuts (from center li ne)
Damage map of AS4/3501-6,(90/0)16=displacement of ~ 1 .Smm
laminate loaded tO a
63

Pot nt of loedt ng
P11j count
32
1.9 mm
Cuts (from center 1i ne)
Figure 61 Damage map of AS4/3501-6,(g0/0)ls= laminate loaded to adisplacement of - 3 m m
64
Poi nt of loadtng
90°
P19 count
321.9mm
Cuts (from center line)
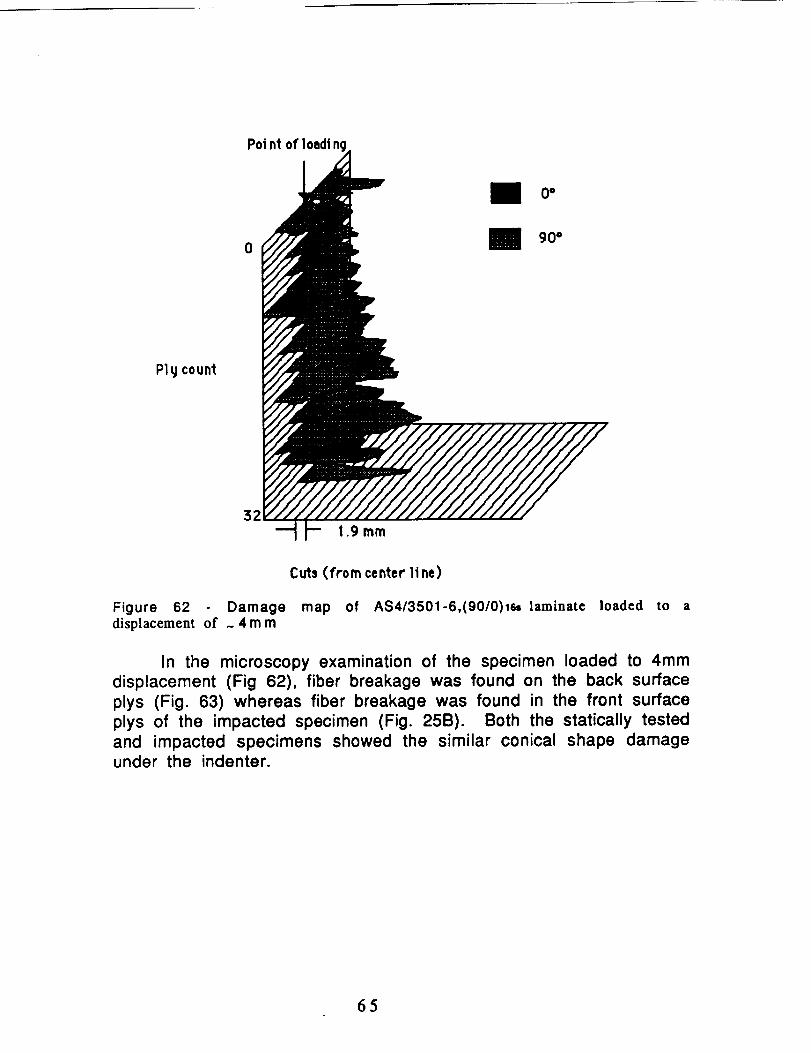
Figure 62 - Damage map of AS4/3501-6,(90/0)1e, laminate loaded to adisplacement of - 4 m m
In the microscopy examination of the specimen loaded to 4mm
displacement (Fig 62), fiber breakage was found on the back surface
plys (Fig. 63) whereas fiber breakage was found in the front surface
plys of the impacted specimen (Fig. 25B). Both the statically tested
and impacted specimens showed the similar conical shape damageunder the indenter.
65
Figure 63 Photomicrograph of backside damage of static loaded AS4/3501-6,(90/0)1ss laminate loaded to a displacement of ~ 4mm
Figure 64 is the static force-displacement curve forAS4/3501-6,(+45) in the static test. The stiffness of the firstregion was around 3300 N/mm which was the same as the stiffnessof the first region in the dynamic tests. Subsequently, the stiffnesswas about 1700 N/mm until the displacement reached 5 mm atwhich point the force started to drop until 7.5 mm and C-scanningindicated that the damage had reached the specimen edges.
AS41PEEK: Figure 65 is the load displacement plot forAS4/PEEK (0/90)16s. There is an initial constant stiffness followedby a more or less continuous decrease in stiffness that becomesvery pronounced after 4.5 mm. The shape of the plot in Fig.65 isclearly different from that for AS4/3501-6,(0/90), see Fig.59.Damage maps at three positions along this load-displacement curvewere constructed (Figs. 66-68).
BLAC_ AND WHITE PHOTOGRAPH
66

m
1, I. ! ! I00 ! 2 11 4 S II
D; SlILACEI4RNTa41o?
Figure 64 - Static load-displacement plot for AS4/3501-6 (0/90)16s
8OOO
5000
4OO0
2DDO
JDOD
o I ] I I 11 2 3 4 5 6
D] SPI.AC1D4E_TO4H)
Figure 65 - Static load displacement curve for AS4/PEEK (0/90)16s
67

Poi nt of l oadi ng
0
Ply count
32
1.9 mm
Cuts (from center line)
Figure 66 - Damage map for an AS4/PEEK,(90/0)I_ laminate loaded to about 2.5mmdisplacement
68

PoJnt of loadJ ng
pl g count
32
! .9 mm
Cuts (from center li ne)
Figure 67 - Damage map for an AS4/PEEK,(90/0)le= laminate loaded to about 4mmdisplacement
69

0
Point of loadin
pl9 count
52
1.9ram
Cuts (from center line)
Figure 68 - Damage map for an AS4/PEEK,(90/0)lss laminate loaded to about 5.5mmdisplacement
No damage was found in the first linear region of the static
test (Fig. 66). The second damage map (Fig.67) was drawn after theinitial drop in force and showed transverse cracking near the front
and back surfaces. In addition there was a noticeable bulge in the
back surface of the specimen. This type of deformation had not been
observed for any of the 3501-6 laminates.
The stiffness (-3500 N/mm) in the initial region in the static
load displacement plot was less than that of the impact test (-4300,
Fig 34A). In the static test at 5.5mm displacement both fiber-
breakage and also fiber displacement were observed (Fig.69).
7O
Figure 69 - Photomicrograph of AS4/PEEK,(90/0)ls= laminate loaded to about 5.5mmdisplacement showing displacement of fiber plys
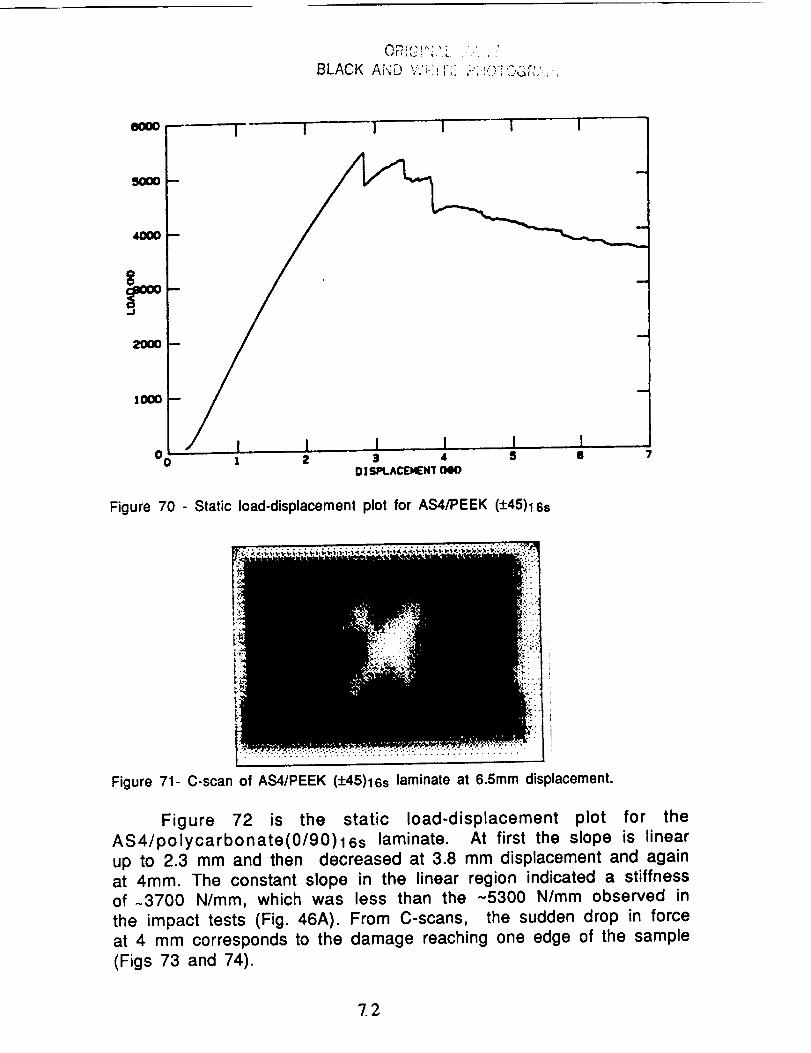
Figure 70 is the static load displacement plot for AS4/PEEK,(±45)16s. The stiffness of the first linear region was -2200 N/mm
which was less than the stiffness observed in the dynamic test(-3000 N/mm, Fig 43A). After the initial drop in load, the force
decreased continuously. The damage was still inside the sample evenat 7mm displacement (Fig.71).
3LACK AND WHilE PHOTOGRAJmI:.t'
7]
BLACK Ai'4D '.,*'_.'i-'_]-;; :-,,, .... _',"'
_OO ''
_O m
41000--
2000 -
tOOO --
I I I i I I
I I I I !0 0 ! 2 3 4 S
O; SPt._CEI4ENT OeO
Figure 70 - Static load-displacement plot for AS4/PEEK (+45)16s
Figure 71- C-scan of AS4/PEEK (+45)16s laminate at 6.5mm displacement.
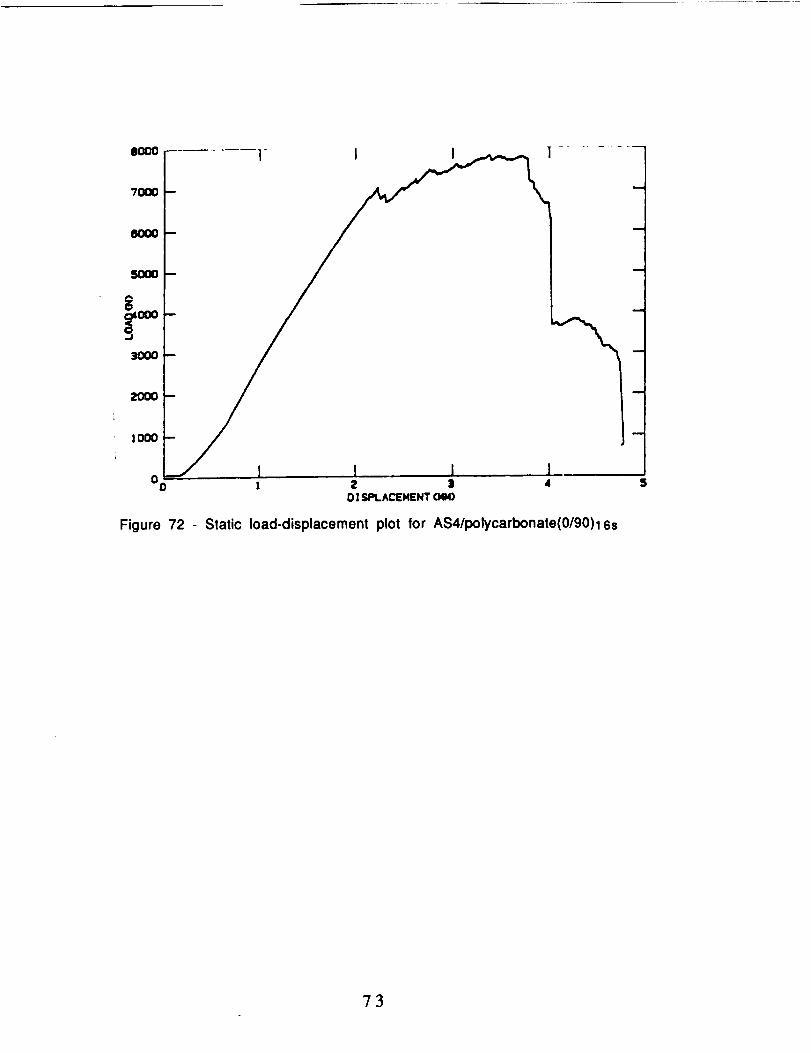
Figure 72 is the static load-displacement plot for the
AS4/polycarbonate(0/90)16s laminate. At first the slope is linear
up to 2.3 mm and then decreased at 3.8 mm displacement and again
at 4mm. The constant slope in the linear region indicated a stiffnessof ~3700 N/mm, which was less than the ~5300 N/mm observed in
the impact tests (Fig. 46A). From C-scans, the sudden drop in forceat 4 mm corresponds to the damage reaching one edge of the sample
(Figs 73 and 74).
?.2
1113OO
70OO
60OO
5OOO
ooo
31OOO
2OOO
1000
0 o
I I I
N
I 2 | 4 5D! SPL.ACE'NENTO4M)
Figure 72 - Static load-displacement plot for AS4/polycarbonate(0/90)16s
73
0
0 o
PI y count
321.9 mm
Cut (from centerlJ ne)
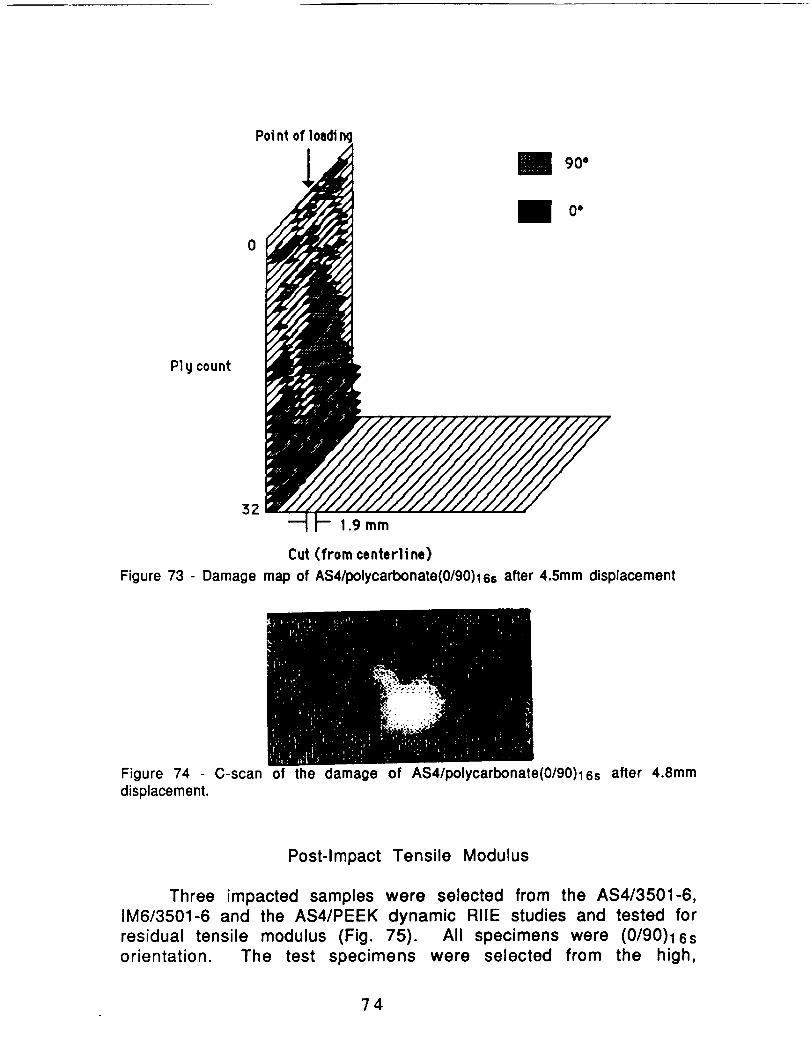
Figure 73 - Damage map of AS4/polycarbonate(O/90)16s after 4.5ram displacement
Figure 74 - C-scan of the damage of AS4/polycarbonate(0/90)16s after 4.8mmdisplacement.
Post-Impact Tensile Modulus
Three impacted samples were selected from the AS4/3501-6,
IM6/3501-6 and the AS4/PEEK dynamic RIlE studies and tested for
residual tensile modulus (Fig. 75). All specimens were (0/90)16s
orientation. The test specimens were selected from the high,
?4
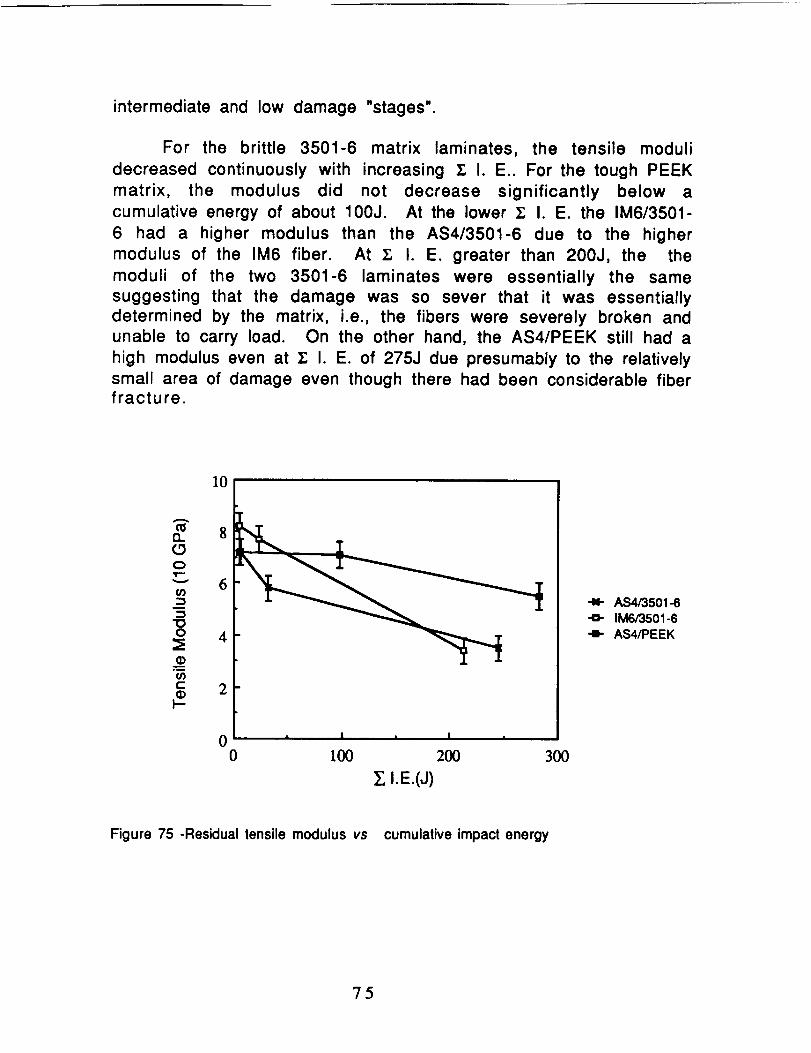
intermediate and low damage "stages".
For the brittle 3501-6 matrix laminates, the tensile moduli
decreased continuously with increasing T., Io E.. For the tough PEEK
matrix, the modulus did not decrease significantly below a
cumulative energy of about 100J. At the lower 7., I. E. the IM6/3501-
6 had a higher modulus than the AS4/3501-6 due to the higher
modulus of the IM6 fiber. At T., I. E. greater than 200J, the the
moduli of the two 3501-6 laminates were essentially the same
suggesting that the damage was so sever that it was essentially
determined by the matrix, i.e., the fibers were severely broken and
unable to carry load. On the other hand, the AS4/PEEK still had a
high modulus even at I; I. E. of 275J due presumably to the relatively
small area of damage even though there had been considerable fiberfracture.
10
a. 8
6
if)¢-
F--
4
00
i , I
100 200
7_,I.E.(J)
3O0
AS4/3501-6
•o- IM6/3501-6
-i- AS4/PEEK
Figure 75 -Residual tensile modulus vs cumulative impact energy
?5

DISCUSSION
From the stiffness vs cumulative impact energy and the
percent of transferred energy vs cumulative impact energy, two andsometimes three distinct stages of behavior were observed for the
AS4 /3501-6 and IM6/3501-6 laminates. During the first stage, the
stiffness was essentially constant as was the percent of
transferred energy. The damage observed in this stage was primarily
transverse cracking in the top layers.
After an abrupt decline in stiffness, a second stage of
relatively constant stiffness was observed. The onset of this stage
was always accompanied by a peak in the transferred energy. The
type of damage observed was a network of delamination and
transverse cracking which extended through the thickness of the
specimen.
This second state was sometimes followed by another abrupt
drop in stiffness followed by a third plateau of relatively constantstiffness. The transferred energy was greater and even more erratic
than for either the first or second stages. C-scan and damage
mapping indicated that the damage progressed to the specimen edges
during this third stage. In addition, some fiber breakage wasobserved. The only difference noted between the AS4 and the IM6reinforced laminates was that the stiffness of the IM6/32501-6
plates were greater due to the higher modulus of the IM6 fiber.
The stiffness plots and the percent of transferred energy for
the thermoplastic matrix laminates were distinctly different fromthe 3501-6 laminates. In the case of the thermoplastics, there was
a progressive decrease in stiffness with cumulative impact energy.In addition, the level of transferred energy was consistently higher
and variable from one impact to the next. C-scans and mappingindicated that essentially the same type of damage was occurring as
for the 3501-6 matrix: initially a few delaminations and transverse
cracks at the top and bottom sides of the plate which had little
effect on the stiffness, (in fact, some of the data suggest a small
increase in stiffness). Subsequently, damage was through the
thickness and then extended to the plate edges. However, these were
more progressive events than in the case of the thermosetting
materials.
76

These differences in the behavior of the thermoplastic matrix
and the thermosetting matrix laminates are probably due to the
higher resistance of the thermoplastics to the extension ofdelamination. Once the stiffness begins to decline, the damage in
the thermoplastic materials is confined to a relatively narrow
cylindrical region under the point of impact. With continued
impacting, this region undergoes even further damage along with
some extension toward the specimen edges.
In the case of the thermosetting matrix laminates, the
development of through the thickness damage is followed byextensive delamination from the center toward the specimen edges.
In a comparison of the RIlE test with the simple fatigue test,
the impact energy is increased incrementally in the RIlE test
whereas in the fatigue test, the energy is constant for each
successive impact. The fatigue study was done using an impact
energy of 3.2J and after the first impact the laminate stiffness wasreduced from about 5000N/ram to about 2000N/mm. In the RIlE test
the cumulative energy reached 100J before the stiffness dropped
from 5000 to 2000N/ram (Fig.18). However, data from Figure 18 are
replotted in Fig.76 but showing the actual energy at each impact. As
in the fatigue test, the drop in stiffness occurred at an impact
energy of about 3J. It would appear that some specific damage
condition occurs at this impact energy level.
Continuing the fatigue test at 3J for each impact resulted inno further change in stiffness. On the other hand, in the continuation
of the RIlE test, a second change in stiffness occurred at about 5J
(Figure 76). The fact that through the second stage the stiffness is
relatively constant suggests that whatever damage is occurring, it
is not sufficient to alter the plate stiffness. None of less, damage
is occurring as evidenced by the increase in transferred energy. The
fact that the transferred energy varies considerably from one
impact to the next, suggests that the amount of microdamage that
occurs for a given impact varies considerably. One impact may
result in only a minor amount of cracking but creates a condition
that precipitates more extensive damage during the next impactevent.
77

5000 limll I II
aiD
_ 4(X)O
3000r_
•= 2000
1000
m_ • • mm'mt
0 , m m I a I m l
1 2 3 4 5
Single Impact Energy (J)
|
6
Figure 76 - Stiffness vs single impact energy for AS4/3501-6
=rl,=,A _tl_ _A _z =t m mI .........
Department of Materials Science and Engineering
304 EMRO BuildingSalt Lake City, Utah 84112
(801) 581-6863

laminates in the static tests were lower than from the impact
testing and the damage modes were also different. This observationcan be interpreted in two ways. One is membrane deformation andthe other is viscoelastic behavior. In ductile materials, deflection in
the static test occurs not only by contact and bending deformation
but also by membrane deformation, especially in a plate supported at
two edges.
The fact that membrane deformation was involved in the PEEK
composite is evident from the C-scan results. In the impact test,damage was confined to the contact region between impactor and
sample (Fig.36c). In the static test, large amounts of damage can be
found in the edge region of the sample (Fig.68) which are very likelythe result of membrane deformation.
The other explanation for the differences in stiffness is theviscoelastic characteristic of the thermoplastics. The low strain
rate of the static test (0.005mm/sec) results in a lower stiffness
than at the high strain rate impact loading.
Also the microfracture patterns from static test and impact
tests are different for thermoplastic matrix. In the static testing of
the thermoplastic materials, not only was there fiber breakage but
also significant displacement of the plies (Fig.69). In the case of the
polycarbonate laminate, the static damage was more restrictedthan for the PEEK laminate. In general, the polycarbonate laminates
were more damage tolerant than the PEEK. Part of the reason for this
is that the thickness of the polycarbonate sample (5.12 mm) was
greater than that of the PEEK sample (4.16 mm). However, there maybe more than thickness involved.
The thermoplastic laminates sustained considerable "plastic"
damage, e.g. the development of a bulge on the back surface without
any associated delamination or fiber breakage. This type of damagedid not occur in the case of the 3501-6 matrix laminates presumably
because of the lower shear yield strength of polycarbonate and PEEK
compared to 3501-6.
The post-impact tensile modulus results (Fig. 75) are at first
glance somewhat surprising. One would have thought thatdelamination and transverse cracking, that dominate the 3501-6laminates would be less severe on tensile stiffness than the fiber
breakage sustained by the PEEK laminate. In fact, the PEEK laminate
?9
suffered less reduction in modulus than the AS4/3501-6 and the
IM6/3501-6 laminates. It would appear that the extent of damage
rather than the type of damage is more important in this post-impact test.
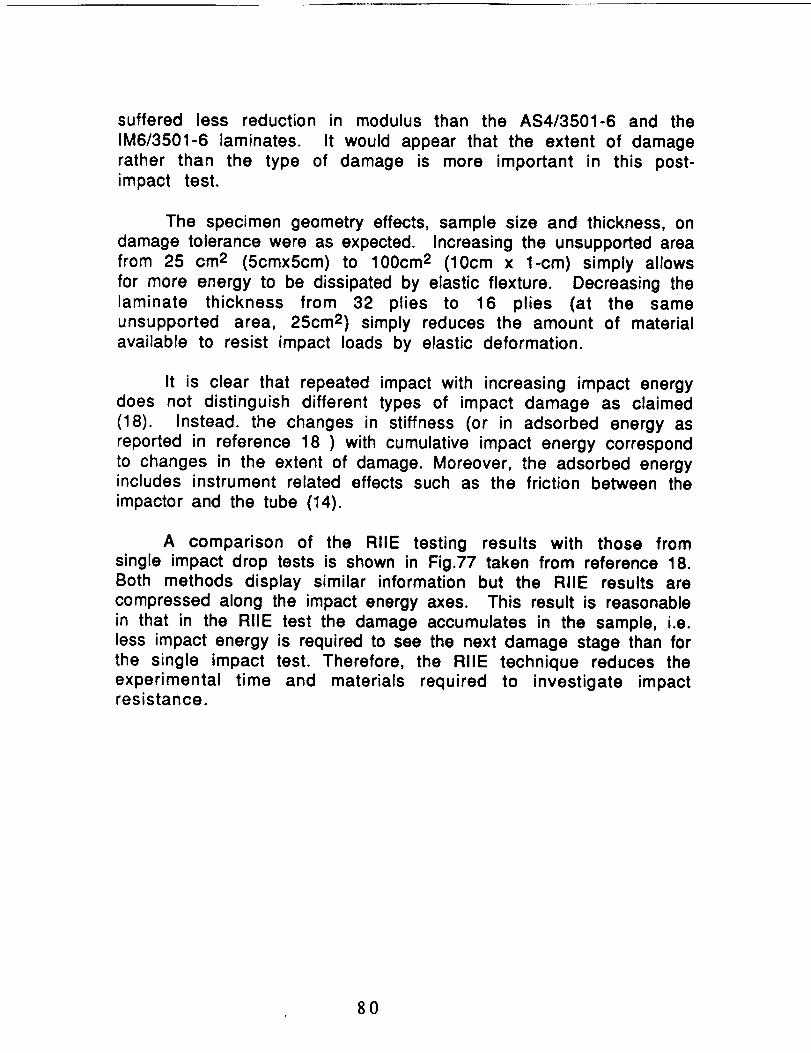
The specimen geometry effects, sample size and thickness, on
damage tolerance were as expected. Increasing the unsupported area
from 25 cm2 (5cmx5cm) to 100cm 2 (10cm x 1-cm) simply allows
for more energy to be dissipated by elastic flexture. Decreasing the
laminate thickness from 32 plies to 16 plies (at the sameunsupported area, 25cm2) simply reduces the amount of material
available to resist impact loads by elastic deformation.
It is clear that repeated impact with increasing impact energy
does not distinguish different types of impact damage as claimed
(18). Instead. the changes in stiffness (or in adsorbed energy as
reported in reference 18 ) with cumulative impact energy correspond
to changes in the extent of damage. Moreover, the adsorbed energyincludes instrument related effects such as the friction between the
impactor and the tube (14).
A comparison of the RIlE testing results with those fromsingle impact drop tests is shown in Fig.77 taken from reference 18.
Both methods display similar information but the RIlE results are
compressed along the impact energy axes. This result is reasonable
in that in the RIlE test the damage accumulates in the sample, i.e.
less impact energy is required to see the next damage stage than for
the single impact test. Therefore, the RIlE technique reduces the
experimental time and materials required to investigate impactresistance.
8O

mm3.
1'
6 °
! Eo-"°o i z 3J
impoctenergy
Figure 78 - Comparison of repetitive impact with increasing energy vs single droptesting (reference JS)
However, the RIlE technique has a problem in terms of data
interpretation. For every impact the impact conditions are changed.For example, the area being impacted is already damaged so that the
conditions of load input are different than if a fresh sample is usedeach time.
CONCLUSIONS
The microdamage that occurs for Mode I and Mode II
delamination was examined by potting delaminated specimens in a
clear epoxy, sectioning through the damage, polishing the cut
sections and examining using light microscopy.
In the case of Mode I delamination of unidirectional CFRP
composites, the major observation was fiber bridging including
large ligaments or fiber bundles which have a significant effect onthe interlaminar fracture energy and on the apparent crack opening
displacement. The study of Mode II delamination of unidirectionallaminates revealed a very narrow crack opening with only occasional
fiber bridging.
81

The Mode II crack propagation in a (0,90) laminate was
predominantly within the 0 o plies but near the ply/matrix boundary
Impact testing by repetitive impacts with increasing energywas studied and it was found that this technique does not discern
changes in the type of damage with increasing cumulative impact
energy. Instead, the changes in the impact response, notably
stiffness, are the result of changes in the extent of damage.
In the case of laminates based on a brittle thermoplastic
matrix, 3501-6, there were distinct changes in stiffness that
corresponded to the development of through the thickness damage
and then to the extension of the damage to the specimen edges. In
the case of two thermoplastic matrix materials, PEEK and
polycarbonate, the changes in stiffness were not as abrupt as for the
thermoset but instead there was a gradual decline in stiffness. None
the less, the damage progressed in the same manner; first throughthe thickness damage then extension of the damage to the specimen
edges.
Static flexure testing of the 3501-6 matrix laminates
resulted in the same changes in stiffness and extent of damage as
observed in the dynamic tests. Static testing of the thermoplastic
matrix laminates gave results somewhat different than the dynamictests. These differences were attributed to the lower modulus
thermoplastic laminates undergoing membrane deformation in the
static tests and the greater time dependent viscoelastic nature of
the thermoplastics compared to the thermoset.
Literature references suggest that the repetitive impact test
gives similar results as for single impacts of fresh specimens.
However, interpretation of the repetitive impact test results are
difficult, especially in terms of the micromechanics of impact
damage, since for each sequential impact event the condition of thespecimen surface changes so that conditions of load input into the
specimen are undefined.
REFERB'qCES
1. O'Brien, T. K., "Characterization of Delamination Onset and Growth
in a Composite Laminate, " in Damage in Com oosite Materials, ASTM
STP 775, K. L. Reifsnider, ED., American Society for Testing and
Materials, Philadelphia, 1982, p. 140
82
2. Sinclair, J. H. and Chamis, C. C., "Compression Belhavior of
Unidirectional Fibrous Composites," NASA Technical Memo 82833,
1982, p. 19
3. Hibbs, M. F. and Bradley, W. L., "Correlations Between
Micromechanical Failure Processes and the Delamination Toughness
of Graphite/Epoxy Systems," in Fractography of Modern Engineering
Materials, J. Eo Masters and J. J. Au, Eds., ASTM STP 948, American
Society for Testing and Materials, Philadelphia, 1982, p. 68
4. O'Brien, T. K., Raju, I. S. and Garber, D. P., "Residual Thermal and
Moisture Influences on the Strain Energy Release Rate Analysis of
Edge Delamination," J. Comp. Technology and Research, Summer1986, American Society for Testing and Materials, Philadelphia, p.37
5. Toughened Comoosites N.J. Johnston, Ed., ASTM STP 937,
American Society for Testing and Materials, Philadelphia, 1987
6. Bascom, W. D.; Boll, D. J.; Weidner, J. C.; and Murri, W. J.; "A
Microscopy Study of Impact Damage of Epoxy-Matrix Carbon Fiber
Composites," J. Mat. Sci., 21 2667(1986)
7. Guynn, E. G., Bradley, W. L., "A Detailed Investigation of the
Micromechanisms of Compressive Failure in Open Hole Composite
Laminates," J. Comp. Mat., 23479, 1989
8. Bascom, W. D., Bitner, J. L., Moulton, R. J., and Siebcrt, A. R., "The
Inter]aminar Fracture of Organic-matrix, Woven Reinforcement
Composites," Composites 11 9 (1980)
9. Bascom, W. D., Bullman, G. W., and Hunston, D. L., Proceedings, 29th
National SAMPE Symp., Reno, 1984
10. Dugdale, D. S., J. Mech. Phys. Solids, 8 100 (1960)
11. Russell, A. J. and Street, K. N., "Moisture and Temperature Effectson the Mixed-Mode Delamination Fracture of Unidirectional Graphite
Epoxy, ' ASTM STP 876, 1985 American Society for Testing and
Materials, Philadelphia, p. 349
12. Stellbrink, K., "The Repetitive Dropweight Test with Increasing
83

Energy," Wissenschaftlich-technische Tagung :12, Verstarkete Paste'88, Berlin, DDR , 1988 p.21
13. P.Zoller, Polymer Testing, 3,197(1983)
14. P.O.Sjoblom, J.T.Hartness, T.M. Cordell "On Low Velocity Impact
Testing of Composite Materials " J. of Composite Materials 22 30
(1988)
16.. Stellbrink, K " On the Behavior of Impact Damaged CFRP
Laminates" Fiber Science and Technology 18 81(1983)
17. Akoi, R and Stellbrink, K "The Influence of Defects on the
Behavior of Composites" Proc. 4th Int. Conf. Composite Materials,
p12.1(1980)
18. Stellbrink, K., "Effect of Hybridization on Impact Behavior of
CFRP Laminates.". DFVLR Report IB 435-85/22 (1985), Stuttgart,
84

APPENDIX 1
85
FOLDOUT ElSE
ORIGINAL _,",-'_-
BLACK AND WHITE PHOTOGRAPH
Figure A1 - Photomicrographs of a transverse section througha delamination

ORIGIN/kL _,_,GE
[3LACK AND wHtTE PHOTOGRAPH

C_
C_
I'-
zc_
-=..3:,
m
-_- C"4
--4

oo
c_
ooim4
c_
IDlm4
o
q_c_
C_

APPENDIX 2
COMPUTER PROGRAM FOR PLOTTING DAMAGE MAPS c
L- ¸¸)
c Requires Apple Computer, Inc Macintosh Plus TM or higher
86

COMPUTER PROGRAM FOR PLOTYING DAMAGE MAPS
Written in True Basic TM using the Run Time Package TM.
library "3dlib*"
library "Pictlib*"
call Copy_printer(I)
dim damCut(32,40),damage(32,40),pangle(32),npts(32)
open #3: NAME "PC (3s)", ACCESS input, Organization text
input #3: nplies,ncuts,dmax
for i=l to nplies
input #3 :plyn,pangle(i),npts(i)
for j=l to npts(i)
input #3:damCut(plyn,j),damage(plyn,j)
next j
next i
close #3
let plyTick=l
let dTick=l
let angle=45
let xs=.8
let ys=l.4
do
clear
print "AS4/Polycarbonate (90/0) STAGE 1 "call ScaleParaWindow( 1 ,dmax, 1,ncuts, 1 ,nplies,workS)
call SetViewPlane3(0,1,0,work$)
call Cabinet3(angle,work$)
Ask Window xl,x2,yl,y2
let xm=(xl +x2)/2
let xmin=xm-(xm-xl)/xs
let xmax=xm+(x2-xm)/xs
let ym=(yl +y2)/2
let ymin=ym-(ym-yl)/ys
let ymax=ym+(y2-ym)/ys
Set Window xmin,xmax,ymin,ymax
TM Trademark of True BASIC, Inc.
87

call MyFrame
for i=nplies to 1 step -1call plyplot(i)
next i
get key hold
input prompt "New Window Scale:":xs,ys
input prompt "New Angle: ":angle
loop
stop
sub plyplot(np)
dim ptmp(40,3)
mat redim ptmp(npts(np),3)for j=l to npts(np)
let ptmp(j, 1)=damage(np,j)
let ptmp(j,2)=damCut(np,j)
let ptmp(j,3)=nplies-np+ 1next J
if(pangle(np)=0) thenset color "black"
else
set color "red"
end if
call MatArea3(ptmp,work$)set color "black"
call MatLines3(ptmp,work$)end sub
sub MyFrame
dim atmp(11,4)
let atmp(1,1), atmp(2,1), atmp(3,1), atmp(7,1), atmp(8,1),
atmp(10,1)=0
let atmp(1,2), atmp(2,2), atmp(6,2), atmp(7,2)=l
let atmp(1,3), atmp(5,3), atmp(6,3), atmp(7,3), atmp(8,3)=l
let atmp(9,3), atmp(10,3)=l
let atmp(1,4), atmp(2,4), atmp(3,4), atmp(4,4), atmp(5,4),
atmp(6,4)=l
let atmp(2,3), atmp(3,3), atmp(4,3), atmp(ll,3)=nplies
let atmp(3,2), atmp(4,2), atmp(5,2), atmp(8,2), atmp(9,2),
atmp(10,2)=ncuts
let atmp(4,1), atmp(5,1), atmp(6,1), atmp(9,1)=dmax
let atmp(7,4), atmp(8,4), atmp(10,4)=l
88

let atmp(11,1), atmp(11,4)=0
let atmp(11,2)=ncuts
let atmp(9,4)=0
call MatPlot3(atmp,work$)
for i=0 to dmax step dTick
call LineOff3(i, 1,1,i,ncuts, 1 ,workS)
next i
for i=l to nplies step plyTick
call LineOff3(0,1,i,0,ncuts,i,work$)
next i
end sub
call Copy_done
end
89

ACK EEX_EMENTS
The author wishes to thank the following students who were
involved in the work reported here; Lisa Conception, Christine
Ellison, Ralph Oakson, and Jill Bohney.
A special thanks to Mr. Seong-Yun Gweon who performed all of
the impact investigation and to Professor John Nairn for many
helpful discussions during the course of this work.
9O
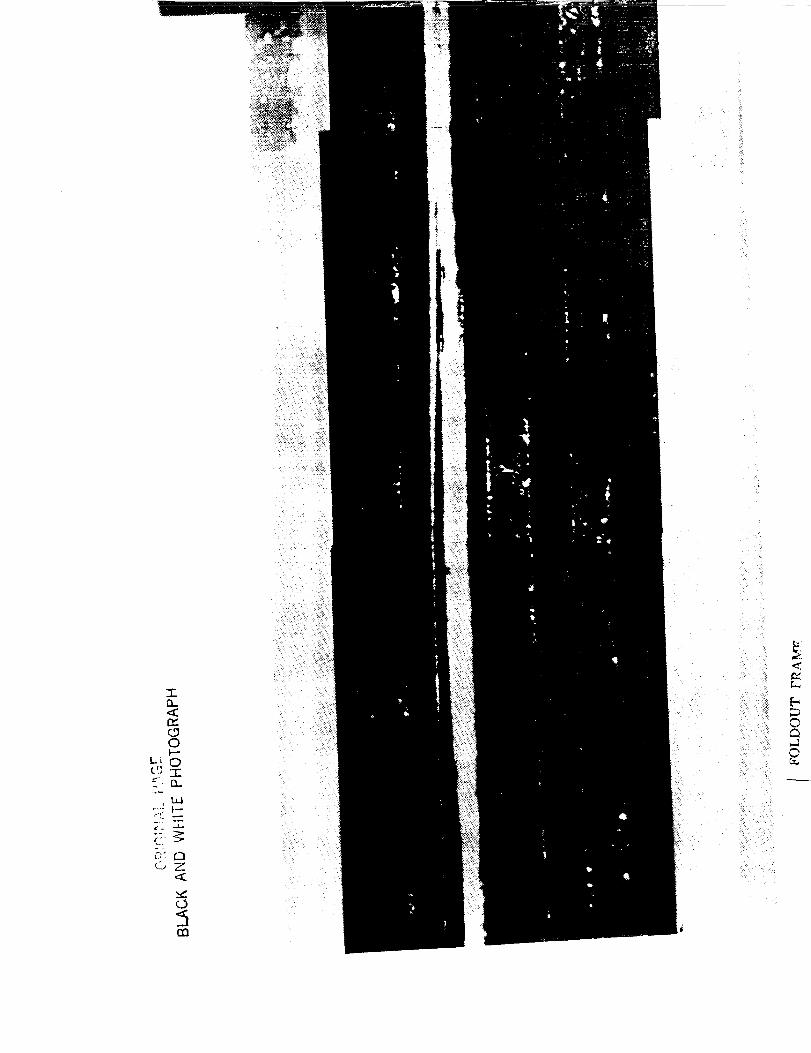
<
©
©c_

0
_ i_i_,_I
<f',,
9_
r_
I
0
k_
g._.J
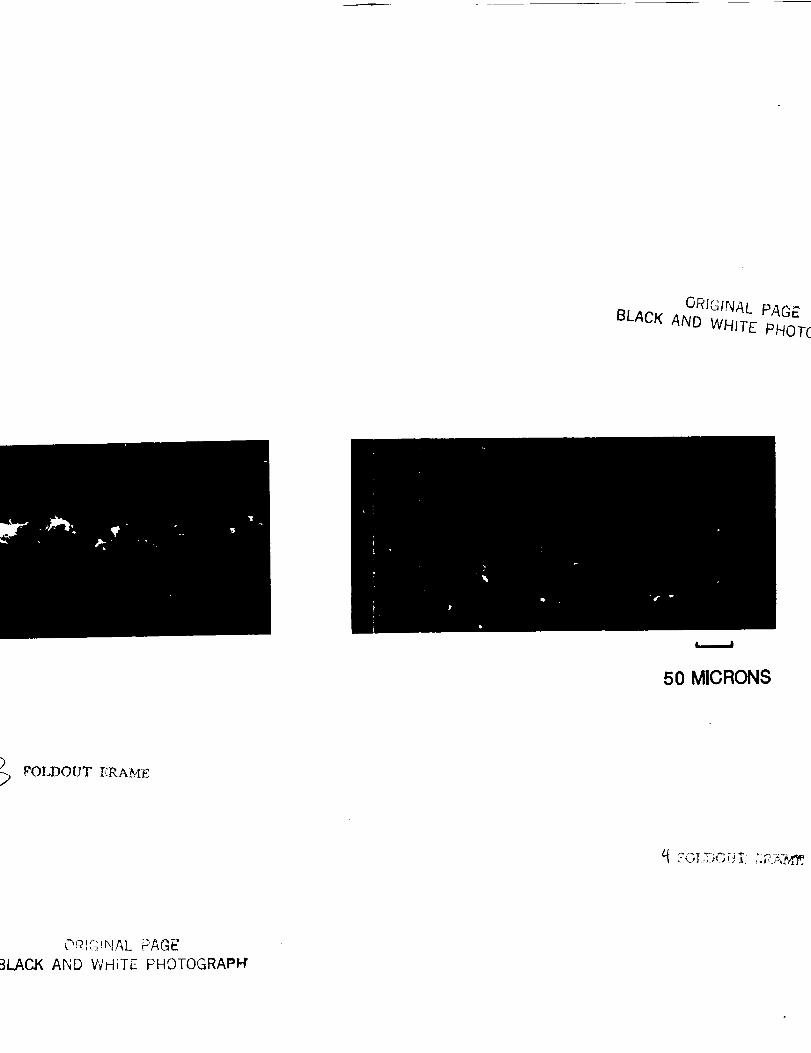
FOLDOUT ERA_.IE
Oc_'<'*NAL _'AGg' d_.a,
3LAC._ AND WHITE PHOTOGRAPH'
ORIGINAL PAGE
BLACK AND WHITE PHOT(
50 MICRONS