framework for a smart energy path - helio...
TRANSCRIPT

FRAMEWORK FOR A SMART ENERGY PATHA GUIDE TO SOUND ENERGY DECISIONS

FRAMEWORK FOR A SMART ENERGY PATH
Project Energy, Ecodevelopment and Resilience in Africa (EERA)With financial support from the Climate Development Knowledge Network
June 2014
A GUIDE TO SOUND ENERGY DECISIONS
AuthorsRalph Torrie and Judy Smith (Torrie Smith Associates, Canada)
Hélène Connor, Maryse Labriet and Michel Labrousse
(HELIO-International, France)
ValidationChristine Fiebig and Laura E. Williamson (HELIO-International, France)
Richard Heede (Climate Mitigation Services, United States)
Steve Thorne (SouthSouthNorth Africa, South Africa)
DesignMagdalena de la Cerda & Andrea Bozzo (Torino, Italia)
Photos first coverMultifunctional platform, Niger, Michel Labrousse
Femme travaillant, Guatemala, Maryse Labriet
Solar traffic light, Mali, Christine Fiebig
Garalo power station, Mali, Ousmane Ouattara
Classroom, Togo, Christine Fiebig
Document printed on FSC-certified paper.
© HELIO International 2014.

Framework for a Smart Energy Path | A guide to sound energy decisions III
More and more aware of the increasingly unrealistic nature of their ap-proaches to ensuring adequate energy supply for their countries, many governments are now invoking the need for an “energy transition”. But a transition to what? And with what time horizon? What policies are being designed? Very few would be able to answer these questions. One thing is certain, climate change is intensifying, so fossil fuels are no lon-ger an option. They also realise that, after Chernobyl and Fukushima, continuing to build nuclear plants would be suicidal.
For their part, conventional energy suppliers, preferring to ignore the stark reality they are facing, have not yet revised their view of the en-ergy future and are holding back the inevitable move to self-sufficient, environmentally benign and inexhaustible forms of energy because these are not within their field of expertise. Nonetheless, numerous for-ward-looking and courageous entrepreneurs have seen that the chal-lenge can be taken up and are developing alternatives that will shape the energy policy of tomorrow: they have understood that these new possibilities are in line with the desires and expectations of informed citizen-consumers.
Evidently the potential of renewable energies and technologies are not yet publicised enough, they are still difficult to store and somewhat too disseminated to really “weigh in” yet, but many people are beginning to see that these apparent disadvantages can actually be turned into advantages. More attention should be paid to those who acknowledge this. It is in their use that the value of these technologies can be rec-ognised, and precisely it is now users who are demanding renewables, which is their right since it is they who ultimately pay the energy bill, with their wallets but also, often, with their health.
FOREWORD

IV Foreword
Embargos and political turmoil have created scarcity and high cost, but the price signal has also been bypassed and lost its meaning when en-vironmental and social costs are externalised. At the end of the day, it is the environment, the health of people whose opinion has not been sought and future generations that will bear the “full cost”. Despite an awareness that now dates back to the 1970s, our modern societies have still not learned from the first energy shocks that led NGOs and civil society to give formal expression to the renewable energy alternative, still disputed by those who hold traditional views on energy.
Fortunately, generations move on and decision-makers, some of whom were educated before the oil crises, are finally rallying to reason. Rec-ognising that the prevailing “hard” energy path is a dead-end, they are now calling for a transition to a more sustainable path known since the 1970s as the “soft energy path”1 that can lead to self-sufficiency.
Obviously energy is only useful when it provides services in everyday life, both to individuals and to the community. Energy is not an end in itself. That is why energy policy making, traditionally led by energy suppliers, must now be radically re-oriented: it is for demand to drive supply and no longer for energy technology to seek applications and customers. In other words, it is up to the function to shape the tool. The transition vaunted by some advanced countries can therefore only come about as a response to a demand for energy services expressed by consumers whose views have been called for when establishing objec-tives and developing policies.
Countries engaged in the fight against poverty, (which affects close to 70% of some populations), cannot do without an energy transition. The supply based approach has been a resounding failure with shortages in cities and almost total absence of modern energy services in rural ar-eas. The indispensable energy transition in sub-Saharan Africa is, here again, synonymous with a demand-side approach, improved energy ef-ficiency and the introduction of modern renewable energy.
The energy sector cannot escape this logic and everyone must now work wholeheartedly to not only share the benefits, but also to assume responsibility. The soft energy path can put energy at the service of ecodevelopment for all. Amory Lovins, the originator to the soft path
1. Amory Lovins, « Soft Energy Paths. Towards a Durable Peace », 1977, ISBN 0-14-02-2029-1.

Framework for a Smart Energy Path | A guide to sound energy decisions V
approach, warned that it is a narrow path and engaging on it together is a daring act, but the result will be worth the effort! It is time we stopped sacrificing on the altar the myth of unlimited material growth. We need to keep our feet firmly planted on the ground of our mother planet, and this time we must avoid further degradation!
A transition to ecodevelopment is only possible via a soft energy path, and HELIO International’s work on energy policies undertaken since Rio+5 culminates today in this guide intended to clarify the approach for energy decision-makers seeking to ensure their countries’ long-term prosperity and stability.
Hélène Connor, Ph. D.
HELIO Founder and Honorary President
In 1997, HELIO International proposed a methodology for integrated evaluation of the contribution of energy policies to ecodevelopment. Its criteria and indicators were taken up by SouthSouthNorth to ensure compliance of climate related projects with commitments under the Kyoto Protocol and to develop the Gold Standard.
HELIO then designed a set of analytical tools to assess the vulnerability and resilience of energy systems to climate change, with the Vulnerability-Adaptation-Resilience (VAR) methodology, and for the development of energy policies resilient to climate change and compatible with countries’ ecodevel-opment, with the TIPEE methodology (Processing information for energy policies conducive to ecode-velopment).
With the soft energy path (SEP) approach, HELIO describes the path that can enable any country to ensure that its socio-economic and technological development will be both viable over the long term and respectful of the natural environment and of the quality of life of its citizens.
VI
Foreword III
Contents VI
Introduction 1
Chapter 1. 3Basic elements of a soft energy path
Chapter 2. 13Framework for planning a soft energy path
Chapter 3. 34Stakeholder and public involvement, key to success
Chapter 4. 40Conclusion
ANNEXESAnnex 1. 42BibliographyAnnex 2. 44French/English glossaryAnnex 3. 49Energy and the Millennium Development Goals
CONTENTS

Framework for a Smart Energy Path | A guide to sound energy decisions VII
LIST OF TABLES Table 1. 11TIPEE indicators and the SEP approach Table 2. 16Issues in rural, urban and periurban areas Table 3. 22Socio-economic structures, energy uses and final energy forms Table 4. 23Example End-use Framework for Soft Energy Path (SEP) Analysis
LIST OF FIGURESFigure 1. 4Ecodevelopment. Figure 2. 7Energy system schematic. Figure 3. 15Schematic of Soft Energy Path (SEP) Figure 4. 35The 7 categories of stakeholders concerned by energy policy and implementation of energy programmes Figure 5. 36Two teams at two levels of intervention

VIII
Framework for a Smart Energy Path | A guide to sound energy decisions 1
Modern energy planning must take into account a number of intercon-nected social, economic, ethical and environmental issues. The primary function of the energy system is to help to meet needs in accordance with development priorities, thereby improving the quality of life for everyone. To achieve this, the need for energy services must be met in a manner that is technically efficient and that preserves healthy ecosys-tems while adapting to climate variations, such variations themselves being largely the result of former harmful practices within the energy system. Lastly, energy planning must also be in line with principles of social justice and of participatory governance, since it is unlikely that an energy system will prove efficient if it is designed and implemented without the participation and full commitment of those whose lives it will affect.
In the past, energy planning focused almost exclusively on the supply side of commercial fuels and electricity. The ways in which fuels and electricity were actually used was the object of scant thinking and at-tention, rarely going beyond what was necessary to increase supply. Things have changed in recent years as it has become increasingly evi-dent that a traditional top-down approach leads to an outlook for the supply of fuels and electricity that is economically and environmentally non-viable and that has not only failed to constitute an effective way of achieving the goals of human and economic development, but looks largely set to compromise them.
With the threat of climate change the requirement for energy strategies able to meet the aspirations of economic and human development while limiting environmental stress and pollution, as well as minimising the energy system’s own vulnerability to climate change, has become more and more pressing. Severe pressures can appear, especially in econo-mies with an unmet demand for electricity and fuels, and can place ex-
INTRODUCTION

2 Introduction
cessive stress on ecosystems and short-circuit participatory governance by favouring short-term interests.
Energy projects are known throughout the world as being one of the major sources of environmental stress. In the 20th century, develop-ment of mining, refining and consumption of non-renewable resources caused massive damage, notably pollution of the seas as a result of hydrocarbon spills, atmospheric pollution from combustion of coal and oil, water pollution from the extraction of uranium and other ores, soil contamination from nuclear accidents and, ultimately, global warming. In the developing countries, households’ dependence on biomass and charcoal for cooking and heating has sometimes led to deforestation, to human suffering and to loss of habitat. This situation necessitates a more sophisticated modern response to minimise harm to the environ-ment and to society: a smart energy path.
In summary, a smart energy path (SEP) aims to provide energy services that make it possible to achieve economic and social goals for a popula-tion within a given perimeter (local, national, regional) in a manner that is compatible with environmental sustainability and within a frame-work of participatory governance. It is therefore a “demand based” or more accurately a “needs based” approach relying on the use of soft energy technologies that1. use renewable energy flows; 2. are diversified and rely on numerous small individual contributions
designed for maximum efficiency in a given context; 3. are flexible and technologically accessible; 4. are appropriate to end users’ needs in terms of quantity, quality
and geographical distribution.
It is important to point out that “energy planning” is merely one com-ponent of economic and social planning. Of course the energy options selected greatly affect people’s living and working conditions and the natural environment, and subsequently the possibility of attaining the Millennium Development Goals (MDG) (even though these do not mention energy specifically) and their successors the Sustainable De-velopment Goals (SDG) currently being defined. Moreover, the very basis of SEP is directly in line with the will to obtain universal access to energy that will be viable in the long term.

3
DEFINITION AND ORIGIN
The smart energy path (SEP) aims to respond to the needs of energy services of the whole population through the use of sustainably man-aged renewable resources – sun, wind, water cycles and biofuels – for long-term provision of energy that is environmentally benign. Smart energy paths use technologies that guarantee high energy performance for end uses, thereby optimising consumption of each unit of energy and reducing the amount of energy produced in the first place, meaning less environmental stress.
In this guide, we employ the expression “smart energy path” to mean an energy planning approach that starts with the question: “what kind of future do we want in terms of social and economic develop-ment?” and answers the question “how can we obtain the energy services and the adapted energy chains required for such a future and satisfy people’s aspirations and needs in a way that is compatible with en-vironmental sustainability and participa-tory governance?”.
It is inspired from the “soft energy path” coined by Amory Lovins in 1976 in a ground-breaking article that appeared in the Foreign Affairs magazine and which defined a new paradigm for the way we consider ener-gy. The ideas propounded by Lovins are closely related to the work of Bent Sørensen in Denmark2 and of Amulya Reddy in India3, with the concept of “energy for development”.
2. Amory Lovins. Energy Strategy: The Road Not Taken », Foreign Affairs. Autumn 1976.
3. Bent Sørensen. Renewable Energy Planning for Denmark and Other Countrie. Energy: The International Journal, 6:293-303, 1981.
“It may then be claimed that renewable en-ergy technologies will stimulate a decentral-ised development, leaving more room for regional optimization of living conditions and democratic participation, as compared with the large scale technology, which has a tendancy to become the “property” of an elite, such that it might promote a further stratification of regions and societies with respect to the levels of material standard of living.” (Bent Sørensen)
CHAPTER 1
BASIC ELEMENTS OF A SMART ENERGY PATH

4 Chapter 1 | Basic elements of a smart energy path
In contrast to this “soft” energy path4, pursuing the energy planning paradigm prevalent at the time was described by Lovins as the “hard” path, characterised by increase in supply of fossil fuels and greater use of centralised and ever more costly energy supply technologies exerting increasing pressure on the environment and resulting in an inflexible, inequitable, vulnerable and ultimately unsustainable energy system.
Smart energy paths are characterised by a focus on the response to the popula-tions needs for modern energy services and optimization of final energy demand. Collective (for example health, education) and productive needs for modern energy services are at the heart of SEP. They use free, natural energy flows that are easy to use and locally accessible. SEP are not only fully compatible with environ-mental sustainability and with economic self-determination (attributes which are essential elements of ecodevelopment) but also favour economic emergence and long-term viability (Figure 1).5
RELEVANT TO AFRICA?
In the industrial economies access to fossil fuel and electricity is univer-sal and both rural and urban local authorities have the benefit of mod-ern energy services with levels of reliability that are more or less equiv-alent. In the developing world, and especially in sub-Saharan Africa, access to commercial energy is very limited, per capita consumption of fuels and electricity is very low. Many small and rural communities are almost totally dependent on biomass which is often collected un-sustainably, contributing to deforestation and adverse environmental effects. There is a high unsatisfied demand for energy services referred to as “suppressed demand”, that is to say an unmet demand that must be taken into account when defining future needs. Meeting suppressed
4. Amulya K.N. Reddy. Energy Options for the Third World. The Bulletin of Atomic Scientists, vol. 34, no 5, May 1978, pp. 28–33. See also http://amulya-reddy.org.en/.
5. Hélène Connor-Lajambe, Conducting Sustainability Assesssments — ISBN-978-92-64-04725-9 ©OCDE 2008, «Assessing the Energy Contributions to Sustainability», ch. 8, page 109.
FIGURE 1: EcodevelopmentHumans, utilizing usufructal technologies use natural resources; trough participatory governance, markets are controlled and regulated. It is trough these processes and nteractions that ecodevelopment is achieved. (Source: Helio International)
ECODEVELOPMENTNATURE MARKET
HUMANKIND
USUFRUCTALTECHNOLOGY
PARTICIPATORYGOVERNANCE

Framework for a Smart Energy Path | A guide to sound energy decisions 5
demand effectively requires a “demand side” approach with a focus on meeting social, communal and productive service needs, combined with progressive enhancement of infrastructure and development of local and national energy resources. In the industrialised economies the amounts of animate (human and animal) energy used are tiny compared to the quantities of energy from electricity and fossil fuels; similarly, biomass is a marginal contributor to the energy mix in most industri-alised countries. The opposite tends to be true in the developing world, where animate power is an important energy source in rural areas.
There is no doubt that the current conditions in developing countries are quite different from those that prevailed in industrialised countries when the SEP concept was developed (1975–80). However, the basic principles of SEP are fundamental, especially in terms of the focus on the services provided by energy: cooking, lighting, mobility, water, motive power (wa-ter pumping, processing of foodstuffs), heating, refrigeration, communica-tions and others. It can even be argued that the SEP approach, fostering efficient and clean supply of such services (and therefore addressing es-sential aspects), is particularly relevant to developing countries, for which it represents an unparalleled strategy to future structural development. A similar approach has been developed by Amulya Reddy in the context of the developing world.
EXTRACT
Poverty and energy
In the face of inadequate inanimate energy and of a lack of access to efficient technologies of en-ergy use, the poor are forced to depend on their own labour, on animal power and biomass energy resources to meet their survival needs. If poverty reduction and improved living standards are to be achieved, energy services must be dramatically augmented to improve the level of satisfaction of basic human needs. This is the challenge, a challenge that is aggravated by growing populations already facing shortages of inanimate energy –failure will play a significant role in the perpetuation of poverty, and success can lead to the achievement of equitable, ecologically sound and sustainable development.
Srilatha Batliwala and Amulya K.N. Reddy “Energy as an Obstacle to the Improvement of Living Standards”, undated.
6 Chapter 1 | Basic elements of a smart energy path
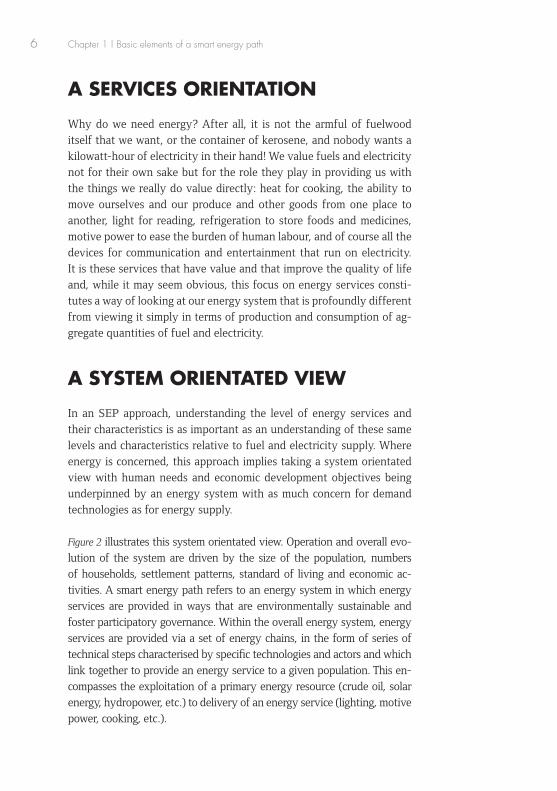
A SERVICES ORIENTATION
Why do we need energy? After all, it is not the armful of fuelwood itself that we want, or the container of kerosene, and nobody wants a kilowatt-hour of electricity in their hand! We value fuels and electricity not for their own sake but for the role they play in providing us with the things we really do value directly: heat for cooking, the ability to move ourselves and our produce and other goods from one place to another, light for reading, refrigeration to store foods and medicines, motive power to ease the burden of human labour, and of course all the devices for communication and entertainment that run on electricity. It is these services that have value and that improve the quality of life and, while it may seem obvious, this focus on energy services consti-tutes a way of looking at our energy system that is profoundly different from viewing it simply in terms of production and consumption of ag-gregate quantities of fuel and electricity.
A SYSTEM ORIENTATED VIEW
In an SEP approach, understanding the level of energy services and their characteristics is as important as an understanding of these same levels and characteristics relative to fuel and electricity supply. Where energy is concerned, this approach implies taking a system orientated view with human needs and economic development objectives being underpinned by an energy system with as much concern for demand technologies as for energy supply.
Figure 2 illustrates this system orientated view. Operation and overall evo-lution of the system are driven by the size of the population, numbers of households, settlement patterns, standard of living and economic ac-tivities. A smart energy path refers to an energy system in which energy services are provided in ways that are environmentally sustainable and foster participatory governance. Within the overall energy system, energy services are provided via a set of energy chains, in the form of series of technical steps characterised by specific technologies and actors and which link together to provide an energy service to a given population. This en-compasses the exploitation of a primary energy resource (crude oil, solar energy, hydropower, etc.) to delivery of an energy service (lighting, motive power, cooking, etc.).

Framework for a Smart Energy Path | A guide to sound energy decisions 7
Heating & Cooling,
Transportation, Cooking,
Entertainment, Lighting etc.
used by Transportation, Commercial, Residential,
and Industrial sectors.
Demand for services is driven by socio-economic factors such
as population, households, economy, standard of living, etc.
Electric cars, diesel trucks, boats, natural gas heaters,
TVs, ovens etc.
Energy Efficiency and Emissions are dependent on the type of
technology used.
Extraction:Drilling & Pumping, Mining, In-Situ, etc.
Conversion to Useable Fuels and
electricity:Refineries, Wind Turbines, Nuclear Reactors, Steam
Turbines, Photovoltaics, etc.
Non-RenewableCrude Oil
Natural GasCoal
UraniumRenewable
SolarHydroWind
BiomassGeothermal*
*Not strictly renewable
SERVICES END USE TECHNOLOGIES
SUPPLYTECHNOLOGIES SOURCES
END USES AND ENERGY SERVICES FUEL AND ELECTRICITY PRODUCTION
Environmental stress, pollution, greenhouse
gas emissions.
ENERGY SUPPLY AND DEMAND
BALANCE
Fuel and electricity imports
and exports
FIGURE 2: Energy System Schematic(Source: From Torrie et. al., “An Inventory of Low-Carbon Energy for Canada”, Trottier Energy Futures Project, March 2013. www.trottierenergyfutures.ca. (Based on a diagram developed by ISEEE, University of Calgary, and inspired by Sanborn Scott’s five-link architecture of an energy system.)
NOTA BENE
Energy services are essential for development – the example of electricity in sub-Saharan Africa
Avoiding confusion between energy services and energy access
In most sub-Saharan African countries it is not only final energy that is missing, it is above all energy services that are lacking. A paradoxical situation pertains: electricity supply grids are built in rural areas; to achieve this, governments, electricity companies, rural electrification agencies (when these exist), international development partners, etc. finance at great cost grids that “cover” significant parts of national territories. But the goal is not attained because the rural households cannot afford to pay for connection to the grid and cannot afford a monthly bill. Only the wealthy profit from this “windfall”, benefiting from public subsidies given to the electricity sector. This is the result of a “supply side” ap-proach: no thought is given to the inability of the majority of people to invest in the appliances that provide electricity services (lighting, refrigeration, ventilation, etc.).
Using energy access to eradicate poverty
Today, access to electricity is often considered as a luxury rather than as a component of develop-ment. It is reserved for the wealthiest fringe of society while the majority have no access to modern services. In fact, communal infrastructure and amenities should be provided with modern energy
8 Chapter 1 | Basic elements of a smart energy path
SOFT ENERGY TECHNOLOGIES
Smart energy paths use soft energy technologies. As defined originally by Lovins6, these are technologies with the following five characteristics:
1. They rely on renewable energy flows such as sun, wind and vegeta-tion that are always there whether they are used or not: this means that energy income is being used, not depletable energy capital7.
2. They are diverse and rely on many individually modest contribu-tions, like a national treasury that relies on many small tax contri-butions, with each energy contribution being designed for maxi-mum efficiency in particular circumstances.
3. They are flexible and relatively low technology, which does not mean unsophisticated but rather that exceptional skills are not re-quired to understand the operating principles, in other words they are accessible rather than arcane.
4. They are matched in scale and in geographic distribution to end us-ers’ needs, taking advantage of the free distribution of most natu-ral energy flows. While power stations and fossil fuel extraction often produce energy at rates in the hundreds or even thousands of megawatts (MW), individual human needs for fuel and electric-
6. Amory Lovins, Soft Energy Paths: Toward a Durable Peace, Ballinger, Cambridge, 1977. pp. 38-39.
7. This is also called “usufructuary use”
services: health centres; schools; administrative centres; social centres; drinking water wells and all facilities contributing to economic and social development; agricultural, artisanal, or commercial enter-prises; markets; etc. Providing these areas with energy services improves their efficiency in delivering services and thereby contributes to achieving the MDG and associated targets (see annex 3) aimed at the population living below the poverty line: specifically levels of school attendance and success, infant/juvenile and maternal mortality, access to drinking water, etc.
The access to energy services approach is therefore a “demand side” one: people’s energy service needs are addressed and the optimum energy systems are designed at the relevant territorial scale. The notion of an “energy territory” is introduced, it can be a municipal area, or a part of this, within which a sole controlling authority will ensure availability of energy services to social infrastructure (health, education, water, municipal departments), productive facilities (agricultural, artisanal, service providers) and to households.

Framework for a Smart Energy Path | A guide to sound energy decisions 9
ity are typically only a few kilowatts (kW), with even the largest industrial facilities rarely requiring as much as 100 MW. This mis-match in the scale of supply and the scale of demand creates inef-ficiencies and losses associated with the inevitable wide extent of distribution grids.
5. They are matched, in energy quality terms, to end users’ needs. Energy by itself is not of great value. Its value derives solely from its capacity to meet needs and, in this regard, some forms of energy are more advantageous than others because they are more versatile and have more relevant attributes than others. For example, one Joule provided in the form of electricity can be used for many more applications than a Joule from low temperature heat, which is why electricity can command unit-of-energy prices that are much higher than those for other forms of energy. Liquid fuels with high energy densities that can be stored on vehicles (e.g. gasoline, diesel fuel) command a high price compared to the same amount of energy in the form of coal.
NOTA BENE:
Optimising economic efficiency of the energy chain
The cost of an energy service is the sum of the costs of each of the links in the energy chain: primary energy, conversion to secondary and then final energy, transport to the consumer, and equipment con-verting the final energy into an “energy service”. Optimising the energy chain means designing and sizing the different links so that the overall cost of the energy service (including externalities) is as low as possible. With a supply side approach, the final energy supplier optimises the upstream part of the chain without really considering the need that is to be met or the choice of appliance converting the final energy into a service. For a given energy service, the investment cost for the equipment providing the service increases with its efficiency of conversion but energy consumption and cost may decrease. For instance, a low-energy light bulb costs more than an incandescent one but requires far less electric-ity. Economic optimum is achieved when the additional investment cost of avoiding consumption of a certain amount of energy is equal to the cost to provide the energy. Virtually all energy systems are a long way from operating at optimum and the final converting elements (buildings, lamps, industrial processes, vehicles, etc.) could perform far better; the potential for realisable energy efficiency is high. In other words, for identical service, the amount of energy consumed and overall cost of the energy chain could be much lower.
It is possible to envisage and put in place an institutional set-up leading to an optimised energy chain if the controlling authority manages both the upstream and downstream parts of the energy chains. An energy service operator can be brought in within a delegated-service remit and can thereby control all of the energy chain so as to make best use of local resources to give full meaning to energy efficiency. This is also the approach that will allow leap-frogging to accede directly to the best technologies.

10 Chapter 1 | Basic elements of a smart energy path
SCENARIOS AND BACKCASTING: GOAL-ORIENTATED ENERGY PLANNING
In SEP planning, wthe energy system is seen as serving human needs and aspirations, which is why the energy service focus is paramount. Future supplies of fuels and electricity are not forecast or predicted but are “back-cast” from a point in the future for which targets, used as key indicators, have been defined by consensus.
Backcasting consists in imagining a future and then planning the way to get there. The word itself may be unfamiliar but it actually refers to a common-place activity. We all use the method, even in such everyday activities as crossing a busy street. If we simply forecast our arrival at the other side by projecting our speed and direction we run the risk of being totally surprised by the traffic. In fact, we look both ways and collect all available informa-tion on the presence and speeds of different vehicles and use this informa-tion to run different scenarios and assumptions. How much time will it take to cross? Am I in a hurry? If I fall, will I have the time to get up and finish crossing before the approaching truck gets there? Will the truck driver have enough time to stop? Would it be safer to wait until there is no more traffic? After comparing the different scenarios (wait? walk? run?), we make a deci-sion. Of course such decisions are made so automatically that we are rarely aware of the process going on in the background but this is, nonetheless, backcasting. In SEP, backcasting is applied systematically and voluntarily as a tool for comparing different ways of reaching a desired result.
SMART ENERGY PATHS AND TIPEE INDICATORSHELIO International has developed the TIPEE©8 indicators enabling measurement of progress resulting from implementation of energy policies integrating the principles of ecodevelopment. The table below provides a summary of the indicators and indicates their compatibility with the SEP approach.
8. HELIO International, «Processing Information for Energy Policies Conducive to Ecodevelopment (TIPEE)», HELIO, Paris, 2011. http://www.helio-international.org/toolkit/tipee.

Framework for a Smart Energy Path | A guide to sound energy decisions 11
INDICATORS RELEVANT PARAMETERS LINK WITH SEP APPROACH
ENVIRONMENT
1.Greenhouse gas emissions
Greenhouse gas emissions (CO2) from the energy sector
Focus on energy efficiency and renewables.
2. Major local energy pollutant
Concentration or emission level of a significant energy-related local pollutant (CO, NOx, SOx, particulates) per capita
Inclusion of energy system impacts on atmosphere and health. Focus on energy efficiency and renewables, including for end use. Fostering of access to clean cooking to improve indoor air quality.
3. Deforestation Number of hectares of deforestation or loss of forest vegetation (biodiversity) used for energy purposes
Consideration from source to end use. Lowering of pressure from obtaining fuelwood supplies.
SOCIETY
4. Electricity access
Number of households with access to electricity
Priority given to energy services, especially those intended for social infrastructure, communal or productive uses. Focus on matching of supply to end uses. Off-grid solutions can accelerate access to electricity.
5. Household energy burden
Proportion of household income spent on energy services
Focus on appropriate energy services with, for example, efficient cooking stoves or solar water heaters that can reduce household energy bills.
ECONOMY
6. Fossil fuel imports
External energy dependence Reinforcement of energy independence and reduction of external debt by fostering energy efficiency and renewables.
7. Non-renewable energy reserves
Number of days of stock of non-renewable energy supplies
Reinforcement of energy security.
TECHNOLOGY
8. Renewable energy
Deployment of modern, local renewable energy
Encouragement of diversified renewables and, in this sense, energy services.
TABLE 1. TIPEE indicators and the SEP approach
EXTRACT
Backcasting
Backcasting analyses are concerned not with what energy futures are likely to happen, but with how desirable futures can be obtained. They involve “working backwards” from a particular chosen future end-point to the present in order to determine what policy measures would be required to reach that future. The difference between forecasting and backcasting is thus as much one of approach as of methods. Both techniques must incorporate policy changes; both must also make use of some predic-tions; both can be highly quantitative. The value of backcasting, which, in contrast to forecasting, increases as the time horizon of the study is extended, is that it makes possible the exploration of the feasibility and viability of a wide range of possible energy futures.
David B. Brooks, John B. Robinson and Ralph D. Torrie, 2025: Soft Energy Futures for Canada, Friends of the Earth Canada for Energy Mines and Resources Canada, Ottawa, February 1983.

12 Chapter 1 | Basic elements of a smart energy path
9. Energy efficiency
Energy intensity of industry; GHG emissions per unit of production; or energy intensity of the economy
Fostering of energy efficiency along the energy supply chain, from source to end use.
10. Quality of electricity supply
Length and recurrence of power cuts and variations in voltage
Improvement in service quality and reliability, focusing on energy efficiency and renewables, diversified and decentralised sources and matching of source quality and quantity with end use.
GOVERNANCE
11. Income control
Reduction in the share of energy revenues that escape taxation
Encouragement of use of local energy resources to facilitate control and redistribution of income. For example, controlled rural markets for biomass from forests in West Africa raise taxes to be used by local authorities.
12. Informed consultation
Public hearings and consultations on the impact assessments of proposed energy projects
Encouragement of participation and upstream public information to facilitate uptake of solutions acceptable to everyone.
13. Women participation
Active participation of women in the governance of the energy sector
Affording of an official position to women in places where energy sector decisions are made, given their active role in obtaining energy supplies and access to energy services.
14. Balanced governance
Balanced representation of energy demand and supply stakeholders as well as transparency in the decision-making process
Guaranteeing of balanced representation of all stakeholders concerned by energy decisions, to encourage transparency of decision making processes and active participation of all actors involved.
VULNERABILITY
15. Vulnerability of thermal power supply
Vulnerability of power plants (and refineries if applicable) to flooding
Diversification of production sources, focus on energy efficiency, avoid siting power plants in risk areas (flooding, loss of production capacity due to low levels in water courses used for cooling, etc.).
16. Vulnerability of renewable power systems
Vulnerability of renewable energy systems to climatic variations
Diversification of production sources, focus on energy efficiency, reduced dependence on biomass.
17. Vulnerability of transmission lines
Length of transmission lines/distribution networks threatened by extreme weather events
Encouragement of varied and distributed sources, development of a meshed grid.
RESILIENCE
18. Investment assets
Rate of domestic savings/GDP Starting with investment with local savings, encourage soft energy technologies without climate impacts able to benefit from international cooperation and “Finance Climat” financing mechanisms.
19. Mobilisation of renewable energy potential
Proportion of national investment earmarked for renewable energy and energy efficiency
Fostering of clean investment in energy efficiency and renewables.
20. Local technical capacity
Annual number of science and engineering graduates per total population
Building of local strategic and technical capacities, offer local centres for study and skill development, encouraging local employment.
21. Scientific information
Availability of risk maps (flooding, desertification, contamination)
Facilitating of access to reliable information, published and commonly known.
22. Siting guidelines
Climate-proofing guidelines for power plant siting and construction
Planning of introduction of facilities that are not vulnerable to climate change.
23. Crisis management
Emergency plans for power plants Provision of clear instructions to increase energy system resilience.
24. Insurance Availability of domestic insurance policies that account for climate change-related damages
Proposal of adaptation solutions to enterprises, farmers and household to cope with hazards.

13
Soft energy planning requires two types of activities that are comple-mentary and are necessary to maintaining the balance between the eco-nomic, environmental and social criteria for ecodevelopment:
• An economic and technological analysis coupled with a backcasting
exercise reconciling energy demand with available supply. • A participation protocol supporting all aspects of the SEP approach.
This chapter covers the technical-economic analysis and backcasting that are at the core of SEP planning. The following chapter looks at the issues of participation and governance.
TECHNOLOGICAL AND ECONOMIC ANALYSIS AND BACKCASTINGThe method for conducting an economic and technological analysis for a soft energy planning exercise is determined by the practical orienta-tion (meeting demand) of the latter and by application of a backcasting approach with the aim of exploring different pathways to achieve a desired result (in this case, an energy system compatible with ecode-velopment).
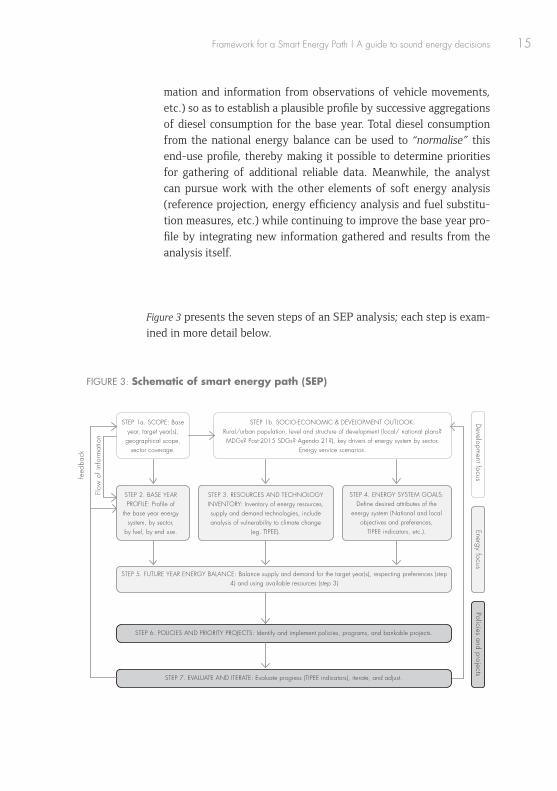
The essential elements of SEP planning are shown in Figure 3 in the form of a seven-step process. Each step includes a participation com-ponent that is described in the Backgrounder “Successful Stakeholder Engagement” 9.
9. http://www.helio-international.org/toolkit/sep
CHAPTER 2
FRAMEWORK FOR PLANNING A SMART ENERGY PATH

14 Chapter 2 | Framework for planning a smart energy path
The individual steps are described in more detail later in this chapter, but there are some characteristics of the overall method that are impor-tant to note at the outset.
• Although SEP planning requires more specific information as to how energy is used than traditional supply orientated planning based on forecasts, it can be developed gradually and does not nec-essarily need to be perfect or exhaustive before being undertaken and implemented. In fact, the SEP planning exercise will identify the information necessary for improvement of the planning in ques-tion which is a continuous process of learning and adjustment of programmes and measures in response to both results obtained and new information.
• Although the steps in Figure 3 are numbered and presented in se-quence, planning work can and should proceed simultaneously for most of the steps, especially in the research and information gather-ing steps: development of the base year profile (step 3); cataloguing of technologies enabling energy efficiency and of the possibilities in this area (step 4); and identification of policies and programmes to be included in the plan (step 6).
• The characteristic SEP planning approach is not to “forecast” the future but to “backcast” the measures to be taken to establish the future energy system, thereby facilitating identification of the pri-ority policies and projects best suited to achieving progress towards ecodevelopment.
• SEP planning is possible even in situations where available infor-mation is limited or is poor. The scenario based approach can be applied not only to the future but also to filling any information gaps when establishing the base year profile. For instance, the analyst may obtain relatively reliable information on total diesel consumption for transport from the national energy balance but only fragments of end-use information such as types of vehicles, fuel energy efficiency, number of trips by vehicles, length and pur-pose of trips, etc. Using a scenario based approach, the analyst can combine assumptions with available information (e.g. vehicle reg-istration date, standard information on fuel efficiency, local infor-
Framework for a Smart Energy Path | A guide to sound energy decisions 15
mation and information from observations of vehicle movements, etc.) so as to establish a plausible profile by successive aggregations of diesel consumption for the base year. Total diesel consumption from the national energy balance can be used to “normalise” this end-use profile, thereby making it possible to determine priorities for gathering of additional reliable data. Meanwhile, the analyst can pursue work with the other elements of soft energy analysis (reference projection, energy efficiency analysis and fuel substitu-tion measures, etc.) while continuing to improve the base year pro-file by integrating new information gathered and results from the analysis itself.
Figure 3 presents the seven steps of an SEP analysis; each step is exam-ined in more detail below.
STEP 1a. SCOPE: Base year, target year(s),
geographical scope, sector coverage.
STEP 2. BASE YEAR PROFILE: Profile of
the base year energy system, by sector,
by fuel, by end use.
STEP 1b. SOCIO-ECONOMIC & DEVELOPMENT OUTLOOK: Rural/urban population, level and structure of development (local/ national plans? MDGs? Post-2015 SDGs? Agenda 21?), key drivers of energy system by sector.
Energy service scenarios.
STEP 5. FUTURE YEAR ENERGY BALANCE: Balance supply and demand for the target year(s), respecting preferences (step 4) and using available resources (step 3)
STEP 6. POLICIES AND PRIORITY PROJECTS: Identify and implement policies, programs, and bankable projects.
STEP 7. EVALUATE AND ITERATE: Evaluate progress (TIPEE indicators), iterate, and adjust.
STEP 3. RESOURCES AND TECHNOLOGY INVENTORY: Inventory of energy resources, supply and demand technologies, include analysis of vulnerability to climate change
(eg. TIPEE).
STEP 4. ENERGY SYSTEM GOALS: Define desired attributes of the
energy system (National and local objectives and preferences,
TIPEE indicators, etc.).
feed
back
D
evelopment focus
Energy focusPolicies and projects
Flow
of i
nfor
mat
ion
FIGURE 3: Schematic of smart energy path (SEP)

16 Chapter 2 | Framework for planning a smart energy path
STEP 1A: SCOPEA few decisions are necessary to get the process started.
WHAT IS THE GEOGRAPHICAL SCOPE OF THE ANALYSIS?The language and examples in this guide are based on the assumption that SEP planning is being developed at national level, but smart en-ergy paths can and have been developed for regions, states, municipali-ties and even villages. In fact, the SEP process can prove to be very ef-fective when applied at the local level, given its emphasis on achieving an efficient match between local demands and local energy resources, the importance of participation by the public and by local stakeholders, and the importance of information from the field.
For instance, it can be seen from Table 2 that the energy systems in West Africa are different in rural, periurban and urban communities and that there are clear differences between the needs and opportuni-ties in coastal and inland regions. Information and data availability may also vary from one region to another.
RURAL AREA URBAN AREA PERIURBAN AREA
Home to the majority of the population, up to 70%, proportion tending to diminish as a result of extreme hardship driving exodus of populations to periurban areas. Poverty is extreme in rural areas and all of the Millennium Development Goal indicators are at their lowest level. The “smart energy path” should lead to rapid increase of the indicators.
Urban areas are occupied by a minority of the population. A large majority of people there continue to use biomass based fuels (mainly charcoal); they generally use improved stoves (not three stone hearths) and LPG is developing amongst the middle class.
The other aspect of the urban energy problem is electricity: appliances (lighting, motors, A/C, etc.) have very mediocre efficiency; growth in demand is therefore strong and inadequacy of means of generation is recurrent.
It is difficult to define the periurban area in geographical, topographical, economic or sociological terms. Populations are highly diverse. Precariousness of housing and of public infrastructure is a constant. The energy issue is complex, combining characteristics of rural areas (need to strengthen social and community services to combat poverty) and of urban areas (presence of industry, commercial services and transport).
The actors are at least as numerous as in rural or urban areas. Above all, it is the uncertainty of land tenure that causes difficulty in making choices as to technology and organisation. The sociological dimension of the different populations involved must be analysed carefully.
TABLE 2. Issues in rural, urban and periurban areas
Framework for a Smart Energy Path | A guide to sound energy decisions 17
It may therefore be worth considering an analysis with infra-national scope. While the content of this guide implicitly assumes the analysis will be national in scope, the methods it presents for conducting an SEP study are applicable on a smaller scale. Therefore, establishing a perimeter or “energy territory” to which analysis is applied is the initial concern of the study. The perimeter characterises a physical unit (co-herence of infrastructure) and an institutional unit (decision making, coherence with decentralisation of institutions ongoing or already ef-fective in a number of African countries).
WHAT IS THE SECTORAL SCOPE OF THE ANALYSIS?Regarding sector coverage, the implicit assumption throughout this guide is that soft energy planning covers all energy sources and all en-ergy consuming sectors: households, passenger transportation, freight transportation, commercial and institutional activities (including gov-ernment), and industrial production. However, as with the geographical scope, SEP analysis techniques can also be applied to individual sectors. Focussing on a single sector (e.g. households) or sub-sector (e.g. urban households or rural households) can be a good way to gain experience with the method or to restrict the scope to an area where data is known to be available. The SEP method is very flexible; it is possible to have different levels of detail for different regions and for different sectors depending on the information that is available and the resources avail-able for the analysis. For example, it is perfectly possible, within the same SEP process, to have an analysis of household energy use that distinguishes between regions or between community types (e.g. ur-ban or rural households) and a national analysis of the commercial and institutional sectors without any disaggregation by region or subsector. Detail can be added over time as information becomes available.
WHAT WILL BE THE BASE YEAR?Availability of information is the most important attribute of the base year in an SEP analysis or any other energy demand analysis. The most recent year for which national statistics are readily available should be chosen. The statistics may cover all sorts of information on energy sup-ply and demand (e.g. electricity sales from national energy balances) as well as information about the demographic and economic determi-nants of energy demand (e.g. number of households, urban/rural split of population, GDP by sector of activity, vehicle registrations, numbers of schools, hospitals, and other types of buildings, etc.). While assump-
18 Chapter 2 | Framework for planning a smart energy path
tions and estimates can be substituted for hard data in any of these areas, it is nonetheless preferable to have a maximum of solid statistical information. Given that, in general, several years elapse before national statistics agencies finalise data profiles, the base year used in an energy demand analysis is usually not the most recent historical year but rather the most recent historical year for which reasonably complete data are available. For example, the national energy balance is an important in-put to the analysis.
WHAT IS THE ANALYSIS TIME HORIZON (“TARGET YEAR”)?A target year is chosen in accordance with the timeline for the energy plan. It may be useful to synchronise the analysis target year with the planning horizon of the national economic development plan or Agen-da 21. It is also possible to determine a number of years between the start of the analysis and the target year and to set many intermediary milestones. As some measures for improving energy efficiency require capital stock turnover or infrastructure investments that are relatively long term, it seems reasonable to suggest that the target year be at least twenty years in the future. It may be useful to have more than one “milestone” year so that both medium term and longer term scenarios can be developed. For example the years 2030 and 2050 could be used for a plan developed in 2014. When analysis is at the local level, a closer horizon is certainly preferable; local development plans usually have horizons of around five years.
STEP 1B: SOCIO-ECONOMIC OUTLOOKWHICH CURRENT AND FUTURE ECONOMIC AND DEMOGRAPHIC CHARACTERISTICS NEED TO BE CONSIDERED?Knowledge of the socio-economic situation and expected development for all of the population in the perimeter and by the chosen time ho-rizon is a required foundation for the approach to developing an SEP. The energy system has relevance for all activities contributing to socio-economic development. Socio-economic development is defined by considering values for the base year (reference situation) and for the target year; it includes characterisation of, notably:

Framework for a Smart Energy Path | A guide to sound energy decisions 19
• population data (headcount, age, number of households, dwellings); • economic data, such as activities involving all members of the
population (agricultural, crafts, trade), people’s income, poverty
level; • social and health data, such as the level of school attendance,
infant and maternal mortality rate, number of social and communal amenities (health, education, religion, markets, street lighting, leisure, etc.) either already existing or planned, and with which
energy services are associated; • environmental data such as local emissions of pollutants,
deforestation; • institutional data, such as existence of national or local policies and
strategies (e.g. village development plan; and • desired objectives for all of the above-mentioned elements.
The formulation of hypotheses concerning the population and eco-nomic activities that the future energy system will have to support is a prerequisite for consensus development of a vision of what the future energy system should be if it is to correspond to the goals for the tar-get year. The hypotheses may be relatively general (e.g. total popula-tion, number and make-up of households, breakdown of households between urban and rural areas, GDP per sector, etc.). The Millennium Development Goals can contribute to choice of hypotheses.
Most SEP studies adopt official figures on future population, household patterns, migration and economic growth. This allows a comparison, all economic and demographic hypotheses being otherwise equal, between conventional energy paths and “soft” paths. Holding demographic and economic assumptions constant allows the costs and benefits of adopt-ing the alternative energy path to be clearly related with the attributes of the soft energy technologies.
It may be useful to explore more than one scenario of demographic and economic activity when considering alternative energy strategies and policies. Understanding the sensitivity of the energy system to demo-graphic, migratory and economic variations helps foster development of energy plans that remain relevant in the face of a number of possible futures. Moreover, the exercise can lead to changes in policies in areas such as industrial and economic development that are not necessarily perceived as energy policies but which nevertheless are influential in determining the prospects for sustainable energy and ecodevelopment.

20 Chapter 2 | Framework for planning a smart energy path
We recommend starting with a single future: the government’s official projections for population and economic activity for the target year. Once a smart energy path has been developed for this future date, sen-sitivity analysis of the results to different starting assumptions about population and economic activity in the target year can be conducted (following the feedback loop between steps 7 and 1 in Figure 3). For example, consider the impacts on energy demand from various distri-bution scenarios for industrial activity between different sectors, for migratory flows between rural and urban areas and for population and economic growth.
STEP 2: BASE YEAR PROFILEHOW IS ENERGY CURRENTLY BEING USED?The aim of this step is to establish a quantitative and qualitative de-scription of the way energy is used in the base year, by source, sector, sub-sector and end use. Drawing up this profile – providing a view of the current situation, of the level and pattern of energy services pro-vided and of the gap between the current situation and goals for the future energy system – is one of the most important steps in conducting an SEP analysis. Lack of detailed data must not be seen as an obstacle. First, the initial level of description is qualitative; this is essential to un-derstand the nature of energy service needs and the ways in which they are met in the base year. Second, surveys can be organised if necessary, or proxies can be used for quantification. A field trip planned over a few days can be used to get an “idea” for the base year. A few weeks or even months will be necessary for surveys.
The first step is to create the general framework: a list of sectors, sub-sectors, fuels used, and energy services for each sector. The national energy balance should be used as the starting point plus other standard sources of information on fuel and electricity use that may be readily available, to define sectors and different types of fuels and electricity used. The qualitative aspects of the various energy uses – different heat temperatures for different uses, specific types of electricity, mobility – can then be evaluated.
Framework for a Smart Energy Path | A guide to sound energy decisions 21
SUB-SECTORSThe national energy balance will indicate the essential sector defini-tions: household, commercial/institutional, transportation, agriculture and industry. Subsectors should be differentiated as required on the basis of energy consumption patterns. The residential sector, for ex-ample, can be subdivided into rural, periurban and urban households in recognition of the distinct characteristics and source dependencies of these three types of households. This information will allow for a timely account of the likelihood that different policies and programmes may be required for these different types of communities. The indus-trial sector can be subdivided in terms of activities, particularly if there are one or two industrial subsectors that dominate production and that have unique energy use characteristics. In the case of commercial build-ings, there may be no need to further divide into sub-categories (e.g. offices, shops, schools, hospitals, etc.) and, even when division is desir-able, the data necessary to make it relevant to the analysis may not be available. It is possible to select two sub-sectors corresponding to one or two types of buildings of particular interest and worthy of separate analysis, the other buildings being integrated into a single “other build-ings” sub-sector. The transport sector must, at a minimum, be subdi-vided into personal and freight transportation, with additional disag-gregation by vehicle type or by trip type as required, and as permitted by the available data.
ENERGY SOURCESFor each sector, a list should be made of energy sources used or likely to be used in the future. Human and animal power should be included where they are known to be significant.
END USES AND ENERGY SERVICESA SEP analysis requires a breakdown of final energy use and of energy services. It does not matter if the list includes energy services for which the analysts know they will not be able to find data; the point of the exercise is to create a framework for understanding the different ways in which fuels and electricity are used. Lists will differ from one part of the world to another and even within a sector there may be significant differences in the way in which energy is used in different circumstanc-es: for example, the end uses in rural households may be somewhat different from the end uses in urban households.

22 Chapter 2 | Framework for planning a smart energy path
Table 3 describes the different aspects to be considered in an SEP analy-sis with an African focus, including socio-economic sub-sectors, energy uses and final energy forms.
TYPES OF SOCIO-ECONOMIC SECTORS
• Social services and infrastructure: health, education, drinking water pumping and supply.
• Community services and amenities: administrative centres, places of worship, markets, multi-purpose venues, street lighting.
• Structuring agricultural: irrigated areas under public or cooperative management (rural).
• Income generating activities: small agricultural (rural), craft or trade facilities.
• Industrial units: agro-food, metallurgical, textile and other industries.
• Passenger and freight transport.
• Households.
TYPES OF ENERGY USE
• Cooking, water heating, “three-stone” hearth, improved stoves, LPG stoves, solar stoves.
• Motive power (human and animal): carrying, milling, multi-function units, drinking water conveyance and distribution, standalone generators, craft machine tools, welding sets, vehicles and others.
• Lighting and other specific uses: oil lamps, hurricane lamps, bulbs, refrigerators, ventilators, telecommunications, IT devices, electrical appliances, air-conditioners and others.
TYPES OF FINAL ENERGY
TRADITIONAL ENERGY MODERN ENERGY
• Traditional biomass (collected, charcoal) and waste
• Animate motive power
• Lamp oil
• Electricity from reused vehicle batteries and other batteries
• “Illegal” electrical connections (“non-technical losses” on electricity grids)
• “Sustainable” biomass and charcoal (controlled forests and rural markets), biogas, sustainable liquid biofuels
• LPG
• Fuel oils
• Electricity from national grid / local grid
• Electricity from solar, wind, hydro, geothermal sources.
• Electricity from rechargeable batteries
TABLE 3. Socio-economic structures, energy uses and final energy forms

Framework for a Smart Energy Path | A guide to sound energy decisions 23
Table 4 illustrates a possible framework for the characterisation of en-ergy demand per sector or sub-sector, fuel and end use, including the activity unit applied for each sector.
SECTOR UNIT OF ACTIVITY SUB-SECTOR FUELS END-USE SERVICES
Residential No. of households RuralPeri-urbanUrban (apartment, house)
FuelwoodCharcoalElectricityBottled gasPiped gas
LightingCookingElectronicsWater pumpingRefrigerationAir conditioningHeating
Commercial Square metres of floor area
AdministrativeShopsSchoolsReligious buildingsHospitalsOther
Piped gasElectricityBottled gasFuel oil
LightingElectronicsAir conditioningHeatingMotors and equipmentHot water
Personal transport
Person-km or vehicle-km of travel
WalkingCycling and human-powered vehiclesMotorbikesCarsBusesTransit
GasolineDieselBiofuelBiodieselHuman powerAnimal power
Person-km of mobility
Freight transport
Tonne-km or vehicle-km of travel
Human-powered vehicles, cartsSmall trucksLarge trucks
DieselBiofuelGasolineHuman powerAnimal power
tonne-km of goods movement
Industry and Agriculture
Dollars or tonnes of output
CottonFood-processingCoffeePhosphatePalm ProductsMixed crop
Piped gasBottled gasBiomassElectricityBiofuelDieselBiodieselFuel oil
Process HeatMotive PowerStationary powerLightingInformation processing and electronicsHot water
TABLE 4. Example End-use Framework for Smart energy path Analysis

24 Chapter 2 | Framework for planning a smart energy path
ACTIVITY UNIT AND PENETRATION RATE The activity unit and penetration rate are important concepts in energy demand analysis that need to be defined. They can be used for estimates of energy consumption for a base year when corresponding data are not readily available and for modelling of future energy use scenarios.
With the simple formula below the values of these two parameters can be used to calculate energy consumption for any end use or particular service.
This formula is used in energy demand analysis in two important ways.
• First, to establish an energy profile for a base year. It is sometimes the case that there is more reliable information for activity units, penetra-tion rates and energy intensities than for actual energy consumption. In the above example, if the penetration rate and energy intensity for electric lighting are known (or can be reasonably estimated) and there are one million households, then the base year electricity consump-tion for household electric lighting can be estimated as: 1,000,000 (households) × 25% (penetration rate of electric lighting) × 100 kWh (energy intensity per household) = 25,000,000 kWh.
[ENERGY USE] = [ACTIVITY UNIT] X [PENETRATION RATE] X [ENERGY INTENSITY]
WHERE:
ACTIVITY UNIT is the driver of energy use. The most common choices are:• households for residential energy services and end uses
• square metres of floor area for commercial buildings
• person-kilometres of travel for personal transportation
• tonne-km or vehicle-km for freight transport
• output or value added (in currency or physical tonnes of output) for the agricultural and industrial activities.
PENETRATION RATE is the percent of the activity to which the energy service in question is applied. So for example, if 25% of households have electric lighting, then the penetration for calculating the energy needed or electric lighting in households is 25%.
ENERGY INTENSITY is the annual energy use per activity unit for the energy service. For example, if houses with electric lighting use 100 kilowatt-hours per household for electric lighting, then the energy intensity of electric lighting is 100 kWh per household.

Framework for a Smart Energy Path | A guide to sound energy decisions 25
• Second, the formula can also be used once the energy profile for the base year has been established, to estimate future energy consump-tion scenarios by varying the three parameters. Continuing with the example above: if the number of households for the target year is expected to reach 1.5 million (as per Step 1 – Scope), the propor-tion of households with electric lighting is assumed to be 40% and technological progress allows consumption of electricity for this type of service to be reduced by 20%, then electricity consumption for household lighting for the target year can be estimated to be: 1,500,000 (households) × 40% (penetration rate of electric lighting) × 80 kWh (energy intensity per household) = 48,000,000 kWh.
USING MODELSThe approach using estimation of past and future consumption of dif-ferent energy services can be applied with a wide spectrum of levels of sophistication, from the basic exercise illustrated above through to highly disaggregated schematics based on computer models enabling tracking of stocks and energy consumption flows for several buildings and several consuming load items and simulation of marginal changes in energy efficiency and fuel choices over time. There are many exhaus-tive energy planning computer models that can be used. However, the analyst may also use spreadsheets to record data and analyse measures envisaged in the planning framework. This method offers the unique advantage that, in designing and finalising spreadsheets, the analyst is faced with the actual problems to be solved and nothing else, since the tool developed will include only the functionalities needed. The ana-lyst’s work will be wholly transparent.
FILLING THE FRAMEWORK USING BASE YEAR DATAOnce a framework has been established for disaggregating energy con-sumption by sector, subsector, source and end use, the next task is to start filling in the data. The national energy balance will usually give totals for fuel and electricity for each sector, and sometimes for subsec-tors. An energy consumption table can then be built “from the bottom-up” using the sector totals by fuel in the energy balance to “calibrate” the exercise. As direct data on different energy services is rarely avail-able at the national level, the art of developing an energy consump-tion profile per energy service consists in using the available data with informed assumptions and deductive reasoning to create a plausible description of how the fuel and electricity use totals in the national energy balance break down by subsector and by energy service.

26 Chapter 2 | Framework for planning a smart energy path
There are a number of short-cuts and “tricks of the trade” that can help build the end-use service profile. Here are a few of them:
• Although there are, in theory, many possible subsector/fuel/en-ergy service combinations within the framework of Table 2, many of them are not practically relevant (e.g. charcoal/lighting, fuelwood/air conditioning) and in most situations four or five combinations of this type will cover practically all energy consumption for a given sector. So, while the overall framework may seem daunting, it will usually only be necessary to quantify a small number of subsector/source/energy service combinations.
• In some cases there is a very direct relationship between the en-ergy consumed for a particular sector/source combination (which can be found in the national energy balance) and the energy used for a given end use. For example, gasoline used in the transporta-tion sector is almost always used for transportation by automobile. Similarly, unless there are significant numbers of diesel cars in use, diesel fuel use in the transportation sector can be assumed to be for trucks. Biomass use in the household sector is for cooking and hot water, and kerosene use in the household sector can often be exclusively associated with lighting.
• There are very often surveys or even specific technical studies that shed light on the energy intensities of different end-use services in different sectors. As described above, this type of data can be combined with facts or estimates of activity levels and penetration rates to obtain reasonable estimates for a particular end use. In the industrial sector, there are often a small number of plants (some-times only one or two) that account for most of the industrial fuel and electricity consumption. With cooperation from these firms, information about their fuel and electricity end uses can go a long way towards determining the details of energy consumption in the industrial sector.
• For any particular end-use service, energy intensities will tend to be fairly uniform or be limited to a small number of values that reflect subsector attributes or variations in local circumstances. For example, the energy use per square metre of office building floor area will generally not be too different from one office building to the next, at least within a particular city. If information about the
Framework for a Smart Energy Path | A guide to sound energy decisions 27
end use profiles for the office buildings sub-sector or even for one or two “typical” buildings can be obtained (there may have been a building energy audit or the utility may have data) and if the total floor area of offices is known or can be estimated, these three items of information can be combined to produce an estimate of the total energy consumption per end use for all of the office buildings.
• When using methods like this it is important to remember that the purpose of the exercise is not to produce the most accurate possible measurement of energy consumption by subsector and by service to end users but to obtain a credible and plausible “bottom-up” ex-planation of how energy is used, while ensuring that sector totals match the national energy balance. It is not necessary to be overly precise, nor is it necessary to count every sub-sector/end-use ser-vice combination, or to get the base year profile “perfect” before moving on to the other energy planning steps. The profile can be continuously updated and improved as knowledge of energy de-mand patterns develops.
STEP 3: RESOURCES AND TECHNOLOGIES INVENTORYWHAT ENERGY RESOURCES AND TECHNOLOGIES ARE AVAILABLE, WITH A FOCUS ON TECHNOLOGIES THAT IMPROVE EFFICIENCY?This step can commence at the outset and continue in parallel with other activities throughout the planning cycle. It involves identifying candidate energy efficiency and renewable energy supply and demand technologies for inclusion in SEP planning. In this step, the focus is on technologies and techniques that increase the long-term viability, effi-ciency, resilience and environmental performance of the energy system (for example, replacing kerosene lamps with solar powered lighting). The aim here is not to highlight policy and programme measures to ac-celerate deployment of the technologies; such policy and programme measures are considered in Step 6.
On the demand side, work involves the systematic assessment of the po-tential for improved energy efficiency for each sector and each end-use service. For technologies improving energy efficiency, key information includes the marginal reduction in energy intensity that the technology can achieve, and the capital cost associated with this improvement. For

28 Chapter 2 | Framework for planning a smart energy path
new equipment, this means the marginal cost, if any, of the energy-improving technology and the marginal reduction it achieves relative to the status quo. In the case of building retrofits, the relevant data includes the cost of the retrofit and the amount of energy saved relative to the building’s consumption prior to the retrofit.
For supply side technologies, the goal should be to produce a compre-hensive assessment and mapping of the availability of the various re-newable energy resources, including their capital and operating costs. In addition, the vulnerability of the energy source to climate change should also be assessed.
STEP 4: ENERGY SYSTEM GOALSWHAT IS THE DESIRED FUTURE?This step involves setting targets for various attributes of the energy system to be achieved by the SEP planning target year. To an extent, these goals are embodied in the nature of ecodevelopment and the smart energy path itself: a reliance on clean renewable energy, decen-tralised matching of energy sources to demands in terms of quantity and quality, and a commitment to diverse, flexible and “user-friendly” technologies that support participatory governance, community self-reliance and environmental sustainability.
In SEP planning, goals for the attributes of the energy system should be explicit and used to guide technological choices in the development of the plan. The goals will depend on local circumstances and the priorities governing the particular planning exercise; the following are some of the attributes of the energy system for which goals could be set:
• Greenhouse gas emissions from the energy sector (TIPEE 110). • Concentration or emission levels of predominant local pollutant
(TIPEE 2). • Proportion of households with access to clean cooking fuel (EDI11). • Percentage of electricity provided by renewables. • Hectares of deforestation due to energy uses (TIPEE 3). • Proportion of households with access to electricity (EDI, TIPEE 4). • Per capita household electricity consumption (EDI).
10. For reference and numbering of TIPEE indicators see Table 1.
11. EDI: the International Energy Agency’s Energy Development Index.

Framework for a Smart Energy Path | A guide to sound energy decisions 29
• Proportion of household income spent on energy services (TIPEE 5). • Hours per week per household spent in fuel and water procurement. • Target for access to modern energy services for health and
educational infrastructure, places of worship, water pumping, markets, street lighting, productive activities.
• Improved household penetration. • Electrical independence (not dependent on national grid) (TIPEE 6). • Weight of expenditure for energy in household budgets (TIPEE 5). • Energy intensity of industrial production (TIPEE 9). • Energy intensity of the economy (TIPEE 9). • Number of recorded cases of illness from energy-related atmospheric
pollution. • Total national investment in clean energy infrastructure and
technologies. • Per capita electricity consumption in the public sector (EDI). • Percentage of total energy use in productive sectors (EDI). • Local renewable energy supplies (TIPEE 8). • Duration and frequency of power cuts (TIPEE 10). • Percentage of energy revenue escaping income tax (TIPEE 11). • Proportion of national investment in renewable energy (TIPEE 19). • Number of science and engineering graduates in the population
(TIPEE 20). • Length of transmission lines threatened by extreme weather
conditions (TIPEE 17). • Number of citizens, and particularly of women, involved in energy
planning (TIPEE 13). • Balance between demand side and supply side actors in energy
planning (TIPEE 14). Some of these lend themselves to the quantitative dimension of energy planning and some do not. Furthermore, this is only a partial and illus-trative list. Analysts must ask themselves: what are the most important attributes of the energy system that stakeholders would like to see im-proved through the implementation of a smart energy path?
SOFT ENERGY AND LEAST COST ENERGYSeveral SEP studies have used a “least cost” criterion to determine the demand and supply options included in the plan. Given that some new (soft) energy options – energy efficiency in particular – are much less expensive than conventional energy, this will usually result in an en-

30 Chapter 2 | Framework for planning a smart energy path
ergy plan that is much “softer” than a purely business-as-usual plan. This least cost approach has the advantage of leading to an energy plan that will be demonstrably economical in the narrow sense of the term, bearing in mind, however, that it will not necessarily achieve the levels of efficiency, renewability and resilience required to achieve the goals of sustainable ecodevelopment.
It has been determined that very often dividing the incremental cost represented by investing in an energy efficiency improving technol-ogy (when spread over the life of the technology, i.e. annualised) by the annual fuel or electricity savings achieved by the technology gives a “saved energy cost” (i.e. a monetary value per Joule or kWh saved) which is lower than the incremental cost of supplying an additional unit of energy. This finding created interest in “least cost energy planning” in which the goal was an energy system in which costs were minimised by ensuring that supply and demand alternatives were compared on a “level playing field”, using symmetrical methods. Even without includ-ing the costs of the environmental externalities, which were one of the main reasons for adopting the smart energy path, least-cost planning would very often favour investments in the soft energy technologies because they could be shown to be cheaper. Smart energy path plans were often produced that were actually more like least-cost energy plans insofar as energy system choices were limited to solutions that could be shown to be less expensive than the conventional “hard path” alternatives.
The “least cost” objective is a legitimate criterion for guiding energy plan-ning exercises. It will almost always result in a “softer” energy path than “business-as-usual”. Such a strategy is particularly effective at highlight-ing the policies and market barriers that have resulted in current energy systems that are not the least costly solutions. When the energy security and environmental objectives of energy policies were more modest than those made necessary by the threat of climate change, by globalisation of toxic and radioactive pollution or by the goals of ecodevelopment, a least-cost approach was sufficient to point out the significant saving potential from energy efficiency, as much as 30% or more, compared to business-as-usual. However, SEP planning goes beyond the least-cost approach. This does not mean it results in a more expensive energy system! On the con-trary, it is the soft path approach, with its emphasis on efficiency and re-newable energy, which offers the greatest promise for avoiding the incal-culable costs of perpetual poverty, ecosystem collapse and climate change.
Framework for a Smart Energy Path | A guide to sound energy decisions 31
STEP 5: BALANCING ENERGY SUPPLY AND DEMAND FOR THE TARGET YEARSATISFYING FUTURE DEMANDS WITH AVAILABLE RESOURCES AND TECHNOLOGIESThis is where all the work done in the previous steps comes together in an energy supply and demand scenario for the target year. The scenario can be built with different levels of complexity, ranging from a simple spreadsheet balance to a large and data-intensive computer modelling exercise. The central objective is the same in each case: to combine the supply and demand resources identified above in Step 4 with the demo-graphic and economic future identified in Step 1 to achieve an energy balance meeting the goals for the energy system defined in Step 2.
The simple formula described in Step 2 can form the basis for developing future scenarios. The product of future activity levels (e.g. households, floor areas of commercial buildings, personal and freight transporta-tion, industrial and agricultural output), penetration rates, and energy intensities (from the Step 3 research) gives energy use in the target year at the level of disaggregation by subsector and end use applied in the research and data collection.
THE “OPTIONAL REFERENCE” PROJECTION Usual practice in SEP analysis is to generate a “reference projection”, that is to say a purely business-as-usual energy-use future based on extrapolation of current levels, trends and policies. The reference pro-jection is not a forecast, or does not need to be. Its purpose is to provide a point of reference for the analysis of measures, and to clarify the rela-tionship between projected population, economic activity and the cor-responding levels and patterns of energy-use services. It then serves as a starting point for an analysis that aims to reduce the intensity of fuel and electricity consumption, increase energy efficiency, and switch to carbon-free energy sources. It can be generated from a computer model and highly sophisticated treatment of the evolution of the contribution of each source and of its energy efficiency within a detailed stock-and-flow representation of energy-using equipment, or it can be generated very simply with a spreadsheet and broad-brush assumptions.

32 Chapter 2 | Framework for planning a smart energy path
STEP 6: POLICIES AND PRIORITY PROJECTSWHICH POLICIES AND MEASURES WILL SUPPORT DEPLOYMENT OF THE DESIRED AND NECESSARY TECHNOLOGIES?Once a scenario of the future energy balance has been obtained for the target and selected intermediate years, the next step is to identify the policy measures that would be required to deploy the technologies in the backcasting scenario at a rate that will ensure they are in place by the target year.
Within the energy system, there are well developed policy strategies for accelerating the deployment of new technologies on the supply and demand side, notably financial incentives, regulations, direct public in-vestment, information and training programmes, etc.
National SEP managers have identified a wide range of tools for short, mid and long term use. HELIO International’s Guide for Decision Makers12 presents 36 examples of possible instruments.
WHAT ARE THE PRIORITY PROJECTS?In addition to developing a set of policies for implementing the SEP scenario, it is also useful at this stage to identify certain specific priority projects. The target-driven nature of the SEP approach lends itself to the identification of focused campaigns, e.g. achieving 50% penetra-tion of household electricity access or building a specified number of village-based photovoltaic power systems, etc. Criteria for identifying and prioritizing projects should be developed and should also include emphasis on their attractiveness to outside investors.
WHAT ARE THE SOURCES OF FINANCING?Energy projects designed with the SEP approach are in line with the principles of ecodevelopment and, notably, make use of encouraged al-ternative practices. Insofar as they help to combat climate change, they are eligible for financing made available specifically for that purpose. This financing comes under industrial countries’ public development aid (PDA) programmes (bilateral or multilateral agreements). Develop-ing countries also have access to financing directed more specifically at preventing climate change. A deeper analysis in the light of policies and priority projects will enable development of a “roadmap” to establish
12. http://www.helio-international.org/project/eera

Framework for a Smart Energy Path | A guide to sound energy decisions 33
contact with national and international institutions to establish condi-tions of access to financing.
STEP 7: EVALUATE PROGRESS, ITERATE, MAKE JUDGEMENTSSEP planning is a process of continuous adaptation in which results are compared with the target attributes of the energy system (Step 3), followed by a repeat of the exercise from Step 1 through Step 7 (with the exception of Step 2, the base year profile, which does not need to be repeated).

34
AN EXPERT MANAGEMENT TEAM WITH VARYING BACKGROUNDSThe SEP approach requires a mix of technical expertise and inter-per-sonal skills to ensure full stakeholder participation. On the technical side, it requires the ability to research and evaluate technology options, analyse their respective costs and benefits, and conduct integrated, quantitative analysis. In this context, availability of data is always an is-sue, and an innovative, flexible and pragmatic approach to the problem is required. The “participation” component of SEP, for its part, requires good facilitation skills, an ability to understand and empathise with stakeholder objectives, and to work closely with the technical team to ensure that stakeholders’ requirements and the information they pro-vide are actually taken into account in the technical analysis and sce-nario development.
In the early stages, the participants, i.e. the project initiators, are often civil servants and politicians, possibly with the assistance of experts (consultants, NGOs, universities). They may form a key technical group responsible for technical analysis and stakeholder mobilisation.
Indeed, almost all ministries and government agencies need to be in-volved via their representatives if SEP planning is to be successful: fi-nance, science and technology, skills development and education, envi-ronment, health, energy planning, agriculture, housing, infrastructure, economics and industry. In this context, each agency and ministry must grasp the usefulness of the SEP process in attaining important objec-tives that are of direct relevance to them. Not-for-profit organisations, universities and funding agencies may also be involved.
CHAPTER 3
STAKEHOLDER AND PUBLIC INVOLVEMENT THE KEY TO SUCCESS

Framework for a Smart Energy Path | A guide to sound energy decisions 35
All of these stakeholders – who can be grouped in seven categories, are directly or potentially concerned by the development of energy policies and strategies (Figure 4) – can participate in a liaison committee support-ing and monitoring the overall approach (Figure 5).
PUBLIC BODIES PROVIDERS OF GOODS AND SERVICES
PROVIDERS OF GOODS
AND SERVICES
Public institutions develop and implement energy policies and sectoral policies, regulations and monitoring; they also instigate policy. There are several levels of organisation:• Supranational: economic
communities, energy pools;
• Centralised national: all ministries, government agencies, centralised and devolved departments, regulatory commissions, etc. including sectoral departments (health, education, agriculture, industry, spatial planning, etc.);
• Decentralised national: all local authorities, appointed or elected (regional, municipal).
Involved in energy delivery.Firms and NGOs providing services such as design, management, legal advice, economic studies, energy service operation, transport, etc., procurement of energy producing equipment when this is not provided by the energy operator.
For example, design engineering firm, system installer, private individual generating electricity sold to an energy operator, energy service operator.
Public or private companies supplying final energy: electricity companies, oil companies, energy distributors, cooperatives of charcoal producers or carriers, etc.
USERS AND BENEFICIARIES
(INDUSTRIES, HOUSE-HOLDS, FARMS)
FINANCIAL SERVICES FACILITATORS
INTERNATIONAL FINANCING
INSTITUTIONS
People and legal entities using energy services.
These are customers of energy operators and energy services. They may also be energy producers.
Banks and loan and micro-credit establishments providing local financial support to project owners, operators, firms and households.
Any actor concerned indirectly by the service to be provided, notably members of civil society playing a catalysing role: research and standards organisations, universities, NGOs, consumer groups, journalists, trade unions, etc.
The IFIs are involved directly in setting up energy programmes aimed specifically at poverty alleviation. They are multi-lateral and bilateral funding agencies.
FIGURE 4. The seven categories of stakeholders concerned by energy policy and implementation of energy programmes

36 Chapter 3 | Stakeholder and public involvement the key to success
The example of multi-sectoral committees can also provide a basis for mobilisation of stakeholders.
TECHNICAL TEAM LIAISON COMMITTEE
MAIN RESPONSIBILITY Research and analysis of the country’s current and future energy situation.
MAIN RESPONSIBILITY Interface between the technical team and main decision makers.
SPECIFIC RESPONSIBILITIES Evaluation of national resources to meet present and future energy service needs by study of demand and supply.Use of these results to design an SEP within an ecodevelopment framework actively involving all of the country’s energy sector stakeholders. Collect and share lessons learned and experience gained in the country in terms of decision making processes and prospective studies in the area of energy.
SPECIFIC RESPONSIBILITIES Ensuring that the principles of an SEP in line with ecodevelopment criteria are shared by the stakeholders and, notably, by decision makers.Examination of the position of energy services in regional, national or local projects, programmes and policies (fighting poverty, energy, economic development, etc.) and recommending of corresponding legal and institutional measures to competent authorities.
TYPICAL MEMBERSHIP Small number of people (5–6) available to work on data collection and analysis and mobilisation of stakeholders, expert energy analysis, climate change, environment, ability to think beyond conventional energy indicators. Ideally: Experts from ministries in charge of energy, environment and from civil society.
TYPICAL MEMBERSHIP Members are from the main bodies involved directly and indirectly with energy and ecodevelopment issues. Some participants may also represent social or productive sectors such as health, education, water, rural development, etc. from specialist ministries and agencies or NGOs sensitive to the advantages of developing energy services in their sector of activity.
NATIONAL SEP APPROACH (UNDER THE MINISTRY OF ENERGY OR DEVELOPMENT)
FIGURE 5. Two teams at two levels of intervention.
CASE STUDY:
National Multi-sectoral Energy Committees in Africa
Born at the start of the 21st century, the multi-sectoral approach had high ambitions. “Multi-sectoral energy groups” have been created in most African countries by and within the ministries responsible for energy. They include representatives from the sectoral ministries (health, education, etc.), cross-cutting organisations (ministries for economy, those tasked with decentralisation, in charge of poverty alleviation strategies), and sometimes representatives from civil society, private enterprise, and finan-cial organisations. Creating such groups was a definite success: “clients” (potential users of energy

Framework for a Smart Energy Path | A guide to sound energy decisions 37
DESIGN OF AN SEP PARTICIPATION PROTOCOLParticipatory governance is the cornerstone of ecodevelopment and the SEP focus on energy services provides a solid and pragmatic justifica-tion for participation of the public, local actors and as wide a range as possible of government officials. Such participation is effective proof of the essential nature of SEP for implementation of new technologies that are better distributed on both the demand and supply sides.
The project initiators’ initial task is to examine the reason why they need a soft energy plan. An examination of the need must consider alternative ways to meet that need (i.e. other energy planning methods including the consequences of doing nothing – the business as usual or null hypothesis). All parties to the project must feel they have a stake in the success of the SEP planning process and must be aware that, in comparison to other energy planning methods, SEP achieves the most benefits for the greatest number.
Each participant in the SEP process must also understand why they are involved and why the others are involved. This understanding can only be reached if everyone’s aspirations are clear to all. A profession-al facilitator can be helpful to keep all government departments and agencies engaged in seeking common ground wherever it exists and to regularly check back with participants to see that their views are being given proper consideration. To ensure that all government agen-cies and ministries cooperate to attain mutually favourable results, common objectives must be laid down in writing and diversity of opin-ion must be respected.
services on the demand side) and suppliers (energy operators) at last had the opportunity for dialogue, to understand one another and undertake joint programmes for better access to energy services.
But the limits to the actions of multi-sectoral energy groups also became evident. Absence of a suitable method to identify and rank energy service needs prevented the groups from acquiring a degree of legitimacy that was essential for their action. In addition, it was necessary to adapt countries’ legal and institutional frameworks for energy access programmes to be implemented. The notion of “energy service” is wholly absent from legislation in most countries.

38 Chapter 3 | Stakeholder and public involvement the key to success
The document “Backgrounder: Successful Stakeholder Engagement”13 il-lustrates the way in which a participation protocol can contribute to every stage of an SEP.
SEP planning is an iterative process that needs to be refined regularly, every few years or more frequently depending on circumstances. It can be hoped that a country’s energy situation will improve as the SEP plan produces tangible results for energy efficiency and self-sufficiency of energy supply.
BENEFITS FOR ALL
In the context of energy, the term “cobenefits”, short for “collateral ben-efits” refers to outcomes of the energy plan which are not the direct goals of the plan but that are nevertheless beneficial and that are often important justifications for supporting the plan. A few examples:
• EMPLOYMENT. An energy plan that emphasizes energy efficien-cy will generally create more employment per dollar of investment than an energy plan that emphasizes investments in central power plants.
• AIR QUALITY. An energy plan that emphasizes renewables and energy efficiency will have lower emissions of both indoor and out-door air pollutants.
• COMPETITIVENESS. Efforts to improve energy efficiency not only save the direct costs of the saved energy but the focus on the end-use services and processes required to identify the energy ef-ficiency opportunities very often lead to better supply-chain per-formance, internal operation efficiencies, and increased institutional capacity that enhance overall competitiveness and innovation ca-pacity.
• BALANCE OF PAYMENTS. For oil importing economies, energy plans that emphasize efficiency and the development of indigenous supplies of distributed energy can have the significant cobenefit of re-ducing the foreign exchange earnings needed to pay for imported oil.
13. http://www.helio-international.org/toolkit/sep

Framework for a Smart Energy Path | A guide to sound energy decisions 39
• SCIENTIFIC AND TECHNOLOGICAL CAPACITY BUILDING. An energy plan that matches energy end uses and supplies with local resources stimulates indigenous technological know-how and capacity, both in short supply in developing countries.
• ECONOMIC AND SOCIAL BENEFITS. Saving energy saves money, and energy plans that give priority to efficiency of energy service provision free up financial resources for other economic development objectives and social programmes, or for accelerated deployment of energy solutions.
• STRENGTHENED DEMOCRACY. An energy plan that deliber-ately engages stakeholders, communities and service providers in the identification of solutions for energy service needs will inevita-bly lead to strengthened democracies.
• SELF-RELIANCE. An energy plan that seeks to match energy end-use service demands with local and indigenous resources leads to a greater level of self-reliance at both the community and the national level.
• REDUCED DISPARITY BETWEEN RICH AND POOR. An en-ergy plan that focuses on energy services results in more energy service being delivered per unit of fuel or electricity consumed, and this differentially helps the poor who utilize technologies with the lowest efficiencies and who have the lowest level of energy services.
These are just a few examples and cobenefits often emerge unexpect-edly as the energy plan progresses. In fact, the cobenefits of an energy plan are often more highly valued than the direct energy outcomes of the plan, and energy planners who keep this in mind will often find that support for their proposals will depend on the extent to which they are able to demonstrate the cobenefits their plan may deliver.
The SEP protocol starts with an assessment of the demand for energy services and gives priority to the earliest possible involvement of stake-holders in development of the energy plan – stakeholders whose first concern will be “how can the energy plan help me?” – the approach to energy planning described in this guide virtually guarantees that cobe-nefits are an important component.
40
Energy planning is far less problematic in industrialised economies than in developing countries, where there are typically large differences be-tween the current situation and the prospects for improvement, be-tween urban and rural areas and between the rich and the poor. Al-though it is true that supply-orientated energy strategies based on grid transmission of centrally generated electricity, requiring ever increasing amounts of usually imported fossil fuels, have provided for some in-dustrial growth and met the transportation and modern energy service demands of urban elites, these strategies have also proven a slow and costly path to self-reliant economic development, and barely a trickle of the supply reaches the rural and urban poor.
Poverty is characterised by low levels of energy services, sometimes even inadequate to meet basic human needs. The prime focus of energy policies is often to increase supply of electricity and fossil fuels, disre-garding the fact that the infrastructure to guarantee reliable access to this energy is costly and concentrated essentially in urban areas. Even in urban areas, and in rural areas where the grid is available, connection costs and electricity tariffs make access to the grid unaffordable for poor households, which remain reliant for their energy supply on their own labour, gathered fuelwood, and kerosene for lighting.
Conversely, the SEP planning approach outlined in this guide – with its emphasis on energy services and the priority it gives to improved energy efficiency – can make the energy sector a true instrument for sustainable development. An energy plan that starts with an assess-ment of energy service needs is more likely to identify technologies and solutions that will be effective in promoting self-reliant development than a plan that assumes a “trickle down” effect from increased supplies of centralized grid electricity and more imported fossil fuels. This is not to say that there will not be a role for increased electrification and in-
CHAPTER 4
CONCLUSION
Framework for a Smart Energy Path | A guide to sound energy decisions 41
creased use of fossil fuels in developing country energy strategies. But the SEP approach described in this manual, with its focus on access to energy service for all, will point the way to many other strategies for promotion of development, strategies that are often overlooked alto-gether in the traditional, supply-orientated approach to energy.
Amongst all of the characteristic aspects of the SEP approach, the im-portance given to improving energy efficiency is capital. Each marginal improvement in the efficiency with which a barrel of oil or a kilowatt of electricity is used frees energy that can be used to supply additional energy service elsewhere.
The focus on energy services also draws attention to the critical role of biomass and human and animal energy, particularly in the less de-veloped countries. Even with a concerted effort on electrification and increased mechanisation of agriculture, human and animal energy will continue to be important in those countries in coming decades. That is why improving the efficiency with which these energy sources are ap-plied will be a particularly effective strategy for supporting ecodevelop-ment in some places.
The SEP approach provides tools to design an energy plan that is tai-lored to the unique circumstances and aspirations of each individual situation. Its central focus on the energy efficiency of services provided to end users and its emphasis on participation of everyone concerned by the plan supports the identification of solutions and strategies that are often missed by more “top down”, supply-orientated approaches. SEP planning contributes to the emergence of resilient communities that, even in periods of uncertainty, will be able to undertake their own ecodevelopment.
“The challenges facing societies in the third millennium oblige us to reflect on the types of communities that could lead to a higher structure and that could, simultaneously, ensure their present-day survival so as to develop and evolve.”
Dolores Garcia-Téllez, in «L’évolution de la noosphère. Nouvel ordre, nouvelle civilisation, nouvelle communautés» page 41, Teilhard aujourd’hui, January 2013.

42
Brooks David B., John B. Robinson and Ralph D. Torrie, 1983. 2025: Soft Energy Futures for Canada. Friends of the Earth Canada for Energy Mines and Resources Canada, Ottawa.
Connor-Lajambe, Hélène, L’autonomie énergétique du Québec dans une perspective écologique, Futuribles “Analyse-Prévision-Prospective”, June 1981, pp 33-55.
Communauté économique des États de l’Afrique de l’Ouest, 2006. Livre blanc pour une politique régionale. CEDEAO, 64p. http://www.energyaccessafrica.org/index.php/fr/bibliotheque/finish/36-lb/128-cedeao-livre-blanc/0
Guibert C. et J. Debreu, 2013. Africa Express, Livre blanc des énergies durables en Afrique, Guides des bonnes pratiques, MkF éditions, 144p.
Institut Francophone pour le Développement Durable, 2013. La transition énergétique ou les énergies que nous aurons. Liaison-Énergie-Francophonie, Numéro 93, 1er trimestre 2013, 135p. http://www.ifdd.francophonie.org/media/docs/publications/542_LEF93_web.pdf
International Renewable Energy Agency, 2013. L’Afrique et les énergies renouvelables: la voie vers la croissance durable ». IRENA, 36p. http://www.irena.org/DocumentDown-loads/Publications/Afrique_%C3%A9nergies_renouvelables.pdf
Lovins A., 2013. Réinventer le feu: des solutions économiques novatrices pour une nouvelle ère énergétique. Rue de l’échiquier, 448p.
Lovins A., 1977. Soft Energy Paths. Towards a durable peace. Penguin Books.
Mutombo E. J. K., T. Bauler et G. Wallenborn, 2007. Méthodes participatives de prospective et de planification pour un développement durable: analyse d’approches et de réalisations. Université Libre de Bruxelles, 166p. http://www.belspo.be/belspo/organisation/publ/pub_ostc/AP/rAP22_fr.pdf
Robinson J., 2003. Future Subjunctive: Backcasting as Social Learning. Futures 35:8, 839-856.
Robinson J., S. Burch, S. Talwar, M. O’Shea, M. Walsh, 2011. Envisioning sustainability: Recent progress in the use of participatory backcasting approaches for sustainability research, Technological Forecasting and Social Change, Volume 78, Issue 5, 756-768.
REFERENCES
ANNEXES
ANNEX 1 BIBLIOGRAPHY

Framework for a Smart Energy Path | A guide to sound energy decisions 43
Rojey A., 2008. Energie et climat - Réussir la transition énergétique, TECHNIP, 216p.
Salomon T. et M. Jedliczka, 2013. Changeons d’énergies - transition, mode d’emploi, Actes Sud/Colibris/Association négaWatt, 112p.
Salter J., J. Robinson. and A. Wiek, 2010. Participatory methods of integrated assessment—a review. WIREs Clim Change, 1: 697–717.
Sarr S. et J-P Correa, 2005. Liens services énergétiques et développement: Quels im-pacts potentiels », ENDA, Sénégal, 12p. http://deafrica.net/Country%20Background/S%C3%A9n%C3%A9gal%20background%20paper-French.pdf.
Waldron D., 2006. Quelle méthode pour imaginer le futur énergétique de nos cités? http://www.energy-cities.eu/IMG/pdf/imagine_session5_waldron_fr.pdf
RELEVANT HELIO GUIDES AND REPORTSHELIO International (2009). Climate-proofing energy systems /Climatiser les systèmes énergétiques. http://helio-international.org/wp-content/uploads/Global-Report.En_.pdf
HELIO International (2012)., Manuel TIPEE: Politique énergétique et écodéveloppement. Manuel d’accompagnement destiné aux planificateurs. http://www.helio-international.org/ManualFinal.pdf
HELIO International (2012). Guide pour les décideurs énergétiques. Choisir l’écodéveloppement. http://helio-international.org/wp-content/uploads/Guide_decision-makers.pdf
HELIO International (2014). Guide pour les décideurs énergétiques, update. http://www.helio-international.org/project/eera
DATA SOURCESRenewable Energy and Energy Efficiency Partnership. http://www.reegle.info
International Renewable Energy Agency. http://www.irena.org
Centre pour les Énergies Renouvelables et l’Efficacité Énergétique de la CEDEAO. http://www.ecreee.org
Observatoire de la CEDEAO pour les Énergies Renouvelables et l’Efficacité Énergétique. http://www.ecowrex.org
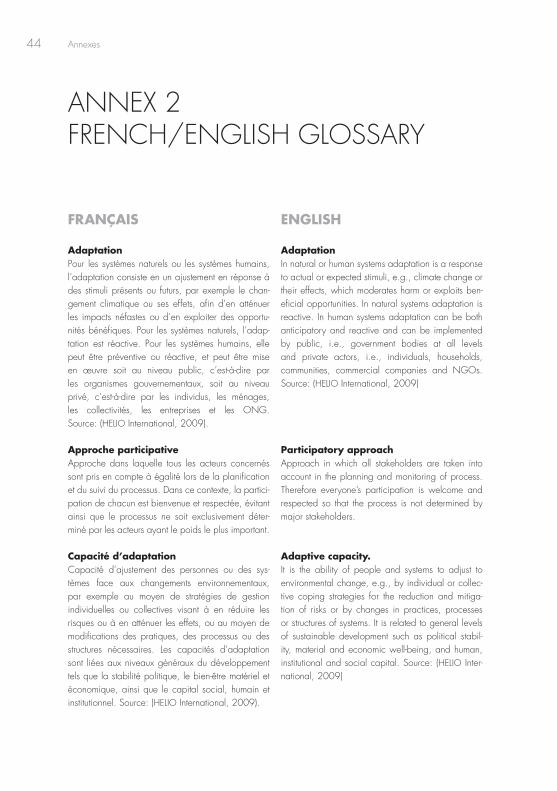
44 Annexes
Adaptation Pour les systèmes naturels ou les systèmes humains, l’adaptation consiste en un ajustement en réponse à des stimuli présents ou futurs, par exemple le chan-gement climatique ou ses effets, afin d’en atténuer les impacts néfastes ou d’en exploiter des opportu-nités bénéfiques. Pour les systèmes naturels, l’adap-tation est réactive. Pour les systèmes humains, elle peut être préventive ou réactive, et peut être mise en œuvre soit au niveau public, c’est-à-dire par les organismes gouvernementaux, soit au niveau privé, c’est-à-dire par les individus, les ménages, les collectivités, les entreprises et les ONG. Source: (HELIO International, 2009).
Approche participativeApproche dans laquelle tous les acteurs concernés sont pris en compte à égalité lors de la planification et du suivi du processus. Dans ce contexte, la partici-pation de chacun est bienvenue et respectée, évitant ainsi que le processus ne soit exclusivement déter-miné par les acteurs ayant le poids le plus important.
Capacité d’adaptation Capacité d’ajustement des personnes ou des sys-tèmes face aux changements environnementaux, par exemple au moyen de stratégies de gestion individuelles ou collectives visant à en réduire les risques ou à en atténuer les effets, ou au moyen de modifications des pratiques, des processus ou des structures nécessaires. Les capacités d’adaptation sont liées aux niveaux généraux du développement tels que la stabilité politique, le bien-être matériel et économique, ainsi que le capital social, humain et institutionnel. Source: (HELIO International, 2009).
AdaptationIn natural or human systems adaptation is a response to actual or expected stimuli, e.g., climate change or their effects, which moderates harm or exploits ben-eficial opportunities. In natural systems adaptation is reactive. In human systems adaptation can be both anticipatory and reactive and can be implemented by public, i.e., government bodies at all levels and private actors, i.e., individuals, households, communities, commercial companies and NGOs. Source: (HELIO International, 2009)
Participatory approachApproach in which all stakeholders are taken into account in the planning and monitoring of process. Therefore everyone’s participation is welcome and respected so that the process is not determined by major stakeholders.
Adaptive capacity.It is the ability of people and systems to adjust to environmental change, e.g., by individual or collec-tive coping strategies for the reduction and mitiga-tion of risks or by changes in practices, processes or structures of systems. It is related to general levels of sustainable development such as political stabil-ity, material and economic well-being, and human, institutional and social capital. Source: (HELIO Inter-national, 2009)
FRANÇAIS ENGLISH
ANNEX 2 FRENCH/ENGLISH GLOSSARY
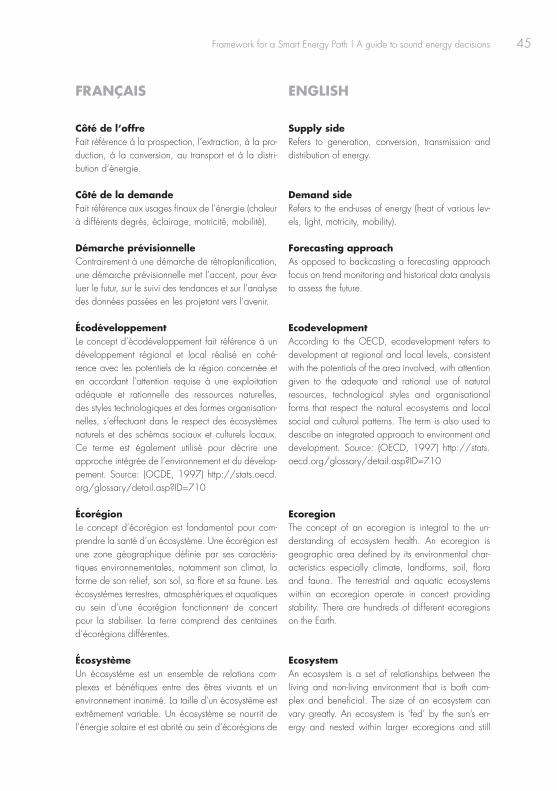
Framework for a Smart Energy Path | A guide to sound energy decisions 45
Côté de l’offreFait référence à la prospection, l’extraction, à la pro-duction, à la conversion, au transport et à la distri-bution d’énergie.
Côté de la demandeFait référence aux usages finaux de l’énergie (chaleur à différents degrés, éclairage, motricité, mobilité).
Démarche prévisionnelleContrairement à une démarche de rétroplanification, une démarche prévisionnelle met l’accent, pour éva-luer le futur, sur le suivi des tendances et sur l’analyse des données passées en les projetant vers l’avenir.
ÉcodéveloppementLe concept d’écodéveloppement fait référence à un développement régional et local réalisé en cohé-rence avec les potentiels de la région concernée et en accordant l’attention requise à une exploitation adéquate et rationnelle des ressources naturelles, des styles technologiques et des formes organisation-nelles, s’effectuant dans le respect des écosystèmes naturels et des schémas sociaux et culturels locaux. Ce terme est également utilisé pour décrire une approche intégrée de l’environnement et du dévelop-pement. Source: (OCDE, 1997) http://stats.oecd.org/glossary/detail.asp?ID=710
ÉcorégionLe concept d’écorégion est fondamental pour com-prendre la santé d’un écosystème. Une écorégion est une zone géographique définie par ses caractéris-tiques environnementales, notamment son climat, la forme de son relief, son sol, sa flore et sa faune. Les écosystèmes terrestres, atmosphériques et aquatiques au sein d’une écorégion fonctionnent de concert pour la stabiliser. La terre comprend des centaines d’écorégions différentes.
ÉcosystèmeUn écosystème est un ensemble de relations com-plexes et bénéfiques entre des êtres vivants et un environnement inanimé. La taille d’un écosystème est extrêmement variable. Un écosystème se nourrit de l’énergie solaire et est abrité au sein d’écorégions de
Supply side Refers to generation, conversion, transmission and distribution of energy.
Demand sideRefers to the end-uses of energy (heat of various lev-els, light, motricity, mobility).
Forecasting approach As opposed to backcasting a forecasting approach focus on trend monitoring and historical data analysis to assess the future.
EcodevelopmentAccording to the OECD, ecodevelopment refers to development at regional and local levels, consistent with the potentials of the area involved, with attention given to the adequate and rational use of natural resources, technological styles and organisational forms that respect the natural ecosystems and local social and cultural patterns. The term is also used to describe an integrated approach to environment and development. Source: (OECD, 1997) http://stats.oecd.org/glossary/detail.asp?ID=710
EcoregionThe concept of an ecoregion is integral to the un-derstanding of ecosystem health. An ecoregion is geographic area defined by its environmental char-acteristics especially climate, landforms, soil, flora and fauna. The terrestrial and aquatic ecosystems within an ecoregion operate in concert providing stability. There are hundreds of different ecoregions on the Earth.
Ecosystem An ecosystem is a set of relationships between the living and non-living environment that is both com-plex and beneficial. The size of an ecosystem can vary greatly. An ecosystem is ‘fed’ by the sun’s en-ergy and nested within larger ecoregions and still
FRANÇAIS ENGLISH

46 Annexes
plus grande taille appartenant elles-mêmes à des éco-zones encore plus étendues. Les cycles d’échange d’énergie et d’éléments nutritifs qui prennent place dans l’ensemble de l’écosystème sont à l’origine de la croissance et de la reproduction de la flore et de la faune et maintiennent la relation existant entre les différentes parties constitutives du système: le sol, l’eau et l’air servant de substrat au caractère unique d’un écosystème donné.
Pauvreté énergétiqueIl s’agit d’un déficit de sources d’énergie fiables et adaptées, accessibles à des prix abordables, et per-mettant de répondre aux besoins humains élémentaires.
RésilienceLa résilience fait référence à la quantité de chan-gement que les personnes, les lieux et les écosys-tèmes exposés peuvent supporter sans que cela entraîne une modification permanente de leur état. Plus précisément, il s’agit de leur capacité à se réta-blir après une agression, à se prémunir contre de futures agressions et perturbations, et à s’adapter. Source: (HELIO International, 2009).
RétroplanificationLa rétroplanification est une méthodologie de pla-nification qui commence par la définition d’un futur à long terme souhaitable, s’appuyant en général entièrement sur des énergies renouvelables, et qui se poursuit par un travail de «rétro-ingénierie» consistant à déterminer les politiques et les mesures nécessaires pour atteindre cet avenir. L’analyse de la demande s’effectue en conformité avec la qualité de l’énergie requise pour chaque besoin et l’approvisionnement est recherché à partir des ressources renouvelables disponibles localement. Les solutions produites sont, en conséquence, clairement normatives et indépen-dantes des tendances actuelles reconnues.
Santé d’un écosystèmeLa santé d’un écosystème fait référence à sa capacité à fournir les services de la nature dont la vie a besoin pour exister sur cette planète; il s’agit notamment de la fourniture d’une atmosphère et d’une eau saines, d’un sol fertile et d’un environnement stable offrant abri, nourriture et sécurité.
larger ecozones. Energy and nutrients cycle through the ecosystem producing growth and reproduction in flora and fauna and maintain the relationship be-tween the constituent parts – soil, water and air that support the uniqueness of that particular ecosystem.
Energy povertyA lack of adequate and reliable and appropriate forms of energy at affordable prices to meet basic human needs.
ResilienceAmount of change the exposed people, places and ecosystems can undergo without permanently changing states. That is, their ability to recover from the stress and to buffer themselves against and adapt to future stresses and perturbations. Source: (HELIO International, 2009)
Backcasting Backcasting is a planning methodology that starts with the definition of a long-term desirable future, usually fully based on renewables and then works backwards to determine the policies and measures that need to be taken to achieve it. Demand analysis is done according to the energy quality requested for each need and supply is searched from available renewable resources. As a result, solutions gener-ated are independent of current identified trends and openly normative.
Ecosystem healthEcosystem health refers to an ecosystem’s ability to perform the services of nature for life on this planet to exist; services such as clean air, clean water, fertile soil and a stable environment that provides shelter, sustenance and predictability.
FRANÇAIS ENGLISH

Framework for a Smart Energy Path | A guide to sound energy decisions 47
Services énergétiquesLes services énergétiques englobent une myriade d’activités comme la cuisson, le pompage de l’eau, la réfrigération d’un bureau, l’éclairage d’un hôpital, le déplacement de marchandises, le transport de per-sonnes, et autres.
Système énergétique (ou filière)Un système énergétique se compose de l’ensemble des processus, étroitement liés entre eux, d’extrac-tion, d’acquisition, de transformation, de transport, d’échange et d’usages finaux de toutes les formes d’énergie, et ce, au niveau local, régional, national ou mondial.
Technologies énergétiques doucesIl s’agit de technologies présentant les cinq carac-téristiques suivantes: elles s’appuient sur des flux d’énergies renouvelables, elles sont diversifiées, elles sont souples (et accessibles plutôt qu’ésotériques), elles sont en harmonie avec les besoins des usagers finaux sur le plan quantitatif et sur le plan de leur répartition géographique, et elles sont en adéqua-tion, sur le plan qualitatif, avec ces mêmes besoins.
TendancielUn scénario tendanciel fait l’hypothèse que les futures tendances du développement énergétique seront si-milaires aux tendances du passé et que les politiques déjà en place ne seront en rien modifiées.
TIPEETIPEE est une méthodologie (outil) et une série d’indi-cateurs développés par HELIO International qui per-mettent aux décideurs de vérifier dans quelle mesure les politiques énergétiques nationales contribuent à l’écodéveloppement dans des conditions climatiques changeantes. Source: (HELIO International, 2012).
Voie «dure»Il s’agit, selon A. Lovins (Soft Energy Paths, Ballinger, 1977), d’une voie caractérisée par une offre croissante de combustibles fossiles et par une utilisation accrue d’autres technologies centralisées d’offre d’énergie tou-jours plus coûteuses et exerçant toujours plus de pressions environnementales avec, pour conséquence, un système énergétique rigide, inéquitable, fragile et non viable.
Energy servicesEnergy services encompass a myriad of activities, such as cooking, water pumping, cooling an office, lighting an hospital, moving goods or persons, etc.
Energy systemAn energy system represents the interrelated procure-ment, transformation, trade, and end use of all en-ergy forms at local, regional, national or global level.
Soft energy technologiesThese are technologies with the following five char-acteristics: they rely on renewable energy flows, are diverse, flexible (and accessible rather than arcane), matched in scale, geographic distribution and qual-ity to end-use needs.
Business-as-usualA “business-as-usual” scenario assumes that future development trends follow those of the past and no changes in policies already in place will take place.
TIPEETIPEE, developed by HELIO International, is a methodology and a series of indicators that allows decision-makers to check how well national energy policies are contributing to ecodevelopment under fluctuating climatic conditions. Source: (HELIO Inter-national, 2012)
Hard pathAccording to A. Lovins (Soft Energy Paths, Ballinger, 1977) ever increasing supplies fossil fuels and other centralized energy supply technologies that grow ever more expensive and environmentally stressful, resulting in an inflexible, inequitable, brittle and un-sustainable energy system.
FRANÇAIS ENGLISH

48 Annexes
Voie énergétique douce autonomeIl s’agit d’une approche de planification énergétique innovante, orientée par la demande. Elle s’appuie sur des technologies énergétiques douces et est com-patible avec les principes de la viabilité environne-mentale et de la gouvernance participative.
VulnérabilitéFragilité d’un système ou d’une unité (par exemple un groupe humain ou un lieu) suite à son exposition à un risque, à un danger, à un choc ou à une agression. Dans le contexte du concept de pauvreté, la vulné-rabilité est plus dynamique, car elle rend compte de la perception qu’ont les gens d’entrer dans la pauvreté ou d’en sortir. Source: (HELIO Internatio-nal, 2009).
Smart energy pathRepresents an innovative, demand-orientated ap-proach to energy planning that uses soft energy technologies and is compatible with the principles of environmental sustainability and participatory governance.
VulnerabilityVulnerability is the degree to which a system or unit (such as a human group or a place) is likely to experi-ence harm due to exposure to risk, hazards, shocks or stresses. Source: (HELIO International, 2009)
FRANÇAIS ENGLISH
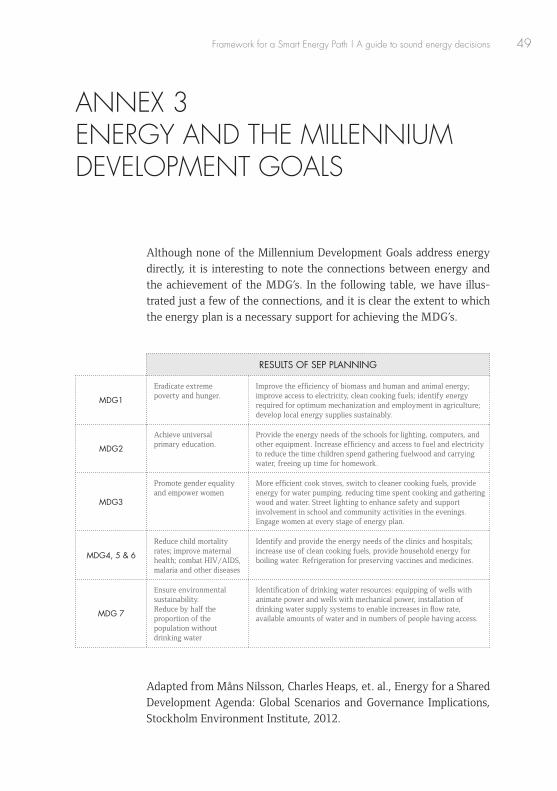
Framework for a Smart Energy Path | A guide to sound energy decisions 49
Although none of the Millennium Development Goals address energy directly, it is interesting to note the connections between energy and the achievement of the MDG’s. In the following table, we have illus-trated just a few of the connections, and it is clear the extent to which the energy plan is a necessary support for achieving the MDG’s.
Adapted from Måns Nilsson, Charles Heaps, et. al., Energy for a Shared Development Agenda: Global Scenarios and Governance Implications, Stockholm Environment Institute, 2012.
RESULTS OF SEP PLANNING
MDG1
Eradicate extreme poverty and hunger.
Improve the efficiency of biomass and human and animal energy; improve access to electricity, clean cooking fuels; identify energy required for optimum mechanization and employment in agriculture; develop local energy supplies sustainably.
MDG2
Achieve universal primary education.
Provide the energy needs of the schools for lighting, computers, and other equipment. Increase efficiency and access to fuel and electricity to reduce the time children spend gathering fuelwood and carrying water, freeing up time for homework.
MDG3
Promote gender equality and empower women
More efficient cook stoves, switch to cleaner cooking fuels, provide energy for water pumping, reducing time spent cooking and gathering wood and water. Street lighting to enhance safety and support involvement in school and community activities in the evenings. Engage women at every stage of energy plan.
MDG4, 5 & 6
Reduce child mortality rates; improve maternal health; combat HIV/AIDS, malaria and other diseases
Identify and provide the energy needs of the clinics and hospitals; increase use of clean cooking fuels, provide household energy for boiling water. Refrigeration for preserving vaccines and medicines.
MDG 7
Ensure environmental sustainability.Reduce by half the proportion of the population without drinking water
Identification of drinking water resources: equipping of wells with animate power and wells with mechanical power, installation of drinking water supply systems to enable increases in flow rate, available amounts of water and in numbers of people having access.
ANNEX 3 ENERGY AND THE MILLENNIUM DEVELOPMENT GOALS

50

Framework for a Smart Energy Path | A guide to sound energy decisions 51
This document is an output from a project funded by the UK Department for International Development (DFID) and the Netherlands Directorate-General for International Cooperation (DGIS) for the benefit of developing countries. However, the views expressed and information contained in it are not necessar-ily those of or endorsed by DFID or DGIS, who can accept no responsibility for such views or informa-tion or for any reliance placed on them. This publication has been prepared for general guidance on matters of interest only, and does not constitute professional advice. You should not act upon the information contained in this publication without obtaining specific professional advice. No represen-tation or warranty (express or implied) is given as to the accuracy or completeness of the information contained in this publication, and, to the extent permitted by law, the entities managing the delivery of the Climate and Development Knowledge Network do not accept or assume any liability, responsibil-ity or duty of care for any consequences of you or anyone else acting, or refraining to act, in reliance on the information contained in this publication or for any decision based on it. Management of the delivery of CDKN is undertaken by PricewaterhouseCoopers LLP, and an alliance of organisations including Fundación Futuro Latinoamericano, INTRAC, LEAD International, the Overseas Development Institute, and SouthSouthNorth.


Energy is only useful when it provides services in everyday life, both to individuals and to the community. Energy is not an end in itself. That is why energy policy making, traditionally led by energy suppliers, must now be radically re-oriented: it is for demand to drive supply and no longer for energy technology to seek applica-tions and customers. In other words, it is up to the function to shape the tool. The transition vaunted by some advanced countries can therefore only come about as a response to a demand for energy services expressed by consumers whose views have been called for when establishing objectives and developing policies.
All countries now need an energy transition leading to ecodevel-opment, and especially those fighting poverty. The supply based approach has been a resounding failure with shortages in cities and almost total absence of modern energy services in rural areas. The indispensable energy transition in sub-Saharan Africa is, here again, synonymous with a demand-side approach, improved en-ergy efficiency and the introduction of modern renewable energy.
A transition to ecodevelopment is only possible via a smart energy path, and HELIO International’s work on energy policies under-taken since Rio+5 culminates today in this guide intended to clarify the approach for energy decision-makers seeking to ensure their countries’ long-term prosperity and stability.
31-33 rue de la Colonie | 75013 Paris | FRANCE
www.helio-international.org