framework for whole of state development - local government nsw
TRANSCRIPT

N E W S O U T H W A L E S
a framework for whole of state development
JULY 2000
Prepared by National Economics (National Institute of Economic and Industry Research)
for the LOCAL GOVERNMENT AND SHIRES ASSOCIATIONS OF NSW
Disclaimer
While National Economics endeavours to provide accurate information and forecasts and believes the material is accurate, it will not be liable for any claim by any party acting
on such information.

2
Acknowledgements At the 1999 State Assembly of Local Government, the Local Government and Shires Associations of NSW established a Whole of State Development Task Force to consider future development strategies for NSW, with particular emphasis on the role of Local Government. The Task Force commissioned National Economics (NIEIR) to work with the Task Force in the preparation of this Whole of State Development report. In accordance with the resolution adopted at the 1999 State Assembly, the Presidents of the Associations nominated the members of the Task Force. The members are: Cr Peter Woods OAM President, Local Government Association of NSW Cr Chris Vardon President, Shires Association of NSW Cr Helen Brayne Mayor of Griffith Cr John Harding Wagga Wagga City Council Cr Max Boyd Tweed Shire Council Cr Athol Roberts OAM Mayor of Carrathool Cr Paul Garrard Parramatta City Council Cr Patricia Harvey Mayor of Mosman Cr Paul Pearce Mayor of Waverley Cr Michael Megna Drummoyne Council Cr Mike Montgomery Chair, Finance & Economic Development Committee Shaun McBride LGSA Staff Support The Associations would like to acknowledge the contributions made by the Task Force members over the past year. We would also like to acknowledge the expert contributions of: Graham Apthorpe (Cowra Shire Council), Graeme Hooper (Lake Macquarie City Council), Clair Hedgecock (Tumut Shire Council), Amanda Buckland (Wollongong City Council), Peter Dale (Riverina Regional Development Board), Warren Barnes (Gwydir Valley Cotton Growers Aboriginal Employment Strategy), Peter Coyte (Penrith City Council), Keith Davidson (Northern Rivers Chambers of Commerce and Industry), Peter O’Connor (Lismore City Council), Alan Woollard (Sustainable Industries Inc.), Alex Ferguson (Inland Marketing Corporation) and Adam Bell (Wagga Wagga City Council) Finally, the Associations would like to thank the NSW Department of State and Regional Development for the support it provided for this undertaking.

Table of contents
Executive Summary 6 1 Background 8 2 The economic context 9 2.1 Economic drivers 9 2.2 Constraints 10 2.3 The current development path 12 3 A vision for whole of state development 15 3.1 A 20 year vision 15 3.2 Elements of WSD 15 3.3 Principles underpinning WSD 16 3.4 Knowledge based regions 17 4 The NSW economy 19 4.1 The New South Wales economy: the next 20 years 20 4.2 Current trends 21 4.3 Barrier constraints and laissez faire 22 4.4 Regional impacts 23 5 Spatial restructuring of NSW 28 5.1 Established Sydney 29 5.2 Developing Sydney 30 5.3 Post industrial regions 31 5.4 Lifestyle regions 31 5.5 Rural regions 31 6 NSW population dynamics 34 6.1 Metropolitan Sydney 36 6.2 Post Industrial regions 40 6.3 Lifestyle regions 41 6.4 Rural resource based regions 42 7 Three scenarios for state development to 2021 45 7.1 DUAP or population constrained 46 7.2 Laissez-faire 47 7.3 Sustainable development 48 7.4 A summary 50

4
8 The limits of current economic policy 52 8.1 Macroeconomic management 52 8.2 Microeconomic reform agenda 53 8.3 Regional policy instruments to support WSD 54 9 Recommendations 57 Appendix 1 Regional boundaries 75 Appendix 2 Regional indicators 76 Case studies 1 Newcastle City Council - Creating jobs and saving greenhouse gases 14 2 Cowra Shire Council - Maintaining and revitalising a local industry base 18 3 Wollongong City Council - Creating opportunities for cultural industries 27 4 Penrith City Council - Thinking laterally on industry networks 33 5 Gwydir Valley Cotton Growers Aboriginal Employment Strategy 44
- Supporting Aboriginal employment as a step towards Reconciliation 6 Wagga Wagga City Council - Investing in Liveability 51 7 Norlink - Building world-class telecommunications 56

Executive summary
The current development path of NSW is not sustainable from an economic, social and environmental perspective. This path creates polarisation and fragmentation. Over the past 20 years, we have witnessed growing disparities in employment, wealth, income and educational opportunities between regions and within regions in the state. The report argues that a new vision is required by all spheres of government, business and community to guide the development of NSW over the next 20 years. From a Local Government perspective, the case is put for the adoption of a “Whole of State Development” approach, where the local and regional dimension to state economic development is recognised and emphasised in new policy directions. The “Whole of State Development” approach aims to ensure that all NSW regions share in the benefits of globalisation and the digital revolution. Measures are required to build the knowledge base, infrastructure and innovative capacity of all regions. The new approach requires a major resource commitment and strategic coordination from all spheres of government. Local Government seeks to be a pro-active partner in this process. The WSD approach involves devolution of responsibilities and resources to regions, but it doesn’t involve a reduction of the role of government. The Local Government and Shires Associations of NSW put forward the following vision to guide WSD:
“NSW will be one of the most confident, well-managed, dynamic, competitive and open economies of the Asia-Pacific region. The state will be fully integrated into the global economy - a multi-cultural society that encourages continuous flows of investment, people and knowledge flows and ideas. The basis of its wealth and well-being will be innovation, social cohesion, good governance and ecological sustainability. It will be a creative, adaptable, high skilled and knowledge-based economy where firms, organisations and citizens of all ages are engaged in continuous learning and innovation. It distinguishes itself by an all-embracing commitment to reconciliation between indigenous and non-indigenous Australians”. “All regions share in the benefits of the new economy. Regions have access to world class transport, financial and technological infrastructure and services. This includes advanced information communications technologies, which are used by local business networks and community organisations to enhance global links, knowledge flows and local learning. Resources and responsibilities are devolved to local government and regions to enable them to implement strategies to attain their economic and social potential. Its cities and regions are socially enriching and safe places to live offering good opportunities for jobs, investment, and learning, with outstanding infrastructure and amenities. It values and conserves its environmental and cultural assets”.
Whilst recognising common challenges facing all metropolitan and non-metropolitan regions of the state, the report also focuses on distinctive challenges facing different types of regions. The report divides NSW into five types of regions: Established Sydney, Developing Sydney, Rural NSW, Post Industrial Regions and Lifestyle Regions. The challenges include increasing congestion and other environmental problems associated with the growth of Sydney, population decline in rural areas

6
west of the Great Dividing Range, rapid population growth in lifestyle regions and Developing Sydney, and ongoing structural change in industrial regions. The report proposes that a WSD approach would:
Ensure that the global competitiveness of Established Sydney is matched by a commitment to improving environmental quality and lifestyle amenities.
Target a population increase of 75,000 in rural NSW (west of the Great Dividing Range) by 2021. This entails significant public investment in education, transport infrastructure, R&D and information and communications technologies in rural centres that demonstrate growth potential. It also proposes tax credits to encourage job creating investment into designated development zones.
Planning Sydney as a multi centred city with strategies to increase the number of knowledge based jobs in the regional centres of Developing Sydney and improving public transport access to these centres.
Promote active revitalisation of the industrial regions of Wollongong and Newcastle. These regions have a capacity to take some of the population growth of Sydney, but only if their economic base can be shifted faster to value added industries and their rail infrastructure links to Sydney are upgraded.
Encourage further diversification of lifestyle regions of the north and south coast with investments in education, amenities and infrastructure. The report considers three scenarios for the development of NSW over the next 20 years. Population constrained scenario results in a state population of 7,428,000 by 2021. It results in poorer economic performance, slower growth of non-metropolitan regions and population decline in rural NSW. Laissez faire scenario results in a NSW population of 7,607,000 by 2021. It results in higher rates of economic growth associated with growing inequality and environmental damage, particularly in Sydney. Infrastructure is inadequate to meet the challenges of regional development, because public investment in infrastructure is severely constrained. Sustainable development scenario results in a population of 7,473,100 by 2021. It results in population and economic growth in all areas. It includes positive measures to target an increase in population of rural regions by 75,000 people, stimulate revitalisation of the industrial regions, constrain over-development of Sydney, and infrastructure investment and careful environmental management of lifestyle regions. The report puts forward a number of recommendations designed to enable all NSW regions to share in the benefits of economic development, whilst maintaining environmental quality and social cohesion.

7
1 Background The Task Force was given the responsibility to:
Prepare a background and position paper to provide context for strategy development.
Review State and Commonwealth Government policy and programs in relation to state and regional development.
Review Associations’ policies in relation to state and regional development.
Develop revised or additional policies on state and regional development to be recommended to the Associations for adoption.
Develop strategies to advance the policy positions.
Produce recommendations for both the State and Commonwealth Governments in relation to whole of state development and make representations to government.
Produce a report to be presented to the next State Assembly of Local Government in July 2000.
This report seeks to address the challenges confronting NSW. It argues that the existing development path is leading to polarisation and fragmentation within regions and between regions. The report attempts to go beyond the narrow and often destructive aspects of economic rationalism, and emphasise the spatial impacts and develop strategies that enable all regions to attain their potential. It also seeks to get away from simplistic notions of city versus the bush. Some areas of rural NSW are doing very well and are positive about their future whilst some areas of the Greater Metropolitan Region have become marginalised. A vision is required by all spheres of government, business and community to guide the development of NSW over the next 20 years. From a local government perspective, the case is put for the adoption of a “Whole of State Development” approach, where the local and regional dimension to state economic development is recognised and emphasised in new policy directions. Local Government seeks to be a pro-active partner in this process.

8
2 The economic context
ew South Wales is undergoing fundamental change. Over the past twenty years, the state has been increasingly integrated into the global economy. This has resulted in intensified competition
and increasing flows of capital, people and information. As with other states and regions, NSW is in the midst of a digital revolution. In the face of international competition, traditional industries have restructured and new industries have emerged. 2.1 Economic drivers Five developments provide the context for looking at the prospects for urban and regional NSW. Firstly, the emergence of a global economy - characterised by rapid global flows of capital, trade, people and ideas - overshadows all other developments in the past 50 years. Successful regions are those that can compete in the global economy. Some do it through exporting high value added products in growing industries; others do it by providing attractive places to live, work and visit. Globalisation has resulted in the creation of high skilled and well paid jobs, but a high proportion of these are concentrated in globally competitive cities – Sydney, Melbourne and Brisbane. Even the smallest community is impacted by globalisation through increasing international and regional competition. Secondly, the world’s advanced economies including Australia defied the odds over the second half of the last decade, with the US, some European and Australian economies growing at rates not experienced in two generations. Growth hardly faltered during the Asian economic crisis. Some commentators suggest that the adoption of orthodox economic policies accounted for this growth - through balanced budgets, privatisation and a reduction of the role of government in the economy. The real reason for high growth rates over the second half of the 1990s is, however, more likely to be due the explosion of productivity in industries and households due to the penetration of IT&T. Although national growth rates are extraordinarily high and the stock markets are in fantasia land, as indicators of national and regional well being they are not sustainable. Thirdly, the digital revolution is beginning to have a major impact on the economic performance of regions, particularly with the wide diffusion of information technologies into firms, farms, schools and households. NSW regions linked into the digital economy – with good telecommunications infrastructure, high use of IT and local electronic applications – have done well. Fourthly, the benefits of rapid economic growth are heavily concentrated in globally oriented capital cities, tourist destinations and regions with strong resource endowments in high growth energy and agricultural markets. The challenge for globalisation is how to spread
N

9
the benefits broadly to rural areas, small communities and provincial cities. Fifthly, economic policy directions, and a lack of commitment to regional development in particular, have reinforced the growing disparities in performance between regions and within cities. National Competition Policy hasn’t brought significant benefits to regional NSW. The demise of industry policy and agricultural extension services at state and national levels has limited innovation in rural and manufacturing sectors. Similarly, the lack of a coherent regional policy framework at the national level has resulted in frustration and confusion at the local and regional level. 2.2 Constraints New South Wales regions are currently constrained from reaching their full economic potential. There are eight critical constraints to growth operating on regional economies. 1 Capital and financial flows Despite Sydney’s emergence as a significant financial centre in the Asia Pacific region, NSW regions have uneven access to development and venture capital. Information imperfections result in investments concentrating around global cities. Investments outside these global centres are often classified as high risk, mainly because other investors are not involved and/or regional investment proponents are not linked into the financial networks. 2 Infrastructure All NSW regions require investment to upgrade physical and social infrastructure – airports, roads, rail, schools and hospitals. Inadequate investment is taking place in infrastructure to support regional development. For example, airport infrastructure in Sydney is not adequate to meet the demands of a global city. Regional producers are paying a high price by not being linked into global distribution systems, which require outstanding airfreight facilities. Major highway systems require large investment including the Princes Highway, Pacific Highway, Great Western Highway and the Sydney Orbital. For many rural communities, the prosperity of their local industries is reflected in the condition of their local roads. Despite strong commitments to invest in information technology and telecommunications, the infrastructure divide appears to be widening between Sydney’s global centre and rural NSW. 3 Corporate networks Corporate networks tend to cluster around global cities. These are the command and coordination centres for international trade, production and finance. Although corporate outsourcing has created new opportunities for small medium enterprises (SMEs), the SMEs have to first be linked into corporate networks. If they are not located in global cities, getting into supplier networks can be difficult.

10
4 Environmental The rundown of NSW natural capital is beginning to impact the production potential of a number of rural areas, particularly in the Murray-Darling River Basins. Investments amounting to billions of dollars are required to address these problems, which may or may not restore the productivity of soil and water resources. In the cities, increased pollution and congestion costs are increasing production costs and travel costs. Large investments in freeways in metropolitan Sydney provide only temporary relief from traffic congestion and perpetuate car dependence. In Sydney, as with other major cities around the world, the impacts of increasing traffic and traffic congestion, is well documented. Impacts include:
Travel time delays due to traffic congestion
Increases in air pollution from road transport
Increases in road traffic noise
Community severance
Reduced traffic safety
Community health/ well-being (ie. effects of air pollution,
traffic noise and stress from driving on congested roads).
Reduced levels of personal accessibility and mobility
(implications for access to basic community services, facilities,
education and employment opportunities).
5 Skills A number of NSW regions are simply not equipped for the “new” economy because their skill base is outdated. They have fewer professionals, para-professionals and managers. The main skill constraints in non-metropolitan regions are shortages of trained people with ICT skills. Other skill constraints include shortages in hospitality, management skills and trades. 6 Innovative and entrepreneurial Although there are many outstanding business successes in non-metropolitan NSW, they have fewer support services and networks than their big city counterparts. Opportunities for entrepreneurs and innovation tend to be concentrated in Sydney. The continuous interaction of ideas, individuals and firms in innovative cities tends to foster risk taking. Access to suppliers and customers, as well as resources such as finance, management and skilled workers also tend to disadvantage non-metropolitan regions. 7 Lack of economies of scale Large cities and regions create critical mass. This dense network of firms, suppliers and workers enhances the potential for regional

11
specialisation, which unleashes growth potential. Large customer markets create the potential for increased sales, which drives business growth. Smaller non-metropolitan regions battle when it comes to economies of scale. 8 Policy distortions Australian and NSW economic policy directions over the past two decades have accentuated regional inequalities and divergences. Although the economic benefits of some of these reforms have been considerable in terms of increased growth rates and export performance, they have also resulted in significant costs. Cutbacks in services, tariff liberalisation and micro-economic reforms have had a disproportionate impact on rural and traditional industrial areas such as Fairfield, Bankstown, Wollongong and Newcastle. Regional policy now lags well behind international best practice, where the embracing of globalisation, structural change and the digital revolution is matched by a commitment by government to support local areas both adapt and to position themselves to improve their competitiveness and capabilities in the new economy. Coordination between planning, transport and industry development agencies in NSW remains poor. 2.3 The current development path The state’s existing development path is limited. It is not adequately spreading the benefits of globalisation and the digital revolution across the state. The spatial impacts of the current economic development path are uneven. They are characterised by concentration of high value added economic opportunities in global Sydney, dispersal of lower income populations and lower value added industries to Greater Western Sydney and the Central Coast, consolidation around provincial cities and marginalisation of parts of rural and traditional industrial areas of NSW. The result is growing disparities in jobs, wealth, incomes, skills and learning opportunities between regions of the state and within regions. If we continue on this path, NSW will become increasingly polarised and fragmented. Details of the growing disparities are set out in Section 4.4 and Appendix 2. Two features of the current development path of NSW stand out. Firstly, in macroeconomic terms the state has performed well over the past 5 years, particularly in relation to economic growth rates. Unemployment, although still too high, has come down significantly in many regions. Secondly, the benefits of economic growth remain narrowly based, mainly with asset holders and knowledge based professionals, residing and working in the central areas of Sydney. A great divide is opening up between high growth, high-income areas and low growth, low-income regions. The indicators point to growing divergences in job opportunities, skills, wealth and incomes. If these trends continue, NSW will never attain its economic and social potential.

12
The changes are most apparent at the local and regional level. Central and inner localities of Sydney, an area we have termed Global Sydney, are booming. A global crescent, stretching from North Ryde, Lane Cove, North Sydney, CBD, and increasingly southward to Kingsford-Smith Airport is emerging. This area has been characterised by increasing property prices, incomes, employment, and a concentration of high-skilled, knowledge-based jobs. It has virtually returned to full employment. This region, the Global Centre, has been the major beneficiary of globalisation in Australia. Traditional industrial areas of Sydney – a corridor stretching from Canterbury-Bankstown, Liverpool, Fairfield, Holroyd, and parts of Parramatta-Auburn and Blacktown – have not fared as well. Although unemployment has come down, it still remains unacceptably high. Wollongong and the Lower Hunter have experienced industrial restructuring over a long period. Although there are encouraging signs of revitalisation in new industries such as IT, education and the wine industry (the latter in the Hunter), the core of these regions is still struggling. Coastal areas of NSW on both the south and north coast are undergoing rapid change – characterised by structural change in primary industries such as forestry and agriculture, rapid population growth and infrastructure backlogs. The lifestyle regions of the north coast: Northern Rivers and Australia’s Holiday Coast, are the most rapidly growing regions of NSW. Many rural regions are facing challenges to their long-term viability due to declining fortunes of traditional agricultural commodities. The non-irrigation areas of Northern and Far West NSW have suffered from drought, and are experiencing an outflow of young people to the cities. The indigenous population is growing in a number of rural areas, but under-employment remains high.

13
Case study 1
Newcastle City Council
Creating jobs and saving greenhouse gases
Working through its Australian Municipal Energy Improvement Foundation (AMEIF), Newcastle City Council is leading Australia in reducing greenhouse gases. The AMEIF recently won an Australian Innovation Award for reducing greenhouse gases and knowledge interchange between councils. AMEIF is a business unit of the Council established to prepare Newcastle and the Hunter Region for a vital future in sustainable technology and to provide Australian councils with knowledge interchange. AMEIF works with local government, the residential and commercial sectors to improve energy efficiency, reduce greenhouse gas emissions, lower energy costs and to create new jobs. The Hunter’s reputation as a centre for green technology will soon be enhanced by the relocation of CSIRO’s Energy Technology Division to the Steel River eco-industrial park. The park is a joint venture of BHP and Baulderstone. The Council has helped to make Newcastle a welcoming environment for sustainable industries. One innovation is its 28-day approval process that removes any delays in development approvals once the design concept has the green light. The three largest councils in the Hunter, Newcastle, Lake Macquarie and Port Stephens are also active members of Sustainable Industries Inc (SII) together with around 35 companies. Newcastle and Port Stephens are also part of SII’s lead team that sets strategic directions for the group. SII is a non-profit incorporated association that supports, promotes and initiates environmentally responsible and sustainable industry products, services and practices. The result of this joint activity of government and business is that the Hunter Valley is developing a reputation as a centre of excellence in sustainability.

14
3 A vision for whole of state development 3.1 A 20 year vision
he following 20 year vision is put forward to initiate a debate about a whole of state development (WSD) strategy:
NSW will be one of the most confident, well-managed, dynamic, competitive and open economies of the Asia-Pacific region. The state will be fully integrated into the global economy - a multi-cultural society that encourages continuous flows of investment, people and knowledge flows and ideas. The basis of its wealth and well-being will be innovation, social cohesion, good governance and ecological sustainability. It will be a creative, adaptable, high skilled and knowledge-based economy where firms, organisations and citizens of all ages are engaged in continuous learning and innovation. It distinguishes itself by an all-embracing commitment to reconciliation between indigenous and non-indigenous Australians. All regions share in the benefits of the new economy. Regions have access to world class transport, financial and technological infrastructure and services. This includes advanced information communications technologies, which are used by local business networks and community organisations to enhance global links, knowledge flows and local learning. Resources and responsibilities are devolved to local government and regions to enable them to implement strategies to attain their economic and social potential. Its cities and regions are socially enriching and safe places to live offering good opportunities for jobs, investment, and learning, with outstanding infrastructure and amenities. It values and conserves its environmental and cultural assets.
3.2 Elements of WSD The WSD approach fosters inter-relationships between and within regions, strengthens global linkages of all regions, and builds strong regional learning and innovation systems. This provides the building blocks for more competitive regional economies. The economic policy framework for WSD is concerned with good macroeconomic management and microeconomic reform, but it incorporates a strong regional policy dimension. In other words, the are three dimensions to good economic policy - macro, micro and regional. The aim is to develop and implement policies that set NSW regions onto a virtuous development cycle. This development cycle is where increased regional investment in infrastructure, education, technology, skills and environmental management improves the competitiveness and attractiveness of regions which in turn attracts further investment and employment. The three spheres of government are partners in this development process, with Local Government well positioned to initiate and implement economic development strategies with local partners. A whole of state approach emphasises that the current development path constrains the economic, social and environmental potential of all regions within NSW, whether they are in metropolitan or remote NSW. The economic costs are too high. Human resources and
T

15
infrastructure are under-utilised in some regions and over-utilised in others. The social and environmental costs of the current development path are also high. Traditional family farms, low skilled workers, migrant women, indigenous communities and many young people pay a heavy price for the aggressive market oriented development policies based on tax minimisation and reduction of social expenditures. The evidence of environmental damage is mounting. Sydney is on an unsustainable growth path with increasing congestion, car dependence, inadequate public transport and ecological threats to the Hawkesbury-Nepean Rivers from urban development. In rural areas, soil erosion and declining water quality in major river systems such as the Murray-Darling is reaching crisis point.
3.3 Principles underpinning WSD The whole of state development approach is built around principles of sustainable development. This involves a comprehensive approach to developing all of the state’s regions encompassing economic development, social well being and ecological health. The principles are:
A state-wide network of globally oriented regions and inter-regional linkages
Innovative communities and enterprises Regional leadership and stewardship Reconciliation and cooperation Social cohesion Ecological sustainability.
To attain the WSD vision, the state needs to build on its strong and diverse economy with value added industries in mining, agriculture, manufacturing, information, advanced services and high technology industries. People at all levels of society and workers need to be involved in continuous learning, acquiring new skills and competencies.

16
3.4 Knowledge based regions Underpinning the WSD are strategies to create knowledge-based economies at the regional level. Increasingly, value adding will emanate from knowledge rather than physical assets. We define a knowledge-based economy as an economy where the acquisition and application of knowledge is paramount. In this economy - product development, coordination of production and distribution, management and marketing - has become increasingly complex. The knowledge intensity of products, processes and most jobs has increased. Successful regions are those where households, firms and institutions can acquire and create useable new knowledge faster than other regions.
The knowledge economy is not confined to scientists in lab coats and academics, but straddles all industries and most occupations. Farmers, for example, are acquiring new skills in environmental management – ranging from maintaining the health of fragile soils, replanting and developing systems to managing scarce water supplies. They are also linking into market intelligence systems, developing accounting and financial management skills, and tapping into new ideas about diversification and product development. Competitive manufacturers are engaging in continuous process and product development, and participating in local and global networks that draw on the expertise and resources of customers and suppliers. Local businesses are becoming more knowledge intensive, particularly in regions such as those where new employment opportunities are predominantly self-employed. Running your own business requires a number of knowledge intensive skills such as business planning, financial management, computer literacy, product development, inventory control and marketing. A regional economy becomes knowledge-based not only by increasing levels and access to formal education, although this is an important part of the process. All regions in NSW should aspire to world class education facilities – universities, TAFE and schools. Bold investments are required in education and training. But this will not be sufficient. It also requires a commitment to new ways of learning. People can learn at school, at home, through community networks, “learning on the job” or through web-based learning systems. The shift towards knowledge-based regions is impeded by the increasing cost of education for individual households and farms.

17
Case study 2
Cowra Shire Council
Maintaining and revitalising a local industry base
Cowra Shire Council helped to save jobs when a corporate takeover threatened to close down the local cannery. When Pacific Dunlop acquired Adelaide Steamship the Edgell Cannery at Cowra faced closure. Rather than see jobs lost and weather the inevitable effects on the local economy, Cowra Council stepped in with a 10-year commitment to support a cooperative of local growers and ex-Edgell employees run the operation. Towards the end of the 1980s, the Council switched its focus from business attraction to working with local industries. Understanding that the first years of a venture are critical in determining whether it will survive, the Council agreed to help the cooperative to bridge the shortfall in capital. The Council tied its financial support to a subsidy of 1,000 per employee with a cap of $55,000 a year. The cooperative has since purchased its plant, become a company, employs around 80 workers and is turning over $15 million a year canning goods under the Edgell, Cowra Gold and generic labels.

18
4 The NSW economy
ew South Wales is Australia’s largest economy. Gross state product in 2000 is estimated at $220 billion, which is around 40% larger than Australia’s second largest state, Victoria, more
than twice the size of Queensland and three times the size of Western Australia (Chart 4.1). This represents more than 35% of Australia’s Gross Domestic Product (Chart 4.2). Over the 1990’s, Gross State Product grew by 3.25% pa, with growth accelerating in the second half of the 1990’s to 5% pa, an extraordinarily good performance. The high rates of growth were associated with increased consumption stimulated by low inflation and interest rates, a building and construction boom partly associated with the Olympic Games, and high levels of investment in information and communications technologies. Over the past five years, unemployment has declined from 10.5% to 7.5%.
Source: National Economics Source: National Economics
N
Chart 4.1 GDP by state ($billion)
0
50
100
150
200
250
NSW Vic Qld SA WA Tas
Chart 4.2 Share of Gross State Product %
05
10152025303540
NSW Vic Qld SA WA Tas

19
Source: National Economics
4.1 The New South Wales economy: the next 20 years
The rules of economic growth in Australia are changing and New South Wales, in general, and Sydney, in particular, are at the centre of these changes. The common view of the long run development of Australia up until the end of the 1990s was that Australia’s economic development would be driven by growth in the resource rich states of Queensland and Western Australia, as well as the Northern Territory. The national population would be redistributed towards these regions with economic growth being between 1 and 3 percentage points higher than the national average. Under this scenario Sydney’s economy would focus on the provision of high value added financial services, business services and tourism. The growth of New South Wales would fall below the national average but only up to 0.5 percentage points below the national average because of the high value of activities. The consensus on population growth was that it would be significantly below the national average. If the national population growth was 1 per cent then the expected New South Wales population growth was approximately 0.7 per cent. Globalisation and, in particular, the arrival of the information economy has weakened and once the dust settles will probably reverse this scenario. The combined pressures of globalisation and the information economy have:
reduced the value of some natural resource (commodity) production;
increased the competition Australia faces in attracting investment for natural resource projects; and
most importantly, reduced the direct employment and local service population base required for the operation of national resource projects.
Chart 4.3 Growth 1990-99 %
00.5
11.5
22.5
33.5
44.5
5
NSW Vic Qld SA WA Tas Australia

20
The control and servicing of major resource projects can now be carried out anywhere in Australia or, for that matter, the world. This factor by itself would have resulted in the population growth rate over the next 20 years of Queensland and Western Australia falling below the rate experienced over the past decade. This implies that Sydney’s population will be higher. Forces operating within Sydney are reinforcing this trend. The information economy means that economic growth is increasingly being driven (not just supported) by Established or Global Sydney. Despite increasing environmental costs and high costs of living, living in Established Sydney is attractive to high-income earners because of access to high income employment and amenities. The presence of high quality education and training is also an important attraction. A number of conclusions flow from this. The first is that: (i) Sydney’s economic growth rate over the next two decades
needs to be scaled upwards compared to previous trends.
(ii) Without a shift towards WSD strategies (see below), NSW and Sydney’s, in particular, population growth over the next 20 years is likely to be closer to the national average. In fact, Sydney’s population growth is likely to be greater than the national average;
(iii) If Sydney cannot perform at its optimum due to poor
infrastructure, inadequate planning or environmental constraints, then national growth potential will be reduced.
4.2 Current trends Since the 1990s the share of New South Wales gross state product in the national total has been maintained. That is, New South Wales growth has equalled the national average. This is increasing pressure for population growth in Sydney. The Department of Urban Affairs and Planning population estimates for Sydney made as late as 1995, are likely to under-estimate the Sydney growth rate between 1991 and 2001 by up to 0.6 per cent per annum. Over the 1986 to 1998 period Sydney’s share of national population has increased from 21.2 per cent to 21.5 per cent. That is, the population growth is higher than the national average. It is for this reason that the laissez faire scenario developed below has a substantially higher population growth profile than the current DUAP projections.
National economic growth rate over the next 20 years is likely to be in the vicinity of 3.3 per cent per annum. On the basis that the new technologies and globalisation will become increasingly important in driving economic growth within the 3.3 national economic growth outlook, it is likely that Sydney’s gross regional product will be of the order of 4.5 to 5.0 per cent per annum. In the absence of a shift to WSD strategies, non-metropolitan gross product growth will lag and only be in the order of 2% p.a.

21
Against this background the DUAP population constrained projection, analysed below, could result in the national economic growth rate being 0.5 to 0.7 per cent lower than what would otherwise have been the case. This would place national growth at around 2.5 to 2.7 per cent. The difference is a national economy that has an effective unemployment rate at worst stabilising, and at best declining, compared to an economy where the effective unemployment rate is increasing. That is, without appropriate policies the DUAP population constrained projections outlined below could lock Australia into continuing the labour market trends of the last 20 years over the next 20 years. 4.3 Barrier constraints and laissez faire Realising the full potential of Sydney will not come by relying only on market forces and laissez faire. With the weakening of the decentralisation mechanisms, market forces will continue to see Established Sydney capturing a disproportionate share of Australia’s increases in income and wealth. Housing costs, rents and business operating costs will increase. Initially capacity will be created by forcing out of the region low to moderate value added businesses and low to medium income households. However, global Sydney needs a balanced industry and household structure to provide the traditional (cleaners, receptionists, business support services, transport workers, etc.) services necessary to sustain efficient production. These types of employees will be forced to live further and further away from global/established Sydney. Productivity will decline and costs will increase. Eventually global/established Sydney’s development will be constrained. In the past these constraints will have pushed economic activity to other locations in Australia. The reality is, however, that while this will still occur it is equally, or more likely, that production opportunities lost to global Sydney will accrue to equivalent global cities in other countries. 4.4 Regional impacts How does the economic structure and performance of the NSW economy impact the regions? Below we analyse and map change in four indicators – all confirming the growing employment, population, income and skill disparities across the state. We use inter-censal periods from 1981-96 to examine the broad trends. Although four years out of date, the Census remains the most reliable source to look at long term trends. The four indicators are:
Population growth
Average Household Income Growth
Growth in Employed Residents
Proportion of adult residents with diploma or degree qualifications
22
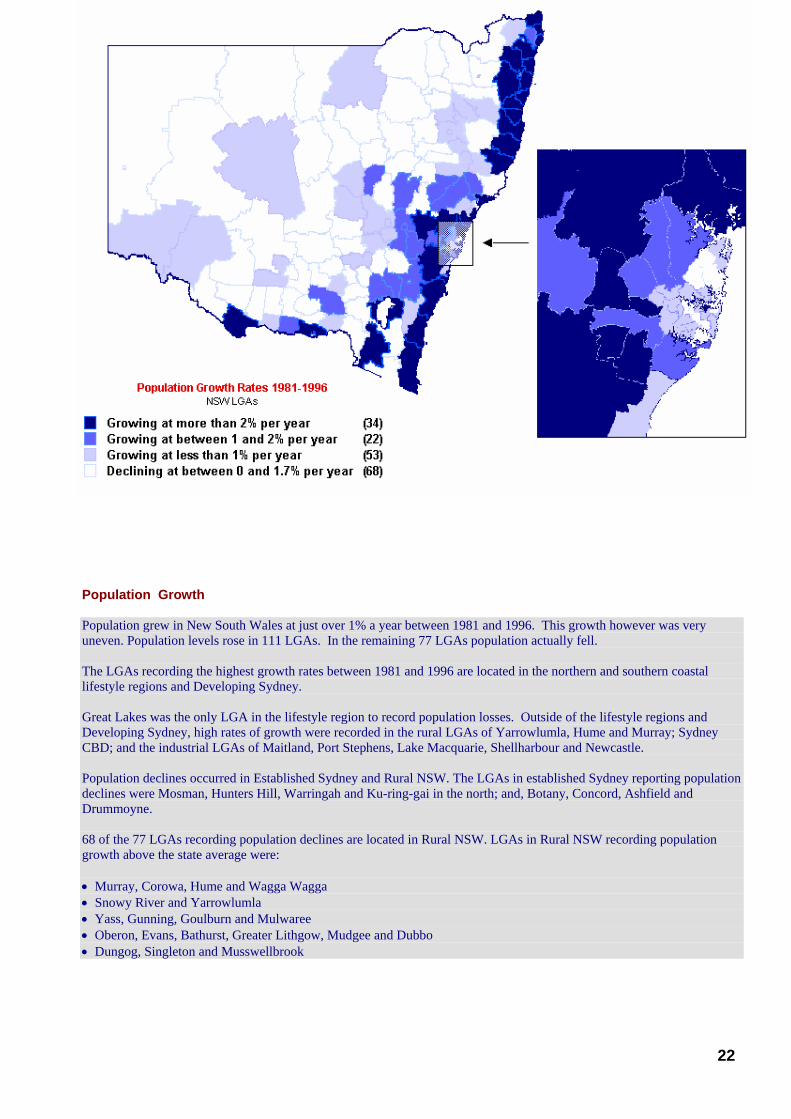
Population Growth Population grew in New South Wales at just over 1% a year between 1981 and 1996. This growth however was very uneven. Population levels rose in 111 LGAs. In the remaining 77 LGAs population actually fell. The LGAs recording the highest growth rates between 1981 and 1996 are located in the northern and southern coastal lifestyle regions and Developing Sydney. Great Lakes was the only LGA in the lifestyle region to record population losses. Outside of the lifestyle regions and Developing Sydney, high rates of growth were recorded in the rural LGAs of Yarrowlumla, Hume and Murray; Sydney CBD; and the industrial LGAs of Maitland, Port Stephens, Lake Macquarie, Shellharbour and Newcastle. Population declines occurred in Established Sydney and Rural NSW. The LGAs in established Sydney reporting population declines were Mosman, Hunters Hill, Warringah and Ku-ring-gai in the north; and, Botany, Concord, Ashfield and Drummoyne. 68 of the 77 LGAs recording population declines are located in Rural NSW. LGAs in Rural NSW recording population growth above the state average were: • Murray, Corowa, Hume and Wagga Wagga • Snowy River and Yarrowlumla • Yass, Gunning, Goulburn and Mulwaree • Oberon, Evans, Bathurst, Greater Lithgow, Mudgee and Dubbo • Dungog, Singleton and Musswellbrook

23
Average Household Income Growth Average household income in NSW grew at 0.3% a year between 1981 and 1996. This growth was not equally shared across the state. Real average household incomes grew in 76 local government areas. In the remaining 102 LGAs average household income actually fell. All LGAs in Sydney Statistical Division recorded income growth with the exceptions of Bankstown and Fairfield. The highest income growth – in excess of 2% per year – were recorded by LGAs in close proximity to Sydney CBD – Mosman, North Sydney, Leichhardt, Woollahra, Hunters Hill, South Sydney and Manly. A cluster of Northern, eastern and inner west LGAs grew at between 1 - 2%. These LGAs are residential areas for many high skilled Global Sydney workers. With the exceptions of Hornsby and Baulkham Hills these LGAs are all part of established Sydney and the LGAs with the highest household incomes in the state. Outside Sydney SD, only two LGAs – Yarrowlumla and Snowy River - recorded average household income growth higher than 1% a year. Non metropolitan LGAs recording between 0 and 1% income growth were: Cobar and Bourke in the Far West; Griffith; Yass, Gunning, Goulburn, Mulwaree; Wingecarribee and Kiama; Oberon , Bathurst, Evans, Orange, Cabonne, Blayney, Parkes, Dubbo and Mudgee. Almost three quarters of the LGAs outside Sydney recorded declining real average household incomes. The steepest declines occurred in: • the south west LGAs of Urana, Jerilderie, Conargo, Windouran, Hay, Wakool and Murray; • the central LGAs of Coolamon, Bland, Temora, Lachlan,Bogan, Warren, Narromine, Coonamble, and Gilgandra; • the northern central LGAs of Coonabarabran and Coolah; • the northern LGAs of Quirindi, Murrurundi, Nundle, and Walcha • the far northern LGAs of Yallaroi, Bingara, Barraba, Severn and Glen Innes

24
Growth in Employed Residents Across NSW the number of employed residents grew on average at 1.2% a year between 1981 and 1996. The growth was unevenly distributed across the state however, with growth in employed residents concentrated in a minority of LGAs. In two thirds of NSW’s LGAs the number of employed persons actually declined between 1981 and 1996. Relatively high average annual growth rates were recorded by many LGAs in Developing Sydney and LGAs in the lifestyle regions. In rural NSW the number of employed residents grew on average by more than one percent a year inYarrowlumla, Snowy River, Hume, Murray, Cobar Singleton and Wingecarribee. Lower growth (less than 1% a year) was experienced by Griffith, Dubbo, Mudgee, Bathurst, Evans, Greater Lithgow, Blayney, Musswellbrook and Dumaresq. All other LGAs in rural NSW, the number of employed persons declined between 1981 and 1996. In the Lifestyle Regions high growth rates were experienced in Tweed, Byron, Richmond River, Nymboida, Coffs Harbour, Hastings, and Eurobodalla. On the other hand declines occurred in Kempsey, Great Lakes and Casino. In the Industrial Regions, the LGAS of Cessnock, Wollongong, Newcastle, Shellharbour, Lake Macquarie all experienced declines in the number of employed residents over the period. On the other hand, the number of employed residents increased in Kiama, Port Stephens and Maitland. The number of employed residents fell in most of the LGAs of established Sydney with the exceptions of Sydney CBD, South Sydney and North Sydney. The steepest declines occurred in the southern LGAs of established Sydney where the number of employed residents generally declined at more than 1 percent per year. Relatively strong rates of growth in employed residents were recorded by Baulkham Hills, Penrith, Camden, Campbelltown, Wollongong, Gosford and Wyong.

25
Proportion of adult residents with diploma or degree qualifications 17% of the NSW population aged over 15 had degrees or diplomas in 1996. However, those qualifications are concentrated in a relatively few LGAs. Only 45 LGAs have above average concentrations of high skill residents. Most of these are in Established Sydney. In sixteen LGAs within Sydney, more than 25% of the population over 15 have degrees or diplomas. These are Drummoyne, Marrickville, Ryde, Hornsby, Hunters Hill, Ashfield, South Sydney, Manly, Waverley, Willoughby, Ku-ring-gai, Leichhardt, Woollahra, Lane Cove, Mosman, and North Sydney. Many of the high skilled residents of these LGAs work in Global Sydney in the knowledge based business services and as high skill in person service workers (such as doctors or university lecturers). Only two LGAs in Sydney – Fairfield and Wyong – recorded less than 10% of the population with degrees or diplomas. Penrith, Liverpool, Campbelltown and Bankstown also record relatively low concentrations of high skill residents. LGAs outside of Sydney with higher than state average high skill concentrations are Dumaresq, Yarrowlumla, Gunning, Kiama, Armidale, Snowy River and Yass. The lifestyle regions report relatively low high skill concentrations with the exceptions of Byron and Lismore (just below the state average). In the industrial regions Kiama, Wollongong and Newcastle also recorded skill concentrations above or just under the state average. Six LGAs in rural NSW recorded high skill concentrations just under the state average: Wagga Wagga, Conargo, Bathurst, Uralla, Wingecarribee and Tallaganda
26
Case study 3
Wollongong City Council
Creating opportunities for cultural industries The city of Wollongong has a supply of creative, communications and information technology graduates from its university and local TAFE, excellent venues and a large audience catchment extending south to Nowra and north and west to Sydney. But it has been losing people in the arts to major cities because of a lack of jobs. In 1998 the Council took a leadership role in cultivating local industry by commissioning a Cultural Industries Plan. The plan, “Point of Take-off”, aims to build businesses in cultural industries as a way of diversifying the city’s economic base. The first step in a Cultural Industries project, jointly funded by the Council and the Illawarra Regional Development Board, was to conduct a cultural audit to assess the existing and potential enterprise base. The project covers urban design, city image, building cultural tourism through packages and seasonal programs, and a marketing strategy to build audiences. A concrete example of what can be done is the formation of Film Illawarra by the Council and University of Wollongong. Five councils – Wollongong, Shellharbour, Shoalhaven, Kiama and Wingecarribee – now have a common film policy as part of a strategy to attract film production to the area. The first big production is now being filmed in Kiama. The next vital step is about to happen. A Cultural Industry Broker is about to be employed for two years thanks to a partnership between the NSW Department of State and Regional Development and Wollongong City Council. One of the aims is to build links between the cultural and other industries. Local designers could play an exciting role in customising local products for sale overseas.

27
5 Spatial restructuring of NSW
he economic and social transformation of regional NSW is resulting in a significant spatial restructuring. People, jobs and capital are continually on the move. A number of clearly
discernible trends are apparent at the regional level. For the purposes of this report, we divide NSW into five regions (Map 1), defined by a major defining feature of different areas of the state. A breakdown by local government area is shown in Appendix 1. Some areas are a combination of different features. This simple regional typology assists with analysis of broad trends and prospects across the state. More detailed analysis is required at the local government and indeed sub-local level.
Established Sydney
Developing Sydney
Post industrial NSW
Lifestyle NSW
Rural NSW
T
Rural NSW

28
5.1 Established Sydney To assist analysis for formulating WSD strategies, Sydney is divided into two regions: Established Sydney and Developing Sydney (see Map 2).
This region encompasses what we have previously termed Global Sydney – CBD, North Sydney, Eastern Suburbs and South Sydney – and the other inner and middle ring localities1. These areas developed inside Sydney’s greenbelt up to the 1960’s. Established Sydney includes inner Sydney, west to Auburn and Bankstown, south to Hurstville and North to Pittwater. Sydney, as a key interface between the Asia-Pacific region and the Australian economy, is Australia’s aspiring sub-global city. Sydney is:
Australia’s largest finance and business service centre;
Recipient of the largest share of foreign investment in Australian property and real estate;
Origin and destination point of most international and domestic business and leisure travellers;
Headquarters of the largest number of corporations;
The most likely location of Regional Headquarters of Australian based foreign companies servicing the Asia-Pacific region.
1 See National Economics, State of the Regions, with the ALGA, 1998
and 1999.
Established Sydney
Developing Sydney

29
The emergence of global cities and Australia’s integration into the global economy means that a new planning framework is required to position Sydney in the global economy. Best practice infrastructure, specifically communications and air transport linkages, will be significant determinants of how well Sydney and the Australian economy perform and develop in the context of these global changes. Increasingly, the main competitors for Sydney will not be Melbourne and Brisbane (although historic rivalries remain) but cities such as Singapore and Hong Kong. There are two fundamental features of Established Sydney of relevance to this report. Firstly, it contains the most economically dynamic areas of Australia. Around 40% of the nation’s knowledge based jobs are located in this region. In 1998, the city contained 40 of the 52 bank headquarters in Australia and 260 of the 408 of the regional headquarters of Australian-based multinationals. Secondly, Established Sydney is the focal point of urban consolidation policies to revitalise population growth in Sydney. 5.2 Developing Sydney
To a large extent, Developing Sydney includes those areas where new residential development is taking place, mainly areas involved in the NSW Government’s Urban Development Program. It includes Hornsby and Sutherland, extensions of Established Sydney with suitable land for development; Greater Western Sydney and the Central Coast. When commentators refer to urban sprawl, they are generally referring to the peripheral areas in this region. The term urban sprawl is unfortunate. The population of Developing Sydney is in fact greater than Established Sydney. Innovative metropolitan strategies such as the Sydney Region Outline Plan (1968) and the Metropolitan Strategy (1988), focused on how Sydney’s population growth could be accommodated in Developing Sydney. Strategies were developed to encourage strong regional centres, good public transport, accommodate population growth and careful environmental management.

30
5.3 Post industrial regions
The industrial regions of Wollongong Statistical Division and the Lower Hunter around Newcastle are undergoing economic and social transformation. In fact, one of the major goals of the economic development strategies of both areas is that they become post-industrial cities. Over the past 20 years, their regional economies have diversified from their heavy industrial base with mixed success. Growing industries include community services, retail, tourism and entertainment and value added manufacturing. Unemployment remains high. Population is growing significantly outside of the industrial cities including Lake Macquarie and Port Stephens in the Lower Hunter. In Wollongong SD, the growth areas have been Shellharbour and, until recently, Kiama. An increasing proportion of workers commute to Sydney from the northern Illawarra. Both Wollongong and the Lower Hunter have significant potential to accommodate population growth of the Greater Metropolitan Region, providing their local economies become more dynamic and transport infrastructure links to Sydney are improved, particularly from the South Coast. 5.4 Lifestyle regions NSW lifestyle regions are those areas of the north and south coast of NSW where lifestyle opportunities are driving both population and economic growth. These areas tend to have good year round climate, scenic surroundings, and strong environmental and cultural assets. Although much of the wealth of these regions has been associated with their natural resource base, including timber and fertile soils, the main drivers of wealth are increasingly associated with lifestyle choices. These areas are attractive to a wide range of socio-economic groups, which results in diversity. It includes retirees, young creative people and, increasingly, highly skilled professionals. The drivers for change have been tourism and post-retirement, which in turn has attracted demand for support industries: building and construction, wholesale and retail and community services. A significant backlog exists in the provision of infrastructure and services in these regions. These areas are coming under great pressure from growth. Some of these areas have the fastest rates of population growth in regional Australia but also the highest unemployment rates. 5.5 Rural regions Rural regions of NSW are those areas where agriculture and associated rural industries are central to economic structure. This includes all the regions to the west of NSW: Northern, North Western, Central West, Murrumbidgee, Murray and Far West. Around 14% of the state’s population live in rural regions. In aggregate, rural regions are losing population. People are moving from farms and small towns to provincial cities, and from rural regions to Sydney and lifestyle regions. There are of course significant differences in their structure and
31
performance. Those areas dependent on traditional agricultural commodities continue to battle, particularly in Northern, North Western and the Far West, but also in parts of Central Western NSW. The intensive agricultural areas of the Murrumbidgee and the Murray are performing well. Much of the debate about regions has focused on rural regions, and particularly on the declining fortunes of small country towns. Rural production has been heavily based on commodities - particularly wheat, beef, wool, sugar and cotton. Many rural regions are experiencing long-term structural difficulties – low commodity prices, competition from other countries and substitute products and declining employment opportunities. Family farms continue to struggle and farmers engaged in marginal activities are leaving the land. The growth of agri-business, and the introduction of business methods and new technology on family farms enhance the competitiveness of rural industries. Farmers are getting involved in producer networks. Deregulation of statutory marketing authorities is creating new opportunities for product differentiation. Over the past decade, the fortunes of rural regions have as always been associated with the fortunes of nature and world commodity prices. In the current cycle, wheat and beef prices have improved significantly whereas sugar, wool and cotton prices are depressed. Some regions with climatic and natural resource advantages – particularly water and soil – have successfully diversified into high-value produce such as horticulture, wine and processed dairy foods. These regions are important to national economic performance, particularly because of the export orientation of the agricultural sector.

32
Case Study 4 Penrith City Council Building local industry networks Just off the blocks at Penrith City Council is a new venture designed to bring jobs to the region. Penrith has engaged an Industry Networks Coordinator to seek out and stimulate industry networks. The project, funded partly by the Council with major support from the local Area Consultative Committee, was the brainchild of the Penrith Valley Economic Development and Employment Committee. Penrith is surveying firms and analysing industry makeup as a precursor to recommending where networks might bring benefits such as economies of scale in joint marketing. The council has looked for success stories in industry networks. Two examples stood out - the Albury-Wodonga Laboratories Network and the Central Coast Hydroponics Network. The council is now hoping it will build its own success story with key success factors being the right skills to drive the project and real economic benefits for participating businesses.

33
6 NSW population dynamics
he population of NSW is approximately 6.5 million people, representing around 34% of the total Australian population. Over the past decade, the NSW population grew by just over 1%
pa. The fastest growing states are Queensland and WA, both growing off a lower base than NSW. The state’s population growth is driven by natural increase and international immigration. This year, natural increases are estimated to increase the state’s population by 35,000, and international immigration will add 45,000 people. NSW is by far the most popular destination for migrants. Around 42% of international migrants to Australia came to NSW last year, and most of these are destined for Sydney. Every year some NSW residents also leave the state. Globalisation and a vibrant labour market is spurring growth of Sydney. This year, for example, 11,500 residents will leave NSW, moving interstate or overseas. This includes professional people moving for employment reasons and retirees shifting interstate, particularly to Queensland. A regional breakdown of the population at the 1996 Census was as follows: Region Population % NSW Established Sydney 1 785 100 28.8 Developing Sydney 2 096 000 33.8 Industrial regions 719 100 11.6 Lifestyle regions 758 900 12.2 Rural NSW 845 500 13.6 Total 6 204 600 100.0 An important characteristic of NSW is the metropolitan dominance of the Greater Metropolitan Region - Newcastle, Sydney and Wollongong - where just under three out of four residents of the state abide. Sydney continues to grow rapidly. Over the past 20 years, Sydney has grown on average by around 53,000 people per year. Last year, its population grew by 60,000. Following innovative metropolitan plans, Sydney has grown along transport corridors to the west, south and south west, north and north west and the Central Coast. These developing areas now represent the majority of Sydney’s population and continue to absorb most of Sydney’s population growth. Population growth is driven by the economic, social and lifestyle opportunities of Australia’s only global city. On the Australian landscape, Sydney acts as a magnet for new residents and workers: including young people from non-metropolitan regions, skilled migrants and low and high-skilled workers from other states. Recent projections from the Department of Urban Affairs and Planning indicate that the state’s population will grow from 6.2 million in 1996 to 7.4 million to 2021. In other words, the state’s population is forecast to grow by 47,000 people a year, or around two thirds of the 1% per year rate experienced over the past decade. These forecasts
T
“NSW is by far the most popular destination for migrants.”

34
suggest a major slowdown in population growth. Table 6.1 - taken from DUAP - indicates a number of important trends.
Table 6.1 Baseline population forecasts for NSW Region
Actual 1996
Projections 2021
Change 1996 to 2021
Sydney 3 881 100 4 737 700 856 600 Newcastle SSD 463 400 523 900 60 500 Wollongong SSD 255 700 292 600 36 900 Greater Metropolitan Region 4 600 200 5 554 200 954 000 Hunter Balance 91 800 105 900 14 100 Illawarra Balance 117 100 170 500 53 400 Richmond Tweed 200 500 293 800 93 300 Mid North Coast 262 400 360 500 98 100 Northern 178 600 171 300 - 7 300 North Western 117 300 117 600 300 Central West 172 400 169 100 - 3 300 South Eastern 178 900 204 300 25 400 Murrumbidgee 149 200 144 800 - 4 400 Murray 110 900 112 000 1 100 Far West 25 300 18 500 - 6 800 NSW 6 204 700 7 422 600 1 217 900
Source: Department of Urban Affairs and Planning

35
6.1 Metropolitan Sydney The dominance of the Greater Metropolitan Region (GMR) is set to continue. In fact, the share of the state’s population living in the GMR is forecast to actually increase slightly to just over 75% of four residents of the state. DUAP forecasts that Sydney’s population will grow by 856,000 to 2021. In other words, the population will grow by 34,000 people per year over the next 20 years, compared to 53,000 over the last 20 years. In our view, on current growth trends, this forecast severely underestimates population growth in Sydney. In the past year, Sydney’s population increased by 60,000. The more Sydney succeeds as a global city, the more it will attract skilled overseas migrants and people from other parts of Australia. Strong employment growth, education and cultural facilities, and natural births have driven population growth in Sydney. It must be emphasised that, although overall there are declining birth rates, natural births in the developing areas of Sydney - principally Western Sydney and the Central Coast - remain high. On the other hand, increasing property prices and rentals are pushing lower income people out of central areas of Sydney, and increasingly out of Sydney altogether. The critical question is where will population growth be accommodated in Sydney? Successive NSW governments have stressed the importance of urban consolidation policies to repopulate Established Sydney. The cited advantages of increasing residential densities in established areas include better utilisation of existing physical and social infrastructure, reducing pollution and journey to work times, and minimising new infrastructure investment. However, this policy has met with considerable community resistance in many areas. Critics argue that it leads to congestion, crowding, overloading of infrastructure and a deterioration of quality of life. Some commentators have warned of the potential for the ‘Manhattanisation’ of Sydney. Despite this, urban consolidation has managed to increase the population of a number of inner city areas. Table 6.2 shows population change in the high priority areas for consolidation inner Sydney over the 12 year period 1986-1998, indicating that the population grew by more than 10%, or 58,000 residents, over this period2.
2 In our view, the 1998 population figures provided by ABS over-estimate
population but are used here because they are official figures.

36
Table 6.2 Population change inner Sydney selective urban consolidation zones 1986-98
Local government area 1986 1998 Change
1986 to 1998
Leichhardt 56 303 62 206 5 903
South Sydney 73 873 83 752 9 879
Randwick 115 620 125 359 9 739
Drummoyne 30 605 32 958 2 353
Ashfield 40 401 41 945 1 544
Strathfield 25 662 28 145 2 483
Concord 23 399 25 290 1 891
Burwood 28 556 29 980 1 424
Marrickville 81 647 79 246 -2 401
Rockdale 83 350 90 372 7 022
Sydney 12 438 30 635 18 197
Total 571 854 629 888 58 034 Source: Australian Bureau of Statistics
Table 6.3 shows that Sydney’s population increased by 632,000 people between 1986-1998, or on average by 53,000 people per year. During this period, the population of Established Sydney grew by 159,000 (25% of the total increase) and the population of Developing Sydney grew by 473,000 (or 75% of the total). Of the latter, the population of Greater Western Sydney increased by 320,000 (or by 26,000 people per year), and the population of the Central Coast increased by 89,500 (or by 7,500 per year).
Table 6.3 Population in metropolitan Sydney 1986-1998
Region 1986 1998 Change
1986-98 % Sydney population
(1998}
% of population growth 1986-98
Established Sydney
1 674 374 1 833 401 159 027 46 % 25 %
Developing Sydney
1 690 484 2 164 044 473 560 54 % 75 %
Total 3 364 858 3 997 445 632 587 Source: Australian Bureau of Statistics and National Economics
A further breakdown of the growth over the period 1986 to 1998 is shown in Chart 6.1. The chart shows that whereas inner Sydney accommodated 9% of Sydney’s population growth, Greater Western Sydney accommodated

37
more than half of Sydney’s growth, Hornsby and Sutherland 10% and Central Coast 14% over the same period. A number of conclusions can be drawn from population change in Sydney. Firstly, urban consolidation policies have supported population regeneration of inner Sydney localities. Around 25% of Sydney’s population growth are being accommodated in Established Sydney. Up until the late 1980’s, these established areas were not growing. It is not expected that Established Sydney will maintain the strong growth rates of recent years, partly because the area is running short of large redevelopment sites, property prices are getting out of reach in Global Sydney, and residents are becoming more concerned about congestion and other environmental problems. Secondly, most population growth is still being absorbed in Greater Western Sydney (GWS), Central Coast and the expanding areas of established Sydney at Hornsby and Sutherland. Given the size of GWS (1.5 million) and Central Coast (280,000), it is inappropriate to talk about continued growth of these areas as urban sprawl. These areas were designated as urban growth areas for Sydney. Thirdly, under all scenarios for the future of Sydney (see below), the localities of Developing Sydney will accommodate between 80-90% of Sydney’s population growth over the next 20 years.

38
Chart 6.1
Accommodating population growth in Sydney 1986:1998
Inner9%
Rest of Established
Sydney16%
Greater Western Sydney
51%
Central Coast14%
Hornsby & Sutherland
10%

39
6.2 Post Industrial regions The industrial regions of NSW are expected to accommodate an increasing share of population growth. DUAP forecasts that Newcastle and Wollongong will increase their population by 96,000 people between 1996 and 2021. The bigger share (60,000 people) will be accommodated in the Lower Hunter particularly in Lake Macquarie, Port Stephens and Maitland. Inner city revitalisation in Newcastle and Wollongong remains an attractive option. In Wollongong SSD, population growth has shifted to Shellharbour, and greenfield developments in Albion Park and Dapto. The natural birth rate, competitively priced land and housing packages, good coastal access, and new regional employment opportunities are driving population growth. High prices and land shortages in Sydney will increase population spillovers to the Northern Illawarra and Lower Hunter. In the case of Wollongong, population growth is also linked to access to the Sydney labour market. The Lower Hunter is attracting retirees to localities such as Port Stephens (really a lifestyle area) and Lake Macquarie. The latter is also becoming increasingly attractive to professional people requiring access to Sydney, particularly to part-time workers, home-based businesses and telecommuters. Population and historic growth rates are set out in Table 6.4. The table shows that there are significant differences in population change within these regions. There is stagnation in the older industrial areas and rapid growth in the more lifestyle-oriented centres. It is suggested that this may change over the next 20 years as these regions become more integrated into the Greater Metropolitan Region and some of the lifestyle areas, such as Kiama and Port Stephens, reach their population capacity.

40
Table 6.4 Population change in NSW Industrial regions Locality Average annual
population growth rate
1986-98
Population 1998
DUAP population
forecasts 2021
Cessnock 0.63% 46264
Maitland 1.27% 52844
Newcastle 0.32% 139171
Lake Macquarie 1.1% 180826
Port Stephens 4.24% 54799
Newcastle SSD 473904 523500
Wollongong 0.54% 185397
Shellharbour 1.87% 55870
Kiama 3.17% 18794
Wollongong SSD 260061 292600
6.3 Lifestyle regions The lifestyle regions – Richmond-Tweed, Mid-North Coast, Shoalhaven, and, to a lesser extent, South Eastern NSW – are coming under increasing pressure from population growth. Substantial population growth has taken place over the past 10 years in regions with attractive lifestyle attributes, specifically good climate, water, housing and, depending on personal preferences, proximity to entertainment and shopping facilities. The Richmond-Tweed and Mid North Coast have the highest population growth rates in NSW, around 2.6% pa. For example, the south eastern NSW localities of Eurobodalla and Bega Valley have grown at 4.1% pa and 2.1% pa over the past 20 years. Shoalhaven is growing at 3.7% pa. In the northern lifestyle regions, growth is most pronounced in coastal towns and villages. For example, Tweed Heads, Byron Bay, Coffs Harbour and Port Macquarie are growing rapidly. On the other hand, some of the inland towns are struggling with structural unemployment and little growth. This includes Casino, Grafton, Taree and Kempsey. On the south coast growth is more dispersed. DUAP estimates that 270,000 more people will be living in the lifestyle regions of NSW by 2021. From these figures, the population of Richmond Tweed and Shoalhaven will increase by almost 50%, the population of the mid North Coast will increase by almost 40%; and the population of South East NSW, predominantly the fast-growing coastal areas, will increase by 14%. This raises important issues about the environmental sustainability of their current growth path as well as the capacity of infrastructure to match their extraordinary growth rates.

41
6.4 Rural resource based regions Rural resource based regions are all areas to the West of the Great Dividing Range. There are significant differences in population growth rates. Many non-irrigation areas involved in wool and wheat are losing population, particularly in the Far West and parts of the North West. Traditional resource areas such as Broken Hill have been losing population. The declines are not uniform. Other areas are doing well, particularly those where farmers have been active in improving both efficiency and quality of wheat production such as Walgett. The big growth areas in agriculture over the past 20 years have been horticulture, wineries and cotton. Areas that have done well include Namoi, Riverina and the Hunter Valley, the latter also aided by its coal resource base. In aggregate, the population of rural NSW is declining. The contributory factors are well known: low agricultural prices and unsustainable small family farms, increased costs, technological improvements and outsourcing, low living standards and associated decline of small towns. The population is ageing as younger people move to the city in search of employment and lifestyle opportunities not afforded to them in the country. Population is consolidating around selective inland cities: Albury, Wagga, Orange, Bathurst, Dubbo, Tamworth and Armidale (Table 6.5). A number of other rural towns have significant economic potential. These cities are at the centre of major catchment areas. Innovative strategies have been implemented to stimulate growth of these towns including growth centres policies, investment in educational facilities and government administration.

42
Table 6.5 Population change in major rural centres
Rural centres Population 1998 Population growth rate 1986-96
Albury 43 074 0.80 %
Wagga 56 566 1.24 %
Orange 35 584 0.71 %
Bathurst 29 683 1.79 %
Dubbo 37 030 1.87 %
Tamworth 35 226 0.51 %
Armidale 21 219 0.92 % Source: Australian Bureau of Statistics
DUAP forecasts that the population of rural NSW will continue to decline to 2021, with population losses in the northern, Murrumbidgee, Far West and Central West.

43
Case study 5
Gwydir Valley Cotton Growers Aboriginal Employment Strategy
Supporting Aboriginal employment as a step towards Reconciliation Since 1996 the Gwydir Valley Cotton Growers Aboriginal Employment Strategy has secured 100 permanent positions and placed a total of 227 Aboriginal people into employment. The inquiries are now streaming in from across Australia to Warren Barnes, Executive Officer, asking for the secrets of this regional success story. The program was put together in 1994 in response to the findings of the Aboriginal Deaths in Custody Report and finally got off the ground in 1996. The Cotton Growers saw they could make a contribution to a better relationship between black and white people within the region thus improving the quality of life. At the same time it had the potential to provide a more stable, local workforce and demonstrate their bona fides as responsible corporate citizens. The result is a practical step towards Reconciliation and a better regional self-image. Part of the answer to the Strategy’s outstanding success is undoubtedly funding and support from the Federal Department of Workplace Relations and Small Business. Local business also played a critical role and the Strategy is no longer confined to the cotton industry. In the last 12 months the Moree City Council has placed 10 people under the Strategy and currently has 6 Aboriginal employees. But much of the success is related to the solid and continuing support that new Aboriginal workers receive under the Strategy. The Strategy requires that workers are supported until they are comfortable in their workplace. They are then able to act as advocates for the workplace with their friends and relations. The first two Aboriginal workers are now qualified as cotton classers, the highest paid and most skilled of the cotton workforce. This was no easy task. Training could only be undertaken in the USA. Qantas, Eastern Airlines and World Vision made the trip possible. The strategy stands as an example of how a region can tackle economic and social problems through innovative programs and personal skills and commitment.

44
7 Three scenarios for state development to 2021
he previous analysis demonstrates that NSW faces a number of economic and social challenges over the next 20 years. The findings of the demographic analysis suggest that Sydney will
continue to experience significant population growth. Each of the major regional areas will face significant challenges. Even with the most aggressive urban consolidation policies, Established Sydney can only accommodate a small share of Sydney’s growth. Developing Sydney will need to accommodate between 700,000-900,000 people. The magnitude of this challenge in terms of infrastructure, residential development, jobs and services is yet to be fully appreciated. Lifestyle regions are coming under increasing pressure to conserve environmental attributes and are facing a major backlog in social and physical infrastructure, as well as the challenge to create good jobs. Three scenarios are considered for population change between 1996 and 2021.
DUAP or population constrained
Laissez faire
Sustainable development
T

45
7.1 DUAP or population constrained These are the official forecasts for NSW. Population growth is assumed to decline from 1% pa over the past 20 years to 0.0067% pa ie two thirds of 1%, over the next 20 years. Under this scenario, it must be accepted that there will be a significant decline in immigration into NSW and an acceleration of interstate movement of people out of NSW. The population of NSW increases from 6.2 million to 7.4 million. Even with a major decline in the growth rate, the population of Sydney increases by 856,000 people over this period. A realistic allocation of this population growth is that Established Sydney will increase its population by 150,000 and Developing Sydney will increase its population by 700,000. Around 500,000 additional people will be accommodated in Greater Western Sydney. Under this scenario, Newcastle and Wollongong become important areas for population growth, with 100,000 extra people living in these regions. Lifestyle regions continue to grow strongly, from 758,900 to 1,029,100 people, or by 35%. Rural NSW continues to lose population, from 845,500 in 1996 to 839,200 in 2021. The changing distribution of population is shown in Chart 7.1.
Chart 7.1 DUAP or population constrained scenario
500 0001 000 000
1 500 000
2 000 000
2 500 000
3 000 000
EstablishedSydney
DevelopingSydney
Productionregions
Lifestyleregions
Rural NSW
1 996 2 021

46
7.2 Laissez-faire Under this scenario, market-oriented solutions remain the force driving change in the state. The population of NSW reaches 7,767,720 by 2021, around 345,000 more than with the DUAP forecasts. NSW population growth slows to 0.008% pa but not as much as the other two scenarios. Sydney reaches 5 million people by 2021, with 48% living in Established Sydney and 52% living in Developing Sydney. Foreign investment and high-income knowledge jobs continue to concentrate in central or Global Sydney. To sustain international competitiveness, federal and state taxes are kept low and shifted downward, increasing the inflow of footloose global enterprises to Global Sydney. Sydney continues to act as a magnet in the Australian context, but it does so in a way that the metropolitan region becomes more polarised and fragmented. Inner city property prices become more linked to other global cities and high income jobs continue to attract high skilled managers, entrepreneurs and workers to live and work in Established Sydney. At the same time, the population growth of Developing Sydney also accelerates, driven by natural births, an influx of people who have been priced out of Established Sydney, as well as people from rural and NSW. With greater population pressure on Sydney, the spillovers on Wollongong and Newcastle are quite significant. The population of these areas grows by 132,000 to 2021, compared with 96,000 in the DUAP forecasts. Higher population growth rates also result in a faster rate of growth in the lifestyle regions, with population growing from 758,900 in 1996 to 1,079,320 in 2021. Less attention is given to rural restructuring, resulting in a net decline in rural population to 839 200, or over 6,000 people. Chart 7.2 shows the population distribution between the regions in 2021.
Chart 7.2 NSW population in 2021: Laissez faire scenario
500 000
1 000 000
1 500 000
2 000 000
2 500 000
3 000 000
EstablishedSydney
DevelopingSydney
Productionregions
Lifestyleregions
Rural NSW 1 996 2 021

47
7.3 Sustainable development The sustainable development scenario involves a concerted effort by three tiers of government and the community to plan for and bring about change in the major regions consistent with the principles of ESD and its economic, social and environmental dimensions. This scenario requires that environmental objectives are clearly specified up-front in regional economic development strategies. All regional types experience population growth in a more balanced way than in the other two scenarios (chart 7.3) . It assumes that other Australian cities become more integrated into the global economy – particularly Melbourne and Brisbane - and their share of new population growth increases. NSW population reaches 7.47 million by 2021, more than the population constrained case but less than the laissez case. In this context, it is concerned with developing the economic capacity of regional NSW within a framework that addresses social cohesion, intra-generational and inter-generational equity and environmental issues.
Chart 7.3 Sustainable development scenario
500 000
1 000 000
1 500 000
2 000 000
2 500 000
EstablishedSydney
Developing Sydney Production regions Lifestyle regions Rural NSW
1 996 2 021

48
The sustainable development scenario is based on the following premises:
Globalisation brings significant economic benefits to the state economy, particularly knowledge flows, migrants, new skills, trade and visitors. All regions are increasingly incorporated into global trade and knowledge flows. It would be economically and socially damaging to NSW if immigration were artificially restricted. Population growth per se is not the problem, it is the environmental consequences of private car dependency, inefficient energy systems and reliance on traditional industries that is the problem.
The benefits of globalisation are too heavily focused on Global
Sydney. The sustainable development sets a target to increase the population of rural NSW through the implementation of active regional development strategies.

49
7.4 A summary The three scenarios are summarised in Chart 7.4. In summary: The constrained scenario results in a state population of 7,428,000 by 2021. It results in poorer economic performance, slower growth of non-metropolitan regions and population decline in rural NSW. The laissez faire scenario results in a NSW population of 7,607,000 by 2021. It results in higher rates of economic growth associated with growing inequality and environmental damage, particularly in Sydney. Infrastructure is inadequate to meet the challenges of regional development, because public investment in infrastructure is severely constrained. The sustainable development scenario results in a population of 7 473 100 by 2021. It results in population and economic growth in all areas, including a target to increase the population of rural regions by 75,000 people.
Chart 7.4 Population distribution in 2021
-1000000
100000200000300000400000500000600000700000800000900000
1000000
Established metro Developing metro Industrial cities Lifestyle Rural
Constrained Laissez faire Sustainable

50
Case study 6
Wagga Wagga City Council
Investing in liveability Wagga has developed its cultural amenities to provide a vibrant quality of life. The City has adjusted to the National Competition Policy by opening up its gas infrastructure to the private sector and investing some of the proceeds in the city’s liveability. One of the projects was a $12 million Main Street development. The Wagga City Council was also able to build a new Civic Centre incorporating library, Regional Art Gallery, Regional Museum and National Art Glass Gallery. The Council has recognised the importance to the area of the original inhabitants, the Wiradjuri people, and often invites Wiradjuri elders to take part in council activities. In May 2000 the NSW Premier, Bob Carr, attended a Cultural Summit held in Wagga, organised through the LGSA and attended by arts officials and local government from across the State. The aim was to produce the 2nd State Cultural Accord. The first Accord came out of a summit held in Parliament House in Sydney. Holding the second summit in Wagga acknowledged the importance of regional cultural life to the entire State. Wagga is attracting arts workers because of its attractive lifestyle, active arts community and a greater opportunity to build skills than may exist in the metropolitan centres. For its part the Riverina Eastern Regional Organisation of Councils has successfully worked at securing cooperation between the city of Wagga and the surrounding councils. The rationale is that the agricultural wealth and productivity of the region has helped Wagga grow and that the city provides an exciting centre of benefit to the whole region.

51
8 The limits of current economic policy
iven the forces driving regional change, why is there such widespread scepticism about regional policy directions in Australia? Arguably, the reason for the scepticism is that the
dominant economic policy approach in Australia at a national level is inimical to regional development. Over the past 15-20 years, the economic policy agenda has been dominated by new (or in fact rehashed) approaches to macroeconomic management and microeconomic reform. These models are still unfortunately in vogue and until we rethink the tenets of these approaches, regional policy is likely to remain relatively ineffective. 8.1 Macroeconomic management Macroeconomics is concerned with outcomes at the national level: inflation, employment, the exchange rate and investment and savings. To understand the impact of macroeconomic policy on regions, it is important to distinguish between two historic models of macroeconomic management. The first model can be termed the market-government partnership approach to marcoeconomic policy - which lasted roughly from the mid 1930s to the early 1980s. The second model is the market dominant paradigm – which came to be increasingly implemented from the early 1980s. The periodic crises of last century – depression, war and underdevelopment – resulted in the implementation of a broad consensus around macroeconomic policy in market economics. This consensus recognised that modern economies could work well in competitive environments. Markets were recognised as a necessary but not sufficient mechanism to produce optimal economic and social outcomes. Producers were free to set prices and production targets, workers could negotiate wages individually or collectively through trade unions, and consumer sovereignty reined supreme. This consensus also recognised three fundamental flaws in the market: Firstly, economies were subject to wide fluctuations or business cycles characterised falling investment and output and increases in unemployment. Secondly, the private sector underproduced in certain key areas, particularly in areas such as education, R&D and technology - where returns may be long term, risks higher, and where others could appropriate the benefits of your investment. Thirdly, the market mechanism tended to concentrate economic benefits. Those with access to capital – including global corporations, those who lived in high-income regions, and those with high skills – tended to be the beneficiaries.
G

52
In this model, government the role of markets. When an economy was under-performing the government could stimulate expenditure and investment to shift an economy onto a higher development path. Government invested heavily in education, health and physical infrastructure, supported public and private R&D, and provided incentives for firms to accelerate the take-up of new technology. To ensure equitable outcomes, governments provided uniform social security – pensions, unemployment and sickness benefits, and transferred resources to regions that were falling behind due to structural change and loss of competitiveness. The emergence of the market dominant model was associated with the slowdown global economic growth since the mid 1970’s. Elements of this model include trade liberalisation, a reduction in the role of government in macroeconomic management – particularly the use of government expenditures and revenues to influence macro-economic outcomes, deregulation and privatisation. The big picture is to rely on markets alone to allocate resources. In this model, government participation in the economy is identified as an impediment. The role of government is to keep taxes low and expenditures even lower and to keep budgets in surplus so as not to put pressure on interest rates. 8.2 Microeconomic reform agenda The other tenet of the economic reform agenda is microeconomic reform. This is predominantly concerned with the performance of individual enterprises and sectors of the economy. The main elements are competitive pricing, changing work practices, and increasing productivity through cost reductions. The flagship for microeconomic reform in Australia is National Competition Policy and most of the reforms have been directed at public enterprises. Microeconomic reform provides a rationalisation for privatisation of public assets. In relation to infrastructure services, greater emphasis has been given to user pays principles – prices should reflect the cost of supply, including environmental costs. With the assumption that private enterprises are more efficient than public enterprises, why maintain public ownership of electricity, water and telecommunications providers? The obsession with deregulation, privatisation and balancing budgets have diverted us from the need to think systematically about the future of NSW’s regions. A driving force for regional policy intervention formulation is to ensure that all regions broadly share opportunities and poorer regions don’t fall further behind richer regions. A conclusion from the economic reform path of the past decade is that reliance on market mechanisms alone will lead to deterioration in the economic performance of poorer regions.

53
8.3 Regional policy instruments to support WSD To meet the challenges confronting regions, regional economic development policy has shifted up the policy agenda in most developed countries. Australia lags behind North American and European commitments. Growing regional inequalities have resulted in a significant involvement of government in the development and implementation of policies that enable regions to restructure and attain their economic potential. The booming US economy, for example, has created economic divergences between regions, leading to a greater commitment to regional development in both poor urban and rural regions. To address this, the US Federal Administration supported the establishment of rural development partnerships in many states, with funding support for collaborative initiatives involving all tiers of government and local stakeholders. The Clinton Administration has implemented a number of major programs and initiatives to support the restructuring of distressed urban and rural communities. The most prominent is the Empowerment Zone and Enterprise Community Initiative (EZ/EC), which provides tax incentives and performance grants and loans to create jobs and expand business opportunities. It also focuses on activities to support people looking for work. Total public and private investment in urban EZ/ECs exceed US$4 billion. European countries have made regional development a centrepiece of economic policy. The European Community now spends about one third of its annual budget on regional initiatives, a massive proportion of total expenditures, and almost twice the proportion spent on regions in 1988. The aim is to stimulate economic development and employment growth in the poorer regions, though infrastructure development, promoting private sector investment and building industry networks, technology transfer, and education and training. It is recognised that to shift poorer regions on a dynamic development path will take a long time, but the focus is on creating the conditions for growth and not subsidies.
The objectives of regional development policy are to enable regions to attain their economic potential. Most successful regions have a number of common core competencies, and hence innovative regional policies have sought to strengthen the core competencies of poorly performing regions. These core competencies include competitive firms that operate in clusters and networks, knowledge based workers continually upgrades skills, good quality lifestyle and innovation and collaboration between business, government and community. Major investments are required in regional education, R&D, technology transfer, information communications technologies and physical infrastructure. New instruments of regional policy have emerged to meet these challenges. The broad features of innovative regional policies are as follows. Firstly, the focus has shifted from business attraction towards enhancing the competencies of firms, households and organisations within the region. Investment attraction follows successful

54
implementation of strategies. Secondly, the generation and exchange of knowledge has become central to the innovation process. Thirdly, greater emphasis is given to developing business and community networks and bonds and trust between groups. Fourthly, government involvement has shifted from a top down approach to a bottom up approach with initiative and direction set from within the region and government responding with financial and human resource support to projects that lead to positive economic and social outcomes. The new agenda for regional policy based on WSD principles should include:
Inclusive regional vision Comprehensive regional strategies -
Economic, social and ecological Partnerships with outcomes Commitment from federal & NSW governments. Regional leadership & empowerment A new charter and resource base for Local Government. Building local and regional capacity

55
Case study 7 Norlink
Building world-class telecommunications
The Northern Rivers Region has a bright future in its “Cellulose Valley” herbal medicine industry. But attracting new companies to this and other growth industries to the region requires a world class information technology and telecommunications. Achieving this standard may very well soon involve establishing its own regional telecommunications company, according to the chairman of Norlink, Keith Davidson. Local interests formed Norlink with the helping to develop a planned, inclusive and effective information economy within the region. Its board has wide representation including:
Northern Rivers Regional Organisation of Councils (NOROC) Northern Development Task Force (NDTF) Northern Rivers Regional Chamber of Commerce & Industry (NRRCCI) Regional Information Technology Industry Association (RITIA) Northern Rivers Social Development Council (NRSDC) Northern Rivers Regional Tourism Organisation (NRRTO) Northern Rivers Regional Development Board (NRRDB) Southern Cross University.
Norlink is using Community groups to bring together consumers with a common interest and involve them in planning how their telecommunications needs can be met. A number of task groups have been set-up by Norlink to examine needs, linkages and applying a telecommunications solutions to them. These have covered the areas of health and health education; education; multi-media and the arts, and business and government tourism. Norlink estimates the regional telecommunications market at $250 million with excellent scope for growth. One industry that relies on state of the art Telecommunications is film production. There are over 100 film or film related production companies in the region estimated to employ around 250 workers. Norlink has concentrated strongly on overcoming inequities in telecommunications. The issues include geographical access and social inequities involving price, availability and quality of service. Local government through NOROC has played an integral role in developing this region wide solution to telecommunications issues and has agreed to work towards combining with others in the region to provide the initial purchasing power. The Northern Rivers Regional Chamber of Commerce, where Keith Davidson is also Executive Officer, has also addressed the issue of skills among business. It is running highly successful business planning workshops to help local businesses re-engineer to take advantage of e-commerce under the slogan E-Commerce “saving money and making money using the Internet”.

56
9 Recommendations
1 WSD approach embraces all urban and
regional NSW
n putting forward perspectives on regional development to NSW and Federal Government, the Associations should adopt a comprehensive state wide approach to regional development to
encompass of all regions in NSW. Current approaches to regional development in Australia are fragmented and confusing. Some equate regional development with the fortunes of small rural towns only. Others define regional Australia as non-metropolitan areas. Telstra has developed a new regional program but excludes Wollongong, Newcastle and Geelong. The starting premise for the “Whole of State Development Strategy” for NSW, however, is that the state can only attain its potential if all areas of the state can be divided into regions. In this report, an attempt is made to classify all NSW into regions. The five types of regions identified are Established Sydney, Developing Sydney, Rural, Industrial and Lifestyle. This classification, although not perfect, enables us to identify major drivers for change in each region. It also enables us to develop a framework to strengthen linkages between different types of regions, such as improving transport and communications linkages between Sydney and rural regions.
I

57
2 Government coordination :
Regional Economic Development Accord Coordination between the three tiers of government in relation to regional economic development remains fragmented. For example, the Federal Government’s Regional Solutions Program excludes state agencies from applying for funds. Recently, the Regional Development Task Force involving the Federal Minister for Transport and Regional Services, state regional development ministers, senior officers and the Australian Local Government Association was established. The Task Force should be broadened to include representation from all state Local Government associations. It should also look at ways of building on the existing body of work including Area Consultative Committees, Regional Development Organisations, Regional Development Boards and regional organisations of councils. The Task Force should be requested to conclude a Regional Economic Development Accord that binds the three spheres of government to ongoing cooperation and coordination mechanisms in relation to the design and implementation of regional economic development programs and initiatives. The Accord should confirm an important and active role for the three spheres of government to support communities and regions undergoing structural change, develop regional competencies to adapt to social and economic change, and to position themselves to maximise the benefits of globalisation and digital technologies. The Accord should outline eligibility criteria for new regional development programs. For example, regions and groups of councils may be eligible to access programs if they have:
A long-term problem with structural unemployment, rapid labour force and population growth and/or infrastructure backlogs.
Developed a comprehensive vision, prepared strategies and
outlined a program of action and identified projects that show how investment, jobs, incomes and/or quality of life outcomes will be enhanced by the implementation of the regional development programs and projects.
Demonstrated the “inclusiveness” of the vision and
development strategies. Regional stakeholders cover all major social and economic groupings: business and farmers, elected representatives, and community representatives such as educationalists, indigenous groups, unions and women’s organisations.

58
Develop ongoing mechanisms and procedures to improve the
efficiency of regional program design and delivery. This would include the role of national and state governments in designing and funding regional development programs with inputs from local government, and the role of regional agencies, regional organisations of councils and Local Government in delivering projects.
Recognise Local Government as a central partner in regional
development and identify its roles and responsibilities, as well as outlining evaluation and accountability procedures for government funds allocated to regional development.
Develop a national regional benchmarking system to assess
outcomes from regional development programs and projects.
Commit Federal and State Governments to ensuring that the funds are available to support regional development and expanding role for local government in local and regional economic development.

59
3 Strengthen the role of councils
in regional economic development A number of councils and regional organisations of councils are pro-active in local and regional economic development. They have full time economic development managers, fund development agencies and/or participate in strategic economic development initiatives. Others leave local and regional economic development processes to market forces alone. All spheres of government need to recognise that the skills required to accelerate economic development are very different from those required to control and account for economic activities. This is particularly the case where governments need to accelerate employment opportunities within a framework that emphasises ESD principles. Given the nature and impacts of globalisation, the importance of digitalisation, and continuous changes in industry competitiveness and skills, this role needs to be significantly enhanced. Further, in the new framework of a Regional Economic Development Accord proposed above, councils must meet essential prerequisites if they are to participate in collaborative and cooperative programs involving the three spheres of government. The most important prerequisite is councils’ commitment and acknowledgement of responsibility for local economic development within a framework that incorporates ESD principles. This may include:
Economic development objectives and action plans be documented in strategic plans, business plans and vision statement and a benchmark system put in place to measure outcomes in terms of both established targets (eg jobs, investment, development approvals for employment related activities) and other local government areas.
Balancing council regulatory responsibilities with a strategic and
facilitating approach to economic development. This includes projecting a vision of the area’s future, assessing ecological impacts, identifying economic development opportunities, facilitating local industry and skill development networks, and establishing local bodies to advise and lobby for economic development.
Running internal training programs amongst staff and
councillors to develop regional competencies in local development planning and management. Councils and their library departments, in collaboration with educationalists (eg ACE, universities) and other stakeholders, could explore ways to nurture skills in local economic development more broadly throughout the community through designing and running courses or training sessions.

60
Council capital works programs and planning and information systems should incorporate economic development objectives and be monitored and evaluated.
Streamlining development approval processes to ensure that
they are in line with best practice.

61
4 Building economic data systems
In an information society, the quality and relevance of economic data availability to local firms, education and training providers and the community has a direct bearing on investment and job outcomes. Local firms and farms require good data about local suppliers, government departments and complementary organisations. Prospective investors are generally responsive to packages of information about industrial and commercial land and building costs, infrastructure costs and services, availability of skills in occupations relevant to their businesses, and other firms. Retailers are interested in local consumption patterns and trends and educational providers seek information about gaps in the labour market. Although local organisations and prospective investors have other sources of information, councils can enhance local development prospects by collating and making available to firms and other comprehensive and relevant local economic data packages. Many councils already do this well, others need to recognise the importance of this function.
5 Using the rating system
to support local economic development Rate capping severely constrains the capacity of local government to provide seed funds to support local economic development initiatives. The Associations should prepare a submission to the NSW Government requesting an easing of rate capping to enable councils and the local community to more actively support local economic development. Increasing rates beyond the cap should be for designated development projects that can demonstrate long-term social and economic returns to the community. The preferred method would be to provide councils for a credit for the previous year’s expenditure on local economic development up to a limit. Approved projects should also demonstrate how they would lead to a strengthening of local rates due to improvements in local economic activity.

62
6 NSW Regional Development Trust Access to capital has been identified as a major constraint to regional development. Strategies are required to encourage CBD based super funds, banks and other financial institutions to recognise and pursue regional investment opportunities. NSW local governments are actively involved in addressing capital and finance between metropolitan and non-metropolitan regions. It is proposed that that these initiatives be used as levers to attract more venture and development capital funds into NSW regions. The Local Government Superannuation Fund has announced its intention to invest close to 4% or $130 million of its $3 billion portfolio into regional development projects in NSW. This is the first major commitment of a super fund to invest back into regions where much of its sources of funds come from. This Regional Development Trust is a joint initiative between Deutsche Asset Management and the Local Government Superannuation Scheme. The investment is to represent the Private Equity allocation made by the Local Government Superannuation Scheme, and as such seeks suitable viable commercial returns from investments in projects in metropolitan, outer metropolitan, and regional New South Wales. The emphasis is to ensure that investment capital is made available to as wide a range of projects as possible, while at the same time ensuring that the risk-adjusted returns being sought are achievable. The unique structure of the Regional Development Trust allows a range of return targets to be established. The Trust will comprise three sub- Trusts, with each having a different investment return target, based upon the nature of the investment project, and the level of risk involved. Deutsche Asset Management will be the trust manager to the Regional Development Trust, with the Local Government Superannuation Scheme being the foundation investor. The allocation of a portion of the Scheme to the private equity asset class was decided by the Board of the Local Government Superannuation Scheme well over twelve months ago. It was not until Deutsche and LGSS jointly developed this product that a suitable solution had been found to the making of that allocation. While the allocation has been established at between 3%-5% of the asset pool which represents the Defined Benefit assets of the Local Government Superannuation Scheme, this should translate into an effective allocation of around $130 million to this new and exciting area.

63
The Local Government Superannuation Scheme has experienced strong levels of success over the three years of its re-establishment, and this new vehicle for , not only identifying, but financing, a viable set of diversified projects represents another step forward for the investment portfolio of the Scheme. The Associations have also been supportive of the pilot projects initiated by the NSW Department of State and Regional Development and the Australian Stock Exchange to establish Regional Enterprise Markets. The purpose is to connect investors, both local and otherwise, with regional investment opportunities.

64
7 Revitalisation of rural NSW The NSW Government should set a target to increase the population of rural NSW – in this context areas to the west of the Great Dividing Range - by 75,000 people by 2020. Official forecasts indicate that rural NSW will continue to lose population over the next 20 years. Current population is around 845,000. A modest population target of 920,000 appears realistic providing the three spheres of government can work together to actively promote economic development. An increase of 75,000 for all rural NSW over 20 years is 25% above the population increase for Sydney last year. The long-term decline of small towns and consolidation around regional centres is set to continue. To achieve the population target outlined above, the primary focus should be on encouraging population growth of the main regional centres that are growing and have demonstrated economic potential. All these centres have populations in excess of 20,000 people. For the 50,000 target to be achieved by 2020 small centres would have to stabilise their current population and the main centres would need to grow at the state average of 1% pa over the next 20 years. If this transpires then the 75,000 population target is achievable. Some of the existing state and federal programs – such as the Federal Government Regional Solutions Program and the NSW Government Country Centres Growth Strategy – may assist small centres to stabilise population. To support population growth of 1% pa in the major regional centres, however, new strategies are required by public and private sectors. Programs to place newly arrived migrants in rural centres are naive. While rural NSW does have significant potential to build multi cultural communities, for example, Griffith has successfully created a multi cultural community in rural NSW, with a population 24,000, the driver for population growth is economic development. Specifically, increasing investment, strengthening regional foundations for growth and enhancing livability of these centres. Incentives to increase private investment are outlined below. The main challenge is to strengthen the connectedness of these centres to the global economy, encourage innovation, and increase flows of knowledge and investment. This requires expanded public investment in these centres in educational infrastructure and services, upgraded airport linkages to ensure that these centres are linked into global “just in time” distribution systems, and R&D and technology transfer. The Associations and the NSW Government should approach the Federal Government with a proposal to establish a Rural Centres Development Program. This program would include the population target for the NSW centres as well as centres of other states, specify joint Federal-state development and infrastructure projects in these centres, and incentive measures for employment creating business investment.

65
8 Investment enhancement Economic revitalisation of rural NSW cannot be proclaimed. The Rural Centres Development Program, a collaborative public investment program, will not be sufficient. Bold new incentives are required to increase private sector investment in these centres. The Associations should put forward a proposal to the Regional Development Task Force that a Rural Centres Investment Scheme be established to provide tax credits for job creating private investment. Eligible firms would be those both based in the rural centres and firms establishing operations in these centres who adhere to existing legislnd environmental standards. One model for this scheme may be the US Enterprise Zone program. For example, nearly all of Southwest Colorado, because it is considered an economically distressed region, has been designated as an Enterprise Zone, enabling the District to offer very attractive incentives for business retention and expansion. One incentive is investment tax credits, where investment in equipment may be claimed as a credit against state income taxes equal to 3% of the investment, subject to limitations on the amount. It also provides job tax credits - a tax credit of US$500 for every new employee appointed in new business facilities including additions to existing plant leading to thee employment of 10 new employees. This includes a Double Tax Credit for agricultural processing. Other incentives include R&D tax credit, credit to rehabilitate vacant buildings, credit for contributions to zones such as job training and placement for the homeless, promoting child care; exemption from state sales taxes for manufacturing and mining equipment, and local government tax incentives.

66
9 Regional infrastructure development program The tax reform agenda based on the GST is set to expand the revenue base of the Federal Government. With the new tax regime the Federal Government has committed itself to increase the allocation of funds to the states. The NSW Premier has announced that $500 million is available for infrastructure projects after the Olympics. Further, Local Government leadership in relation to super funds investment will significantly increase resources available for regional infrastructure. Hence, the capital constraint on public infrastructure investment may be partially lifted creating an opening for a “whole of state development” approach to state development. The infrastructure lag in many regions is acute. Further, there are significant variations in regional infrastructure priorities over the next 20 years. For example, the Far West is outside the universal service obligations delivered by Telstra, severely limiting the capacity of producers and households to benefit from digitalisation. Developing Sydney and lifestyle regions are struggling to keep up with population growth. Major investments are required in social, physical and intellectual infrastructure to enable these regions to develop as innovative regional economies. Northern Illawarra and Lower Hunter/Central Coast require major investments in high technology rail infrastructure to link them further to global Sydney and enable them to absorb more population growth from Sydney. Established Sydney, particularly its Global centre, faces major infrastructure challenges if it is to sustain its competitiveness as a global Sydney. This includes solving its longstanding crisis in relation to poor airport infrastructure, expanding sea port capacity, and major investments in public transport, and cultural and entertainment facilities. A more strategic approach is required to regional infrastructure development. Two features of such a program should be emphasised. Firstly, definitions more emphasis is given to infrastructure to position regions in the global economy - namely learning, scientific and technological infrastructure. Secondly, investment in hard infrastructure alone will be insufficient. Priority needs to be given to the development of new learning systems, development of local software applications and regional organisational innovations in combination with infrastructure investment. The Associations, with active participation of councils, should seek to collaborate with the NSW Government in the design and implementation of a Regional Infrastructure Development Program. The program should be built around the principles of the “Whole of State Development” approach: getting regions better connected to the global economy, investments in knowledge and technological infrastructure, and upgrading physical and social infrastructure.

67
10 New directions for metropolitan planning Given the job, skill, infrastructure and service lags between Developing and Established Sydney, the former should become the focus of metropolitan planning. Through Action for Transport the NSW Government is undertaking a number of important initiatives to improve transport infrastructure in Developing Sydney. Much of this investment is dealing with the backlog in infrastructure. This report indicates, however, that the population growth of Developing Sydney will increase by between 700,000-900,000, the latter approaching the size of Adelaide. Is such an increase desirable and is it sustainable? Over the past 20 years, urban consolidation in Established (or inner) Sydney has been the dominant planning policy objective, with success evaluated in terms of the number of multi unit dwellings constructed in Established Sydney. In the next 20 years, new planning targets associated in economic outcomes should be established and monitored in Developing Sydney including:
Increase in the proportion of knowledge based jobs located in the region;
Increase in value added investment as a proportion of total investment
Number of export oriented SMEs Proportion of people travelling to work by public transport
Developing Sydney councils, WSROC and the Central Coast Development Corporation should make representations to the NSW Government to seek a commitment to make Developing Sydney central to economic, land-use and transport planning over the next decade. This would involve bold initiatives to increase the number and proportion of knowledge based jobs located in Developing Sydney. The new planning orientation should be matched by a commensurate increase in NSW government infrastructure investments towards Developing Sydney. The main NSW government agencies to work on this agenda are Department of Urban Affairs and Planning, NSW Infrastructure Coordination Unit, Department of Transport and the Department of State and Regional Development.

68
11 Sydney as a multi-centred city
Value added investment, high income and high growth occupations are concentrated in Established Sydney, specifically the high technology crescent running through North Ryde, Lane Cove, North Sydney to the CBD and increasingly, southwards towards Kingsford Smith Airport. Although employment conditions improved in Developing Sydney in the late 1990s, there is a high reliance on lower skilled, part-time and less secure jobs. A “Whole of State Development” Strategy should stress the need to plan and develop Sydney as a multi-centred city. This would involve a bold vision and investment strategy to upgrade the role of regional centres in Developing Sydney – with commitments to invest in education, culture, advanced business services and administration. Councils, along with WSROC, the Greater Western Sydney Economic Development Board and the Central Coast Development Corporation should propose to the NSW Government that consideration be given to undertaking a major report comparing economic and environmental impacts of alternate development paths for Sydney over the next 25 years. It is proposed that the economic, social and environmental impacts of two development paths be evaluated. The first development path should be based on the current metropolitan planning and transport strategies, which basically reinforces the centrifugal forces concentrating economic opportunities around the global centre whilst improving transport linkages from Developing Sydney. The second development strategy should be based on implementation of strategies to significantly upgrade regional centres of Developing Sydney and access from the surrounding residential areas – Parramatta, Sutherland, Gosford, Wyong, Liverpool, Blacktown, Campbelltown and Penrith. A central objective should be to increase the number and proportion of knowledge based jobs in Developing Sydney working in these centres and associated office parks.

69
12 Pro-active purchasing policies In many areas, councils are the largest business and employer. By joining together, they can make competitive market forces work better. Councils have significant purchasing power and can use this to enter into bulk purchasing arrangements as a lever to support local economic development objectives. This is particularly the case where councils can combine their activities with other councils on a voluntary basis and possibly enter into purchasing partnerships with regional stakeholders. Some councils have already established purchasing co-operatives for internal purchasing. This practice can be extended on behalf of residents, as an extension of competitive tendering, to other services including banking, insurance, energy, telecommunications, vehicles and petroleum products. With the assistance of high quality local internet portals and databases, local firms can be informed of emerging contracts and encouraged to tender. The economic benefits to councils are lower costs. The financial resources generated by these activities can be quite significant. These cost savings can be passed to residents with a proportion set aside for strategic economic development projects. The Associations should establish a Purchasing Policy Working Group to support councils seeking to strengthen their business units dealing with purchasing, and to identify ways to share the benefits of these new businesses with residents and to increase funds available for longer term economic development projects.

70
13 Learning Communities Program The Associations – in collaboration with members - should initiate a Learning Communities Program – with the aim of supporting NSW councils to become national and international innovators in fostering multi generational learning networks and innovation at the local level. The Program should mobilise resources, run pilot programs, develop kits, raise awareness, benchmark outcomes, and enter into community based “learning partnerships”. Learning partnerships involve learning institutions such as schools, vocational education and higher education providers including international consortia and specialists in the packaging and delivery of on- line learning services.
Local Government - as a partner of regional education providers, firms and households - must identify itself as a champion of the local knowledge economy and be prepared to undertake actions to promote the shift to the knowledge economy. In the knowledge-based economy, however, formal education is one element of a lifelong process of learning. The capacity to acquire new knowledge, skills and to adapt to continual change are hallmarks of the new economy, indeed what some have termed the knowledge economy. Local government can and should play a creative role in fostering active community based learning programmes. Community based learning will be an important bridge to lifelong learning for people who are alienated from learning institutions as well as people lacking foundation learning skills. Active community based learning starts from the cultural values, aspirations and shared learning goals of community members. Ironically, in an electronic age, council community based assets – libraries, early childhood development centres, community centres and museums – can be reinvented as central community learning sites. They foster inquisitiveness, new skills, learning-by-doing and experiential learning, important building blocks for the acquisition of knowledge, team work and innovation.
Libraries and early childhood development centres will be important facilities in the learning communities of the future. Many local libraries are equipped with learning technology in advance of most local schools. The opportunity exists to formalise learning partnerships and technology sharing agreements with local schools. The role of early childhood centres in forming social competencies, group interaction and foundation learning skills will be increasingly valued. They are at the beginning of the lifelong learning chain. As well as their primary functions, libraries, museums and early childhood centres can play a crucial role as fundamental nodes within the community for the delivery of family and household support services and learning advice.

71
14 Local Information Society Initiative Information and communications technologies underpin the shift towards the knowledge-based economy. They are the infrastructure to enable local and global electronic networking. Accessible, affordable and quality ICTs are a necessary but not sufficient infrastructure to link regions to the global economy, information and learning systems. They enable communities to get connected and their impacts of regional NSW is omnipresent – in schools, hospitals, households, shops and business enterprises. Increasingly, households will engage in tele-shopping and tele-banking. Local information systems, networks and databases enable rapid spreading of information about regional capacities and opportunities. They enable fast and efficient knowledge and resource sharing between government agencies, communities, households, learning facilities and enterprises. A great divide is opening up in NSW in relation to ITT infrastructure and use. The divide is partly due to the rapidly widening gap between the quality of Internet infrastructure available to city users vis-a-vis remote/rural users. In turn this divide revolves around the ability of the installed telecommunications infrastructure to support adequate band width. It is also due to the different penetration rates for socio-economic groups and firms/farms. While the Commonwealth Networking the Nation (NTN) Program is providing some assistance to overcome the divide, the funds are inadequate. The Associations should continue to lobby the Commonwealth to increase the level of funding available to overcome ITT infrastructure deficiencies. The Associations should also develop an IT and Online Services Strategy for NSW Local Government. One objective of the strategy would be to provide a strategic framework for the optimal application of the limited resources available from the NTN Local Government Fund ($6 million over five years for NSW). However, the strategy should extend beyond the allocation of NTN funds. It should consider Local Governments own contributions and other potential funding sources. The strategic framework could form the basis of a “Local Information Society Initiative”. Possible outcomes could include projects to: In response to this challenge, the Associations should consider establishing a Local Information Society Initiative designed to assist councils and communities upgrade local ICT capacities. The purposes of the initiative would include: (i) Assist NSW councils prepare submissions for funding under
the federal Government’s Local Government Fund, $45 million available for council’s in rural communities to provide on-line access to their own information and services, as well as public points of access to advanced telecommunications services.

72
Funded projects might include:
Local Government On-line, including a one-stop shop for planning and business approvals, development of local community /business capability resources;
Local Government providing new
telecommunications services to their communities;
Local Government utilising current
infrastructure and facilities to extend the range of telecommunications services within their communities through such things as public access.
(ii) Encourage councils to enter into partnerships with
telecommunications providers to accelerate the dissemination of ICT skills and applications in local communities and to attract ICT.
(iii) To foster and participate in local initiatives aimed to encourage
the development of ICT awareness and applications.

73
15 The Way Forward The most important aspect of this report is how we can drive it forward. To effectively implement the WSD approach, the following steps are proposed.
The push for the adoption of a WSD philosophy does not end with this report. This is a starting point. It needs to be reviewed and enhanced and must evolve over time.
While there are many actions Local Government can take to
promote the WSD concept independently, to have any real impact the concept must be embraced by the NSW Government and other stakeholders.
The Associations will campaign vigorously to have the
concept/philosophy adopted by the NSW Government and other key stakeholders.
The Associations should seek the establishment of an
influential WSD Committee involving Local Government, State Government, business, community and indigenous representatives and other key stakeholder representatives. State Government representation must be of a senior level.
The concept also needs to infuse the Associations policies and strategies in all areas. All policies should be reviewed in this context.

74
Appendix 1
Regional breakdown of NSW
Developing Sydney Auburn, Baulkham Hills, Blacktown, Blue Mountains, Camden, Campbelltown, Fairfield, Gosford, Hawkesbury, Holroyd, Hornsby, Liverpool, Parramatta, Penrith, Sutherland Shire, Wollondilly, Wyong. Established Sydney Ashfield, Bankstown, Botany, Burwood, Canterbury, Concord, Drummoyne, Hunters Hill, Hurstville, Kogarah, Ku-ring-gai, Lane Cove, Leichhardt, Manly, Marrickville, Mosman, North Sydney, Pittwater, Randwick, Rockdale, Ryde, South Sydney, Strathfield, Sydney, Warringah, Waverley, Willoughby, Woollahra. Post industrial regions Cessnock, Kiama, Lake Macquarie, Maitland, Newcastle, Port Stephens, Shellharbour, Wollongong.
Lifestyle regions Ballina, Bega Valley, Bellingen, Bombala, Byron, Casino, Coffs Harbour, Copmanhurst, Eurobodalla, Gloucester, Grafton, Great Lakes, Greater Taree, Hastings, Kempsey, Kyogle, Lismore, Maclean, Nambucca, Nymboida, Richmond River, Shoalhaven, Tweed, Ulmarra. Rural NSW Albury, Armidale, Balranald, Barraba, Bathurst, Berrigan, Bingara, Bland, Blayney, Bogan, Boorowa, Bourke, Brewarrina, Broken Hill, Cabonne, Carrathool, Central Darling, Cobar, Conargo, Coolah, Coolamon, Cooma-Monaro, Coonabarabran, Coonamble, Cootamundra, Corowa, Cowra, Crookwell, Culcairn, Deniliquin, Dubbo, Dumaresq, Dungog, Evans, Forbes, Gilgandra, Glen Innes, Goulburn, Greater Lithgow, Griffith, Gundagai, Gunnedah, Gunning, Guyra, Harden, Hay, Holbrook, Hume, Inverell, Jerilderie, Junee, Lachlan, Leeton, Lockhart, Manilla, Merriwa, Moree Plains, Mudgee, Mulwaree, Murray, Murrumbidgee, Murrurundi, Muswellbrook, Narrabri, Narrandera, Narromine, Nundle, Oberon, Orange, Parkes, Parry, Queanbeyan, Quirindi, Rylstone, Scone, Severn, Singleton, Snowy River, Tallaganda, Tamworth, Temora, Tenterfield, Tumbarumba, Tumut, Unincorporated NSW, Uralla, Urana, Wagga Wagga, Wakool, Walcha, Walgett, Warren, Weddin, Wellington, Wentworth, Windouran, Wingecarribee, Yallaroi, Yarrowlumla, Yass, Young.

75
Appendix 2 This attachment presents 15 tables showing relative economic performances of New South Wales Regions. The data is derived from YourPlace – software developed by National Economics that shows the relative performances and prospects of 632 LGAs across Australia. YourPlace uses 28 specially designed indicators to assess and benchmark the performance of Australia’s local economies. The indicators show relative performance in three key dimensions of the local economy: households, industry and local community foundations. YourPlace groups LGAs within families or “clusters” of LGAs with similar performance characteristics in each of the three dimensions as well as for industry type and overall performance. This allows users to compare and benchmark the performance of like places. YourPlace provides performance ratings and total peformance rankings for 1991, 1996 and 1998. For every indicator, the best performimg LGA (s) score 100. YourPlace performance index ratings show relative performance of a locality in relation to all other Australian localities eg an LGA scoring 80 for a given indicator performs better than most other LGAs in Australia. A selection of 1998 YourPlace household and local foundations indicators is presented for non metropolitan Statistical Divisions and four regions of Sydney: Global Sydney, Sydney Production Corridor, Service Economy Zone and Sydney Periphery. This provides a more detailed breakdown of Sydney regions than provided in the body of the report. Regional ratings have been calculated by population weighting and summing LGA ratings within a region. Therefore the highest scoring regions will score less than 100. The indicators are a mix of backward and forward looking indicators which capture both future prospects and recent performances. Many forward looking indicators incorporate National Economics medium term projections for local economies. The LGAs in the four regions of Sydney used in the accompanying datasets are:
Global Sydney: Botany, Lane Cove, Leichhardt, Mosman, North Sydney, Ryde, South Sydney, Sydney,
and Willoughby
Local service economy zone: Ashfield, Baulkham Hills, Burwood, Concord, Drummoyne, Hornsby, Hunter's Hill, Hurstville, Kogarah, Ku-ring-gai, Manly, Marrickville, Pittwater, Randwick, Rockdale, Strathfield, Sutherland Shire, Warringah, Waverley, and Woollahra
Periphery: Blue Mountains, Camden, Campbelltown, Gosford, Hawkesbury, Penrith, Wollondilly and
Wyong.
Production Corridor: Auburn, Bankstown, Blacktown, Canterbury, Fairfield, Holroyd, Liverpool, and Parramatta

76
Household Dimension
Household growth www.your-place.net Income and employment growth for households. LGA with a rating of 100 has the highest estimated income and employment growth. Derivation: The 1991 version of the indicator is based upon reported changes in Census income and employment. The 1996 version estimates actual changes using tax statistics and DEETYA employment estimates. The 1998 version is based on National Economics’ medium term projections. This indicator is forward looking i.e it reflects likely future performance
Rank
Region
Population Weighted YourPlace
Rating
Performance Descriptor
1 Global Sydney 70 Strongest Performers
2 Sydney local service economy zone 63 Strongest Performers
3 Mid-North Coast 40
4 Sydney Periphery 37
5 Richmond-Tweed 34
6 Northern (NSW) 31
7 Sydney Production Corridor 31
8 Murrumbidgee 28
9 North Western 25
10 South Eastern (NSW) 21
11 Central West (NSW) 19 Weakest Performers
12 Hunter 19 Weakest Performers
13 Murray 17 Weakest Performers
14 Illawarra 12 Weakest Performers
15 Far West 5 Weakest Performers

77
Prosperity potential www.your-place.net
Household prospects for change based on national growth trends related to socio-economic factors LGA with a rating of 100 has the socio-economic mix consistent with the fastest change in prosperity. DERIVATION: Same as Prosperity potential. CONTEXT: Many regions within Australia are characterised by slow transformation in household prosperity. If this slow transformation is coupled with poor prosperity potential this slowly decaying household prosperity is cause for concern. Hence, this indicator describes the speed of the change of the prosperity indicator. The indicator, therefore, captures the rate of change differentials between regions
Rank
Region
Population Weighted YourPlace
Rating
Performance Descriptor
1 Global Sydney 92 Strongest Performers
2 Sydney local service economy zone 84 Strongest Performers
3 Richmond-Tweed 81 Strongest Performers
4 Mid-North Coast 75
5 North Western 66
6 Murray 63
7 Northern (NSW) 62
8 South Eastern (NSW) 62
9 Murrumbidgee 58
10 Central West (NSW) 57
11 Illawarra 51
12 Sydney Periphery 50
13 Hunter 49
14 Sydney Production Corridor 33 Weakest Performers
15 Far West 28 Weakest Performers

78
Socio-economic dynamism www.your-place.net Household prospects for change based on national growth trends related to socio-economic factors LGA with a rating of 100 has the socio-economic mix consistent with the fastest change in prosperity. DERIVATION: Same as Prosperity potential. CONTEXT: Many regions within Australia are characterised by slow transformation in household prosperity. If this slow transformation is coupled with poor prosperity potential this slowly decaying household prosperity is cause for concern. Hence, this indicator describes the speed of the change of the prosperity indicator. The indicator, therefore, captures the rate of change differentials between regions
Rank
Region
Population Weighted YourPlace
Rating
Performance Descriptor
1 Global Sydney 79 Strongest Performers
2 Sydney local service economy zone 59 Strongest Performers
3 Murray 40
4 Richmond-Tweed 37
5 North Western 36
6 Northern (NSW) 35
7 South Eastern (NSW) 31
8 Mid-North Coast 30
9 Central West (NSW) 28
10 Illawarra 25
11 Murrumbidgee 23
12 Sydney Production Corridor 22
13 Sydney Periphery 15 Weakest Performers
14 Hunter 14 Weakest Performers
15 Far West 11 Weakest Performers

79
Debt affordability www.your-place.net Household capacity to manage debt. LGA with a rating of 100 has the highest resilience compared to its asset base and, therefore, the lowest exposure to debt risk. DERIVATION: This indicator compares the macro resilience position of a region with its wealth position. CONTEXT: Current economic growth in Australia is largely driven by low income households or households with negative savings rates borrowing to undertake consumption and other expenditures. Eventually this must come to an end and those regions with the highest ratio of debt to their asset base will bear the brunt of adjustment
Rank
Region
Population Weighted YourPlace
Rating
Performance Descriptor
1 Far West 99 Strongest performers
2 Mid-North Coast 69 Strongest performers
3 Northern (NSW) 57
4 North Western 56
5 Richmond-Tweed 55
6 Murrumbidgee 55
7 Central West (NSW) 49
8 Hunter 46
9 Global Sydney 42
10 Sydney local service economy zone 42
11 South Eastern (NSW) 40
12 Murray 36
13 Illawarra 35
14 Sydney Production Corridor 17 Weakest Performers
15 Sydney Periphery 9 Weakest Performers

80
Resilience to interest rises and income falls www.your-place.net Household capacity to weather increases in interest rates and reductions in income. LGA with a rating of 100 has the best capacity for maintaining investment and spending in the event of interest rate rises and reduced income. DERIVATION: The core components of the index are: (i) estimated average debt service ratio; (ii) estimated savings ratio; and (iii) financial assets coverage ratio. The higher the average household savings and financial assets to income ratio and the lower the debt service burden, the less vulnerable is the household sector to macroeconomic shocks such as a large interest rate increase. The lower the rating, the more likely it is that the households in the LGA will need to cut back consumption and investment to weather the economic shock. Index derived from National Economics Household Debt Model based on national accounts and ABS household expenditure survey.
Rank
Region
Population Weighted YourPlace
Rating
Performance Descriptor
1 Sydney local service economy zone 96 Strongest Performers
2 Global Sydney 93 Strongest Performers
3 Far West 66
4 Hunter 56
5 Illawarra 49
6 Mid-North Coast 48
7 Richmond-Tweed 46
8 South Eastern (NSW) 45
9 Sydney Production Corridor 43
10 Central West (NSW) 39
11 Murrumbidgee 39
12 Northern (NSW) 38
13 North Western 34 Weakest performers
14 Murray 33 Weakest performers
15 Sydney Periphery 27 Weakest performers

81
Wealth www.your-place.net
Household wealth held in financial assets, house values and unincorporated business assets. LGA with a rating of 100 has the highest estimated asset base for households DERIVATION: The total household wealth is calculated using National Economics household debt model. In this model asset values are based on typical rates of income yield or return. House prices are calculated using sources such as Census rental prices, industry data and published house prices. Superannuation is not included. The total value of assets is tracked through time in order to reflect changes over all asset classes. CONTEXT: The wealth indicator is extremely important because, although the income differentials between regions are well known, in many ways the wealth differentials are more important. This is because wealthier regions have a much greater level of household resources to withstand income shocks and to exploit further wealth creating opportunities.
Rank
Region
Population Weighted YourPlace
Rating
Performance Descriptor
1 Sydney local service economy zone 98 Strongest Performers
2 Global Sydney 97 Strongest Performers
3 Sydney Production Corridor 81 Strongest Performers
4 Sydney Periphery 67
5 Hunter 58
6 South Eastern (NSW) 56
7 Illawarra 56
8 Murray 43
9 Central West (NSW) 43
10 Richmond-Tweed 41
11 Murrumbidgee 35 Weakest Performers
12 Mid-North Coast 34 Weakest Performers
13 Northern (NSW) 33 Weakest Performers
14 North Western 32 Weakest Performers
15 Far West 13 Weakest Performers

82
Population growth www.your-place.net
Population growth expected to 2002 LGA with a rating of 100 has the highest projected population growth Derivation: The 1991 and 1996 versions of this indicator are the actual growth rates for the regions as detailed by the ABS. The 1998 version of this indicator is based on National Economics PopInfo population projection modelling. It captures the anticipated growth in population to 2002.
Rank
Region
Population Weighted YourPlace
Rating
Performance Descriptor
1 Richmond-Tweed 74 Strongest Performers
2 Mid-North Coast 73 Strongest Performers
3 Sydney Periphery 67 Strongest Performers
4 Sydney Production Corridor 56
5 South Eastern (NSW) 52
6 North Western 48
7 Global Sydney 46
8 Hunter 45
9 Sydney local service economy zone 43
10 Illawarra 43
11 Murray 35 Weakest Performers
12 Murrumbidgee 35 Weakest Performers
13 Central West (NSW) 34 Weakest Performers
14 Northern (NSW) 33 Weakest Performers
15 Far West 25 Weakest Performers

83
Income earning age profile www.your-place.net Rate of ageing as a pointer to shrinkage of a region’s total income and spending capacity.
LGA with a rating of 100 has highest total population growth compared to the growth of 65 and over.
Derivation: The 1991 and 1996 versions of this indicator uses the actual comparative growth rates for the regions as detailed by the ABS. The 1998 version of this indicator is based on National Economiocs population projection modelling for both aged and general population growth up to 2002.
Rank
Region
Population Weighted YourPlace
Rating
Performance Descriptor
1 Global Sydney 84 Strongest Performers
2 Richmond-Tweed 78 Strongest Performers
3 Far West 74 Strongest Performers
4 Sydney local service economy zone 69
5 Mid-North Coast 67
6 Sydney Production Corridor 59
7 Hunter 59
8 North Western 50
9 Illawarra 50
10 Central West (NSW) 47
11 Sydney Periphery 46
12 Murray 43
13 Murrumbidgee 43
14 South Eastern (NSW) 42
15 Northern (NSW) 38 Weakest Performers

84
Job readiness www.your-place.net Proportion of the adult population ready for, or already undertaking, employment.
LGA with a rating 100 has the fewest long term unemployed, migrant unemployed and recipients of other social security benefits associated with structural unemployment such as a disability payment.
Derivation: There is a direct relationship between the proportion of the population comprising unemployed migrants; long term unemployed; and recipients of sole parents, sickness and disability benefits and the employability of people not in work. These residents are facing structural employment barriers.Data is derived from Department of Social Security statistics and is a weighted measure of the number of recipients as a proportion of the workforce.
CONTEXT: The official unemployment statistics show a steady improvement since the early 1990 decade. The reality is that there are differential unemployment rates between regions because of structural barriers to employing some of those in the unemployed pool. More importantly, however, has been the practice of governments to reduce the headline unemployment rate by shifting social welfare recipients to other categories, such as disability support pensions. The purpose of this indicator is to reveal the true structural unemployment position of each region.
Rank
Region
Population Weighted YourPlace
Rating
Performance Descriptor
1 Sydney local service economy zone 84 Strongest Performers
2 Global Sydney 69 Strongest Performers
3 Murrumbidgee 51
4 Murray 50
5 South Eastern (NSW) 45
6 Sydney Periphery 40
7 Central West (NSW) 38
8 Sydney Production Corridor 38
9 Northern (NSW) 35
10 Hunter 29
11 Illawarra 26
12 North Western 21
13 Mid-North Coast 10 Weakest Performers
14 Richmond-Tweed 10 Weakest Performers
15 Far West 1 Weakest Performers

85
Labour utilisation www.your-place.net Hours worked by residential labour force compared to available working hours. LGA with a rating of 100 is the most successful in employing the available pool of labour measured in hours of employment. DERIVATION: This index measures total hours worked, divides them by the labour force and multiplies by 37.5 (average full time weekly hours) to provide the labour utilisation rate. A low rate will reflect lower levels of total income and spending within the region which will constrain local economic growth prospects. This index is derived from National Economics modelling, ABS labour force survey statistics, Census data and DEETYA information. CONTEXT: Participation rate variations and the growing number of workers in part time and casual work has undermined the usefulness of the unemployment rate as a measure of a community’s success in winning work. This is because a worker is counted as employed even if he/she is able to obtain 10 hours work per week. As much job growth is now in casual and part time work, and conversely many full time positions are being down scaled to part time, this measure is crucial in capturing these changes.
Rank
Region
Population Weighted YourPlace
Rating
Performance Descriptor
1 Global Sydney 85 Strongest Performers
2 Sydney local service economy zone 71 Strongest Performers
3 Hunter 54
4 Central West (NSW) 49
5 Sydney Production Corridor 47
6 South Eastern (NSW) 45
7 Murray 45
8 Sydney Periphery 43
9 Murrumbidgee 42
10 North Western 42
11 Northern (NSW) 30
12 Richmond-Tweed 20 Weakest Performers
13 Illawarra 14 Weakest Performers
14 Mid-North Coast 12 Weakest Performers
15 Far West 4 Weakest Performers

86
Progression to full employment www.your-place.net
The speed of adjustment of a regions movement towards maximum utilisation of its labour resources. The LGA with a rating of 100 will have made the greatest progress in bridging the gap between its previous levels of utilisation and maximum capacity. DERIVATION: This index involves a time series calculated on the data used for previous index, Labour Utilisation. This index compares rate at which an LGAs labour utilisation rate will converge with the current best performing LGAs, based on past labour market performance . This index adjusts for changes in the participation rate and internal factors causing different levels of labour utilisation across LGAs. Most importantly, this index shows how the region is coping with the casualisation of the workforce
Rank
Region
Population Weighted YourPlace
Rating
Performance Descriptor
1 Hunter 89 Strongest Performers
2 Global Sydney 84 Strongest Performers
3 Richmond-Tweed 71 Strongest Performers
4 Central West (NSW) 60
5 Mid-North Coast 60
6 Sydney local service economy zone 58
7 Sydney Production Corridor 56
8 Sydney Periphery 53
9 North Western 52
10 South Eastern (NSW) 50
11 Northern (NSW) 39
12 Murray 34
13 Illawarra 28 Weakest Performers
14 Murrumbidgee 28 Weakest Performers
15 Far West 6 Weakest Performers

87
Local Foundations
High skill human capital www.your-place.net Potential of a regions human capital to stimulate local prosperity and jobs growth LGA with a rating of 100 has the highest proportion of high skilled workers occupying managerial, professional or associate professional occupations. DERIVATION: This index captures the relative skills of the residential workforce and corresponding local prosperity. In the long term, the higher the ratio the more prosperous an LGA is likely to be, especially as the proportion of knowledge workers and teleworking increases.
Rank
Region
Population Weighted YourPlace
Rating
Performance Descriptor
1 Global Sydney 89 Strongest Performers
2 Sydney local service economy zone 81 Strongest Performers
3 Northern (NSW) 61
4 South Eastern (NSW) 59
5 Murray 56
6 Central West (NSW) 52
7 North Western 52
8 Richmond-Tweed 52
9 Mid-North Coast 46
10 Murrumbidgee 46
11 Illawarra 45
12 Hunter 35 Weakest Performers
13 Sydney Periphery 31 Weakest Performers
14 Far West 26 Weakest Performers
15 Sydney Production Corridor 18 Weakest Performers

88
Life-long learning www.your-place.net
Proportion of residents undertaking further training as a pointer to future prosperity LGA with a rating of 100 has the highest proportion of residents undertaking further training DERIVATION: This index compares the rates of adult education with the resident population. It captures the ability of the LGA to supply the skills needed for economic growth.
Rank
Region
Population Weighted YourPlace
Rating
Performance Descriptor
1 Global Sydney 93 Strongest Performers
2 Sydney local service economy zone 84 Strongest Performers
3 Murrumbidgee 71
4 Sydney Production Corridor 69
5 Murray 67
6 Central West (NSW) 66
7 Hunter 63
8 Northern (NSW) 60
9 Far West 59
10 Richmond-Tweed 58
11 Illawarra 56
12 North Western 52
13 South Eastern (NSW) 46 Weakest Performers
14 Mid-North Coast 45 Weakest Performers
15 Sydney Periphery 43 Weakest Performers

89
Lifestyle choice www.your-place.net
Significance of entertainment, cultural and recreational industries to future growth LGA with rating of 100 has the economy married most strongly to providing lifestyle services to residents and visitors DERIVATION: This index is derived from National Economics industry output modelling. It compares the concentration of economic activity in recreational and lifestyle industries (restaurants, theme parks, clubs, hotels, caravan parks, theatres, cinemas, tourist activities) as a proportion of total output.
Rank
Region
Population Weighted YourPlace
Rating
Performance Descriptor
1 Richmond-Tweed 82 Strongest Performers
2 Sydney local service economy zone 81 Strongest Performers
3 Mid-North Coast 80 Strongest Performers
4 South Eastern (NSW) 74 Strongest Performers
5 Murray 66
6 Sydney Periphery 66
7 Global Sydney 65
8 Far West 64
9 Hunter 63
10 Illawarra 60
11 North Western 59
12 Northern (NSW) 55
13 Central West (NSW) 53
14 Sydney Production Corridor 50
15 Murrumbidgee 45 Weakest Performers