framework indicators a review of covid -19 statistics
TRANSCRIPT

Framework Indicators A Review of COVID -19 StatisticsUpdated to November 10, 2021

Risk Indicators for Monitoring COVID-19 Transmission in Saskatoon
Indicator Green Minimal Risk
Yellow- Caution
Orange High Risk
Red Critical
7 Day Average Weekly Cases Per 100,000 persons
0 to 10 11 to 20 21 to 30 Greater than 30
7-Day Average Test Positivity Rate (%)
0 to 3.0% 3.1 to 6.0 % 6.1% to 10% Greater than 10%
Effective Reproduction Rate
Less Than 1.0 1.01 to 1.2 1.21 to 1.4 Greater than 1.4
Vaccination Rates of Total Population (%)
90% or greater 75 to 90% 60 to75 % Less than 60%

Saskatoon’s Status as of November 10, 2021 The data charts and trends on the subsequent slides.
7 Day Average Weekly Cases Per 100,000 persons 7.57-Day Average Test Positivity Rate (%) 6.0%Effective Reproduction Rate (Sample Mean) 0.87Vaccination Rates of Total Population (%) 67.0%
Status Yellow (Caution)
Primary Indicator Status as of
November 10, 2021

Primary COVID-19 Transmission Risk Indicators -
Saskatoon

CASE COUNTS PER CAPITA: This slide shows panel charts using the 7 day average of cases adjusted for 100,000 population. It uses the same y-axis scale so that better comparisons about the COVID-19 impact on each aggregate zone can be made. Note that only the first two charts on each row have the y-axis labelled and the same scale is used on each chart (to a maximum of 100). All zones are experiencing high per capita case counts. The red dotted line indicates when the provincial public health order was lifted on July 11, 2021.

Test Positivity Rates 7 Day Average: This slide shows panel charts using the 7 day average the test positivity rate for each aggregate zone. It is calculated by the 7 day average of new cases divided by the 7 day average of new tests. The data starts onAugust 22, 2021 because there is no testing data by zone for late June, all of July, and the first two weeks of August. The red line indicates the World Health Organization Standard of 5% for a controlled level of positive cases. A test positivity rate of less than 5% typically means the transmission is under control.

This slide estimates the Effective Reproduction Number (Rt) for Saskatoon. A few points to note here. (1) The dates are lagged because Rt uses recent case history to estimate the infection rate that caused them, referred to as the “presumed transmission date”. This date occurs about 7 days prior to reporting of new cases. (2) An Rt above 1 means that COVID-19 is growing exponentially. An Rt below 1 means that cases will eventually die out. (3) Rt is based on the SEIR epidemiological model with assumptions. I use the Cori, et.al method to determine the Rt (described here: https://doi.org/10.1093/aje/kwt133). (4) The Rt is estimated as the mean using 95% confidence intervals.

Vaccine Progress by Zone. This slide shows vaccinations by zone as percentage of the total population. There are about 813,000 fully vaccinated persons in Saskatchewan or 67.5%. In Saskatoon, over 226,000 persons are fully vaccinated translating into to 67.0% of the zone's total population. Saskatoon’s vaccination rate grew by 0.8 percentage points this week. The chart on this slide shows the progress to reach immunity, which is suggested to be 90%, given the transmissibility of the Delta Variant of Concern.

Vaccines progress Saskatoon Zone. This slide shows vaccinations for the Saskatoon zone is a few different ways, since April 2021. The line charts use 7-day averages for vaccination doses. The first chart shows new total vaccination doses. The second chart shows new first vaccination doses and the third chart shows fully vaccinated doses. There is a noticeable uptick in the first dose vaccines in late September, but that has fallen off. Full vaccination doses have fallen to 380 per day, while first does are averaging 172 per day over that past week. Finally, the fourth chart shows a time series of percent share of the Saskatoon population fully vaccinated.

Secondary COVID-19 Transmission Risk Indicators -
Saskatoon

Wastewater Testing: The charts on this slide show the wastewater samples collected in Saskatoon. This is a predictive model that tests wastewater samples to determine the concentration of SARS-COV-2 and its variants. This slide has been revised and now combines the overall wastewater samples and the variants of concern in the wastewater samples. The analysis reveals that the entire wastewater load is of the Delta VOC. The measurement period shows a drop of 56 percent in the virus load relative to the last sample and a 75% drop in the Delta VOC.

Hospitalizations & Deaths. This slide shows total hospitalizations and ICU hospitalizations for the Saskatoon zone. Total hospitalizations and ICU hospitalizations are at record peaks. ICUs are about 26% of total hospitalizations for Saskatoon. Fatalities tend to follow an increase in ICU hospitalizations as shown by the blue line on the chart, but lagged by about one week.
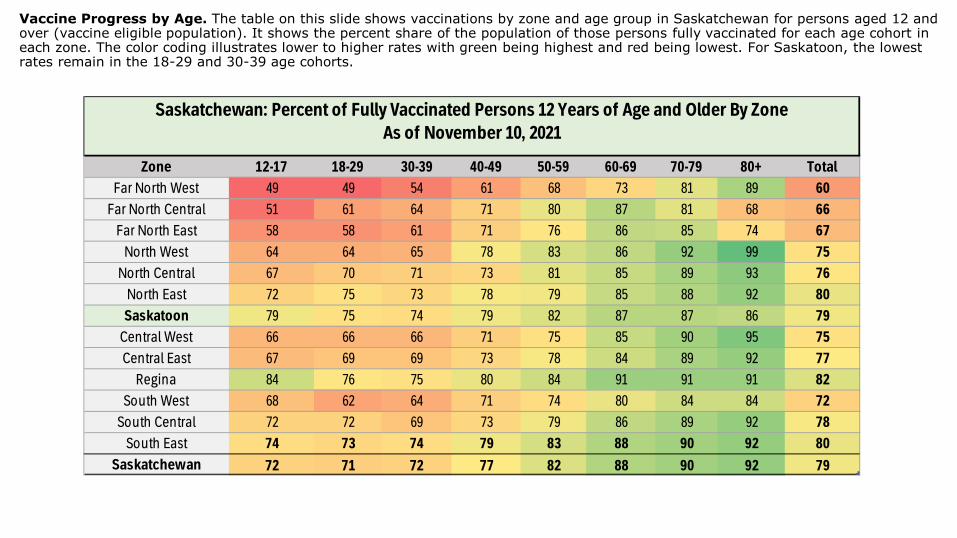
Vaccine Progress by Age. The table on this slide shows vaccinations by zone and age group in Saskatchewan for persons aged 12 and over (vaccine eligible population). It shows the percent share of the population of those persons fully vaccinated for each age cohort in each zone. The color coding illustrates lower to higher rates with green being highest and red being lowest. For Saskatoon, the lowest rates remain in the 18-29 and 30-39 age cohorts.
Zone 12-17 18-29 30-39 40-49 50-59 60-69 70-79 80+ Total
Far North West 49 49 54 61 68 73 81 89 60
Far North Central 51 61 64 71 80 87 81 68 66
Far North East 58 58 61 71 76 86 85 74 67
North West 64 64 65 78 83 86 92 99 75
North Central 67 70 71 73 81 85 89 93 76
North East 72 75 73 78 79 85 88 92 80
Saskatoon 79 75 74 79 82 87 87 86 79
Central West 66 66 66 71 75 85 90 95 75
Central East 67 69 69 73 78 84 89 92 77
Regina 84 76 75 80 84 91 91 91 82
South West 68 62 64 71 74 80 84 84 72
South Central 72 72 69 73 79 86 89 92 78
South East 74 73 74 79 83 88 90 92 80
Saskatchewan 72 71 72 77 82 88 90 92 79
Saskatchewan: Percent of Fully Vaccinated Persons 12 Years of Age and Older By ZoneAs of November 10, 2021

General Monitoring Statistics

Table A shows various COVID statistics by Saskatchewan Health Zones to show the incidence of COVID in various parts of Saskatchewan. The table shows both case counts (the raw numbers as reported) and rates adjusted for 100,000 population in each zone. It also shows testing data, with rates adjusted to 100,000 persons and the cumulative test positivity rate. The reason for the adjustments is to show per capita comparisons on the various indicators and their intensity. A row called “unassigned” means that some cases/tests have not been assigned a location.
* indicates rates are per 100,000 persons
Location Recoveries
Zone Population
Estimates (2021)Share of
Population Total Cases Total Case
Rate*Active Cases
Active Case Rate*
Inpatient ICU Count Deaths Death Rate*
Total Tests Test Rate* Test Positivity Rate (%)
Far North West 29,813 2.5 4,323 14,500 62 208.0 0 0 4,213 48 161.0 30,483 102,247 14.2Far North Central 2,649 0.2 541 20,423 0 0.0 0 0 535 6 226.5 2,841 107,248 19.0Far North East 24,249 2.0 4,356 17,964 42 173.2 0 0 4,290 24 99.0 28,034 115,609 15.5North West 82,386 6.8 8,582 10,417 115 139.6 7 1 8,349 118 143.2 67,666 82,133 12.7North Central 88,991 7.4 7,928 8,909 145 162.9 14 5 7,697 86 96.6 82,286 92,466 9.6North East 41,560 3.4 2,803 6,744 20 48.1 1 0 2,750 33 79.4 33,773 81,263 8.3Saskatoon 338,106 28.1 18,997 5,619 289 85.5 52 25 18,542 166 49.1 328,093 97,039 5.8Central West 36,962 3.1 1,403 3,796 13 35.2 0 0 1,376 14 37.9 22,310 60,359 6.3Central East 98,368 8.2 4,323 4,395 190 193.2 12 4 4,084 49 49.8 75,892 77,151 5.7Regina 273,351 22.7 15,514 5,675 246 90.0 43 17 15,071 197 72.1 253,229 92,639 6.1South West 38,670 3.2 2,126 5,498 31 80.2 1 0 2,061 34 87.9 26,284 67,970 8.1South Central 60,459 5.0 2,879 4,762 46 76.1 3 0 2,796 37 61.2 56,088 92,770 5.1South East 89,294 7.4 4,683 5,244 154 172.5 2 0 4,466 63 70.6 67,304 75,373 7.0Unassigned (Pending) 0 0.0 572 0.0 21 0.0 0 0 548 3 0.0 167,484 0 0.0Total Saskatchewan 1,204,858 100.0 79,030 6,559.3 1,374 114.0 135 52 76,778 878 72.9 1,241,767 103,063 6.4
Tests
Table A: Saskatchewan COVID-19 Data by Health Zone (Cumulative Data, except Hospitalizations, as of November 10, 2021)Source: Author Calculations from https://dashboard.saskatchewan.ca/health-wellness
Hospitalizations Fatalities Demographics Cases

Cases by Vaccination Status. This slide shows the composition of cases, deaths and hospitalizations by vaccine status as published by the Public Health Agency of Canada. The data clearly shows the vaccine efficacy in preventing cases and serious outcomes. About six percent of all cases, hospitalizations, and deaths in Canada recorded since early December 2020 are in fully vaccinated persons aged 12 and over. The data is lagged by about three weeks and the sample size (N) is about 837,000 cases.
