francis jackson - esi-africa.com · induction generator power converter (30% of full-rating)...
TRANSCRIPT
Francis JacksonEngineering Development
Manager
WindlabSouth Africa

2
“Unlocking Africa’s wind energy potential - getting projects off the
ground”
1. What precedents from international best practice can Africa draw on to enable wind project development?
2. What would best practice be in an African context?

3
Introductions
• Francis Jackson
• Windlab Developments South Africa Pty Ltd
• Engineering Development Manager
• Windlab Systems, WindScapeTM
• International Developer, USA/Canada/Australia/RSA
• Local team employs 5 South Africans, 1 Zimbabwean
• University of Stellenbosch
• Lecture wind energy module
• SAWEA (South African Wind Energy Ass’n)
• Technical Working Group

4
Introductions
• Dipolelo J. Elford
• Chief Director: Environmental Sustainability
• Department of Environmental Affairs and Development Planning
• Western Cape, South Africa

5
Introductions
• James White
• Sales Account Manager – Southern and Eastern Africa
• Vestas Southern Africa (Pty) Ltd


7
Workshop format
• Two sessions, two themes:
• 9:30-10:30
• What precedents from international best practice can Africa draw on to enable wind project development?
• Panellists' introductory presentation
• Discussion
• 10:30-11:00 Tea/Coffee Break
• 11:00-12:30
• What would best practice be in an African context?• Panellists' introductory presentation
• Discussion

8
Issues on each theme
1. Market barriers and mechanisms
2. Sustainability and local resource context
3. Regulation and development approvals
4. Social context
5. Technology and infrastructure
6. Localisation and industrial development

SESSION ONE: International Best Practice
James White
10
International Best Practice
• What precedents from international best practice can Africa draw on to enable wind project development?
• Employment in the wind industry
• James White

11
Sources: Die Welt, September 10, 2009, p.3, Deutsche
Bundesnetzagentur 2009,Bundesministerium für Umwelt,
Naturschutz und Reaktorsicherheit (BMU), Erneuerbare Energien in
Zahlen 2009
Wind energy accounts for 40,5 TWh
Equivalent to the annual outputof five nuclear power plants
In 2007, the German electricity generation from renewable sources increased 30% to 66.7 TWh
This is…
Wind Farms Today are Real Power Plants

12
How many jobs does wind energy create?
1 MW = 15.5 Wind JobsFTE per MW annual installation
“33 new jobs per day, seven days a week – this is only one of the benefits the European wind sector offered to
Europe’s economy in average over the last 5 years.”(Referring to direct job creation in Europe 2002-2007).
European Wind Energy Association (EWEA) (2009). Wind at Work, p. 5
13
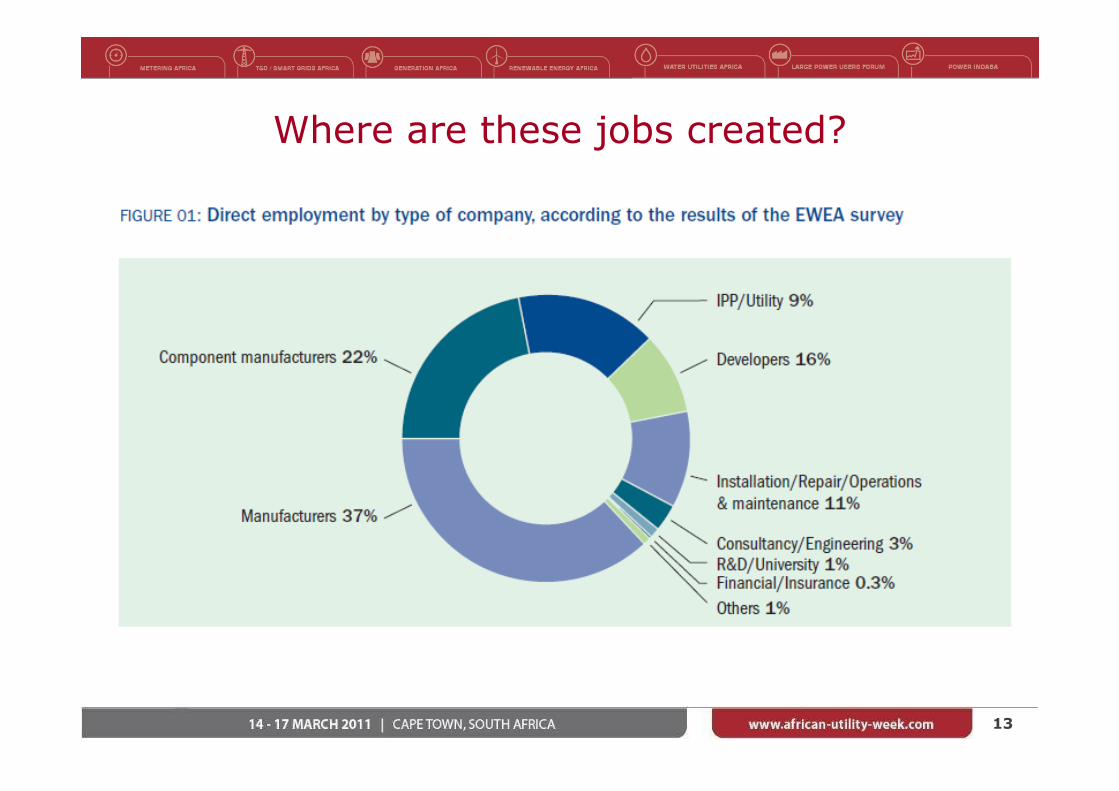
Where are these jobs created?

14
How does this look for one wind farm?
Manufacturers report a shortage in two types of jobs: Firstly, engineers , secondly, O&M and site management
activities. Wind energy promoters need more project managers – those responsible for obtaining the building permits in the country where the wind farm is going to be
installed. The role requires a specific knowledge both of the country in question and of wind energy, along w ith
negotiating skills.
European Wind Energy Association (EWEA) (2009). Wind at Work, p. 29

15
How does this compare across renewable technologies?
Source: World Watch Institute et al. (2008). Green Jobs: Towards Decent Work in a Sustainable, Low-Carbon World. United Nations for Environment Programme, p.127.
16
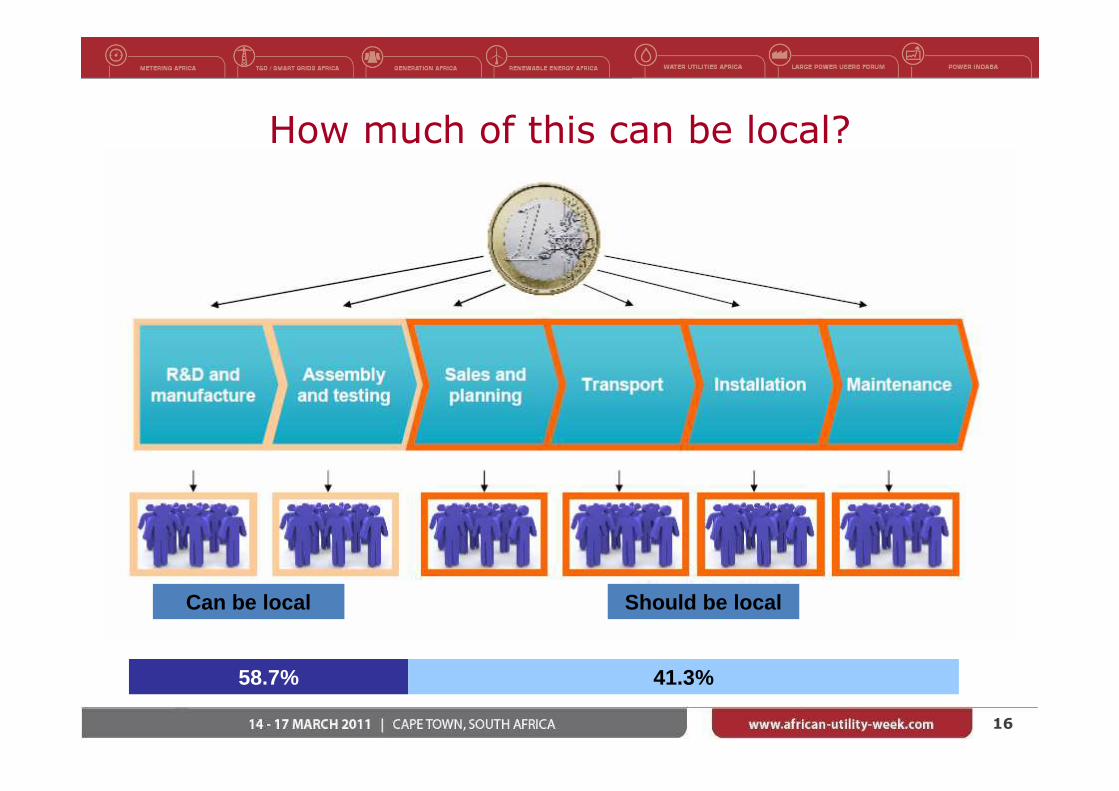
How much of this can be local?
Should be localCan be local
58.7% 41.3%

17
International best practise: Overall top drivers and must-dos for Wind Jobs creation
Deliver on targets!
- Wind targets are one thing. Necessary and important to create momentum but insufficient to create jobs.
Incentive schemes are key
- Feed-in tariffs
- Cap-and trade / certificates schemes including effective penalty fornonperformers
- Tax incentives transferrable to investment incentives
Support with coherent infrastructure build-outs and efficient spatial planning
Transmission grid build-outs and transparent
Quick permission processes are found to be of equal importance as incentive schemes by experienced wind investors.
SESSION ONE: International Best PracticeTechnology and Infrastructure
Daniel Kurylo

19
Departure and delivery ports
The busiest port in the world, Singapore
World’s busiest ports based on 2009 data
1.Singapore2.Shanghai3.Hong Kong4.Shenhen5.Busan28. Port Said, Egypt36. Durban, South Africa
What makes a good port?
• Proximity to wind farms and factories• Cranes for lifting• Lay-down yard• Road and rail connected• Deep harbor
20
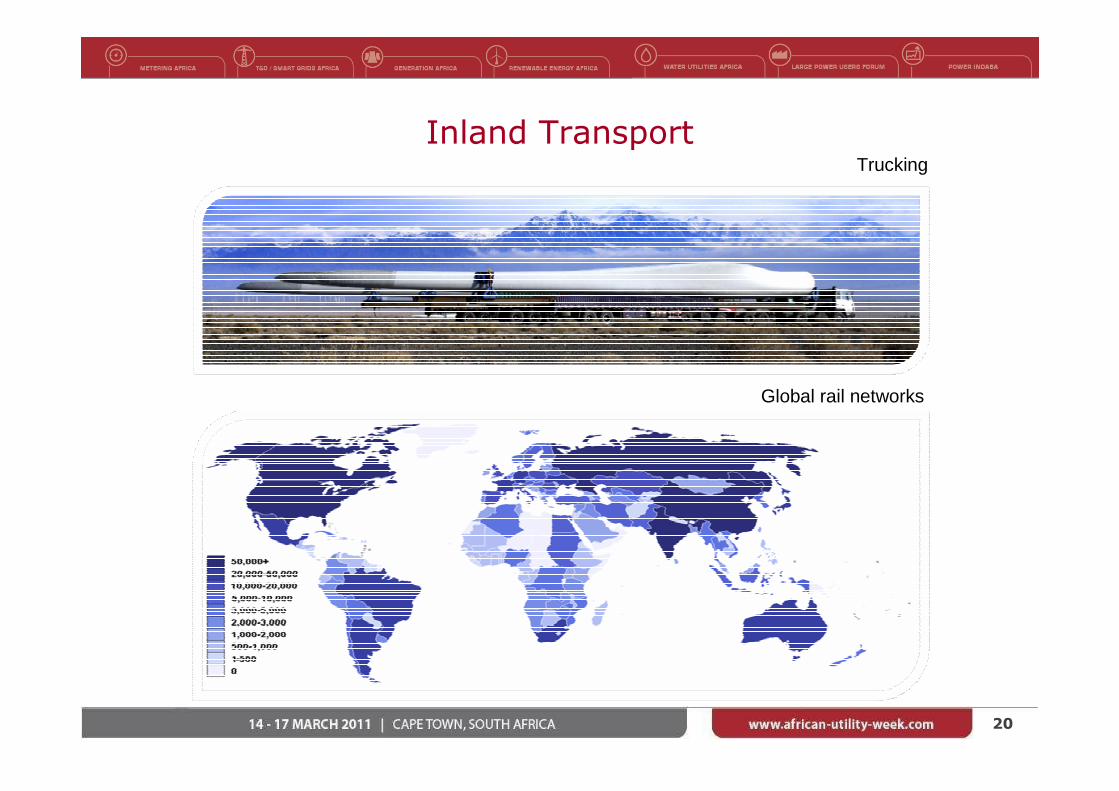
Inland Transport
Global rail networks
Trucking

21
Cranes
A traditional lattice crane installing a Goldwind 2.5MW turbine in China
Lattice cranes- 15+ truckloads and days to erect- manually extending
Hydraulic cranes- 4-5 truck loads and about six hrs to erect- extendable via remote control
Crawler carrier- slow moving- stable without need for outriggers
Truck mounted carrier- fast moving- needs outriggers
Global trend towards bigger turbinesGlobal trend toward bigger cranes
22
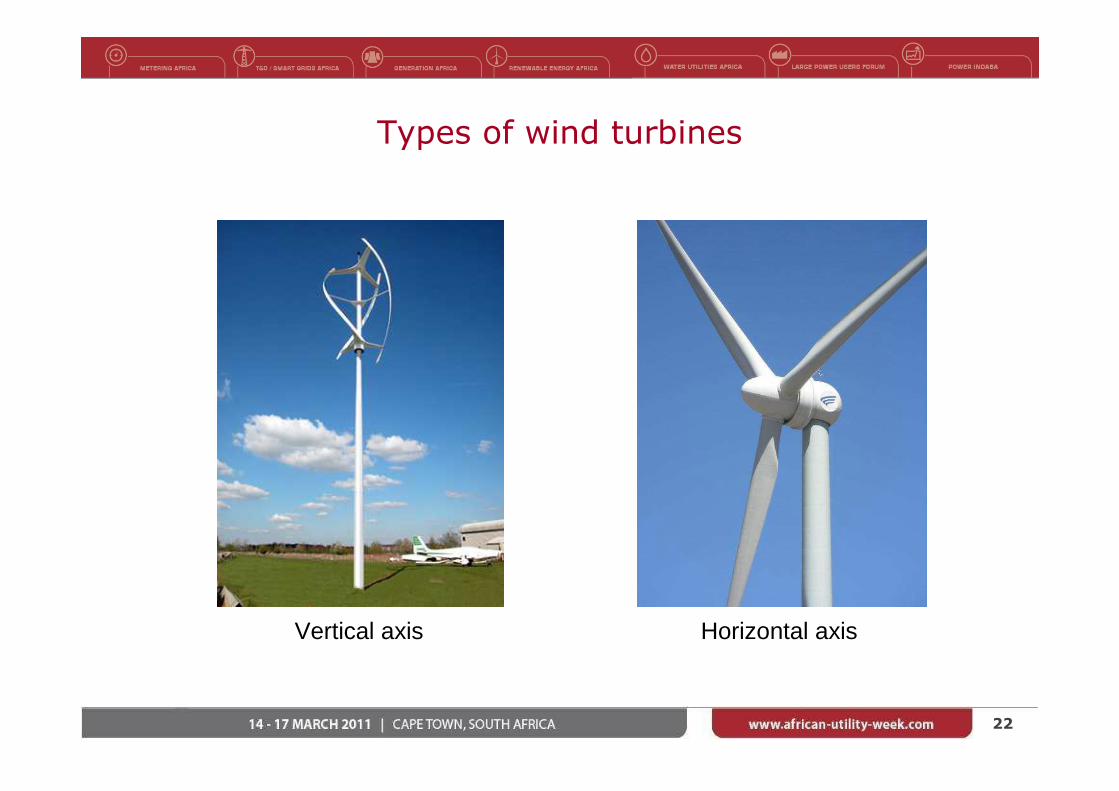
Types of wind turbines
Vertical axis Horizontal axis

23
Towers
Lattice tower Tubular tower

24
Trending from gearbox DFIG to PMDD
PMDD Technology – Forward Trend for Wind Industry
Direct Drive Permanent Magnet Generator
Full Power Converter (100% of full-rating)
Gearbox
DFIG
Double-Fed Induction Generator
Power Converter (30% of full-rating)
Gearbox DFIG – Incumbent TechnologyTrend Reason for
Change
Direct Drive Eliminate failure of gearboxesEliminate gearbox energy lossesReduce number of parts required
Permanent Magnet Generator
Better fault ride through/zero power requirement to energizeEliminatesecondary winding lossesEliminate slip rings and associated maintenance
Full Power Converter
Grid friendlyMore control and operational flexibilityMeet Future Grid Codes and Requirements

25
DD generators vs. Goldwind PMDD
• Simple and compact structure and a lightweight design
• Multi-polar, low-speed• High power to weight ratio• No excitation losses• No requirement for excitation
slip rings and brushes• External diameter of WTG is
smaller than wound rotor designs Goldwind
Permanent Magnet Generator
Traditional turbine Wound Rotor
ExcitationGenerator
2. Stator 2. Stator1. Rotor
Generator Diameter
5. Rotor Windings
3. Stator Windings
4. Permanent Magnet
3. Stator Windings
1. Rotor
Reduction in diameter due to PM
The use of permanent magnets in the generator rotor removes the need for excitation of rotor windings, slip rings, brushes and associated maintenance
Permanent magnets also allow for a smaller physical structure, removing weight and enabling easier transportation

26
Multi-pole synchronous generator
The generator consists of the following components:
• Generator stator with six‐phase winding• Generator rotor with permanent magnets
The generator is fully maintenance and wear‐free (with the exception of the main bearing).

27
Full power frequency convertor – AC/DC/AC
Variable Speed Technology
• Passive diode rectifier: high efficiency, low EMI
• Very low harmonics to the grid
• Automatic adjustment to 50 Hz or 60 Hz
• Measured and certified low-voltage ride through
• Full reactive power control
• High reliability: air cooling, robust converter control
• Good serviceability: modular design with fast IGBT exchange
“Low-tech converter” of highly integrated IGBT modules• Integrated current sensor • Integrated temperature sensor• Integrated heat sink• Integrated driving circuit & protection

28
What are the Top 10onshore turbine manufacturers doing?
Company
Current Production Turbines
Technological History Indicated Future Turbine TechnologyDirect
DrivePermanent
MagnetFull Power Converter
Goldwind � Yes � Yes � Yes PMDD PMDD
Vestas X No � Yes � Yes Gearbox DFIG Gearbox driven
GE X No � Yes � Yes Gearbox DFIG PMDD
Sinovel X No XNo X No Gearbox DFIG Not specified
Enercon � Yes X No � Yes Wound Rotor DD Wound Rotor DD
Siemens � 2011 � Yes � Yes Gearbox Type PMDD
Suzlon X No XNo X No Gearbox DFIG Not specified
Repower X No XNo X No Gearbox DFIG Not specified
Gamesa X No � Yes � Yes Gearbox DFIG Not specified
Dong Fang X No XNo X No Gearbox DFIG PMDD
29
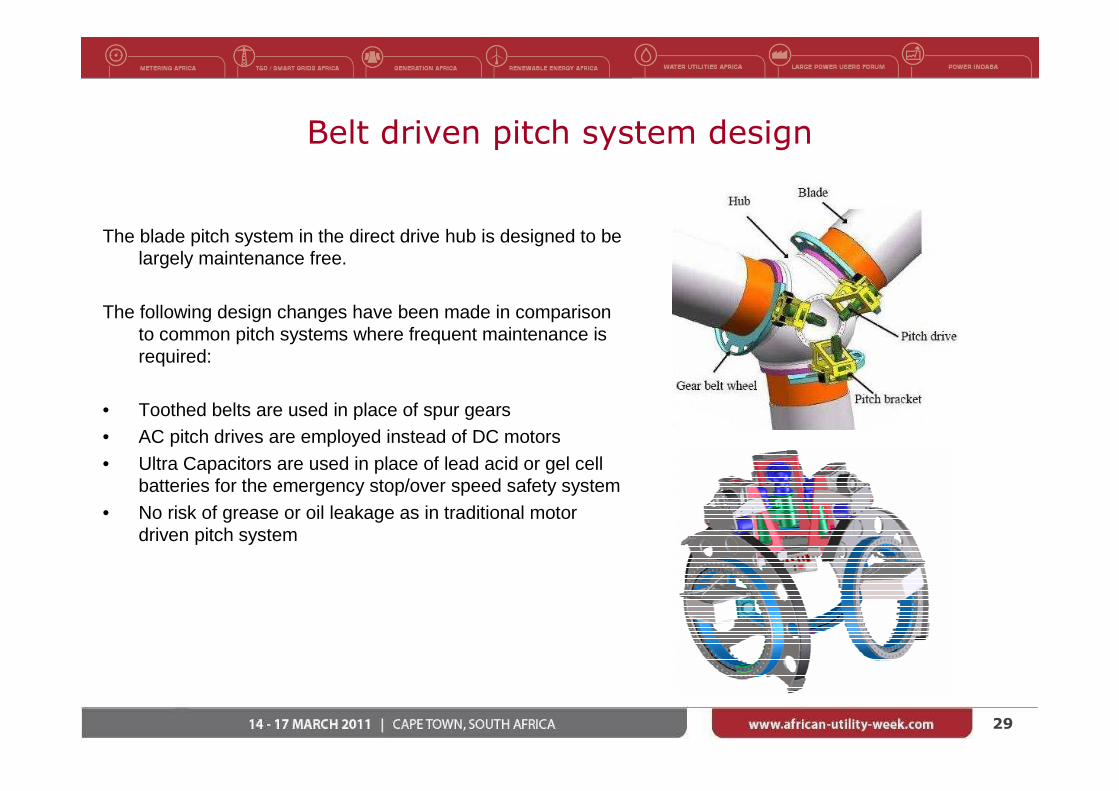
Belt driven pitch system design
The blade pitch system in the direct drive hub is designed to belargely maintenance free.
The following design changes have been made in comparison to common pitch systems where frequent maintenance is required:
• Toothed belts are used in place of spur gears• AC pitch drives are employed instead of DC motors• Ultra Capacitors are used in place of lead acid or gel cell
batteries for the emergency stop/over speed safety system• No risk of grease or oil leakage as in traditional motor
driven pitch system

30
Blades
• Traditionally made of wood
• Blades are getting longer and lighter
• Now made of composite materials including glass fiber and resin
• LM is making a 61.5m blade
• Companies are specializing in blade design and production

SESSION ONE: International Best Practice
Francis Jackson

32
International Best Practice
• Market mechanisms
• Sustainability and local resource context
• Grid integration

33
Market Mechanisms: Energy Markets, Procurement
• Power procurement and trading
• Live market / power pool trading
• Price-based tender
• Tradable Renewable Energy Certificates
• Feed-in Tariff
• Incentives: Carrot and stick
• Carbon taxes
• CDM
• …other national incentive programs

34
Market Mechanisms: National Incentive Programs
• Investment Support
• Direct capital investment subsidies/grants
• Capital investment write-offs, soft loans
• Production Support
• Premium price for generation (e.g. REFIT)
• Exemption from energy taxes
• Production tax credits
• Demand Creation
• Obligation for production from renewables on suppliers
• e.g. Renewable Portfolio Standards (RPS) / Renewables Production Obligation (RPO), allows utilities to select most economical RE
• Free market for green electricity (e.g. TRECs)

35
National Incentive Programs• Enhanced feed-in tariff
• Renewable portfolio standards (RPS), renewables production obligation (RPO), or renewables obligation (RO)
• Green electricity schemes
• Capital subsidies
• Income tax credits
• Net metering
• Special planning activities
• Net billing
• Electric utility activities
• Wind-specific green electricity schemes
• Investment funds for wind energy
• Sustainable building requirements
• Payroll tax credit
• Commercial bank activities IEA Wind Annual Report 2009

36
Market Mechanisms: ExampleIEA, 2007
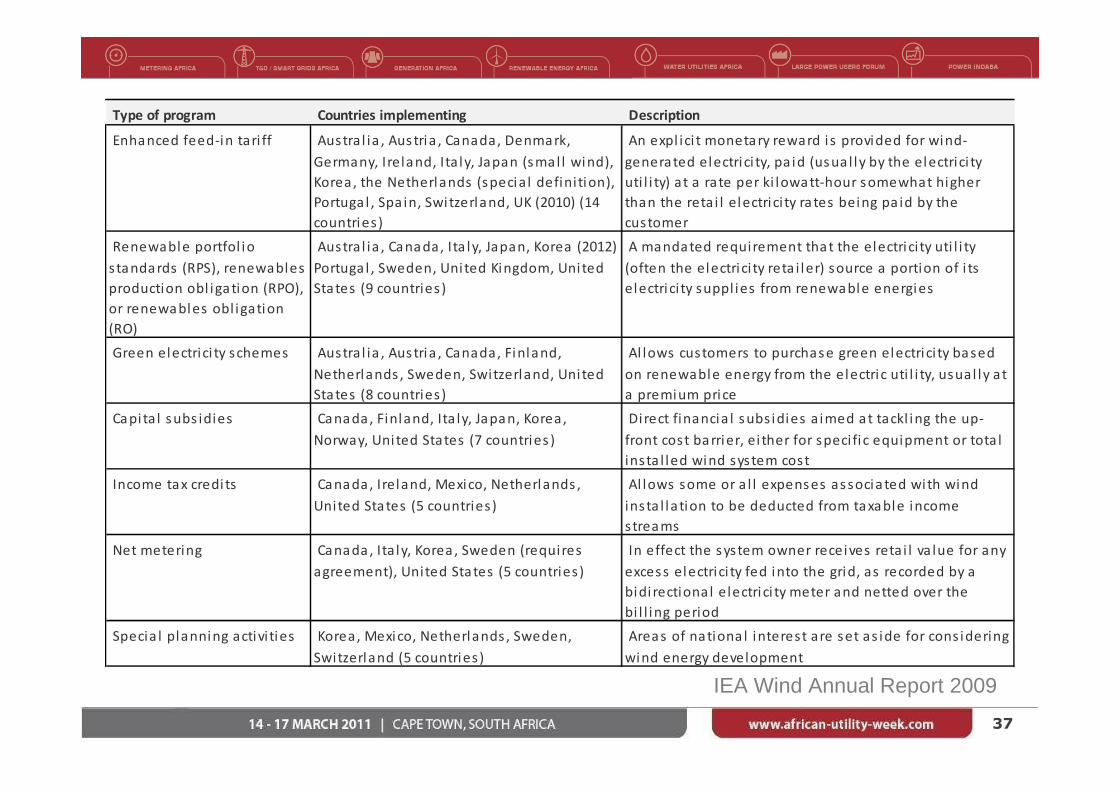
37
Type of program Countries implementing Description
Enhanced feed-in tari ff Austral ia , Austria , Canada, Denmark,
Germany, Ireland, Ita ly, Japan (smal l wind),
Korea , the Netherlands (specia l definition),
Portuga l , Spa in, Switzerland, UK (2010) (14
countries)
An expl ici t monetary reward i s provided for wind-
generated electrici ty, pa id (usua l ly by the electrici ty
uti l i ty) at a rate per ki lowatt-hour somewhat higher
than the retai l electrici ty rates being pa id by the
customer
Renewable portfol io
standards (RPS), renewables
production obl igation (RPO),
or renewables obl igation
(RO)
Austral ia , Canada, Ita ly, Japan, Korea (2012)
Portuga l , Sweden, Uni ted Kingdom, Uni ted
States (9 countries)
A mandated requirement that the electrici ty uti l i ty
(often the electrici ty reta i ler) source a portion of i ts
electrici ty suppl ies from renewable energies
Green electrici ty schemes Austral ia , Austria , Canada, Finland,
Netherlands , Sweden, Switzerland, Uni ted
States (8 countries)
Al lows customers to purchase green electrici ty based
on renewable energy from the electric uti l i ty, usual ly a t
a premium price
Capi ta l subs idies Canada, Finland, Ita ly, Japan, Korea,
Norway, Uni ted States (7 countries )
Direct financia l subs idies a imed at tackl ing the up-
front cost barrier, ei ther for specifi c equipment or tota l
insta l led wind system cost
Income tax credi ts Canada, Ireland, Mexico, Netherlands ,
United States (5 countries)
Al lows some or a l l expenses associated with wind
insta l la tion to be deducted from taxable income
streams
Net metering Canada, Ita ly, Korea , Sweden (requires
agreement), United States (5 countries)
In effect the system owner receives retai l va lue for any
excess electrici ty fed into the grid, as recorded by a
bidi rectiona l electrici ty meter and netted over the
bi l l ing period
Specia l planning activi ties Korea, Mexico, Netherlands , Sweden,
Switzerland (5 countries)
Areas of nationa l interest are set as ide for cons idering
wind energy development
IEA Wind Annual Report 2009

38
Type of program Countries implementing Description
Net bi l l ing Portugal (microgeneration only), Sweden
(requires agreement), Uni ted States (4
countries )
The electrici ty taken from the grid and the electrici ty
fed into the grid are tracked separately, and the
electrici ty fed into the grid is va lued at a given price
Electric uti l i ty activi ties Canada, Sweden, Switzerland, United
States (4 countries )
Includes green power s chemes a l lowing customers to
purchase green electrici ty, wind farms, various wind
generation ownership and fi nancing options with
select cus tomers , and wind electrici ty power purchase
models
Wind-speci fi c green
electrici ty schemes
Finland, Sweden, Switzerland, Uni ted
States (4 countries )
Al lows cus tomers to purchase green electrici ty from
wind plants from the electrici ty uti l i ty, usual ly a t a
premium price
Investment funds for wind
energy
Austra l ia , Canada, Switzerland (3 countries ) Provides share offerings in private wind investment
funds plus other schemes that focus on weal th creation
and bus iness success us ing wind energy as a vehicle to
achieve these ends
Susta inable bui lding
requirements
Canada, Ireland (2 countries ) Includes requirements on new bui lding developments
(res identia l and commercia l ) to generate electrici ty
from renewables including wind microgeneration
Payrol l tax credi t Austra l ia (South Austra l ia only), 2010 (1
country)
Al lows developers of renewable energy projects with
capacities greater than 30 MW to receive a rebate for
payrol l tax incurred during project construction
Commercia l bank activi ties Switzerland (1 country) Includes activi ties such as preferentia l home mortgage
terms for houses including wind systems and
preferentia l green loans for the insta l lation of wind
systems
IEA Wind Annual Report 2009

39
Sustainability and Local Resources
• per kWh savings in
• Generation from fuel-based resources
• Carbon emissions
• Use of water
• Health effects of externalities
• Reduction of import dependence, national security
• Co-existence with agriculture
• Direct investment and income for individuals and community / cooperatives
• A few turbines in many places (e.g. Germany) vs. many turbines in a few places

40
Grid Integration
• Grid infrastructure
• Embedded Dx and Tx integration
• Strongly interconnected networks
• E.g. Central Europe and Scandinavia
• Islanded or poorly interconnected networks
• E.g. Ireland, parts of Australia
• Evolution of Smart Grids
• Grid codes and network support
• Penetration
• Percentage of power capacity
• Percentage of energy consumption

41
Experience with penetration
• Extents cannot be generalised, depend on
• grid infrastructure quality and configuration
• power market operation, cross-border transmission and trading
• correlation to demand
• cross-border transmission and trading
Wind development Issues
Phase I
The added variability due to wind is not significantly noticed on the
system, wind is treated as negative load; no major system adaptation
is normally necessary and demands on transmission capacity are
mostly within existing limits.
Phase II
Additional operational and capacity reserve will become necessary.
Grid re-enforcements might become necessary, depending on wind
location of wind resources and demand centres.
Phase III
Flexible capacity reserves increasingly gain in value; grid upgrades
and new interconnections will become more important, depending
on the historic structure of the grid.

42
Experience with energy penetration
• Islanded or small power systems with weak interconnections may require attention in system planning
• Technically: can integrate very large amounts
• Limits: socially and economically acceptable costs
IEA Wind Annual Report 2009
~1% Impacts and costs minor
~20% Impacts more complex, costs increase
(< 10% of long term market value of
electricity /kWh)
>~20% Changes in system operational
practise, e.g. forecasting incorporated

43
Power & Energy Penetration
Energy
penetration
Instantaneous
power
peneration peaks
Denmark 20% 100%
Spain & Portugal 14-15% 69%
Ireland 12%
Germany 7%
North Germany >30%
IEA Wind Annual Report 2009

44
Power penetration: Portugal 2009
• Limited interconnection (1-1.8 GW w’ Spain)
• Power system reached limited instantaneous penetration of 70% wind power
• No technical problems for the power system operation reported
IEA Wind Annual Report 2009

SESSION ONE: International Best Practice and
African ContextRegulation and Development Approvals
Social context
Dipolelo J. Elford

46
REGULATIONS AND APPROVAL PROCESS
WHY THE NEED FOR REGULATIONS
4747
ENSURE WIND POWER PROJECTS ARE IN LINE WITH NATIONAL PRIORITIES
ENSURE WIND ENERGY ADDS SUFFICIENT VALUE TO COUNTRY’S ENERGY NEEDS
ENSURE PROCESSING OF APPLICATIONS IS STREAMLINED AND APPLIED CONSISTENTLY THROUGHOUT COUNTRY

4848
STRATEGIC CONSIDERATIONS
• NERSA selection Criteria• As per REFIT
• Cooperative Governance• National decision making authorities to cooperate in decision-making (work in progress)
• Site selection process• To be in line with the REFIT programmes as introduced over time
• Integrate Resource Plan• Projects to be in line with IRP 2010 once finalised
• Cumulative impacts• Wind farms to be located sensibly to avoid cumulative or synergistic impacts

4949
APPROVAL PROCESS FRAMEWORK - PURPOSE
• Acknowledges that unintended consequences of development are likely to occur if different standards are applied
• Establish a Strategic Environmental Framework (SEF) to guide developers
• Establish SEF to guide decision-makers
• Generally provide context for decision-making that makes clear the spatial feasibility and possible negative impact to coastal environments

5050
STRATEGIC ENVIRONMENTAL FRAMEWORK
• Indicate wind energy potential at different places in various provinces considering basic tech requirements and probability of adequate wind
• Outline areas where the needs (tech) can be met with least likely environ impacts
• Provide officials with info for decision-making
• Provide wind farm proponents with proactive info to ensure that their projects fits with national priorities

5151
APPLICATION OF THE SEF IN APPROVAL PROCESS
• Overall Suitability Index
• Environmental Suitability Index
• Technical Suitability Index

5252
ENVIRONMENTAL SUITABILITY INDEX
• Land use suitability Index
• Ecological suitability Index
• Visual suitability Index

5353
TECHNICAL SUITABILITY INDEX
• Connection potential
• Proximity to grid
• 132 KV
• Later 132KV to 400KV
• Wind potential
• Wind Map S.A.
• Future detailed Map from SAWEA
5454
OTHER APPROVAL CONSIDERATIONS
• Comprehensive Site specific EIA, including land use, roads, all appropriate infrastructure, vegetation cover
• All appropriate authorities to be consulted by applicant
• Application of “if all things equal principle”meaning, consider alternative site, with similar characters, but less impacts on ecology

55
SOCIAL CONTEXT
GLOBAL
NATIONAL

5656
GLOBAL
• Climate change
• International Conventions – KYOTO
• Global financial meltdown
5757
NATIONAL
• POVERTY
• ENERGY POVERTY
• UNEMPL0YMENT
• Green Economy growth path - MTSF for 2009-2014
• OTHER LEGISLATIVE PROVISIONS
• INSTITUTIONAL ARRANGEMENTS
• FINANCING FOR WIND ENERGY PROJECTS
• SKILLS, EDUCATION

5858
POVERTY, ENERGY POVERTY, UNEMPLOYMENT
• How can wind farms assist communities living around their installation• Broad base empowerment?
• How can poor communities around wind farm installation benefit from it?
• Provision of jobs where appropriate (given fact that some jobs will require high level technical skills?

5959
MEDUIM TERM STRATEGIC FRAMEWORK 2009/14 FOCUS
• Minimise impact of global economic downturn on Country’s productive capacity
• Job creation and poverty reduction measures
• Identify opportunities for new areas of growth and economic participation
• Progressively and actively set the country on a new growth and development path

6060
OTHER LEGISLATION
• REFIT
• IRP
• Renewable Energy Purchasing Agency (REPA)
• How can these expedite process mainstreaming wind energy in the energy mix of country?

6161
INSTITUTIONAL ARRANGEMENTS
• ESKOM – main big player
• One integrated grid – who pays for strengthening where necessary
• REPA – When?
• Role of Municipality in buying RE – How can it be facilitated?

6262
SKILLS DEV, TRAINING & EDUCATION FOR WIND
ENERGY
• How can the above be achieved for wind energy?
• Role of tertiary and other training institutions
• Role of Government
• Role of indvl/aggregate developers

6363
FINANCING FOR WIND ENERGY
• Local availability?
• International availability?
• How to access by indv. Developer?

64
International Best Practice
• Workshop discussion open
• Please introduce yourself before addressing the group
• Please, no commercial breaks

SESSION TWO: African Context
James White

66
African context
• What would best practice be in an African context?
• Employment the South African wind industry
• James White

67
How Does South Africa Measure Up?Overall top drivers and must-dos for Wind Jobs creation
How does SA measure up?
Deliver on targets! - 10,000GWh by 2013
- IRP1: 700MW wind by 2013
- IRP2010: 4500MW by 2019, 7200MW RE tech. by 2030
Incentive schemes are key - REFIT: R1.25/kWh, take or pay, 20 years, pegged at CPI, backed by Treasury
Support with coherent infrastructure build-outs and efficient spatial planning
- Generation Connection Capacity Assessment of the 2012 Transmission Network (GCCA-2012)
- SA’s strong Road Network
Quick permission processes - EIA process
- Rezoning (influence of DAFF)
- Eskom
- REFIT RFP
68
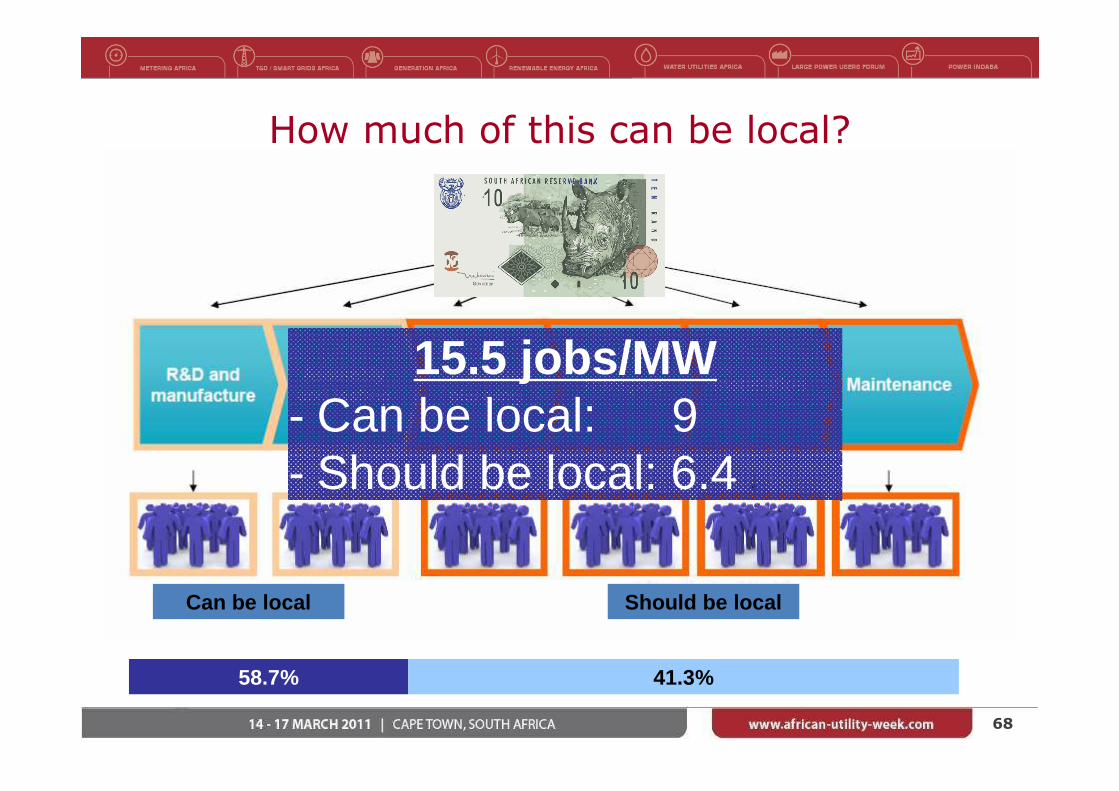
How much of this can be local?
Should be localCan be local
58.7% 41.3%
15.5 jobs/MW- Can be local: 9- Should be local: 6.4

69
What could this look like for the SA wind industry?
• New Growth Plan (NGP)
10 million jobs in the next 10 years
• IRP2010
4,500MW by 2019
• Two (basic) Scenarios• Fully Localised – 69,750 new jobs created
• Partially localised – 28,800 new jobs created
• Industrial development through the green economy
So over the next 9 years a growing wind industry could contribute 1.4% of the 10m described under the NGP supporting

70
Could it be more than 15,5/MW in Africa?

SESSION TWO: African Context
Daniel Kurylo

72
African context: Infrastructure
Local ports• Djibouti, Ethiopia• Saldhana, South Africa• Coega, South Africa• Walvis Bay, Namibia
Inland transport• Partners for transport in South Africa with
experience throughout Africa• Rail system is not as extensive as the USA
for wind turbine transport
Cranes• There is a GTK 1100 in SA to handle the
more traditional gearbox wind turbine lifts• Many crane companies in Africa have
cranes large enough to handle lifts needed for Goldwind PMDD turbines

73
African context – Technology summary
Double Fed Induction Generator Permanent Magnet, Full Power Converter
Electricity going through power converter
Approx. 30%- final output control is limited
100%- final output control is increased
Connection between generator windings and grid
Yes- any faults in the grid will directly felt by generator
No- generator windings are separated from grid
faults
Electricity required to “excite” the generator
Yes- Limits LVRT capability
No- Excellent LVRT
Number of “windings” Basically 3 sets 1 set (fewer “parts” in generator)
Generator energy consumption for excitation
Energy consumed No energy required for excitation
Converter Cost $$ stable $$$ but decreasing with improvements in power electronics
Operational Flexibility
Low- example: from 60Hz to 50Hz requires a change in gearbox ratio and production- meaning different machines in different countries with different problems
High- example: from 60Hz to 50Hz is a software change- meaning that the African turbines are the same trouble-free machines globally
Bottom line DFIG technology is outdated and no longer industry best practice
- Global trend toward PMDD- Garrad Hassan reports, Goldwind has the longest history with permanent magnet generators- GW1.5MW PMDD prototypes running since 2003

74
The best option for Africa
Permanent magnet direct drive
Full power convertor
Partially integrated value chain

SESSION TWO: African Context
Francis Jackson

76
African context
• Market barriers and mechanisms
• Sustainability and local resource context
• Grid integration
77
Market Mechanisms: National incentive programs
• Regulatory and market environment
• Government or state-owned
• Incumbent monopolies
• Power-pools
• Local drivers for:
• Introduction of new capacity
• Introduction of renewables
• Industrial development
• Feed in Tariff historically effective at ramping up introduction of wind industry

78
Feed-in Tariffs in Africa:What would make it work?
• Knowledge-sharing needed; and
• Each scheme must be country-specific
• Technology relevant to local resource
• Tariff-setting must support country’s goals
• Types of institutions needed to manage RE financial support mechanisms
• Finance of such subsidies as appropriate
REEEP/SERN Workshop Nov 2010 c/o www.renewableenergyfocus.com

79
• Planning framework must contain RE obligation for utilities
• Regulations on priority grid access
• Make long term purchase contracts
• Set prices to
• Encourage RE technologies
• Decline to “grid parity” over time
Feed-in Tariffs in Africa
REEEP/SERN Workshop Nov 2010 c/o www.renewableenergyfocus.com

80
Feed in Tariffs in Africa
• Algeria, Kenya, Tanzania
• South Africa
• REFIT introduced in March 2009
• At R1.25/kWh, attracted strong interest
• Allocation capped in IRPs
• Over-subscription concern
• Combination of REFIT and Tender
• Procurement program & PPA terms still under development

81
Market Barriers
• Barriers to entry for private sector
• Energy market, PPA
• Regulatory policy vacuum / delay
• Lead time to establish regulatory protocols
• Local capacity
• Direct wind-industry skills
• Unfamiliar to policy makers
• Unfamiliar to system operators
• Infrastructure

82
Sustainability and Local Resources
• Per kWh reductions or displacement
• Use of fuel-based energy – coal and oil reserves in Africa: incentive?
• Carbon emissions – CDM incentive
• Water consumption – critical in regions
• Health effects of externalities – felt by the poor and disempowered in particular
• Promote energy independence
• Importance of agriculture - co-existence and economic support inherent
• Proactive and realistic management of social and ecological impacts in line with national goals

83
Grid Integration
• Strength and management of networks varies
• Proximity to resource
• e.g. 428km to Lake Turkana, Kenya
• RSA, Eskom network – not always LV or MV connection
• Bulk generation connection to HV network
• Wind-relevant grid codes under evolution

84
Experience with energy penetration
• Islanded or small power systems with weak interconnections may require attention in system planning
• Technically: can integrate very large amounts
• Limits: socially and economically acceptable costs
IEA Wind Annual Report 2009
~1% Impacts and costs minor
~20% Impacts more complex, costs increase
(< 10% of long term market value of
electricity /kWh)
>~20% Changes in system operational
practise, e.g. forecasting incorporated

85
Penetration in Africa: Example scenarios
Energy
Penetration
Wind
capacity
Total
Capacity
Wind
Energy
Energy
Demand
Power
Penetration
(MW) (MW) (TWh/y) (TWh/y)
Portugal 15% 3616 17800 7.49 49.9 20%
Ireland 10.5% 1264 2.96 27.4
South Africa (scenario) 1% 840 40000 2.2 220 2%
10% 8370 40000 22 220 21%
20% 16740 40000 44 220 42%
1000MW country (scenario) 1% 20 1000 0.06 6 2%
10% 220 1000 0.58 6 22%
20% 440 1000 1.16 6 44%
Scenario Assumptions: Capacity Factor 30%, Peak Load Factor 66%

86
African Context
• Workshop discussion open
• Please introduce yourself before addressing the group
• Please, no commercial breaks

87
Conclusion and thanks
Francis Jackson
Engineering Development Manager
Windlab Developments South Africa Pty Ltd
www.windlab.com
+27 (0) 21-701-1292