fraser institute annual survey of mining companies 2016 · pdf filefraserinstitute.org survey...
TRANSCRIPT
SURVEY OF MINING COMPANIES 2016Fraser Institute Annual
Taylor Jackson and Kenneth P. GreenFRASERINST I TUTE
February 2017

ii • Fraser Institute Annual Survey of Mining Companies 2016
fraserinstitute.org

fraserinstitute.org
Table of Contents
Survey information iv
Executive Summary—2016 Mining Survey 1
Survey Methodology 3
Summary Indexes 8
Global Survey Rankings 23
Global Results 25
Overview 48
Acknowledgments 65
About the Authors 66
Publishing Information 67
Supporting the Fraser Institute 68
Purpose, Funding, and Independence 68
About the Fraser Institute 69
Editorial Advisory Board 70

fraserinstitute.org
Survey information
The Fraser Institute Annual Survey of Mining Companies was sent to approximately 2,700 exploration, development, and other mining-related companies around the world. The survey was conducted from August 30th to November 18th, 2016. The companies that participated in the survey reported exploration spending of US$2.7 billion in 2016 and US$3.2 billion in 2015.

fraserinstitute.org
Executive Summary
2016 Mining Survey
This report presents the results of the Fraser Institute’s 2016 annual survey of mining and exploration companies. The survey is an attempt to assess how mineral endowments and public policy factors such as taxation and regulatory uncertainty affect exploration investment. The survey was circulated electronically to approximately 2,700 individuals between August 30th and November 18th, 2016. Survey responses have been tallied to rank provinces, states, and countries according to the extent that public policy factors encourage or discourage mining investment.
A total of 350 responses were received for the survey, providing sufficient data to evaluate 104 jurisdictions. By way of comparison, 109 jurisdictions were evaluated in 2015, 122 in 2014, 112 in 2013, and 96 in 2012. The number of jurisdictions that can be included in the study tends to wax and wane as the mining sector grows or shrinks due to commodity prices and sectoral factors.
The Investment Attractiveness Index takes both mineral and policy perception into consideration
An overall Investment Attractiveness Index is constructed by combining the Best Practices Mineral Potential index, which rates regions based on their geologic attractiveness, and the Policy Perception Index, a composite index that measures the effects of government policy on attitudes toward exploration investment. While it is useful to measure the attractiveness of a jurisdiction based on policy factors such as onerous regulations, taxation levels, the quality of infrastructure, and the other policy related questions respondents answered, the Policy Perception Index alone does not recognize the fact that investment decisions are often sizably based on the pure mineral potential of a jurisdiction. Indeed, as discussed below, respondents consistently indicate that only about 40 percent of their investment decision is determined by policy factors.
The top
The top jurisdiction in the world for investment based on the Investment Attractiveness Index is Saskatchewan, which moved up to first from second place in 2015. Manitoba moved up to second

2 • Fraser Institute Annual Survey of Mining Companies 2016
fraserinstitute.org
place this year after ranking 19th the previous year. Western Australia dropped to third, after Saskatchewan displaced it as the most attractive jurisdiction in the world. Rounding out the top ten are Nevada, Finland, Quebec, Arizona, Sweden, the Republic of Ireland, and Queensland.
The bottom
When considering both policy and mineral potential in the Investment Attractiveness Index, the Argentinian province of Jujuy ranks as the least attractive jurisdiction in the world for investment. This year, Jujuy replaced another Argentinian province—La Rioja—as the least attractive jurisdiction in the world. Also in the bottom 10 (beginning with the worst) are Neuquen, Venezuela, Chubut, Afghanistan, La Rioja, Mendoza, India, Zimbabwe, and Mozambique.
Policy Perception Index: A “report card” to governments on the attractiveness of their mining policies
While geologic and economic considerations are important factors in mineral exploration, a region’s policy climate is also an important investment consideration. The Policy Perception Index (PPI), is a composite index that measures the overall policy attractiveness of the 104 jurisdictions in the survey. The index is composed of survey responses to policy factors that affect investment decisions. Policy factors examined include uncertainty concerning the administration of current regulations, environmental regulations, regulatory duplication, the legal system and taxation regime, uncertainty concerning protected areas and disputed land claims, infrastructure, socioeconomic and community development conditions, trade barriers, political stability, labor regulations, quality of the geological database, security, and labor and skills availability.
The top
For the fourth year in a row, the Republic of Ireland had the highest PPI score of 100. Ireland was followed by Saskatchewan in second, which moved up from 4th in the previous year. Along with Ireland and Saskatchewan, the top 10 ranked jurisdictions are Sweden, Finland, Nevada, Manitoba, Wyoming, New Brunswick, Western Australia, and Northern Ireland, which was included for the first time in the 2016 survey.
The bottom
The 10 least attractive jurisdictions for investment based on the PPI rankings (starting with the worst) are Venezuela, Afghanistan, Zimbabwe, Mongolia, Philippines, Indonesia, Chubut, South Sudan, Mendoza, and Ecuador. Venezuela, Zimbabwe, and Chubut were all in the bottom 10 jurisdictions last year. Two out of the 10 lowest-rated jurisdictions based on policy were Argentinian provinces.

fraserinstitute.org
Survey Methodology
Survey background
The mining industry is an important contributor both to Canada’s economy and to economies around the world. It provides not only materials essential for all sectors of the economy, but also employment and government revenues. Mining contributes to economic growth worldwide and Canadian mining companies operate in jurisdictions around the world. While mineral potential is obviously a very important consideration in encouraging or dissuading mining investment, the impact of government policies can also be significant in encouraging or discouraging investment in this important area of economic activity.
Moreover, many regions around the world have attractive geology and competitive policies, allowing exploration investment to be shifted away from jurisdictions with unattractive policies. As well, it is well beyond our capability to fully understand the details of the public policy environment around the world.
So, since 1997, the Fraser Institute has conducted an annual survey of mining and exploration companies to assess how mineral endowments and public policy factors such as taxation and regulation affect exploration investment. Our purpose is to create a “report card” that governments can use to improve their mining-related public policy in order to attract investment in their mining sector to better their economic productivity and employment. Others also may find the survey useful for evaluating potential investment decisions, or for assessing various risk factors in jurisdictions of interest.1
This year the survey includes 104 jurisdictions from all continents except Antarctica. There were insufficient responses to a number of the jurisdictions surveyed for us to be able to include them in the 2016 report.2 These include Albania, Angola, Armenia, Belarus, Burundi, Cambodia, Central
1 While we would prefer to directly measure the impacts of specific mining policy changes on investment in the sector, there are many barriers to doing so. The effects of policy on deterring exploration investment may not be immediately apparent due to the lag time between when policy changes are implemented and when economic activity is impeded and job losses occur.
2 The minimum threshold for inclusion this year was 5 responses. However, jurisdictions with between 5 and 9 responses were also included but have been noted accordingly. Any jurisdiction with fewer than 5 responses was dropped.

4 • Fraser Institute Annual Survey of Mining Companies 2016
fraserinstitute.org
African Republic, Egypt, Estonia, Gabon, Guinea (Conakry), Iraq, Israel, Jordan, Kyrgyzstan, Laos, Lesotho, Liberia, Madagascar, Malawi, Mauritania, Morocco, New Caledonia, Niger, Nigeria, Oman, Pakistan, Republic of the Congo (Brazzaville), Rio Negro, Saudi Arabia, Solomon Islands, Sudan, Suriname, Swaziland, Tajikistan, Thailand, Tunisia, and Vietnam.
Jurisdictions are added to the survey based on interest from survey respondents. This survey is published annually and the results are available and accessible to an increasingly global audience. In the past, detailed tables were included in the report’s appendix; they showed the breakdown of scores on each question for each individual jurisdiction. Those tables are now available online at fraserinstitute.org.
The Fraser Institute’s mining survey is an informal survey that attempts to assess the perceptions of mining company executives about various areas of optimal and sub-optimal public policies that might affect the hospitality of a jurisdiction to mining investment. Given the survey’s very broad circulation, its extensive press coverage, and positive feedback about the survey’s utility from miners, investors, and policymakers, we believe that the survey captures, at least in broad strokes, the perceptions of those involved in both mining and the regulation of mining in the jurisdictions included in the survey.
Sample design
The survey is designed to identify the provinces, states, and countries that have the most attractive policies for encouraging investment in mining exploration and production. Jurisdictions that investors assessed as relatively unattractive may therefore be prompted to consider reforms that would improve their ranking. Presumably, mining companies use the information that is provided to corroborate their own assessments and to identify jurisdictions where the business conditions and regulatory environment are most attractive for investment. The survey results are also a useful source of information for the media, providing independent information as to how particular jurisdictions compare.
The 2016 survey was distributed to approximately 2,700 managers and executives around the world in companies involved in mining exploration, development, and other related activities. The names of potential respondents were compiled from commercially available lists, publicly available membership lists of trade associations, and other sources. Several mining associations also helped publicize the survey.
The survey was conducted from August 30th to November 18th, 2016. A total of 350 responses were received from individuals, of whom 301 completed the full survey and 49 completed part of the survey. As figure 1 illustrates, over half of the respondents (53%) are either the company president or vice-president, and a further 28% are either managers or senior managers. The companies that participated in the survey reported exploration spending of US$2.7 billion in 2016 and US$3.2 billion

Fraser Institute Annual Survey of Mining Companies 2016 • 5
fraserinstitute.org
Figure 1: The Position Survey Respondents Hold in Their Company, 2016
Figure 2: Company Focus as Indicated by Respondents, 2016
An exploration company51%
A producer company with less than US$50M
9%
A producer company with more than US$50M
18%
A consulting company12%
Other 10%
Company president40%
Vice president13%
Manager19%
Other Senior Management9%
Consultant8%
Other 11%

6 • Fraser Institute Annual Survey of Mining Companies 2016
fraserinstitute.org
in 2015. This represents an increase from the 2015 Survey of Mining Companies (where exploration spending of US$2.2 billion in 2015 and US$2.5 billion in 2014 was reported), and could possibly be a sign that the previous trend of decreases in exploration spending year after year, likely due to a downturn in commodity prices, is softening or coming to an end.
Figure 2 shows that slightly over half of the 2016 survey respondents represent an exploration company. Just over a quarter (27 percent) of the respondents represent producer companies, and the final 22 percent is made up of consulting and other companies.
Survey questionnaire
The survey was designed to capture the opinions of managers and executives about the level of investment barriers in jurisdictions with which their companies were familiar. Respondents were asked to indicate how each of the 15 policy factors below influenced company decisions to invest in various jurisdictions.
1 Uncertainty concerning the administration, interpretation, or enforcement of existing regulations;
2 Uncertainty concerning environmental regulations (stability of regulations, consistency and timeliness of regulatory process , regulations not based on science);
3 Regulatory duplication and inconsistencies (includes federal/provincial, federal/state, inter-departmental overlap, etc.);
4 Legal system (legal processes that are fair, transparent, non-corrupt, timely, efficiently administered, etc.)
5 Taxation regime (includes personal, corporate, payroll, capital, and other taxes, and complexity of tax compliance);
6 Uncertainty concerning disputed land claims;
7 Uncertainty concerning what areas will be protected as wilderness, parks, or archeological sites, etc.;
8 Infrastructure (includes access to roads, power availability, etc.);
9 Socioeconomic agreements/community development conditions (includes local purchasing or processing requirements, or supplying social infrastructure such as schools or hospitals, etc.);
10 Trade barriers (tariff and non-tariff barriers, restrictions on profit repatriation, currency restrictions, etc.);
11 Political stability;
Fraser Institute Annual Survey of Mining Companies 2016 • 7
fraserinstitute.org
12 Labor regulations/employment agreements and labor militancy/work disruptions;
13 Quality of the geological database (includes quality and scale of maps, ease of access to information, etc.);
14 Level of security (includes physical security due to the threat of attack by terrorists, criminals, guerrilla groups, etc.);
15 Availability of labor/skills.
Respondents were asked to score only jurisdictions with which they were familiar and only on those policy factors with which they were familiar. The 15 policy questions were unchanged from the 2013 survey. However, two questions that had been included—on the level of corruption (or honesty) and on growing (or lessening) uncertainty in mining policy and implementation—were dropped in 2013 in response to complaints from previous years’ respondents that the survey had become onerously lengthy. Also, those questions were seen to be redundant, or overlap heavily with other questions. For each of the 15 factors, respondents were asked to select one of the following five responses that best described each jurisdiction with which they were familiar:
1 Encourages exploration investment
2 Not a deterrent to exploration investment
3 Is a mild deterrent to exploration investment
4 Is a strong deterrent to exploration investment
5 Would not pursue exploration investment in this region due to this factor
The survey also included questions about the respondents and the type of company they represented, regulatory “horror stories,” examples of “exemplary policy,” mineral potential assuming current regulation and land use restrictions, mineral potential assuming a “best practices” regulatory environment, the weighting of mineral versus policy factors in investment decisions, and investment spending.

fraserinstitute.org
Summary Indexes
Investment Attractiveness Index
The Investment Attractiveness Index (table 1 and figure 3) is a composite index that combines both the Policy Perception Index and results from the Best Practices Mineral Potential Index.3 While it is useful to measure the attractiveness of a jurisdiction based on policy factors such as onerous regulations, taxation levels, the quality of infrastructure, and the other policy related questions respondents answered, the Policy Perception Index alone does not recognize the fact that investment decisions are often sizably based on the pure mineral potential of a jurisdiction. Indeed, as discussed below respondents consistently indicate that roughly 40 percent of their investment decision is determined by policy factors. To get a true sense of which global jurisdictions are attracting investment, mineral potential must also be considered.
This year, as in other years, the index was weighted 40 percent by policy and 60 percent by mineral potential. These ratios are determined from a survey question that asks respondents to rate the relative importance of each factor. In most years, the split is nearly exactly 60 percent mineral and 40 percent policy. This year, the answer was 59.48 percent mineral potential and 40.52 percent policy. We maintain a 60/40 ratio in calculating this index to allow comparability with other years.
The Policy Perception Index (table 2 and figure 4) is used to provide the data on the policy perceptions of various jurisdictions (see below for explanation on how the index is calculated). Meanwhile, the rankings from the Best Practices Mineral Potential Index (table 3 and figure 5), which is based on the percentage of responses for “encourages investment” and a half-weighting of the responses for
“not a deterrent to investment,” is used to provide data on the mineral potential. The relative trends observed over the last five years for the performance of each of the jurisdictions on the Investment Attractiveness Index are detailed in table 1.
A limitation of this index is that it may not provide an accurate measure of the investment attractiveness of a jurisdiction at extremes, or where the 60/40 weighting is unlikely to be stable. For example, extremely bad policy that would virtually confiscate all potential profits, or an environment that would expose workers and managers to high personal risk, would discourage mining activity
3 A best practice environment is one that contains a world class regulatory environment, highly competitive taxation, no political risk or uncertainty, and a fully stable mining regime.

Fraser Institute Annual Survey of Mining Companies 2016 • 9
fraserinstitute.org
Figure 3: Investment Attractiveness Index
0 20 40 60 80 100
Nova ScotiaFrench Guiana
MexicoCalifornia
Burkina FasoAlberta
ColoradoGuyanaRussia
SaltaMaliFiji
New BrunswickChileSpain
NorwayPortugalMontana
PolandEritrea
Northern IrelandNunavutZambia
Democratic Republic of CongoPeru
British ColumbiaMinnesota
MichiganNew Mexico
WyomingGhana
Northwest TerritoriesNorthern Territory
BotswanaOntario
Ivory CoastNewfoundland & Labrador
YukonAlaska
South AustraliaIdahoUtah
QueenslandIreland, Republic of
SwedenArizonaQuebecFinlandNevada
Western AustraliaManitoba
Saskatchewan
0 20 40 60 80 100
JujuyNeuquen
VenezuelaChubut
AfghanistanLa Rioja
MendozaIndia
ZimbabweMozambique
UruguayMalaysia
Dominican RepublicMyanmar
PanamaHonduras
GuatemalaSierra Leone
KenyaHungary
WashingtonBoliviaGreece
MongoliaSouth Sudan
FranceIndonesia
CatamarcaEcuadorBulgaria
South AfricaKazakhstanSanta CruzNicaragua
UgandaRomaniaEthiopia
New ZealandPhilippines
ColombiaTanzania
TurkeyNew South Wales
BrazilSerbia
Papua New GuineaSan JuanVictoria
TasmaniaGreenland
ChinaNamibia

10 • Fraser Institute Annual Survey of Mining Companies 2016
fraserinstitute.org
Table 1: Investment Attractiveness Index
Score Rank
2016 2015 2014 2013 2012 2016 2015 2014 2013 2012
Canada Alberta 68.55 69.71 74.78 78.49 71.87 47/104 34/109 28/122 14/112 27/96
British Columbia 74.15 75.71 74.27 79.02 72.32 27/104 18/109 29/122 13/112 26/96
Manitoba 89.05 75.27 84.14 79.90 73.03 2/104 19/109 5/122 12/112 24/96
New Brunswick 69.45 66.51 77.34 74.38 74.79 40/104 45/109 19/122 26/112 17/96
Newfoundland & Labrador
78.94 73.55 83.27 83.93 74.99 16/104 25/109 8/122 3 /112 16/96
Northwest Territories 75.77 69.48 79.73 76.32 73.62 21/104 35/109 15/122 21/112 21/96
Nova Scotia 66.80 59.51 66.27 65.25 60.35 52/104 59/109 49/122 46/112 46/96
Nunavut 72.52 74.37 73.23 75.12 73.38 31/104 23/109 34/122 25/112 23/96
Ontario 78.65 78.02 76.05 78.13 77.73 18/104 15/109 23/122 16/112 12/96
Quebec 85.02 80.80 81.51 75.21 77.05 6/104 8/109 10/122 24/112 13/96
Saskatchewan 89.91 85.73 86.27 82.36 81.70 1/104 2/109 2/122 6/112 5/96
Yukon 79.61 79.16 83.68 81.39 84.12 15/104 12/109 6/122 8/112 1/96
United States
Alaska 80.27 83.96 81.28 82.38 80.13 14/104 6/109 12/122 5/112 7/96
Arizona 84.91 76.33 80.59 77.42 73.46 7/104 17/109 13/122 17/112 22/96
California 67.81 59.26 61.95 58.09 51.92 49/104 61/109 57/122 66/112 69/96
Colorado 68.85 72.28 71.43 65.75 61.72 46/104 28/109 39/122 43/112 44/96
Idaho 81.34 64.44 81.33 73.44 66.47 12/104 50/109 11/122 27/112 34/96
Michigan 74.38 73.10 72.44 71.89 58.10 25/104 27/109 37/122 29/112 56/96
Minnesota 74.18 74.46 76.69 66.84 60.20 26/104 21/109 20/122 39/112 48/96
Montana 71.16 68.27 73.25 68.23 64.15 35/104 40/109 33/122 37/112 37/96
Nevada 87.48 85.39 88.38 87.47 82.68 4/104 3/109 1/122 1/112 2/96
New Mexico 75.03 60.95 72.50 64.90 59.55 24/104 58/109 36/122 48/112 50/96
Utah 81.39 80.31 79.68 80.22 75.72 11/104 9/109 18/122 11/112 15/96
Washington 48.58 66.13 55.57 56.35 48.72 84/104 46/109 79/122 70/112 78/96
Wyoming 75.26 78.07 83.54 78.35 79.79 23/104 14/109 7/122 15/112 8/96
Australia New South Wales 61.84 68.83 62.40 68.57 60.57 62/104 38/109 55/122 36/112 45/96
Northern Territory 77.61 81.90 73.89 76.49 74.48 20/104 7/109 31/122 19/112 19/96
Queensland 81.40 77.79 76.24 76.33 74.01 10/104 16/109 22/122 20/112 20/96
South Australia 81.03 79.83 79.71 75.97 74.73 13/104 10/109 16/122 23/112 18/96
Tasmania 64.27 71.34 66.43 65.71 54.40 56/104 30/109 46/122 44/112 66/96
Victoria 63.96 59.16 58.04 63.87 54.41 57/104 62/109 69/122 51/112 65/96
Western Australia 88.88 87.35 84.33 86.88 80.20 3/104 1/109 4/122 2/112 6/96
Oceania Fiji* 69.43 53.87 65.70 49.69 ** 41/104 79/109 50/122 87/112 **
Indonesia 50.16 65.16 55.24 58.01 61.96 78/104 49/109 81/122 67/112 43/96
Malaysia* 42.80 54.44 32.47 60.12 ** 93/104 76/109 121/122 58/112 **
New Zealand 57.47 66.73 66.38 65.85 60.22 67/104 44/109 48/122 41/112 47/96
Papua New Guinea 63.48 67.15 61.92 63.64 66.62 59/104 43/109 58/122 52/112 33/96
Philippines 58.97 56.59 48.78 64.54 59.36 66/104 72/109 95/122 49/112 51/96
Fraser Institute Annual Survey of Mining Companies 2016 • 11
fraserinstitute.org
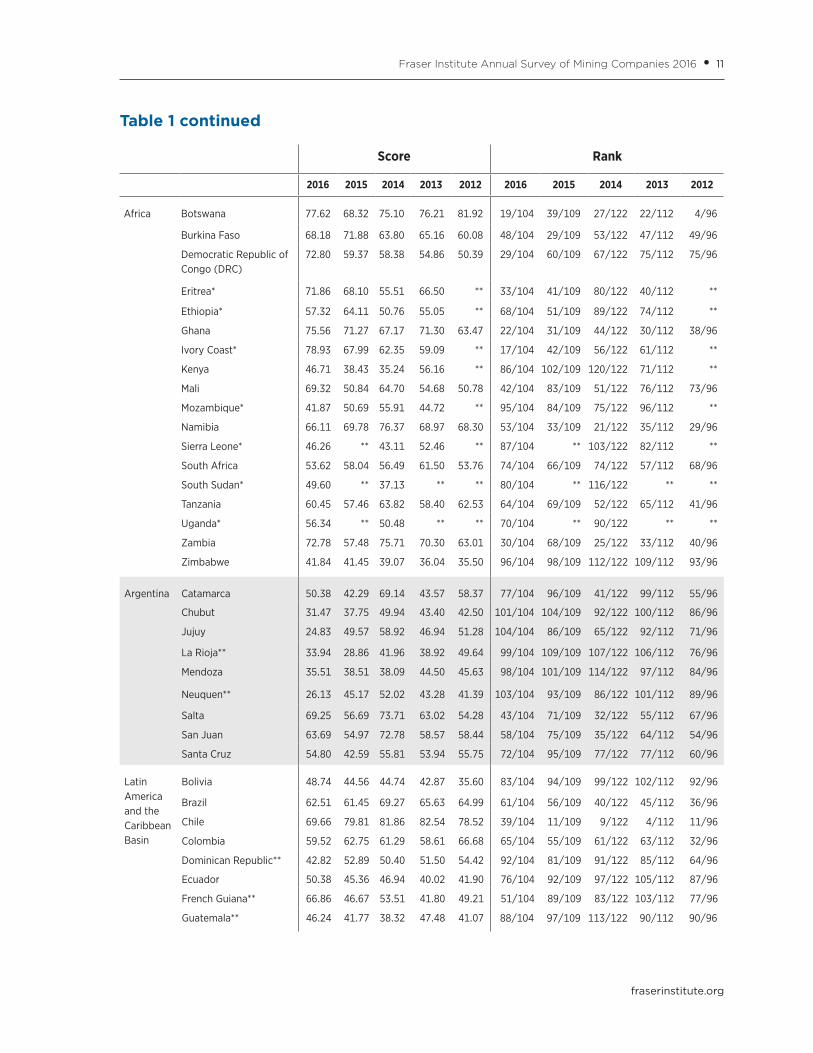
Table 1 continued
Score Rank
2016 2015 2014 2013 2012 2016 2015 2014 2013 2012
Africa Botswana 77.62 68.32 75.10 76.21 81.92 19/104 39/109 27/122 22/112 4/96
Burkina Faso 68.18 71.88 63.80 65.16 60.08 48/104 29/109 53/122 47/112 49/96
Democratic Republic of Congo (DRC)
72.80 59.37 58.38 54.86 50.39 29/104 60/109 67/122 75/112 75/96
Eritrea* 71.86 68.10 55.51 66.50 ** 33/104 41/109 80/122 40/112 **
Ethiopia* 57.32 64.11 50.76 55.05 ** 68/104 51/109 89/122 74/112 **
Ghana 75.56 71.27 67.17 71.30 63.47 22/104 31/109 44/122 30/112 38/96
Ivory Coast* 78.93 67.99 62.35 59.09 ** 17/104 42/109 56/122 61/112 **
Kenya 46.71 38.43 35.24 56.16 ** 86/104 102/109 120/122 71/112 **
Mali 69.32 50.84 64.70 54.68 50.78 42/104 83/109 51/122 76/112 73/96
Mozambique* 41.87 50.69 55.91 44.72 ** 95/104 84/109 75/122 96/112 **
Namibia 66.11 69.78 76.37 68.97 68.30 53/104 33/109 21/122 35/112 29/96
Sierra Leone* 46.26 ** 43.11 52.46 ** 87/104 ** 103/122 82/112 **
South Africa 53.62 58.04 56.49 61.50 53.76 74/104 66/109 74/122 57/112 68/96
South Sudan* 49.60 ** 37.13 ** ** 80/104 ** 116/122 ** **
Tanzania 60.45 57.46 63.82 58.40 62.53 64/104 69/109 52/122 65/112 41/96
Uganda* 56.34 ** 50.48 ** ** 70/104 ** 90/122 ** **
Zambia 72.78 57.48 75.71 70.30 63.01 30/104 68/109 25/122 33/112 40/96
Zimbabwe 41.84 41.45 39.07 36.04 35.50 96/104 98/109 112/122 109/112 93/96
Argentina Catamarca 50.38 42.29 69.14 43.57 58.37 77/104 96/109 41/122 99/112 55/96
Chubut 31.47 37.75 49.94 43.40 42.50 101/104 104/109 92/122 100/112 86/96
Jujuy 24.83 49.57 58.92 46.94 51.28 104/104 86/109 65/122 92/112 71/96
La Rioja** 33.94 28.86 41.96 38.92 49.64 99/104 109/109 107/122 106/112 76/96
Mendoza 35.51 38.51 38.09 44.50 45.63 98/104 101/109 114/122 97/112 84/96
Neuquen** 26.13 45.17 52.02 43.28 41.39 103/104 93/109 86/122 101/112 89/96
Salta 69.25 56.69 73.71 63.02 54.28 43/104 71/109 32/122 55/112 67/96
San Juan 63.69 54.97 72.78 58.57 58.44 58/104 75/109 35/122 64/112 54/96
Santa Cruz 54.80 42.59 55.81 53.94 55.75 72/104 95/109 77/122 77/112 60/96
Latin America and the Caribbean Basin
Bolivia 48.74 44.56 44.74 42.87 35.60 83/104 94/109 99/122 102/112 92/96
Brazil 62.51 61.45 69.27 65.63 64.99 61/104 56/109 40/122 45/112 36/96
Chile 69.66 79.81 81.86 82.54 78.52 39/104 11/109 9/122 4/112 11/96
Colombia 59.52 62.75 61.29 58.61 66.68 65/104 55/109 61/122 63/112 32/96
Dominican Republic** 42.82 52.89 50.40 51.50 54.42 92/104 81/109 91/122 85/112 64/96
Ecuador 50.38 45.36 46.94 40.02 41.90 76/104 92/109 97/122 105/112 87/96
French Guiana** 66.86 46.67 53.51 41.80 49.21 51/104 89/109 83/122 103/112 77/96
Guatemala** 46.24 41.77 38.32 47.48 41.07 88/104 97/109 113/122 90/112 90/96

12 • Fraser Institute Annual Survey of Mining Companies 2016
fraserinstitute.org
Table 1 continued
Score Rank
2016 2015 2014 2013 2012 2016 2015 2014 2013 2012
Latin America and the Caribbean Basin (cont.)
Guyana* 68.97 50.91 66.38 55.79 58.82 45/104 82/109 47/122 72/112 52/96
Honduras* 45.57 35.36 38.08 36.72 30.24 89/104 107/109 115/122 108/112 95/96
Mexico 67.06 68.93 75.96 71.05 72.69 50/104 37/109 24/122 31/112 25/96
Nicaragua 55.02 58.38 63.28 50.32 ** 71/104 65/109 54/122 86/112 **
Panama* 45.20 55.09 61.13 59.99 50.56 90/104 74/109 62/122 59/112 74/96
Peru 73.47 69.26 75.35 69.85 63.23 28/104 36/109 26/122 34/112 39/96
Uruguay* 42.08 39.39 54.33 31.76 ** 94/104 99/109 82/122 111/112 **
Venezuela 27.86 31.88 31.80 24.27 27.60 102/104 108/109 122/122 112/112 96/96
Asia Afghanistan* 33.11 ** ** ** ** 100/104 ** ** ** **
China 65.13 58.49 48.89 58.69 54.50 54/104 64/109 94/122 62/112 63/96
India* 39.11 55.47 58.26 52.13 58.69 97/104 73/109 68/122 84/112 53/96
Kazakhstan* 54.08 74.66 50.84 63.45 62.50 73/104 20/109 88/122 53/112 42/96
Mongolia 49.42 50.03 49.22 53.25 67.04 81/104 85/109 93/122 80/112 31/96
Myanmar* 44.47 48.92 61.70 53.32 ** 91/104 87/109 60/122 79/112 *
Europe Bulgaria 51.31 58.54 42.77 56.55 46.43 75/104 63/109 104/122 69/112 83/96
Finland 85.56 84.00 85.70 81.23 82.00 5/104 5/109 3/122 10/112 3/96
France* 50.10 53.41 61.78 59.82 ** 79/104 80/109 59/122 60/112 **
Greenland 64.63 73.43 68.58 81.72 79.60 55/104 26/109 42/122 7/112 9/96
Greece* 48.77 35.43 42.39 48.90 30.34 82/104 106/109 106/122 88/112 94/96
Hungary* 47.41 ** 39.59 ** ** 85/104 ** 111/122 ** **
Ireland, Republic of 83.13 85.00 80.20 76.57 65.60 9/104 4/109 14/122 18/112 35/96
Northern Ireland 72.41 ** ** ** ** 32/104 ** ** ** **
Norway 70.59 70.68 67.99 70.53 69.91 37/104 32/109 43/122 32/112 28/96
Poland 71.34 61.37 58.03 65.84 46.76 34/104 57/109 70/122 42/112 82/96
Portugal 70.86 74.40 71.51 62.84 ** 36/104 22/109 38/122 56/112 **
Romania 56.57 57.76 43.98 43.58 43.94 69/104 67/109 101/122 98/112 85/96
Russia* 69.02 65.86 60.14 52.35 57.20 44/104 47/109 64/122 83/112 58/96
Serbia 62.54 63.20 58.74 63.21 67.46 60/104 53/109 66/122 54/112 30/96
Spain 70.39 65.41 56.75 67.01 55.69 38/104 48/109 72/122 38/112 61/96
Sweden 84.26 78.58 79.70 81.29 79.40 8/104 13/109 17/122 9/112 10/96
Turkey 60.67 64.04 56.71 72.77 76.12 63/104 52/109 73/122 28/112 14/96
Notes:
* Between 5 and 9 responses
** Not Available

Fraser Institute Annual Survey of Mining Companies 2016 • 13
fraserinstitute.org
regardless of mineral potential. In this case, mineral potential—far from having a 60 percent weight—might carry very little weight. There is also an issue when poor policies lead to a reduction in the knowledge of mineral potential, thereby affecting the responses of potential investors.
Policy Perception Index (PPI): An assessment of the attractiveness of mining policies
While geologic and economic evaluations are always requirements for exploration, in today’s globally competitive economy where mining companies may be examining properties located on different continents, a region’s policy climate has taken on increased importance in attracting and winning investment. The Policy Perception Index, or PPI (see table 2 and figure 4), provides a comprehensive assessment of the attractiveness of mining policies in a jurisdiction, and can serve as a report card to governments on how attractive their policies are from the point of view of an exploration manager. In previous survey years, we have referred to this index as the Policy Potential Index. However, we feel that Policy Perception Index more accurately reflects the nature of this index.
The Policy Perception Index is a composite index that captures the opinions of managers and executives on the effects of policies in jurisdictions with which they are familiar. All survey policy questions (i.e., uncertainty concerning the administration, interpretation, and enforcement of existing regulations; environmental regulations; regulatory duplication and inconsistencies; taxation; uncertainty concerning disputed land claims and protected areas; infrastructure; socioeconomic agreements; political stability; labor issues; geological database; and security) are included in its calculation.
This year we continued the use of the methodology first used to calculate the PPI in 2015. The methodology differs from that of previous years in that it considers answers in all five response categories4, as well as how far a jurisdiction’s score is from the average. To calculate the PPI, a score for each jurisdiction is estimated for all 15 policy factors by calculating each jurisdiction’s average response. This score is then standardized using a common technique, where the average response is subtracted from each jurisdiction’s score on each of the policy factors and then divided by the standard deviation. A jurisdiction’s scores on each of the 15 policy variables are then added up to generate a final, standardized PPI score. That score is then normalized using the formula
The jurisdiction with the most attractive policies receives a score of 100 and the jurisdiction with the policies that pose the greatest barriers to investment receives a score of 0.
4 The methodology used previously only considered responses in the “encourages investment” category..
Vmax – Vi x 100 Vmax – Vmin

14 • Fraser Institute Annual Survey of Mining Companies 2016
fraserinstitute.org
Table 2: Policy Perception Index
Score Rank
2016 2015 2014 2013 2012 2016 2015 2014 2013 2012
Canada Alberta 83.89 92.24 93.95 97.15 94.17 28/104 7/109 7/122 3 /112 5/96
British Columbia 76.57 75.28 70.18 78.07 72.80 41/104 41/109 54/122 42/112 39/96
Manitoba 96.62 88.90 88.84 82.89 79.07 6/104 13/109 15/122 26/112 26/96
New Brunswick 94.21 91.27 95.85 96.93 96.98 8/104 9/109 3/122 5/112 3/96
Newfoundland & Labrador
89.01 88.24 94.17 92.75 85.46 18/104 15/109 6/122 9/112 15/96
Northwest Territories 72.77 64.46 73.33 74.03 74.55 48/104 58/109 47/122 47/112 37/96
Nova Scotia 91.99 87.85 93.68 88.20 90.87 11/104 17/109 8/122 16/112 11/96
Nunavut 68.80 68.85 72.07 75.90 72.45 58/104 54/109 51/122 46/112 40/96
Ontario 84.69 79.48 76.12 79.30 81.83 26/104 31/109 36/122 33/112 23/96
Quebec 89.82 85.02 83.78 78.37 83.13 17/104 22/109 20/122 39/112 21/96
Saskatchewan 98.87 95.10 95.67 92.43 93.26 2/104 4/109 5/122 10/112 8/96
Yukon 84.81 76.66 78.70 85.13 88.79 25/104 39/109 32/122 24/112 13/96
United States
Alaska 85.42 84.89 75.70 80.99 83.33 23/104 23/109 38/122 29/112 20/96
Arizona 90.64 87.88 84.48 88.78 81.65 14/104 16/109 18/122 14/112 24/96
California 57.04 63.48 60.36 62.57 53.30 74/104 59/109 73/122 68/112 65/96
Colorado 73.02 78.06 79.57 78.20 70.31 47/104 36/109 29/122 41/112 44/96
Idaho 90.86 86.10 83.32 85.64 82.18 13/104 19/109 21/122 22/112 22/96
Michigan 90.49 87.75 80.60 86.57 77.76 15/104 18/109 27/122 18/112 29/96
Minnesota 78.31 82.30 80.72 87.67 75.50 37/104 28/109 26/122 17/112 34/96
Montana 71.16 77.58 73.63 78.78 71.89 52/104 37/109 46/122 36/112 41/96
Nevada 97.64 94.07 91.95 95.97 92.70 5/104 6/109 10/122 7/112 9/96
New Mexico 81.89 77.37 79.25 79.37 75.37 30/104 38/109 31/122 32/112 35/96
Utah 88.09 89.47 88.20 90.08 93.30 20/104 11/109 16/122 11/112 7/96
Washington 63.13 75.32 62.43 69.48 66.30 67/104 40/109 70/122 54/112 52/96
Wyoming 94.40 97.09 93.35 96.95 95.97 7/104 2/109 9/122 4/112 4/96
Australia New South Wales 63.91 69.12 75.01 78.49 77.93 66/104 51/109 41/122 37/112 27/96
Northern Territory 85.70 85.15 82.72 86.22 84.20 22/104 21/109 23/122 20/112 17/96
Queensland 78.50 79.19 78.10 81.40 77.02 36/104 32/109 33/122 28/112 32/96
South Australia 87.05 85.50 86.78 88.30 83.33 21/104 20/109 17/122 15/112 19/96
Tasmania 81.51 78.34 73.08 78.99 67.01 32/104 34/109 49/122 34/112 51/96
Victoria 73.80 72.91 76.09 79.64 76.03 42/104 43/109 37/122 31/112 33/96
Western Australia 93.20 91.53 90.83 94.19 85.00 9/104 8/109 12/122 8/112 16/96
Oceania Fiji* 73.57 69.06 71.26 64.22 ** 44/104 53/109 53/122 63/112 **
Indonesia 29.93 40.41 34.60 35.90 36.39 99/104 91/109 110/122 106/112 88/96
Malaysia* 69.51 61.10 51.19 70.28 ** 55/104 64/109 90/122 53/112 **
New Zealand 77.51 79.83 77.45 83.26 81.55 39/104 30/109 35/122 25/112 25/96
Papua New Guinea 47.99 51.96 49.81 43.37 48.06 83/104 77/109 93/122 96/112 72/96
Philippines 28.68 41.48 33.46 42.41 37.40 100/104 89/109 113/122 99/112 86/96

Fraser Institute Annual Survey of Mining Companies 2016 • 15
fraserinstitute.org
Table 2 continued
Score Rank
2016 2015 2014 2013 2012 2016 2015 2014 2013 2012
Africa Botswana 91.79 88.29 90.26 89.05 92.29 12/104 14/109 14/122 12/112 10/96
Burkina Faso 72.37 71.90 75.50 78.22 67.69 51/104 44/109 39/122 40/112 48/96
Democratic Republic of Congo (DRC)
60.58 42.74 40.95 33.43 20.98 70/104 87/109 105/122 107/112 93/96
Eritrea* 72.50 73.81 59.28 72.50 ** 49/104 42/109 76/122 48/112 **
Ethiopia* 53.29 70.27 51.89 62.56 ** 79/104 48/109 87/122 69/112 **
Ghana 81.76 69.09 74.93 77.60 71.67 31/104 52/109 42/122 43/112 42/96
Ivory Coast* 77.33 62.84 65.87 58.40 ** 40/104 60/109 64/122 74/112 **
Kenya 55.40 46.08 53.61 59.54 ** 76/104 84/109 85/122 72/112 **
Mali 65.48 60.86 65.76 57.21 54.94 61/104 65/109 65/122 77/112 64/96
Mozambique* 59.66 51.72 57.27 57.58 ** 72/104 79/109 80/122 75/112 **
Namibia 77.77 80.70 84.44 81.52 77.76 38/104 29/109 19/122 27/112 30/96
Sierra Leone* 51.36 ** 53.78 56.14 ** 80/104 ** 84/122 79/112 **
South Africa 47.50 51.91 54.24 56.85 48.90 84/104 78/109 83/122 78/112 70/96
South Sudan* 33.99 ** 17.82 ** ** 97/104 ** 120/122 ** **
Tanzania 66.13 62.12 69.56 62.67 55.83 59/104 63/109 56/122 67/112 62/96
Uganda* 65.86 ** 64.69 ** ** 60/104 ** 66/122 ** **
Zambia 73.61 62.69 75.28 72.33 67.51 43/104 61/109 40/122 49/112 50/96
Zimbabwe 18.06 24.67 13.68 17.71 10.75 102/104 106/109 121/122 111/112 95/96
Argentina Catamarca 59.28 44.35 60.35 48.24 60.43 73/104 85/109 74/122 92/112 60/96
Chubut 31.79 25.13 34.86 37.26 34.26 98/104 105/109 109/122 104/112 89/96
Jujuy 37.07 42.68 54.31 60.29 41.20 93/104 88/109 82/122 71/112 80/96
La Rioja** 37.96 22.15 37.40 39.99 40.10 92/104 107/109 108/122 101/112 81/96
Mendoza 34.23 35.56 27.72 43.24 39.07 96/104 98/109 117/122 98/112 83/96
Neuquen** 50.33 25.43 49.05 49.32 49.48 81/104 104/109 95/122 88/112 69/96
Salta 83.13 62.30 73.28 68.08 62.20 29/104 62/109 48/122 55/112 57/96
San Juan 73.50 53.61 67.94 58.91 60.60 46/104 72/109 60/122 73/112 58/96
Santa Cruz 62.00 40.86 42.02 47.78 46.37 69/104 90/109 103/122 94/112 75/96
Latin America and the Caribbean Basin
Bolivia 42.16 36.40 29.34 22.27 15.50 87/104 95/109 115/122 110/112 94/96
Brazil 64.97 56.57 59.17 63.65 64.98 64/104 69/109 77/122 65/112 53/96
Chile 78.68 83.50 83.16 85.89 83.80 35/104 26/109 22/122 21/112 18/96
Colombia 45.68 53.75 57.23 50.53 60.19 86/104 70/109 81/122 87/112 61/96
Dominican Republic** 62.04 65.55 50.99 60.35 70.06 68/104 57/109 91/122 70/112 45/96
Ecuador 34.28 43.41 27.36 23.54 23.74 95/104 86/109 118/122 108/112 92/96
French Guiana** 79.64 52.39 58.79 67.08 67.53 34/104 74/109 78/122 57/112 49/96
Guatemala** 40.59 46.09 47.79 48.35 36.66 89/104 83/109 98/122 91/112 87/96

16 • Fraser Institute Annual Survey of Mining Companies 2016
fraserinstitute.org
Table 2 continued
Score Rank
2016 2015 2014 2013 2012 2016 2015 2014 2013 2012
Latin America and the Caribbean Basin (cont.)
Guyana* 72.44 59.76 71.45 64.40 64.54 50/104 67/109 52/122 62/112 54/96
Honduras* 49.65 33.86 33.70 43.28 32.10 82/104 100/109 112/122 97/112 90/96
Mexico 69.97 71.14 72.90 71.50 73.72 53/104 47/109 50/122 50/112 38/96
Nicaragua 68.81 53.64 68.20 63.33 ** 57/104 71/109 59/122 66/112 **
Panama* 47.37 57.72 67.32 71.23 63.40 85/104 68/109 61/122 51/112 56/96
Peru 69.54 66.80 68.37 65.29 60.57 54/104 55/109 58/122 60/112 59/96
Uruguay* 55.21 66.33 81.82 67.86 ** 77/104 56/109 25/122 56/112 **
Venezuela 0.00 0.00 0.00 0.00 0.00 104/104 109/109 122/122 112/112 96/96
Asia Afghanistan* 7.78 ** ** ** ** 103/104 ** ** ** **
China 59.71 46.22 42.73 52.30 47.74 71/104 82/109 102/122 85/112 73/96
India* 41.52 47.61 60.16 55.34 43.22 88/104 81/109 75/122 80/112 77/96
Kazakhstan* 38.77 70.00 46.09 57.38 55.75 90/104 50/109 100/122 76/112 63/96
Mongolia 28.08 36.85 28.55 44.02 41.60 101/104 94/109 116/122 95/112 78/96
Myanmar* 36.16 17.31 47.75 40.91 ** 94/104 108/109 99/122 100/112 **
Europe Bulgaria 69.34 71.35 57.44 66.44 68.09 56/104 46/109 79/122 59/112 47/96
Finland 97.64 94.83 98.74 96.81 100.00 4/104 5/109 2/122 6/112 1/96
France* 65.25 70.07 79.45 78.45 ** 62/104 49/109 30/122 38/112 **
Greenland 65.14 83.58 79.94 86.48 88.01 63/104 25/109 28/122 19/112 14/96
Greece* 38.59 38.57 60.97 39.74 38.35 91/104 93/109 72/122 102/112 84/96
Hungary* 73.53 ** 68.97 ** ** 45/104 ** 57/122 ** **
Ireland, Republic of 100.00 100.00 100.00 100.00 93.51 1/104 1/109 1/122 1/112 6/96
Northern Ireland 92.97 ** ** ** ** 10/104 ** ** ** **
Norway 88.98 89.19 90.47 88.88 89.26 19/104 12/109 13/122 13/112 12/96
Poland 84.59 78.43 74.58 78.87 64.39 27/104 33/109 43/122 35/112 55/96
Portugal 90.30 89.56 91.78 85.48 ** 16/104 10/109 11/122 23/112 **
Romania 55.71 52.74 48.44 37.70 46.84 75/104 73/109 96/122 103/112 74/96
Russia* 64.22 52.15 48.36 48.67 45.50 65/104 75/109 97/122 90/112 76/96
Serbia 81.35 83.01 77.84 76.81 71.14 33/104 27/109 34/122 45/112 43/96
Spain 85.18 78.29 74.36 80.00 74.73 24/104 35/109 45/122 30/112 36/96
Sweden 98.15 96.45 95.74 99.65 98.00 3/104 3/109 4/122 2/112 2/96
Turkey 54.61 71.46 69.78 76.85 77.79 78/104 45/109 55/122 44/112 28/96
Notes:
* Between 5 and 9 responses
** Not Available

Fraser Institute Annual Survey of Mining Companies 2016 • 17
fraserinstitute.org
Figure 4: Policy Perception Index
0 20 40 60 80 100
Montana
Burkina Faso
Guyana
Eritrea
Northwest Territories
Colorado
San Juan
Hungary
Fiji
Zambia
Victoria
British Columbia
Ivory Coast
New Zealand
Namibia
Minnesota
Queensland
Chile
French Guiana
Serbia
Tasmania
Ghana
New Mexico
Salta
Alberta
Poland
Ontario
Yukon
Spain
Alaska
Northern Territory
South Australia
Utah
Norway
Newfoundland & Labrador
Quebec
Portugal
Michigan
Arizona
Idaho
Botswana
Nova Scotia
Northern Ireland
Western Australia
New Brunswick
Wyoming
Manitoba
Nevada
Finland
Sweden
Saskatchewan
Ireland, Republic of
0 20 40 60 80 100
Venezuela
Afghanistan
Zimbabwe
Mongolia
Philippines
Indonesia
Chubut
South Sudan
Mendoza
Ecuador
Myanmar
Jujuy
La Rioja
Greece
Kazakhstan
Guatemala
India
Bolivia
Colombia
Panama
South Africa
Papua New Guinea
Honduras
Neuquen
Sierra Leone
Ethiopia
Turkey
Uruguay
Kenya
Romania
California
Catamarca
Mozambique
China
Democratic Republic of Congo
Santa Cruz
Dominican Republic
Washington
New South Wales
Russia*
Brazil
Greenland
France
Mali
Uganda
Tanzania
Nunavut
Nicaragua
Bulgaria
Malaysia
Peru
Mexico

18 • Fraser Institute Annual Survey of Mining Companies 2016
fraserinstitute.org
Best Practices Mineral Potential Index
Figure 5 and table 3 show the mineral potential of jurisdictions, assuming their policies are based on “best practices” (i.e., world class regulatory environment, highly competitive taxation, no political risk or uncertainty, and a fully stable mining regime). In other words, figure 5 represents, in a sense, a jurisdiction’s “pure” mineral potential, since it assumes a “best practices” policy regime.
The “Best Practice Mineral Potential” index ranks the jurisdictions based on which region’s geology “encourages exploration investment” or is “not a deterrent to investment.” Since the “encourages” response expresses a much more positive attitude to investment than “Not a Deterrent,” in calculating these indexes, we give “not a deterrent” half the weight of “encourages.” For example, the “Best Practices Mineral Potential” for Western Australia was calculated by adding the percent of respondents who rated Western Australia’s mineral potential as “encourages investment” (76 percent) with the 20 percent that responded “not a deterrent to investment,” which was half weighted at 10 percent. Thus, Western Australia has a score of 86, taking into account rounding, for 2016. Table 3 provides more precise information and the recent historical record.
A caveat
This survey captures both general and specific knowledge of respondents. A respondent may give an otherwise high-scoring jurisdiction a low mark because of his or her individual experience with a problem there. We do not believe this detracts from the value of the survey. In fact, we have made a particular point of highlighting such differing views in the survey comments and the “What miners are saying” quotes.
It is also important to note that different segments of the mining industry (exploration and development companies, say) face different challenges. Yet many of the challenges the different segments face are similar. This survey is intended to capture the overall view.

Fraser Institute Annual Survey of Mining Companies 2016 • 19
fraserinstitute.org
Figure 5: Best Practices Mineral Potential Index
0% 20% 40% 60% 80% 100%
Wyoming
Poland
Michigan
Chile
Indonesia
Mongolia
Greenland
Kazakhstan
Turkey
Mexico
Burkina Faso
Colorado
Fiji
Guyana
Botswana
China
Colombia
New Mexico
Montana
Eritrea
Ghana
Minnesota
Mali
Ireland, Republic of
Northern Territory
Zambia
Newfoundland and Labrador
Russia
British Columbia
Papua New Guinea
Ontario
Idaho
California
Nunavut
Sweden
Peru
Yukon
Alaska
Utah
South Australia
Finland
Northwest Territories
Philippines
Ivory Coast
Nevada
Democratic Republic of Congo (DRC)
Arizona
Quebec
Queensland
Saskatchewan
Manitoba
Western Australia
0% 20% 40% 60% 80% 100%
Neuquen
Jujuy
Malaysia
Dominican Republic
Hungary
Mozambique
Chubut
La Rioja
Uruguay
Mendoza
India
Washington
Bulgaria
France
Kenya
Sierra Leone
Honduras
Panama
New Zealand
Catamarca
Nicaragua
Venezuela
Serbia
Uganda
Santa Cruz
Guatemala
Myanmar
Nova Scotia
Afghanistan
Tasmania
New Brunswick
Bolivia
Greece
Tanzania
San Juan
Romania
Victoria
South Africa
Zimbabwe
Portugal
Alberta
Namibia
French Guiana
Norway
Northern Ireland
Salta
South Sudan
Ethiopia
New South Wales
Spain
Brazil
Ecuador
EncouragesInvestment
Not aDeterrent toInvestment

20 • Fraser Institute Annual Survey of Mining Companies 2016
fraserinstitute.org
Table 3: Best Practices Mineral Potential Index
Score Rank
2016 2015 2014 2013 2012 2016 2015 2014 2013 2012
Canada Alberta 58.33 54.69 62.07 66.07 57.14 61/104 70/109 53/122 34/112 50/ 96
British Columbia 72.53 76.00 77.08 79.69 71.57 24/104 17/109 14/122 5/112 18/ 96
Manitoba 84.00 66.18 81.11 77.91 68.84 2/104 42/109 5/122 10/112 25/ 96
New Brunswick 52.94 50.00 65.15 59.38 59.76 74/104 78/109 44/122 52/112 44/ 96
Newfoundland & Labrador
72.22 63.75 76.04 78.05 67.69 25/104 48/109 17/122 9/112 29/ 96
Northwest Territories 77.78 72.83 84.44 77.85 72.50 11/104 21/109 4/122 11/112 16/ 96
Nova Scotia 50.00 40.63 47.92 50.00 40.38 76/104 99/109 92/122 78/112 86/ 96
Nunavut 75.00 78.05 73.75 74.66 73.58 18/104 8/109 26/122 15/112 12/ 96
Ontario 74.62 77.04 75.77 77.35 75.00 22/104 13/109 18/122 12/112 8/ 96
Quebec 81.82 77.98 79.72 73.13 72.61 5/104 9/109 9/122 17/112 16/ 96
Saskatchewan 83.93 79.49 79.35 75.64 74.14 3/104 7/109 11/122 14/112 12/ 96
Yukon 76.14 80.83 85.94 78.87 80.77 16/104 4/109 1/122 7/112 2/ 96
United States
Alaska 76.83 83.33 85.09 83.33 78.49 15/104 2/109 3/122 1/112 5/ 96
Arizona 81.08 68.63 77.78 69.89 68.12 6/104 31/109 13/122 25/112 29/ 96
California 75.00 56.45 63.51 55.07 50.81 19/104 65/109 49/122 65/112 63/ 96
Colorado 66.07 68.42 65.12 57.46 55.88 41/104 33/109 45/122 58/112 55/ 96
Idaho 75.00 50.00 80.00 65.31 56.38 20/104 78/109 8/122 36/112 55/ 96
Michigan 63.64 63.33 66.67 62.07 44.74 47/104 49/109 41/122 42/112 75/ 96
Minnesota 71.43 69.23 73.68 52.94 50.00 31/104 28/109 27/122 75/112 64/ 96
Montana 71.15 62.07 72.22 61.22 59.30 34/104 52/109 29/122 45/112 45/ 96
Nevada 80.70 79.61 85.80 81.85 75.56 8/104 6/109 2/122 3/112 7/ 96
New Mexico 70.45 50.00 67.86 55.21 48.65 35/104 78/109 39/122 64/112 67/ 96
Utah 76.92 74.19 74.19 73.64 63.64 14/104 20/109 25/122 16/112 39/ 96
Washington 38.89 60.00 50.00 47.62 36.90 93/104 56/109 83/122 87/112 88/ 96
Wyoming 62.50 65.38 76.79 65.91 69.32 51/104 43/109 16/122 35/112 25/ 96
Australia New South Wales 60.47 68.63 53.92 61.94 48.89 56/104 31/109 77/122 43/112 67/ 96
Northern Territory 72.22 79.73 67.95 70.00 68.18 26/104 5/109 38/122 23/112 29/ 96
Queensland 83.33 76.85 75.00 72.97 71.74 4/104 14/109 19/122 18/112 18/ 96
South Australia 77.03 76.04 74.47 67.74 68.64 13/104 16/109 24/122 29/112 25/ 96
Tasmania 52.78 66.67 62.00 56.90 46.43 75/104 35/109 54/122 60/112 73/ 96
Victoria 57.41 50.00 45.16 53.41 40.00 68/104 78/109 97/122 72/112 86/ 96
Western Australia 86.00 84.56 79.51 82.00 76.50 1/104 1/109 10/122 2/112 6/ 96
Oceania Fiji* 66.67 43.75 61.54 40.00 ** 39/104 93/109 55/122 101/112 **
Indonesia 63.64 81.67 68.06 72.73 78.95 48/104 3/109 37/122 20/112 3/ 96
Malaysia* 25.00 50.00 20.00 53.33 ** 102/104 78/109 121/122 73/112 **
New Zealand 44.12 58.00 59.26 54.29 46.15 86/104 62/109 63/122 68/112 75/ 96
Papua New Guinea 73.81 77.27 70.00 77.14 79.41 23/104 12/109 32/122 13/112 3/ 96
Philippines 79.17 66.67 58.33 79.31 74.32 10/104 35/109 65/122 6/112 12/ 96

Fraser Institute Annual Survey of Mining Companies 2016 • 21
fraserinstitute.org
Table 3 continued
Score Rank
2016 2015 2014 2013 2012 2016 2015 2014 2013 2012
Africa Botswana 68.18 55.00 65.52 67.65 75.00 38/104 69/109 43/122 30/112 8/ 96
Burkina Faso 65.38 71.88 55.77 56.45 54.84 42/104 23/109 72/122 62/112 58/ 96
Democratic Republic of Congo (DRC)
80.95 70.45 68.97 69.12 70.00 7/104 26/109 34/122 26/112 23/ 96
Eritrea* 71.43 64.29 53.13 62.50 ** 32/104 45/109 78/122 40/112 **
Ethiopia* 60.00 60.00 50.00 50.00 ** 57/104 56/109 85/122 80/112 **
Ghana 71.43 72.73 62.50 67.07 57.61 33/104 22/109 51/122 32/112 47/ 96
Ivory Coast* 80.00 71.43 59.52 59.52 ** 9/104 24/109 60/122 50/112 **
Kenya 40.91 33.33 23.08 53.85 ** 90/104 106/109 120/122 71/112 **
Mali 71.88 64.29 63.79 53.03 47.50 29/104 45/109 48/122 74/112 71/ 96
Mozambique* 30.00 50.00 54.17 36.11 ** 99/104 78/109 76/122 105/112 **
Namibia 58.33 62.50 70.37 60.61 61.54 62/104 50/109 31/122 47/112 40/ 96
Sierra Leone* 42.86 ** 36.36 50.00 ** 88/104 ** 111/122 81/112 **
South Africa 57.69 62.12 57.89 64.58 56.56 66/104 51/109 67/122 37/112 50/ 96
South Sudan* 60.00 ** 50.00 ** ** 58/104 ** 87/122 ** **
Tanzania 56.67 54.35 60.00 55.56 67.11 71/104 71/109 57/122 63/112 32/ 96
Uganda* 50.00 ** 41.18 ** ** 77/104 ** 106/122 ** **
Zambia 72.22 54.00 75.00 68.97 60.29 27/104 73/109 20/122 28/112 43/ 96
Zimbabwe 57.69 52.63 56.00 48.28 51.72 67/104 77/109 71/122 85/112 62/ 96
Argentina Catamarca 44.44 40.91 75.00 40.48 57.14 85/104 98/109 21/122 99/112 50/ 96
Chubut 31.25 46.15 59.38 47.50 48.21 97/104 90/109 62/122 88/112 71/ 96
Jujuy 16.67 54.17 61.54 38.10 58.33 103/104 72/109 56/122 104/112 47/ 96
La Rioja** 31.25 33.33 45.00 38.24 55.88 98/104 106/109 99/122 103/112 55/ 96
Mendoza 36.36 40.48 44.12 45.31 50.00 95/104 100/109 102/122 95/112 64/ 96
Neuquen** 10.00 58.33 54.55 39.29 35.71 104/104 60/109 74/122 102/112 90/ 96
Salta 60.00 52.94 73.53 59.62 48.53 59/104 76/109 28/122 49/112 67/ 96
San Juan 57.14 55.88 75.00 58.33 57.32 69/104 68/109 22/122 54/112 50/ 96
Santa Cruz 50.00 43.75 64.71 58.11 61.76 78/104 93/109 46/122 57/112 40/ 96
Latin America and the Caribbean Basin
Bolivia 53.13 50.00 55.00 56.58 48.89 73/104 78/109 73/122 61/112 67/ 96
Brazil 60.87 64.71 75.00 66.98 64.75 54/104 44/109 23/122 33/112 35/ 96
Chile 63.64 77.36 80.36 80.32 75.00 49/104 11/109 6/122 4/112 8/ 96
Colombia 68.75 68.75 63.89 64.04 71.31 36/104 29/109 47/122 38/112 21/ 96
Dominican Republic** 30.00 44.44 50.00 45.65 53.85 100/104 92/109 88/122 94/112 60/ 96
Ecuador 61.11 46.67 60.00 50.96 43.75 53/104 89/109 58/122 77/112 79/ 96
French Guiana** 58.33 42.86 50.00 25.00 37.50 63/104 95/109 89/122 110/112 88/ 96
Guatemala** 50.00 38.89 31.82 46.88 44.44 79/104 103/109 115/122 92/112 78/ 96

22 • Fraser Institute Annual Survey of Mining Companies 2016
fraserinstitute.org
Table 3 continued
Score Rank
2016 2015 2014 2013 2012 2016 2015 2014 2013 2012
Latin America and the Caribbean Basin (cont.)
Guyana* 66.67 45.00 63.33 50.00 55.36 40/104 91/109 50/122 82/112 58/ 96
Honduras* 42.86 36.36 40.91 32.35 29.41 89/104 105/109 107/122 109/112 95/ 96
Mexico 65.12 67.46 77.97 70.73 72.10 43/104 34/109 12/122 22/112 18/ 96
Nicaragua 45.83 61.54 59.09 41.67 ** 84/104 53/109 64/122 97/112 **
Panama* 43.75 53.33 56.25 52.50 41.67 87/104 74/109 68/122 76/112 84/ 96
Peru 76.09 70.90 80.36 72.90 65.20 17/104 25/109 7/122 19/112 35/ 96
Uruguay* 33.33 21.43 35.71 7.69 ** 96/104 109/109 112/122 112/112 **
Venezuela 46.43 53.13 52.17 40.48 45.71 83/104 75/109 82/122 100/112 75/ 96
Asia Afghanistan* 50.00 ** ** ** ** 80/104 ** ** ** **
China 68.75 66.67 52.78 62.90 58.57 37/104 35/109 80/122 39/112 45/ 96
India* 37.50 60.71 56.25 50.00 68.75 94/104 55/109 69/122 83/112 25/ 96
Kazakhstan* 64.29 77.78 54.55 67.50 66.67 45/104 10/109 75/122 31/112 32/ 96
Mongolia 63.64 58.82 62.50 59.46 84.29 50/104 59/109 52/122 51/112 1/ 96
Myanmar* 50.00 70.00 70.83 61.54 ** 81/104 27/109 30/122 44/112 **
Europe Bulgaria 39.29 50.00 33.33 50.00 31.82 92/104 78/109 114/122 84/112 94/ 96
Finland 77.50 76.79 76.92 70.83 69.51 12/104 15/109 15/122 21/112 23/ 96
France* 40.00 42.31 50.00 47.37 ** 91/104 97/109 91/122 90/112 **
Greenland 64.29 66.67 60.00 78.57 74.00 46/104 35/109 59/122 8/112 12/ 96
Greece* 55.56 33.33 30.00 55.00 25.00 72/104 106/109 119/122 66/112 96/ 96
Hungary* 30.00 ** 20.00 ** ** 101/104 ** 122/122 ** **
Ireland, Republic of 71.88 75.00 65.91 60.94 46.51 30/104 17/109 42/122 46/112 73/ 96
Northern Ireland 58.70 ** ** ** ** 60/104 ** ** ** **
Norway 58.33 58.33 52.50 58.33 57.14 64/104 60/109 81/122 55/112 50/ 96
Poland 62.50 50.00 46.88 57.14 34.62 52/104 78/109 94/122 59/112 91/ 96
Portugal 57.89 64.29 58.33 47.73 ** 65/104 45/109 66/122 86/112 **
Romania 57.14 61.11 40.91 47.50 42.00 70/104 54/109 108/122 89/112 84/ 96
Russia* 72.22 75.00 67.86 54.76 65.38 28/104 17/109 40/122 67/112 35/ 96
Serbia 50.00 50.00 45.45 54.17 65.00 82/104 78/109 96/122 70/112 35/ 96
Spain 60.53 56.82 44.74 58.33 42.50 55/104 64/109 100/122 56/112 82/ 96
Sweden 75.00 66.67 68.52 69.05 67.14 21/104 35/109 35/122 27/112 32/ 96
Turkey 64.71 59.09 47.06 70.00 75.00 44/104 58/109 93/122 24/112 8/ 96
Notes:
* Between 5 and 9 responses
** Not Available

fraserinstitute.org
Global Survey Rankings
The top
The top jurisdiction in the world for investment based on the Investment Attractiveness Index is Saskatchewan, which moved up to first from second in 2015 (see table 1). Manitoba moved up into second from 19th in the previous year, after the Canadian province’s investment attractiveness score increased by over 10 points. Western Australia dropped to third, after Saskatchewan displaced it as the most attractive jurisdiction in the world. Nevada dropped from 3rd to 4th this year. Rounding out the top ten are Finland, Quebec, Arizona, Sweden, the Republic of Ireland, and Queensland. In addition to Manitoba, Arizona, Sweden, and Queensland were all outside of the top 10 in the previous year.
For the fourth year in a row, the Republic of Ireland had the highest PPI score of 100. Ireland was followed by Saskatchewan in second, which moved up from 4th in the previous year. Along with Ireland and Saskatchewan the top 10 ranked jurisdictions are Sweden, Finland, Nevada, Manitoba, Wyoming, New Brunswick, Western Australia, and Northern Ireland.
All were in the top 10 last year except for Manitoba and Northern Ireland. Manitoba rose in the rankings from 13th in 2015 to rank 6th, while Northern Ireland was included for the first time this year. Displaced from the top 10 were Alberta, which fell in the rankings from 7th in 2015 to 28th in 2016, and Portugal, which fell from 10th to 16th.
Finland, the Republic of Ireland, Nevada, New Brunswick, Saskatchewan, Sweden, and Wyoming have ranked consistently in the top 10 over the last five surveys. Table 2 illustrates in greater detail the shifts in relative ranking of the policy perceptions of the jurisdictions surveyed.
The bottom
When considering both policy and mineral potential in the Investment Attractiveness Index, the Argentinian province of Jujuy ranks as the least attractive jurisdiction in the world for investment. Jujuy replaced another Argentinian province, La Rioja, as the least attractive jurisdiction in the world. Apart from Jujuy, the bottom 10 jurisdictions in 2016 (beginning with the worst) are Neuquen, Venezuela, Chubut, Afghanistan, La Rioja, Mendoza, India, Zimbabwe, and Mozambique.

24 • Fraser Institute Annual Survey of Mining Companies 2016
fraserinstitute.org
The 10 least attractive jurisdictions for investment based on the PPI rankings (starting with the worst) are Venezuela, Afghanistan, Zimbabwe, Mongolia, Philippines, Indonesia, Chubut, South Sudan, Mendoza, and Ecuador. Venezuela, Zimbabwe, and Chubut were all in the bottom 10 last year. Two out of the 10 lowest-rated jurisdictions based on policy were Argentinian provinces. Displaced from the bottom 10 in 2016 were Myanmar, La Rioja, and Neuquen.

fraserinstitute.org
Global Results
Canada
Canada’s median PPI score remained about the same in 2016 as in 2015, and three Canadian jurisdictions— Saskatchewan (2nd), Manitoba (6th) and New Brunswick (8th)—were ranked in the top 10. When considering how Canadian jurisdictions rank on the Investment Attractiveness Index, Canada continues to perform well, although Australia surpassed Canada in 2015 to become the most attractive region in the world for investment. Three Canadian jurisdictions—Saskatchewan (1st), Manitoba (2nd), and Quebec (6th), are all in the top ten.
Focusing on policy alone (and not overall investment attractiveness), after seeing its score fall significantly in 2014, British Columbia’s PPI score experienced a slight rebound in 2016, indicating that some of the uncertainty in the province might have lessened. British Columbia’s PPI rank remained the same this year, coming in at an overall ranking of 41st. The two policy areas that continue to significantly hamper British Columbia are uncertainty concerning disputed land claims and uncertainty over which areas will be protected. The sum of negative responses for these policy factors was 69 percent and 80 percent of respondents respectively. These scores likely reflect the ongoing tensions in the province over land title issues.5
Alberta saw its score and rank drop the most amongst Canadian jurisdictions this year, moving down from the 7th spot in 2015 to 28th in this year’s survey. This now places Alberta as the fourth lowest ranked jurisdiction in Canada based solely on policy, after being the second highest the previous year. This decline reflects lower scores on the PPI as a great percentage of respondents for Alberta indicated that the following policy factors were “deterring investment”: regulatory duplication and inconsistencies (an increase of 40 percentage points)6, uncertainty concerning protected areas (+30
5 See Ravina Bains (2014), A Real Game Changer: An Analysis of the Supreme Court of Canada Tsilhqot’in Nation v. British Columbia Decision, Fraser Institute; and Ravina Bains (2015), Economic Development in Jeopardy? Implications of the Saik’uz First Nation and Stellat’en First Nation v. Rio Tinto
Decision, Fraser Institute. Both are available at fraserinstitute.org.
6 The numbers in brackets show the difference between the total percentage of respondents that rate a particular policy factor as either a mild deterrent to investment, a strong deterrent to investment, or that they would not pursue investment due to this factor from 2015 to 2016 (i.e., the change in percent-age points).

26 • Fraser Institute Annual Survey of Mining Companies 2016
fraserinstitute.org
points), and uncertainty regarding the administration, interpretation, or enforcement of existing regulations (+21 points), among others.
Two Canadian territories—Northwest Territories and Yukon—saw both their scores and ranks improve significantly. The Northwest Territories experienced the largest improvement in its PPI score of any of Canada’s provinces or territories. The almost 8.5-point improvement helped the Northwest Territories move up from 58th in 2015 to 48th in 2016. Yukon also experienced an improvement of over eight points in its PPI score, which put it into the 25th spot in this year’s survey. Issues surrounding uncertainty from land claims and infrastructure continue to be the chief deterrents to investment in both territories according to miners.
Manitoba also appeared to be more attractive this year, based on the views of miners. The province’s score improved by just under eight points and Manitoba is now ranked as the 6th most attractive jurisdiction in the world based on policy alone. This also marks the 5th straight year of improvement for Manitoba. This year, miners indicated that there was less uncertainty regarding the administration, interpretation, or enforcement of existing regulations (-15 points) and found the province’s taxation regime to be more favourable (-11 points).
This year we also broke out the responses for British Columbia, Ontario, and Quebec according to whether the respondents were primarily explorers or producers. We did this to compare how the
Figure 6: Investment Attractiveness Index—Canada
0 10 20 30 40 50 60 70 80 90 100
Nova Scotia
Alberta
New Brunswick
Nunavut
British Columbia
Northwest Territories
Ontario
Newfoundland & Labrador
Yukon
Quebec
Manitoba
Saskatchewan

Fraser Institute Annual Survey of Mining Companies 2016 • 27
fraserinstitute.org
different types of firms that are engaged in exploration view the policy environment. We selected these three provinces for the comparison because all had more than 10 respondents from each firm type. Table 6 displays the sum of the three “deterrent to investment” categories for the three provinces for explorers and producers. There are a few notable differences.
In general, the results suggest that explorers are much more sensitive to the policy environment, and find it much more of a deterrent than do producers. Explorers particularly indicated that disputed land claims and uncertainty surrounding protected areas is more of a deterrent to investing for them than for producers. For example, in British Columbia, 72 percent of explorers indicated that disputed land claims were deterrent to investment, whereas about 60 percent of producers indicated that this was the case. In Ontario and Quebec, explorer and producer perceptions deviated widely—by almost 20 percentage points—in the area of uncertainty surrounding protected areas. Taxation was one area where producers in all three jurisdictions expressed more concern than explorers. The difference between the two types of firms was largest in British Columbia, where just over 40 percent of producers expressed concerns about the taxation regime, compared to just over 23 percent of explorers.
Table 6: Explorers vs. Producers in British Columbia, Ontario, and Quebec
Areas of Policy British Columbia Ontario Quebec
Explorers Producers Explorers Producers Explorers Producers
Uncertain Existing Regulations 49.0% 36.0% 33.3% 36.3% 19.2% 20.0%
Uncertain Environmental Regulations 68.0% 68.0% 36.7% 34.8% 29.6% 20.0%
Regulatory Duplication 60.9% 50.0% 36.6% 31.8% 37.0% 31.6%
Legal System 23.5% 12.5% 16.1% 22.7% 34.5% 10.5%
Taxation Regime 23.5% 40.9% 25.8% 35.0% 25.9% 31.3%
Disputed Land Claims 72.0% 60.8% 53.3% 52.3% 25.9% 17.6%
Protected Areas 82.0% 72.7% 56.6% 38.1% 40.7% 23.5%
Infrastructure 24.5% 33.4% 23.3% 31.8% 25.9% 11.1%
Socioeconomic Agreements 42.0% 40.9% 23.4% 30.0% 22.2% 17.6%
Trade Barriers 8.0% 0.0% 3.3% 11.8% 11.5% 6.7%
Political Stability 22.0% 9.1% 13.4% 10.0% 33.3% 11.8%
Labour Regulations 26.0% 25.0% 13.3% 33.4% 26.9% 25.0%
Geological Database 5.9% 4.8% 10.0% 16.7% 15.4% 6.7%
Security 4.0% 9.5% 3.3% 5.3% 4.0% 6.3%
Availability of Skills and Labour 10.1% 0.0% 0.0% 10.5% 3.8% 6.3%

28 • Fraser Institute Annual Survey of Mining Companies 2016
fraserinstitute.org
Comments: Canada
The comments in the following section have been edited for length, grammar and spelling, to retain confidentiality, and to clarify meanings.
Alberta
Long delays in getting land use permits closed out; changes to rules/interpretation. —An exploration company, Vice-president
British Columbia
British Columbia has too many conditions and too much red tape and stumbling blocks put in front of you when moving forward for permitting applications for mining.
—An exploration company, Company president
Inconsistencies in the application of regulations between regions are an issue in British Columbia.
—An exploration company, Consultant
Policy that requires higher claim payments to maintain claims has resulted in smaller exploration companies exiting and is acting as a deterrent to investment.
—An exploration company, Company president
Extremely long lead times for final mining project approvals and ongoing extreme uncertainty with respect to unsettled first nations land claims in the province.
—An exploration company, Company president
The “guaranteed” two-month turnaround for exploration permit review is a very good policy. This year we were raising money while waiting for a permit and knowing there was relatively hard deadline for a yes or no provided comfort and clarity on timelines. The condensed time frame also helped with community consultation, as everyone worked a bit harder to find time in their schedules to meet and discuss.
—An exploration company, Company president
Manitoba
Unstated regulations or requirements for permitting that only come up during the permitting process and are not clearly disclosed in advance are a deterrent to investment in the province.
—An exploration company, Vice-president

Fraser Institute Annual Survey of Mining Companies 2016 • 29
fraserinstitute.org
Northwest Territories
Overlapping and conflicting regulatory groups/levels of government; internal conflict between government departments; delays of years and years to close out land use or water permits; large delays in granting of permits and conflicting requirements; lack of transparency in permitting and enforcement all act as deterrents to investment in the Northwest Territories.
—An exploration company, Vice-president
The inability of the government of Northwest Territories to adopt/agree on major infrastructure such as connecting to the southern power grid or building a road into the Slave Geological Region, either of which would greatly reduce the costs of exploration, deters investment in the territory. Power would also reduce the cost of living and attract employees.
—An exploration company, Vice-president
Nunavut
Multiple permitting requirements; large delays in being granted access/water permits; granting of permits that contain conditions which essentially nullify the permit (e.g., ice drilling in the spring that is then blocked by caribou constraints); currently delays of 5 years or more to close out land use permits (both Aboriginal Affairs and Northern Development Canada and Responsible Investment Association) where the appropriate and complete paperwork has been fully filed are all issues deterring investment in Nunavut.
—An exploration company, Vice-president
Ontario
Mining Act amendments, the switch to map staking, a new requirement for exploration permits, etc. are deterrents to investment in the province.
—A producer company with more than US$50M, Vice-president
Building a road or rail to the Ring of Fire would help to encourage investment in the province.
—A producer company with more than US$50M, Company president
Changes to the Ontario Mining Act that allow a company to be a “good corporate citizen” and clean up (or at least partially clean up) potential environmental problems (old fuel caches, camps, debris, etc.) left behind by others without assuming

30 • Fraser Institute Annual Survey of Mining Companies 2016
fraserinstitute.org
liability or responsibility for those sites is a positive step. Other jurisdictions should take note of this.
—An exploration company, Vice-president
Quebec
The uranium moratorium has cost the province investments. —An exploration company, Company president
Saskatchewan
Saskatchewan promotes itself as having a progressive and easily followed permitting process, but when you get right into it, things are not quite so straightforward, both in the process and the related “consultation” requirements with the various native groups.
—An exploration company, Vice-president
In Saskatchewan the policy of staged and set time periods for getting permits is the one that the entire country should adopt.
—An exploration company, Company president
The United States
The United States’ median investment attractiveness score improved slightly this year. The most attractive state to pursue exploration investment in, based on policy factors and mineral potential, is Nevada, which this year ranked as the fourth most attractive jurisdiction in the world.
Based on the region’s median investment attractiveness score, the United States is now the third most attractive region in the world for investment, only slightly behind Canada and Australia. The median PPI score for the United States increased again in 2016. The state with the most attractive policy environment alone is Nevada, which ranked 5th in the world behind the Republic of Ireland, Saskatchewan, Sweden, and Finland. Wyoming (7th) was the only other American state in the top 10.
Idaho and New Mexico were the two US jurisdictions that saw the greatest improvement in their PPI scores. The three areas where Idaho experienced the most improvement were socioeconomic agreements and the geological database (both -10 points), and uncertainty concerning protected areas (-4 points). Survey respondents saw New Mexico as improving in its political stability (-15 points), uncertainty concerning environmental regulations (-14 points), and the availability of labour and skills (-8 points).

Fraser Institute Annual Survey of Mining Companies 2016 • 31
fraserinstitute.org
The score and ranking for Washington State decreased the most amongst US states in 2016. Washington’s PPI ranking dropped from 40/109 last year to 67/104 in 2016. Washington’s survey ratings declined most significantly for uncertainty regarding the administration, interpretation, or enforcement of existing regulations (+25 points), uncertainty concerning environmental regulations (+24 points), and taxation regime (+24 points).
California, the least attractive policy jurisdiction in the US, moved further down in the international rankings in 2016, falling to a rank of 74th, compared to a rank of 59th in 2015.This year, miners expressed greater concerns in the areas of labour regulations (+26 points), the state’s taxation regime (+26 points), and uncertainty concerning protected areas (+23 points).
Comments: United States
The comments in the following section have been edited for length, grammar and spelling, to retain confidentiality, and to clarify meanings.
Figure 7: Investment Attractiveness Index—United States
0 10 20 30 40 50 60 70 80 90 100
Washington
California
Colorado
Montana
Minnesota
Michigan
New Mexico
Wyoming
Alaska
Idaho
Utah
Arizona
Nevada

32 • Fraser Institute Annual Survey of Mining Companies 2016
fraserinstitute.org
Alaska
Availability of the Large Mine Permitting Team to provide guidance helps attract investment to Alaska.
—An exploration company, Manager
Alaska has developed a Geologic Materials Center that now houses core, rock samples, and other data from many decades of work by the United States Geological Survey, Alaska Division of Geological and Geophysical Surveys, and dozens of private companies. This Geologic Materials Center facility has significant excess capacity to house such materials for the future. Explorers can request that specific core and rock samples are assembled into a secure room at the Geologic Materials Center where the explorer will have private access to the materials for as long as he wishes.
—A consulting company, Company president
California
Exploration/mining property was surrounded by a protected area that gradually collapsed right to the borders of the property essentially killing any potential expansion.
—An exploration company, Chief Exploration Officer
Drilling permits are difficult, United States Bureau of Land Management and state of California overlap. Surface mining in California is discouraged.
—An exploration company, Company president
Michigan
State mineral taxation system was simplified in cooperative discussions with industry representatives.
—An exploration company, Other senior management
Minnesota
The governor of Minnesota cancelled mineral permits before a permit was applied for. —An exploration company, Company president
Montana
Montana has banned the use of cyanide. —A producer company with less than US$50M, Company president

Fraser Institute Annual Survey of Mining Companies 2016 • 33
fraserinstitute.org
Utah
Working with the different levels of government in Utah is quick and efficient. —An exploration company, Founder
Australia and Oceania
Australia continues to be a very attractive place to invest in mining. The region as a whole has surpassed Canada and the United States as the most attractive region in the world for investment when both policy and mineral potential are considered. Western Australia was rated to be the most attractive jurisdiction in the region and the third most attractive jurisdiction in the world this year based on its Investment Attractiveness score. Queensland (10th) was also in the top 10 most attractive jurisdictions in which to invest. Only Western Australia appeared in the global top 10 on the PPI, coming in at 9th.
Figure 8: Investment Attractiveness Index—Australia and Oceania
0 10 20 30 40 50 60 70 80 90 100
Malaysia
Indonesia
New Zealand
Philippines
New South Wales
Papua New Guinea
Victoria
Tasmania
Fiji
Northern Territory
South Australia
Queensland
Western Australia

34 • Fraser Institute Annual Survey of Mining Companies 2016
fraserinstitute.org
Two Australian jurisdictions—New South Wales and Queensland—experienced declines in their PPI scores this year. New South Wales saw a large reduction in its score and rank, moving down to 66/104 this year from 51/109 last year as more respondents rated socioeconomic agreements/community development conditions (+22 points), labour regulations (+14 points), and the legal system (+13 points) as discouraging to investment. This is the fifth consecutive year for New South Wales to experience a decline in its rank. Queensland’s ratings also declined this year, but slightly. Its policy ranking decreased from 32nd in 2015 to 36th in 2016, reflecting increasing concern over the legal system (+18 points) and socioeconomic agreements/community development conditions (+17 points). While Queensland’s PPI score decreased, its investment attractiveness score increased this year, moving the state up from 16th in 2015 to 10th in 2016. The increase is driven by a substantial improvement in miners’ views of Queensland’s geology. In fact, this year Queensland is rated as having the 4th most attractive geology in the world.
Oceania continues to have a number of jurisdictions with relatively unattractive investment environments. Two jurisdictions in the region—Indonesia (99th) and the Philippines (100th)—ranked in the bottom 10 of all jurisdictions included in the survey this year based on their PPI scores. While many of Oceania’s jurisdictions struggle when only policy is considered, some, like the Philippines, perform much better when mineral potential is included, indicating that the resource base is the driver behind the overall investment ratings for many of the region’s jurisdictions. This finding indicates that there is considerable room for improvement in Oceania.
New Zealand continues to be the top performer in the region, although its score and rank were slightly lower this year than last, moving the jurisdiction down from 30th in 2015 to 39th in 2016.
The Philippines experienced the largest deterioration within Oceania on its PPI score this year. Its more than 12-point drop placed the Philippines in the bottom 10 globally, at 100/104. Investors indicated increased concern this year over uncertainty regarding the administration, interpretation, or enforcement of existing regulations (+23 points), uncertainty concerning protected areas (+22 points), uncertainty concerning environmental regulations (+17 points). and uncertainty concerning disputed land claims (also +17 points).
Indonesia also saw a large deterioration of over 10 points in its PPI score, leading to a rank of 99th in the world. This year, a higher percentage of respondents indicated that Indonesia’s regulatory duplications and inconsistencies (+20 points), uncertainty concerning protected areas (+16 points), and uncertainty concerning disputed land claims (+15 points), were increasingly deterring investment.

Fraser Institute Annual Survey of Mining Companies 2016 • 35
fraserinstitute.org
Comments: Australia and Oceania
The comments in the following section have been edited for length, grammar and spelling, to retain confidentiality, and to clarify meanings.
New South Wales
The government has instigated a new permitting and regulatory regime for mineral exploration supposedly to streamline and assist explorers. The overall effect has been to slow down and complicate the permitting process.
—An exploration company, Company president
Recent changes in the legislation and regulations in NSW ensure that paperwork has increased over 10-fold—mindless form filling is required and the bureaucrats do not understand any of it and are not trained correctly. There is no response to documents that you lodge—you have to follow up on the phone—when someone deigns to answer. License documents are issued with mistakes.
—A consulting company, Consultant
South Australia
The push to renewable energy without transitional arrangements has led to a power price crisis that is deterring investment in South Australia.
—A producer company with less than US$50M, Company president
South Australia has a can-do attitude towards exploration and mining. The state has an objective to make SA a world producer in copper and uranium.
—A consulting company, Consultant
Western Australia
Western Australia has fast tracking and real-time monitoring of applications. —An exploration company, Vice-president
Indonesia
Requirement to process ore in-country and to divest 50% of project within 10 years of commencement of operation is a major deterrent to investment in Indonesia.
—A producer company with more than US$50M, Manager
Government insistence on making metals from all minerals has closed numerous bauxite, nickel, and base metal operations and prevented development of many more.

36 • Fraser Institute Annual Survey of Mining Companies 2016
fraserinstitute.org
The legislation was retrospective and no compensation was paid. —A consulting company, Consultant
Papua New Guinea
The draft Mining Act for PNG has the potential to stop exploration and investment. —An exploration company, Company president
Changing policies and government decisions on exploration and mining leases are often unpredictable.
—An exploration company, Company president
Philippines
Lack of physical security is a deterrent to investment in the country. —A producer company with more than US$50M, Manager
The decision by the new president, Duterte, to ban some open pit mining will hurt the potential for investment in the Philippines.
—An exploration company, Company president
Africa
Africa’s median score on policy factors (PPI) improved this year. This was also the case for the region’s median investment attractiveness score. Africa’s overall investment attractiveness now ranks it ahead of the regions of Oceania, Latin America and the Caribbean, Asia, and Argentina.
Two African countries—Zimbabwe (102nd) and South Sudan (97rd),—ranked in the bottom 10 of the survey rankings this year based on policy. Zimbabwe was also amongst the bottom 10 in the previous five years. Zimbabwe and Mozambique were the only two African jurisdictions in the global bottom 10 based on their overall investment attractiveness.
Botswana is again the highest ranked jurisdiction in Africa on policy factors, ranking 12/104 in 2016, after ranking 14/109 in 2015. Botswana’s slightly higher score on the PPI reflects decreased concerns over labour regulations (-30 points), the availability of labour and skills (-17 points), and infrastructure (-15 points). This year, four African countries—Democratic Republic of Congo (DRC), Ghana, Ivory Coast, and Zambia—experienced improvements of over 10 points each in their PPI scores. The DRC had the largest improvement in Africa based on miners’ perceptions

Fraser Institute Annual Survey of Mining Companies 2016 • 37
fraserinstitute.org
of policy. The DRC’s improvement of over 17 points enabled the country to move up to 70th from 87th place in the previous year. Investors displayed decreased concern this year over socioeconomic agreements/community development conditions (-40 points), political stability (-34 points), and labour regulations (-29 points). Ghana’s more than 12-point improvement and movement from 52nd in 2015 up to 31st this year, places Ghana as the second most attractive jurisdiction in Africa this year based on policy alone. Few investors indicated that political instability (-24 points), the legal system (-23 points), and uncertainty regarding the administration, interpretation, or enforcement of existing regulations (-21 points) were acting as deterrents to investment in the country this year. Zambia (43rd) also saw a large improvement in its PPI score this year, allowing the country to move back into the top 50 countries, after ranking 61st last year. Zambia had large improvements in labour regulations (-29 points) and the availability of labour and skills (-28 points).
Namibia’s score and rank deteriorated for the second straight year. In 2014, Namibia was ranked as the 19th most attractive jurisdiction in the world when only policies were considered. The country fell
Figure 9: Investment Attractiveness Index—Africa
0 10 20 30 40 50 60 70 80 90 100
Zimbabwe
Mozambique
Sierra Leone
Kenya
South Sudan
South Africa
Uganda
Ethiopia
Tanzania
Namibia
Burkina Faso
Mali
Eritrea
Zambia
Democratic Republic of Congo (DRC)
Ghana
Botswana
Ivory Coast

38 • Fraser Institute Annual Survey of Mining Companies 2016
fraserinstitute.org
to 29th in 2015 and dropped again to rank 38th this year. After this year’s decline, Namibia no longer ranks as the second most attractive jurisdiction in Africa based on policy. This year miners expressed increased concern over uncertainty regarding the administration, interpretation, or enforcement of existing regulations (+28 points), the taxation regime (+21 points), and trade barriers (+19 points).
Comments: Africa
The comments in the following section have been edited for length, grammar and spelling, to retain confidentiality, and to clarify meanings.
Botswana
The government has permitted the development of a mine within a large game reserve; multiple land use is possible.
—A consulting company, Consultant
Democratic Republic of Congo
There is corruption on every level in the DRC. —A producer company with more than US$50M, Manager
The 2012 change in the mining law and a genuine attempt to impose transparency and due legal process in disputes was a positive.
—An exploration company, Company president
Kenya
Unilateral cancellation of licenses, punitive fiscal regime that includes a 10% free carry interest to government as well as a mandated requirement to list 20% on the local security exchange, appropriation of assets on termination of mining licenses, etc., are all deterrents to investment in Kenya.
—A producer company with more than US$50M, Manager
Kenya has a flawed legislation in relation to exploration and it is extremely complex. —A producer company with more than US$50M, Manager
Namibia
A draft policy of local “previously disadvantaged” persons is being circulated. It models itself after South Africa which has clearly failed in its broad based objectives. There is

Fraser Institute Annual Survey of Mining Companies 2016 • 39
fraserinstitute.org
great danger to all existing or new companies in Namibia. —A consulting company, Consultant
The Ministry of Mines and Energy has added new conditions to renewals and new mineral licenses. The new conditions are not described in any Act, thus poorly defined and up to the discretion of the Minister. The issue of licenses has thus been delayed severely (months to years).
—An exploration company, Manager
South Africa
Presently before the courts is a decision regarding local ownership in accordance to the existing Black Economic Empowerment (BEE) policy. Once deemed BEE compliant, shareholdings are being sold. Government takes the position that companies must remain BEE compliant by issuing new shares. There is a grave risk to ownership with the government’s track record on passing and then modifying laws to achieve their policy goals. The environment in South Africa is not predictable.
—A consulting company, Consultant
Zimbabwe
The contentious 51% local ownership requirement is a deterrent to investment in Zimbabwe.
—An exploration company, Manager
Argentina, Latin America, and the Caribbean Basin
Argentina’s median investment attractiveness declined by almost seven points this year, a marked decrease over both 2015 and 2014. Argentina continues to rank as the least attractive region in the world for investment. While the median investment attractiveness score deteriorated, the median PPI score for Argentina actually increased in 2016, although Argentina is still the second least attractive region in the world when considering policies only.
Some of Argentina’s provinces are also some of the least attractive jurisdictions in the world. Indeed, two Argentinian provinces—Chubut (98th) and Mendoza (96th)—are in the bottom 10 jurisdictions based on PPI scores. When focusing on Investment Attractiveness scores, five Argentinian provinces also rank in the bottom 10, including both the least and second-least

40 • Fraser Institute Annual Survey of Mining Companies 2016
fraserinstitute.org
attractive jurisdictions in the world. The provinces are Jujuy (104th), Neuquen (103rd), Chubut (101st), La Rioja (99th), and Mendoza (98th).
All but two of the Argentinian provinces saw their PPI scores increase this year. Salta had the second highest increase in its PPI score within Argentina, and the province is now ranked as the most attractive jurisdiction for investment in the country based on perceptions of the policy environment. Salta experienced an over 20-point increase, which resulted in the province’s rank improving from
Figure 10: Investment Attractiveness Index—Argentina, Latin America, and the Caribbean Basin
0 10 20 30 40 50 60 70 80 90 100
Jujuy
Neuquen
Venezuela
Chubut
La Rioja
Mendoza
Uruguay
Dominican Republic
Panama
Honduras
Guatemala
Bolivia
Catamarca
Ecuador
Santa Cruz
Nicaragua
Colombia
Brazil
San Juan
French Guiana
Mexico
Guyana
Salta
Chile
Peru

Fraser Institute Annual Survey of Mining Companies 2016 • 41
fraserinstitute.org
62/109 in 2015 to 29/104 in 2016, as respondents’ ratings showed decreased concern over the taxation regime (-43 points), labour regulations (-33 points), and uncertainty concerning disputed land claims (-33 points). San Juan is another Argentinian jurisdiction which experienced a large increase in its PPI score, moving it up into the top 50 this year, as respondents’ ratings improved for its taxation regime (-45 points), the geological database (-42 points), and uncertainty concerning disputed land claims (-39 points). Catamarca, La Rioja, Neuquen, and Santa Cruz all also saw their scores improve by over 10 points.
In Latin America and the Caribbean Basin, the median investment attractiveness score improved slightly this year, placing the region between Oceania and Asia. Venezuela (102nd) was the only Latin American jurisdiction (other than some of the Argentinian provinces discussed above) to appear in the global bottom 10 based on the country’s investment attractiveness score. When considering overall investment attractiveness (policy and geology), Peru (28th) surpassed Chile this year as the most attractive jurisdiction in Latin America. Chile (39th) was the second most attractive jurisdiction in the region.
Two Latin American countries were also in the bottom 10 jurisdictions based solely on policy (PPI). These were Venezuela, which occupied the least attractive spot in the world, and Ecuador which was the 10th least attractive jurisdiction in the world based on policy. The median PPI score for Latin America and the Caribbean Basin also improved slightly over 2015. Overall, French Guiana (34th), Chile (35th), Guyana (50th), Mexico (53rd), and Peru (54th) are the most attractive jurisdictions in the region for investment based on policy.
Chile is no longer the top-ranked jurisdiction in the region, after ranking 35th overall on the PPI in 2016, down from 26th in the previous year. Respondents indicated they were increasingly concerned over uncertainty concerning protected areas (+23 points), the legal system (+19 points), and the geological database (+17 points) in Chile. Ecuador experienced one of the largest declines in Latin America and the Caribbean this year, and it pushed Ecuador into the bottom 10. Ecuador saw diminished investor perceptions in a number of areas including infrastructure (+22 points), security (+14 points), and labour availability and skills (+10 points).
Nicaragua had one of the greatest improvements in the region this year, moving from 71/109 in 2015 to 57/104 in 2016, with socioeconomic agreements/community development conditions (-31 points), uncertainty concerning protected areas (-31 points), and regulatory duplication and inconsistencies (-21 points) being the areas where the country’s performance improved the most.
Comments on Argentina, Latin America, and the Caribbean Basin
The comments in the following section have been edited for length, grammar and spelling, to retain confidentiality, and to clarify meanings.

42 • Fraser Institute Annual Survey of Mining Companies 2016
fraserinstitute.org
Catamarca
Government misuses royalties. As a result, the people who have a legitimate right to them blame the industry with a consequent loss of social license.
—A consulting company, Company president
Chubut
The disastrous law against open pit mining, and the even more disastrous proposed legislation to allow it, basically caused a complete write-off of millions spent there and continue to deter investment.
—An exploration company, Company president
La Rioja
La Rioja is the most unpredictable jurisdiction in Argentina. Mining authorities are inconsistent and policies often don’t make any sense.
—A consulting company, Company president
Mendoza
Mendoza has instituted a prohibition on open pit mining and cyanide use. —A producer company with more than US$50M, Vice-president
Salta
Salta is a jurisdiction with clear policies that are rigorously enforced to everyone’s benefit. The outcomes of government decisions are predictable and provide a regime of legal security.
—A consulting company, Company president
Bolivia
Permanent threats to foreign investment from high-level authorities like the president and vice-president of the country act as deterrents to investment in the country.
—A producer company with more than US$50M, Company president
Brazil
The granting of exploration licenses was suspended in most states since about two years ago. This set back exploration and ultimately affected the whole company.
—A consulting company, Manager

Fraser Institute Annual Survey of Mining Companies 2016 • 43
fraserinstitute.org
Proposal to change the mining law, royalties, and organization of the mines department has gone nowhere and creates uncertainty that deters investment.
—An exploration company, Vice-president
Guatemala
Political uncertainty in Guatemala is deterring investment. —A producer company with less than US$50M, Company president
Peru
Situations where the government does not enforce established surface access agreements deter future investment in Peru.
—An exploration company, Chief exploration officer
Asia
Asia’s median investment attractiveness deteriorated this year by over seven points. The region overall is now more attractive than only Argentina. China (54th) is the most attractive jurisdiction in the region based on its investment attractiveness rating. China is followed by Kazakhstan, which was rated as the 73rd most attractive jurisdiction in the world based on policy and mineral potential.
Figure 11: Investment Attractiveness Index—Asia
0 20 40 60 80 100
Afghanistan
India
Myanmar
Mongolia
Kazakhstan
China

44 • Fraser Institute Annual Survey of Mining Companies 2016
fraserinstitute.org
While some Asian jurisdictions perform modestly on their overall investment attractiveness, on policy Asia continues to struggle. Indeed, with Argentina’s improvement on this measure in 2016, Asia now has the least attractive policy environment in the world, and it appears that Asia’s median policy is trending downwards. Two Asian countries—Afghanistan and Mongolia—rank in the global bottom 10 on policy. Only one Asian jurisdiction—China—ranked above 80th on policy in 2015.
China, the highest ranked jurisdiction in the region, experienced a large improvement in its PPI score this year, moving up by just under 15 points. This change reflected improvement in the areas of infrastructure (-55 points), socioeconomic agreements/community development conditions (-39 points), and the geological database (-33 points). Only one other Asian jurisdiction—Myanmar—improved this year. In this case it was enough to move Myanmar just out of the bottom 10.
Kazakhstan saw the largest decline in PPI ranking in the region, falling from 50/109 in 2015 to 90/104 in 2016 with negative respondent ratings increasing most significantly for the legal system (+48 points), uncertainty concerning environmental regulations (+37 points), and ), socioeconomic agreements/community development conditions (+28 points). Mongolia’s PPI score also fell in 2015 and its ranking slipped into the bottom 10, reflecting worsening perceptions of respondents for uncertainty concerning disputed land claims (+20 points), uncertainty concerning protected areas (+19 points), and the availability of labour and skills (+11 points).
Europe
Europe’s median investment attractiveness score experienced another increase this year. Europe also has some of the most attractive jurisdictions in the world for investment, including three in the global top 10: Finland (5th), Sweden (8th), and the Republic of Ireland (9th). The lowest ranked European jurisdiction on this measure is Hungary at 85th.
A number of European jurisdictions have relatively attractive policy environments in particular. Republic of Ireland (1st), Sweden (3rd), Finland (4th) and Northern Ireland (10th) all ranked in the global top 10 on policy, the highest number of jurisdictions in any one region. This is also the first year that Northern Ireland has been included as its own jurisdiction. Ireland has been the top-ranked jurisdiction based on policy for the past four years after it displaced Finland. Ireland, Finland, and Sweden have all ranked in the PPI top 10 every year for the last five years. Norway (12th) is also a consistent top performer in the survey, appearing in the top 20 in each of the last five years.

Fraser Institute Annual Survey of Mining Companies 2016 • 45
fraserinstitute.org
Spain saw its ranking increase by more than 10 spots this year, moving up from 35/109 in 2015 to 24/104 in 2016, with improved ratings from respondents for uncertainty concerning environmental regulations (-22 points), uncertainty concerning the administration, interpretation, or enforcement of existing regulations (-19 points), and the legal system (-19 points). Poland, which ranked 55th in 2012, has improved in four of the last five years, moving up from 33/109 in 2015 to 27/104 this year, with a higher PPI score reflective of improved perceptions of the geological database (-25 points), socioeconomic agreements/community development conditions (-17 points), and trade barriers (-16 points).
Greenland had the greatest decrease in both score and rank in the region, moving down to 63/104 in 2016 from 25/109 in 2015, reflecting poorer respondent ratings for its taxation regime (+43 points), labour regulations (+36 points), and political stability (+28 points). Turkey also experienced a large
Figure 12: Investment Attractiveness Index—Europe
0 10 20 30 40 50 60 70 80 90 100
Hungary
Greece
France
Bulgaria
Romania
Turkey
Serbia
Greenland
Russia
Spain
Norway
Portugal
Poland
Northern Ireland
Ireland, Republic of
Sweden
Finland

46 • Fraser Institute Annual Survey of Mining Companies 2016
fraserinstitute.org
decline in both its rank and score this year. Turkey’s more than 16-point drop in its PPI score led to a rank of 78/104 in 2016, down from 45/109 in 2015. Investors expressed greater concern over political stability (+31 points), uncertainty concerning the administration, interpretation, or enforcement of existing regulations (+31 points), and the taxation regime (+25 points).
Comments on Europe
The comments in the following section have been edited for length, grammar and spelling, to retain confidentiality, and to clarify meanings.
Finland
[There has been a] delay in renewing an exploration permit for more than four years due to internal government disputes after the promulgation of the new mining code.
—A producer company with more than US$50M, Vice-president
Republic of Ireland
Clear transparent process for license application and security of tenure with no risk of claim jumping. Excellent open file system with access to old exploration data eliminates duplication of efforts.
—A consulting company, Consultant
The Republic of Ireland is a pragmatic and pro-exploration jurisdiction staffed by individuals with a keen interest in promoting and developing exploration and mining in the country.
—An exploration company, Manager
Poland
Poland has established a regulatory regime for mineral exploration and development, which is precise, has well defined time frames, well defined requirements, and is easy to understand. This is an encouragement to investment.
—A producer company with more than US$50M, Executive Chairman
Serbia
Serbia introduced a revised mining law in late 2015 which is modelled on the widely accepted best practices of Finland and Sweden. This new law sent a strong signal to the mining community and played a role in our recent significant investment in the country.
—A producer company with more than US$50M, Other senior management

Fraser Institute Annual Survey of Mining Companies 2016 • 47
fraserinstitute.org
Sweden
Sweden has a very transparent system, with excellent access to historic exploration and drill core data.
—An exploration company, Manager
Northern Ireland
The Department for the Economy (Minerals Branch) issues licenses but provides no support for any problems. The government is a coalition and historically individual departments (e.g., Environment, Economy) do not work collectively to encourage mining or exploration investment. Indeed many instances of departments working against each other are observed, with the mining/ exploration company a victim of the process.
—An exploration company, Manager

fraserinstitute.org
Overview
An analysis of the regional trends in the results of the Investment Attractiveness Index (based on both mineral potential and policy factors) from the 2016 mining survey indicates a stark difference between geographical regions; notably the divide between Australia, Canada, and the United States, and the rest of the world. As figure 13 indicates, as a region, Australia continues to surpass both Canada and the United States this year as the most attractive region in the world for investment, although both Canada and the United States gained ground on Australia in 2016. Only two sets of jurisdictions—Argentina and Asia—saw their relative investment attractiveness decrease. Argentina experienced a 16 percent decline in its regional median score from 2015, while Asia experienced a 13 percent decline. Africa experienced the largest improvement, with an 8 percent increase in its regional median investment attractiveness score. In general, the climate for investment appears to be slightly improving.
The regional trend for policy measures (figure 14) is again dominated by certain regions (Canada, the United States, Australia, and Europe). Europe’s presence with the other top performing regions when only policy is considered (not pure mineral potential), indicates that mineral potential is the factor holding Europe back from being in the same category as the three other most attractive regions in the world. Argentina’s median policy score experienced a large increase this year, although, as a whole, the South American country is the second least attractive region in the survey. Of the regions included in the survey, Asia now has the least attractive policy environment. Canada continues to have the most attractive policy environment of all regions.
Also of interest is the difference in results between regional median investment attractiveness and PPI. For example, Argentina’s median investment attractiveness score declined, even while it performed better as a region on the PPI. This indicates that the region’s decline in investment attractiveness is being driven by investors’ views of Argentina’s pure mineral potential and not necessarily policy.
Explanation of the figures
Figures 15 through 29 show the percentage of respondents who rate each policy factor as “encouraging investment” or “not a deterrent to investment: (a “1” or “2” on the scale). Readers will find a breakdown of both negative and positive responses for all areas online at fraserinstitute.org.

Fraser Institute Annual Survey of Mining Companies 2016 • 49
fraserinstitute.org
Figure 14: Regional Median Policy Perception Index Scores 2015 and 2016
Figure 13: Regional Median Investment Attractiveness Scores 2015 and 2016
0
10
20
30
40
50
60
70
80
90
Argentina Asia LatinAmerican
andCaribbean
Oceania Africa Europe United States Canada Australia
2015
2016
0
10
20
30
40
50
60
70
80
90
100
Asia Argentina LatinAmerican
andCaribbean
Oceania Africa Europe Australia UnitedStates
Canada
2015
2016

50 • Fraser Institute Annual Survey of Mining Companies 2016
fraserinstitute.org
Figure 15: Uncertainty Concerning the Administration, Interpretation and Enforcement of Existing Regulations
0% 20% 40% 60% 80% 100%
Northwest TerritoriesNamibia
PolandBritish Columbia
MalaysiaSanta Cruz
EritreaGreenland
GuyanaQueensland
NicaraguaIdaho
MichiganSpain
AlbertaMali
CatamarcaTasmania
Northern IrelandMexico
PeruPortugal
Burkina FasoArizonaOntarioAlaska
TanzaniaUruguay
SaltaUtahChile
FinlandNewfoundland & Labrador
San JuanSouth Australia
QuebecSweden
YukonNorthern Territory
Ireland, Republic ofFiji
WyomingGhana
Nova ScotiaSerbia
NorwayNew Brunswick
Ivory CoastManitoba
SaskatchewanNevada
BotswanaWestern Australia
0% 20% 40% 60% 80% 100%
ChubutAfghanistanPhilippinesZimbabwe
MendozaIndonesia
GreeceVenezuela
IndiaMyanmar
BoliviaMongolia
FranceSouth Africa
EthiopiaCalifornia
New South WalesWashington
ChinaRomaniaEcuador
Sierra LeoneHonduras
La RiojaGuatemala
MontanaColombia
KazakhstanRussia
MinnesotaUgandaTurkey
ColoradoNew Zealand
NunavutVictoria
HungaryBrazil
South SudanFrench Guiana
JujuyKenya
Papua New GuineaDemocratic Republic of Congo
New MexicoMozambique
NeuquenPanamaBulgariaZambia
Dominican Republic
EncouragesInvestment
Not a Deterrentto Investment

Fraser Institute Annual Survey of Mining Companies 2016 • 51
fraserinstitute.org
Figure 16: Uncertainty Concerning Environmental Regulations
0% 20% 40% 60% 80% 100%
HondurasAlberta
MichiganBolivia
FinlandBrazil
ArizonaSierra Leone
SpainIvory Coast
PeruPapua New Guinea
NorwaySerbiaYukon
South SudanFiji
ChileNorthern Territory
Nova ScotiaOntario
UtahNewfoundland and Labrador
PortugalSanta CruzWyoming
MaliTanzania
South AustraliaIreland, Republic of
MexicoQuebec
Democratic Republic of CongoManitoba
New BrunswickSwedenGuyanaNevada
San JuanRussia
Western AustraliaEthiopiaNamibiaUganda
Burkina FasoMozambique
EritreaSalta
MyanmarBotswana
SaskatchewanZambiaGhana
0% 20% 40% 60% 80% 100%
ChubutMendozaLa RiojaGreece
VenezuelaWashington
CaliforniaNew South Wales
NunavutNew Zealand
FrancePhilippines
ColoradoMinnesota
PanamaHungaryMontanaEcuador
MongoliaColombia
PolandBritish Columbia
NeuquenSouth Africa
VictoriaBulgariaRomania
GuatemalaQueensland
Dominican RepublicUruguay
Northwest TerritoriesIndonesia
CatamarcaAfghanistan
IndiaZimbabwe
KazakhstanFrench Guiana
JujuyTurkey
IdahoKenya
NicaraguaAlaskaChina
GreenlandNew Mexico
TasmaniaNorthern Ireland
Malaysia
EncouragesInvestment
Not a Deterrentto Investment

52 • Fraser Institute Annual Survey of Mining Companies 2016
fraserinstitute.org
Figure 17: Regulatory Duplication and Inconsistencies
0% 20% 40% 60% 80% 100%
Democratic Republic of CongoAlaska
New MexicoQueensland
PolandSan Juan
IdahoUruguay
RussiaDominican Republic
MozambiqueUganda
TanzaniaUtah
MichiganTasmania
YukonArizona
PeruNova Scotia
GreenlandSpain
EritreaSerbia
South AustraliaHungary
WyomingBurkina Faso
NicaraguaZambia
ChileQuebec
Northern TerritorySalta
BulgariaSaskatchewan
PortugalNamibiaOntarioMexicoGuyana
ManitobaIvory Coast
MaliNorthern IrelandNew Brunswick
GhanaNevada
Western AustraliaFinlandSweden
BotswanaIreland, Republic of
Norway
0% 20% 40% 60% 80% 100%
Indonesia
Chubut
Neuquen
Mendoza
Greece
Philippines
Zimbabwe
Nunavut
California
Mongolia
La Rioja
Venezuela
Afghanistan
India
China
Ecuador
Myanmar
Jujuy
New South Wales
South Africa
Montana
Washington
Minnesota
Santa Cruz
Catamarca
Kenya
Turkey
French Guiana
Romania
Colorado
New Zealand
Panama
Brazil
Victoria
Colombia
Alberta
Guatemala
Bolivia
France
Malaysia
Sierra Leone
Papua New Guinea
Honduras
Northwest Territories
South Sudan
Fiji
Ethiopia
Newfoundland & Labrador
Kazakhstan
British Columbia
EncouragesInvestment
Not a Deterrent toInvestment

Fraser Institute Annual Survey of Mining Companies 2016 • 53
fraserinstitute.org
Figure 18: Legal System
0% 20% 40% 60% 80% 100%
UruguayFrance
Burkina FasoMontanaZambiaEritrea
French GuianaSerbia
NamibiaChilePeru
FijiQueensland
ColoradoSalta
PortugalIdaho
New MexicoGhana
MinnesotaVictoria
MichiganNew Zealand
San JuanGreenland
SpainNorthwest Territories
British ColumbiaArizonaAlaska
QuebecNunavut
WyomingUtah
YukonNorwayOntarioNevada
South AustraliaNew Brunswick
AlbertaNewfoundland & Labrador
Northern IrelandBotswana
SaskatchewanNorthern Territory
FinlandNova Scotia
ManitobaWestern Australia
Ireland, Republic ofTasmania
Sweden
0% 20% 40% 60% 80% 100%
IndonesiaEthiopia
Dominican RepublicAfghanistanPhilippines
GreeceBolivia
IndiaMalaysia
Sierra LeonePanama
ZimbabweKazakhstanVenezuela
South AfricaUganda
GuatemalaHungary
ChinaMendozaEcuador
JujuyMyanmarLa Rioja
MongoliaBrazil
TurkeyIvory Coast
ChubutRussia
Democratic Republic of CongoColombiaNeuquen
Papua New GuineaMali
TanzaniaNicaragua
BulgariaRomania
KenyaHonduras
PolandSanta Cruz
South SudanMexico
WashingtonCalifornia
CatamarcaNew South Wales
MozambiqueGuyana
EncouragesInvestment
Not a Deterrent toInvestment

54 • Fraser Institute Annual Survey of Mining Companies 2016
fraserinstitute.org
Figure 19: Taxation Regime
0% 20% 40% 60% 80% 100%
San JuanFiji
Papua New GuineaChile
Newfoundland & LabradorMali
Northwest TerritoriesTasmania
IdahoNunavut
Northern TerritoryGuyana
UruguayFrance
MichiganQuebec
Western AustraliaPeru
AlbertaBritish Columbia
NicaraguaSerbia
New ZealandAlaska
OntarioEritrea
UtahGhana
WyomingPortugal
SpainNova Scotia
NorwayPolandRussia
SwedenBulgaria
Burkina FasoArizona
Ivory CoastSouth Sudan
YukonSalta
Northern IrelandSaskatchewan
NevadaManitoba
New BrunswickFinland
Ireland, Republic ofBotswana
MalaysiaFrench Guiana
0% 20% 40% 60% 80% 100%
JujuyMongolia
GuatemalaEcuadorChubutGreeceBolivia
PhilippinesMendozaPanama
VenezuelaCaliforniaIndonesia
La RiojaMyanmarEthiopia
NeuquenAfghanistan
IndiaChina
ZimbabweGreenland
KazakhstanWashington
ColoradoSouth Africa
TanzaniaNew South Wales
BrazilMozambiqueSierra Leone
CatamarcaDominican Republic
ColombiaSanta Cruz
HondurasTurkey
UgandaNamibiaMexico
RomaniaMontana
KenyaQueensland
Democratic Republic of CongoMinnesota
VictoriaZambia
New MexicoSouth Australia
Hungary
EncouragesInvestment
Not a Deterrentto Investment

Fraser Institute Annual Survey of Mining Companies 2016 • 55
fraserinstitute.org
Figure 20: Uncertainty Concerning Disputed Land Claims
0% 20% 40% 60% 80% 100%
NicaraguaWestern Australia
CaliforniaNewfoundland & Labrador
La RiojaZambia
New BrunswickMinnesota
BulgariaNamibia
ChileWashington
CatamarcaHungary
GhanaTasmania
UtahIvory Coast
MaliNorway
SerbiaNova Scotia
MontanaMichiganSweden
New MexicoQuebec
Burkina FasoGuyana
ColoradoEritrea
MalaysiaDominican Republic
PolandWyomingSan Juan
GreenlandFinlandArizona
Northern IrelandRussiaFrance
BotswanaAlaska
FijiNevada
SaskatchewanFrench Guiana
SpainSalta
IdahoIreland, Republic of
Portugal
0% 20% 40% 60% 80% 100%
AfghanistanPhilippines
MyanmarVenezuelaIndonesia
PanamaZimbabwe
EthiopiaGuatemala
South AfricaPapua New Guinea
BoliviaSierra Leone
Northwest TerritoriesMongolia
KenyaIndia
British ColumbiaTanzania
MozambiqueUganda
New South WalesQueensland
JujuyPeru
NeuquenSouth Sudan
OntarioColombia
AlbertaYukon
RomaniaKazakhstan
VictoriaTurkeyChubut
EcuadorMexico
Democratic Republic of CongoManitoba
South AustraliaNew Zealand
Northern TerritoryMendoza
Santa CruzGreece
UruguayHonduras
BrazilChina
Nunavut
EncouragesInvestment
Not a Deterrentto Investment

56 • Fraser Institute Annual Survey of Mining Companies 2016
fraserinstitute.org
Figure 21: Uncertainty Concerning Protected Areas
0% 20% 40% 60% 80% 100%
NorwayPeru
BrazilNewfoundland & Labrador
San JuanTurkey
Dominican RepublicKazakhstanGreenland
ChinaUtah
MichiganMexico
EthiopiaAfghanistan
HungaryManitoba
KenyaQuebec
New BrunswickNicaragua
Western AustraliaSwedenMalaysiaTanzania
WyomingPoland
South AfricaNevada
Nova ScotiaPortugal
SpainSaltaMali
SaskatchewanGhana
Burkina FasoZambiaRussia
Northern IrelandIreland, Republic of
GuyanaNamibia
Ivory CoastSouth Sudan
SerbiaDemocratic Republic of Congo
UgandaFrench Guiana
EritreaSierra Leone
FijiBotswana
0% 20% 40% 60% 80% 100%
JujuyCaliforniaNeuquen
British ColumbiaColombia
GreeceMendozaMongoliaNunavutVictoria
New ZealandVenezuelaTasmania
FranceEcuador
GuatemalaColorado
PhilippinesNew South Wales
WashingtonChubut
La RiojaUruguay
MyanmarNorthwest Territories
ZimbabweIndonesia
New MexicoAlberta
MontanaNorthern Territory
MinnesotaIndia
PanamaBulgariaRomania
QueenslandYukonAlaska
FinlandChile
South AustraliaCatamarca
ArizonaBolivia
HondurasMozambique
IdahoOntario
Santa CruzPapua New Guinea
EncouragesInvestment
Not a Deterrentto Investment

Fraser Institute Annual Survey of Mining Companies 2016 • 57
fraserinstitute.org
Figure 22: Quality of Infrastructure
0% 20% 40% 60% 80% 100%
FijiSan JuanRomania
TurkeyUruguay
GreeceSouth Australia
SaltaNewfoundland & Labrador
MexicoChinaIdaho
QueenslandCatamarcaCalifornia
OntarioBritish Columbia
BotswanaMalaysiaMichigan
WashingtonNew Zealand
ManitobaMontanaBulgaria
SaskatchewanNeuquenHungary
Western AustraliaTasmania
UtahQuebec
Nova ScotiaColorado
SpainWyoming
New South WalesVictoria
New MexicoAlbertaFrance
SwedenFinlandSerbia
NorwayArizona
MinnesotaNevada
PortugalNorthern Ireland
Ireland, Republic ofPoland
New Brunswick
0% 20% 40% 60% 80% 100%
Ivory CoastPanama
AfghanistanMyanmar
PhilippinesIndonesia
Papua New GuineaMongolia
Sierra LeoneHonduras
Democratic Republic of CongoEritrea
ZimbabweMozambique
UgandaFrench Guiana
NunavutMali
EthiopiaSouth Sudan
IndiaEcuadorChubut
GuatemalaNorthwest Territories
Burkina FasoVenezuelaGreenland
TanzaniaAlaskaBrazil
GuyanaLa Rioja
ColombiaRussiaBoliviaKenya
Dominican RepublicKazakhstan
ZambiaSouth Africa
YukonPeru
NicaraguaGhana
MendozaJujuy
Santa CruzChile
NamibiaNorthern Territory
EncouragesInvestment
Not a Deterrentto Investment

58 • Fraser Institute Annual Survey of Mining Companies 2016
fraserinstitute.org
Figure 23: Socioeconomic Agreements/ Community Development Conditions
0% 20% 40% 60% 80% 100%
New ZealandChile
ZambiaWashington
CaliforniaBurkina Faso
Democratic Republic of CongoQueensland
GhanaBulgaria
TasmaniaSalta
ColoradoSan Juan
Northern TerritoryVictoria
SaskatchewanMontanaMalaysia
Nova ScotiaMinnesota
RomaniaAlbertaSerbia
OntarioChina
South AustraliaAlaska
Ivory CoastUganda
HungaryQuebec
BotswanaFrench Guiana
MichiganManitoba
UtahSpain
Newfoundland & LabradorNew Mexico
Western AustraliaNorthern Ireland
ArizonaIreland, Republic of
NevadaWyoming
PolandNorway
IdahoSweden
New BrunswickPortugalFinland
0% 20% 40% 60% 80% 100%
BoliviaPhilippines
MyanmarVenezuela
Sierra LeonePapua New Guinea
MongoliaEthiopia
South SudanAfghanistan
EcuadorGuatemala
South AfricaZimbabwe
ChubutIndonesia
Dominican RepublicKazakhstan
ColombiaJujuy
PanamaIndia
MexicoGreenland
PeruMendozaLa RiojaNunavut
GreeceGuyana
Santa CruzTanzania
YukonNorthwest Territories
MozambiqueCatamarca
UruguayBrazil
FranceNew South Wales
HondurasRussia
MaliNamibia
KenyaFiji
EritreaBritish Columbia
NicaraguaTurkey
Neuquen
EncouragesInvestment
Not a Deterrentto Investment

Fraser Institute Annual Survey of Mining Companies 2016 • 59
fraserinstitute.org
Figure 24: Trade Barriers
0% 20% 40% 60% 80% 100%
TanzaniaGuyanaSerbia
GreenlandMali
AlbertaMinnesota
MichiganWyoming
Burkina FasoBotswanaColoradoNunavut
New South WalesUtah
MontanaSpain
CaliforniaNorway
Ireland, Republic ofNorthern Ireland
QuebecPoland
QueenslandIdaho
Northwest TerritoriesBulgaria
GhanaVictoria
SaskatchewanBritish Columbia
YukonPortugal
WashingtonSouth Australia
ArizonaTasmania
NevadaFinlandOntario
ManitobaNorthern Territory
SwedenNewfoundland & Labrador
AlaskaHungary
Ivory CoastWestern Australia
New ZealandFrench Guiana
New BrunswickNova ScotiaNew Mexico
0% 20% 40% 60% 80% 100%
IndonesiaMendoza
ChubutLa Rioja
VenezuelaCatamarca
JujuySanta Cruz
EcuadorNeuquen
AfghanistanZimbabwe
MyanmarChina
MozambiqueSan Juan
GuatemalaBolivia
South AfricaMongolia
IndiaRussia
UgandaKazakhstan
TurkeyColombia
PhilippinesDominican Republic
HondurasPanama
BrazilDemocratic Republic of Congo
FijiSierra Leone
GreeceNicaragua
EthiopiaSouth Sudan
Papua New GuineaSalta
ZambiaNamibia
FranceKenya
MexicoPeru
UruguayRomania
ChileEritrea
Malaysia
EncouragesInvestment
Not a Deterrent toInvestment

60 • Fraser Institute Annual Survey of Mining Companies 2016
fraserinstitute.org
Figure 25: Political Stability
0% 20% 40% 60% 80% 100%
MontanaChina
TanzaniaColorado
New South WalesGuyana
UruguayRussia
MichiganSpainChile
San JuanSerbia
TasmaniaNorthern Ireland
Northern TerritoryNamibia
QueenslandVictoria
Northwest TerritoriesGhana
QuebecHungary
IdahoBritish Columbia
UtahNew Mexico
WyomingOntario
NunavutMinnesota
YukonNew Zealand
AlaskaAlberta
PortugalArizonaFrance
Ireland, Republic ofNorwayPoland
South AustraliaWestern Australia
Newfoundland & LabradorNevada
Nova ScotiaFinland
BotswanaSaskatchewan
SwedenFrench Guiana
New BrunswickManitoba
0% 20% 40% 60% 80% 100%
South SudanZimbabwe
AfghanistanMyanmar
TurkeyBolivia
VenezuelaSierra LeoneSouth Africa
EthiopiaIndonesia
GreecePhilippines
Papua New GuineaMali
GuatemalaJujuy
MongoliaMendozaEcuador
HondurasPanamaChubut
ColombiaDemocratic Republic of Congo
Burkina FasoBrazil
NicaraguaKenya
Santa CruzMozambique
BulgariaZambiaLa Rioja
RomaniaIndia
WashingtonGreenland
FijiCatamarca
PeruEritrea
Dominican RepublicMalaysia
KazakhstanMexico
CaliforniaIvory Coast
UgandaNeuquen
Salta
EncouragesInvestment
Not a Deterrentto Investment

Fraser Institute Annual Survey of Mining Companies 2016 • 61
fraserinstitute.org
Figure 26: Labor Regulations/Employment Agreements and Labour Militancy/Work Disruptions
0% 20% 40% 60% 80% 100%
MontanaMozambique
MyanmarVictoriaFrance
MichiganWashington
MalaysiaRomania
South AustraliaSpain
SerbiaChina
QuebecNorthern Territory
GuyanaUtahMali
British ColumbiaBurkina Faso
MinnesotaAlberta
Newfoundland & LabradorEthiopia
SaltaOntario
Western AustraliaNorthwest Territories
French GuianaWyoming
Ireland, Republic ofBulgariaSweden
Sierra LeoneGhana
ArizonaIdaho
New BrunswickRussiaYukon
NunavutAlaska
Nova ScotiaNorthern Ireland
NevadaManitoba
SaskatchewanFinland
BotswanaEritrea
Ivory CoastHungary
Poland
0% 20% 40% 60% 80% 100%
VenezuelaZimbabwe
South AfricaJujuy
NeuquenSanta Cruz
ChubutLa Rioja
BoliviaPapua New Guinea
MendozaIndonesia
PhilippinesBrazil
EcuadorCatamarca
AfghanistanColombiaHonduras
PeruGuatemala
New South WalesUruguay
IndiaGreece
QueenslandSan Juan
KenyaTasmania
FijiCalifornia
Dominican RepublicPanama
ChileGreenland
KazakhstanNicaragua
MexicoSouth Sudan
UgandaTanzaniaNamibia
TurkeyMongolia
NorwayColorado
New ZealandZambia
PortugalNew Mexico
Democratic Republic of Congo
EncouragesInvestment
Not a Deterrentto Investment
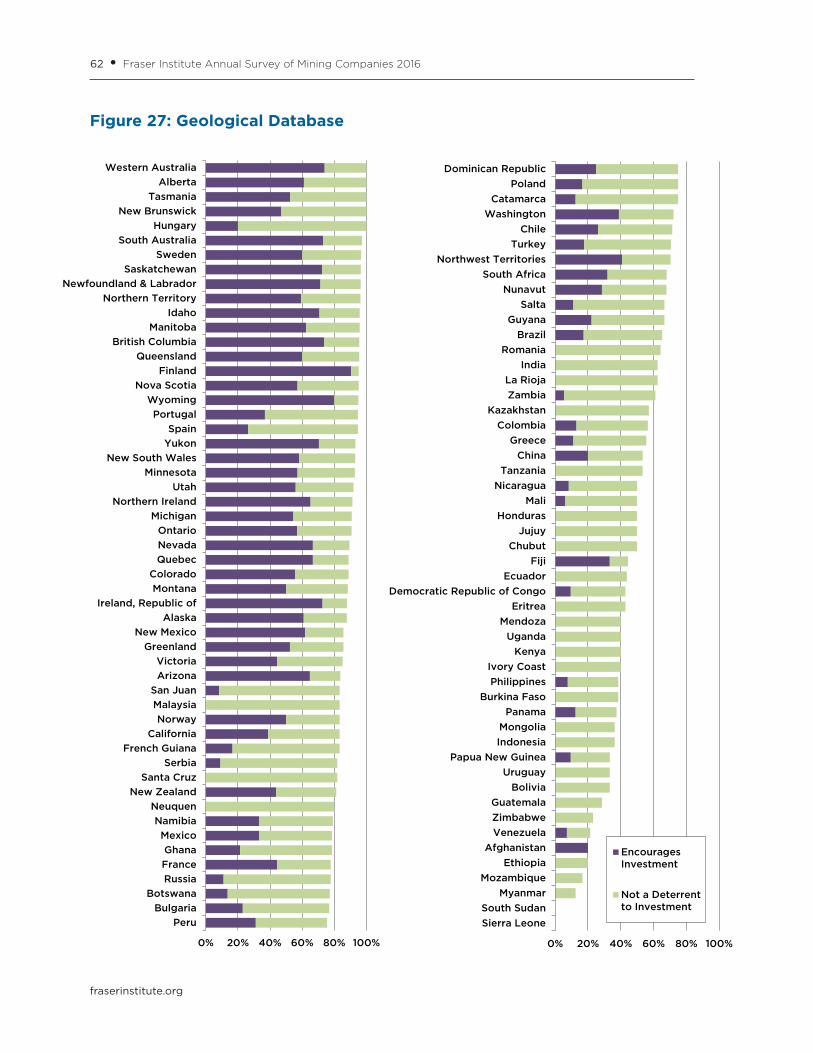
62 • Fraser Institute Annual Survey of Mining Companies 2016
fraserinstitute.org
Figure 27: Geological Database
0% 20% 40% 60% 80% 100%
PeruBulgaria
BotswanaRussiaFranceGhana
MexicoNamibia
NeuquenNew Zealand
Santa CruzSerbia
French GuianaCalifornia
NorwayMalaysiaSan Juan
ArizonaVictoria
GreenlandNew Mexico
AlaskaIreland, Republic of
MontanaColorado
QuebecNevadaOntario
MichiganNorthern Ireland
UtahMinnesota
New South WalesYukonSpain
PortugalWyoming
Nova ScotiaFinland
QueenslandBritish Columbia
ManitobaIdaho
Northern TerritoryNewfoundland & Labrador
SaskatchewanSweden
South AustraliaHungary
New BrunswickTasmania
AlbertaWestern Australia
0% 20% 40% 60% 80% 100%
Sierra LeoneSouth Sudan
MyanmarMozambique
EthiopiaAfghanistan
VenezuelaZimbabweGuatemala
BoliviaUruguay
Papua New GuineaIndonesiaMongolia
PanamaBurkina Faso
PhilippinesIvory Coast
KenyaUganda
MendozaEritrea
Democratic Republic of CongoEcuador
FijiChubut
JujuyHonduras
MaliNicaragua
TanzaniaChina
GreeceColombia
KazakhstanZambiaLa Rioja
IndiaRomania
BrazilGuyana
SaltaNunavut
South AfricaNorthwest Territories
TurkeyChile
WashingtonCatamarca
PolandDominican Republic
EncouragesInvestment
Not a Deterrentto Investment

Fraser Institute Annual Survey of Mining Companies 2016 • 63
fraserinstitute.org
Figure 28: Security
0% 20% 40% 60% 80% 100%
MongoliaUruguay
French GuianaChileSpain
Santa CruzSan Juan
ChubutNamibia
New MexicoColorado
New South WalesIreland, Republic of
New BrunswickCaliforniaPortugal
WyomingGreenland
British ColumbiaNorthern Ireland
QuebecNorthwest Territories
NunavutSwedenOntario
YukonNevada
HungarySerbia
WashingtonBotswana
AlbertaQueensland
VictoriaUtah
Newfoundland & LabradorMontana
PolandSaskatchewanNew Zealand
AlaskaNova Scotia
South AustraliaMichiganArizona
Northern TerritoryTasmaniaManitoba
IdahoWestern Australia
MinnesotaNorwayFinland
0% 20% 40% 60% 80% 100%
PhilippinesEthiopia
Sierra LeoneSouth SudanAfghanistan
MyanmarVenezuelaIndonesia
MexicoHonduras
South AfricaColombia
TurkeyMali
GuatemalaBurkina Faso
ZimbabweBolivia
PanamaPapua New Guinea
EritreaDemocratic Republic of Congo
GuyanaKenya
NicaraguaIndia
EcuadorIvory Coast
PeruMozambique
JujuyBrazil
GhanaMendoza
RussiaKazakhstan
MalaysiaUgandaZambia
CatamarcaDominican Republic
FranceBulgaria
TanzaniaLa Rioja
ChinaRomania
FijiGreece
NeuquenSalta
EncouragesInvestment
Not a Deterrentto Investment

64 • Fraser Institute Annual Survey of Mining Companies 2016
fraserinstitute.org
Figure 29: Availability of Labor/Skills
0% 20% 40% 60% 80% 100%
BulgariaRussia
ZambiaPoland
SaltaSan Juan
MexicoFranceBrazil
TurkeyAlaska
NorwayAlberta
SpainNova Scotia
GhanaYukon
Northern IrelandNew Zealand
MontanaSerbia
Ireland, Republic ofPeru
ColoradoMinnesota
British ColumbiaCalifornia
WashingtonPortugalFinland
New South WalesChile
IdahoWestern Australia
SaskatchewanVictoriaQuebecSwedenOntario
South AustraliaArizona
QueenslandHungary
New MexicoWyoming
Newfoundland & LabradorNorthern Territory
NevadaTasmaniaMichigan
UtahNew Brunswick
Manitoba
0% 20% 40% 60% 80% 100%
South SudanUruguay
AfghanistanMyanmar
ChubutVenezuela
Sierra LeonePapua New Guinea
Burkina FasoMozambique
NicaraguaMongolia
Ivory CoastEcuador
GuatemalaHonduras
La RiojaPanama
IndiaJujuy
TanzaniaFrench Guiana
ColombiaDemocratic Republic of Congo
UgandaNeuquen
IndonesiaNamibia
EritreaGreenland
MaliMendoza
ZimbabweDominican Republic
MalaysiaBolivia
NunavutSanta Cruz
FijiGreece
South AfricaRomania
KazakhstanBotswana
EthiopiaKenya
Northwest TerritoriesPhilippinesCatamarca
GuyanaChina
EncouragesInvestment
Not a Deterrentto Investment

fraserinstitute.org
Acknowledgments
We would like to thank the hundreds of members of the mining community who have responded to the survey this year and in previous years. You do a service to your industry by providing such valuable information. We would also like to thank a number of mining associations that generously helped inform their readers and members of the opportunity to participate in the survey.
We also wish to acknowlege the work of then Executive Director Michael Walker and Laura Jones for conceptualizing this project 19 years ago. As well, we thank Gavin Rogers for his excellent research assistance.

66 • Fraser Institute Annual Survey of Mining Companies 2016
fraserinstitute.org
About the Authors
Taylor Jackson
Taylor Jackson is a Senior Policy Analyst in the Centre for Natural Resource Studies at the Fraser Institute. He holds a BA and an MA in Political Science from Simon Fraser University. Mr. Jackson is the co-author of a number of Fraser Institute studies, including Safety in the Transportation of Oil and Gas: Pipelines or Rail?, and the Fraser Institute’s annual Global Petroleum Survey and Survey of Mining Companies. Mr Jackson’s work has been covered in the media all around the world and his commentaries have appeared in the National Post, Financial Post, and Washington Times, as well as other newspapers across Canada.
Kenneth P. Green
Kenneth P. Green is Senior Director of Natural Resources at the Fraser Institute. He received his doctorate in Environmental Science and Engineering from the University of California, Los Angeles (UCLA), an MS in Molecular Genetics from San Diego State University, and a BS Biology from UCLA. Dr. Green has studied public policy involving risk, regulation, and the environment for more than 16 years at public policy research institutions across North America. He has an extensive publication list of policy studies, magazine articles, opinion columns, book and encyclopedia chapters, and two supplementary text books on climate change and energy policy. Ken’s writing has appeared in major news papers across the US and Canada, and he is a regular presence on both Canadian and American radio and television.

Fraser Institute Annual Survey of Mining Companies 2016 • 67
fraserinstitute.org
Publishing Information
DistributionThese publications are available from <http://www.fraserinstitute.org> in Portable Document Format (PDF) and can be read with Adobe Acrobat® or Adobe Reader®, versions 8 or later. Adobe Reader® DC, the most recent version, is available free of charge from Adobe Systems Inc. at <http://get.adobe.com/reader/>. Readers having trouble viewing or printing our PDF files using applica-tions from other manufacturers (e.g., Apple’s Preview) should use Reader® or Acrobat®.
Ordering publicationsTo order printed publications from the Fraser Institute, please contact:
• e-mail:[email protected]
• telephone:604.688.0221ext.580or,tollfree,1.800.665.3558ext.580 • fax:604.688.8539.
MediaFor media enquiries, please contact our communications department via e-mail: [email protected];telephone:604.714.4582.InToronto,contactourmediaspecialistviatelephoneat416.363.6575,ext.238.
CopyrightCopyright©2017bytheFraserInstitute.Allrightsreserved.Nopartofthispublicationmaybereproduced in any manner whatsoever without written permission except in the case of brief pas-sages quoted in critical articles and reviews.
Date of issueFebruary2017
ISBN978-0-88975-439-3
CitationJackson,Taylor,andKennethP.Green(2017).Fraser Institute Annual Survey of Mining Companies 2016. Fraser Institute. <http://www.fraserinstitute.org>.

68 • Fraser Institute Annual Survey of Mining Companies 2016
fraserinstitute.org
Supporting the Fraser Institute
To learn how to support the Fraser Institute, please contact
•Development Department, Fraser Institute Fourth Floor, 1770 Burrard Street Vancouver, British Columbia, V6J 3G7 Canada
•telephone,toll-free:1.800.665.3558ext.548
•e-mail:[email protected]
•website:: http://www.fraserinstitute.org/donate
Purpose, funding, and independenceThe Fraser Institute provides a useful public service. We report objective infor-mation about the economic and social effects of current public policies, and we offer evidence-based research and education about policy options that can improve the quality of life.
The Institute is a non-profit organization. Our activities are funded by charitable donations, unrestricted grants, ticket sales, and sponsorships from events, the licensing of products for public distribution, and the sale of publications.
All research is subject to rigorous review by external experts, and is conducted and published separately from the Institute’s Board of Trustees and its donors.
The opinions expressed by authors are their own, and do not necessarily reflect those of the Institute, its Board of Trustees, its donors and supporters, or its staff. This publication in no way implies that the Fraser Institute, its trustees, or staff are in favour of, or oppose the passage of, any bill; or that they support or oppose any particular political party or candidate.
As a healthy part of public discussion among fellow citizens who de-sire to improve the lives of people through better public policy, the Institute welcomes evidence-focused scrutiny of the research we publish, including verification of data sources, replication of analytical methods, and intelligent debate about the practical effects of policy recommendations.

Fraser Institute Annual Survey of Mining Companies 2016 • 69
fraserinstitute.org
About the Fraser Institute
Our mission is to improve the quality of life for Canadians, their families, and future generations by studying, measuring, and broadly communicating the ef-fects of government policies, entrepreneurship, and choice on their well-being.
Notre mission consiste à améliorer la qualité de vie des Canadiens et des généra-tions à venir en étudiant, en mesurant et en diffusant les effets des poli tiques gouvernementales, de l’entrepreneuriat et des choix sur leur bien-être.
Peer review —validating the accuracy of our research
The Fraser Institute maintains a rigorous peer review process for its research. New research, major research projects, and substantively modified research conducted by the Fraser Institute are reviewed by experts with a recognized expertise in the topic area being addressed. Whenever possible, external review is a blind process. Updates to previously reviewed research or new editions of previously reviewed research are not reviewed unless the update includes substantive or material changes in the methodology.
The review process is overseen by the directors of the Institute’s re-search departments who are responsible for ensuring all research published by the Institute passes through the appropriate peer review. If a dispute about the recommendations of the reviewers should arise during the Institute’s peer review process, the Institute has an Editorial Advisory Board, a panel of schol-ars from Canada, the United States, and Europe to whom it can turn for help in resolving the dispute.

70 • Fraser Institute Annual Survey of Mining Companies 2016
fraserinstitute.org
Members
Past members
Editorial Advisory Board
* deceased; † Nobel Laureate
Prof. Terry L. Anderson
Prof. Robert Barro
Prof. Michael Bliss
Prof. Jean-Pierre Centi
Prof. John Chant
Prof. Bev Dahlby
Prof. Erwin Diewert
Prof. Stephen Easton
Prof. J.C. Herbert Emery
Prof. Jack L. Granatstein
Prof. Herbert G. Grubel
Prof. James Gwartney
Prof. Ronald W. Jones
Dr. Jerry Jordan
Prof. Ross McKitrick
Prof. Michael Parkin
Prof. Friedrich Schneider
Prof. Lawrence B. Smith
Dr. Vito Tanzi
Prof. Armen Alchian*
Prof. James M. Buchanan* †
Prof. Friedrich A. Hayek* †
Prof. H.G. Johnson*
Prof. F.G. Pennance*
Prof. George Stigler* †
Sir Alan Walters*
Prof. Edwin G. West*