fraudulent financial reporting detection using …
TRANSCRIPT
FRAUDULENT FINANCIAL REPORTING DETECTION USING BENEISH M-SCORE MODEL IN PUBLIC COMPANIES
IN 2012-2016 Fhiqi Alfian, Ni Nyoman Alit Triani
Universitas Negeri Surabaya
Corresponding author : Address : - Email : [email protected]
ARTICLE INFORMATION
Article History:Received Nov 26, 2018Revised Dec 1, 2019Accepted Nov 28, 2018
JEL Classifications D73; E44; L32
DOI:10.21532/apfj.001.19.04.01.03
ABTRACTThis study aims to examine the ability of the Beneish M-Score model to detect fraudulent financial reporting. The Data research sample consisted of 55 manipulator companies that were sanctioned and fined by the Financial Services Authority due to violating POJK number X.K.1; X.K.4; IX.E.1; IX.E.2 and VIII.G.7 during 2012-2016 and 55 non-manipulator companies as comparison companies. The results showed that 28 of the 55 manipulator companies were correctly classified as fraud firms by 50.91%, while for the category of non-manipulator companies, there were as many as 60% or 33 of the 55 companies correctly classified as non-fraud firms.The results also identified three M-Score variables that were often manipulated by manipulator and non-manipulator companies namely Sales and General and Administrative Expenses Index (SGAI), Depreciation Index (DEPI) and Asset Quality Index (AQI), but two other variables namely Days Sales in Receivables Index (DSRI) and Sales Growth Index (SGI) are considered unable to detect fraudulent financial reporting. In addition, based on the results of the logistic regression test, the eight Beneish M-Score variables have no effect on the detection of fraudulent financial reporting.The Beneish M-Score model is an easy and cheap way to detect possible fraudulent financial reporting, this can be applied by investors before determining their investment decisions.
Keyword: Fraudulent financial reporting; Beneish M-Score; Logistic Regression;
1. INTRODUCTIONAccording to Tuanakotta (2010), presentation errors in financial statements can arwase due to fraud and errors. Generally detecting errors was much easier than fraud because errors were commonly detected by the internal control system, whereas fraud perpetrators tried to hide their actions. The axiom introduced by ACFE Global was that fraud was always hidden. The Indonesia Institute of Public Account (2015) stated that financial reporting containing fraud includes intentional misstatements and includes the removal of an amount or disclosure
in financial statements to influence the perceptions of users of financial statements. Meanwhile, Beneish and Nichols (2007) in fraudulent financial reporting gave a big loss, but often investors did not use relevant information to detect fraud.
The survey conducted by the Association of Certified Fraud Examiners (ACFE) globally in 2016 in “Report to the Nations on Occupational Fraud and Abuse” stated that the overall total losses was caused by fraud cases reached $ 6.3 billion with an average loss per case up to $ 2.7 million. ACFE (2016: 12) reported that among these fraud cases, the most common
Asia Pacific Fraud JournalE-ISSN: 2502-695X, ISSN: 2502-8731
Volume 4, Nomor 1 (January-June) 2019http://apfjournal.or.id/index.php/apf
Association of Certified Fraud Examiners (ACFE)Indonesia Chapter
© 2019
28 | Fhiqi Alfian & Ni Nyoman Alit Triani, Fraudulent Financial Reporting Detection
types of fraud were Asset Misappropriation (83.5%), Corruption (35.4%) and fraudulent financial reporting (9.6%) The number of fraudulent financial reporting cases in 2010 to 2016 only reached less than 10% of the total. Vice resa, the value of the losses caused was very material and pervasive at a median rate of $ 975,000 (ACFE, 2016: 12). Asset Misappropriation had the largest percentage of 83.5%, thiswas because its nature was easily traceableand the losses incurred were not material. In 2016, ACFE Indonesia collaborated with the White Collar Crime Prevention and Research Center (P3K2P) from STIE Perbanas Surabaya to conduct research on the description of fraud that occurred in Indonesia. The results of the Indonesian Fraud Survey stated that 154 respondents (67%) chose corruption, 71 respondents (31%) chose asset misappropriation, and the remaining 4 respondents (2%) choose fraudulent financial reporting as the most detrimental type of fraud in Indonesia. Corruption was the most common type of fraud in Indonesia and caused the greatest losses with an average loss of Rp. 100 million to Rp.500 million rupiah per case, thiswas different from the survey conducted by ACFE (2016) which stated that fraudulent financial reporting was the most detrimental. This difference was suspected that in Indonesia a variety of financial report crimes had not been revealed. Like the crime of information fraud on the stock exchange, and crime due to tax information fraud.
Many models of fraudulent financial reporting had been created today, one of which was the Beneish M-Score model found by Professor Messod D. Beneish in 1999. This model was a quantitative approach to investigative auditing and forensic accounting that can detect the possibility of companies doing fraudulent financial reporting and can classify these companies as fraud firms and non-fraud firms Beneishet al., (2012). This model received special attention from the public, after the disclosure of the Enron accounting scandal. This model was able
to warn long before the Enron accounting disaster was revealed to the public at large. The results ofBeneish M-Score model can detect companies that commit fraud by 76% (Messod D. Beneish, 1999). Then they conducted a study with a sample of fraud companies during the period 1998 - 2002 (including large cases such as Cendant, Enron, Global Crossing, Qwest), the results of the study stated that M-Score was able to correctly identify 12 of 17 cases or 71% (Beneish et al., 2012).This research was expected to contribute to the development of audit science, especially related to the detection of fraudulent financial reporting in public companies in Indonesia. After that, it provides a comprehensive understanding of the concepts of the Beneish M-Score model and the eight Beneish M-Score variables.
2. THEORICAL BASISLiterature ReviewFraudBased on Tuanakotta (2013), fraud was an unlawful act that contains elements of intentions, bad intentions, deception, concealment, and violation of trust with the aim of illegal advantages that can be in the form of money, goods/property, services, or business (“winning” procurement tenders goods/services by bribing officials). Erickson et al., (2004) explained that fraudulent financial reporting and earnings management have the same objective because they both manipulate financial statements. But what makes it different was that fraudulent financial reporting was outside the scope of general accepted accounting principle (GAAP) while earnings management was still within the scope of GAAP.
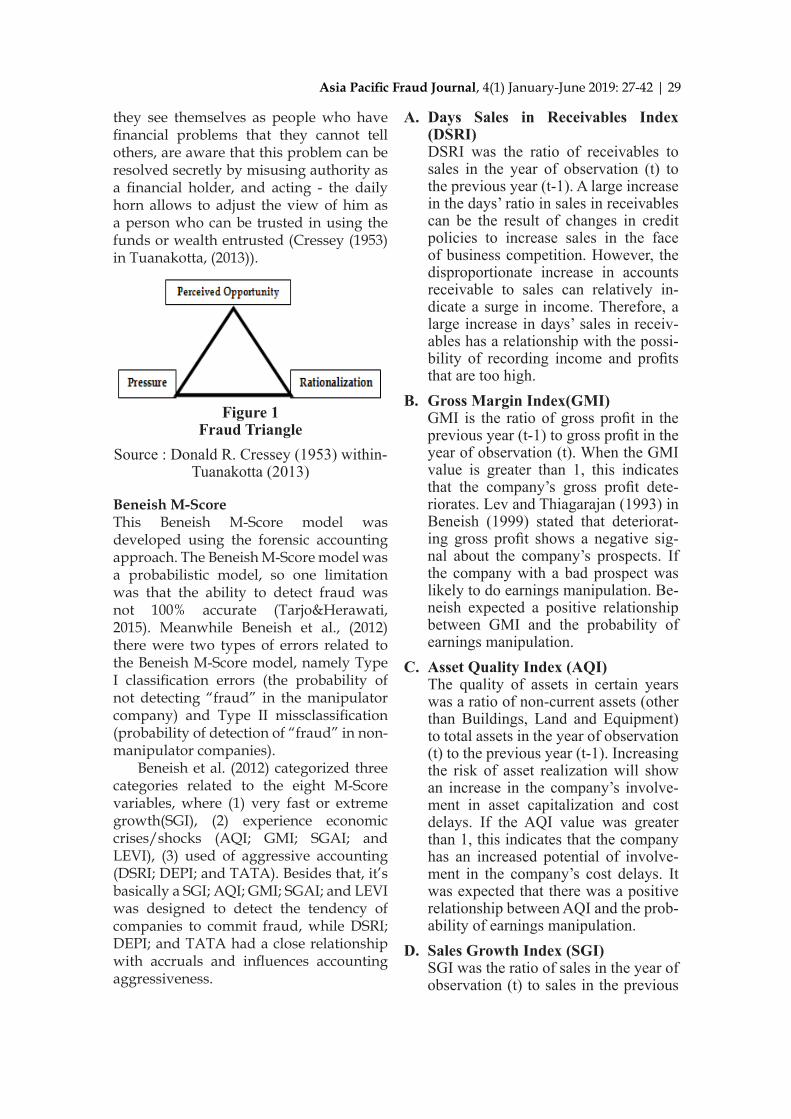
The Fraud Triangle TheoryCressey (1953) examined employees who stole corporate money (embezzlers). He interviewed 200 people who were jailed for the fraud. Cressey was interested in embezzlers which he calls “trust violators”.He argued that people who are believed to be violators of trust when
Asia Pacific Fraud Journal, 4(1) January-June 2019: 27-42 | 29
they see themselves as people who have financial problems that they cannot tell others, are aware that this problem can be resolved secretly by misusing authority as a financial holder, and acting - the daily horn allows to adjust the view of him as a person who can be trusted in using the funds or wealth entrusted (Cressey (1953) in Tuanakotta, (2013)).
Figure 1Fraud Triangle
Source : Donald R. Cressey (1953) within-Tuanakotta (2013)
Beneish M-ScoreThis Beneish M-Score model was developed using the forensic accounting approach. The Beneish M-Score model was a probabilistic model, so one limitation was that the ability to detect fraud was not 100% accurate (Tarjo&Herawati, 2015). Meanwhile Beneish et al., (2012) there were two types of errors related to the Beneish M-Score model, namely Type I classification errors (the probability of not detecting “fraud” in the manipulator company) and Type II missclassification (probability of detection of “fraud” in non-manipulator companies).
Beneish et al. (2012) categorized three categories related to the eight M-Score variables, where (1) very fast or extreme growth(SGI), (2) experience economic crises/shocks (AQI; GMI; SGAI; and LEVI), (3) used of aggressive accounting (DSRI; DEPI; and TATA). Besides that, it’s basically a SGI; AQI; GMI; SGAI; and LEVI was designed to detect the tendency of companies to commit fraud, while DSRI; DEPI; and TATA had a close relationship with accruals and influences accounting aggressiveness.
A. Days Sales in Receivables Index (DSRI)DSRI was the ratio of receivables to sales in the year of observation (t) to the previous year (t-1). A large increase in the days’ ratio in sales in receivables can be the result of changes in credit policies to increase sales in the face of business competition. However, the disproportionate increase in accounts receivable to sales can relatively in-dicate a surge in income. Therefore, a large increase in days’ sales in receiv-ables has a relationship with the possi-bility of recording income and profits that are too high.
B. Gross Margin Index(GMI)GMI is the ratio of gross profit in the previous year (t-1) to gross profit in the year of observation (t). When the GMI value is greater than 1, this indicates that the company’s gross profit dete-riorates. Lev and Thiagarajan (1993) in Beneish (1999) stated that deteriorat-ing gross profit shows a negative sig-nal about the company’s prospects. If the company with a bad prospect was likely to do earnings manipulation. Be-neish expected a positive relationship between GMI and the probability of earnings manipulation.
C. Asset Quality Index (AQI)The quality of assets in certain years was a ratio of non-current assets (other than Buildings, Land and Equipment) to total assets in the year of observation (t) to the previous year (t-1). Increasing the risk of asset realization will show an increase in the company’s involve-ment in asset capitalization and cost delays. If the AQI value was greater than 1, this indicates that the company has an increased potential of involve-ment in the company’s cost delays. It was expected that there was a positive relationship between AQI and the prob-ability of earnings manipulation.
D. Sales Growth Index (SGI)SGI was the ratio of sales in the year of observation (t) to sales in the previous
30 | Fhiqi Alfian & Ni Nyoman Alit Triani, Fraudulent Financial Reporting Detection
year (t-1). Sales growth does not mean manipulation, but the growth of the company was seen by experts as having the possibility to commit fraudulent fi-nancial reporting, because the financial position and needs of the company’s capital provide a pressure for manage-ment to achieve profit. If companies experience large stock losses, they may have greater incentives to manipulate profits. For this effect, Fridson (1993: 7-8) states that companies often try to eliminate the impression that their com-pany’s growth was slowing down, be-cause that perception can cause losses. Thus it was expected that there was a positive relationship between SGI and the probability of earnings manipula-tion.
E. Depreciation Index (DEPI)DEPI was the ratio of the previous year’s depreciation rate (t-1) to the rate of shrinkage in the observation year (t). The DEPI with a value greater than 1 indicates that the rate at which assets are depreciated more slowly increases the likelihood that the company has changed the estimated useful life of the asset or adopted a new method that can increase profits. Therefore, it was expected that there was a positive rela-tionship between DEPI and probability of manipulation.
F. Sales and General and Admin-wastrative Expenses Index (SGAI)SGAI calculates sales expenses and administrative expenses on sales in the year of observation (t) compared to the previous year (t-1). This variable was derived from the results of research Lev and Thiangarajan (1993) which states that analysts will interpret a disproportionate increase in a sale, indicating a negative signal for the company’s prospects in the future. It was expected that a positive relationship between SGAI and the probability of earnings manipulation.
G. Leverage Index (LEVI)LEVI was the ratio of total debt to total
assets in the year of observation (t) to the previous year (t-1). The value of LEVI greater than 1 indicates an increase in debt. This variable was included in identifying earnings manipulations caused by debt contract incentives. The LEVI variable specifically measures the level of errors in company debt estimates, assuming that debt takes place randomly.
H. Total Accruals to Total Assets (TATA)TATA variable was calculated by in-come before extraordinary items minus operating cash flows against total as-sets. Total accruals that have been used by previous researchers aim to measure the extent to which management makes procedures for selecting accounting to change profits (Jones, 1991). Beneish uses total accruals of total assets as a proxy to measure how much cash was a baswas for reporting company prof-its and expects a high positive accrual (accruals are lower than cash), which can be related to the high likelihood the company has manipulated earnings.
Previous ResearchTarjo&Herawati (2015) used a sample of
35 fraud firms and 35 non-fraud companies with criteria based on comparable asset categories and in the same industry. The ability of Beneish M-Score to detect fraud was 77.1% (27 of 35 samples of accurate fraud companies are classified as fraud). Then, out of 35 non-fraud companies, 28 (80%) accurately did not commit fraud.Other study, Ramírez-Orellana et al. (2017) used a sample of fraud companies (Pescanova) during the period 2008-2011 and used control companies (comparison), namely Austevoll, Marine Harvest, and Bolton Alimentari who were competitors, with criteria having size, liquidity, and profitability was proportional to the sample of fraud firms. Based on the Beneish M-Score calculation, it was known that the DSRI, LEVI, SGI, and TATA variables had been manipulated by Pescanova, besides that the company was proven to
Asia Pacific Fraud Journal, 4(1) January-June 2019: 27-42 | 31
manipulate financial statements before the period of financial difficulties.
Hasan et al. (2017) calculated the Overall Manipulation Index (OMI) in each country in the Asian Continent based on the frequency value of the Beneish M-Score variable, then a rating will be made. On the basis of the results of the M-Score calculation, the order of ranks (from the highest to the lowest) was manipulated in financial statements in the sample countries namely China, Indonesia, Hong Kong, Singapore, Thailand, Malaysia and Japan. In addition, it was also known that the overall value of OMI in 2010-2013 in China and Singapore was (0.82), Hong Kong (0.76), Thailand (0.75), Indonesia (0.72), Malaysia (0,66), and Japan (0.50). Next, Kamal et al. (2016) used a sample of 17 fraudulent companies that are subject to legal sanctions as a result of violating Malaysia’s Securities Industry rules Section 122A, Section 122B, Section 122C, and Section 122D. Based on the calculation of the Beneish M-Score, it was found that there were 14 out of 17 sample companies classified as fraudulentfinancial reporting. In addition, findings were obtained namely Beneish Model variables which often appear in fraud modus (from highest to lowest) TATA, DSRI, LEVI & SGAI, GMI, as well as AQI, SGI, and DEPI.
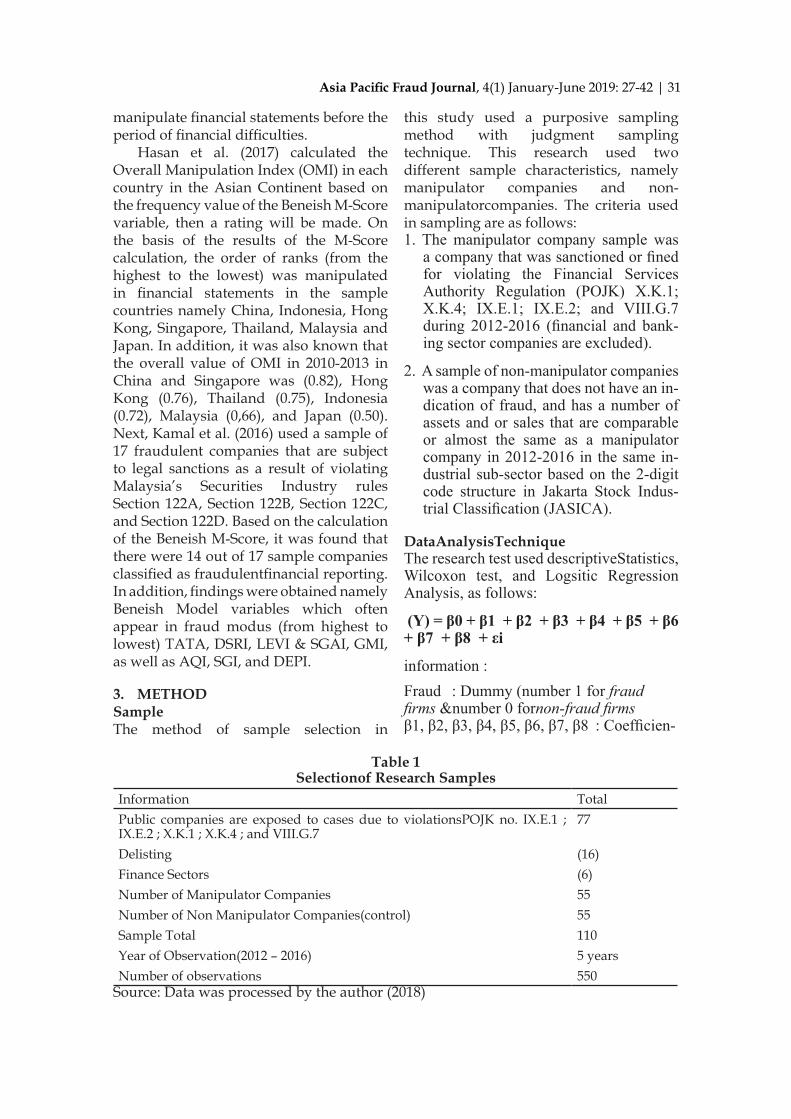
3. METHODSampleThe method of sample selection in
this study used a purposive sampling method with judgment sampling technique. This research used two different sample characteristics, namely manipulator companies and non-manipulatorcompanies. The criteria used in sampling are as follows:1. The manipulator company sample was
a company that was sanctioned or fined for violating the Financial Services Authority Regulation (POJK) X.K.1; X.K.4; IX.E.1; IX.E.2; and VIII.G.7 during 2012-2016 (financial and bank-ing sector companies are excluded).
2. A sample of non-manipulator companies was a company that does not have an in-dication of fraud, and has a number of assets and or sales that are comparable or almost the same as a manipulator company in 2012-2016 in the same in-dustrial sub-sector based on the 2-digit code structure in Jakarta Stock Indus-trial Classification (JASICA).
DataAnalysisTechniqueThe research test used descriptiveStatistics, Wilcoxon test, and Logsitic Regression Analysis, as follows:
(Y) = β0 + β1 + β2 + β3 + β4 + β5 + β6 + β7 + β8 + εi
information :Fraud : Dummy (number 1 for fraud firms &number 0 fornon-fraud firms β1, β2, β3, β4, β5, β6, β7, β8 : Coefficien-
Table 1Selectionof Research Samples
Information TotalPublic companies are exposed to cases due to violationsPOJK no. IX.E.1 ; IX.E.2 ; X.K.1 ; X.K.4 ; and VIII.G.7
77
Delisting (16)Finance Sectors (6)Number of Manipulator Companies 55Number of Non Manipulator Companies(control) 55Sample Total 110Year of Observation(2012 – 2016) 5 yearsNumber of observations 550
Source: Data was processed by the author (2018)
32 | Fhiqi Alfian & Ni Nyoman Alit Triani, Fraudulent Financial Reporting Detection
tregression DSRI : Day’s sales receivables index GMI : Gross profit margin AQI : Asset quality index SGI : Sales growth index DEPI : Depreciation index SGAI : Sales and general adminisstration expenses index TATA : Total accrual to total assets LEVI : Leverage index εi : Residual
4. RESEARCH RESULT AND DISCUSSION
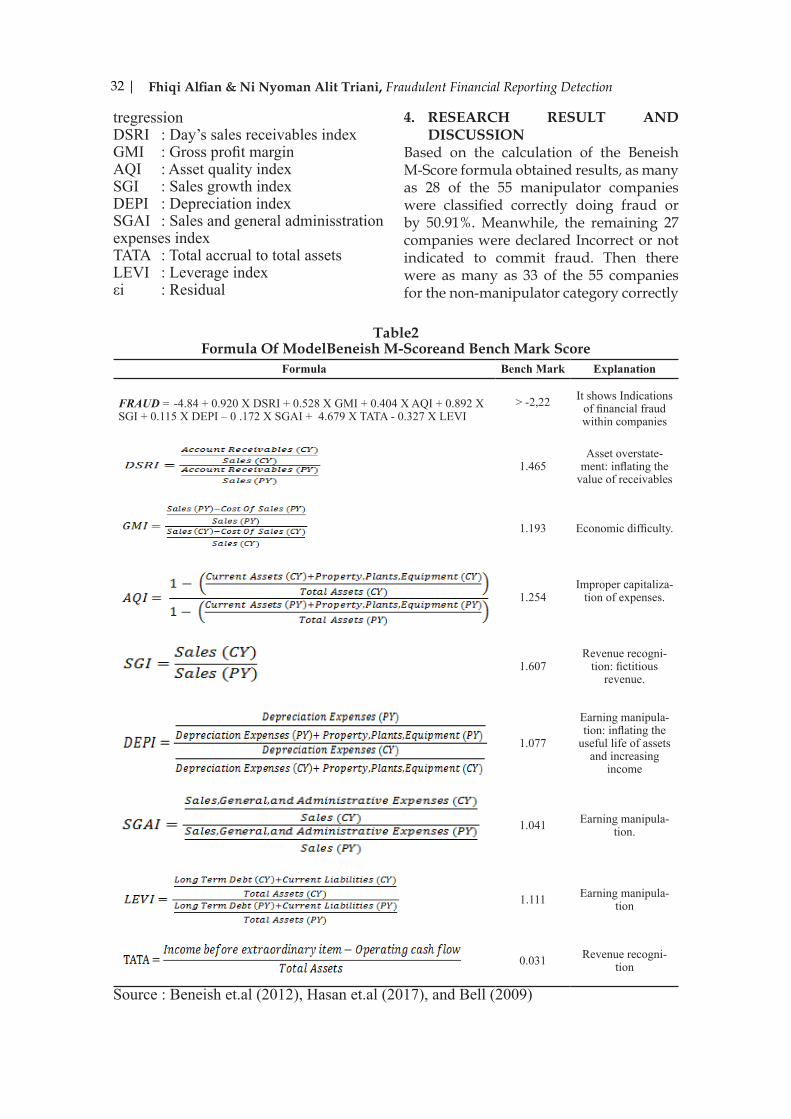
Based on the calculation of the Beneish M-Score formula obtained results, as many as 28 of the 55 manipulator companies were classified correctly doing fraud or by 50.91%. Meanwhile, the remaining 27 companies were declared Incorrect or not indicated to commit fraud. Then there were as many as 33 of the 55 companies for the non-manipulator category correctly
Table2Formula Of ModelBeneish M-Scoreand Bench Mark Score
Formula Bench Mark Explanation
FRAUD = -4.84 + 0.920 X DSRI + 0.528 X GMI + 0.404 X AQI + 0.892 X SGI + 0.115 X DEPI – 0 .172 X SGAI + 4.679 X TATA - 0.327 X LEVI
> -2,22 It shows Indications of financial fraud within companies
1.465Asset overstate-
ment: inflating the value of receivables
1.193 Economic difficulty.
1.254Improper capitaliza-
tion of expenses.
1.607Revenue recogni-
tion: fictitious revenue.
1.077
Earning manipula-tion: inflating the
useful life of assets and increasing
income
1.041 Earning manipula-tion.
1.111 Earning manipula-tion
0.031 Revenue recogni-tion
Source : Beneish et.al (2012), Hasan et.al (2017), and Bell (2009)
Asia Pacific Fraud Journal, 4(1) January-June 2019: 27-42 | 33
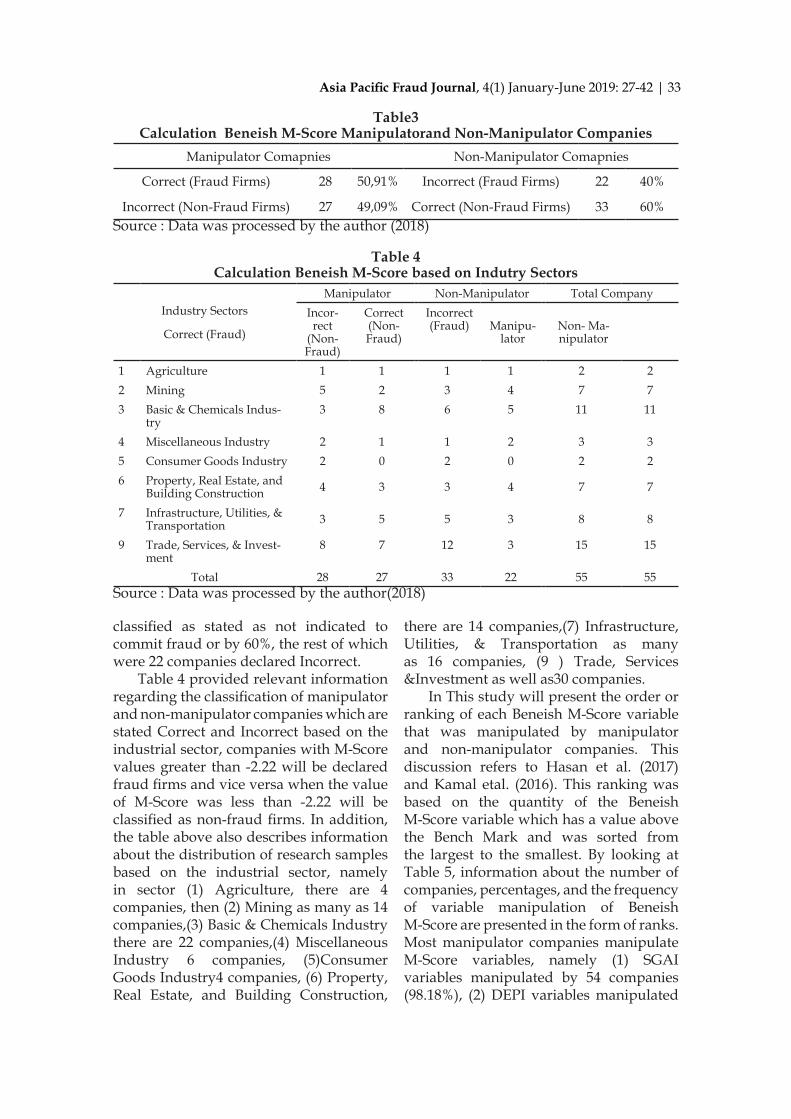
classified as stated as not indicated to commit fraud or by 60%, the rest of which were 22 companies declared Incorrect.
Table 4 provided relevant information regarding the classification of manipulator and non-manipulator companies which are stated Correct and Incorrect based on the industrial sector, companies with M-Score values greater than -2.22 will be declared fraud firms and vice versa when the value of M-Score was less than -2.22 will be classified as non-fraud firms. In addition, the table above also describes information about the distribution of research samples based on the industrial sector, namely in sector (1) Agriculture, there are 4 companies, then (2) Mining as many as 14 companies,(3) Basic & Chemicals Industry there are 22 companies,(4) Miscellaneous Industry 6 companies, (5)Consumer Goods Industry4 companies, (6) Property, Real Estate, and Building Construction,
there are 14 companies,(7) Infrastructure, Utilities, & Transportation as many as 16 companies, (9 ) Trade, Services &Investment as well as30 companies.
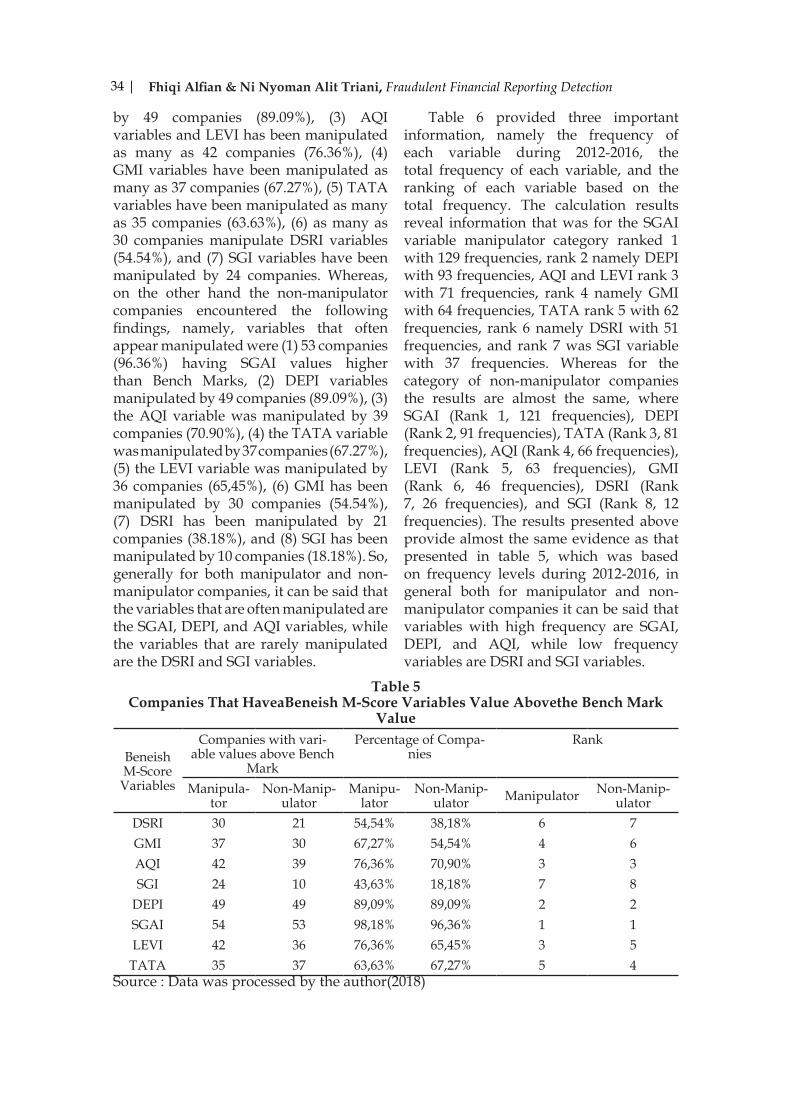
In This study will present the order or ranking of each Beneish M-Score variable that was manipulated by manipulator and non-manipulator companies. This discussion refers to Hasan et al. (2017) and Kamal etal. (2016). This ranking was based on the quantity of the Beneish M-Score variable which has a value above the Bench Mark and was sorted from the largest to the smallest. By looking at Table 5, information about the number of companies, percentages, and the frequency of variable manipulation of Beneish M-Score are presented in the form of ranks.Most manipulator companies manipulate M-Score variables, namely (1) SGAI variables manipulated by 54 companies (98.18%), (2) DEPI variables manipulated
Table3Calculation Beneish M-Score Manipulatorand Non-Manipulator Companies
Manipulator Comapnies Non-Manipulator Comapnies
Correct (Fraud Firms) 28 50,91% Incorrect (Fraud Firms) 22 40%
Incorrect (Non-Fraud Firms) 27 49,09% Correct (Non-Fraud Firms) 33 60%Source : Data was processed by the author (2018)
Table 4Calculation Beneish M-Score based on Indutry Sectors
Industry Sectors
Correct (Fraud)
Manipulator Non-Manipulator Total CompanyIncor-rect
(Non-Fraud)
Correct (Non-Fraud)
Incorrect (Fraud) Manipu-
latorNon- Ma-nipulator
1 Agriculture 1 1 1 1 2 22 Mining 5 2 3 4 7 73 Basic & Chemicals Indus-
try3 8 6 5 11 11
4 Miscellaneous Industry 2 1 1 2 3 35 Consumer Goods Industry 2 0 2 0 2 26 Property, Real Estate, and
Building Construction 4 3 3 4 7 7
7 Infrastructure, Utilities, & Transportation 3 5 5 3 8 8
9 Trade, Services, & Invest-ment
8 7 12 3 15 15
Total 28 27 33 22 55 55Source : Data was processed by the author(2018)
34 | Fhiqi Alfian & Ni Nyoman Alit Triani, Fraudulent Financial Reporting Detection
by 49 companies (89.09%), (3) AQI variables and LEVI has been manipulated as many as 42 companies (76.36%), (4) GMI variables have been manipulated as many as 37 companies (67.27%), (5) TATA variables have been manipulated as many as 35 companies (63.63%), (6) as many as 30 companies manipulate DSRI variables (54.54%), and (7) SGI variables have been manipulated by 24 companies. Whereas, on the other hand the non-manipulator companies encountered the following findings, namely, variables that often appear manipulated were (1) 53 companies (96.36%) having SGAI values higher than Bench Marks, (2) DEPI variables manipulated by 49 companies (89.09%), (3) the AQI variable was manipulated by 39 companies (70.90%), (4) the TATA variable was manipulated by 37 companies (67.27%), (5) the LEVI variable was manipulated by 36 companies (65,45%), (6) GMI has been manipulated by 30 companies (54.54%), (7) DSRI has been manipulated by 21 companies (38.18%), and (8) SGI has been manipulated by 10 companies (18.18%). So, generally for both manipulator and non-manipulator companies, it can be said that the variables that are often manipulated are the SGAI, DEPI, and AQI variables, while the variables that are rarely manipulated are the DSRI and SGI variables.
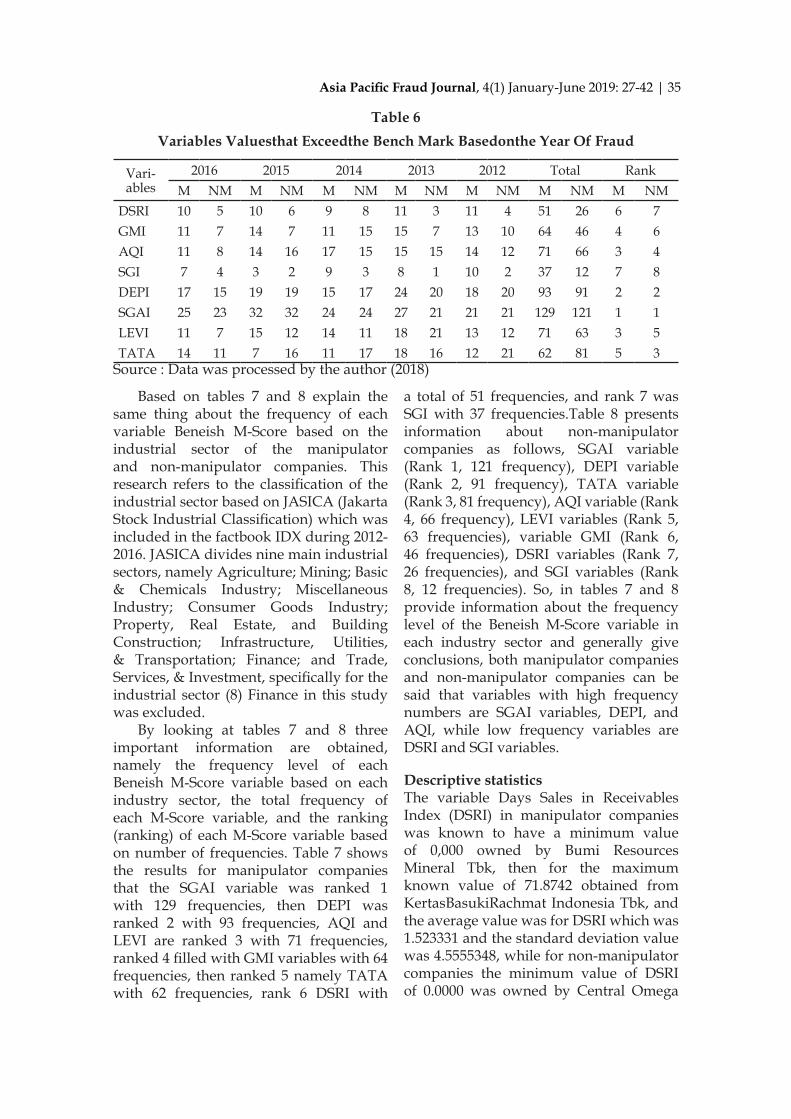
Table 6 provided three important information, namely the frequency of each variable during 2012-2016, the total frequency of each variable, and the ranking of each variable based on the total frequency. The calculation results reveal information that was for the SGAI variable manipulator category ranked 1 with 129 frequencies, rank 2 namely DEPI with 93 frequencies, AQI and LEVI rank 3 with 71 frequencies, rank 4 namely GMI with 64 frequencies, TATA rank 5 with 62 frequencies, rank 6 namely DSRI with 51 frequencies, and rank 7 was SGI variable with 37 frequencies. Whereas for the category of non-manipulator companies the results are almost the same, where SGAI (Rank 1, 121 frequencies), DEPI (Rank 2, 91 frequencies), TATA (Rank 3, 81 frequencies), AQI (Rank 4, 66 frequencies), LEVI (Rank 5, 63 frequencies), GMI (Rank 6, 46 frequencies), DSRI (Rank 7, 26 frequencies), and SGI (Rank 8, 12 frequencies). The results presented above provide almost the same evidence as that presented in table 5, which was based on frequency levels during 2012-2016, in general both for manipulator and non-manipulator companies it can be said that variables with high frequency are SGAI, DEPI, and AQI, while low frequency variables are DSRI and SGI variables.
Table 5Companies That HaveaBeneish M-Score Variables Value Abovethe Bench Mark
Value
Beneish M-Score Variables
Companies with vari-able values above Bench
Mark
Percentage of Compa-nies
Rank
Manipula-tor
Non-Manip-ulator
Manipu-lator
Non-Manip-ulator Manipulator Non-Manip-
ulatorDSRI 30 21 54,54% 38,18% 6 7GMI 37 30 67,27% 54,54% 4 6AQI 42 39 76,36% 70,90% 3 3SGI 24 10 43,63% 18,18% 7 8
DEPI 49 49 89,09% 89,09% 2 2SGAI 54 53 98,18% 96,36% 1 1LEVI 42 36 76,36% 65,45% 3 5
TATA 35 37 63,63% 67,27% 5 4Source : Data was processed by the author(2018)
Asia Pacific Fraud Journal, 4(1) January-June 2019: 27-42 | 35
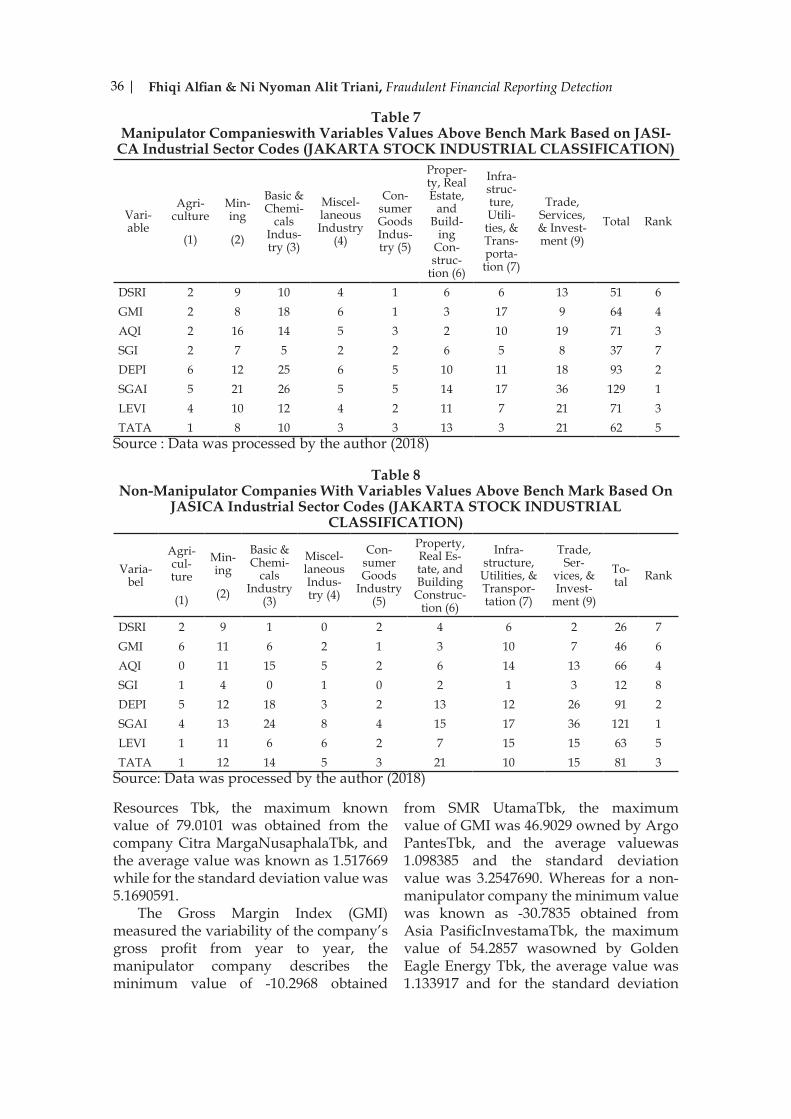
Based on tables 7 and 8 explain the same thing about the frequency of each variable Beneish M-Score based on the industrial sector of the manipulator and non-manipulator companies. This research refers to the classification of the industrial sector based on JASICA (Jakarta Stock Industrial Classification) which was included in the factbook IDX during 2012-2016. JASICA divides nine main industrial sectors, namely Agriculture; Mining; Basic & Chemicals Industry; Miscellaneous Industry; Consumer Goods Industry; Property, Real Estate, and Building Construction; Infrastructure, Utilities, & Transportation; Finance; and Trade, Services, & Investment, specifically for the industrial sector (8) Finance in this study was excluded.
By looking at tables 7 and 8 three important information are obtained, namely the frequency level of each Beneish M-Score variable based on each industry sector, the total frequency of each M-Score variable, and the ranking (ranking) of each M-Score variable based on number of frequencies. Table 7 shows the results for manipulator companies that the SGAI variable was ranked 1 with 129 frequencies, then DEPI was ranked 2 with 93 frequencies, AQI and LEVI are ranked 3 with 71 frequencies, ranked 4 filled with GMI variables with 64 frequencies, then ranked 5 namely TATA with 62 frequencies, rank 6 DSRI with
a total of 51 frequencies, and rank 7 was SGI with 37 frequencies.Table 8 presents information about non-manipulator companies as follows, SGAI variable (Rank 1, 121 frequency), DEPI variable (Rank 2, 91 frequency), TATA variable (Rank 3, 81 frequency), AQI variable (Rank 4, 66 frequency), LEVI variables (Rank 5, 63 frequencies), variable GMI (Rank 6, 46 frequencies), DSRI variables (Rank 7, 26 frequencies), and SGI variables (Rank 8, 12 frequencies). So, in tables 7 and 8 provide information about the frequency level of the Beneish M-Score variable in each industry sector and generally give conclusions, both manipulator companies and non-manipulator companies can be said that variables with high frequency numbers are SGAI variables, DEPI, and AQI, while low frequency variables are DSRI and SGI variables.
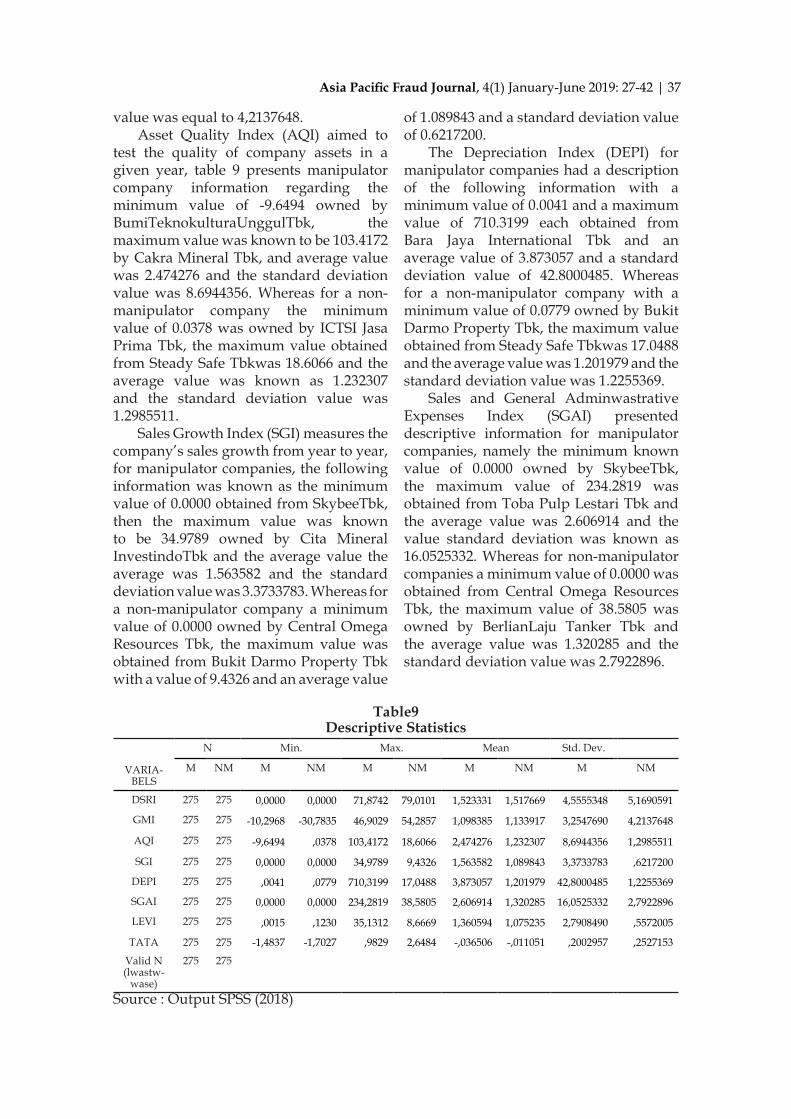
Descriptive statisticsThe variable Days Sales in Receivables Index (DSRI) in manipulator companies was known to have a minimum value of 0,000 owned by Bumi Resources Mineral Tbk, then for the maximum known value of 71.8742 obtained from KertasBasukiRachmat Indonesia Tbk, and the average value was for DSRI which was 1.523331 and the standard deviation value was 4.5555348, while for non-manipulator companies the minimum value of DSRI of 0.0000 was owned by Central Omega
Table 6Variables Valuesthat Exceedthe Bench Mark Basedonthe Year Of Fraud
Vari-ables
2016 2015 2014 2013 2012 Total RankM NM M NM M NM M NM M NM M NM M NM
DSRI 10 5 10 6 9 8 11 3 11 4 51 26 6 7GMI 11 7 14 7 11 15 15 7 13 10 64 46 4 6AQI 11 8 14 16 17 15 15 15 14 12 71 66 3 4SGI 7 4 3 2 9 3 8 1 10 2 37 12 7 8DEPI 17 15 19 19 15 17 24 20 18 20 93 91 2 2SGAI 25 23 32 32 24 24 27 21 21 21 129 121 1 1LEVI 11 7 15 12 14 11 18 21 13 12 71 63 3 5TATA 14 11 7 16 11 17 18 16 12 21 62 81 5 3
Source : Data was processed by the author (2018)
36 | Fhiqi Alfian & Ni Nyoman Alit Triani, Fraudulent Financial Reporting Detection
Resources Tbk, the maximum known value of 79.0101 was obtained from the company Citra MargaNusaphalaTbk, and the average value was known as 1.517669 while for the standard deviation value was 5.1690591.
The Gross Margin Index (GMI) measured the variability of the company’s gross profit from year to year, the manipulator company describes the minimum value of -10.2968 obtained
from SMR UtamaTbk, the maximum value of GMI was 46.9029 owned by Argo PantesTbk, and the average valuewas 1.098385 and the standard deviation value was 3.2547690. Whereas for a non-manipulator company the minimum value was known as -30.7835 obtained from Asia PasificInvestamaTbk, the maximum value of 54.2857 wasowned by Golden Eagle Energy Tbk, the average value was 1.133917 and for the standard deviation
Table 7Manipulator Companieswith Variables Values Above Bench Mark Based on JASI-
CA Industrial Sector Codes (JAKARTA STOCK INDUSTRIAL CLASSIFICATION)
Vari-able
Agri-culture
(1)
Min-ing
(2)
Basic & Chemi-
cals Indus-try (3)
Miscel-laneous Industry
(4)
Con-sumer Goods Indus-try (5)
Proper-ty, Real Estate,
and Build-
ing Con-struc-
tion (6)
Infra-struc-ture, Utili-ties, & Trans-porta-tion (7)
Trade, Services, & Invest-ment (9)
Total Rank
DSRI 2 9 10 4 1 6 6 13 51 6GMI 2 8 18 6 1 3 17 9 64 4AQI 2 16 14 5 3 2 10 19 71 3SGI 2 7 5 2 2 6 5 8 37 7DEPI 6 12 25 6 5 10 11 18 93 2SGAI 5 21 26 5 5 14 17 36 129 1LEVI 4 10 12 4 2 11 7 21 71 3TATA 1 8 10 3 3 13 3 21 62 5
Source : Data was processed by the author (2018)
Table 8Non-Manipulator Companies With Variables Values Above Bench Mark Based On
JASICA Industrial Sector Codes (JAKARTA STOCK INDUSTRIAL CLASSIFICATION)
Varia-bel
Agri-cul-ture
(1)
Min-ing
(2)
Basic & Chemi-
cals Industry
(3)
Miscel-laneous Indus-try (4)
Con-sumer Goods
Industry (5)
Property, Real Es-tate, and Building
Construc-tion (6)
Infra-structure,
Utilities, & Transpor-tation (7)
Trade, Ser-
vices, & Invest-
ment (9)
To-tal Rank
DSRI 2 9 1 0 2 4 6 2 26 7GMI 6 11 6 2 1 3 10 7 46 6AQI 0 11 15 5 2 6 14 13 66 4SGI 1 4 0 1 0 2 1 3 12 8DEPI 5 12 18 3 2 13 12 26 91 2SGAI 4 13 24 8 4 15 17 36 121 1LEVI 1 11 6 6 2 7 15 15 63 5TATA 1 12 14 5 3 21 10 15 81 3
Source: Data was processed by the author (2018)
Asia Pacific Fraud Journal, 4(1) January-June 2019: 27-42 | 37
value was equal to 4,2137648.Asset Quality Index (AQI) aimed to
test the quality of company assets in a given year, table 9 presents manipulator company information regarding the minimum value of -9.6494 owned by BumiTeknokulturaUnggulTbk, the maximum value was known to be 103.4172 by Cakra Mineral Tbk, and average value was 2.474276 and the standard deviation value was 8.6944356. Whereas for a non-manipulator company the minimum value of 0.0378 was owned by ICTSI Jasa Prima Tbk, the maximum value obtained from Steady Safe Tbkwas 18.6066 and the average value was known as 1.232307 and the standard deviation value was 1.2985511.
Sales Growth Index (SGI) measures the company’s sales growth from year to year, for manipulator companies, the following information was known as the minimum value of 0.0000 obtained from SkybeeTbk, then the maximum value was known to be 34.9789 owned by Cita Mineral InvestindoTbk and the average value the average was 1.563582 and the standard deviation value was 3.3733783. Whereas for a non-manipulator company a minimum value of 0.0000 owned by Central Omega Resources Tbk, the maximum value was obtained from Bukit Darmo Property Tbk with a value of 9.4326 and an average value
of 1.089843 and a standard deviation value of 0.6217200.
The Depreciation Index (DEPI) for manipulator companies had a description of the following information with a minimum value of 0.0041 and a maximum value of 710.3199 each obtained from Bara Jaya International Tbk and an average value of 3.873057 and a standard deviation value of 42.8000485. Whereas for a non-manipulator company with a minimum value of 0.0779 owned by Bukit Darmo Property Tbk, the maximum value obtained from Steady Safe Tbkwas 17.0488 and the average value was 1.201979 and the standard deviation value was 1.2255369.
Sales and General Adminwastrative Expenses Index (SGAI) presented descriptive information for manipulator companies, namely the minimum known value of 0.0000 owned by SkybeeTbk, the maximum value of 234.2819 was obtained from Toba Pulp Lestari Tbk and the average value was 2.606914 and the value standard deviation was known as 16.0525332. Whereas for non-manipulator companies a minimum value of 0.0000 was obtained from Central Omega Resources Tbk, the maximum value of 38.5805 was owned by BerlianLaju Tanker Tbk and the average value was 1.320285 and the standard deviation value was 2.7922896.
Table9Descriptive Statistics
VARIA-BELS
N Min. Max. Mean Std. Dev.
M NM M NM M NM M NM M NM
DSRI 275 275 0,0000 0,0000 71,8742 79,0101 1,523331 1,517669 4,5555348 5,1690591
GMI 275 275 -10,2968 -30,7835 46,9029 54,2857 1,098385 1,133917 3,2547690 4,2137648
AQI 275 275 -9,6494 ,0378 103,4172 18,6066 2,474276 1,232307 8,6944356 1,2985511
SGI 275 275 0,0000 0,0000 34,9789 9,4326 1,563582 1,089843 3,3733783 ,6217200
DEPI 275 275 ,0041 ,0779 710,3199 17,0488 3,873057 1,201979 42,8000485 1,2255369
SGAI 275 275 0,0000 0,0000 234,2819 38,5805 2,606914 1,320285 16,0525332 2,7922896
LEVI 275 275 ,0015 ,1230 35,1312 8,6669 1,360594 1,075235 2,7908490 ,5572005
TATA 275 275 -1,4837 -1,7027 ,9829 2,6484 -,036506 -,011051 ,2002957 ,2527153
Valid N (lwastw-
wase)
275 275
Source : Output SPSS (2018)
38 | Fhiqi Alfian & Ni Nyoman Alit Triani, Fraudulent Financial Reporting Detection
Leverage Index (LEVI) provides a descriptive description of manipulator companies, namely a minimum value of .0015 obtained from IndoritelMakmur International Tbk, with a maximum value of 35.1312 owned by Surya IntrindoMakmurTbk and an average value of 1.360594 and a standard deviation of 2.7908490.While for a non-manipulator company with a minimum value of 0.1230 owned by BerlianLaju Tanker Tbk, the maximum value was obtained from Central Omega Resources Tbk with a value of 8.6669 and an average value of 1.075235 and a standard deviation value of 0.5572005.
Total Accrual to Total Assets (TATA) for manipulator companies had a minimum value and maximum values of -1.4837 and 0.9829, respectively, are obtained from SkybeeTbk, then for the average value of -0.036506 and the standard deviation value 0.2002957.Whereas for non-manipulator companies the minimum value was -1.7027 owned by Rimo International Lestari Tbk, the maximum value was 2.6484 owned by Steady Safe Tbk and the average value was -0.011051 and the standard deviation value was0.2527153.
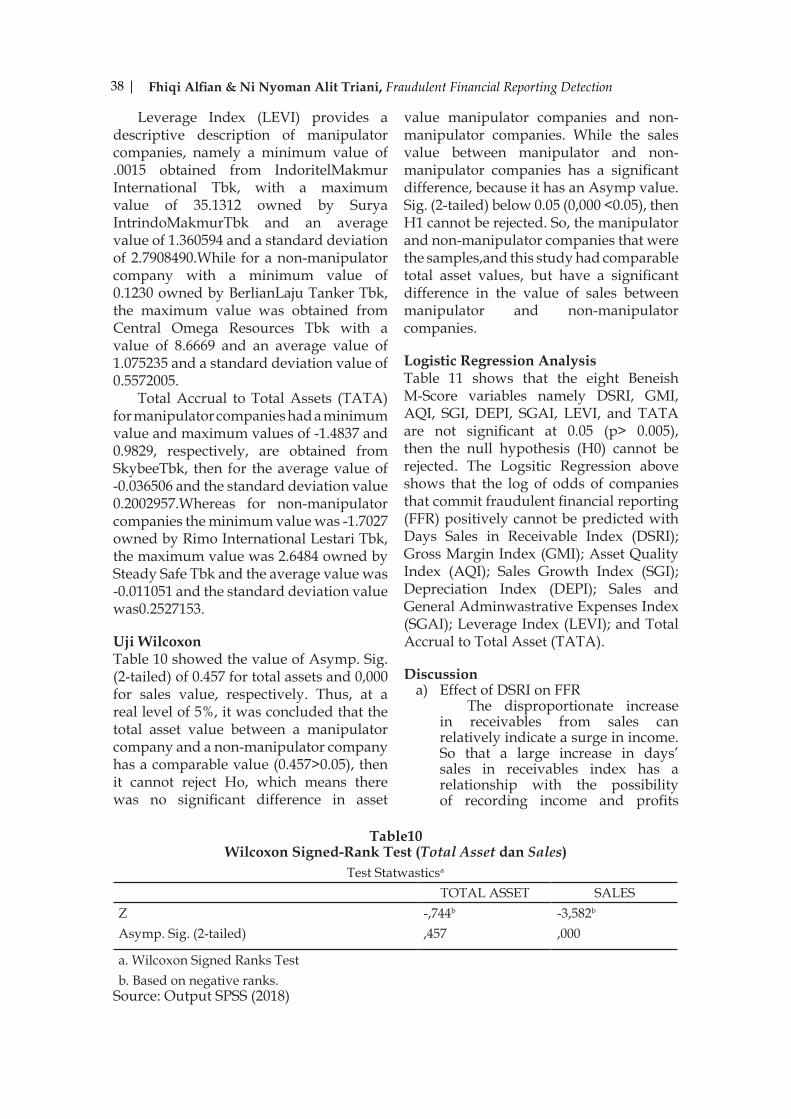
Uji WilcoxonTable 10 showed the value of Asymp. Sig. (2-tailed) of 0.457 for total assets and 0,000 for sales value, respectively. Thus, at a real level of 5%, it was concluded that the total asset value between a manipulator company and a non-manipulator company has a comparable value (0.457>0.05), then it cannot reject Ho, which means there was no significant difference in asset
value manipulator companies and non-manipulator companies. While the sales value between manipulator and non-manipulator companies has a significant difference, because it has an Asymp value. Sig. (2-tailed) below 0.05 (0,000 <0.05), then H1 cannot be rejected. So, the manipulator and non-manipulator companies that were the samples,and this study had comparable total asset values, but have a significant difference in the value of sales between manipulator and non-manipulator companies.
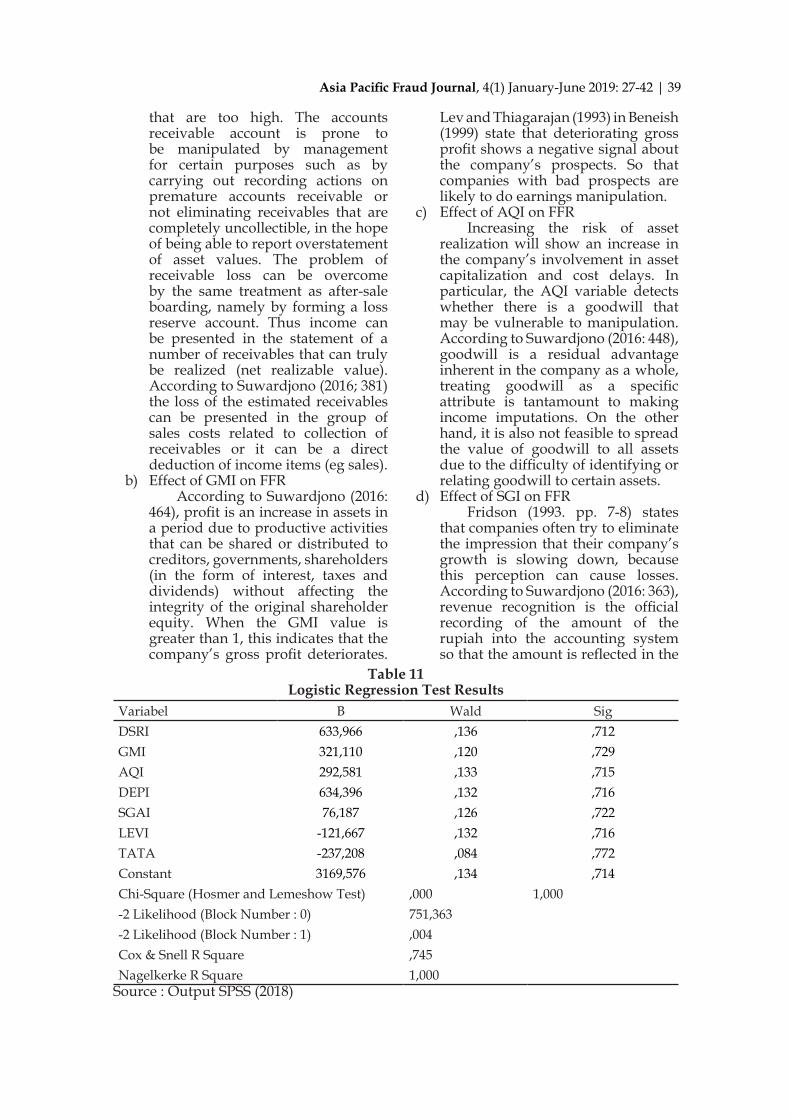
Logistic Regression AnalysisTable 11 shows that the eight Beneish M-Score variables namely DSRI, GMI, AQI, SGI, DEPI, SGAI, LEVI, and TATA are not significant at 0.05 (p> 0.005), then the null hypothesis (H0) cannot be rejected. The Logsitic Regression above shows that the log of odds of companies that commit fraudulent financial reporting (FFR) positively cannot be predicted with Days Sales in Receivable Index (DSRI); Gross Margin Index (GMI); Asset Quality Index (AQI); Sales Growth Index (SGI); Depreciation Index (DEPI); Sales and General Adminwastrative Expenses Index (SGAI); Leverage Index (LEVI); and Total Accrual to Total Asset (TATA).
Discussiona) Effect of DSRI on FFR
The disproportionate increase in receivables from sales can relatively indicate a surge in income. So that a large increase in days’ sales in receivables index has a relationship with the possibility of recording income and profits
Table10Wilcoxon Signed-Rank Test (Total Asset dan Sales)
Test Statwasticsa
TOTAL ASSET SALESZ -,744b -3,582b
Asymp. Sig. (2-tailed) ,457 ,000
a. Wilcoxon Signed Ranks Testb. Based on negative ranks.
Source: Output SPSS (2018)
Asia Pacific Fraud Journal, 4(1) January-June 2019: 27-42 | 39
that are too high. The accounts receivable account is prone to be manipulated by management for certain purposes such as by carrying out recording actions on premature accounts receivable or not eliminating receivables that are completely uncollectible, in the hope of being able to report overstatement of asset values. The problem of receivable loss can be overcome by the same treatment as after-sale boarding, namely by forming a loss reserve account. Thus income can be presented in the statement of a number of receivables that can truly be realized (net realizable value). According to Suwardjono (2016; 381) the loss of the estimated receivables can be presented in the group of sales costs related to collection of receivables or it can be a direct deduction of income items (eg sales).
b) Effect of GMI on FFRAccording to Suwardjono (2016:
464), profit is an increase in assets in a period due to productive activities that can be shared or distributed to creditors, governments, shareholders (in the form of interest, taxes and dividends) without affecting the integrity of the original shareholder equity. When the GMI value is greater than 1, this indicates that the company’s gross profit deteriorates.
Lev and Thiagarajan (1993) in Beneish (1999) state that deteriorating gross profit shows a negative signal about the company’s prospects. So that companies with bad prospects are likely to do earnings manipulation.
c) Effect of AQI on FFRIncreasing the risk of asset
realization will show an increase in the company’s involvement in asset capitalization and cost delays. In particular, the AQI variable detects whether there is a goodwill that may be vulnerable to manipulation. According to Suwardjono (2016: 448), goodwill is a residual advantage inherent in the company as a whole, treating goodwill as a specific attribute is tantamount to making income imputations. On the other hand, it is also not feasible to spread the value of goodwill to all assets due to the difficulty of identifying or relating goodwill to certain assets.
d) Effect of SGI on FFRFridson (1993. pp. 7-8) states
that companies often try to eliminate the impression that their company’s growth is slowing down, because this perception can cause losses. According to Suwardjono (2016: 363), revenue recognition is the official recording of the amount of the rupiah into the accounting system so that the amount is reflected in the
Table 11Logistic Regression Test Results
Variabel B Wald SigDSRI 633,966 ,136 ,712GMI 321,110 ,120 ,729AQI 292,581 ,133 ,715DEPI 634,396 ,132 ,716SGAI 76,187 ,126 ,722LEVI -121,667 ,132 ,716TATA -237,208 ,084 ,772Constant 3169,576 ,134 ,714Chi-Square (Hosmer and Lemeshow Test) ,000 1,000-2 Likelihood (Block Number : 0) 751,363-2 Likelihood (Block Number : 1) ,004Cox & Snell R Square ,745Nagelkerke R Square 1,000
Source : Output SPSS (2018)
40 | Fhiqi Alfian & Ni Nyoman Alit Triani, Fraudulent Financial Reporting Detection
financial statement. There are times when the sale of goods accompanied by the right to return (right of return), the right to return does not preclude the recognition of income at the time of sale and the sale of cash deductions also in no way prevent the recognition of revenue at the time of sale.
e) Effect of DEPI on FFRA DEPI that is greater than
1 indicates that the rate at which assets are depreciated more slowly increases the likelihood that the company has changed the estimated useful life of the asset or adopted a new method that can increase profits. According to Suwardjono (2016: 445), depreciation should not be postponed simply because “income cannot cover costs”, the reason is that the wear / damage process will not stop because physical assets are not used and technological developments also continue to run during the depressation period. With the principle of accruals, depreciation is not an assessment process and also is not a means to cover the replacement price of fixed assets from consumers but rather a step (procedure) in the process of appropriately comparing costs and revenues.
f) Effect of SGAI on FFRThis variable is derived
from the results of research Lev and Thiangarajan (1993) which states that analysts will interpret a disproportionate increase in a sale, indicating a negative signal for the company’s prospects in the future. According to Suwardjono (2016: 412), the concept of effort and achievement states that cost is an effort in order to obtain achievement in the form of income, this means there is a causal relationship between costs and income. The criteria for recognizing costs are utilization and disappearance, costs are recognized when economic benefits have been consumed in the context of delivering goods or services to bring income or when future economic benefits have disappeared (Suwardjono, 2016: 450).
g) Effect of LEVI on FFRThe value of LEVI greater than 1
indicates an increase in the company’s debt. This variable is included in identifying earnings manipulations caused by debt contract incentives. Obligations have three main characteristics, namely the sacrifice of future economic benefits, become a necessity nowadays, and arise due to transactions or past events. The obligation to be more assertive if supported by the obligation to pay cash, its identification is paid off, and legally forced. The occurrence of liabilities is generally accompanied by the acquisition of assets or the emergence of costs (Suwardjono, 2016: 321).
h) Effect of TATA on FFRBeneish uses total accruals of
total assets as a proxy to measure how much cash is a basis for reporting company profits. To determine a decent profit, cash base income must be compared with the costs that have been spent on cash, in other words the basic cash income must be compared with the accrual basis cost (Suwardjono, 2016: 394). Profit is the element that is most the concern of users of financial statements because the profit figures are expected to be rich enough to represent the company’s overall performance Therefore, from the point of view of accounting engineering or fraudulent financial reporting, the concept of profit is developed to meet the goal of providing information about company performance broadly (Suwardjono, 2016: 509).
5. CONCLUSIONThe Beneish M-Score model had a high probability of detecting fraudulent financial reporting. The results showed that there were 28 of the 55 manipulator companies correctly classified as fraud firms by 50.91%, while for the category of non-manipulator companies, there were as many as 60% or 33 of the 55 classified companies appropriately declared as non-fraud firms. The results also identified three M-Score variables that were often
Asia Pacific Fraud Journal, 4(1) January-June 2019: 27-42 | 41
manipulated by manipulator and non-manipulator companies, namely Sales and General and Adminwastrative Expenses Index (SGAI), Depreciation Index (DEPI), and Asset Quality Index (AQI), but twoother variables namely Days Sales in Receivables Index (DSRI) and Sales Growth Index (SGI) are considered unable to detect fraudulent financial reporting.Based on the results of the Logsitic regression test and the discussion described earlier, it shows that the eight Beneish M-Score model variables have no effect on the detection of fraudulent financial reporting. Thiswas because the calculation of the Beneish M-Score model has a high multicollinearity that causes the ratio t (Sig value, variable in the equation) to be statistically insignificant, but both the R2 and the goodness of fit size of a model have a high value. Days Sales in Receivables Index (DSRI) detects the possibility of companies conducting asset overstatement: through improper increase in the value of accounts receivable. Then, the Gross Margin Index (GMI) variable can describe the economic difficulties that the company was experiencing. The Asset Quality Index (AQI) detects there was goodwill or the company deliberately capitalizes assets improperly. The Sales Growth Index (SGI) detects intentions in recognizing fictitious sales revenue, the variable Depreciation Index (DEPI) detects the company’s intentions in delaying depreciation expenses in the hope that reported profits will be higher. The Sales and General and Adminwastrative Expenses Index (SGAI) describes the proportion of operating expenses against company sales, and the Leverage Index (LEVI) identifies earnings manipulation caused by debt contract incentives and the Total Accrual to Total Assets (TATA) variable measuring how much cash was a baswas company profit reporting. This research had limitations, therefore the researcher proposes several suggestions, namely: 1) Further research was needed on the effect of the Beneish M-Score model on other factors beyond fraudulent financial
reporting such as market response or stock returns. 2) This study has limitations, for further research it can use methods other than Logsitic regression tests and use tools other than SPSS in testing Logistic regression.
6. REFFERENCIES
Association of Certified Fraud Examiners. (2016). Report to the nations on occupational fraud and abuse. Association of Certified Fraud Examiners, 1–92.
Association of Certified Fraud Examiners. (2016). Survai Fraud Indonesia. Association of Certified Fraud Examiners, 1–62.
Beneish, M. D. (1999). The Detection of Earnings Manipulation.
Beneish, M. D., Lee, C. M. C., & Nichols, D. C. (2012). Fraud Detection and Expected Returns.
Beneish, M. D., & Nichols, D. C. (2007). The Predictable Cost of Earnings Manipulation.
Erickson, M., Hanlon, M., & Maydew, E. (2004). Was There a Link Between Executive Compensation and Accounting Fraud?
Ghozali, I. (2016). Aplikasi Analisis Multivariete Dengan Program IBM SPSS 23. (Prayogo P Harto, Ed.) (8th ed.). Semarang: Badan Penerbit Universitas Diponegoro.
Gujarati, D. N., & Porter, D. C. (2010). Dasar-Dasar Ekonometrika (5th ed.). Jakarta: Salemba Empat.
Hasan, M. S., Omar, N., Barnes, P., & Handley-Schachler, M. (2017). A cross-country study on manipulations in fi nancial statements of lwasted companies Evidence from Asia. Journal of Financial Crime, 24(4), 656–677. https://doi.org/10.1108/JFC-07-2016-0047
42 | Fhiqi Alfian & Ni Nyoman Alit Triani, Fraudulent Financial Reporting Detection
Healy, P. M., & Wahlen, J. M. (1999). A review of the earnings management literature and its implications for standard setting. Accounting Horizons.
Holthausen, R. W., & Leftwich, R. W. (1983). The economics consequences of accounting choice. Journal of Accounting and Economics, 5(2), 77–117.
Ikatan Akuntan Publik Indonesia. Standar Audit 240 Tentang Tanggung Jawab Auditor Terkait dengan Kecurangan dalam Suatu Audit atas Laporan Keuangan (2015). Indonesia.
Kamal, M. E. M., Salleh, M. F. M., & Ahmad, A. (2016). Detecting Financial Statement Fraud by Malaysian Public Lwasted Companies: The Reliability of the Beneish M-Score Model. Jurnal Pengurusan, 46, 23–32.
Ramírez-Orellana, A., Martínez-Romero, M. J., & Marino-Garrido, T. (2017). Measuring fraud and earnings management by a case of study: Evidence from an international family business. European Journal of Family Business (2017), XXX, 1–13. https://doi.org/10.1016/j.ejfb.2017.10.001
Sarwono, J. (2006). Metode Penelitian Kuantitatif dan Kualitatif. Yogyakarta: Graha Ilmu.
Sekaran, U., & Bougie, R. (2013). Research Methods For Business. United Kingdom: John Wiley & Sons, Inc.
Setiawan, B. (2015). Teknik Praktik Analwaswas Data Penelitian Sosial dan Bwasnwas Dengan SPSS. (Nikodemus, Ed.) (1st ed.). Yogyakarta: Andi Yogyakarta.
Suwardjono. (2006). Teori Akuntansi Perekayasaan Pelaporan Keuangan. Edisi Ketiga. Yogyakarta : BPFE : Yogyakarta.
Sugiyono. (2017). Metode Penelitian Kuantitatif, Kualitatif, Dan R&D (26th ed.). Bandung: Alfabeta CV.
Tarjo, & Herawati, N. (2015). Application of Beneish M-Score Models and Data Mining to Detect Financial Fraud. Procedia - Social and Behavioral Sciences, 211(September), 924–930. https://doi.org/10.1016/j.sbspro.2015.11.122
Teoh, S. H., Welch, I., & Wong, T. J. (1998). Earnings management and the long-term under performance of initial public offerings. Journal of Finance, 53, 1935–1974.
Tuanakotta, T. M. (2010). Akuntansi Forensik Dan Audit Investigatif. (T. E. S. Empat, Ed.) (2nd ed.). Salemba Empat.
Tuanakotta, T. M. (2013). Mendeteksi Manipulasi Laporan Keuangan. (E. S. Suharsi, Ed.). Jakarta: Salemba Empat.
Tuanakotta, T. M. (2015). Audit kontemporer. (E. S. Suharsi, Ed.). Jakarta: Salemba Empat.
Widarjono, A. (2015). Analwaswas Multivariat Terapan Dengan Program SPSS, AMOS, dan Smartplas. Yogyakarta: UPP STIM YKPN.