frbclev_econtrends_200707.pdf
TRANSCRIPT

1
In Th is IssueEconomy in Perspective
Tick-tock … Infl ation and Prices
May Price Statistics Money, Financial Markets, and Monetary Policy
Assessing New Information: What’s Permanent, What’s Not?Monetary Policy: What’s in a Few Words?Th e Yield Curve’s Prognosis for Economic Growth
International Markets Sovereign Wealth Funds
Economic Activity and Labor Markets Th e Employment Situation Employment and Firm Size over the Business Cycle
Regional Activity Midwest Housing Markets
Banking and Financial Institutions Fourth District Bank Holding Companies
Economic TrendsFederal Reserve Bank of Cleveland
July 2007(Covering June 20, 2007 - July 12, 2007)

2
Economic Trends is published by the Research Department of the Federal Reserve Bank of Cleveland.
Views stated in Economic Trends are those of individuals in the Research Department and not necessarily those of the Fed-eral Reserve Bank of Cleveland or of the Board of Governors of the Federal Reserve System. Materials may be reprinted provided that the source is credited.
If you’d like to subscribe to a free e-mail service that tells you when Trends is updated, please send an empty email mes-sage to [email protected]. No commands in either the subject header or message body are required.
ISSN 0748-2922

3
Th e Economy in Perspective Tick-tock…07.12.07 by Mark S. Sniderman
Th e majority opinion among private economic forecasters is that the U.S. economy is in the last phase of adjust-ing to a series of disturbances from energy and housing markets. Most forecasters expect the economy to resume its growth, at a rate close to its longer-term trend, sometime in next year or perhaps earlier, depending on how soon the depressing eff ects of the housing markets start to wane.
Infl ation, which has been uncomfortably high more often than not during the past few years, seems to be heading back toward an acceptable range, although evidence on this point is not conclusive. Drawing a bead on the infl ation trend is tricky because there are many measures of infl ation itself and of its underlying trend, termed core infl ation. All the measures tend to paint to a similar picture over time horizons of a few years, but we are in one of those peri-ods when convergence is not yet evident: Some scorecards still show infl ation hanging above 3 percent, while others indicate that it has fallen to 2 percent or below.
Housing conditions are equally unclear. In terms of sales volumes and unit prices, new and existing homes have not been moving congruently for much of the past year. New and existing homes are not perfect substitutes for one an-other in either features or location, and we use diff erent sources to estimate their sale prices. On average throughout the country, sales volumes have fallen more for new homes than for existing ones, but prices for new homes appear to be holding up somewhat better than those of existing homes.
Th e housing market is important, not only for individual owners and would-be owners but also for its potential macroeconomic implications. As housing credit markets tighten up, it is uncertain how the subsequent wave of adjustable-rate loan refi nancing will play out. For some homeowners, higher interest payments will undoubtedly forestall spending elsewhere; for others, refi nancing may not be possible at all. Apart from that, to the extent that consumption formerly was supported by cash-out mortgage refi nancing, higher interest rates and more fragile hous-ing valuations are likely to become constraining infl uences. Yet, so far this year, consumption spending on the whole appears sound.
Th e U.S. economy’s rebalancing after these housing and energy shocks takes place in the context of a much larger and more profound rebalancing of world economic activity. Unless China, India, and a slew of other countries that are relatively new entrants to global trading and fi nancial markets abruptly slow down or reverse course, the econo-mies of the United States and other developed nations may be entering a long period of adjustment
Th e energy market is one of the most important markets being aff ected by this rebalancing. Over extended periods of time, as we have seen, energy is subject to substantial price swings, which can aff ect both economic growth and measured infl ation. Unless rising energy prices are off set by price movements for other goods and services, infl a-tion will rise. If people view energy price increases as largely transitory, they are not likely to foresee an enduring connection between events in the energy market and the general infl ation rate. Indeed, during the past few years, longer-term infl ation expectations have held relatively steady in the face of elevated short-term infl ation, a sign of public confi dence in the Federal Reserve. However, as investment advisors are fond of saying, past performance is no guarantee of future results. However, monetary policymakers would be unable to ignore persistent price increases for energy or for other goods and services, if those increases were accompanied by a notable deterioration in infl ation expectations.

4
While an expanded world economy off ers promising opportunities for all who join, it introduces fresh complications as nations work to harmonize their trading practices and agree on mechanisms for resolving their disputes. Global economic expansion also provides greater scope for prices, interest rates, and exchange rates to fl uctuate as diff erenc-es in national savings propensities, regulatory systems, labor market practices, and other forces infl uence patterns of consumption, investment, labor utilization, and productivity within and across countries. It is easy to underestimate the strength and duration of these forces, for they play out incrementally over time and often reveal themselves in prosaic ways. But play out they do.
Infl ation and PricesMay Price Statistics
06.29.07 by Michael F. Bryan and Linsey Molloy
Th e headline CPI surged 8.4 percent (annual-ized rate) during the month—its highest monthly growth rate since the aftermath of Hurricane Katrina, in September 2005. Th e monthly CPI advance refl ects elevated food prices and sharply higher energy prices. Energy prices have risen at an average annualized monthly rate of roughly 30 percent during the fi rst four months of the year and soared nearly 90 percent in May. Th e total or “headline” CPI increase exceeded analyst expecta-tions and was a marked acceleration from longer-term CPI-measured infl ation trends. Th e relative price of energy, notably petroleum, has fl uctuated rather widely over the past few years, after having shown a persistent and sharp rise during the fi rst half of the current decade.
While the monthly headline infl ation measure is a reasonably good approximation of the changing costs that households actually face, they are not very reliable measures of the infl ation trend that a central bank hopes to contain. Th e core infl ation measures, which reduce the infl uence of short-term price volatility coming from certain index compo-nents—like petroleum—have revealed a relatively more favorable pattern over the past few months. For example, the CPI excluding food and energy was up a modest 1.8 percent (annualized) in May while the median CPI fell to 1.0 percent, its slowest monthly growth rate in almost four years. And the monthly growth rate of the 16 percent trimmed-mean CPI dropped to 2.3 percent in May, below its 3-month, 6-month, and 12-month averages. In their June statement, the Federal Open Market
May Price Statistics
Percent change, last:
1 mo.a 3 mo.a 6 mo.a 12 mo. 5 yr.a2006 avg.
Consumer Price Index All items 8.5 7.0 5.5 2.7 3.0 2.6Less food and energy
1.8 1.5 2.1 2.2 2.0 2.6
Medianb 1.0 2.1 2.6 3.1 2.6 3.616% trimmed meanb 2.3 2.7 2.9 2.7 2.3 2.7Producer Price Index
Finished goods 11.4 11.0 8.5 4.1 3.9 1.5Less food and energy
2.3 0.7 1.8 1.6 1.4 2.1
a. Annualized.b. Calculated by the Federal Reserve Bank of Cleveland.Sources: U.S. Department of Labor, Bureau of Labor Statistics; and Federal Reserve Bank of Cleveland.
1520253035404550556065707580
2000 2001 2002 2003 2004 2005 2006 2007
Dollars per barrel, weeklyOil Prices
Source: The Wall Street Journal.

5
Committee asserted that “Readings on core infl a-tion have improved modestly in recent months. However, a sustained moderation in infl ation pres-sures has yet to be convincingly demonstrated.”
Owner’s equivalent rent of primary residence (OER), which accounts for nearly one-quarter of the overall CPI, rose at a mere 1.0 annualized rate in May—its slowest monthly growth rate in nearly four years. Some of the recent deceleration in monthly OER growth comes from a more moder-ate rise in rents and may be a consequence of a housing market that continues to fl ounder. Howev-er, some of the recent deceleration in monthly OER growth may also come from accelerating utilities costs, which are generally assumed by a landlord, and thus, subtracted from the OER housing cost measure. So recent patterns in the OER measure might not remain as favorable as the most recent data would suggest.
Th e infl ation trend over the last 12 months, as mea-sured by the CPI, CPI excluding food and energy, and the 16 percent trimmed-mean CPI, is between 2¼ and 2¾ percent. Infl ation in core service prices has ranged largely between 3 percent and 4 percent over the past year, while prices for core goods (i.e., commodities less food and energy commodities) continue to decline.
Meanwhile, households’ year-ahead infl ation expectations remained a bit elevated at 4.2 percent in June, while expectations for infl ation over the next 5 to 10 years, which are more correlated with movements in core infl ation, fell from 3.7 per-cent in May to 3.3 percent. Longer-term infl ation expectations are back in the 3 percent–3½ percent range in which they’ve generally fl uctuated for nearly decade.
Professional forecasters and fi nancial market par-ticipants are more optimistic about the infl ationary environment. A consensus forecast from the Blue Chip panel of economists suggests that core infl a-tion will register 2.3 percent in 2007 and 2008. Th is is the same rate as market-based measures of infl ation expectations, which show that investors anticipate that the CPI will grow between 2¼ and 2½ percent over the next decade.
0.500.550.600.650.700.750.800.850.900.951.001.051.101.151.20
1967 1971 1975 1979 1983 1987 1991 1995 1999 2003 2007
Ratio
CPI: Energy / CPI excluding energy
CPI: Food and beverages / CPI excluding food
Relative Prices
Source: U.S. Department of Labor, Bureau of Labor Statistics.
0.0
1.0
2.0
3.0
4.0
5.0
6.0
7.0
1995 1997 1999 2001 2003 2005 2007
Housing Prices1-month annualized percent change
CPI: Rent of primary residence
CPI: Owner’s equivalent rent of primary residence
Sources: U.S. Department of Labor, Bureau of Labor Statistics; and Federal Reserve Bank of Cleveland.
1.001.251.501.752.002.252.502.753.003.253.503.754.004.254.504.75
1995 1997 1999 2001 2003 2005 2007
12-month percent change
Core CPI
Median CPIa
16% trimmed-mean CPI a
CPI
CPI, Core CPI, and Trimmed-mean CPI Measures
a. Calculated by the Federal Reserve Bank of Cleveland. Sources: U.S. Department of Labor, Bureau of Labor Statistics, and Federal Reserve Bank of Cleveland.

6
-6.00-5.00-4.00-3.00-2.00-1.000.001.002.003.004.005.006.007.008.00
1995 1997 1999 2001 2003 2005 2007
12-month percent change
Core goods1- month annualized percent change
Core CPI Goods and Core CPI Services
a. Calculated by the Federal Reserve Bank of Cleveland.Sources: U.S. Department of Labor, Bureau of Labor Statistics, and Federal Reserve Bank of Cleveland.
Core services
1-month annualized percent change
1.0
1.5
2.0
2.5
3.0
3.5
4.0
4.5
5.0
5.5
6.0
1995 1996 1997 1998 1999 2000 2001 2002 2003 2004 2005 2006 2007
12-month percent change
Five to 10 years ahead
One year ahead
Household Inflation Expectations*
*Mean expected change as measured by the University of Michigan’s Survey of Consumers.Source: University of Michigan.
1.0
1.5
2.0
2.5
3.0
3.5
1995 1997 1999 2001 2003 2005 2007
12-month percent change, December
Top 10 average
Bottom 10 average
Consensus
Core CPI Inflation and Forecasts
Source: Blue Chip panel of economists, June 10, 2007.
0.751.001.251.501.752.002.252.502.753.003.253.50
1997 1999 2001 2003 2005 2007
Percent, monthly
10-year TIPS-derived expected inflation
Adjusted 10-year TIPS-derived expected inflationa
Market-Based Inflation Expectations*
*Derived from the yield spread between the 10-year Treasury note and Treasury inflation-protected securities.a. Ten-year TIPS-derived expected inflation, adjusted for the liquidity premium on the market for the 10-year Treasury note.Sources: Federal Reserve Bank of Cleveland; and Bloomberg Financial Information Services.

7
Money, Financial Markets, and Monetary Policy Assessing New Information: What’s Permanent, What’s Not?
07.11.07 by John Carlson and Bethany Tinlin
After the Federal Open Market Committee (FOMC) meets to determine its policy rate, it issues a statement to explain its decision. Th at statement typically includes a sentence to empha-size that future policy adjustments will depend on the evolution of the outlook for both infl ation and economic growth, as implied by incoming informa-tion. Financial market analysts thus keep a keen eye on the fl ow of new information to assess how it will aff ect the Committee’s choice of the federal funds rate target at upcoming meetings.
New information often does not aff ect the outlook enough to warrant a policy action. During the past year, for example, the policy rate—the intended federal funds rate—remained unchanged. Because short-term rates tend to be closely tethered to the policy rate, short-term Treasury yields did not vary much relative to periods over which the policy rate did change.
Although short-term rates varied some, they hov-ered at levels below the policy rate, providing a sign that market participants expected the next policy action to be a rate cut. To some extent, the movements refl ect changes in the expected path of policy, given new information.
Prices of fed funds futures can also be used to infer the expected path of policy actions via their implied yields. Moreover, options based on those futures provide a means to estimate the distribution of those expectations. Implied yields based on futures prices corroborate the view that during the fi rst four months of 2007, market participants built in a projection for rate cuts later in the year, as new information indicat-ed a weaker than expected level of economic activity.
During the late spring, however, incoming data indicated that economic growth was rebounding to a moderate rate. Indeed, on June 13, 2007, im-plied yields suggested that no rate cut was on the horizon. Th is change in the expected policy path, however, has not been sustained.
*All yields are from constant-maturity series.Source: Federal Reserve Board, “Selected Interest Rates,” Federal Reserve Statistical Releases, H.15.
0
1
2
3
4
5
6
7
8
1998 1999 2000 2001 2002 2003 2004 2005 2006 2007
Three-monthTreasury bill
One-year Treasury bill
Two-year Treasury note
Percent, weekly average
Short-term Interest Rates*
Intended federal funds rate
*All yields are from the constant-maturity series.a. One day after FOMC meeting.Source: Bloomberg Financial Information Services.
4.95
5.00
5.05
5.10
5.15
5.20
5.25
5.30
Feb Apr Jun Aug Oct Dec Feb
Percent
Feb 1, 2007 June 13, 2007a
a
2007 2008
Implied Yields on Federal Funds Futures*
Mar 22, 2007
May 10, 2007a
June 27, 2007
July 10, 2007

8
*Probabilities are calculated using trading-day closing prices from options on January 2007 federal funds futures that trade on the Chicago Board of Trade.Sources: Chicago Board of Trade; and Bloomberg Financial Services.
0.00.10.20.30.40.50.60.70.80.91.0
6/08 6/12 6/16 6/20 6/24 6/28 7/02 7/06 7/10
Implied probability
5.25%
5.50%4.75%5.00%
Implied Probabilities of Alternative Target Federal Funds Rates, October Meeting Outcome*
June 13
a. Yields are from constant-maturity series.Source: Federal Reserve Board, “Selected Interest Rates,” Federal Reserve Statistical Releases, H.15.
3
4
5
6
7
8
9
1998 1999 2000 2001 2002 2003 2004 2005 2006 2007
10-year Treasury note
20-year Treasury bond
Percent, weekly average
Conventional mortgage
aa
Long-term Interest Rates
a. Day after the FOMC meeting.b. Day of FOMC meeting.Sources: Board of Governors of the Federal Reserve System, “Selected Interest Rates,” Federal Reserve Statistical Releases, H.15; and Bloomberg Financial Information Services.
4.44.54.64.74.84.95.05.15.25.35.4
0 5 10 15 20
Percent, weekly average
Mar 22, 2007a
Years to maturity
Feb 1, 2007a
June 27, 2007
May 10, 2007a
Yield Curve
July 10, 2007
Sources: Bloomberg Financial Information Services, Board of Governors of the Federal Reserve System, “Selected Interest Rates,” and Federal Reserve Statistical Releases, H.15.
0.0
0.5
1.0
1.5
2.0
2.5
3.0
3.5
4.0
1997 1998 1999 2000 2001 2002 2003 2004 2005 2006 2007
Long-term Inflation ExpectationsPercentage points
Ten-year TIPS-derived expected inflation
Ten-year adjusted TIPS-derived expected inflation
Stable
Estimated probabilities for alternative outcomes for the October meeting indicate a similar reaction to the data. Around June 13, 2007, market participants put a high-er probability on a rate hike than a rate cut, although neither outcome seemed likely at that meeting.
More recently, the news on infl ation has been relatively favorable, increasing the prospect of a rate cut. In sum, incoming news in recent weeks has altered expecta-tions about the path of the fed funds rate, but not in any convincingly permanent way. When looked at in cumulative terms, the outlook seems little changed.
Long-term interest rates have tended to move up in recent weeks. Such rates are typically infl uenced less by policy actions in the near term. Rather they are infl uenced more by underlying economic conditions and expectations about infl ation. Th e improvement in the economic outlook no doubt contributed to the recent rise, which seems consis-tent with a more positive slope of the yield curve.
Ideally, long-term infl ation expectations are tightly anchored and hence relatively fi xed. However, in his speech yesterday, Chairman Bernanke noted “Although infl ation expectations seem much better anchored today than they were a few decades ago, they appear to remain imperfectly anchored.” As an example, the Chairman noted that TIPs-based mea-sures of infl ation expectations still move in response to economic data and to current infl ation news, “which would not be the case if expectations were perfectly anchored.” Regardless of the variation, there’s no clear change in the pattern of expected infl ation.

9
Money, Financial Markets, and Monetary Policy Monetary Policy: What’s in a Few Words?
06.29.07 by John Carlson and Bethany Tinlin
Th e Federal Open Market Committee (FOMC) left the target level of the federal funds rate unchanged at 5.25 percent this afternoon. It was the eighth consecutive meeting at which the rate was held steady. Th e infl ation-adjusted fed funds rate rests near 3 percent, or about 400 basis points above its low of June 2004.
Any changes in the policy rate would have come as a great surprise to market participants. Indeed, implied yields and estimated probabilities based on fed funds futures indicate that a rate change is not likely before the end of the year. An adjustment to the post-meeting statement language, on the other hand, was widely anticipated.
Language changes were seen as necessary to account for the evolution of the outlook for both infl ation and economic growth since the last meeting. In its rationale for the May meeting decision, where rates were held steady, the FOMC said that economic growth had slowed and core infl ation remained “somewhat elevated.” Two favorable readings on CPI core infl ation and some good news on economic ac-tivity altered the FOMC’s basis for its rationale. Th e June statement reads: “ Readings on core infl ation have improved modestly in recent months. However, a sustained moderation in infl ation pressures has yet to be convincingly demonstrated.”
Concerning economic growth, the statement reads “Economic growth appears to have been moderate during the fi rst half of this year, despite the ongo-ing adjustment in the housing sector.” Th is com-pares with the May meeting statement, “Economic growth slowed in the fi rst part of the year and the adjustment to the housing sector is ongoing.” In the FOMC’s assessment of risk, the statement repeated last meeting’s language that “the Commit-tee’s predominant policy concern remains the risk that infl ation will fail to moderate as expected.”
Initial market reaction saw both equity prices and bond yields rise. Th en after some erratic move-
0
1
2
3
4
5
6
7
8
2000 2001 2002 2003 2004 2005 2006 2007
Percent
Effective federal funds rate
Intended federal funds rate
Primary credit rate
Discount rate
a
b
bb
Reserve Market Rates
a. Weekly average of daily figures.b. Daily observations.Source: Board of Governors of the Federal Reserve System, “Selected Interest Rates,” Federal Reserve Statistical Releases, H.15.
-2
-1
0
1
2
3
4
5
6
2000 2001 2002 2003 2004 2005 2006 2007
PercentReal Federal Funds Rate*
*Defined as the effective federal funds rate deflated by the core PCE. Shaded bar represents a recession. Source: U.S. Department of Commerce, Bureau of Economic Analysis; Board of Governors of the Federal Reserve System, “Selected Interest Rates,” Federal Reserve Statistical Releases, H.15; Federal Reserve Bank of Philadelphia; and Bloomberg Financial Information Services.

10
Implied Yields on Federal Funds Futures*Percent
*All yields are from the constant-maturity series.a. One day after FOMC meeting.Source: Bloomberg Financial Information Services.
4.95
5.00
5.05
5.10
5.15
5.20
5.25
5.30
Feb Mar Apr May Jun Jul Aug Sep Oct Nov Dec Jan
Feb 1, 2007 June 13, 2007a
a
2007 2008
Mar 22, 2007
May 10, 2007a
June 27, 2007
0.0
0.1
0.2
0.3
0.4
0.5
0.6
0.7
0.8
0.9
1.0
5/04 5/10 5/16 5/22 5/28 6/03 6/09 6/15 6/21 6/27
5.00%
5.25%
5.50%4.75%
Implied Probabilities of Alternative Target Federal Funds Rates September Meeting Outcome
4.50%
Implied probability
Existing home sales
CPI, Industrial production, UM Consumer sentiment
*Probabilities are calculated using trading-day closing prices from options on January 2007 federal funds futures that trade on the Chicago Board of Trade.Sources: Chicago Board of Trade; and Bloomberg Financial Services.
ments (the S&P index dropped briefl y into negative territory), stocks fi nished the trading session lower than just prior to the statement’s release and virtu-ally unchanged on the day. Th e 10-year Treasury yield fi nished the day higher by about 5 basis points and near the level to which it jumped immediately after the announcement.
Money, Financial Markets, and Monetary Policy Th e Yield Curve’s Prognosis for Economic Growth
06.26.07 by Joseph G. Haubrich and Brent Meyer
Since last month, the yield curve has steepened considerably, with short rates falling and long rates rising. As a consequence, the yield curve is no longer inverted. Th at is, long rates are once again higher than short rates. One reason for noting this is that the slope of the yield curve has achieved some notoriety as a simple forecaster of economic growth. Th e rule of thumb is that an inverted yield curve (short rates above long rates) indicates a recession in about a year, and yield curve inversions have preceded each of the last six recessions (as de-fi ned by the NBER). Very fl at yield curves preceded the previous two, and there have been two notable false positives: an inversion in late 1966 and a very fl at curve in late 1998. More generally, though, a fl at curve indicates weak growth, and conversely, a
Yield Spread and Real GDP Growth*
*Shaded bars indicate recessions.Sources: U.S. Department of Commerce, Bureau of Economic Analysis; and Board of Governors of the Federal Reserve System.
Percent
-4
-2
0
2
4
6
8
10
12
1953 1963 1973 1983 1993 2003
Yield spread: 10-year Treasury note minus 3-month Treasury bill
Real GDP growth (year-to-year percent change)

11
steep curve indicates strong growth. One measure of slope, the spread between 10-year bonds and 3-month T-bills, bears out this relation, particularly when real GDP growth is lagged a year to line up growth with the spread that predicts it.
Th e yield curve had been giving a rather pessimistic view of economic growth for a while now, but with the inversion gone, this is less pronounced. Th e spread has turned positive: With the 10-year rate at 5.20 percent and the 3-month rate at 4.66 percent (both for the week ending June 15), the spread stands at 54 basis points, up a lot from May’s −23 basis points. Projecting forward using past values of the spread and GDP growth suggests that real GDP will grow at about a 2.3 percent rate over the next year. Th is prediction is on the low side of other forecasts, in part because the quarterly average spread used here remains negative.
While such an approach predicts when growth is above or below average, it does not do so well in predicting the actual number, especially in the case of recessions. Th us, it is sometimes preferable to focus on using the yield curve to predict a discrete event: whether or not the economy is in recession. Looking at that relationship, the expected chance of a recession in the next year is 15 percent, down a quite a bit from Mays’s value of 35 percent and April’s 38 percent. Th e 15 percent is close to the 16.9 percent calculated by James Hamilton over at Econbrowser (though to be fair we are calculating diff erent events: Our number gives a probability that the economy will be in recession over the next year. Econbrowser looks at the probability that the quarter fourth quarter of 2006 was in a recession).
Of course, it might not be advisable to take this number quite so literally, for two reasons. First, this probability is itself subject to error, as is the case with all statistical estimates. Second, other research-ers have postulated that the underlying determi-nants of the yield spread today are materially dif-ferent from the determinants that generated yield spreads during prior decades. Diff erences could arise from changes in international capital fl ows and infl ation expectations, for example. Th e bottom line is that yield curves contain important informa-tion for business cycle analysis, but, like other indica-tors, should be interpreted with caution.
Yield spread: 10-year Treasury note minus 3-month Treasury bill
One-year-lagged real GDP growth (year-to-year percent change)
Yield Spread and Lagged Real GDP Growth
Sources: U.S. Department of Commerce, Bureau of Economic Analysis; and Board of Governors of the Federal Reserve System.
Percent
-4
-2
0
2
4
6
8
10
12
1953 1963 1973 1983 1993 2003
Yield spread: 10-year Treasury note minus the 3-month Treasury bill
Real GDP growth(year-to-year percent change)
Predicted GDP growth
Predicted GDP Growth and the Yield Spread
Sources: U.S. Department of Commerce, Bureau of Economic Analysis; the Board of Governors of the Federal Reserve System; and authors’ calculations.
Percent
-2
-1
0
1
2
3
4
5
6
3/02 3/03 3/04 3/05 3/06 3/07 3/08
Probability of Recession Based on the Yield Spread*
*Estimated using probit model. Shaded bars indicate recessions.Sources: U.S. Department of Commerce, Bureau of Economic Analysis; Board of Governors of the Federal Reserve System; and authors’ calculations.
Percent
0
10
20
30
40
50
60
70
80
90
100
1960 1966 1972 1978 1984 1990 1996 2002 2008
ForecastProbabilityof recession

12
For more detail on these and other issues related to using the yield curve to predict recessions, see the Commentary “Does the Yield Curve Signal Reces-sion?”
International Markets Sovereign Wealth Funds
07.02.07 by Owen F. Humpage and Michael Shenk
Th e fl ip side of our current account defi cits these past 25 years has been an infl ow of foreign savings. Th ese funds have been quite benefi cial: Th ey helped to keep real interest rates lower than they otherwise would have been, thereby promoting interest-sensi-tive sectors of the economy, like investment and consumers’ durable spending. But would we be so sanguine about the economic benefi ts of these fi -nancial infl ows if foreign governments directed the placement? Foreign governments are increasingly interested in earning higher returns on their large and growing reserve portfolios.
Most governments maintain portfolios of foreign exchange reserves as insurance funds against tempo-rary shortfalls or reversals in their foreign currency receipts. Countries’ ability to sell their foreign ex-change reserves in the face of short-lived problems with their balance of payments helps them avoid currency depreciations without either imposing re-straints on imports and fi nancial outfl ows or imme-diately adopting defl ationary macroeconomic poli-cies. Countries acquire foreign exchange reserves by managing their exchange rates; they traditionally invest their reserves in low-risk liquid assets like for-eign government securities, interest-bearing depos-its, or repurchase agreements. Th e U.S. dollar is the key international reserve currency, accounting for about 65 percent of the world’s total portfolio. Th e euro, with approximately 25 percent of the total, is a distant second, and the British pound comes in third with 5 percent. Th e Japanese yen also plays a noteworthy role as an offi cial reserve currency.
A sharp increase in offi cial holdings of foreign exchange reserves began in the early 1990s and accelerated after 2001, probably in response to the global fi nancial crises of 1997 and 1998 and the
Currency Composition of Worldwide Reserve Holdings
U.S. dollars64.7%
Euros 25.8%
British pounds 4.4%
Japanese yen 3.2%
All others 1.8%
Source: International Monetary Fund, International Financial Statistics, COFER data.
0
1
2
3
4
5
6
1972 1976 1980 1984 1988 1992 1996 2000 2004
Foreign Exchange ReservesTrillions of U.S. dollars
World
Industrial countries
Non-oil-exporting developing countries
Source: International Monetary Fund, International Financial Statistics.
Oil-exporting developing countries

13
sustained rise in oil prices. Th e gains seem large, not only in an absolute sense but also relative to traditional rules of thumb for reserve needs like countries’ imports or their outstanding short-term debts. Th e sharpest increase in reserve holdings has occurred among the developing countries, although Japan’s portfolio expanded rapidly through 2003. China, which tightly manages the renminbi–dollar exchange rate, holds the largest reserve portfolio, approximately $1.2 trillion.
Traditionally, reserve portfolios’ low yield has made them rather expensive insurance funds, particularly for developing countries where the rate of return on domestic infrastructure and the interest cost of foreign loans can be rather high. Concerns about the opportunity cost of holding large and rapidly growing reserve portfolios have prompted some developing countries to seek higher yields.
In doing so, they have turned to sovereign wealth funds. Th ese are government investment vehicles that seek a higher yield on offi cial foreign exchange receipts by diversifying into a broad range of assets, including long-term government bonds, corporate bonds and stocks, derivatives, commodities, and real estate. Th ese funds have a higher tolerance for risk than do traditional offi cial reserve portfolios. To the extent that the fi nancial resources contained in sovereign wealth funds are not readily available to monetary authority for exchange rate stabiliza-tion or balance-of-payments purposes, they are distinct from offi cial foreign exchange reserves.
Sovereign wealth funds have been around since at least 1956. Countries that either owned or taxed exported commodities—like oil—initially estab-lished them, eff ectively replacing real assets taken from the ground with high-yielding fi nancial assets and thereby creating a revenue source for future generations. Norway’s Government Pension Fund-Global is a prominent example of a commodity-based sovereign wealth fund. Such funds account for an estimated two-thirds of all sovereign wealth funds.
Th e emergence of reserve-based sovereign wealth funds is fairly recent. Singapore created the fi rst—the Singapore Global Investment Corporation—in 1981. Korea started a reserve-based sovereign
0
0.2
0.4
0.6
0.8
1.0
1.2
1.4
1972 1976 1980 1984 1988 1992 1996 2000 2004
Foreign Exchange ReservesTrillions of U.S. dollars
Japan
China
Korea
Source: International Monetary Fund, International Financial Statistics.
India
Russia

14
wealth fund last year, and China recently complet-ed the process of setting one up. Japan, Russia, and India reportedly are also considering reserve-based sovereign wealth funds.
Little is known about the aggregate size of sover-eign wealth funds, but the U.S. Treasury estimates1 that they control approximately $1 trillion to $2.5 trillion. Including offi cial foreign exchange reserves, governments now control a portfolio of $6.3 tril-lion to $7.8 trillion. Many observers believe sov-ereign wealth funds will continue to demonstrate strong growth, particularly if oil prices remain high, and they project that such funds will eventually become the single most important factor in global fi nancial markets.
Th e growing clout of sovereign wealth funds has left a lot of anxious people wondering if state-controlled investment funds will act like privately owned investment funds. With the exception of Norway’s, sovereign wealth funds’ operations are notoriously opaque, which has given rise to many questions: Will they invest for non-economic or strategic reasons? Do they raise national defense and security issues? Will they provide the fi rms in which they hold a stake unfair access to their home markets? Will they be subject to as much market discipline as private investment funds?
And what may be the biggest concern: Will they encourage fi nancial protectionism? Germany re-cently announced plans for establishing an agency to review investments by sovereign wealth funds for national security reasons. Th e United States has maintained a similar mechanism since 1988. While these are legitimate concerns, they also could off er individuals who simply do not appreciate competi-tion—domestic or foreign—another means of seek-ing protection. How far, after all, might security issues extend?
1. “Remarks by Acting Under Secretary for International Affairs Clay Lowery on Sovereign Wealth Funds and the International Financial System,” June 21, 2007. Available at <http://www.treas.gov/press/releases/hp471.htm>.

15
Economic Activity and Labor Th e Employment Situation
07.09.07 By Peter Rupert and Cara Stepanczuk
Nonfarm payroll employment rose by 132,000 jobs in June, edging above an average forecast of 128,000. April and May payrolls were revised upward a cumulative 75,000 (to 122,000 and 190,000, respectively). Th e average monthly gain in the fi rst half of 2007 was 145,000, which was a step down from the fi rst two quarters of 2006 (+188,000).
Th e service sector showed continued fi rmness, gain-ing 135,000 jobs. Education and health services rose sharply, posting its highest increase (+59,000) since August 2006. Government (+40,000) and leisure and hospitality (+39,000) showed strength, but there were pockets of weakness in retail trade (-24,000) and professional business services (-9,000). In 2006 retail trade averaged a monthly loss of 3,000 jobs per month, and professional business services averaged a monthly gain of 42,000.
Th e goods-producing sector lost only 3,000 jobs, which was better than its average monthly loss of 12,000 jobs so far in 2007. Th e construction indus-try edged up to a modest increase of 12,000 and nearly counteracted the continued losses in manu-facturing (-18,000). Manufacturing job losses were concentrated in primary metals, computer equip-ment, wood products, and textile mills.
Labor Market Conditions
Average monthly change(thousands of employees, NAICS)
2004 2005 2006Jan-May
2007June 2007
Payroll employment 172 212 189 148 132Goods-producing 28 32 9 –14 –3
Construction 26 35 11 –3 12Manufacturing 0 –7 –7 –13 –18Durable goods 8 2 0 –12 –13Nondurable goods –9 –9 –6 –1 –5
Service-providing 144 180 179 162 135Retail trade 16 19 –3 13 –24Financial activitiesa 8 14 16 5 1PBSb 38 57 42 18 –9Temporary help services 11 18 –1 –8 –8Education and health services
33 36 41 46 59
Leisure and Hospitality 25 23 38 31 39Government 14 14 20 28 40
Average for period (percent)Civilian unemployment rate 5.5 5.1 4.6 4.5 4.5
a.Financial activities include the fi nance, insurance, and real estate sector and the rental and leasing sector.b. PBS is professional business services (professional, scientifi c, and techni-cal services, management of companies and enterprises, administrative and support, and waste management and remediation services. Source: U.S. Department of Labor, Bureau of Labor Statistics.
0
30
60
90
120
150
180
210
240
270
300
2004 2005 2006 2007 IIIQ IVQ IQ IIQ Apr May Jun
Average Monthly Nonfarm Employment Change
Source: Department of Labor, Bureau of Labor Statistics.
Change, thousands of workers
Previous estimateRevised
2006 2007

16
Economic Activity and Labor Employment and Firm Size over the Business Cycle
06.26.07 by Murat Tasci and Cara Stepanczuk
Large fi rms in the United States create and destroy jobs at a slower pace than small fi rms, but they nevertheless make a large contribution to gross job creation, gross job destruction, and the net change in employment. (See “Employment Flows and Firm Size” for an overview of these points1). A recent study in Monthly Labor Review looks at recent patterns of gross job gains and losses across diff er-ent sizes of fi rms and argues that there is more to the relationship between fi rm size and employment than meets the eye.2
Th e study’s authors observe fi rst that large fi rms have been making sizable contributions to job creation for some time. Using data from Business and Employment Dynamics of Bureau of Labor Statistics, they show that between the second quar-ter of 1990 and the third quarter of 2005, fi rms with more than a thousand employees accounted for nearly one-third (29.9 percent) of the total net change in employment over the period, contribut-ing 18 percent of gross job gains and 17.4 percent of gross job losses. Small fi rms—those with 20 to 49 employees and those with 1 to 4 employees—follow in terms of contributions to gross job gains and losses.
As relatively large fi rms grow, we expect to see the fraction of employment they account for increase. In some cases, this is what the authors fi nd. Firms with more than 500 workers, for example, saw their share of employment increase from 41.4 percent to 44.2 percent over the period. On the other hand, fi rms with fewer than 100 workers saw their share decline, from 40.6 percent to 38.2 percent, during the same time.
-20 -15 -10 -5 0 5 10 15 20
Average Percentage Share of Gross Job Gains and Losses by Firm SizeShare of gross job losses (%)
Source: Monthly Labor Review, Bureau of Labor Statistics, March 2007.
1000+
500-999
250-499
100-249
50-99
20-49
10-195-9
1-4 employees
Share of gross job gains (%)
15
20
25
30
35
40
45
50
1990 1992 1994 1996 1998 2000 2002 2004
Percent
Share of Employment by Size Class
1 to 99 employees
500+ employees
100 to 499 employees
Source: Monthly Labor Review, Bureau of Labor Statistics, March 2007.

17
But here’s where it gets really interesting. Th e authors discover that the role small and large fi rms play in net job creation over the course of the busi-ness cycle changed over the period studied. During that period, there were two recessionary episodes in which net job losses occurred. During the fi rst (from the second quarter of 1990 to the fi rst quar-ter of 1992), most of the net job loss (58.06 per-cent) came from fi rms employing fewer than 100 workers. But in the second episode (second quarter of 2001 to the second quarter of 2003), this share declined to a mere 18.67 percent. Th is sharp dif-ference was not caused by diff erences in the shares of gross job gains across the two recessions but by higher job losses at large fi rms (which increased from 15.9 percent to 20.06 percent).
1. “Employment Flows and Firm Size,” by Tim Dunne, and Brent Meyer, Federal Reserve Bank of Cleveland, Economic Trends, (May 2, 2007). 2. “Employment Dynamics: Small and Large Firms over the Business Cycle,” by Jessica Helfand, Akbar Sadeghi, and David Talan. (March, 2007) Monthly Labor Review. Bureau of Labor Statistics. 130-3, pp. 39-50.
Net Job Change During Economic Recessions and Expansions
Number of employees
Recession 1990:QII–1992:QI
Expansion 1992:QII–2001:QI
Recession 2001:QII–2003:QII
Recovery 2003:QIII–2005:QIII
1–4 3.69 7.25 −2.98 11.435–9 7.6 5.69 0.64 5.8310–19 12.16 7.46 3.5 7.2620–49 19.9 11.57 8.52 11.2950–99 14.71 9.29 8.98 8.99100–249 15.12 11.82 12.31 11.79250–499 7.15 7.77 9.88 7.48500–999 2.37 6.77 10.5 5.651,000+ 17.3 32.38 48.64 30.281–99 58.06 41.26 18.67 45.4100+ 41.94 58.74 81.33 54.6
Source: Monthly Labor Review, Bureau of Labor Statistics, March 2007.
Regional ActivityMidwest Housing Markets
07.11.07 By Tim Dunne and Kyle Fee
In the fi rst four months of 2007, U.S. home prices declined slowly but steadily, dropping 1.4 percent according to the Case-Shiller Index of Home Prices. Cleveland, the only Fourth District city included in the index, fell slightly more than the composite index over the same period (1.8 percent). Th e index measures the change in single-family house prices in 20 large U.S. cities, holding the quality of homes constant.
Between 2000 and 2006, the composite index dou-bled in value, though Midwest housing markets ex-perienced considerably less price appreciation than those on the coasts. Cleveland’s and Detroit’s index rose only about 20 percent; and although price ap-preciation in Chicago was considerably stronger, it
Case-Shiller Home Price Index
80
100
120
140
160
180
200
220
2000 2001 2002 2003 2004 2005 2006 2007
Index (Q1 2000 = 100)
Composite 20
Chicago
Detroit
Cleveland
Sources: S&P; Fiserv; MacroMarkets, LLC; and Haver Analytics.
18
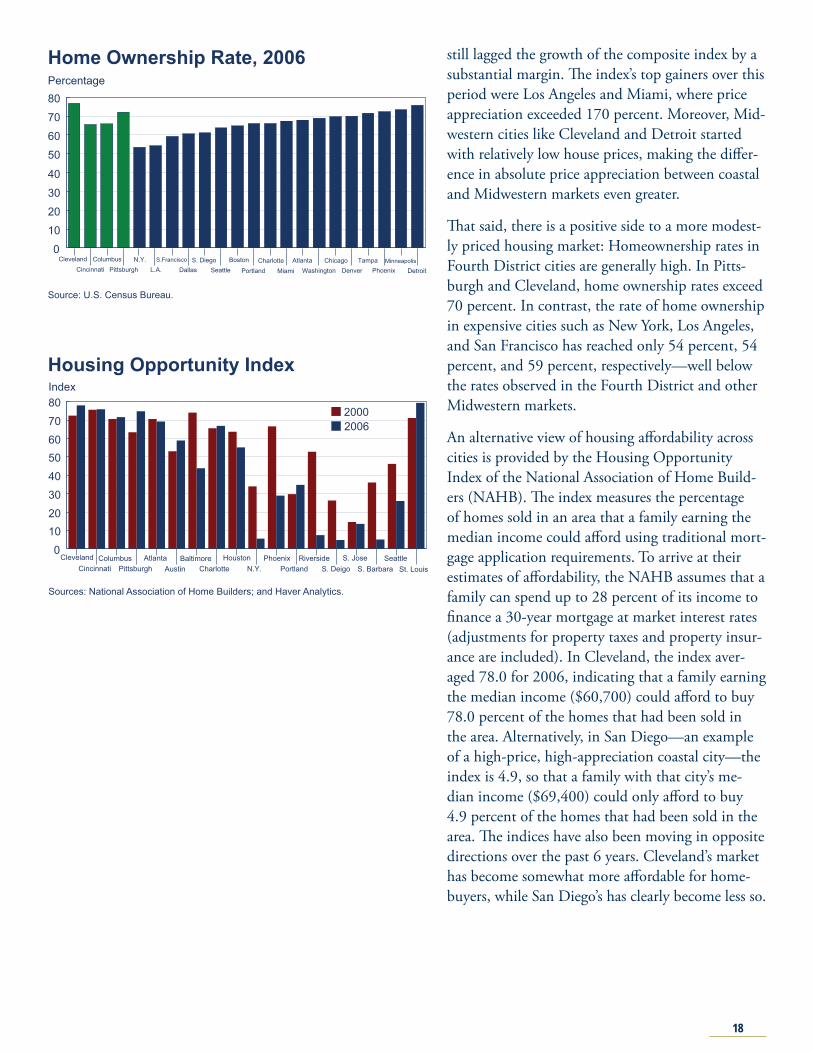
still lagged the growth of the composite index by a substantial margin. Th e index’s top gainers over this period were Los Angeles and Miami, where price appreciation exceeded 170 percent. Moreover, Mid-western cities like Cleveland and Detroit started with relatively low house prices, making the diff er-ence in absolute price appreciation between coastal and Midwestern markets even greater.
Th at said, there is a positive side to a more modest-ly priced housing market: Homeownership rates in Fourth District cities are generally high. In Pitts-burgh and Cleveland, home ownership rates exceed 70 percent. In contrast, the rate of home ownership in expensive cities such as New York, Los Angeles, and San Francisco has reached only 54 percent, 54 percent, and 59 percent, respectively—well below the rates observed in the Fourth District and other Midwestern markets.
An alternative view of housing aff ordability across cities is provided by the Housing Opportunity Index of the National Association of Home Build-ers (NAHB). Th e index measures the percentage of homes sold in an area that a family earning the median income could aff ord using traditional mort-gage application requirements. To arrive at their estimates of aff ordability, the NAHB assumes that a family can spend up to 28 percent of its income to fi nance a 30-year mortgage at market interest rates (adjustments for property taxes and property insur-ance are included). In Cleveland, the index aver-aged 78.0 for 2006, indicating that a family earning the median income ($60,700) could aff ord to buy 78.0 percent of the homes that had been sold in the area. Alternatively, in San Diego—an example of a high-price, high-appreciation coastal city—the index is 4.9, so that a family with that city’s me-dian income ($69,400) could only aff ord to buy 4.9 percent of the homes that had been sold in the area. Th e indices have also been moving in opposite directions over the past 6 years. Cleveland’s market has become somewhat more aff ordable for home-buyers, while San Diego’s has clearly become less so.
Home Ownership Rate, 2006
0
10
20
30
40
50
60
70
80
ClevelandCincinnati
ColumbusPittsburgh
N.Y.L.A.
S.Francisco
DallasS. Diego
Seattle Boston
Portland Charlotte
MiamiAtlanta
WashingtonChicago
DenverTampa
PhoenixMinneapolis
Detroit
Percentage
Source: U.S. Census Bureau.
Housing Opportunity Index
01020304050607080
ClevelandCincinnati
ColumbusPittsburgh
AtlantaAustin
BaltimoreCharlotte
Houston N.Y.
PhoenixPortland
RiversideS. Deigo
S. JoseS. Barbara
Seattle St. Louis
Index
Sources: National Association of Home Builders; and Haver Analytics.
20002006

19
Banking and Financial Institutions Fourth District Bank Holding Companies
06.26.07 by O. Emre Ergungor and Cara Stepanczuk
A bank holding company (BHC) is a company that owns one or more commercial banks, other deposi-tory institutions, and nonbank subsidiaries. While BHCs come in all sizes, we focus here on BHCs with consolidated assets of more than $1 billion. Th ere are 21 BHCs headquartered in the Fourth District that meet this defi nition as of the fi rst quarter of 2007, including seven of the top fi fty BHCs in the United States.
Th e banking system continues to consolidate nationwide, a process that is evident in the Fourth District. Between the beginning of 1999 and the beginning of 2007, the number of BHCs in the Fourth District with assets over $1 billion fell from 24 to 21, but the total assets of the remain-ing BHCs increased every year except 2000. Th e decline that year refl ects the acquisition of Charter One Financial by Citizens Financial Group, a BHC headquartered in in the First Federal Reserve Dis-trict, served by the Federal Reserve Bank of Boston.
Fourth District BHCs of all asset sizes account for roughly 4.8 percent of BHC assets nationwide, and BHCs with over $1 billion in assets make up the majority of the assets held by Fourth District BHCs.
Th e income stream of BHCs in the district has im-proved slightly in recent years. Th e return on assets has fl uctuated between 1.7 percent and 2.3 percent since 1998, and it edged down to 1.9 percent in the fi rst quarter of 2007 (Return on assets is measured by income before taxes and extraordinary items, because a bank’s extraordinary items can distort the average earnings picture in a small sample of 21 banks). Th is decrease has coincided with a weaken-ing of net interest margins (interest income minus interest expense divided by earning assets). Cur-rently at 3.0 percent, the net interest margin is at its lowest level in over eight years.
Another indication of the strength of earnings is the continued low level of income earned but not
Annual Asset Growth
-3-2-10123456789
1999 2000 2001 2002 2003 2004 2005 2006 2007
Percent
Source: Authors’ s calculation from Federal Financial Institutions Examination Council, Quarterly Banking Reports of Condition and Income, first quarter, 2007.
Largest Fourth District Bank Holding Companies by Asset Size
5
25
45
65
85
105
125
145
National City
PNC Fifth Third
Keycorp Mellon Huntington Sky FirstMerit
Dollars, billions
*Rank is as of first quarter, 2007.Source: Authors’ s calculation from Federal Financial Institutions Examination Council, Quarterly Banking Reports of Condition and Income, first quarter, 2007.
Income Stream
0.0
0.5
1.0
1.5
2.0
2.5
3.0
3.5
4.0
1998 1999 2000 2001 2002 2003 2004 2005 2006 20070.00
0.25
0.50
0.75
1.00
1.25
1.50
1.75
2.00Percent
ROA before tax and extraordinary items
Income earned but not receivedNet Interest Margin
Percent of assets
First quarter, annualized
Source: Authors’ s calculation from Federal Financial Institutions Examination Council, Quarterly Banking Reports of Condition and Income, first quarter, 2007.

20
received. If a loan allows the borrower to pay an amount that does not cover the interest accrued on the loan, the uncollected interest is booked as income even though there is no cash infl ow. Th e assumption is that the unpaid interest will eventu-ally be paid before the loan matures. However, if an economic slowdown forces an unusually large number of borrowers to default on their loans, the bank’s capital may be impaired unexpectedly. Despite a slight rise over the past two years, income earned but not received at the beginning of 2007 (0.57 percent) was still well below the recent high of 0.82 percent, registered at the end of 2000.
Fourth District BHCs are heavily engaged in real estate related lending. As of the fi rst quarter of 2007, about 38 percent of their assets are in loans secured by real estate. Including mortgage-backed-securities, the share of real estate-related assets on the balance sheet is 50 percent.
Deposits continue to be the most important source of funds for Fourth district BHCs. Saving and small time deposits (time deposits in accounts less than $100,000) made up 53 percent of liabilities at the beginning of 2007. Core deposits, the sum of transaction, saving, and small time deposits, made up 61.5 percent of the district’s BHC liabilities as of the beginning of 2007, the highest level since 1998. Finally, total deposits made up almost 70 percent of funds so far this year. Despite the re-quirement that large banking organizations must have a rated debt issue outstanding at all times, subordinated debt represents only 3 percent of funding. As with large holding companies outside the district, Fourth district BHCs rely heavily on large negotiable certifi cates of deposit and nonde-posit liabilities for funding.
Problem loans are loans that are past due for more than 90 days but are still receiving interest pay-ments, as well as loans that are no longer accruing interest. Problem commercial loans rose sharply starting in 1999, peaked in 2002, and settled below 0.75 percent of assets in 2004, thanks in part to the strong economy. Currently, 0.64 percent of all commercial loans are problem loans. Problem real estate loans are only 0.52 percent of all outstand-ing real-estate-related loans, though they have been
Balance Sheet Composition
2
7
12
17
22
27
32
37
42
1998 1999 2000 2001 2002 2003 2004 2005 2006 2007
Percent of assets
Commercial loans
Consumer loans
Mortgage-backedsecurities
Real estate loans
Source: Authors’ s calculation from Federal Financial Institutions Examination Council, Quarterly Banking Reports of Condition and Income, first quarter, 2007.
Liabilities
05
10152025303540455055
1998 1999 2000 2001 2002 2003 2004 2005 2006 2007
Percent of liabilities
Subordinated debt
Savings and small time deposits
Transactions depositsLarge time deposits
Source: Authors’ s calculation from Federal Financial Institutions Examination Council, Quarterly Banking Reports of Condition and Income, first quarter, 2007.
Problem Loans
0.000.250.500.751.001.251.501.752.002.252.502.753.00
1998 1999 2000 2001 2002 2003 2004 2005 2006 2007
Percent of loans
Consumer loans
Real estate loans
Commercial loans
Source: Authors’ s calculation from Federal Financial Institutions Examination Council, Quarterly Banking Reports of Condition and Income, first quarter, 2007.

21
creeping upward since 2005. Problem consumer loans (credit cards, installment loans, etc.) re-mained relatively fl at, declining slightly through the fi rst quarter of 2007. Currently, 0.37 percent of all outstanding consumer loans are problem loans.
Net charge-off s are loans removed from the bal-ance sheet because they are deemed unrecoverable, minus the loans that were deemed unrecoverable in the past but are recovered in the current year. As with problem loans, there was a sharp increase in the net charge-off s of commercial and consumer loans in 2001. Fortunately, the charge-off levels have returned to their pre-recession levels in recent years. Net charge-off s in the fi rst quarter of 2007 were limited to 0.25 percent of outstanding com-mercial loans, 0.77 percent of outstanding con-sumer loans, and 0.14 percent of outstanding real estate loans.
Capital is a bank’s cushion against unexpected losses. Th e recent upward trend in capital ratios indicates that Fourth District BHCs are suffi ciently protected. Th e leverage ratio (balance sheet capital over total assets) at 10.0 percent and the risk-based capital ratio (a ratio determined by assigning a larger capital charge on riskier assets) at 11.7 per-cent are signs of strength for the district’s BHCs.
An alternative measure of balance sheet strength is the coverage ratio. Th e coverage ratio measures the size of the bank’s capital and loan loss reserves relative to its problem assets. As of the fi rst quarter of 2007, the district’s BHCs have $16.84 in capi-tal and reserves for each dollar of problem assets. While the coverage ratio is below its recent high at the end of 2004, it remains well above the levels of the early 2000s.
Net Charge-offs
-0.5
0.0
0.5
1.0
1.5
2.0
2.5
3.0
1998 1999 2000 2001 2002 2003 2004 2005 2006 2007
Percent of loans
Consumer loans
Real estate loans
Commercial loans
Source: Authors’ s calculation from Federal Financial Institutions Examination Council, Quarterly Banking Reports of Condition and Income, first quarter, 2007.
Coverage Ratio*
3
6
9
12
15
18
21
1998 1999 2000 2001 2002 2003 2004 2005 2006 2007
Dollars
*Ratio of capital and loan loss reserves to problem assets.Source: Authors’ s calculation from Federal Financial Institutions Examination Council, Quarterly Banking Reports of Condition and Income, first quarter, 2007.
Capitalization
7.0
7.5
8.0
8.5
9.0
9.5
10.0
10.5
11.0
11.5
12.0
1998 1999 2000 2001 2002 2003 2004 2005 2006 2007
Percent
Risk-based capital ratio
Leverage ratio
Source: Authors’ s calculation from Federal Financial Institutions Examination Council, Quarterly Banking Reports of Condition and Income, first quarter, 2007.