freak waves at campos basin, brazil -...
TRANSCRIPT
Original scientific paper
UDC 551.465
Freak Waves at Campos Basin, Brazil
Uggo Ferreira de Pinho1, Paul C. Liu2 and Carlos Eduardo Parente Ribeiro1
1 Department of Ocean Engineering, Federal University of Rio de Janeiro (UFRJ), Brazil
2 NOAA Great Lakes Environmental Research Laboratory, Ann Arbor, U.S.A.
Received 20 July 2004, in final form 25 November 2004
Freak waves occur abundantly in Campos Basin, located on the north-east coast of Rio de Janeiro, Brazil in the South Atlantic Ocean. This sur-prising and unexpected discovery was made from a search of the time-seriesdata of wave measurements recorded in the Campos Basin from 1991 to1995. In a study on the occurrence of freak waves and their relevant proper-ties, we have also found that freak waves are not of rare occurrence as con-ventionally presumed, and they occur not only during storm conditions butalso during fair weather states as well. While the conventional approach ofspectrum analysis provides some weak inference of freak wave effects, thebasically stationary random process approach is clearly incapable of con-tending with the localized non-stationary process of freak wave occurrences.
Keywords: Freak waves, ocean waves, wave data analysis.
1. Introduction
Freak waves, sometimes also known as rogue waves, are a particularkind of ocean waves that display a singular, unexpected wave profile charac-terized by an extraordinarily large and steep crest or trough as illustrated bythe well-known Draupner case (e.g. Trulsen and Dysthe, 1997) shown in Fig-ure 1.
The existence of freak waves has been widely proclaimed among seafar-ers throughout the ages. Its presence clearly poses severe hazardous con-cerns to navy fleets, merchant marines, offshore structures, and other mari-time ventures. While multitudes of seagoing vessels and mariners haveencountered freak waves over the years, and many had resulted in disaster,it was only recently, however, that their actual existence was recognized. Theemerging interest in freak waves and the quest to grasp an understanding ofthis phenomenon has inspired numerous theoretical conjectures in the litera-ture in recent years. But the practical void of actual field observations offreak waves renders even the most well-developed theories unsubstantiated.
53
GEOFIZIKA VOL. 21 2004
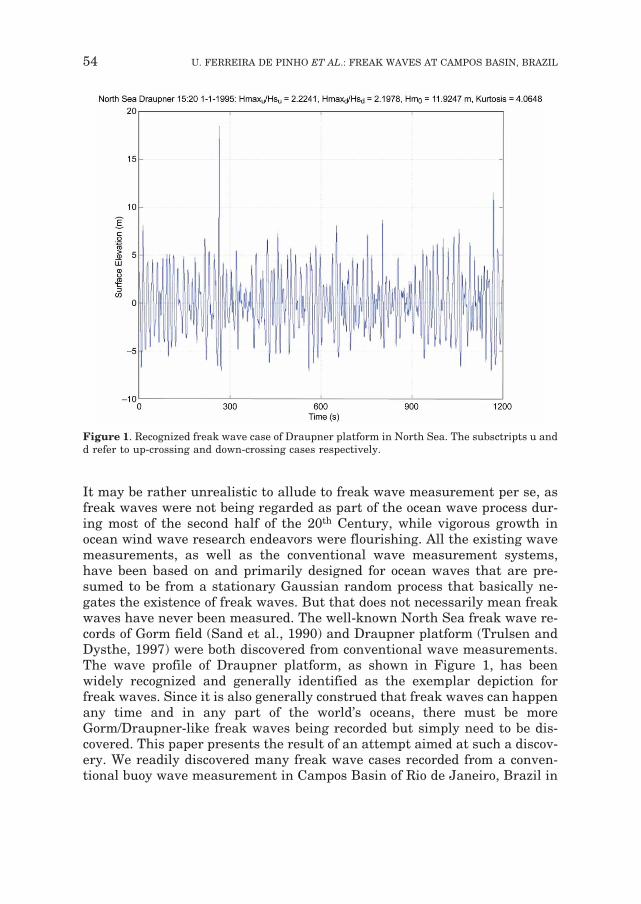
It may be rather unrealistic to allude to freak wave measurement per se, asfreak waves were not being regarded as part of the ocean wave process dur-ing most of the second half of the 20th Century, while vigorous growth inocean wind wave research endeavors were flourishing. All the existing wavemeasurements, as well as the conventional wave measurement systems,have been based on and primarily designed for ocean waves that are pre-sumed to be from a stationary Gaussian random process that basically ne-gates the existence of freak waves. But that does not necessarily mean freakwaves have never been measured. The well-known North Sea freak wave re-cords of Gorm field (Sand et al., 1990) and Draupner platform (Trulsen andDysthe, 1997) were both discovered from conventional wave measurements.The wave profile of Draupner platform, as shown in Figure 1, has beenwidely recognized and generally identified as the exemplar depiction forfreak waves. Since it is also generally construed that freak waves can happenany time and in any part of the world’s oceans, there must be moreGorm/Draupner-like freak waves being recorded but simply need to be dis-covered. This paper presents the result of an attempt aimed at such a discov-ery. We readily discovered many freak wave cases recorded from a conven-tional buoy wave measurement in Campos Basin of Rio de Janeiro, Brazil in
54 U. FERREIRA DE PINHO ET AL.: FREAK WAVES AT CAMPOS BASIN, BRAZIL
Figure 1. Recognized freak wave case of Draupner platform in North Sea. The subsctripts u andd refer to up-crossing and down-crossing cases respectively.
South Atlantic Ocean that spanned over four years between 1991 and 1995.Our studies also point to a need for a new paradigm toward further effectiveexplorations of freak waves.
2. The Data
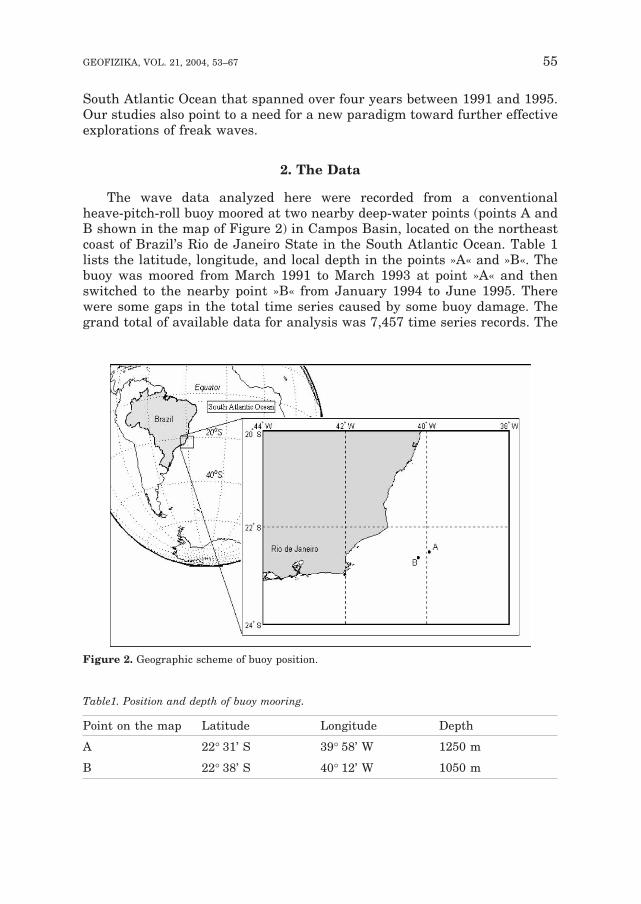
The wave data analyzed here were recorded from a conventionalheave-pitch-roll buoy moored at two nearby deep-water points (points A andB shown in the map of Figure 2) in Campos Basin, located on the northeastcoast of Brazil’s Rio de Janeiro State in the South Atlantic Ocean. Table 1lists the latitude, longitude, and local depth in the points »A« and »B«. Thebuoy was moored from March 1991 to March 1993 at point »A« and thenswitched to the nearby point »B« from January 1994 to June 1995. Therewere some gaps in the total time series caused by some buoy damage. Thegrand total of available data for analysis was 7,457 time series records. The
55GEOFIZIKA, VOL. 21, 2004, 53¿67
Figure 2. Geographic scheme of buoy position.
Table1. Position and depth of buoy mooring.
Point on the map Latitude Longitude Depth
A 22� 31’ S 39� 58’ W 1250 m
B 22� 38’ S 40� 12’ W 1050 m
waves were measured intermittently for 17.067 minutes (1024 s) every 3hours at 1 Hz sampling frequency. The recorded time series data consists ofsurface elevations as well as corresponding N–S and E–W slopes for direc-tional spectrum analysis.
3. Relevant Aspects of Freak Waves
As the study of freak waves is still basically at the incipient and forma-tive stage, it is not surprising that neither the cause of occurrence nor a uni-versal definition of freak waves has been firmly established beyond a qualita-tive description as being an unusually high single wave event. The followingfeatures represent a general consensus on freak waves promulgated amongavailable literatures:
– their characteristic freak wave profile resembles the profile of the timeseries data given from Gorm field or Draupner platform recordings;
– they usually occur during severe storm conditions (Junger, 1997);– they are events of rare occurrence (Janssen, 2003);– they can be identified by the ratio of Hmax/H1/3 greater than 2 (Kjelsen,
2000), where Hmax and H1/3 are Maximum and significant wave heightof the data respectively.
With the exception of the last item, which is based on the conventionalRayleigh distribution theory (Ochi, 1998), the others all have an inherentvague and uncertain nature that tends to be more intuitive than rational. Soit primarily renders the designation of freak waves in a given time series asubjective matter. In some cases there does not seem to be a clear distinction
56 U. FERREIRA DE PINHO ET AL.: FREAK WAVES AT CAMPOS BASIN, BRAZIL
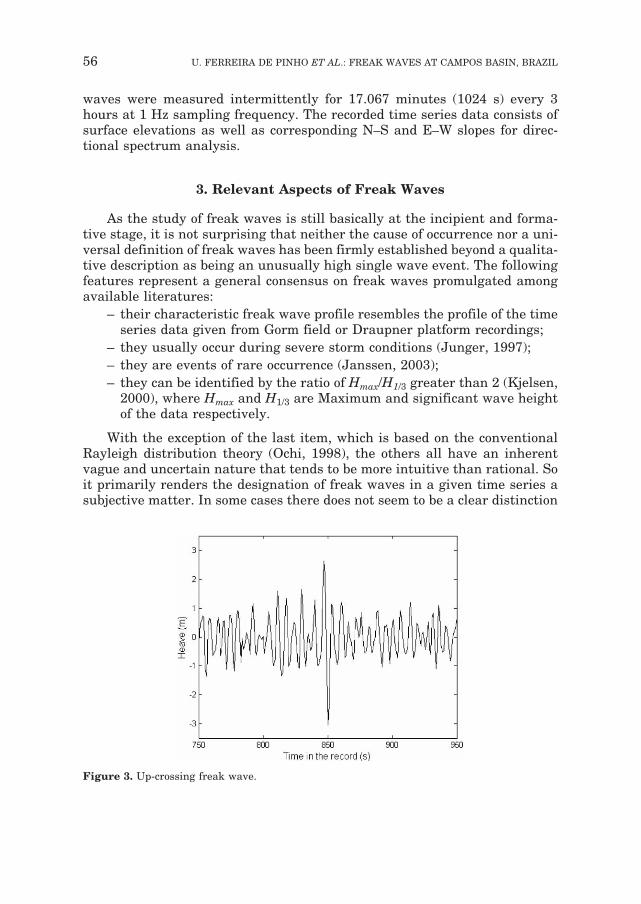
Figure 3. Up-crossing freak wave.
between freak waves and extreme waves in the literature. While freak wavesare often perceived as »rare« events, since many theories were developedbased on this premise, there is no clear assertion available to readily clarifyjust how rare is rare.
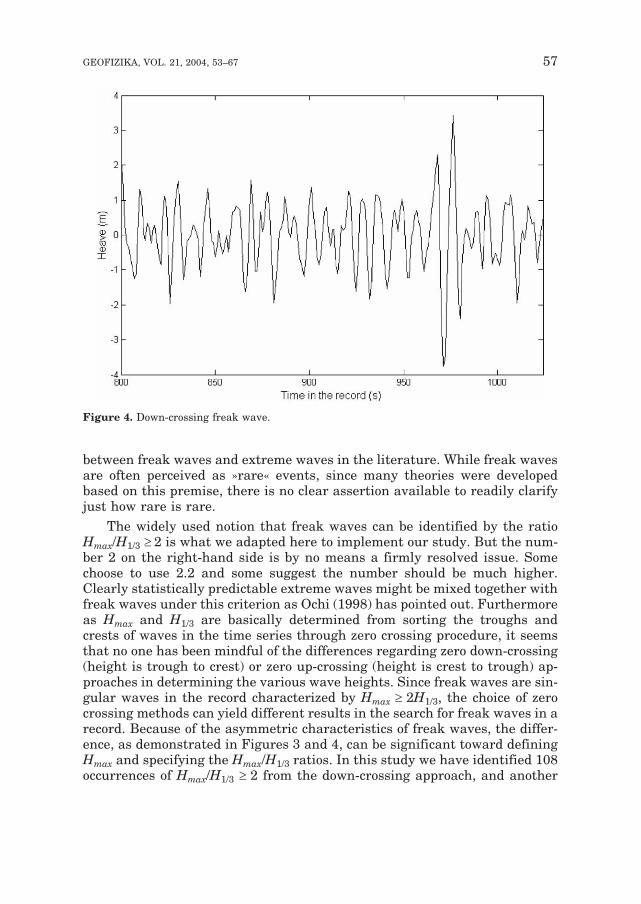
The widely used notion that freak waves can be identified by the ratioHmax/H1/3 � 2 is what we adapted here to implement our study. But the num-ber 2 on the right-hand side is by no means a firmly resolved issue. Somechoose to use 2.2 and some suggest the number should be much higher.Clearly statistically predictable extreme waves might be mixed together withfreak waves under this criterion as Ochi (1998) has pointed out. Furthermoreas Hmax and H1/3 are basically determined from sorting the troughs andcrests of waves in the time series through zero crossing procedure, it seemsthat no one has been mindful of the differences regarding zero down-crossing(height is trough to crest) or zero up-crossing (height is crest to trough) ap-proaches in determining the various wave heights. Since freak waves are sin-gular waves in the record characterized by Hmax � 2H1/3, the choice of zerocrossing methods can yield different results in the search for freak waves in arecord. Because of the asymmetric characteristics of freak waves, the differ-ence, as demonstrated in Figures 3 and 4, can be significant toward definingHmax and specifying the Hmax/H1/3 ratios. In this study we have identified 108occurrences of Hmax/H1/3 � 2 from the down-crossing approach, and another
57GEOFIZIKA, VOL. 21, 2004, 53¿67
Figure 4. Down-crossing freak wave.
197 freak wave events with Hmax/H1/3 � 2 from the up-crossing approach.Among them there are only 28 cases for which the same Hmax results fromboth down-crossing and up-crossing approaches. So, from the 7457 availabledata sets, we obtained 276 distinctive cases of freak wave occurrences. It maybe unprecedented, but we shall incorporate the results of both down-crossingand up-crossing cases of freak waves in our subsequent analyses.
4. Portraits of Freak Waves
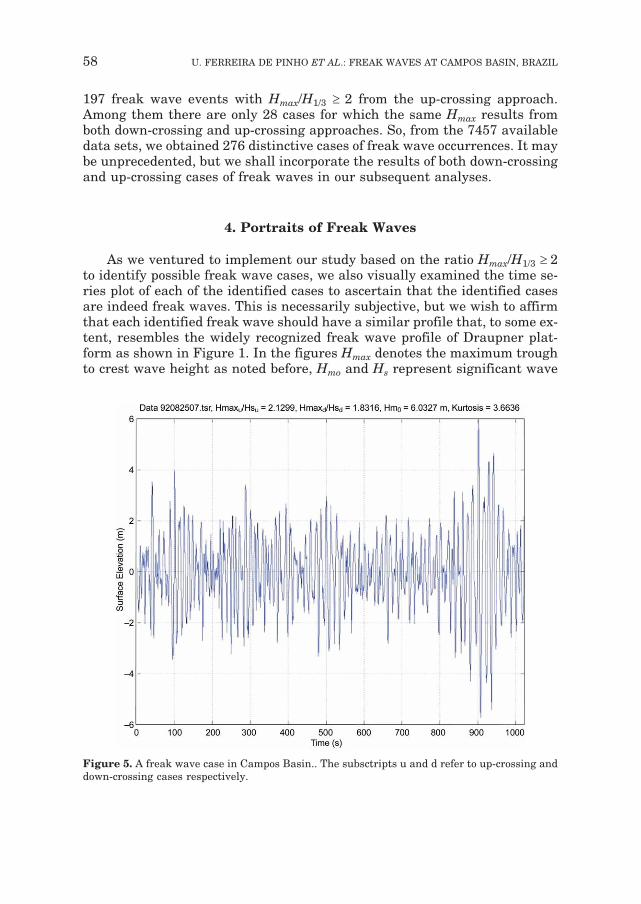
As we ventured to implement our study based on the ratio Hmax/H1/3 � 2to identify possible freak wave cases, we also visually examined the time se-ries plot of each of the identified cases to ascertain that the identified casesare indeed freak waves. This is necessarily subjective, but we wish to affirmthat each identified freak wave should have a similar profile that, to some ex-tent, resembles the widely recognized freak wave profile of Draupner plat-form as shown in Figure 1. In the figures Hmax denotes the maximum troughto crest wave height as noted before, Hmo and Hs represent significant wave
58 U. FERREIRA DE PINHO ET AL.: FREAK WAVES AT CAMPOS BASIN, BRAZIL
Figure 5. A freak wave case in Campos Basin.. The subsctripts u and d refer to up-crossing anddown-crossing cases respectively.
heights with respect to 0th moment of the spectrum and trough to crest waveheights respectively, while subscripts u and d denote up-crossing anddown-crossing cases respectively.
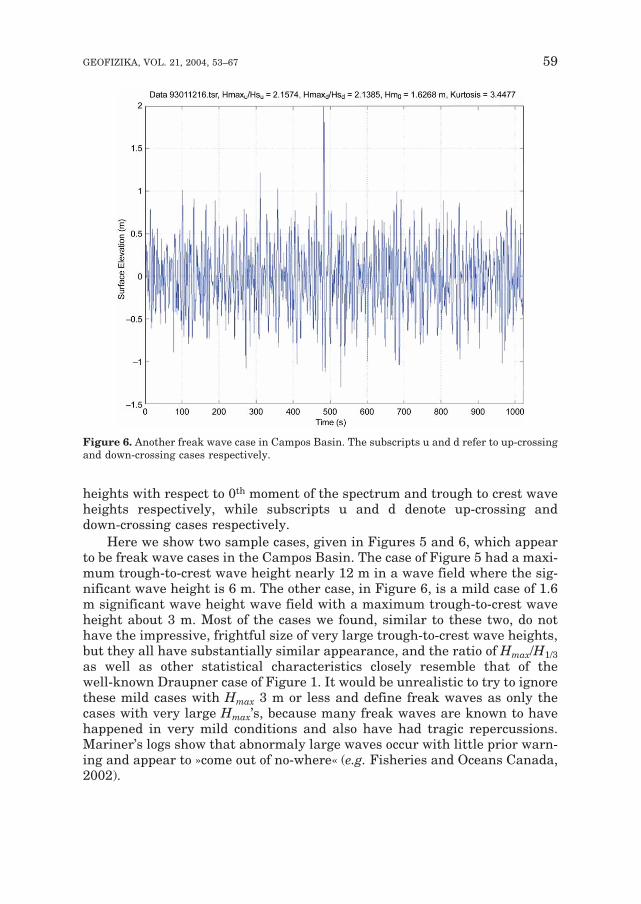
Here we show two sample cases, given in Figures 5 and 6, which appearto be freak wave cases in the Campos Basin. The case of Figure 5 had a maxi-mum trough-to-crest wave height nearly 12 m in a wave field where the sig-nificant wave height is 6 m. The other case, in Figure 6, is a mild case of 1.6m significant wave height wave field with a maximum trough-to-crest waveheight about 3 m. Most of the cases we found, similar to these two, do nothave the impressive, frightful size of very large trough-to-crest wave heights,but they all have substantially similar appearance, and the ratio of Hmax/H1/3as well as other statistical characteristics closely resemble that of thewell-known Draupner case of Figure 1. It would be unrealistic to try to ignorethese mild cases with Hmax 3 m or less and define freak waves as only thecases with very large Hmax’s, because many freak waves are known to havehappened in very mild conditions and also have had tragic repercussions.Mariner’s logs show that abnormaly large waves occur with little prior warn-ing and appear to »come out of no-where« (e.g. Fisheries and Oceans Canada,2002).
59GEOFIZIKA, VOL. 21, 2004, 53¿67
Figure 6. Another freak wave case in Campos Basin. The subscripts u and d refer to up-crossingand down-crossing cases respectively.
What we have found here suggests that while a Draupner-like wave pro-file, regardless of the size of its significant wave height, have been generallyconsidered as a rare case of freak waves, it is clearly happening much morefrequently than rare. It happens not only in severe storm conditions but alsoin moderately calm ocean surfaces as well. If this awareness bears out, as itcan be done easily from the vastly available wave data in the world, then wemay face an immediate need to revisit our long held conventional conceptthat the wind wave process is a stationary Gaussian random process, whichbasically invalidates the frequent occurrence of freak waves.
5. The Peril of Conventional Wisdom
The finding of a sizeable number of freak wave cases in Campos Basin isreally a surprising development to us. We did not expect to find more thanjust a handful. Conventional wisdom on wind waves tends to assert two pre-conceived notions that obviate this kind of outcome. In the first place, asnoted before, freak waves are of rare occurrence, and there is no previousstudies showing freak wave cases in South Atlantic Ocean. And secondly,buoy wave measurements are theoretically known to be incapable of measur-ing sharply peaked waves.
The results of what we actually learned, on the other hand, seem to haveunwittingly cast off both of the two aforementioned conventional perceptions.We may even surmise the following pertinent consequences from our simplefinding:a). So long as no one knows how rare is rare in the occurrence of freak
waves, we may just as well envision that the occurrence of freak wavescan be in fact more frequent than rare;
b). Just because there is no known maritime disaster due to freak wavesever reported in the South Atlantic Ocean, it does not mean this area isfree from freak waves; and
c). While theoretically one may question the adequacy of a buoy’s responsein extreme waves, in practice, freak waves have nevertheless been mea-sured from buoy wave measurements.So in brief, while reliance on a conventional approach can be prudent for
seeking general bearings, it is by no means foolproof.
6. Analysis through Conventional Prospects
Along with the lack of specific freak wave measurement, there is also aconspicuous gap in specific means for analyzing freak wave cases. Here wepresent some results of basic wave data analysis regarding statistical and di-rectional spectral parameters from familiar, conventional perspectives to ex-plore freak wave implications.
60 U. FERREIRA DE PINHO ET AL.: FREAK WAVES AT CAMPOS BASIN, BRAZIL
6.1 Statistics connection
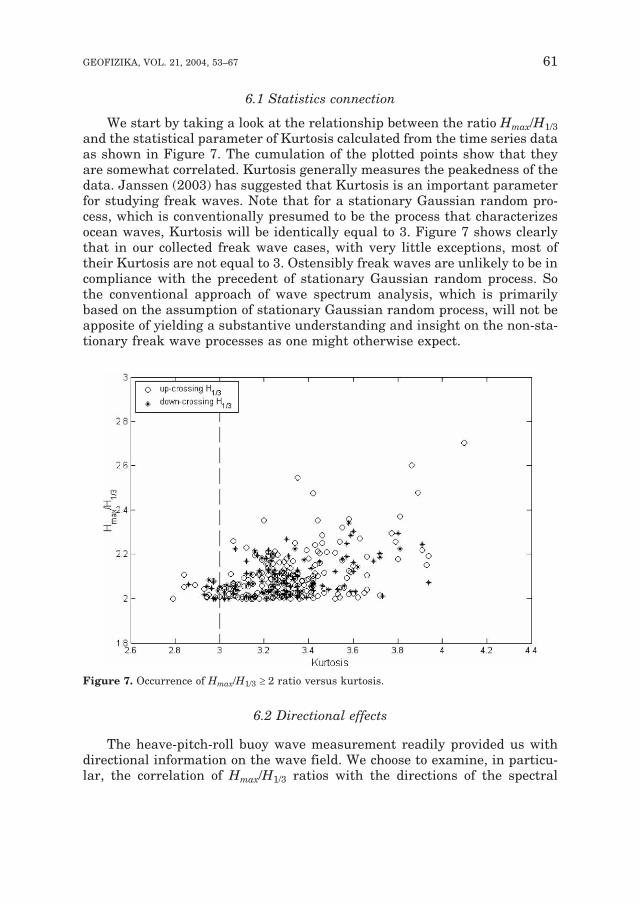
We start by taking a look at the relationship between the ratio Hmax/H1/3and the statistical parameter of Kurtosis calculated from the time series dataas shown in Figure 7. The cumulation of the plotted points show that theyare somewhat correlated. Kurtosis generally measures the peakedness of thedata. Janssen (2003) has suggested that Kurtosis is an important parameterfor studying freak waves. Note that for a stationary Gaussian random pro-cess, which is conventionally presumed to be the process that characterizesocean waves, Kurtosis will be identically equal to 3. Figure 7 shows clearlythat in our collected freak wave cases, with very little exceptions, most oftheir Kurtosis are not equal to 3. Ostensibly freak waves are unlikely to be incompliance with the precedent of stationary Gaussian random process. Sothe conventional approach of wave spectrum analysis, which is primarilybased on the assumption of stationary Gaussian random process, will not beapposite of yielding a substantive understanding and insight on the non-sta-tionary freak wave processes as one might otherwise expect.
6.2 Directional effects
The heave-pitch-roll buoy wave measurement readily provided us withdirectional information on the wave field. We choose to examine, in particu-lar, the correlation of Hmax/H1/3 ratios with the directions of the spectral
61GEOFIZIKA, VOL. 21, 2004, 53¿67
Figure 7. Occurrence of Hmax/H1/3 � 2 ratio versus kurtosis.
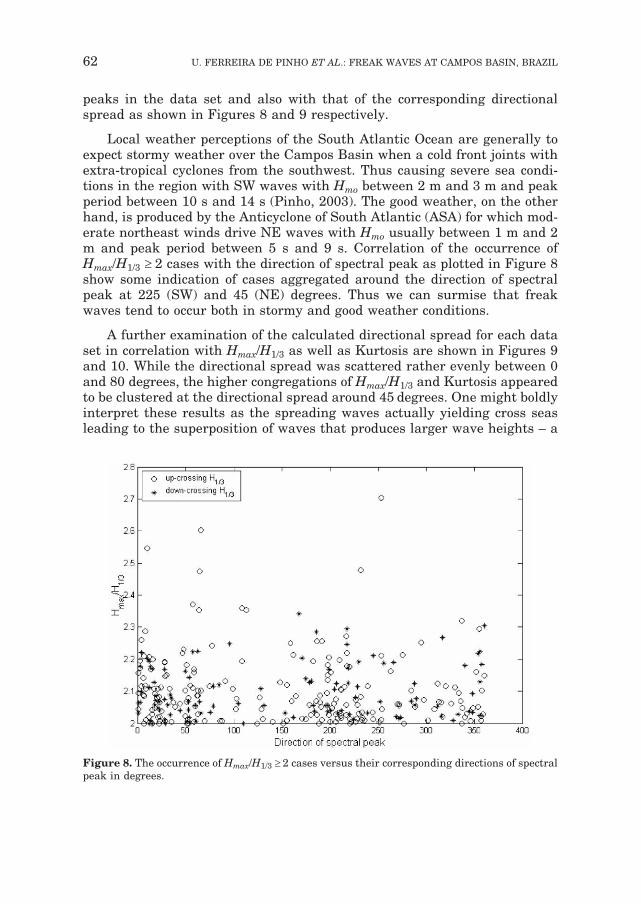
peaks in the data set and also with that of the corresponding directionalspread as shown in Figures 8 and 9 respectively.
Local weather perceptions of the South Atlantic Ocean are generally toexpect stormy weather over the Campos Basin when a cold front joints withextra-tropical cyclones from the southwest. Thus causing severe sea condi-tions in the region with SW waves with Hmo between 2 m and 3 m and peakperiod between 10 s and 14 s (Pinho, 2003). The good weather, on the otherhand, is produced by the Anticyclone of South Atlantic (ASA) for which mod-erate northeast winds drive NE waves with Hmo usually between 1 m and 2m and peak period between 5 s and 9 s. Correlation of the occurrence ofHmax/H1/3 � 2 cases with the direction of spectral peak as plotted in Figure 8show some indication of cases aggregated around the direction of spectralpeak at 225 (SW) and 45 (NE) degrees. Thus we can surmise that freakwaves tend to occur both in stormy and good weather conditions.
A further examination of the calculated directional spread for each dataset in correlation with Hmax/H1/3 as well as Kurtosis are shown in Figures 9and 10. While the directional spread was scattered rather evenly between 0and 80 degrees, the higher congregations of Hmax/H1/3 and Kurtosis appearedto be clustered at the directional spread around 45 degrees. One might boldlyinterpret these results as the spreading waves actually yielding cross seasleading to the superposition of waves that produces larger wave heights – a
62 U. FERREIRA DE PINHO ET AL.: FREAK WAVES AT CAMPOS BASIN, BRAZIL
Figure 8. The occurrence of Hmax/H1/3 � 2 cases versus their corresponding directions of spectralpeak in degrees.
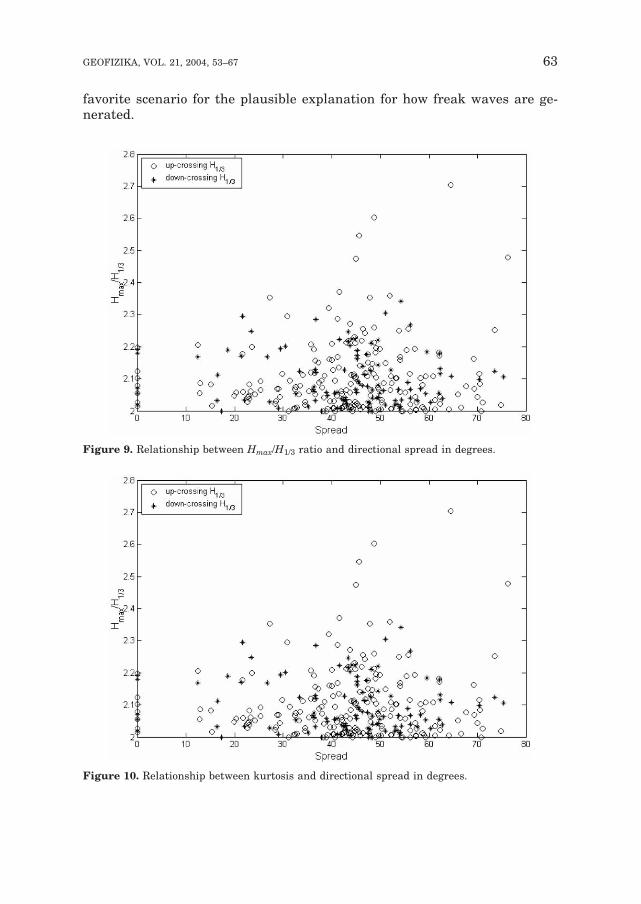
favorite scenario for the plausible explanation for how freak waves are ge-nerated.
63GEOFIZIKA, VOL. 21, 2004, 53¿67
Figure 9. Relationship between Hmax/H1/3 ratio and directional spread in degrees.
Figure 10. Relationship between kurtosis and directional spread in degrees.
6.3 Correlating with the peak-enhancement factor
One of the interesting speculations regarding conventional wave spec-trum and freak waves is the implication of the peak-enhancement factor, �, inthe renowned JONSWAP spectrum formula. While the peak-enhancementrefers to the shape of the empirical spectrum shape, it has been hypothesizedthat an existence of freak waves will increase the magnitude of �. Now withour data and analysis, we have an opportunity to examine this presumptionand show its falsehood.
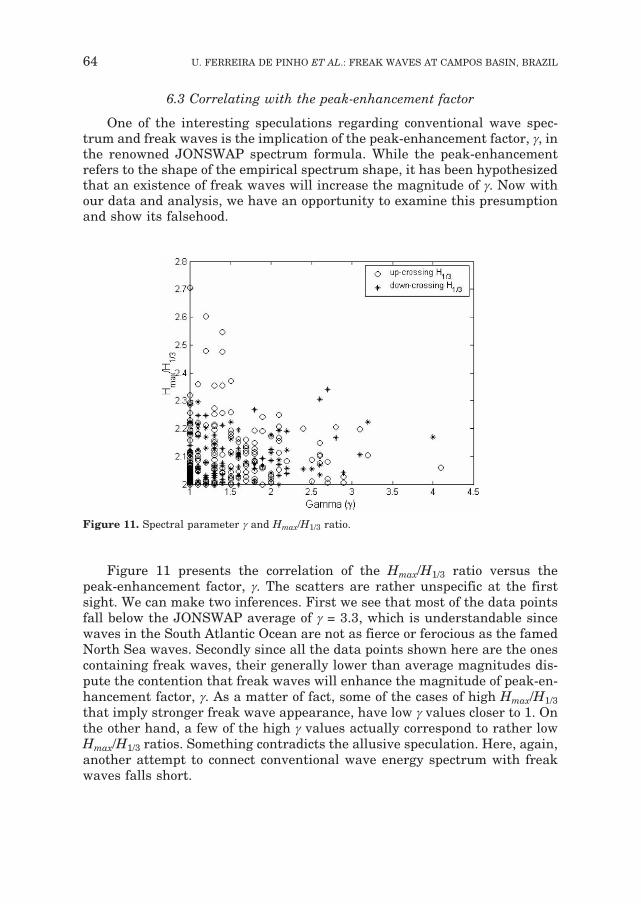
Figure 11 presents the correlation of the Hmax/H1/3 ratio versus thepeak-enhancement factor, �. The scatters are rather unspecific at the firstsight. We can make two inferences. First we see that most of the data pointsfall below the JONSWAP average of � = 3.3, which is understandable sincewaves in the South Atlantic Ocean are not as fierce or ferocious as the famedNorth Sea waves. Secondly since all the data points shown here are the onescontaining freak waves, their generally lower than average magnitudes dis-pute the contention that freak waves will enhance the magnitude of peak-en-hancement factor, �. As a matter of fact, some of the cases of high Hmax/H1/3that imply stronger freak wave appearance, have low � values closer to 1. Onthe other hand, a few of the high � values actually correspond to rather lowHmax/H1/3 ratios. Something contradicts the allusive speculation. Here, again,another attempt to connect conventional wave energy spectrum with freakwaves falls short.
64 U. FERREIRA DE PINHO ET AL.: FREAK WAVES AT CAMPOS BASIN, BRAZIL
Figure 11. Spectral parameter � and Hmax/H1/3 ratio.
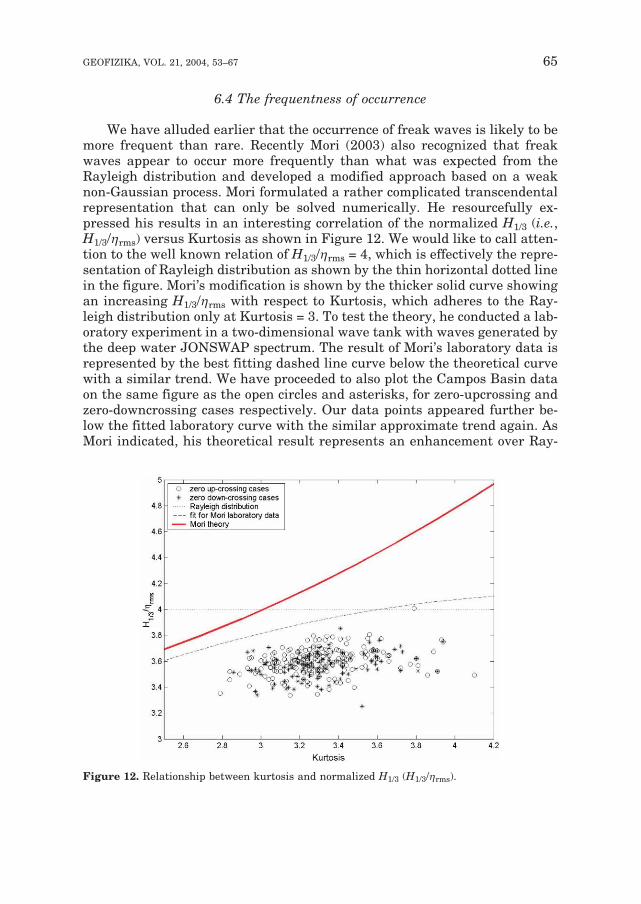
6.4 The frequentness of occurrence
We have alluded earlier that the occurrence of freak waves is likely to bemore frequent than rare. Recently Mori (2003) also recognized that freakwaves appear to occur more frequently than what was expected from theRayleigh distribution and developed a modified approach based on a weaknon-Gaussian process. Mori formulated a rather complicated transcendentalrepresentation that can only be solved numerically. He resourcefully ex-pressed his results in an interesting correlation of the normalized H1/3 (i.e.,H1/3/�rms) versus Kurtosis as shown in Figure 12. We would like to call atten-tion to the well known relation of H1/3/�rms = 4, which is effectively the repre-sentation of Rayleigh distribution as shown by the thin horizontal dotted linein the figure. Mori’s modification is shown by the thicker solid curve showingan increasing H1/3/�rms with respect to Kurtosis, which adheres to the Ray-leigh distribution only at Kurtosis = 3. To test the theory, he conducted a lab-oratory experiment in a two-dimensional wave tank with waves generated bythe deep water JONSWAP spectrum. The result of Mori’s laboratory data isrepresented by the best fitting dashed line curve below the theoretical curvewith a similar trend. We have proceeded to also plot the Campos Basin dataon the same figure as the open circles and asterisks, for zero-upcrossing andzero-downcrossing cases respectively. Our data points appeared further be-low the fitted laboratory curve with the similar approximate trend again. AsMori indicated, his theoretical result represents an enhancement over Ray-
65GEOFIZIKA, VOL. 21, 2004, 53¿67
Figure 12. Relationship between kurtosis and normalized H1/3 (H1/3/�rms).
leigh distribution in freak wave occurrence probability, conceivably his labo-ratory results show still more occurrences. We think a plausible interpreta-tion of the results shown in Figure 12 would be that the natural progressionfrom the Rayleigh distribution through Mori’s modification and laboratoryexperiment to our oceanic results is qualitatively in the logical track of in-creasing frequency of occurrence of freak waves. Our results represent thereality of actual ocean processes, and certainly substantiate our contentionthat freak waves occur much more frequently than the rareness one usuallyconcludes from the Rayleigh distribution hypothesis.
Concluding Remarks
We have presented a radical study of freak waves from a measured dataset that was not intended for freak wave study per se. The study heraldedsome surprising and unexpected results that challenge most of the conven-tional perceptions on freak waves. As freak waves studies are still in theemerging stage, we hope that our results, while signaling divergence fromthe customary, can serve to stimulate further studies on analyzing availableor making new measurements of ocean waves and developing new ap-proaches that recognize freak waves as part of the sweeping ocean wave pro-cesses.
Acknowledgement – The authors wish to thank the Petrobras – the Brazilian Oil Com-pany – for making the wave data available to us.
References
Fisheries and Oceans Canada (2002): http://www-sci.pac.dfo-mpo.gc.ca/osap/projects/waves/de-fault_e.htm.
Janssen, P.A.E.M. (2003): Nonlinear four-wave interactions and freak waves. J. Phys. Oce-anogr., 33, 863–899.
Junger, S. (1997): Perfect Storm. W. W. Norton & Co.Kjeldsen, P. (2000): A sudden disaster – in extreme waves. Rogue Waves 2000, IFREMER,
19–35.Mori, N. (2003): Occurrence probability of freak waves in nonlinear wave field. Ocean Engi-
neering. 31, 165–175Ochi, M. K. (1998): Ocean waves. Cambridge University Press.Pinho, U. F. (2003): Characterization of the sea state in the Campos Basin. M.Sc. thesis, Ocean
Engeneering Progr. Federal University of Rio de Janeiro – COPPE (in portuguese).Sand, S. E., et al. (1990): Freak wave kinematics. In Water Wave Kinematics, NATO ASI Series
E, 178, Kluwer Academic, 535–550.Trulsen, K. and Dysthe, K. (1997): Freak waves – a three-dimensional wave simulation. Proc.
21st Symposium Naval Hydrodynamics, 550–558.Yasuda, T. and N. Mori. (1997): Occurrence properties of giant waves in sea around Japan. J
Waterway, Port, Coast. and Ocean Eng. 123, 209–213.
66 U. FERREIRA DE PINHO ET AL.: FREAK WAVES AT CAMPOS BASIN, BRAZIL
SA@ETAK
Neobi~ni valovi u akvatoriju Campos (Brazil)
Uggo Ferreira de Pinho, Paul C. Liu i Carlos Eduardo Parente Ribeiro
Neobi~ni se valovi ~esto pojavljuju u akvatoriju Campos, sjeveroisto~no od Rio deJaneira (Brazil) u ju`nom Atlantiku. To iznena|uju}e i neo~ekivano otkri}e na~injenoje na osnovi vremenskih nizova prikupljenih valomjerima u akvatoriju Campos urazdoblju od 1991. do 1995. godine. Istra`uju}i pojavljivanje neobi~nih valova i nji-hove zna~ajke utvrdili smo da ti valovi nisu tako rijetka pojava kako se obi~nopretpostavlja te da se javljaju ne samo za olujnih nevremena nego i kad su vremenskeprilike stabilne. Premda uobi~ajena spektralna analiza daje neke informacije o neo-bi~nim valovima, pristup baziran na pretpostavci stacionarnosti slu~ajnog procesao~ito ne mo`e cjelovito dokumentirati jedan takav lokalizirani nestacionarni proceskakav predstavljaju neobi~ni valovi.
Klju~ne rije~i: neobi~ni valovi, oceanski valovi, analiza valomjernih podataka
Corresponding author’s address: Paul C. Liu, NOAA Great Lakes Environmental Research Laboratory, 2205Commonwealth Blvd.,Ann Arbor, Michigan 48105,U. S. A., [email protected]
67GEOFIZIKA, VOL. 21, 2004, 53¿67