free cash flows, agency costs, firm characteristics …
TRANSCRIPT

FREE CASH FLOWS AGENCY COSTS FIRM
CHARACTERISTICS AND PERFORMANCE OF FIRMS LISTED
AT THE NAIROBI SECURITIES EXCHANGE KENYA
MUTENDE EVANS AGALA
A THESIS SUBMITTED IN FULFILMENT OF THE
REQUIREMENTS FOR THE AWARD OF THE DEGREE OF
DOCTOR OF PHILOSOPHY IN BUSINESS ADMINISTRATION
SCHOOL OF BUSINESS UNIVERSITY OF NAIROBI
2018
ii
DECLARATION
Declaration by the Candidate
This thesis is my original work and has not been submitted for an academic award in any
University
Signed ----------------------------------------------------- Date ----------------------------
Evans Agala Mutende
D80730402012
Declaration by the Supervisors
This thesis has been submitted for examination with our approval as University
supervisors
Signed ----------------------------------------------------- Date ----------------------------
Dr Mirie Mwangi
Department of Finance and Accounting
School of Business University of Nairobi
Signed ----------------------------------------------------- Date ----------------------------
Prof James Muranga Njihia
Department of Management Science
School of Business University of Nairobi
Signed ----------------------------------------------------- Date ----------------------------
Dr Duncan Elly Ochieng (PhD CIFA)
Department of Finance and Accounting
School of Business University of Nairobi
iii
COPYRIGHT copy
All rights reserved No part of this thesis may be reproduced or used in any form without
prior written permission from the author or the University of Nairobi except for brief
quotations embodied in review articles and research papers Making copies of any part of
this thesis for any purpose other than personal use is a violation of the Kenyan and
international copyright laws
iv
ACKNOWLEDGMENT
Praise be to God almighty who enabled me to go all the way and complete this work I
thank my supervisors Dr Mirie Mwangi Prof James Muranga Njihia and Dr Duncan
Elly Ochieng for their immense support and ensuring that I completed the course I also
thank Prof Erasmus S Kaijage Prof Kibera Dr Iraki Dr Mary Kinoti Dr Iraya and Dr
Josphat Lishenga for their invaluable input My appreciation also goes to Mr Eric Asuma of
the Nairobi Securities Exchange for availing and facilitating data collection Many people
who contributed to the successful completion of this work including Mr Johnstone Lukokolo
Mandila and Ms Miriam V Ongrsquoanyo I say thank you all
v
DEDICATION
I dedicate this work to my dear wife Naomi Khakasa daughter Marion Metah and son
Collins Agala for their encouragement To my dear parents Mr Andrew Mutende and Mrs
Elizabeth Mutende the sacrifice you made for me since 1979 when I joined Kakunga nursery
school to date is immeasurable All my brothers and sisters thank you so much for your
support
vi
TABLE OF CONTENTS
DECLARATION ii
COPYRIGHT copy iii
ACKNOWLEDGMENT iv
DEDICATION v
LIST OF TABLES x
LIST OF FIGURES xi
ABBREVIATIONS AND ACRONYMS xii
ABSTRACT xv
CHAPTER ONE INTRODUCTION 1
11 Background to the Study 1
111 Firm Performance 3
112 Free Cash Flows 6
113 Agency Costs 7
114 Firm Characteristics 9
115 Firms Listed at the Nairobi Securities Exchange 12
12 Research Problem 15
13 Objectives of the Study 19
131 Broad Objective 19
132 Specific Objectives 20
14 Research Hypothesis 20
15 Value of the Study 21
16 Operational Definition of Terms 22
161 Free Cash flows 22
162 Agency Costs 22
163 Firm Characteristics 23
164 Firm Performance 23
17 Organization of the Thesis 24
vii
CHAPTER TWO LITERATURE REVIEW 26
21 Introduction 26
22 Theoretical Foundation of the Study 26
221 Free Cash Flow Hypothesis 27
222 Agency Theory 28
223 Stakeholder Theory 29
224 Stewardship Theory 31
225 The Resource Based View Theory 33
226 Organizational Theory 36
23 Free Cash Flows and Firm Financial Performance 38
24 Free Cash Flows Agency Costs and Firm Financial Performance 40
25 Free Cash Flows Firm Characteristics and Firm Financial Performance 42
26 Free Cash Flows Agency Costs Firm Characteristics and Firm Financial Performance45
27 Summary of Knowledge Gaps 48
28 Conceptual Framework 55
29 Chapter Summary 56
CHAPTER THREE RESEARCH METHODOLOGY 57
31 Introduction 57
32 Research Philosophy 57
33 Research Design 59
34 Population of the Study 59
35 Data Collection 60
36 Reliability and Validity 60
361 Reliability Test 61
362 Validity Test 62
37 Operationalization of the Study Variables 63
viii
38 Data Analysis 66
39 Choice of Panel Data Analysis Model 67
391 Effect of Free Cash Flows on Financial Performance 68
392 Free Cash Flows Agency Costs and Financial Performance 68
393 Free Cash Flows Firm Characteristics and Financial Performance 70
394 Relating all the Variables 71
310 Chapter Summary 74
CHAPTER FOUR DATA ANALYSIS AND FINDINGS 74
41 Introduction 75
42 Pre-estimation Diagnostics 75
421 Normality test 75
422 Reliability Tests 80
423 Test for Linearity 81
424 Bartletts Test for Internal Consistency 82
425 Multicollinearity Test 83
43 Descriptive Statistics 85
44 Chapter Summary 86
CHAPTER FIVE TESTS OF HYPOTHESES AND DISCUSSION 87
51 Introduction 87
52 Correlation Analysis 87
53 Hypotheses Testing Using Regression Analysis 89
531 Free Cash Flows and Financial Performance 90
532 Free Cash Flows Agency Costs and Financial Performance 92
533 Free Cash Flows Firm Characteristics and Financial Performance 97
534 Free Cash Flows Agency Costs Firm Characteristics and Financial Performance
104
54 Discussion 107
ix
541 The Influence of Free Cash Flows on Financial Performance 107
542 The Influence of Agency Costs on the Relationship between Free Cash Flows and
Financial Performance 109
543 The Influence of Firm Characteristics on the Relationship between Free Cash
Flows and Firm Performance 110
544 The Joint Effect of Free Cash Flows Agency Costs and Firm Characteristics on
Financial Performance 112
55 Summary and Presentation of Empirical Models 115
CHAPTER SIX SUMMARY OF FINDINGS CONCLUSIONS AND
RECOMMENDATIONS 117
61 Introduction 117
62 Summary of Findings 118
63 Conclusions 120
64 Contributions of the Study 121
641 Contribution to Theory 121
642 Contribution to Policy 122
643 Contribution to Practice 123
65 Limitations of the Study 124
66 Recommendations of the Study 125
67 Suggestions for Further Research 126
REFERENCES 127
APPENDICES i
Appendix I Firms Listed at the Nairobi Securities Exchange as at December 31 2015 i
Appendix II Data Collection Form iv
x
LIST OF TABLES
Table 21 Summary of Knowledge Gaps 50
Table 31 Operationalization of Study Variables 64
Table 32 A Summary of Statistical Tests of Hypotheses 72
Table 41 Normality Test 76
Table 42 Reliability Scores for Individual Variables 81
Table 43 Test for Linearity 81
Table 44 Bartlettrsquos Test 83
Table 45 Multicollinearity Test 84
Table 46 Descriptive Statistics for Secondary Data ndash 2006 to 2015 85
Table 51 Pearson Product-Moment Correlations among the Dependent Independent
Intervening and Moderating Variables 88
Table 52 Panel Data Results for Free Cash Flows and Financial Performance 90
Table 53 Panel Data Results of Agency Costs as the Dependent Variable and Free Cash flows
as the Independent Variable 93
Table 54 Panel Data Results of Financial Performance as the Dependent Variable while
Agency Costs and Free Cash flows are the Independent Variables 95
Table 55 Panel Data Results for Financial Performance as the Dependent Variable and FCF
and Firm Age as the Predictor Variables 98
Table 56 Panel Data Results for Financial Performance as the Dependent Variable and FCF
and Firm Age as the Predictor Variables Centered Approach 99
Table 57 Panel Data Results for Financial Performance as the Dependent Variable and FCF
and Firm Size as the Predictor Variables 101
Table 58 Panel Data Results for Financial Performance as the Dependent Variable and FCF
and Firm Size as the Predictor Variables Centered Approach 102
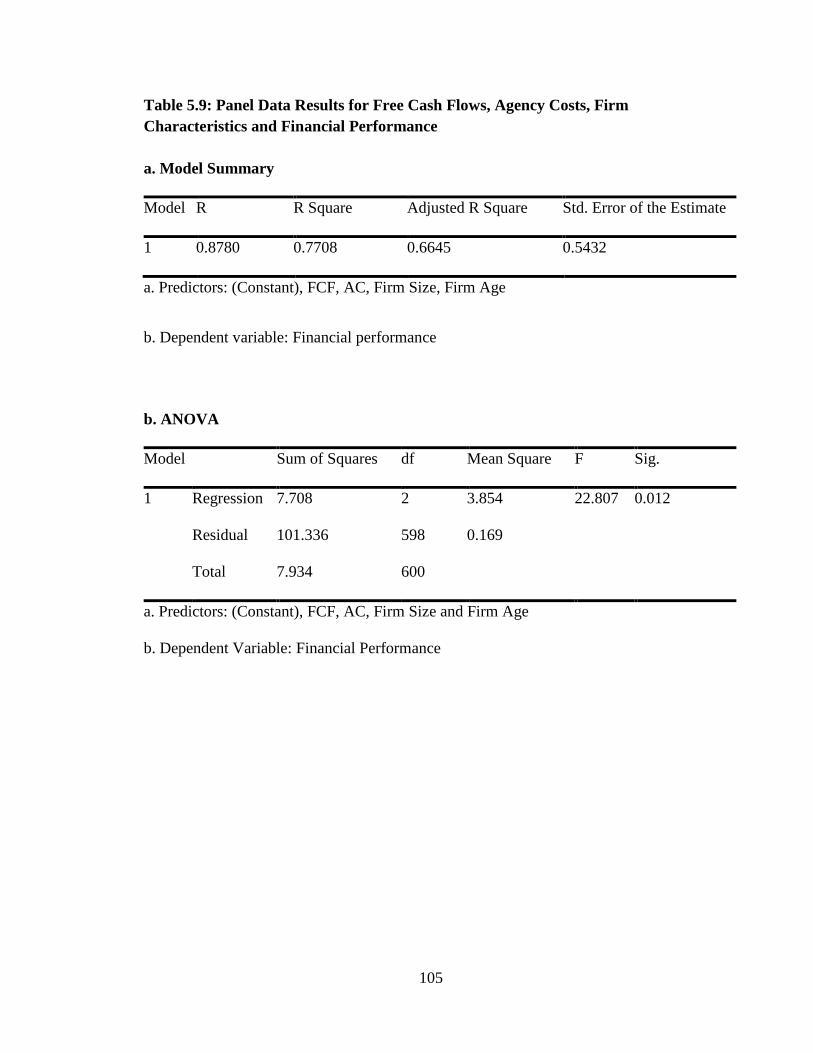
Table 59 Panel Data Results for Free Cash Flows Agency Costs Firm Characteristics and
Financial Performance 105
Table 510 Summary of Tests of Hypotheses Results and Conclusions 114
xi
LIST OF FIGURES
ABBREVIATIONS AND ACRONYMS xii
Figure 21 Conceptual Model 55
Figure 31 Path Diagram for Mediation effect of Agency Costs 69
Figure 41 Q-Q Plot for Free cash Flows (2006 ndash 2015)77
Figure 42 Q-Q Plot for Agency Costs (AC) ndash 2006 to 2015 77
Figure 43 Q-Q Plot for Firm Characteristics (Firm Age) ndash 2006 to 2015 78
Figure 44 Q-Q Plot for Firm Characteristics (Firm Size) ndash 2006-2015 79
Figure 45 Q-Q Plot for Firm Financial Performance ndash 2006 to 2015 80
Figure 51 Revised Empirical Model ndash Financial Performance 116
xii
ABBREVIATIONS AND ACRONYMS
AFM Association of Futures Markets
AIMS Alternative Investment Market Segment
ANOVA Analysis of Variance
ASEA African Securities Exchanges Association
BSC Balanced Score Card
CAPEX Capital expenditure
CCP Central Counter Party
CG Corporate Governance
CMA Capital Markets Authority
CSR Corporate Social Responsibility
DA Discretionary accruals
DY Dividend yield
EMIR European Market Infrastructure Regulations
EASEA East African Securities Exchanges Association
FCF Free Cash flows
FISMS Fixed Income Securities Market
FOMS Futures and Options Market Segment
xiii
IAS International Auditing Standards
IDRC The International Development Research Centre
IFRS International Financial Reporting Standards
KMO Kaiser-Meyer-Olkin
MIMS Main Investment Market Segment
NACOSTI National Commission for Science Technology and Innovation
NASI Nairobi Securities Exchange All Share Index
NSE Nairobi Securities Exchange
NPV Net Present Value
OLS Ordinary Least Squares
OTC Over the Counter
PAT Profit after Tax
Q-Q Quantile ndash Quantile
RBV Resource Based View
ROA Return on Assets
ROE Return on Equity
SACCOs Savings and Credit Cooperatives
xiv
SPSS Statistical Package for the Social Sciences
SSE Sustainable Stock Exchanges
RampD Research and Development
TQM Total Quality Management
UK United Kingdom
USA United States of America
VIF Variance Inflation Factor
WFE World Federation of Exchanges
xv
ABSTRACT
Firm performance is affected by various factors both internal and external to the firm
Internal factors include factors such as firm size age liquidity leverage free cash flows
agency costs profitability and growth prospects among others External factors include
regulation and general macro-economic factors This research sought to find out the
influence of agency costs and firm characteristics on the relationship between FCF and
firm performance The first study objective was to establish how FCF influence
performance of NSE listed firms The second objective was to find out how agency costs
influence the relationship between FCF and performance of NSE listed firms Thirdly to
determine how firm characteristics influence the relationship between FCF and
performance of NSE listed firms and lastly to establish the joint effect of FCF agency
costs and firm characteristics on the performance of NSE listed firms The study used
secondary panel data which were obtained from 60 firms listed at the NSE Secondary
data was for the period 2006 to 2015 Multiple and simple regression analyses were
employed Results indicate that FCF have a positive statistically significant effect on
firm performance and also agency costs have a statistically significant positive
intervening effect on the relationship between FCF and firm performance Additionally
firm characteristics have a positive moderating effect on the correlation between FCF and
financial performance Finally FCF agency costs and firm characteristics have a positive
statistically significant joint effect on firm performance These findings are inconsistent
with the agency theory and the FCF hypothesis Conversely the findings seem to support
the stewardship theory The study therefore recommends that firm managers
shareholders practitioners the government and other regulators should enhance firm
monitoring because the benefits derived from investing therein seem to outweigh the
costs Further research needs to be conducted using longitudinal study design and also by
integrating the views of other practitioners in data collection rather than focusing on firm
managers only
1
CHAPTER ONE INTRODUCTION
11 Background to the Study
The separation of firm proprietorship and management in public firms causes conflict of
interest between firm owners (principals) and firm managers (agents) While the primary
incentive of firm owners is to maximize their wealth by improving firm value the goals
of firm managers are varied and may include enrichment of personal wealth and status
This varying of interests sometimes leads managers to engage in insider dealings where
there are no mechanisms for effective monitoring validation and approving of
managerial decisions (Wang 2010)
Jensen and Meckling (1976) argue that managers opt to extract personal gain from the
firms if they do not hold shares in those firms This has the effect of raising agency costs
which are manifested through investment choices that are not efficient and or managers
not providing sufficient or efficient effort Rising agency costs may eventually affect firm
performance (Tirole 1986) Brush Bromiley and Hendrickx (2000) also hypothesize that
managerrsquos personal-interest encourages wastage and wastefulness when free cash flows
(FCF) are present which similarly could increase agency costs and eventually affect firm
performance Firm characteristics such as profitability firm size liquidity leverage sales
growth age of the firm board structure and composition asset growth turnover
dividend payout and growth prospects are argued to have an influence on the correlation
between FCF and firm performance (Subrahmanyam amp Titman 2001 Kogan amp Tian
2012 and Mukras amp Nzioka 2015)
2
Brush et al (2000) observe that agency theory examines how the behavior of managers
could be focused towards shareholdersrsquo interests to minimize agency costs Jensen and
Meckling (1976) and Jensen (1986) describe three kinds of agency costs First the
monitoring cost of managersrsquo decisions second the bonding cost of restricting
covenants and lastly residual loss due to suboptimal managerial actions The goal of
managers is to enhance personal wealth to the detriment of shareholders The FCF
hypothesis posits that this personal-interest encourages wastage when FCF are present
The stewardship theory is in direct contrast to the agency theory It views managers as
stewards who guard and enhance the wealth of shareholders since by so doing utility
functions of the managers are enhanced (Davis Donaldson amp Schoorman 1997)
Stakeholder theory on the other hand views managers and shareholders among others as
stakeholders and can therefore influence or be influenced by the attainment of the goals
and objectives of the firm (Donaldson amp Preston 1995) The resource based view (RBV)
theory contends that financial firm performance is influenced by firm specific
characteristics (Pierce amp Robinson 2011) Organizational theory on the other hand
attempts to describe the effect of size and firm age on firm performance (Kaen amp
Baumann 2003)
Nyongrsquoo (2000) observes that Kenya has had challenges with regard to the agency
problem and corporate governance (CG) in general The result of these challenges has
been generally low firm profits Ongore and KrsquoObonyo (2011) also note that agency
problems were equally experienced across the globe Several cases of firm failures are an
3
indictment of the efficiency and effectiveness of the current CG structures which fail to
deter FCF related agency costs This research centered on the FCF hypothesis and
agency theory seeks to discover the way agency costs and specified firm characteristics
influence the correlation between FCF and the performance of Nairobi Securities
Exchange (NSE) listed firms Ayako Kungu and Githui (2015) observe that whereas
most NSE listed firms record good performance there are others that have presented
declining performance and yet others have even been delisted from the bourse during the
period between 2003 and 2014 Ongore and Krsquo Obonyo (2011) and Njuguna and
Moronge (2013) have attributed the decline during the period to the agency problem
111 Firm Performance
Gleason and Barnum (1982) define firm performance as a firmrsquos ability to achieve
planned outcomes as measured against projected outputs It encompasses outcomes
associated with shareholder return market performance and financial performance On
the other hand Daft (1995) defines firm performance as the ability to achieve objectives
by expending resources effectively and efficiently Firm performance may also be viewed
as incorporating specifically three areas of organizational outcomes shareholder return
financial return and market performance each with its specific indicators (Richard
Divinney Yip amp Johnson 1999)
Performance is an important concept that is at the centre of a firm and its measurement is
critical in determining whether the firm is achieving the desired objectives Market
performance is measured by assessing customer satisfaction customer retention value
4
delivered to customers and market share While the importance of firm performance is
broadly acknowledged debate on the bases for performance measurement still abound
Researchers should also use operational indicators in addition to using financial
indicators These may include product quality introduction of new products marketing
effectiveness and manufacturing value-addition which may replicate the firmrsquos
competitive position in its industry space and might influence financial performance In
operationalization of firm performance the use of multiple indicator approach would be
superior to the use of only a single indicator (Venkataram amp Ramanujan 1986)
Neely (1998) defined performance measurement systems as comprising of three
interrelated components specific measures that quantify the effectiveness and efficiency
of activities a set of measures that jointly evaluate firm performance as a whole and a
supportive structure that allows data to be collected organized examined deduced and
disseminated Performance measurement is therefore multidimensional On the other
hand Bourne Neely Mills and Platts (2003) describe it as the practice of measuring
effectiveness and the efficiency of an action Efficiency is a measure of how cost-
effective the resources of the firm are used when providing the specified customer service
while effectiveness is the extent to which customer needs are met
The Balanced Score Card (BSC) was developed by Kaplan and Norton (2001) and it
measures customer satisfaction financial performance growth perspectives learning and
of performance and efficiency of internal business processes The sustainable BSC has
been applied to integrate the social and environmental aspects into effective application
5
of both conventional firm strategy and explicit firm sustainability strategies (Figge Hanh
Schaltegger amp Wagner 2002)
The triple bottom line performance measurement integrates the corporate economic
environmental and social performance (Norman amp MacDonald 2004) while the
International Development Research Centre (IDRC) model conceives firm performance
in three general areas First is performance in actions that support the operation
(effectiveness) second is performance related to the available resources (efficiency) and
lastly performance is related to long-term capability or continuing relevance (Lusthaus
Anderson amp Murphy 1995) Other performance measurement techniques include the
Performance Prism and the Cambridge Performance Measurement Process (Neely
Adams amp Kennerley 2002)
Dyer and Reeves (1995) observe that there are no performance measures universally
appropriate and multiple measures should therefore be used Wang (2010) and Ongore
and KrsquoObonyo (2011) use ROA ROE and Dividend Yield (DY) to measure financial
performance Szewczyk Tsetsekos and Zantout (1996) and Mojtahedzadeh and
Nahavandi (2009) have used Tobinrsquos Q as a market-based measure of a firmrsquos financial
performance Tobinrsquos Q relates the market value of firmsrsquo equity with their
corresponding book values Employee job satisfaction employee turnover organizational
effectiveness and efficiency have been proposed by Gleason and Barnum (1982) as non-
financial measures of firm performance Hubbard (1998) observes a positive significant
6
correlation between FCF and performance which is manifested through prudent
investment
112 Free Cash Flows
The concept of FCF presented by Jensen (1986) refers to surplus cash available after
financing profitable ventures FCF are therefore described as net operating income minus
capital expenditure (CAPEX) minus cost of inventory and paid out dividends On the
other hand Brealey Myers and Allen (2005) describe FCF as net income profit after tax
(PAT) plus amortization and depreciation minus CAPEX minus changes in non-cash
working-capital add net borrowingsloans Richardson (2006) argues that firms which
have surplus funds risk wasting it in ventures that are not profitable and that because
FCF are financial resources at the managersrsquo discretion to apportion they are also
referred to as idle cash flows
FCF denotes funds that a firm is able to generate after setting aside cash needed to sustain
or increase its assets FCF are important because they allow firms to pursue investments
that could improve value to shareholders In the absence of funds it is hard to create new
products and services acquire new projects pay out dividends and pay debts Some
shareholders believe that FCF show a better perspective of the firmrsquos ability to create
profits because while earnings can often be misrepresented through accounting
gimmicks it is more difficult to fake FCF Positive FCF indicate that the firm is
generating more funds than are being used to run the firm and to reinvest Many small
firms do not have positive FCF because they invest heavily to grow their operations It is
7
worth-noting that generally negative FCF detrimental to the firm Negative FCF could
be an indication that the firm is engaged in huge investment projects If high returns are
earned from these investments then there is a long run potential payoff (Chen Sun amp Xu
2016)
Jensen (1986) argues that managersrsquo personal - interest motive leads to waste and
inefficiency when FCF are present because the objective of the managers is to increase
their personal wealth instead of shareholdersrsquo wealth Therefore when FCF are present
the result is internal inefficiency and wastage of firm resources which leads to increased
agency costs and lower firm performance Similarly Wang (2010) observes that in the
presence of surplus FCF managers tend to abuse the FCF resulting in inefficient resource
allocation and wrongful investment
113 Agency Costs
Agency costs refer to the cost that a firm incurs due to incongruent interests of firmsrsquo
management and shareholders (Berle amp Means 1932) Jensen and Meckling (1976) point
out that the incomplete manager and shareholder contractual relationship can result into
the agency problem The agency problem that is caused by the firm managers would
result in a loss to the wealth of shareholders in the following ways first managers from
the characteristic of personal-interest drive would raise perquisite consumption and
shirking behavior that in turn leads to increased agency costs Secondly managers might
fail to choose the highest Net Present Value (NPV) project and instead choose that which
maximizes their own personal interest thereby exposing shareholders to unnecessary
investment risk
8
Jensen (1986) claims that there are three kinds of agency costs the monitoring cost of
managersrsquo decisions the bonding cost of restricting agreementcontracts and the residual
loss due to suboptimal managersrsquo actions Monitoring costs are manifested once the
shareholders try to regulate or control the managersrsquo actions For example the auditors
are engaged by a firm on shareholdersrsquo behalf to check and control the managersrsquo
activities to confirm conduct that increases value for the shareholders The pricecost of
engaging the auditors is therefore considered an agency cost The bonding cost entails
bond covenants or contracts A bond covenant is an agreement that restricts the firm from
venturing in specified actions such as a limitation on dividend payment Firm claims
could be structured in a way that controls shareholdersrsquo motive to follow a strategy that
does not increase the total firm value This inherent cost is an agency cost And lastly
residual loss is the cost sustained from conflicting shareholder and manager interests
notwithstanding the use of monitoring and bonding (Smith amp Warner 1979)
Brush et al (2000) argue that once a firm has generated excess FCF management tends
to misuse the FCF resulting in increased agency costs which could eventually lower
firm performance Khidmat and Rehman (2014) on the other hand observe that agency
costs of monitoring could increase as a result of increased FCF and consequently improve
firm performance This is because the firm is able to invest in better CG mechanisms
which improve monitoring managerial decisions and hence reduced wastage Agency
costs are therefore expected to mediate the correlation between FCF and firm
performance because they are intermediate output of FCF Wang (2010) states seven
proxy agency cost measures earnings volatility total asset turnover floatation costs
9
advertising research and development (RampD) expenses to sales ratio operating expenses
to sales ratio free cash flows and administrative expenses to sales ratio
Tirole (1986) argues that there are two main ways through which agency costs are
manifested the first one is inefficient choice of investment and the second is insufficient
or inefficient effort spent by managers Therefore agency cost measures should be
contingent on inefficient asset utilization (due to poor investment choices) excessive cost
of production and extravagant perks for managers (which results in unnecessarily high
expenditure) and inefficient effort spent by managers (the results of which is lower
revenue and profitability) Asset utilization efficiency is measured by assets turnover
ratio which is described as the ratio of sales to assets It indicates the way managers use
the assets under their control in generating revenue Production cost efficiency on the
other hand is measured as operating expenses divided by sales Singh and Davidson
(2003) observe that a high level of operating expense is a close estimate of managersrsquo pay
and perquisites in terms of high salaries executive and lavish offices and other corporate
support amenities To a large extent these costs reflect discretionary expenditure at the
disposal of firm managers
114 Firm Characteristics
Zou and Stan (1998) define firm characteristics as a firmrsquos managerial and demographic
variables that in turn encompass part of the firmrsquos internal environment Firm
characteristics have been listed by Kogan and Tian (2012) to include firm size leverage
liquidity sales growth asset growth and turnover Others include ownership structure
board characteristics age of the firm dividend pay-out profitability access to capital
10
markets and growth opportunities (Subrahmanyam amp Titman 2001 and McKnight amp
Weir 2008)
Vogt (1997) argues that the more a firm has FCF the more it engages into capital
investment and hence the higher the performance Smaller firms gear towards rampant
growth thereby utilizing most or all the available FCF in a bid to better firm
performance The relationship between FCF and investment is stronger in small and
medium firms which generally are in the growth stage Adelegan (2009) on the other
hand notes that the influence of firm size is neutral and that firms that are older incline
more on internally generated funds to finance their business investments than small and
medium firms
Cline Williamson and Yore (2014) observe that the FCF problem seems to be intense in
medium and large multinationals that are less reliant on the capital market The smaller
firms that fund their investments with funds that are generated externally do not
experience such declines in wealth This is because firms that are larger have
considerably more FCF that are available and are subsequently less dependent on the
external market When high FCF are available the unconstrained manager may
socialistically fund investment projects that have a negative NPV Increased levels of
FCF lead to sub-optimal allocation of resources in form of value-destroying and cross-
subsidizing investment action that eventually deteriorates firm performance
Firm age and performance relationship is to a large extent driven by selection and
learning effects in the early stages of the firmrsquos life Once a firm is older the relationship
11
could be more indirect due to a correlation between age of the firm and ownership
changes product life cycle size of the firm and management Usually firms that are new
require time to adapt to the environment A new firm needs to catch up with an older firm
when the new firmrsquos performance is lower than that of the older (existing) firm so as to
be competitive in the market Therefore it is expected that firms that are new will show
higher growth rates in productivity than the older firms as a result of high FCF Hence
age of the firm is negatively correlated with productivity growth rate because older firms
have lower FCF (Brouwe Kok amp Fris 2005)
Similarly Cadogan and Diamantopoulos (1995) note that as firms become older and
more experienced they tend to be more bureaucratic and inflexible Demsetz and Lehn
(1985) denote firm size as the log of total assets and argue that in smaller firms agency
costs related to the FCF problem may be relatively lower than in larger firms because of
more growth opportunities available for smaller firms Larger firms tend to overinvest
thereby generating a relatively lower return on assets (ROA)return on equity (ROE)
Opler and Titman (1993) maintain that more likely firms that have high growth
prospects are managed better than those with less growth prospects Such firms are also
less likely to have surplus FCF since any available cash would be spent on projects that
have positive NPV Thakor (2013) further argues that foreign cash in firms that have
good growth opportunities should be valued significantly higher than foreign cash in
firms that have poor growth prospects since firms that have poor growth prospects are
more likely to be adversely affected by the repatriation tax burden and FCF problems
12
stemming from a relatively low shadow price of cash This further implies that foreign
cash for firms that have poor investment prospects ought to be valued at a discount while
foreign cash for firms that have good investment prospects should be valued at a
premium
Heydari Mirzaeifar Javadghayedi and Student (2014) postulate that firm characteristics
can expose a firm to more managerial costs and thus decrease the expected positive effect
of FCF on firm performance Firm characteristics are therefore expected to moderate the
correlation between FCF and firm performance because their interaction affects the
strength and or direction of the correlation between the dependent and independent
variables (Baron amp Kenny 1986) This study focused on firm characteristics of firm size
and age of the firm because their influence on the correlation between FCF and firm
performance seem to be more significant (Demsetz amp Lehn 1985 and Mule Mukras amp
Nzioka 2015)
115 Firms Listed at the Nairobi Securities Exchange
NSE is the primary stock market in Kenya Apart from equities the NSE deals with the
issue and trade of debt instruments NSE is a member of East African Securities
Exchanges Association (EASEA) and the African Securities Exchanges Association
(ASEA) and also an associate member of World Federation of Exchanges (WFE) a
subordinate member of the Association of Futures Markets (AFM) Additionally the
NSE is a partner Exchange in the United Nations Sustainable Stock Exchanges Initiative
(SSE) The NSE is a market for securities approved and controlled by the Capital
13
Markets Authority (CMA) and has 63 listed firms (Appendix I) Introduced in 2008 the
NSE All Share Index (NASI) is a general indicator of market performance The NASI
integrates all the daily transacted shares therefore giving the general outline of the value
of the market as opposed to the activities of selected securitiesrsquo prices The daily trading
volume of the market is valued at over US $5000000 and a total market capitalization
estimate of US $15000000000 Corporate bonds government bonds and equities are
also traded at the NSE (NSE 2015)
Odundo (2009) notes that as part of the NSE market transformation program the CMA
introduced market improvements in 2001 which led to the restructuring of the NSE into
four separate segments The Alternative Investments Market Segment (AIMS) Main
Investments Market Segment (MIMS) Fixed Income Securities Market Segment
(FISMS) and the Futures and Options Market Segment (FOMS) Development of the
capital market has remained Kenyarsquos strategic development goal since the mid-1980s
The government has realized significant reforms over the last three decades to underpin
the countryrsquos development prospects including modernization of the NSE which includes
computerization of trading divergence of listed securities and stocks dematerialization
and improvement of regulatory and supervisory structures The NSE is among the fastest
growing stock exchanges in the developing markets and is the largest in East Africa
(Ayako et al 2015)
The NSE (2015) indicates that Kenyarsquos capital market has continued to develop The
NSE signed up six clearing members as the exchange readied itself to introduce a
14
derivatives market These clearing members include Cooperative bank of Kenya
Barclays bank of Kenya NIC bank CBA and CFC Stanbic bank Other banks are slated
to sign up and the clearing members would by executing the principal role of clearing
and settling deals strengthen the NSErsquos abilities to begin derivatives trading The
derivatives mechanisms will primarily comprise currency futures and stock indices and
will work to expand liquidity in the market increasing the boursersquos product offer The
NSErsquos derivative market which received authorization from CMA will permit
derivatives that are exchange traded and created on various underlying financial
instruments that will include equities and currencies
The universal world norm has been a system of central counterparty (CCP) clearing and
reporting represented by the European Market Infrastructure Regulationsrsquo (EMIR) latest
rules Further to demanding central clearing of standardized Over-the-Counter (OTC)
derivatives that wasnrsquot the practice earlier EMIR presented other numerous processes to
minimize counterparty risk a significant matter which led to contagion in the recent
global financial crisis The NSE derivatives contracts will be exchange traded and
therefore clearing members will be critical components of the CCP clearing network
(NSE 2015) The CMA (2010) shows that as of 2008 the most actively traded market in
Africa was South Africa recording over 70 percent of the whole African securities
markets revenue making it the most liquid securities market in Africa with the NSE
ranking 5th
with 02 per cent contribution
15
The NSE listed firms were selected for this study because data is readily available and
also the data is generally deemed credible Ponnu and Okoth (2009) observe that several
challenges ranging from boardroom wrangles poor decision making lack of oversight to
control by various boards of directors and unethical practices have been evident among
the listed firms resulting in a trend of poor performance Similarly NSE (2015) shows
that several listed firms have previously been delisted liquidated or placed under
receivership on account of the agency problem
12 Research Problem
The FCF hypothesis suggested by Jensen (1986) states that firm managers may invest in
needless negative NPV projects when there is surplus FCF at their disposal The
hypothesis suggests that greater levels of FCF could lead to more unnecessary
administrative waste and inefficiency negatively impacting on firm performance
Demsetz and Lehn (1985) find that in the presence of substantial FCF large firms tend to
have fewer growth opportunities than smaller ones which could lead to an
overinvestment problem thereby negatively impacting on firm performance Similarly
Gul and Tsui (1998) note that an escalation in financial leverage seems to diminish
agency costs because managers are subject to legal bonding of repaying interest and debt
that subsequently decreases misuse of FCF and therefore improves firm performance
The agency problem accounting anomalies and other governance manipulations is a
worldwide phenomenon affecting many firms including Enron Corporation of the United
States of America (USA) and China Aviation (Ongore amp KrsquoObonyo 2011) The World
16
Bank (2000) indicates that the failure of major conglomerates such as the Bank of Credit
and Commerce International and WorldCom in the USA and United Kingdom (UK)
respectively has inspired interest in the agency problem and governance The economic
crisis in Asia has also contributed to the rising profile of the agency problem In the East
African region the agency problem and governance have been discussed in the
framework of state-run companies where corruption malpractice and subsidization of
deteriorating firms by the government have been the major issues of concerns The
Kenyan context has been characterized by appeals for active CG particularly for public
firms (Okiro 2014) The recent financial problems facing Fidelity commercial bank
Charterhouse bank Imperial bank and Chase bank could be related to the agency problem
between shareholders and firm managers (Central Bank of Kenya 2016)
Frentrop (2003) has recounted that there is still lack of consensus on identifying the
extent and dealing with the complications that are intrinsic in CG processes Waithaka
Ngugi Aiyabei Itunga and Kirago (2012) observe that FCF have caused conflict between
firm managers and shareholders which in turn have affected performance of NSE listed
firms Similarly Ongore and KrsquoObonyo (2011) noted existence of agency problems
among firms listed at the NSE which negatively affected their performance These
observations are consistent with Nyongrsquoo (2000) who posits that the low firm
performance across the Kenyan economy is primarily due to agency problems and bad
CG practices
17
Globally empirical literature shows mixed findings regarding FCF and firm performance
For instance Nekhili Amar Chtioui and Lakhal (2014) carried out a study in Australia
and found increased agency costs emanating from the presence of FCF Similarly Brush
et al (2000) conducted a study in the USA and found that weak CG caused inefficiency
in the allocation of FCF While these findings support the argument that FCF negatively
affects firm performance on the contrary Gregory (2005) whose study was carried out
in the UK established that the mergers with higher FCF were performing better than
mergers with lower FCF In addition a study by Szewcyzk et al (1996) in the USA
found that shareholders favored firms that had both significant FCF and investment
opportunities that were profitable Locally Wambua (2013) found a positive correlation
between FCF and performance of NSE listed firms which again invalidates the
hypothesis which states that there is a negative correlation between FCF and performance
of the firm Conversely Njuguna and Moronge (2013) found that agency conflicts within
firms listed at the NSE are related to FCF which negatively affects firm performance
Regarding the moderating effect of firm characteristics Hendricks and Singhal (2001)
found that smaller firms tend to have better performance in terms of higher sales growth
Similarly Kinoti (2012) found a statistically positive moderating effect of firm
characteristics (ownership age of the firm firm size and type of industry) on the
correlation between corporate image and performance of the firm Conversely Njeru
(2013) found that firm characteristics did not have a statistically significant moderating
effect on the correlation between market orientation and performance In view of these
18
contradicting results it was necessary to further investigate the moderating influence of
firm characteristics on the correlation between FCF and performance of the firm
Some prior studies portray or tend to equate FCF to agency costs For instance Jensen
(1986) presents his study as ldquoagency costs of FCF corporate finance and takeoversrdquo
while Lin and Lin (2014) describe their study as ldquoagency costs of FCF and biddersrsquo long-
run takeover performancerdquo Furthermore Wang (2010) mentions seven proxy measures
of agency costs and one of the proxy measures equates FCF to agency costs These
studies do not give a clear distinction between agency costs and FCF This study has
attempted to delineate FCF from agency costs and has also attempted to provide linkages
between all the study variables
Wang (2010) and Lin and Lin (2014) excluded CAPEX and net borrowings in their
operationalization of FCF This study included both CAPEX and net borrowings in the
definition of FCF Additionally unlike Njuguna and Moronge (2013) who used asset
utilization efficiency as the sole measure of agency costs this study also incorporated
production cost efficiency to measure agency costs that arise out of monitoring
managementrsquos actions These measures of FCF and agency costs are more robust
Furthermore some of the prior studies are bivariate For instance Njuguna and Moronge
(2013) and Wambua (2013) focused on the influence of agency costs on firm
performance In this study a multivariate analysis was employed where the joint effects
of FCF agency costs firm characteristics and firm performance were all incorporated
While many of the studies were carried out in developed economies such as Australia
19
France UK and the USA this study focused on firms listed at the NSE employing cross-
sectional and panel data research designs
In summary this study sought to fill the identified knowledge gaps which constitute the
research problem as follows first global empirical study findings are mixed and non-
conclusive This study therefore focused on firms listed at the NSE and used panel data
design Secondly the study sought to delineate FCF from agency costs Third the study
incorporated the major firm characteristics of firm size and age Fourth CAPEX and net
borrowings were incorporated in defining FCF Fifth two measures of agency costs were
incorporated and these are asset utilization efficiency and production cost efficiency
Lastly a multivariate study was adopted as opposed to bivariate This research was
guided by the following study question How significant is the influence of agency costs
and firm characteristics on the relationship between FCF and financial performance of
firms listed at the NSE
13 Objectives of the Study
The broad objectives and specific objectives of the study are here-below stated
131 Broad Objective
The broad objective of this research was to determine the effect of agency costs and firm
characteristics on the relationship between FCF and financial performance of firms listed
at the Nairobi Securities Exchange Kenya
20
132 Specific Objectives
i Establish the relationship between free cash flows and financial performance of
firms listed at the Nairobi Securities Exchange
ii Assess the influence of agency costs on the relationship between free cash flows
and financial performance of firms listed at the Nairobi Securities Exchange
iii Determine the influence of firm characteristics on the relationship between free
cash flows and financial performance of firms listed at the Nairobi Securities
Exchange
iv Establish the joint effect of free cash flows agency costs and firm characteristics
on financial performance of firms listed at the Nairobi Securities Exchange
14 Research Hypothesis
H1 Free cash flows have no significant effect on the financial performance of firms listed
at the Nairobi Securities Exchange
H2 Agency costs have no significant intervening effect on the relationship between free
cash flows and financial performance of firms listed at the Nairobi Securities Exchange
H3 Firm characteristics have no significant moderating effect on the relationship
between free cash flows and financial performance of firms listed at the Nairobi
Securities Exchange
H3a Firm age has no significant moderating effect on the relationship between
FCF and financial performance of firms listed at the NSE
21
H3b Firm size has no significant moderating effect on the relationship between
FCF and financial performance of firms listed at the NSE
H4 There is no joint effect of free cash flows agency costs and firm characteristics on
financial performance of firms listed at the Nairobi Securities Exchange
15 Value of the Study
This study was intended to provide insights into knowledge about how agency costs and
firm characteristics influence the relationship between FCF and the financial performance
of NSE listed firms This research examined the validity of the FCF hypothesis agency
theory stakeholder theory stewardship theory RBV theory and the organizational theory
and established linkages between these theories thereby interrogating existing
knowledge to affirm modify or reject it The research community in finance will benefit
from the study because it is intended to aggregate and provide important quantitative
literature that will bridge the existing knowledge gap regarding FCF agency costs firm
characteristics and financial performance of firms listed at the NSE It will also serve as
a foundation upon which more empirical studies will be built hence propagating
knowledge
This study sought to establish the correlation between FCF agency costs firm
characteristics and firm performance Investors firm managers and other practitioners
will benefit from the study because it delineates FCF from agency costs and also brings
out the linkages between FCF agency costs firm characteristics and firm performance
Firm managers are expected to act more prudently and efficiently in their pursuit of
maximizing shareholdersrsquo wealth through better firm performance Investors and other
22
practitioners will build on the understanding of the linkages between these variables to
help improve firm performance
The NSE and the listed firms have high growth potential given the various initiatives
being undertaken at the bourse such as demutualization restructuring and introduction of
derivatives trading The government NSE and CMA stand to benefit from this study
because the insights and intuitions gained from the study will help in the development
and improvement of existing policies guidelines and regulation
16 Operational Definition of Terms
The key study variables have been defined as follows
161 Free Cash flows
The term free cash flows refers to the sum of surplus funds available after funding
profitable projects This is described as net income plus depreciation and amortization
less capital expenditure less change in non-cash working capital plus net borrowing
(Brealey Myers amp Allen 2005)
162 Agency Costs
Agency costs refer to the cost that a firm incurs due to inconsistent interests of
management and shareholders (Berle amp Means 1932)
23
163 Firm Characteristics
Firm characteristics refer to a firmrsquos demographic and managerial variables which in turn
comprise part of the firmrsquos internal environment Firm characteristics include firm size
leverage liquidity sales growth asset growth and turnover age of the firm dividend
pay-out profitability access to capital markets and growth opportunities (Zou amp Stan
1998 Kogan amp Tian 2012 Subrahmanyam amp Titman 2001 and McKnight amp Weir
2008) This study focused on firm size and age of the firm
164 Firm Performance
In this research the term firm performance is used interchangeably with organizational or
corporate performance Firm performance refers to an assessment of an organization in
terms of its ability to achieve its stated objectives over a given period of time Firm
performance is broad and has to be studied with reference to its indicators A firm that is
able to meet its objectives is considered to be successful (Sagwa 2014) For this study
firm performance was measured in terms of financial performance
Financial performance perspective may be measured using Tobinsrsquo Q ROA ROE DY
sales growth rate market share productivity and profitability among others This study
used Tobinrsquos Q to measure financial performance Tobinrsquos Q compares the market value
of a firmrsquos equity with its corresponding book values
24
17 Organization of the Thesis
This thesis contains six chapters The first chapter has the introduction and background to
the study The NSE has also been discussed the research problem research objectives
value of the study scope and how the study is organized In chapter two the theoretical
framework on which the study is based has been discussed
The chapter reviews the theoretical and empirical literature relating to the linkages among
the study variables The theories reviewed are The free cash flow hypothesis agency
theory stakeholder theory stewardship theory RBV theory and the organizational
theory
Empirical literature has focused on the relationships among the variables as follows FCF
and firm performance FCF agency costs and firm performance FCF firm
characteristics and firm performance FCF agency costs firm characteristics and firm
performance A summary of knowledge gaps has been presented and finally the chapter
ends with the conceptual framework that guides the study and the conceptual hypotheses
Chapter three has identified and discussed the philosophical orientation the study design
and population of the study
Additionally it has highlighted data collection methods reliability and validity
considerations operationalization of the study variables and analytical data models
Chapter four presents the findings of the general data analysis starting with test of
25
validity and reliability then the descriptive statistics including frequency tables
percentages standard deviations means and Cronbachrsquos Alpha Coefficient of reliability
A presentation of the results of the test of hypotheses and interpretation has been featured
under chapter five The chapter has concluded by a discussion of the resultsfindings
Chapter six gives a summary of the findings conclusion study implications limitations
and recommendations for further studies
26
CHAPTER TWO LITERATURE REVIEW
21 Introduction
The chapter has explored the theoretical foundations of the study Empirical literature has
also been discussed under four sections as follows First FCF and financial performance
second FCF agency costs and financial performance third FCF firm characteristics
and financial performance and lastly FCF agency costs firm characteristics and
financial performance
This chapter also gives a summary of knowledge gaps a graphical framework of the
study variables (FCF agency costs firm characteristics and financial performance)
depicting the researcherrsquos conceptualization of the study It then concludes with the
conceptual hypotheses
22 Theoretical Foundation of the Study
The theoretical framework upon which this study is based is varied Six theories have
been discussed and these are FCF hypothesis agency theory stakeholder theory
stewardship theory RBV theory and the organization theory The research sought to
establish the influence of agency costs and firm characteristics on the correlation between
FCF and performance of NSE listed firms
Although the agency theory stakeholder theory stewardship theory RBV theory and the
organization theory contribute heavily in attempting to explain the interaction between
27
the identified variables and their combined effect on firm performance the FCF
hypothesis is the overarching theory on which this study is founded
221 Free Cash Flow Hypothesis
The notion of FCF was initially suggested by Jensen (1986) where FCF was described as
net cash flow after subtracting all the needs of positive NPV ventures Jensen (1986)
submits that when there are surplus FCF the severity of the agency conflict between firm
shareholders and firm managers is higher The reason for the conflict is that when there is
excess cash in the firm there is no need for the management to raise cash from the capital
market This gives firm management the freedom to spend invest without being
monitored by capital providers as would have been the case if such funds were raised
from the capital market Shareholders would rather have such excess funds distributed
back to them through share repurchase programs or as dividends if the growth
opportunities for the firms are limited and the funds could not be prudently invested
elsewhere Management on the other hand would waste the surplus funds in unprofitable
investments administrative waste and managerial perks
FCF hypothesis postulates that when firms have made significant FCF and the firms do
not have gainful investment projects available firm managers tend to misuse the FCF
which consequently raises agency costs Critics of the FCF hypothesis claim that it
nurtures short termism by discouraging investment that would bring profit in the long-
run This study is related to the FCF hypothesis because based on the observation by
Brush et al (2000) managersrsquo personal-interest inspires wastefulness and ineffectiveness
28
when there is surplus FCF This study sought to establish the influence of agency costs
and firm characteristics on the relationship between FCF and firm performance In this
study therefore it was expected that FCF would have a negative effect on firm
performance
222 Agency Theory
The agency theory was advanced by Jensen and Meckling (1976) and it avows that
shareholders who are the owners (principals) of the firm hire firm managers (agents)
The principal expects the agent to make decisions and act in the ownerrsquos principalrsquos best
interest The managers agents may however have self-interests that conflict with the
interests of the principals Brush et al (2000) observe that agency theory is founded on
the principle that the objective of the management is to achieve their individual interests
instead of shareholdersrsquo interests and that managersrsquo personal-interest encourages waste
and ineffectiveness when there are surplus FCF
Agency theory suggests mechanisms that aim to resolve the shareholder interests and
those of the management The mechanisms include external control measures like
takeovers (Easterwood 1997) The potential for conflict between shareholders and
managers may also be minimized by the use of internal control measures like non-
executive directorsrsquo monitoring and executive share ownership incentives The advocates
of agency theory postulate that control measures are mandatory for directing dishonest
managerial actions Critics on the other hand argue that control creates stronger personal
behavior lessens proactive organizational actions and honesty and lastly results in
suspicion (Jensen amp Meckling 1976)
29
Divergences in goals and attitude towards risk and decentralization in information are
tenets of the agency theory If the information asymmetry and conflict of interestsrsquo
assumptions and are allayed the agency problem then becomes inconsequential and not
of any interest scientifically If there were no information asymmetry the principal would
simply direct and control the agentrsquos actions and appropriately reward the agent If the
principal and the agent have consistent interests then the agentrsquos incentives are clear
(Podrug 2010)
A critique of the agency approach is that the analytical focus on how to resolve conflict
between the various stakeholders in the firm is too narrow and the shareholders are not
the only ones who make investment in the firm (Donaldson 1990) Additionally Hill
(1990) has argued that even in situations of very specific assets where the possibility of
unscrupulousness is very high there are people who will give precedence to collaboration
and trust and will not initiate opportunistic behavior Just like the FCF hypothesis this
research is related to the agency theory because it is centered on conflict of interests
between firm managers and shareholders One of the objectives of this study is to
determine the influence of agency costs on the relationship between FCF and firm
performance It was expected that the higher the agency costs the higher the effect on the
relationship between FCF and firm performance
223 Stakeholder Theory
Developed by Freeman (1984) stakeholder theory combines business accountability to a
wide collection of stakeholders The theory advances that the management of firms has a
30
network of relationships to serve in its stakeholdersrsquo circle in its achievement of
corporate goals The theory develops the understanding of corporate accountability to
include a broad collection of stakeholders such as customers suppliers business
associates employees government and its agencies financial institutions among others
A stakeholder is defined as any person or group which can influence or is influenced by
the attainment of the personrsquos or grouprsquos objectives
Mitchell Agle and Wood (1997) maintain that a stakeholder may be recognized by
looking at either one or two or all the associative aspects namely first the clout to impact
the firm secondly the legality of affiliation in or with the firm and lastly the
earnestness of their entitlement in or on the firm Unlike agency theory in which the
management work and serve the shareholders stakeholder theorists propose that firm
management has a relationships network for service and these include employees
business partners and suppliers Stakeholder theory attempts to address the collection of
stakeholders eligible and demanding managersrsquo attention (Sundaram amp Inkpen 2004)
Donaldson and Preston (1995) have argued that all stakeholders participating externally
or internally in the firm have an interest to fulfill This includes the characteristics and
behavior of firms incorporating how the firm is run how the board of directors thinks
about firm units the way management think about organization and the nature of the firm
itself In this regard the firm should strive to satisfy not only the welfare of its
shareholders but also the welfare of other relevant stakeholders Hence the board should
ensure that the firm acts on opportunities that enhance value to all the relevant
31
stakeholders and also prevent bad management practices that may expose the firm to
scandals or risk financial distress To achieve these the board should consist of more
members with diverse competencies experience as well as capabilities that will
effectively discharge its governance function
The stakeholdersrsquo model has been criticized by Donaldson and Preston (1995) arguing
that managers may use ldquostakeholderrdquo reasons to justify poor performance Mansell (2013)
has also critiqued the stakeholder theory stating that by using the political notion of a
lsquosocial contractrsquo to the firm stakeholdersrsquo theory weakens the values upon which a
market economy is founded The stakeholder theory is relevant to this study to the extent
that shareholders and firm managers are considered as lsquostakeholdersrsquo and therefore can
influence or are influenced by the accomplishment of the organizationrsquos goals This
theory implies that the relationships of the variables in this study can take any direction
positive negative or no relationship
224 Stewardship Theory
Developed by Donaldson and Davis (1991) stewardship theory has its origins in
sociology and psychology A steward guards and strives to maximize the shareholderrsquos
interests through firm performance since in doing so the value of the steward is also
maximized From this perception the steward is the firm management who work for the
shareholders defending and making returns for them Stewardship theory emphasizes the
role of firm management being stewards incorporating their objectives as part of the
firm Therefore as stewards they are contented and encouraged when the firmrsquos success
is accomplished The stewardship theory is quite the opposite of the agency theory It
32
submits that firm managers are honest and upright stewards of the assets delegated to
them under their care and thus making monitoring useless The theory opposes the
agency theory which assumes that managers will act to satisfy their own self-interest
rather than that of the firm Rather stewards who are managers executives and board of
directors are satisfied and motivated when firm objectives are achieved (Donaldson amp
Davis 1991 and Davis et al 1997)
Davis et al (1997) argues that stewards derive greater utility at personal level by
satisfying firm objectives than through self-serving behavior and as such the managers
and directors are also concerned about their personal reputation as expert decision
makers which drives their effort towards better firm performance of the firms they serve
According to the stewardship theory other non-financial motivations such as need for
accomplishment and gratitude personal fulfillment gained by successful achievement of
the goals of the firm respect for authority and peers as well as the firmrsquos work ethics do
impact on the actions of the stewards Superior firm performance is connected to having
majority of inside directors as opposed to external directors since inside directors know
the firm better and are better placed to manage than outside directors
Daily Dalton and Cannella (2003) discern that in order to guard their reputation as
decision makers in firms firm managers are motivated to run the firm with the main
objective of maximizing firm performance Similarly Fama (1980) suggests that firm
managers are also protecting their careers so as to be seen as efficient and effective
stewards of their firms Davis et al (1997) have critiqued the stewardship theory arguing
33
that the role of the lsquostewardrsquo is over-simplified and impracticable and that the theory
emphasizes the personalities and egos of senior directors The stewardship theory is
related to this study to the extent that firm managers are considered lsquostewardsrsquo who act on
behalf of shareholders Just like the stakeholder theory stewardship theory adds value
especially in explaining outcomes where the FCF hypothesis and agency theory are not
supported Since this theory emphasizes the role of firm managers being that of stewards
it was expected that the higher the FCF the higher the firmrsquos performance
225 The Resource Based View Theory
RBV is defined by Pearce and Robinson (2011) as a way of examining and recognizing a
firmrsquos strategic advantages based on observing its distinct mix of skills assets
intangibles and capabilities The RBV theory is concerned with internal firm-specific
factors and their effect on performance Grant (1991) observes that RBV theory views the
firm as a bundle of resources that are combined to generate firm capabilities which it can
use to earn above average profitability Every firm develops capabilities from these
resources and when they are well established these become the basis of the firmrsquos
competitive advantage Penrose (1959) explains the significance of exceptional
packagesbundles of resources controlled by the firm which are critical for performance
These firm resources comprise of tangible assets all capabilities attributes of the firm
organizational processes knowledge and information controlled in order to expand
competence effectiveness and efficiency that will in general lead to greater financial
performance
34
Resources are defined as firm capabilities physical assets and intangibles that are semi-
permanently tied to the firm (Wernerfelt 1984) Barney (2002) observes that the RBV
competitive advantage stems from a firmrsquos unique assets and distinctive capabilities and
assumes that firms can be hypothesized as bundles of resources and that those resources
are heterogeneously dispersed across the firms with resource variances persisting over
time Similarly Baker and Sinkula (2005) note that RBV of the firm suggests that
performance is contingent on the firmrsquos competences and specific resources
The thirst to understand the effects of firm level characteristics on financial performance
has been debated a lot in the research arena Among the arguments presented is that a
firmrsquos financial performance is affected only by structural characteristics within the
industry The other argument is that a firmrsquos financial performance is affected by firm
specific resources Much focus has been given to the firm level characteristics as opposed
to the industry level characteristics because it forms the basis upon which the firms
compete The industry related factors is majorly explained by the competitive focus
approach The RBV theory explains the effect of firm characteristics which are internal
factors to the firm with respect to financial performance (Bain 1959 and Porter 1980)
Researchers have carried out studies to test which of the two commonly disputed factors
(industry factors or firm specific factors) are important in explaining variations in firm
performance Wernerfelt and Montgomery (1985) Schmalensee (1985) Rumelt (1991)
Chang and Singh (2000) and Hawawini Subramanian and Verdin (2003) performed
variance component analysis test to establish the percentage of effects of firm
35
characteristics and industry factors on firm performance as measured by ROA Under the
RBV the firm is seen to be heterogeneous and firms possess a combination of unique
capabilities and assets that are responsible for giving them an upper hand in competition
and enable them achieve superior performance
Wernerfelt (1984) was the earlier supporter of the RBV theory but he did not get much
attention at the time However scholars such as Grant (1991) Stalk Evans and Schulman
(1992) and Williams (1992) revisited Wernerfelt (1984) and found that firms with
particular set of skills and capabilities outperformed their rivals Wernerfelt (1984)
describes a resource as ldquoanything that could be deemed as a strength or weaknessrdquo
According to the RBV of the firm resources (which are inputs for the production of
goods and services) and organizational competences (intangible assets that are founded
learning skills and knowledge in deploying resources) can be sources of competitive
advantage The RBV is criticized for its failure to describe how these resources are
established and organized to realize competitive advantage RBV has also been critiqued
for its inability to contemplate the effect of a dynamic market environment (Lengnick-
Hall amp Wolff 1999 and Priem amp Butler 2001)
Another criticism of the RBV theory is that researchers only concentrate on one resource
type that is intangible assets within a single industry and examine its effect on firm
performance The RBV theory helps in explaining performance variation of intra industry
firms as it specifically addresses firm characteristics rather than industry factors
Financial resources are normally measured by leverage ratios which enable the firm to
36
increase its project financing by borrowing from debt providers Liquidity measures
spontaneous financial resources available to conduct normal business operations
Physical resources as measured by the size of assets is one of the tangible resources the
firm can use to gain competitive advantage while business experience of the firm and
serving board of directors give the firm organizational capabilities that it can use to gain a
competitive advantage over its competitors thus being able to earn an above average
financial performance
The boards of directors are viewed as strategic resources that are responsible for the
advancement of the firms to meet their long-term objectives (Kapelko 2006) RBV is
related to this study because it maintains that a firmrsquos financial performance is influenced
by firm specific characteristics (which are one of the study variables) Based on the RBV
therefore it was expected that the higher the FCF the higher will be firm performance
Firm characteristics were expected to provide an interaction which statistically affects the
strength and or direction of the correlation between FCF and firm performance
226 Organizational Theory
Kaen and Baumann (2003) in an attempt to explain firm size came up with the
organizational theory that explains firm size in relation to profitability as well as
organizational transaction costs agency costs and span of control costs Organizational
theory explains the effect of firm size and age of the firm on firm performance Dean
Robert and Bamford (1998) cite that the size of the firm is somewhat correlated to firm
performance because of concentration industry-sunk costs overall industry profitability
37
and vertical integration Firm size matters in assessing financial performance Large-sized
firms have greater number of departments multi-layer levels of management have more
specialized functions and skills greater formalization and management control is highly
centralized which makes them highly bureaucratized than small-sized firms effectively
making them miss out on profitable opportunities that require urgent attention (Daft
1995)
Hannan and Freeman (1984) Aldrich and Austen (1986) and Meyer and Zucker (1989)
have linked firm size and age of the firm to Inertia Inertia is described as an insufficient
or sluggish adjustment to transformation or opposition to major variations in business
operations which in effect may cause the firm to miss profitable opportunities
Stinchcombe (1965) claims that firms that are older seem to be more experienced and
enjoy the benefits of improvement curve effect which makes them not to be exposed to
the problems of newness and hence enjoy above average performance
Penrose (1959) argues that larger firms are able to generate superior performance because
they have diversified capabilities ability to fully exploit economies of scale and scope
Such firms have formalized procedures of conducting business which ultimately makes
implementation of operations more effective On the contrary Leibenstein (1976) and
Shepherd (1986) argue that firm size is correlated with market power and along with
market power inefficiencies are created leading to inferior performance Thompson and
McHugh (2002) have critiqued the organization theory regarding it as being essentially
38
prescriptive There is an implied belief in underlying values or laws that govern
managersrsquo activities and functions
Another weakness of the organization theory cited by Salaman (1979) is the assumption
that all firms are in some way alike arguing that some firm analysts develop propositions
about firms in general lumping together such dissimilar examples as voluntary
establishments charities and political associations Salaman (1979) observes that it
hinders the analysis of those organizational elements which are radically exposed in
employing firms and not necessarily in all forms of organization Organizational theory
is related to this study because it explains the effect of firm size and age of the firm
(which are firm characteristics) on firm performance These are integral variables in this
study Since the theory cites conflicting views for instance bureaucracy in larger firms
which negatively affects performance on the one hand and economies of scale and
diversified capabilities in larger firms which positively affect firm performance on the
other hand it was expected that the relationship among the study variables would take
any direction Firm characteristics would moderate the relationship between FCF and
firm performance by statistically influencing the strength and or the direction of the
correlation between the predictor and explanatory variables
23 Free Cash Flows and Firm Financial Performance
Wang (2010) studied the impact of FCF on firm performance with empirical data from
Taiwan Stock Market for the period 2002 to 2007 Using a sample of 505 firms
regression analysis was employed in data analysis The study found that FCF had
39
statistically significant effects on firm performance These effects were however
conflicting On the one hand the presence of high FCF escalated imprudent expenditures
that consequently lowered firm performance The results indicated on the other hand that
FCF were generated due to managersrsquo efficiency in operations implying that a positive
correlation between FCF and firm performance
However in his definition of FCF Wang (2010) did not take into account CAPEX and
net borrowings which are critical in the FCF definition Additionally the study focused
on financial performance only The findings by Wang (2010) are partially consistent with
results by Gregory (2005) who studied the long run abnormal performance of UK
acquirers and the correlation between FCF and firm performance Gregory (2005)
established that mergers with greater FCF achieved better than those with lesser FCF
While testing the hypothesis the study used ldquolong term returnsrdquo and also ldquoanalyzed
announcement month returnrdquo However the study did not include daily returns around
announcement which could probably yield different results Furthermore the study
focused on financial performance outcomes only
Brush et al (2000) studied the proposition that sales growths in firms with FCF were less
lucrative than sales growths for firms with lower FCF Data was obtained from firms in
the USA covering eight years 1988 to 1995 and used Tobinrsquos Q to ascertain whether
firms had positive NPV projects available to determine FCF Returns to shareholders
were used as a performance measure The use of shareholder returns was criticized by
Bromiley (1990) because it assumes capital market efficiency which argues that the
returns to a large extent reveal surprises to the market Therefore if the markets expect
40
firmsrsquo sales growths and profitability even very profitable sales growths should not be
reflected in shareholder returns in the periods in which they arose The study found that
firms with higher FCF achieve lower from sales growth than those without or with lower
FCF Since sales growth is a measure of firm performance these findings support the
argument that FCF negatively affects firm performance
The findings by Wang (2010) and Gregory (2005) on the one hand and Brush et al
(2000) on the other hand reveal inconsistencies These contradictions indicate that the
correlation between FCF and firm performance is still unresolved In this study a more
robust measure of FCF was adopted For instance Wang (2010) measured FCF as net
operating income before depreciation minus tax expense minus interest expense minus
share dividends scaled by net sales In this study FCF are defined as in Brealey et al
(2005) as net income add amortization and depreciation minus CAPEX less change in
non-cash working-capital plus net borrowing The study is therefore expected to yield
more reliable and robust results
24 Free Cash Flows Agency Costs and Firm Financial Performance
Lin and Lin (2014) investigated the agency costs of FCF and biddersrsquo long-run takeover
performance in Australia using data for the period 1993 to 2000 The final sample
included 556 acquiring firms The study introduced two proxies of FCF excess
accounting cash flow and excess cash holdings and tested the relationship between
biddersrsquo long-run post-acquisition performance and the level of excess cash The findings
41
indicated that the level of excess cash holdings didnrsquot show a substantial reason for the
cross-sectional disparity in long-run post-acquisition performance
The findings from the flow measure of cash indicated that the acquisitions done by
bidders with surplus accounting cash flow didnrsquot escalate agency costs and therefore were
not value reducing Rather bidders with greater surplus accounting cash flows had better
long-run post-acquisition performance The findings therefore indicate that the
examination of FCF hypothesis in the Australian takeover market is conflicting to the
expectations of the FCF theory This finding is contrary to the argument that substantial
FCF increases agency costs which subsequently negatively impacts on firm performance
However Lin and Linrsquos (2014) definition of FCF ignores CAPEX and net borrowings
which are critical variables
Nekhili et al (2014) analyzed the intervening effect of agency costs of monitoring and
ownership structures in reducing earnings management practices when there is FCF The
sample comprised of 85 French listed firms for the period 2001 to 2010 The results
highlighted the unscrupulous managerial behavior in the presence of high FCF The study
measured FCF by multiplying the retained cash flows by the inverse of Tobinrsquos Q
However like in Lin and Lin (2014) CAPEX and net borrowings were omitted in the
definition of FCF The findings indicated that firms which had high FCF tended to
upwardly manage their earnings Additionally with the availability of high FCF the
tendency of firm managers to use discretionary accruals depended on the firm ownership
and the efficiency and effectiveness of governance mechanisms Precisely independence
42
of audit committees and external audit quality together with firm ownership structure (for
example institutional investors and executive ownership) reduced the extent of earnings
management when FCF were available
Conversely independent directorsrsquo ownership and board independence had no significant
effect on earnings management The results indicate that firm executives employ earnings
management practices that escalate reported earnings This implies that there are
increased agency costs emanating from the presence of high FCF subsequently
negatively affecting firm performance The negative effect of agency costs on the
correlation between FCF and firm performance is also supported by Brush et al (2000)
These results are of interest to this study because the research tried to find out the effect
of agency costs and firm characteristics on the correlation between FCF and performance
of NSE listed firms Agency costs are expected to mediate the correlation between FCF
and firm performance because they are the intermediate output of FCF
25 Free Cash Flows Firm Characteristics and Firm Financial Performance
Demsetz and Lehn (1985) studied the firm characteristics that included structure of
corporate ownership and firm size using 511 firms in the USA Size of the firm was
measured by the mean annual common stock market value and the study period was
1976 to 1980 Ordinary least squares (OLS) regression estimates were employed in data
analysis The findings suggest that in the presence of substantial FCF large firms tend to
overinvest thereby yielding relatively lower performance Large firms tended to have
fewer growth prospects than smaller firms and in the absence of good growth prospects
43
an overinvestment problem is likely to arise thereby negatively impacting on the firmrsquos
performance However the choice of a five-year study period seems too short Literature
indicates that 7 to 10 yearsrsquo study period is preferred (Brush et al 2000 and Nekhili et
al 2014)
In examining the degree of firm level over-investment of FCF Richardson (2006) used
an accounting-based structure to measure over-investment and FCF and confirmed that
over-investment was dominant in firms with the greatest FCF levels The study was
carried out in the USA and used a sample of 58053 firms for the period 1988 to 2002
The study also examined whether there was any association between firmsrsquo governance
structures and FCF over-investment The empirical analysis employed two steps In the
first step the study used an accounting-based structure in measuring both over-
investment and FCF The study defined FCF as cash flow over and above what was
needed to sustain assets in place and to fund new investment projects On the other hand
over-investment was described as investment expenditure over and above that needed to
retain assets in place and to fund probable new investments In measuring over-
investment the study decomposed total investment outlay into two component parts
First it needed investment spending to sustain assets in place and secondly investment
spending in new projects
In the next step the study decomposed investment expenditure into expected investment
outlay and over-investment in negative NPV projects where the latter varied with the
firmrsquos growth prospects industry affiliation funding constraints and other aspects
44
Although the study incorporated the firm characteristics of size liquidity and growth
prospects it focused on financial performance measures only Furthermore the study
excluded age of the firm Results suggest that some governance mechanisms like the
existence of shareholders who are activists seem to lessen over-investment Additionally
firm performance in the presence of FCF was found to be lower in firms with higher
liquidity than those with lower liquidity The findings are consistent with Harford (2002)
who found that cash-rich firms were more probable to undertake acquisitions that
consequently suffer abnormal failures in operational performance
Brouwer et al (2005) investigated whether age of the firm accounted for productivity
differences Data was obtained for the period 1994 to 1999 and the focus was on Dutch
firms Although the dataset included firms from all age cohorts (0-4 years and 5-9 years)
the study focused more on firms of at least 10 years of age Using regression methods the
results showed very few signs of a relationship between productivity (performance) and
age Both growth rate and level of productivity varied between sectors and also differed
with size of the firm There was also no indication that productivity growth rate was
related to the age of the firm On productivity level there were very few signs of the
effects of age The Brouwer et al (2005) study did not fully exploit the panel structure of
the dataset that was available The explicit techniques of estimation that take account of
this structure such as multilevel or panel data estimation techniques are expected to be
more effective
45
Conversely Power (1998) found a negative relationship between the growth rate of
productivity and age at a certain phase in the firmsrsquo lifespan Power (1998) examined the
relationship between plant age and productivity for firms in the manufacturing industry of
the USA for the period 1972 to 1988 The study found that productivity growth rates
decline with age which was credited to the effects of learning Firm characteristics are
expected to moderate the correlation between FCF and performance because their effect
is statistically characterized as an interaction affecting the strength and or direction of
the correlation between FCF and firm performance (Baron amp Kenny 1986)
26 Free Cash Flows Agency Costs Firm Characteristics and Firm Financial
Performance
Investigating the agency costs of FCF corporate finance and takeovers Jensen (1986)
sampled top 200 firms in the oil industry in the USA and found a link between the agency
problem with FCF firm characteristics and firm performance Using regression methods
results suggest that firm managers might misappropriate FCF at their disposal when the
firm does not readily have viable investment opportunities and that agency costs are high
when FCF are combined with poor growth prospects Results also indicate that more debt
would increase efficiency by compelling firms with large FCF but few high-return
investment projects to pay back cash to the creditors Leverage helps in preventing such
firms from misappropriating resources on low-return projects
For industries that are declining within the industry mergers would generate value while
outside industry mergers would likely generate lesser value or negative-returns Mergers
46
within the food industry seemed to reflect the spending of FCF The industry seemingly
generated large cash flows with few growth prospects The findings however seem to be
contradicting because they also indicate that increased leverage escalates agency costs
As leverage increases the typical agency costs of debt rise which include bankruptcy
costs that subsequently negatively affects firm performance
Mojtahedzadeh and Nahavandi (2009) investigated the relationship between agency
problems that arise due to FCF with long term profitability and income management
Using Tobinrsquos Q to measure long term profitability and Adjusted Jones Model to estimate
Discretionary Accruals (DA) panel analysis was used to analyze the data Results from
testing 106 firms listed on Tehran Stock Exchange throughout the years 2003 to 2007
reflect that agency costs emanating from the availability of substantial FCF negatively
affect both long term and short term profitability However the five-year period of study
seems too short and also non-financial performance outcomes were ignored in the study
Similarly Nunes Serrasqueiro and Sequeira (2009) investigated 75 Portuguese service
oriented firms to establish the effect of firm size on profitability (performance) They
introduced control variables of growth prospects leverage liquidity and asset structure
(tangibility)
The study used both dynamic estimators and static panel models Results indicated a
positive statistically significant correlation between firm size and performance They
also found a positive effect of growth prospects and liquidity on profitability but a
negative effect on leverage and asset tangibility on profitability as measured by ROA
47
Results also indicated that substantial FCF negatively affected profitability of the firm
The data employed was for the period 1999 to 2003 a duration which seems too short A
longer study period of seven to ten years would probably yield different results
Milne Purda and Anand (2008) used 1200 Canadian firms for the period 1999 to 2003 to
test the hypothesis that independent boards are more prone than non-independent boards
to willingly embrace mechanisms intended to improve their ability to monitor firm
management The study examined seven mechanisms both in aggregate and individually
through construction of an index that allocated one point for each mechanism embraced
up to a maximum of seven points and conducted multivariate regression analyses in
which the explanatory variable was either the full or the reduced index
Results indicate that the board of directors vigorously monitors decision makers who
have an inclination towards diverting firm resources to their own personal interests as a
consequence of the agency problem and FCF hypothesis thereby negatively impacting on
firm performance The findings also offer evidence that a relatively large number of
acclaimed monitoring mechanisms have been embraced by firms and that the acceptance
rate increases for firms with both independent and executive boards However the Milne
et al (2008) study didnrsquot integrate alterative views for the board of directors such as
influencing management decisions using the advisory role The study also ignored
procedures other than board monitoring that may serve to lessen agency costs
48
Locally Wambua (2013) examined the effects of agency costs on performance of NSE
listed firms The study used regression analysis and results indicated a positive
correlation between FCF and firm performance Furthermore the study found that
liquidity firm size and ownership concentration positively influenced performance of the
listed firms However the study did not incorporate firm age Conflicting results were
found by Njuguna and Moronge (2013) who studied the influence of managerial behavior
of agency costs on performance of firms listed at the NSE Using descriptive research
methodology results indicated that information asymmetry is a source of agency costs
and that agency problems are usually related to FCF In operationalizing the agency costs
however Njuguna and Moronge (2013) used total asset turnover as the only measure of
agency costs and also focused on financial outcomes only
To fill these knowledge gaps this study used two measures to fully integrate agency
costs The two agency cost measures used in this study are operating expenses to sales
ratio and sales to assets ratio These two measures are better measures of agency costs
because they tend to incorporate managerial asset utilization efficiency and production
cost efficiency (Singh amp Davidson 2003 McKnight amp Weir 2008 and Fauver amp
Naranjo 2010)
27 Summary of Knowledge Gaps
Empirical literature shows mixed findings regarding FCF agency costs firm
characteristics and firm performance For instance Jensen (1986) found a negative
correlation between FCF and firm performance results suggesting that management
49
might abuse FCF at their disposal Similar findings are recorded by Brush et al (2000)
Mojtahedzadeh and Nahavandi (2009) Wang (2010) Wambua (2013) Njuguna and
Moronge (2013) and Nekhili et al (2014)
Gregory (2005) on the other hand established that mergers that had a greater degree of
FCF performed better than those with lower FCF Similarly Szewcyzk et al (1996) and
Chang et al (2007) find that investors favored firms with both profitable investment
opportunities and significant FCF Likewise Lin and Lin (2014) established that the
acquisitions made by bidders with surplus FCF were not value decreasing Instead
bidders with higher excess FCF had better long-run post-acquisition performance
This research attempted to fill the following knowledge gaps first the influences of
agency costs and firm characteristics (firm size and age of the firm) on the correlation
between FCF and financial performance of the firm were all integrated Secondly FCF
were measured more robustly by incorporating CAPEX and net borrowings Thirdly
unlike in prior studies such as Wang (2010) and Njuguna and Moronge (2013) which
only focused on asset utilization efficiency to measure agency costs this study employed
two different measures for agency costs First is the asset utilization efficiency and
second is the production cost efficiency The two measures are better because they tend
to fully integrate agency costs Lastly the study used cross-sectional panel data design
The study therefore sought to affirm modify or reject existing empirical literature by
bridging the gaps identified in prior studies
50
Table 21 Summary of Knowledge Gaps
Researcher(s) Focus of Study Methodology Findings Knowledge Gaps How this Study
Addressed Gaps
Demsetz and
Lehn (1985)
Structure of corporate
ownership Causes and
consequences
The study
employed OLS
regression
estimates with
sample of 511
firms in the USA
In the presence of
substantial FCF
large firms tend to
overinvest thereby
negatively
impacting on firm
performance
The study
considered a five-
year period which
seems too short and
the focus did not
include FCF and
agency costs
This study employed
a ten year period
focused on FCF
agency costs firm
characteristics and
performance of firms
listed at the NSE
Jensen (1986) FCF agency costs
corporate finance and
takeovers
The study used
regression analysis
on 200 firms in the
oil industry in the
USA
Managers might
misuse FCF at their
disposal when
investment
opportunities are
not available
The study did not
incorporate firm
characteristics
This study included
firm characteristics
(age and size)
Szewcyzk et
al (1996)
The role of investment
opportunities and FCF in
explaining RampD induced
abnormal returns in the
Used regression
analysis and
measured
performance using
Shareholders
favored firms that
had both high FCF
and profitable
Focus variables
omitted agency
costs
The variables for this
study are FCF
agency costs firm
characteristics and
51
Researcher(s) Focus of Study Methodology Findings Knowledge Gaps How this Study
Addressed Gaps
USA firms Tobinrsquos Q investment
opportunities
firm performance
Gul and Tsui
(1998)
Tested the hypothesis
that FCF and director
stock ownership
interaction was less
likely to occur for firms
with high levels of
leverage
Studied 157 low
growth Australian
firms and used
OLS regression
analyses
Results suggested
that an increase in
financial leverage
seemed to reduce
agency costs
The study ignored
the influence of
liquidity and also
focused on low
growth firms only
This study focused on
firm characteristics of
firm size and age of
the firm
Brush et al
(2000)
FCF hypothesis for sales
growth and firm
performance The study
was conducted in the
USA
Study used
regression analysis
with performance
measured using
Tobinrsquos Q and
shareholder return
Firms with high
FCF perform
poorly and also
weak CG caused
inefficiency in the
allocation of FCF
CAPEX and Net
borrowings were
omitted in FCF
definition
This study included
CAPEX and net
borrowings to
measure FCF
Gregory
(2005)
Long run abnormal
performance of UK
acquirers and the
correlation between FCF
and firm performance
Used long term
returns and
analyzed
announcement
month return
Mergers with
greater FCF
performed better
than firms with
lower FCF
The study did not
incorporate firm
characteristics and
agency costs
The study
incorporated agency
costs and firm
characteristics (age
and size)
52
Researcher(s) Focus of Study Methodology Findings Knowledge Gaps How this Study
Addressed Gaps
Richardson
(2006)
Firm level over-
investment of FCF for
firms in the USA
Used an
accounting-based
structure to
measure over-
investment and
FCF
Found that over-
investment was
intense in firms
with the greatest
FCF levels
The study did not
incorporate firm
characteristics
This study included
firm characteristics
(age and size)
Mojtahedzadeh
and Nahavandi
(2009)
The relationship between
agency problems that rise
due to FCF with long
term profitability and
income management
The study was on firms
listed on the Tehran stock
exchange Iran
Used 106 firms for
the period 2003 to
2007 used Tobinrsquos
Q to measure long-
term profitability
DA was estimated
using the Adjusted
Jones Model
The study found
that agency
problems of FCF
result in short term
and eventually long
term profitability
The study focused
on FCF agency
costs and
profitability and
income and the
study period was
five years
This study focused on
FCF agency costs
firm characteristics
and the performance
of firms quoted at the
NSE Study period
was ten years
Nunes et al
(2009)
Profitability in
Portuguese service
industries
Used both static
panel models and
dynamic
estimators
Found a positive
correlation between
firm characteristics
and performance
and that FCF result
in profitability
The study used data
for four years only
(1999 to 2003)
which seems too
short
This study employed
data for ten years
(2006 to 2015)
53
Researcher(s) Focus of Study Methodology Findings Knowledge Gaps How this Study
Addressed Gaps
Wang (2010) The effect of FCF and
agency costs on firm
performance (firms listed
at the Taiwan stock
market)
Used descriptive
statistics
correlations and
regression analysis
Found no evidence
supporting a
negative correlation
between FCF and
firm performance
CAPEX and Net
borrowing were
omitted in FCF
definition
This study included
CAPEX and net
borrowings in
measuring FCF
Waithaka et al
(2012)
Effects of dividend
policy on share prices of
NSE listed firms Kenya
Used the case
method and
regression analysis
Found that FCF
instigated conflict
between managers
and shareholders
which consequently
affected the firm
performance
The study focused
on dividend policy
and stock
performance
This study focused on
FCF agency costs
firm characteristics
and firm
performance
Njuguna and
Moronge
(2013)
Effect of managerial
behavior of agency costs
on performance of firms
listed at the NSE Kenya
Used descriptive
research and used
asset turnover ratio
to measure agency
costs
Found that FCF
were negatively
related to firm
performance and
information
asymmetry causes
agency problem
The study used only
one proxy measure
of agency costs -
total asset turnover
ratio
This study employed
total assets turnover
and operating
expenses sales
54
Researcher(s) Focus of Study Methodology Findings Knowledge Gaps How this Study
Addressed Gaps
Wambua
(2013)
Effects of agency costs
on performance of firms
listed at the NSE
Regression
analysis was
employed in data
analysis
Got a positive
correlation between
FCF and firm
performance
The study did not
incorporate firm
characteristics
This study included
firm characteristics
(age and size)
Lin and Lin
(2014)
Agency costs of FCF and
biddersrsquo long-run
takeover performance of
Australian firms
Used regression
analysis on 556
firms for the
period 1993 to
2000
Found a positive
correlation between
FCF and firm
performance
CAPEX and Net
borrowing were
omitted in FCF
definition
This study included
CAPEX and net
borrowings in
measuring FCF
Nekhili et al
(2014)
Moderating effect of CG
and ownership in
lessening earnings
management practices
when there is high FCF
The study was conducted
in France
Developed
simultaneous
equations to
address
endogeneity of
FCF and then
employed
Hausman test
They found
opportunistic
behavior of
managers in
presence of FCF
Used firm
characteristics of CG
and ownership as
moderating variable
This study used firm
characteristics of size
and age of the firm as
moderating variable
Source Researcher (2018)
55
28 Conceptual Framework
Figure 21 below shows graphically the researcherrsquos conceptualization of the study
Figure 21 Conceptual Model
Independent Variable Dependent Variable
H01
Intervening Variable
H02
H04
H03
Moderating Variable
Source Researcher (2018)
Free Cash Flows
FCFit = (Net income
(PAT) + depreciation and
amortization - CAPEX -
change in non-cash
working capital + net
borrowing)Sales
Financial Performance
Tobinrsquos Q
Agency Costs
- Asset utilization efficiency ACit
- Production cost efficiency
Firm Characteristics
- Firm Size
- Age of the firm
56
FCF is the independent variable whereas the dependent variable is financial
performance As shown in figure 21 above H01 indicates the effect of FCF on financial
performance Agency costs are the intervening variable and they comprise of asset
utilization efficiency and production cost efficiency In figure 21 above H02 designates
the intervening influence of agency costs on the correlation between FCF and financial
performance In similar manner H03 depicts the moderating influence of firm
characteristics on the correlation between FCF and financial performance Firm
characteristics in the study are firm size and age of the firm Lastly H04 shows the joint
effect of FCF agency costs and firm characteristics on financial performance
29 Chapter Summary
This chapter reviewed theoretical foundation on which the study is grounded The
theories highlighted are The FCF hypothesis agency theory stewardship theory
stakeholder theory RBV theory and the organizational theory Empirical studies were
also examined specifically reviewing the correlation between FCF and financial
performance the intervening role of agency costs on the correlation between FCF and
financial performance the moderating role of firm characteristics on the correlation
between FCF and financial performance and finally the joint effect of FCF agency costs
and firm characteristics on financial performance Findings are mixed with some studies
indicating negative relationships while others showing positive relationships A summary
of knowledge gaps has also been underscored The chapter presented and explained the
conceptual model that guided the study and how it was conceptualized by the researcher
57
CHAPTER THREE RESEARCH METHODOLOGY
31 Introduction
This chapter deliberates on the research methodology used It presents the philosophy
research design study population how data was collected reliability and validity The
operationalization of study variables the techniques of data analysis applied and
summary of the research objectives Their corresponding hypotheses and analytical
models have also been highlighted
32 Research Philosophy
Research is defined by Proctor (1998) as a process to find out the unknown A critical
phase in doing social science research is to decide and validate the preferred research
philosophy embraced by the researcher Inter-related paradigmatic conventions
concerning the nature of reality the researcherrsquos role and the research process initiate
scientific research Research philosophy is the primary essential credence that supports
the options that need to be selected in taking a position in research Philosophy has
consequences on what how and why research is to be conducted (Carson Gilmore Perry
amp Gronhaug 2001)
Research philosophy has broad paradigms There are interpretative and the positivistic
paradigms Perry Reige and Brown (1999) explain the relationships among the
techniques that the researcher employs the researcher and the reality and truth that they
seek The two philosophical traditions that guide research in social science are positivism
58
and phenomenology (Saunders et al 2007) The roots of positivism tradition are
grounded in empiricism (Kerlinger 2002) Positivism is an ontology which makes an
assumption that a person has a straight access to the actual world and it is likely to get
independent information regarding the particular external reality
Interpretivism or Phenomenology is an ontology which makes an assumption that a
person does not have direct access to the real world and the knowledge heshe has
regarding this apparent realm is important in its own terms Within the phenomenological
ontology epistemology is founded on belief or assumption that the person conducting the
research is part of the reality and therefore not objective value-free or independent
Research emphasis is to understand what happens in a particular situation and it
contemplates several realities and diverse perceptions of the researcher (Carson et al
2001)
In this study the two philosophical traditions were examined and positivism was
considered the more appropriate tradition for the study because the study is centered on
prevailing theory and it develops hypotheses that can be verified Positivism made it
possible to make definite statements about the influence of agency costs and firm
characteristics on the correlation between FCF and firm performance grounded on
unbiased assessment and deductive reasoning The study utilized statistical data analysis
techniques and the researcher was objective and independent because individual feelings
were not introduced
59
33 Research Design
Research design involves decisions on where what when how farmuch and through
which means regarding a phenomenon It is the outline employed to direct a research
study to make certain that the research addresses the study problem (Gorard 2013) After
considering various research designs described by research experts such as Cooper and
Schindler (2006) Mugenda and Mugenda (1999) and Muganda (2010) as well as the
purpose of the study the philosophical tradition adopted the topical scope researcher
involvement time period over which the data was collected the nature of the data and
type of data analysis the study design embraced was cross sectional descriptive design
Mojtahedzadeh and Nahavandi (2009) successfully used the cross-sectional research
design in their study of the relationship between agency problems that arise due to FCF
with long term profitability and income management Mwangi (2014) also successfully
employed this study design in determining the influence of membersrsquo income and
conduct of Savings and Credit Cooperatives (SACCOs) in the correlation between
efficiency and characteristics of SACCOS in Kenya The cross-sectional descriptive
design was considered appropriate because of its versatility and leverage in collection of
data from a large number of respondents within a fairly short time period
34 Population of the Study
The target population comprised of the entire 63 firms listed at the NSE (Appendix I) as
at December 31 2015 This was a census study which involved obtaining information
from every member of the population A census of all the NSE listed firms was employed
60
because the number of listed firms at the NSE is relatively small and therefore the study
could easily be carried out
35 Data Collection
Secondary data was collected from published financial statements obtained from the
NSE Time series panel data was collected covering a 10 - year period from 2006 and to
2015 A ten-year period is deemed large enough to yield reliable findings A similar
period was adopted by Gregory and Wang (2010) and Nekhili et al (2014) Appendix II
shows the data collection form
36 Reliability and Validity
The main indicators of the value of a data collection instrument are reliability and validity
of the measures Reliability is among the most essential components of test quality and it
entails consistency or reproducibility or the examineersquos test performance Therefore
reliability is the degree with which research instruments yield consistent results after
repeated trials Reliability of a measure has two parts its stability over time and the
consistency of the instrument in measuring the concept Several methods of computing
test reliability exist and they include decision consistency parallel forms reliability test-
retest reliability inter-rater reliability and internal consistency Decision consistency is
often an appropriate choice for many criterion-referenced tests (Kimberlin amp Winterstein
2008)
61
Validity is the degree with which theory and evidence corroborate interpretations of test
scores occasioned by suggested uses of tests It denotes whether or not the test is
measuring what it anticipated to measure It is perhaps the most essential criteria for the
quality of a test There are several types of validity and these consist of construct validity
criterion-related validity and content validity Construct validity refers to the extent to
that an instrument measures the attribute or hypothetical concept that it was proposed to
measure while content validity is the degree with which the content of the objects reveals
the content purview of interest Lastly criterion-related validity is evaluated when an
individual wants to establish the correlation of scores on a test to a specified benchmark
(AERAAPANCME 2000 and Penfield amp Miller 2004)
361 Reliability Test
Stability was assessed by use of test retest reliability while internal consistency was
assessed using inter-item consistency reliability In testing for reliability Cronbach alpha
was calculated The Cronbachrsquos alpha coefficient was applied in measuring internal
consistency of the measurement scales It is a scale measurement tool that is frequently
used in social sciences for determining internal consistency of factors or items among and
within variables of the study Nunnally (1967) and Oppenheim (1992) argue that alpha
coefficient value of 0700 and above is tolerable
The Cronbachrsquos alpha coefficient was employed because it is suitable for multi-scaled
items The Cronbachrsquos alpha is a broad formula of the Kunder-Richardson (K-R) 20
formula as shown
62
(K) (S2-Σs
2)
KR20 =
(S2) (K-1)
KR20 = Reliability coefficient of internal consistency
S2 = Variance of all scores
K= Number of items employed to measure the model
s2 = Variance of individual items
This study also employed secondary data Kimberlin and Winterstein (2008) argue that
the foremost concern when deciding if secondary data should be used is to confirm that
the data set suitably measures the variables that are required to answer the study
questions Secondary data was collected from audited financial statements of all NSE
listed firms This data is deemed reliable because financial reporting is guided by
International Financial Reporting Standards (IFRS) Furthermore the companies Act
(CAP 486) of the laws of Kenya require that every limited liability firm conducts a
statutory audit at least once annually Such audits are guided by International Auditing
Standards (IAS)
362 Validity Test
Validation of the instrument was accomplished in several ways Pre-test was done by
administering the instrument to eight middle level managers to complete The eight
managers were conveniently selected to review the statement items for clarity meaning
63
and relevance Based on their response the data collection instrument was appropriately
modified Validity shows whether the instrument is testing what it should be testing
Content validity was achieved by establishing whether the items in the data collection
instrument are well balanced in content domain and link up well with theoretical
assumptions centered on the study objectives which involved checking of the content to
establish if it contained representative sample of the objects being measured Criterion-
related validity was established by administering test-retest or stability test on the data
contents in the data collection instrument Construct validity was established by ensuring
that the study variables were properly operationalized This was achieved through
constant consultations and reviews by research experts from the University of Nairobirsquos
School of Business Validity can be measured by use of expert judgment and informed
opinion (Kerlinger 2002)
37 Operationalization of the Study Variables
This study has four variables of interest independent variable dependent variable
intervening variable and a moderating variable Table 33 shows the research variables
and their respective metricsindicators Theoretical and empirical research in the area of
study has guided the choice of the variables
64
Table 31 Operationalization of Study Variables
Variable
Indicator Measure Support from
Literature
Form Section
Independent Variable
Free Cash Flows
Net income (PAT) add
depreciation and
amortization minus CAPEX
minus change in non-cash
working capital add net
borrowing
Net income (PAT) add
depreciation and amortization
minus CAPEX minus change
in non-cash working capital
plus net borrowingNet
Sales
Brealey et al
(2005) and
Nekhili et al
(2014)
Part A of Data
Collection Form
Dependent variable(s) - Firm Performance
Financial
Performance
Tobinrsquos Q Equity market valueEquity
book value
Szewczyk et al
(1996) and
Mojtahedzadeh
and Nahavandi
(2009)
Part B of Data
Collection Form
Intervening Variable(s)
(a) Asset utilization
efficiency = Net sales
to total Assets ratio
(a + b)2 = AC
Tirole (1986)
Part C of Data
Collection Form
65
Variable
Indicator Measure Support from
Literature
Form Section
Agency Costs
(b) Production cost
efficiency = Operating
expenses to net sales
ratio
Tirole (1986)
Singh and
Davidson (2003)
Moderating variable(s)
Firm
Characteristics
Firm Size Natural log of total assets Demsetz and Lehn
(1985)
Part D of Data
Collection Form
Firm Age
n log (number of years since
incorporation)
Ferris and Yan
(2009)
Source Researcher (2018)
66
Non-cash working capital includes inventories financial assets held to maturity
receivables and prepayments (current assets) and payables accrued expenses current
income tax liability (liabilities) For financial and investment firms non-cash working
capital includes prepaid lease rentals intangible assets deferred tax assets and retirement
benefit assets (assets) and taxation payable dividends payable deferred tax liabilities
and retirement benefit liabilities
Net sales in case of insurance firms are the equivalent of ldquoNet premium revenuerdquo For
commercial banks it is ldquoTotal operating incomerdquo which is composed of net interest
income add total non-interest income In case of investment firms it is ldquoIncomerdquo which
is comprised of rental income dividends and interest received and other incomes
38 Data Analysis
Data was analyzed using inferential statistics generated from statistical software using
95 confidence interval as in Aiken and West (1991) Descriptive statistics and
inferential statistics were both employed in data analysis Measures of dispersion and
measures of central tendency were used in profiling the respondent firms
Linear regression analyses were used in establishing the magnitude and nature of the
relationship between the study variables and in testing the relationships hypothesized
This study employed panel data regression analysis using the OLS technique where data
consist of cross-sectional and time series data which was combined into a panel data set
67
and projected with the use of panel data regression Regression analysis is a statistical
tool for examination of relations between variables
The value of the coefficient of determination (R2) indicates the extent of variation in the
dependent (explanatory) variable explained by the independent (predictor) variable Beta
values indicate the extent of variation in the explanatory variable that is attributed to the
extent of variation in the independent variable F ratio measures the model fit or simply
how sound the equation line established fits the data observed Interpretation of statistical
significance of each relationship hypothesized was based on β R2 t F and P ndash values
The study hypotheses were measured using two sets of regression equations The
regression analysis was done using STATA software
39 Choice of Panel Data Analysis Model
Panel data analysis can be categorized into several categories First are the pooled panels
which assume that there exist no distinctive qualities of characters in the dimension set
and there are no common effects across time Second are the fixed effects models which
assume existence of unique qualities of characters which are not the effects of random
variations and which donrsquot differ across time They assume changes in intercepts across
sets or time periods Lastly we have random effects models which have the assumption
that there are distinctive time constant qualities of characters which are the effects of
random variations and do not associate with the characters that are the effects of random
variation They donrsquot relate with the specific regressors The random effect models are
suitable if we want to draw conclusions about the entire population
68
The selection of a suitable model is contingent on the aim of investigation and
complications regarding the exogenity of dependent variables The fixed effects model
and the random effects model were not considered The pooled regression model was
suitable because of its assumption that all the organizations are similar The Pooled
regression model also has an assumption that the coefficients including the intercepts
are identical for all study items (firms) The fixed and random effect models provide for
individuality or heterogeneity among the organizations by letting each organization to
have own intercept that is time invariant
391 Effect of Free Cash Flows on Financial Performance
In establishing the effect of FCF on firm performance FCF is the predictor variable while
financial performance is the explanatory variable In the specification the standard errors
are clustered by firm and year Equation 31 entails panel data for 2006 to 2015
The regression model for hypothesis 1 is as follows
Ǭit = ά + βFCFit + euro -------------------------------------------------------------------------- (31)
Where Ǭ = Financial performance and it indicates the firm i at time t Financial
performance was measured using Tobinrsquos Q ά = Constant term β = Beta Coefficient
FCFit= Free cash flows for firm i at time t where t is the year 2006 to 2015
392 Free Cash Flows Agency Costs and Financial Performance
In analyzing hypothesis 2 the relevant variables are FCF (independent variable) agency
costs (intervening variable) and financial performance (dependent variable) Intervening
effects were examined using hierarchical (stepwise) multiple regression analysis As in
69
Baron and Kenny (1986) the fundamental concept of mediating variables is that in some
way they intervene in the process of transformation between response and stimuli Some
essential features of a mediating variable include the fact that the independent variable
shall affect the mediator variable (path a) the mediator shall affect the dependent
variable (path b) independent variable shall affect the dependent variable (path c) and
that once paths a and b are controlled path c becomes inconsequential or trivial The
mediation path is shown in figure 31 below
Figure 31 Path Diagram for Mediation effect of Agency Costs
c
lsquoa b
Agency costs
Source Researcher (2018)
Mediation was tested through the following three steps Step one entailed the dependent
variable Ǭ (financial performance) being regressed on the independent variable FCF
(Free cash flows) In step two the mediator AC (agency costs) was regressed on the
independent variable FCF In step three Ǭ is regressed on AC and FCF In each step the
120689 coefficient was tested to establish the size and direction of the correlation If a zero
order relationship exists and is significant then proceed to the next step Mediation exists
if FCF coefficient is significant in step 2 and also when the FCF coefficient is
significantly less in step 3 than in step 1
Free cash flows Financial performance
70
In testing intervention between FCF and financial performance the regression model is as
follows
Ǭit = ά + β1FCFit + euroit ------------------------------------------------------------------------ (32a)
AC it = ά + β1FCFit + euroit --------------------------------------------------------------------- (32b)
Ǭit = ά + β1AC it + β2FCF it + euroit ------------------------------------------------------------ (32c)
while controlling the effect of M on Y
Where ACit is the sum of Production cost efficiency (PCEit) and Asset utilization
efficiency (AUEit) divided by 2 (average) for the period 2006 to 2015
393 Free Cash Flows Firm Characteristics and Financial Performance
In testing hypothesis 3 the relevant variables are FCF firm characteristics (moderating
variable) and financial performance The regression models are as follows
Ǭit = ά + β1FCFit + β2AGEit + β3 (AGEit FCFit) + euro---------------------------------- (33a)
Ǭit = ά + β1FCFit + β2SIZit + β3 (SIZit FCFit) + euro------------------------------------- (33b)
Where SIZit = Firm size AGEit = Age of the firm
Equations 33a and 33b represent moderation models For purposes of avoiding possible
high multicollinearity the variables were centered and an interaction term added If the
predictor variable (FCF) and moderator variable (firm characteristics) are not significant
with the interaction term then complete moderation has happened Otherwise if the
independent and moderator variables are significant with the interaction term then
71
moderation has happened but the main effects are also significant (Aiken amp West 1991
and Mackinnon et al 2002)
In equations 33a and 33b above the variables associated with coefficient 1206893 were added
in the model to measure the effect of moderation The effect of moderation variables
firm size and age is characterized statistically as an interaction that affects the strength
and or direction of the correlation between explanatory variable (firm performance) and
the predictor variables (Baron amp Kenny 1986) The term in the model does not imply
multiplication but rather it denotes moderation
394 Relating all the Variables
Hypothesis 4 entails testing all the variables in the conceptual framework In testing for
the effect on financial performance panel data model was applied in measuring the
strength of the relations between the independent moderating intervening and dependent
variables To measure the joint effect of the moderating intervening and independent
variables intercept (constant) was used to determine the nature and extent of effect of all
the variables Additionally R2 was employed in determining the joint effect of the
moderating intervening and independent variables on the dependent variable (financial
performance) The resultant model is as follows
Ǭit = ά + β1FCFit + β2AC it + β3SIZit + β4AGEit + euro----------------------------------------- (34)
Where
72
34 represents the model for the effect on financial performance which utilized secondary
panel data for the period 2006 to 2015 and Ǭit represents financial performance
Table 32 A Summary of Statistical Tests of Hypotheses
Objective Hypothesis Analytical Model Interpretation
i To establish
the relationship
between FCF
and financial
performance of
firms listed at
the NSE
H01 FCF have no
significant effect on
financial performance of
firms listed at the NSE
ANOVA
regression
model
Panel data
regression
model
Test of
assumption
(normality and
multi-
collinearity)
Relationship exists if β is
significant
Relationship will be
determined based on R2
ii To assess the
influence of
agency costs on
the relationship
between FCF
and financial
performance of
firms listed at
the NSE
H02 Agency costs have
no significant
intervening effect on the
relationship between
FCF and financial
performance of firms
listed at the NSE
ANOVA
regression
model
Panel data
regression
model
Test of
assumption
(normality and
multi-
collinearity)
Mediation exists if FCF
coefficient is significant in
step 2 and also when in
step 3 the FCF coefficient
is significantly less than in
step 1
Regression co-efficient and
R2 will be used to affirm the
effect of agency cost on the
relationship between free
cash flow and firm
performance
iiiTo determine
the influence of
firm
characteristics
on the
H03a Firm age has no
significant moderating
effect on the relationship
between FCF and
financial performance of
ANOVA
regression
model
Panel data
regression
Moderation exists when the
interaction term between
firm characteristics and
FCF is a significant (p lt
005) predictor of firm
73
Objective Hypothesis Analytical Model Interpretation
relationship
between FCF
and financial
performance of
firms listed at
the NSE
firms listed at the NSE
H03b Firm size has no
significant moderating
effect on the relationship
between FCF and
financial performance of
firms listed at the NSE
model
Test of
assumption
(normality and
multi-
collinearity)
performance Furthermore
when FCF remains a
significant predictor while
firm characteristics become
insignificant
The intercept of the
regression model will
be used to tests the
influence of firm
characteristics on the
relationship between
free cash flow and firm
performance
Regression co-efficient and
R2 will be used to affirm the
effect of firm characteristics
on the relationship between
FCF and firm performance
iv To establish
the joint effect
of FCF agency
costs and firm
characteristics
on financial
performance of
firms listed at
the NSE
H04 There is no joint
effect of FCF agency
costs and firm
characteristics on
financial performance of
firms listed at the NSE
ANOVA
regression
model
Panel data
regression
model
Test of
assumption
(normality and
multi-
collinearity)
The intercept of the
regression model will be
used to tests the joint effect
of FCF agency costs and
firm characteristics on firm
performance
R2 will be used to get the
joint effect of independent
variables on Firm
Performance
74
310 Chapter Summary
The chapter discussed the study methodology employed and has highlighted the research
philosophy adopted clearly indicating that the study was anchored on the positivist
orientation since it is founded on existing theory and it articulates hypotheses which can
be verified Furthermore the positivist approach made it possible to make categorical
statements
The research design used has also been discussed The research design adopted was
cross sectional descriptive survey The population of the study has been highlighted as a
census of all firms listed at the NSE The chapter has also explained the data collection
methodology Reliability and validity considerations have been discussed
Operationalization of research variables has been deliberated showing a summary table
of the four variables of study indicators how the variables were measured support from
literature and the relevant section of the data collection form Data analysis has been
explained being regression methods using inferential statistics The chapter also
presented a tabulated summary of the research objectives their corresponding hypotheses
and analytical models
75
CHAPTER FOUR DATA ANALYSIS AND FINDINGS
41 Introduction
The study sought to establish the relationships between free cash flows agency costs
firm characteristics and performance of firms listed at the NSE Secondary data were
collected to test the relationships between the study variables This chapter presents an
analysis of the results More specifically the chapter has focused on descriptive statistics
reliability tests validity tests and correlation analysis
42 Pre-estimation Diagnostics
The study used OLS to estimate regression models The use of OLS is based on
normality linearity sampling adequacy and internal consistency of variables used in the
regression model Therefore normality linearity internal consistency and sampling
adequacy of these variables were required for the application of OLS This section
presents the test statistics to verify satisfaction of these assumptions by the data collected
and analyzed
421 Normality test
The Shapiro Wilk test for normality was conducted to test if the variables were normally
distributed The null hypothesis was that the data did not come from a population that
was normally distributed Therefore the alternate hypothesis is that the data originated
from a normally distributed population The test statistics for normality of each variable
are shown in table 41 below
76
Table 41 Normality Test
Variable Test Statistic
Z statistic P value
Free cash flows 1687 0082
Agency costs (AC) 1501 0160
Firm Age 0832 0129
Firm Size 1004 0076
Table 41 above shows that the p-values for all the variables were greater than 005 and
therefore we failed to reject the null hypothesis that the variables were normally
distributed at five per cent level of significance Therefore OLS could be applied on the
data considering that the data met the assumed conditions for application of multiple
regression analysis Field (2013) recommends use of a visual inspection of histograms or
Quantile ndash Quantile (Q-Q) plots to supplement use of tables and numbers These plots are
presented below
77
Figure 41 Q-Q Plot for Free cash Flows (2006 ndash 2015)
The results of the Q-Q plot in figure 41 above exhibits normality because most of the
observations seem to be in a straight line with a few cases appearing to be far away from
the line
Figure 42 Q-Q Plot for Agency Costs (AC) ndash 2006 to 2015
Figure 42 Q-Q plot above for agency costs (AC) reveals normality because the majority
of the observations seem to be along the straight line Outliers were investigated and
78
corrected or eliminated where necessary Large data sets can be analysed even if some
variables do not meet normality assumptions (Tabachnick amp Fiddel 2013)
Figure 43 Q-Q Plot for Firm Characteristics (Firm Age) ndash 2006 to 2015
The above Q-Q in figure 43 exhibits normality This is because most of the observations
seem to be in a straight line with a few cases appearing to be far away from the line
79
Figure 44 Q-Q Plot for Firm Characteristics (Firm Size) ndash 2006-2015
The Q-Q plot for firm size in figure 44 above indicates almost all the observations being
on a straight line This implies normality of the data Outliers were investigated and
corrected or eliminated where necessary
80
Figure 45 Q-Q Plot for Firm Financial Performance ndash 2006 to 2015
The Q-Q plot for financial performance in figure 45 above shows normality
422 Reliability Tests
Reliability tests were carried out through Cronbachs alpha tests in Statistical Package for
the Social Sciences (SPSS) with the findings presented below The results are shown in
Table 42 below Except for financial performance which shows a score of 0672 all the
other variables indicate reliability scores above 0700 which is the accepted score for
reliability (Bonett amp Wright 2014) The research instrument was therefore deemed
reliable
81
Table 42 Reliability Scores for Individual Variables
Variable Item Cronbachs Alpha
Free Cash Flow 0726
Firm Age 0798
Firm Size 0814
Agency Costs-AC 0828
Financial Performance 0672
423 Test for Linearity
In testing whether the variables were linearly associated a correlation analysis was done
The null hypothesis for the test was that there was no linear association The test statistics
for linear associations between the predictor variables and firm performance (explanatory
variable) are shown in table 43 below
Table 43 Test for Linearity
Reference Variable Firm
Performance
Coefficient of Correlation P-Value
Free cash flows 0506 0000
Agency costs (AC) 0521 0000
Firm Age 0619 0000
Firm Size 0590 0000
82
From table 43 above FCF shows a coefficient of correlation of 0506 agency costs (AC)
indicate 0521 firm age 0619 and finally firm size reveal 0590 All the values exceed
05000 meaning that there is a positive correlation Financial performance is the reference
variable All the p-values for the respective coefficients of correlation are 0000 which is
lower than 001
Thus all the predictor variables have a significant positive correlation with financial
performance at five per cent level of significance Therefore the predictor variables and
the explanatory variable (financial performance) move in the same direction which
suggests a linear relationship This positive significant correlation indicates that the
signage coefficients of the predictor variables in the simple regression models are
positive
424 Bartletts Test for Internal Consistency
The study tested the consistency of the items in the designed questionnaire to measure
several variables used in the research by applying the Bartlettrsquos test of sphericity The
null hypothesis of the test was that there was no internal consistency A failure to reject
the null hypothesis implies that the principal components which measure individual
sections have to be established using principal component analysis
Conversely rejecting the null hypothesis implies that all the elements are consistent
internally and that their composites can be applied in measuring the variables concerned
83
Test statistics for each of the sections involved in the linear regression analysis are
presented in table 44 below
Table 44 Bartlettrsquos Test
Variable Degrees of freedom Test statistic
Chi Square P value
Free cash flows 21 4382 0000
Agency costs (AC) 10 2665 0000
Firm age 10 1462 0000
Firm size 10 1621 0000
Financial performance 10 26940 0000
Table 44 above demonstrates that the null hypothesis which states that the variables are
not intercorrelated in each of the sections has to be rejected at five per cent significance
level This is confirmed by all the p-values being less than 001 for the variables
425 Multicollinearity Test
Multicollinearity occurs if there is a strong relationship between two or more independent
variables in a regression model Multicollinearity becomes an issue only in multiple
regressions and not for simple regression analysis Multicollinearity poses several
problems such as increases in standard errors of 120689 coefficients This means that the 120689s
have relatively higher variability across samples and less likely to represent the
population The second problem is limiting the size of R which measures multiple
correlation between the independent variables and the result and R2 the variance of the
84
result for which the independent variables explain making the second predictor to
explain very little of the remaining variance The other problem posed by
multicollinearity is that it reduces the importance of predictors making it hard to measure
the specific significance of a predictor (Field 2009)
To test whether the level of multicollinearity in the estimated models could be tolerated
Variance Inflation Factor (VIF) was used The rule of the thumb is that a value of VIF
that is less than 10 means that the level of multicollinearity can be tolerated (Robinson amp
Schumacker 2009) Since multicollinearity test is only applicable for multivariate
regressions only VIF statistics are reported since the regressions involve more than one
independent variable
Table 45 Multicollinearity Test
Variables VIF
Free Cash Flows 206
Agency costs (AC) 155
Financial Performance 252
Firm Size 109
Firm Age 168
Table 45 above shows that the VIF for all the models estimated ranged from 109 to 235
showing that the VIF results are between the acceptable ranges of 1 to 10 (Robinson amp
85
Schumacker 2009) This shows that the variables did not exhibit multicollinearity and
regression analysis could then be carried out
43 Descriptive Statistics
Table 46 Descriptive Statistics for Secondary Data ndash 2006 to 2015
Variables No Min Max Mean STD
Tobinrsquos Q (Ratio) 600 0867900 6447370 0526600 0634590
FCF (Ratio) 600 -0024530 3145000 16900 011270
AC(Ratio) 600 0003716 6329080 33166898 091646
SIZ (Ratio) 600 -1342200 2810600 04418300 0612300
AGE (n log of year
since incorporation)
600 140884 5400013 3904435 0287000
Table 46 above shows descriptive statistics for secondary data for a 10 year period from
2006 to 2015 Table 46 above gives the descriptive analysis for the main variables used
in the research It shows that the average Tobin Q is 05266 This suggests that on
average firms listed at NSE have recorded fairly impressive performance The Tobinrsquos Q
mean of 05266 suggests that the firmsrsquo market values are less than their book values
Since their market price to book value ratio is less than one the market expects the value
of these firms to reduce in the future because the market price also takes any future
earnings into account at the current price
86
For FCF the average is 169 meaning that most firms listed at NSE have low FCF The
mean for AC was found to be 33166898 indicating a high asset turnover and operating
expenses to sales ratio The average age of the firm is indicated by the log of 3904435
This shows that the firms listed at the NSE are relatively old On average the mean firm
size of listed firms at the NSE is indicated by a log of 04418300 indicating that the firms
have a fairly high asset value
44 Chapter Summary
This chapter presented information on pre-estimation diagnostics These include
normality test reliability test reliability test test for linearity Bartlettrsquos test for internal
consistency and multicollinearity test The chapter also gave results of analysis tests run
on the data that was collected These include descriptive statistics Results were indicated
by standard deviations mean scores minimum scores and maximum scores
87
CHAPTER FIVE TESTS OF HYPOTHESES AND DISCUSSION
51 Introduction
This section presents the hypotheses of the study which are derived from the research
objectives and the results of the hypothesized relationships This study was informed by
the premise that there exists a correlation between FCF and financial performance and
that this relationship is intervened by agency costs and is moderated by firm
characteristics
52 Correlation Analysis
The relationship between strength and direction of the variablesrsquo relationship was
investigated using the Pearson Product Moment correlation coefficient This was
significant so as to assess whether any relationship exists between the variables before
proceeding with further analyses The study employed the following classification strong
if 07 and above moderate if 04 but less than 07 and weak if 0 and less than 04
Apart from analysing the direction and strength of association correlation analysis was
also used to test the presence of multicollinearity between the independent variables
Multicollinearity exists if independent variables are highly correlated (r = or greater than
075) Multicollinearity reduces the importance of predictors making it difficult to assess
the individual importance of a predictor Multicollinearity may lead to poor regression
modelling (Dancey amp Reidy 2011) The results in Table 51 below show that there is no
multicollinearity since all the predictor coefficient results are below 075
88
Table 51 Pearson Product-Moment Correlations among the Dependent
Independent Intervening and Moderating Variables
Firm
performance
Free
cash
flows
Agency
costs
Firm
size
Firm
age
Pearson
Correlation
Firm performance 1 0702 0519 0405 0126
Free cashflows 1 0129 0135 0245
Agency costs 1 0198 0322
Firm size 1 0418
Firm age 1
Source Researcher (2018)
Correlation is significant at the 005 level (2-tailed)
Correlation is significant at the 001 level (2-tailed)
As indicated in Table 51 above there is a strong positive correlation between financial
performance and FCF (r = 0702) On the other hand the correlation between financial
performance and firm size and with agency costs is moderate and positive (r = 0405 and
0519 respectively) The correlation with firm age is weak but positive (r = 0126) All the
correlations were significant at 005 except firm age The relationships between financial
performance and FCF agency costs firm size and firm age moved in the same direction
as hypothesized in the study These variables were further assessed using regression
analysis as shown in section 53 below
89
53 Hypotheses Testing Using Regression Analysis
In order to establish these relationships four hypotheses were formulated and tested For
purposes of testing the hypotheses different regression models were run First finding
out the correlation between FCF and financial performance secondly tests to determine
the intervening effect of agency costs on the correlation between FCF and financial
performance thirdly tests were carried out to establish the moderating effect of firm
characteristics on the relationship between FCF and financial performance and lastly to
find out the joint effect of FCF agency costs and firm characteristics on financial
performance of NSE listed firms
In order to ascertain these relationships the hypotheses were formulated and tested using
simple and multiple linear regression analyses The hypotheses were tested at 95 percent
confidence level (ά = 005) while p-values were used to establish individual significance
of the hypothesized relationships The significance and general robustness of the model
was assessed using F statistic and p-values for significance Overall F statistic value
greater than 1 signifies goodness of fit P-values greater than or equal to 005 indicated
that we would fail to reject the null hypothesis while those with p-values less than 005
signified that the null hypothesis would be rejected ANOVA and panel data analyses
results have been presented and discussed below
90
531 Free Cash Flows and Financial Performance
The study sought to determine the effect of FCF on financial performance and it
employed panel data design Panel data was used in establishing financial performance
which was measured by Tobinrsquos Q (equity market value equity book value) FCF on the
other hand was measured as Net income + depreciation and amortization - CAPEX -
change in non-cash working capital + net borrowing)Net sales The study sought to
identify the effect of FCF on firm financial performance The following hypothesis was
developed
H01 FCF have no significant effect on financial performance of firms listed at the NSE
Maximum likelihood regression model was employed in data analysis The test statistics
regression results with financial performance as the dependent variable and FCF as the
independent variable are reported in Table 52(a) below
Table 52 Panel Data Results for Free Cash Flows and Financial Performance
Model Summary
Model R R2 Adjusted R
2 Standard
Error
1 04890 02391 02106 02258
a Predictors (Constant) Free cash flows
b Dependent Variable Financial performance
91
(a) ANOVA
Model Sum of
Squares
DF Mean
Square
F Sig
Regression 2689 1 2689 5376 0017
Residual 32483 599 0054
Total 35172 600
a Predictors (Constant) Free Cash Flows
b Dependent variable Financial performance
(c) Regression Co-efficients
Model Unstandardized Coefficients Standard
Coefficients
t Sig
B Standard Error Beta
Constant 048011 0011662 020 7229 0000
FCF 0206 00254 0265 54238 00023
Dependent variable Financial performance
The model coefficients are shown in Table 52(c) above The results indicate that FCF is
a significant predictor because the p value is 00023 which is lower than 005 (level of
significance) Furthermore results indicate R2
of 02391 which implies that FCF explain
2391 of the variability in firm financial performance The results have rejected the null
hypothesis implying that FCF have a statistically significant positive effect on financial
performance of firms listed at the NSE The regression model that explains the variation
in financial performance as a consequence of FCF is as shown below
92
Ǭit = 048011 + 0206FCFit
Where
Ǭ = Firm financial performance
FCF =Free cash flows
532 Free Cash Flows Agency Costs and Financial Performance
This study sought to ascertain the effect of agency costs on the relationship between FCF
and financial performance The corresponding hypothesis is
Hypothesis 2 Agency costs have no significant intervening effect on the relationship
between free cash flows and financial performance of firms listed at the Nairobi
Securities Exchange
The study employed secondary panel data in determining the results under this
hypothesis Secondary data was obtained from financial statements and measured agency
costs using asset utilization efficiency (salesassets) and production cost efficiency
(operating expensessales) The values were obtained separately (AUE and PCE) and
added together then divided by two to obtain agency costs (AC)
In testing for mediation intervention first the relationship between the dependent
variable (financial performance) and the independent variable (FCF) was carried out
ignoring the intervening variable (agency costs-AC) This was step number 1 and is
similar to the regressions performed under hypothesis one under section 52 The model
should indicate significance where p = lt005
93
Next is the regression analysis between FCF (the independent variable) and agency costs
(AC) which is a combination of production cost efficiency and asset utilization efficiency
as intervening variable ignoring the financial performance (the dependent variable) The
FCF and AC relationship should be significant (p=lt005) if one is to move to step 3
Under step 3 the regression analysis is done with financial performance as the dependent
variable and both AC and FCF as independent variables Regression results for step 1 are
same as shown in Table 51 earlier Results from step 1 shown in Table 51 indicate the p
value of 00023 and is therefore significant The regression model is specified as Ǭit =
048011 + 0206FCFit This necessitates moving to step 2 the results of which are
depicted in Table 53 below
Table 53 Panel Data Results of Agency Costs as the Dependent Variable and Free
Cash flows as the Independent Variable
a) Model Summary
Model R R Square Adjusted R Square Std Error of the Estimate
1 03356 01126 00958 02290
a Predictors (Constant) FCF
b Dependent Variable Agency costs (AC)
94
b) ANOVA
Model
Sum of
Squares df
Mean
Square F Sig
Regression 6881 1 6881 059 46181 0053
Residual 89226 599 0149 043
Total 96107 600
a Predictors (Constant) FCF
b Dependent Variable Agency costs (AC)
c Coefficients
Model
Unstandardized
Coefficients
Standardized
Coefficients
t Sig B Std Error Beta
1 (Constant) 0117 03042 3840 023
FCF 083 0137 265 2772 048
a Dependent Variable Total Non-Performance
Results in Table 53(c) above indicate that FCF is a significant predictor of AC as shown
by Sig = lt005 Table 53(a) above shows R square of 01126 which implies that 1126
variations in AC are explained by changes in FCF The regression model for the
relationship between FCF and AC ignoring financial performance is given below
AC = 0117 + 0083FCF
95
Since the relationship between FCF and AC is significant (as depicted by Sig = 0048)
we can now move to step 3 where financial performance is the dependent variable while
FCF and AC are predictor variables The results of step 3 are displayed in Table 54
below
Table 54 Panel Data Results of Financial Performance as the Dependent Variable
while Agency Costs and Free Cash flows are the Independent Variables
a Model Summary
Model R R Square Adjusted R Square Std Error of the Estimate
1 07157 05122 04613 02288
a Predictors (Constant) AC FCF
b Dependent Variable Financial Performance
a ANOVA
Model Sum of Squares df Mean Square F Sig
1 Regression 14725 2 73625 62606 0000
Residual 106258 598 01776
Total 120983 600
a Predictors (Constant) AC FCF
b Dependent Variable Financial Performance
96
c Coefficients
Model
Unstandardized Coefficients
Standardized
Coefficients
t Sig B Std Error Beta
1 (Constant) 0187 0342 44409 021
FCF 211 0179 227 13380 071
AC 148 042 282 62376 015
a Predictors (Constant) AC FCF
b Dependent Variable Financial Performance
The findings in Table 54 above indicate that financial performance is significantly
predicted by AC (p =0015 which is lt005) On the contrary FCF does not significantly
predict financial performance This is depicted by (p = 0071 which is gt005) From the
regression results above Adjusted R squared changed from 02106 to 04613 showing a
significant increase in the relationship between FCF and financial performance
This change is attributed to the intervening variablersquos effect It is therefore concluded that
agency costs (AC) have a positive statistically significant intervening effect on the
relationship between FCF and financial performance The null hypothesis that Agency
costs have no significant intervening effect on the relationship between free cash flows
and financial performance of firms listed at the Nairobi Securities Exchange is therefore
rejected The resultant regression model is as shown below
Ǭit = 0187 + 0148ACit+0211FCFit
97
533 Free Cash Flows Firm Characteristics and Financial Performance
This study sought to identify the effect of firm characteristics on the relationship between
FCF and financial performance The corresponding hypothesis is
Hypothesis 3 Firm characteristics have no significant moderating effect on the
relationship between free cash flows and financial performance of firms listed at the
Nairobi securities exchange
The study employed secondary panel data in determining the results under this
hypothesis Since firm characteristics (age and size) are additive each one of them was
tested separately Therefore under this hypothesis two sub-hypotheses were developed
as follows
H03a Firm age has no significant moderating effect on the relationship between free cash
flows and financial performance of firms listed at the Nairobi securities exchange
H03b Firm size has no significant moderating effect on the relationship between free cash
flows and financial performance of firms listed at the Nairobi securities exchange
Secondary data was obtained from financial statements and measured firm characteristics
using firm size and age of the firm Firm size was measured using the natural log of total
assets while age of the firm was measured using the natural log of number of years since
incorporation The moderating effect of firm size and firm age on the relationship
between FCF and firm financial performance was assessed using the centered approach
as by Wu and Zumbo (2008)
98
This involves the following steps Step 1 involves the independent variables and the
moderator variables being regressed against firm financial performance Step 2 on the
other hand entails introduction of the centered approach in the model with the predictor
variable moderating variable and the interaction term being factored into the model The
regression results are shown in Table 55 below
Table 55 Panel Data Results for Financial Performance as the Dependent Variable
and FCF and Firm Age as the Predictor Variables
a Model Summary
Model R R Square Adjusted R Square
Std Error of the
Estimate
1 05894 03474 03109 1573
a Predictors (Constant) FAGE_CENTRED FCF_CENTRED
b Dependent Variable Financial Performance
b ANOVA
Model Sum of Squares df Mean Square F Sig
1 Regression 51189 2 25594 8531 0000
Residual 20440 598 003
Total 255589 600
a Predictors (Constant) FAGE_CENTRED FCF_CENTRED
b Dependent Variable Financial Performance
99
c Coefficients
Model
Unstandardized
Coefficients
Standardized
Coefficients
t Sig B Std Error Beta
1 (Constant) 0041 11662 28109 0044
FCF 1306 0144 088 44238 0023
AGE 201 02607 353 6120 0002
a Dependent Variable Financial Performance
Results in Table 55(a) above show R2 of 03474 and Adjusted R
2 of 03109 Table 55(c)
above shows the coefficients of FCF and AGE as 01306 and 0201 respectively The p
values for FCF and AGE are 0023 and 0002 respectively indicating statistical
significance because each of them is less than 005 Results for Step 2 are displayed in
Table 56 below where the interaction term is introduced
Table 56 Panel Data Results for Financial Performance as the Dependent Variable
and FCF and Firm Age as the Predictor Variables Centered Approach
a Model Summary
Model R R Square Adjusted R Square Std Error of the Estimate
1 06825 046580 042170 041054
a Predictors (Constant) FCF_FAGE_CENTRED FAGE_CENTRED FCF_CENTRED
b Dependent Variable Financial Performance
100
b ANOVA
Model Sum of Squares df Mean Square F Sig
1 Regression 12034 3 401130 29957 0000
Residual 79950 597 01339
Total 91984 600
a Predictors (Constant) FCF_FAGE_CENTRED FAGE_CENTRED FCF_CENTRED
b Dependent Variable Financial Performance
c Coefficients
Model
Unstandardized
Coefficients
Standardized
Coefficients
t Sig B Std Error Beta
1 (Constant) 0065 00245 41263 0001
FCF_CENTRED 0207 00014 0293 74638 0000
AGE_CENTRED 0094 0091 0351 1986 0047
FAGE_CENTRED 0045 002 00204 2230 0027
a Predictors (Constant) FCF_FAGE_CENTRED FAGE_CENTRED FCF_CENTRED
b Dependent Variable Financial Performance
Results from Table 56 above shows R squared change from 03109 to 042170 which is a
change of 01108 (1108 change) which is occasioned by the interaction term This is
also confirmed by the p values which are all less than 005 meaning that firm age
101
positively and significantly moderates the relationship between FCF and financial
performance The regression model for moderation effect of firm age is as shown below
Ǭit = FCFit + AGEit + 0045FAGEit
Table 57 Panel Data Results for Financial Performance as the Dependent Variable
and FCF and Firm Size as the Predictor Variables
a Model Summary
Model R R Square Adjusted R Square Std Error of the Estimate
1 06481 04200 03902 03198
a Predictors (Constant) SIZE FCF
b Dependent Variable Financial performance
b ANOVA
Model
Sum of
Squares df Mean Square F Sig
1 Regression 8447 2 4224 120685 00000
Residual 21456 598 0035
Total 29903 600
a Dependent variable Financial performance
102
c Coefficients
Model
Unstandardized
Coefficients
Standardized
Coefficients
t Sig B Std Error Beta
1 (Constant) 009 002109 53270 00014
FCF 0107 003104 0178 74238 00000
SIZE 0223 009100 1444 19860 00470
a Dependent Variable Financial Performance
Results in Table 57(a) above show R2 of 04200 and Adjusted R
2 of 03902 Table 57(c)
above shows the coefficients of FCF and SIZE as 0107 and 0223 respectively The p
values for FCF and SIZE are 0000 and 0047 respectively indicating statistical
significance because each of them is less than 005 Results for Step 2 are displayed in
Table 58 below where the interaction term is introduced
Table 58 Panel Data Results for Financial Performance as the Dependent Variable
and FCF and Firm Size as the Predictor Variables Centered Approach
a Model Summary
Model R R Square Adjusted R2 Std Error of the Estimate
1 07853 06167 05654 02208
a Predictors (Constant) FCF_CENTRED SIZE_CENTRED FSIZE_CENTRED
b Dependent Variable Financial Performance
103
b ANOVA
Model Sum of Squares df Mean Square F Sig
1 Regression 3138 1 3138 17119 00011
Residual 109846 599 01833
Total 112984 600
a Predictors (Constant) FCF_CENTRED FCF_FSIZE_CENTRED FSIZE_CENTRED
b Dependent Variable Financial Performance
c Coefficients
Model
Unstandardized
Coefficients
Standardized
Coefficients
t Sig B Std Error Beta
1 (Constant) 0144 00245 4826 0021
SIZE_CENTRED 0048 00140 0392 2586 0041
FCF_CENTRED 0155 00140 0132 3938 0003
FSIZE_CENTRED 0227 00327 0472 2679 00981
a Dependent Variable Financial Performance
Results from Table 58 above shows R squared change from 03902 to 05654 which is a
change of 01752 (1752 change) which is occasioned by the interaction term This is
also confirmed by the p values which are all less than 005 meaning that firm size
moderates the relationship between FCF and financial performance The regression
model for moderation effect of firm size is as shown below
104
Ǭit = FCFit + SIZit + 0227FSIZEit
The moderating effect was established as in Stone-Romero and Liakhovitski (2002)
which involves assessing the effects on the dependent variable (non-financial
performance) of the moderating variables (firm size and age) and dependent variable
(FCF) Regression results with non-financial performance as the dependent variable firm
characteristics (firm size and age) and FCF as predictors as shown below
534 Free Cash Flows Agency Costs Firm Characteristics and Financial
Performance
This study sought to establish the joint effect of FCF agency costs and firm
characteristics on firm performance The corresponding hypothesis is as follows
Hypothesis 4 There is no joint effect of free cash flows agency costs and financial
characteristics on performance of firms listed at the Nairobi Securities Exchange
Secondary data was obtained from financial statements The independent variable is FCF
intervening variable is agency costs (AC) The moderating variable is firm characteristics
which are firm size and age of the firm Financial performance was measured using
Tobinrsquos Q and is the dependent variable Panel data results are presented in table 59
below
105
Table 59 Panel Data Results for Free Cash Flows Agency Costs Firm
Characteristics and Financial Performance
a Model Summary
Model R R Square Adjusted R Square Std Error of the Estimate
1 08780 07708 06645 05432
a Predictors (Constant) FCF AC Firm Size Firm Age
b Dependent variable Financial performance
b ANOVA
Model Sum of Squares df Mean Square F Sig
1 Regression 7708 2 3854 22807 0012
Residual 101336 598 0169
Total 7934 600
a Predictors (Constant) FCF AC Firm Size and Firm Age
b Dependent Variable Financial Performance
106
c Coefficients
Model
Unstandardized
Coefficients
Standardized
Coefficients
t Sig B Std Error Beta
1 (Constant) 065 0011 3826 0033
FCF 0144 0024 0081 4938 0020
Age 0107 0027 0150 1233 0074
Size 0231 0069 0102 6586 0010
AC 0314 0034 0259 2901 0032
a Predictors (Constant) FCF AC Firm Size and Firm Age
b Dependent Variable Financial Performance
From the panel study results the intercept (constant) is 0065 with a statistically
significant p-value of 0033 FCF have a coefficient value of 0144 with a p-value of 002
which is significant The findings indicate that FCF still have positive effect on the
performance of the listed firms and the effect is still significant even when control
variables are introduced in the model The effect of agency costs is also positive and
significant at p value 0032 Firm size shows a positive and significant joint effect (p
value is 001) while age has a positive effect but the effect is not significant (p value is
0074) The R2 is 07708 indicating that 7708 of changes in financial performance are
accounted by the joint effect of FCF AC and firm characteristics (size and age)
107
Overall the joint effect of FCF agency costs and firm characteristics on performance of
firms listed at NSE indicates a positive significant relationship The null hypothesis is
therefore rejected There is a significant joint effect of FCF agency costs and firm
characteristics on performance of firms listed at the NSE The regression model that
explains the variation in firm performance as a result of the joint effect of FCF agency
costs and firm characteristics is shown below
Ǭit FCFit +ACit +SIZit +AGEit
Where Ǭit = Financial Performance
FCF= Free Cash flows
AC = Agency Costs (AC)
SIZ = Firm Size
AGE = Firm Age
54 Discussion
The study had four hypotheses with hypothesis 3 having two sub hypotheses one
focusing on firm age and the other on firm size The results under each objective are
discussed here-below
541 The Influence of Free Cash Flows on Financial Performance
The first objective of the study was to establish the influence of FCF on the performance
of firms listed at the NSE This was achieved through analyzing the audited financial
statements of the listed companies (panel data)
108
The results indicate that there is a significant positive relationship between FCF and firm
performance The findings for the influence of FCF on financial performance showed a
statistically significant positive relationship These results are consistent with other
studies on FCF and firm performance For instance Kargar and Ahmadi (2013) found a
positive relationship between FCF and performance of firms listed at the Tehran stock
exchange Similarly Gregory (2005) established that the greater the FCF the better the
performance in merger undertakings Szewczyk et al (1996) and Chang et al (2007)
concluded that shareholders favour businesses that have FCF
In his study on the effects of agency costs on performance of firms listed at the NSE
Wambua (2013) also found a positive relationship between FCF and firm performance
The findings show that increasing FCF disposes more resources to firm managers who
then deploy the resources towards generating more revenues and profits for the firm
The findings are inconsistent with the FCF hypothesis postulated by Jensen (1986) which
suggests that agency conflicts between firm managers and shareholders become more
severe in the presence of substantial FCF thereby negatively affecting firm performance
Furthermore these findings reject the agency theory which was proposed by Jensen and
Meckling (1976) The agency theory is based on the premise that the goal of firm
managers is to maximize their personal wealth and other self-interests instead of
maximizing the wealth of shareholders
On the contrary the findings seem to support the stakeholder theory which advances that
firm management has a network of relationships and therefore corporate accountability
109
includes a broad range of stakeholders such as suppliers business associates financial
institutions the government customers among others Similarly the findings are
consistent with the stewardship theory The theory emphasizes the role of firm managers
as being that of stewards who integrate their goals as part of the firmrsquos goals
542 The Influence of Agency Costs on the Relationship between Free Cash Flows
and Financial Performance
The second objective was to assess the influence of agency costs on the relationship
between FCF and financial performance of firms listed at the NSE The study
hypothesized that agency costs have no significant intervening effect on the relationship
between FCF and performance of firms listed at the NSE The assessment of agency
costs FCF and financial performance was achieved by reviewing financial statements of
companies listed at the NSE The results indicate a statistically significant positive
intervening effect of agency costs on the relationship between FCF and financial
performance
The results reveal that agency cost measure is positive and significantly associated with
firm performance This can be attributed to the role of internal control system in reducing
agency costs associated with residual loss due to suboptimal managerial actions These
findings are supported by Kangarluei Motavassel and Abdollahi (2011) and Khidmat
and Rehman (2014) who established a statistically significant positive effect of agency
costs on the relationship between FCF and firm performance
110
Similarly Lin and Lin (2014) found a positive statistically significant effect of agency
costs on the relationship between FCF and firm performance in the Australian takeover
market These findings are contrary to the argument that substantial FCF increases
agency costs which subsequently affects firm performance negatively The FCF
hypothesis and the agency theory are therefore not supported by the findings On the
contrary the stakeholder theory and the stewardship theory are supported by the results
543 The Influence of Firm Characteristics on the Relationship between Free Cash
Flows and Financial Performance
The third objective of the study was to determine the moderating effect of firm
characteristics on the relationship between FCF and performance of firms listed at the
NSE The firm characteristics evaluated were firm size and age of the firm An
assessment of audited financial statements was carried out to measure FCF firm
characteristics (firm size and age of the firm) and firm financial performance
Results indicate firm size exhibiting a statistically significant positive moderating effect
on the relationship between FCF and firm financial performance Similarly firm age
shows a positive moderating effect on the relationship between FCF and firm financial
performance and the effect is also statistically significant The positive effect of firm size
confirms the results of the study conducted by Nyamweno and Olweny (2014) which
found firm size to be positively related to ROA This indicates that larger firms report
higher financial performance as compared to smaller firms Abbasi and Malik (2015)
clarified the relationship between firm size and financial performance by concluding that
111
larger firms had higher likelihoods of obtaining credit from financial institutions and
would get loans at lower rates because they have superior credit worth ratings and have
lower risk of bankruptcy
Heydari et al (2014) argue that firm characteristics such as firm age and size can expose
a firm to more agency costs related to management and growth prospects thus depressing
the effect of FCF on firm performance This result can be viewed from the perspective of
liability of obsolescence in which organizational performance declines with age
The decline can be attributed to environmental drift resulting from rivalry and
competition and organizational inertia the syndrome of too big or too old to change
Liabilities of obsolescence arise from growing external mismatch with the environment
The results indicate positive effects of firm characteristics on the relationship between
FCF and firm financial performance The results in this study support the RBV theory
which is concerned with internal firm specific factors and their effect on performance
The RBV theory views the firm as a bundle of resources which are combined to create
organizational capabilities that it can use to earn more than average profitability If well
developed competences from these resources become a source of competitive advantage
(Grant 1991)
112
544 The Joint Effect of Free Cash Flows Agency Costs and Firm Characteristics
on Financial Performance
The last objective of the study was to establish the joint effect of FCF agency costs and
firm characteristics on financial performance of firms listed at the NSE Financial
performance was measured by Tobinrsquos Q Firm characteristics that were considered in
the study were firm size and age of the firm Panel data results indicate that there is a
positive statistically significant joint effect of FCF agency costs and firm characteristics
on firm performance These findings support results by Chen et al (2016) who conclude
that large firms which have been in existence for a long time tend to have structures in
place to reduce agency costs
The findings are also similar to Wang (2010) who concluded that there exists a positive
joint effect of firm size FCF and agency cost on firm performance Results of the study
by Jabbary Hajiha Labeshka and Hassanpour (2013) are confirmed by these findings
which reveal that FCF have a positive significant effect on firm performance even with
the inclusion of control variables of agency costs and firm characteristics All the agency
cost coefficients indicate statistically significant positive effects
Emami et al (2014) observe that internal control systems provide an overarching
framework that reduces agency costs and hence positively affecting firm performance
These findings are also similar to Dawar (2014) who established that firm monitoring
costs impact positively on firm performance In testing financial performance firm size
had a coefficient of 0231 and p-value of 001 when jointly tested with other variables
113
indicating that firm size has a positive effect on firm performance even with control
variables introduced
These findings are supported by Banafa (2016) who concluded that firm size affects
performance of firms significantly albeit with small effect when moderated by other
variables In testing financial performance firm age revealed a positive but not
statistically significant effect with a coefficient of 0107 and a p-value of 0074 These
results contradict with Brouwe et al (2005) who concluded that productivity growth
rates are negatively correlated with firm age
Overall the joint effect of FCF agency costs and firm characteristics on performance of
firms listed at NSE indicates a positive significant relationship We therefore reject the
null hypothesis which states that there is no significant joint effect of free cash flows
agency costs and firm characteristics on financial performance of firms listed at the NSE
These results have rejected the FCF hypothesis and the agency theory This is because
FCF firm characteristics and agency costs have indicated a positive joint effect on firm
performance On the other hand the stewardship theory the stakeholder theory and the
RBV theory seem to be supported by the findings The organisational theory which
explains firm size in relation to profitability as well as organizational transaction costs
agency costs and span of control also seems to be supported by the findings of this study
114
Table 510 Summary of Tests of Hypotheses Results and Conclusions
Hypothesis R2
(p-value) Conclusion
H01 FCF have no significant
effect on financial
performance of firms listed at
the NSE
02391
00023
Null Hypothesis rejected
H2 Agency costs (AC) have
no significant intervening
effect on the relationship
between FCF and financial
performance of firms listed at
the NSE
05122
0031
Null Hypothesis rejected
H03a Firm age has no
significant moderating effect
on the relationship between
FCF and financial
performance of firms listed at
the NSE
04658
0047
Null Hypothesis rejected
H03b Firm size has no
significant moderating effect
on the relationship between
FCF and financial
performance of firms listed at
the NSE
06167
0041 Null Hypothesis rejected
H04 There is no joint effect of
FCF agency costs and firm
characteristics on financial
performance of firms listed at
the NSE
07708
0033
Null Hypothesis rejected
115
55 Summary and Presentation of Empirical Models
The chapter presented the study results from analytical tests conducted to verify the study
hypotheses The findings of the statistical analyses carried out were presented and
interpreted The study established that FCF have a statistically significant positive effect
on financial performance This relationship is intervened by agency costs and moderated
by firm characteristics
Agency costs have a statistically significant positive intervening effect on the relationship
between FCF and financial performance On the other hand firm characteristics have a
statistically significant negative moderating effect on the relationship between FCF and
firm financial performance Finally the study established that there is a joint effect of
FCF agency costs and firm characteristics on financial performance of firms listed at the
NSE The joint effect is positive and statistically significant The empirical conceptual
model depicting the relationships between the variables is presented in figure 51 below
116
Figure 51 Revised Empirical Model ndash Financial Performance
Independent Variable Dependent Variable
Intervening Variable H1 Ǭit = 048011 + 0206FCFit
H2 Ǭit = 0187 + 0148ACit + 0211FCFit
H4 Ǭit = 065 + 00144FCFit + 0314ACit + 0231SIZit + 0107AGEit
Ǭit = 065+0207FCFit+0094AGEit + 0045FAGEit
H3 Ǭit = 0144+0155FCFit +0048SIZit+ 0227FSIZit
Moderating Variable
Source Researcher (2018)
Free Cash Flows
FCFit=(Net income
(PAT)+depreciation and
amortization - CAPEX -
change in non-cash
working capital + net
borrowing)Sales
Firm Financial
Performance
- Tobinrsquos Q
Agency Costs
- Asset utilization efficiency AC
- Production cost efficiency
Firm Characteristics
- Firm Size
- Age of the firm
117
CHAPTER SIX SUMMARY OF FINDINGS CONCLUSIONS AND
RECOMMENDATIONS
61 Introduction
This study investigated the relationship between FCF agency costs firm characteristics
and financial performance of firms listed at the NSE The independent variable is FCF
while agency costs are intervening variables and firm characteristics are moderating
variables Financial performance is the dependent variable The chapter has summarized
the findings of the study and made conclusions upon which recommendations are drawn
Discussions conclusions and recommendations have been presented These have been
discussed in light of other studies that have investigated the same or similar variables in
other settings The chapter ends with the study implications to theory policy and
practice and recommendations for further research
The study had four objectives upon which conclusions are aligned to The objectives
were first to stablish the relationship between free cash flows and financial performance
of firms listed at the NSE second to assess the influence of agency costs on the
relationship between free cash flows and financial performance of firms listed at the
NSE third to determine the influence of firm characteristics on the relationship between
free cash flows and financial performance of firms listed at the NSE and lastly to
establish the joint effect of free cash flows agency costs and firm characteristics on
financial performance of firms listed at the NSE
118
62 Summary of Findings
This study was founded on the premise that FCF have an influence on financial
performance and that the relationship between the two is intervened by agency costs and
moderated by firm characteristics A conceptual framework was therefore developed and
the study empirically tested hypotheses which were guided by the study objectives The
first objective of the study was set to find out the relationship between FCF and
performance of firms listed at NSE The findings reveal that FCF have a statistically
significant positive effect on performance of firms listed at the NSE
This finding is supported by the coefficient of determination of 02391 which indicates
the variations in firmsrsquo financial performance (explanatory variable) explained by FCF
(predictor variable) The effect of FCF was established to be statistically significant and
therefore the null hypothesis was rejected Therefore we reject the null hypothesis that
FCF have no statistically significant effect on performance of firms listed at the NSE
The results are inconsistent with the FCF hypothesis advanced by Jensen (1986) which
proposes that agency conflicts between firm managers and shareholders become more
severe in the presence of substantial FCF thereby negatively affecting financial
performance Additionally these findings reject the agency theory which was suggested
by Jensen and Meckling (1976) These results are consistent with Wambua (2013) who
found a positive relationship between FCF and firm performance The findings imply that
increasing FCF avails more resources to firm managers who utilize the funds in
generating more wealth
119
The second objective of the study sought to assess the influence of agency costs on the
relationship between FCF and financial performance of firms listed at the NSE The
findings indicate that agency costs have a positive statistically significant intervening
effect on the relationship between FCF and financial performance of firms listed at the
NSE Thus the study rejected the null hypothesis which states that agency costs have no
significant intervening effect on the relationship between FCF and financial performance
of firms listed at NSE
These findings support Lin and Lin (2014) who found a positive statistically significant
effect of agency costs on the relationship between FCF and firm performance in the
Australian takeover market These findings are contrary to the FCF hypothesis suggested
by Jensen (1986) and the agency theory postulated by Jensen and Meckling (1976)
However the stakeholder theory advanced by Freeman (1984) and the stewardship theory
developed by Donaldson and Davis (1991) seem to be supported by the findings
The third objective of the study sought to establish the influence of firm characteristics on
the relationship between FCF and financial performance of firms listed at the NSE
Results indicate that firm characteristics (both firm size and age) have a positive
significant moderating effect on the relationship between FCF and financial performance
of firms listed at the NSE These findings contradict Heydari et al (2014) who argue that
firm characteristics such as firm age and size can expose a firm to more agency costs
related to management and growth prospects thus depressing the effect of FCF on firm
performance
120
The fourth and final hypothesis sought to establish the joint effect of FCF agency costs
and firm characteristics on financial performance of firms listed at the NSE Results show
positive coefficients for all the variables which means that as FCF agency costs and firm
characteristics jointly increase performance of the NSE listed firms also increases Firm
characteristics show a positive statistically significant joint effect on firm financial
performance and also FCF and agency costs show a positive statistically significant joint
effect on firm financial performance The results have rejected the FCF hypothesis and
the agency theory On the other hand the results seem to support the stewardship theory
the stakeholder RBV theory and the organisational theory
63 Conclusions
Based on the findings of the study FCF is fundamental to firm performance because it
allows firms to invest and grow thereby improving performance Firms should strive to
increase FCF since it has a statistically significant positive effect on financial
performance Similarly firms should invest more in firm monitoring which according to
the findings in this study the benefits derived from investing in firm monitoring
(improved firm performance) outweigh the agency costs of investing therein (in firm
monitoring) This study has found no evidence supporting the FCF hypothesis as
suggested by Jensen (1986) and therefore firms listed at the NSE are not consistent with
the FCF hypothesis
Consistent with these findings Nyamweno and Olweny (2014) found firm size to be
positively related to financial performance Similarly Dawar (2014) found that firm
121
monitoring costs impact positively on financial performance Conflicting with literature
(Kwanum amp Lorpev 2012) firm age indicated a positive effect on the relationship
between FCF and firm financial performance However the findings of this study are
consistent with Banafa (2016) who concluded that firm size affects firm performance
significantly when moderated by other variables It is therefore confirmed that there
exists a strong relationship between FCF agency costs firm characteristics and financial
performance of firms listed at the NSE
64 Contributions of the Study
The study has contributed to knowledge in the areas of FCF and the agency problem firm
characteristics and firm performance More specifically the study has contributed to
theory policy and practice
641 Contribution to Theory
The results of this study have to a large extent rejected the FCF hypothesis advanced by
Jensen (1986) and the agency theory advanced by Jensen and Meckling (1976) which
postulate that when a firm has generated significant FCF and there are no lucrative
investment projects available managers tend to abuse the FCF which results in increased
agency costs The study results have therefore given credence to the critics of the FCF
hypothesis and agency theory who argue that the theories foster short-termism by not
favouring investments that have long run returns Furthermore the findings support the
argument that even in conditions of greatly specific assets where the likelihood of
opportunism is very high there are people who will give precedence to cooperation and
trust and will not engage in opportunistic behavior
122
The study findings have also given credibility to the stewardship theory postulated by
Donaldson and Davis (1991) which emphasizes the role of firm managers as being
stewards incorporating their objectives as part of the firm As stewards they are
contented and encouraged when success of the firm is achieved Agency costs have
shown a positive intervening effect on the relationship between FCF and firm
performance This finding gives credibility to firm monitoring through CG which seems
to have achieved the objective of aligning the interests of firm managers and
shareholders The study findings also imply that firm capabilities and firm characteristics
complement the effects of agency costs on performance
The inclusion of firm characteristics as a moderating variable provided an opportunity to
test the RBV and organizational theories by providing empirical evidence about how the
specific firm characteristics (size and age) affect firm performance This study adopted
two measures of agency costs This measurement approach has enabled the study to offer
a stronger and more robust assessment of the linkages between the study variables
642 Contribution to Policy
The Kenyan context is characterized by calls for effective CG particularly for public
limited liability firms (Okiro 2014) These study findings have refuted the FCF
hypothesis by revealing a positive relationship between FCF and firm performance as
intervened by agency costs This is an indication that investing in firm monitoring is
yielding positive results Adopting good CG mechanisms (firm monitoring which form
123
part of agency costs) is an effective way of improving firm performance Firms should
endeavor to strengthen their monitoring mechanisms so as to increase performance
Improving CG entails having an optimal number of board of directors enhancing board
independence making full disclosure of shareholding and directorrsquo remuneration Policy
makers will therefore maintain CG calls and strive to strengthen and continue developing
policies regulations and prudential guidelines that protect and strengthen shareholders
643 Contribution to Practice
The study findings have shown the fundamental importance of firms generating FCF and
strengthening firm monitoring The joint effect of FCF agency costs and firm
characteristics on firm performance has yielded a positive relationship Firm managers
investors and other practitioners will therefore put more emphasis on the need for firms to
generate FCF and to enhance firm monitoring
Cash flows from operating activities financing activities and investment activities will be
more keenly analyzed with a view to achieve greater efficiency This study has also
delineated FCF from agency costs unlike studies such as Jensen (1986) which generally
regard FCF as agency costs This gives firm managers investors and other practitioners a
better understanding of the variables and their linkages which will enhance effectiveness
and efficiency in firm operations
124
65 Limitations of the Study
The study focused on firms listed at the NSE which operate in a unique environment
Unique factors such as regulatory environment culture and demographics limit the
generalizability of the study results to other countries or markets However this
limitation does not render the study findings applicable to NSE listed firms only Some
aspects could be relevant to other markets
Secondly the major theoretical motivations underlying this study are the FCF hypothesis
and the agency theory Traditionally the board of directors keenly monitors decision
makers who tend to divert resources to their own personal interests The findings support
this view and offer evidence that proper firm monitoring mechanisms yield higher firm
performance A probable limitation of the study is that it does not integrate other CG
mechanisms such as influencing managersrsquo actions through an advisory role
Thirdly the study disregards practices other than board monitoring that may serve to
lessen agency costs Firm monitoring costs were a part of the larger agency cost variable
The omission of alternative board monitoring practices did not therefore undermine the
robustness and or the rigor of the study Fourthly the study used only two firm
characteristics These are firm size and age of the firm Other firm characteristics include
profitability leverage liquidity sales growth among others The study employed size and
age only because they are the most commonly used in literature and their effect on firm
performance is more significant (Demsetz amp Lehn 1985 and Mule Mukras amp Nzioka
2015)
125
Lastly literature indicates at least seven proxy measures of agency costs These are
operating expense to sales ratio total asset turnover advertising and RampD expense to
sales ratio administrative expense to sales ratio earnings volatility firm monitoring
index and FCF This study utilized only two of these measures (total asset turnover and
operating expense to sales ratio) Agency cost measures other than the two used in this
study may yield different findings Employing only one agency cost measure may still be
sufficient and therefore the omission of other measures did not undermine the robustness
and or the rigor of the study
66 Recommendations of the Study
The findings have indicated that there exists a positive relationship between FCF and
financial performance The study therefore recommends that firm managers investors
and other practitioners should focus more on the need for firms to generate FCF Positive
FCF indicate that the firm is making more cash than is used to operate the firm and for
reinvestment Such excess funds can be given back to shareholders as dividends or share
repurchase packages in cases where the firms have limited growth prospects and the
funds could not be better invested somewhere else
It is therefore recommended that regulators policy makers investors and other
practitioners should emphasize on monitoring and CG mechanisms to maintain if not
improve high firm performance Study results indicate that proper monitoring
mechanisms can bring the actions of firm managers into congruence with those of
shareholders which primarily is to maximize the shareholdersrsquo wealth
126
67 Suggestions for Further Research
This study used Tobinrsquos Q in measuring financial performance Further studies need to be
conducted using ROE ROI ROA DY sales growth market share or productivity
Secondly the study population was all firms listed at the NSE These firms cut across
various industry sectors Future studies could focus on specific industries such as
manufacturing financial sector communications agricultural or automobile industry
This is because focusing on a specific industry could yield different results that are
unique for the industry
Thirdly this study used only two firm characteristics as moderating variables These are
firm size and age of the firm Future studies could employ sales growth liquidity growth
prospects profitability asset growth turnover ownership structure dividend pay-out
profitability and access to capital markets among others Use of other moderating
variables may yield different results
Lastly the study only employed two proxy measures of agency costs Future studies
should attempt to use all the suggested seven agency cost measures or the other agency
cost measures not employed in this study This could yield different results or provide
more robustness and rigor in the study
127
REFERENCES
Abbasi A amp Malik A Q (2015) Firm size moderating financial performance in
growing firms Empirical evidence from Pakistan International Journal of
Economics and Financial Issues 5(2) 334ndash339
Adelegan O J (2009) Investment financial factors and cash flow from Nigerian panel
data Journal of African Development 11(1) 77-108
AERA APA amp NCME (2000) Standards for educational and psychological tests
Washington DC American Psychological Association American Educational
Research Association National Council on Measurement in Education
Aldrich H E amp Austen E (1986) Even dwarfs started small Liabilities of size and age
and their strategic implications In Staw B Cummings (Eds) Research in
organizational behavior JAI Press Greenwich CT
Ayako A Kungu G amp Githui T (2015) Determinants of the performance of firms
listed at the Nairobi Securities Exchange Research Journal of Finance and
Accounting 6(12) 157-164
Aiken L S amp West S G (1991) Multiple regression Testing and interpreting
interactions Thousand Oaks CA Sage
Bain J S (1959) Industrial organization New York John Wiley amp Sons
Baker W E amp Sinkula (2005) Market orientation and the new product paradox Journal
of Product Innovation Management 22(6) 485-502
Banafa A (2016) The effect of leverage liquidity and firm size on financial
performance of listed non-financial firms in Kenya Unpublished PhD Thesis
Jomo Kenyatta University of Agriculture and Technology
128
Barney J B (2002) Gaining and sustaining competitive advantage 2nd
ed Reading
Mass Addison-Wesley
Baron R M amp Kenny D A (1986) The moderator-mediator variable distinction in
social psychological research conceptual strategic and statistical considerations
Journal of Personality and Social Psychology 51(6) 1173-1182
Berle A A amp Means G C (1932) The modern corporation and private property
McMillan New York
Bonett D G amp Wright T A (2014) Cronbachrsquos Alpha Reliability Interval estimation
hypothesis testing and sample size planning Journal of Organizational Behavior
36 (1) 3-15
Bourne M Neely A D Mills J F amp Platts K (2003) Implementing performance
measurement systems A literature review International Journal of Business
Performance Management 5 (1) 1-24
Brealey A A Myers S C amp Allen F (2005) Principles of corporate finance (8th
ed)
Boston McGraw-HillIrwin
Bromiley P (1990) Advances in strategic management JAI Press Greenwich
Brouwer P Kok J D amp Fris P (2005) Can firm age account for productivity
differences EIM Business research scientific analysis of entrepreneurship and
SMEs SCALES ndash paper N200421 Zoetermeer Netherlands
Brush H W Bromiley P amp Hendrickx M (2000) The free cash flow hypothesis for
sales growth and firm performance Strategic Management Journal 21 455-472
129
Cadogan J W amp Diamantopoulos A (1995) Narver and Slater Kohli and Jaworski and
the market orientation construct integration and internationalization Journal of
Strategic Marketing 3(1) 41-60
Carson D Gilmore A Perry C amp Gronhaug K (2001) Qualitative marketing
research SAGE publications London
Central Bank of Kenya (2016) Bank supervision annual report
Chang S J amp Singh H (2000) Corporate industry effects on business and competitive
position Strategic Management Journal 21 (1) 739-752
Chen X Sun Y amp Xu X (2016) Free cash flow over-investment and corporate
governance in china Pacific-Basin Finance Journal 37 81ndash103
CMA (2010) A comparative analysis of the performance of African stock markets
[Online] Available wwwcmaorke [Accessed 9 August 2015]
Cline B N Williamson C R amp Yore A (2014) Economic calculation and constraints
on firm size Mississippi State University USA
Cooper D R amp Schindler P S (2006) Business research methods 9th
edition Mac-
Grow-hill publishing co ltd New Delhi India
Daft R L (1995) Organization theory and design (11 ed) West Publishing Company
New York
Daily C M Dalton D R amp Cannella J A A (2003) Corporate governance decades
of dialogue and data The Academy of Management Review 28 (3) 371-382
Dancey C amp Reidy J (2011) Statistics without maths for psychology 5th Edition
Prentice Hall London
130
Davis J Donaldson L amp Schoorman D (1997) Towards a stewardship theory of
management Academy of Management Review 22 (1) 20-47
Dawar V (2014) Agency theory capital structure and firm performance some Indian
evidence Managerial Finance 40(12) 1190ndash1206
Dean T J Robert L B amp Bamford (1998) Differences in large and small firm
responses to environmental context strategic implications from a comparative
analysis of business formations Strategic Management Journal 19(8) 709-728
Demsetz H amp Lehn K (1985) The structure of corporate ownership causes and
consequences Journal of Political Economy 93 (6) 1155-1177
Donaldson L (1990) A rational basis for criticism of organizational economics a reply
to Barney Academy of Management Review 15 394-401
Donaldson L amp Davis J H (1991) Stewardship theory or agency theory CEO
governance and shareholder returns Australian Journal of Management 16 (1)
49-65
Donaldson T amp Preston LE (1995) The stakeholder theory of the corporation
concepts evidence and implications Academy of Management Review 20 (1)
65-91
Dyer L amp Reeves T (1995) Human resource strategies and firm performance what do
we know and where do we go International Journal of Human Resource
Management 31 758-775
Easterwood C (1997) Takeovers and incentives for earnings management an empirical
analysis Journal of Applied Business Research 14 29-48
131
Emami E Salteh H M amp Hasanzadeh R B (2014) Social responsibility and value of
firms listed at Tehranrsquos Stock Exchange International Review of Management
and Business Research 31(21) 332ndash338
Fama E F (1980) Agency problems and theory of the firm Journal of Political
Economy 88(2) 288-307
Fauver L amp Naranjo A (2010) Derivative usage and firm value the influence of
agency costs and monitoring problems Journal of Corporate Finance 16 719-
735
Ferris S P amp Yan X S (2009) Agency costs governance and organizational forms
evidence from the mutual fund industry Journal of Banking and Finance 33 619-
626
Field A (2009) Discovering statistics using SPSS Sage Publications Ltd London
Figge F Hanh T Schaltegger S amp Wagner M (2002) The sustainability Balanced
Score Card - Linking sustainability management to business strategy Business
Strategy and Environment 11 269-284
Freeman R (1984) Strategic management a stakeholder approach Pitman Publishing
Inc Massachusetts
Frentrop P (2003) On the discretionary power of top executives Journal of Asset
Management 5 (2) 91-104
Gleason J M amp Barnum D T (1982) Toward valid measures of public sector
productivity performance measures in urban transit Management Science
28(14) 379-386
Gorard S (2013) Research design robust approaches for the social sciences London
SAGE ISBN
132
Grant R M (1991) The resource based theory of competitive advantage implications
for strategic formulation California Management Review 33(1) 114-135
Gregory A (2005) The long-run abnormal performance of UK acquirers and the free
cash flow hypothesis Journal of Business Finance and Accounting 32(5) 777-
814
Gul F A amp Tsui S T J (1998) A test of the free cash flow and debt monitoring
hypotheses evidence from audit pricing Journal of Accounting and Economics
24 (2) 219-237
Hannan M T amp Freeman J (1984) Structural inertia and organizational change
American Sociological Review 49(2) 149-164
Harford J (2002) Corporate cash reserves and acquisitions The Journal of Finance 54
(6) 1969 ndash 1997
Hawawini G Subramanian V amp Verdin P (2003) Is performance driven by industry
or firm specific factors a new look at evidence Strategic Management Journal
23 (1) 1-16
Hendricks K B amp Singhal V R (2001) Firm characteristics total quality management
and financial performance Journal of Operations Management 19 269-285
Heydari I Mirzaeifar M Javadghayedi M amp Student M A (2014) Investigating the
relationship between free cash flows and firm performance evidence from Tehran
Stock Exchange Indian Journal of Scientific Research 4(6) 269ndash279
Hill C W L (1990) Cooperation opportunism and the invisible hand implications for
transaction cost theory Academy of Management Review 15(3) 500-513
Hubbard R G (1998) Capital market imperfections and investment Journal of
Economic Literature 36 (2) 193-225
133
Jabbary H Hajiha Z Labeshka amp Hassanpour R (2013) Investigation of the effect of
agency costs on firm performance of listed firms at the Tehran Stock Exchange
European Online Journal of Natural and Social Sciences 2(3) 771ndash776
Jensen M (1986) Agency costs of free cash flow corporate finance and takeovers
American Economic Review 76 (2) 323-329
Jensen M C amp Meckling W H (1976) Theory of the firm managerial behavior
agency cost and ownership structure Journal of Financial Economics 3 (4) 305-
360
Kaen F R amp Baumann H D (2003) Firm size employees and profitability in US
manufacturing industries Social Science Research Network Electronic Journal
(1) 1-71
Kapelko M (2006) Evaluate efficiency in the framework of resource based view of the
firm evidence from Polish and Spanish textile amp clothing industry Bellaterra
1(1) 1-56
Kaplan R S amp Norton D P (2001) Transforming Balanced Score Card from
performance measurement to strategic management Part 1 Accounting Horizons
87-104
Kangarluei S J Motavassel M amp Abdollahi T (2011) The investigation and
comparison of free cash flows in the firms listed in Tehran Stock Exchange (TSE)
with an emphasis on earnings management International Journal of Economics
and Business Management 2(2) 5352ndash118
Kargar E F amp Ahmadi G R (2013) The relationship between free cash flows and
agency costs levels evidence from Tehran Stock Exchange Research Journal of
Finance and Accounting 4(14) 51ndash66
134
Kerlinger F N (2002) Foundations of behavioural research Holt Rinehart and
Winston Inc USA
Khidmat W B amp Rehman M U (2014) The impact of free cash flows and agency
costs on firm performance - an empirical analysis of KSE listed companies of
Pakistan Journal of Financial Engineering 01(03) 145 ndash 175
Kimberlin C L amp Winterstein A G (2008) Validity and reliability of measurement
instruments used in research American Society of Health-System Pharmacists 65
Kinoti M A (2012) Factors contributing towards adoption of green marketing
practices in the mobile phone service providers in Kenya Unpublished PhD
Thesis University of Nairobi Kenya
Kogan L amp Tian M (2012) Firm characteristics and empirical factor models a data-
mining experiment International Finance Discussion papers 1070
Kwanum M amp Iorpev L (2012) Capital structure and firm performance evidence from
manufacturing companies in Nigeria International Journal of Business and
Management Tomorrow 2 (5) 1ndash17
Leibenstein H (1976) Beyond economic man Cambridge MA Harvard University
Press
Lengnick-Hall C A amp Wolff J A (1999) Similarities and contradictions in the core
logic of three strategy research streams Strategic Management Journal 20(12)
1109-1132
Lin L amp Lin D (2014) Agency cost of free cash flow and biddersrsquo long-run takeover
performance Universal Journal of Accounting and Finance 2(1) 1-8
135
Lusthaus C Anderson G amp Murphy E (1995) Institutional assessment a framework
for strengthening organizational capacity for IDRCrsquos research partners
International Development Research Centre Ottawa
Mackinnon D P Lockwood C M Hoffman J M West S G amp Sheets V (2002) A
comparison of methods to test mediation and other intervening variable effects
Psychological Methods 7 (1) 83-104
Mbugua D (2015) Market orientation firm characteristics dynamic capabilities and
performance of deposit-taking savings and credit cooperative societies in Kenya
Unpublished PhD Thesis University of Nairobi Kenya
Mansell S (2013) Capitalism corporations and the social contract a critique of
stakeholder theory Cambridge Cambridge University Press
McKnight P J amp Weir C (2008) Agency costs corporate governance mechanisms and
ownership structure in large UK publicly quoted companies a panel data analysis
The Quarterly Review of Economics and Finance 49 (2009) 139-158
Meyer M W amp Zucker L G (1989) Permanently failing organization Sage Beverly
Hills CA
Miller D amp Chen M J (1994) Sources and consequences of competitive inertia
Administrative Science Quarterly 39(1) 1-17
Milne F Purda L amp Anand A (2008) Monitoring to reduce agency costs examining
the behavior of independent and non-independent boards Seattle University Law
Review 33(4) 809-848
Mitchell R K Agle B R amp Wood D J (1997) Toward a theory of stakeholder
identification and salience defining the principle of who and what really counts
Academy of Management Review 22(4) 853-886
136
Mojtahedzadeh V amp Nahavandi N N A P (2009) Free cash flow agency costs
earnings management and investor monitoring Journal of Financial Economics
32 615-635
Muganda N (2010) Applied business and management research Exploring the
principles and practices of research within the context of Africa Africa Nicorp
Publication
Mugenda O M amp Mugenda AG (2003) Research methods quantitative and
qualitative approaches Nairobi Acts Press
Mule R K Mukras S M amp Nzioka O M (2015) Corporate size profitability and
market value an econometric panel analysis of listed firms in Kenya European
Scientific Journal 11 (13) 376-396
Mwangi M (2014) The influence of membersrsquo income and conduct of SACCOs in the
relationship between characteristics and efficiency of SACCOs in Kenya
Unpublished PhD Thesis University of Nairobi Kenya
Nairobi Securities Exchange (2015) History of the NSE [Online] Available
wwwnsecoke [Accessed 26 June 2015]
Neely A (1998) Measuring business performance - why what and how Economist
Books London
Neely A D Adams C amp Kennerley M (2002) The performance prism the scorecard
for measuring and managing business success Pearson Education Limited
London UK
Nekhili M Amar I F B Chtioui T amp Lakhal F (2014) Free cash flow and earnings
management the moderating role of governance and ownership Journal of
Financial Economics 11 (13) 847 ndash 875
137
Njeru W G (2013) Market orientation marketing mix practices firm characteristics
external environment and performance of tour firms in Kenya Unpublished PhD
Thesis University of Nairobi Kenya
Njuguna L amp Moronge M (2013) Influence of the managerial behavior of agency cost
on the performance of listed firms on NSE International Journal of Social
Sciences and Entrepreneurship 1 (7) 397-410
Norman W amp MacDonald C (2004) Getting to the bottom of tripple bottom line
Business Ethics Quarterly 14 (2) 243-262
Nunes P J M Serrasqueiro Z M amp Sequeira T N (2009) Profitability in Portuguese
service industries a panel data approach The Service Industries Journal 29(5)
693-707
Nunnally J (1967) Psychometric theory Mac-Graw-Hill New York
Nyamweno C N amp Olweny T (2014) Effect of working capital management on
performance of firms listed at the Nairobi Securities Exchange Economics and
Finance Review 3(11) 1ndash14
Nyongrsquoo A P (2000) The context of privatization in Kenya African academy of
sciences Colour Printers Nairobi Kenya
Odundo E (2009) Alternative investment options transforming needs into
opportunities Retirement Benefits Authority CMA Workshop
Okiro K O (2014) The influence of capital structure firm size rules and regulations on
the relationship between composite corporate governance and performance of
firms listed on East African Securities Exchanges Unpublished PhD Thesis
University of Nairobi Kenya
138
Ongore V amp KrsquoObonyo P (2011) Effects of selected corporate governance
characteristics on firm performance empirical evidence from Kenya
International Journal of Economics and Financial Issues 1 (3) 99-122
Opler T amp Titman S (1993) The determinants of leveraged buyout activity free cash
flow versus financial distress costs Journal of Finance 48 1985-1999
Oppenheim A N (1992) Questionnaire design interviewing and attitude measurement
Basic books Inc New York
Patton M (1990) Qualitative evaluation and research methods Beverly Hills CA
Sage
Pearce J A amp Robinson R B (2011) Strategic management formulation
implementation and control (12th
ed) New York McGraw HillIrwin
Penfield R amp Miller J M (2004) Improving content validation studies using an
asymmetric confidence interval for the mean of expert ratings Applied
Measurement in Education 17 359-370
Penrose E T (1959) The theory of the growth of the firm Oxford Basil Blackwell
Perry C Reige A amp Brown L (1999) Realismrsquos role among scientific paradigms in
marketing research Irish Marketing Review 12(2) 16-23
Podrug N (2010) Stewardship relations within management hierarchy in large
Croatian companies Doctoral Dissertation Faculty of Economics and Business
Zagreb
139
Ponnu C H amp Okoth M O (2009) Corporate social responsibility disclosure in Kenya
The Nairobi Stock Exchange African Journal of Business Management 3(10)
601-608
Porter M E (1980) Competitive strategy New York The Free Press
Power L (1998) The missing link technology investment and productivity Review of
Economics and Statistics 80(2)300 ndash 313
Priem R L amp Butler J E (2001) Is the resource based view a useful perspective for
strategic management research Academy of Management Review 26(1) 22-40
Proctor S (1998) Philosophy and methods of research process the case of realism
Nurse Researcher 5 (4) 73 ndash 90
Richard P Divinney T M Yip G S amp Johnson G (1999) Measuring organizational
performance towards methodological best practice Journal of Management
35(2) 1340-1378
Richardson S (2006) Over-investment of free cash flow and corporate governance
Review of Accounting Studies 11 159-189
Robinson C amp Schumacker R E (2009) Interaction effects countering variance
inflation factor and interpretation issues Multiple Linear Regression View Points
35(1) 6-11
Rumelt R P (1991) How much does industry matter Strategic Management Journal
12(1) 167 185
Sagwa E V (2014) Human resource management practices and performance of firms
listed at the Nairobi Securities Exchange Unpublished PhD Thesis University of
Nairobi Kenya
140
Salaman G (1979) Work organizations resistance and control Longman London
Saunders M Lewis P amp Thornhill A (2007) Research methods for business students
(4th
ed) Prentice Hall Financial Times Harlow
Schmalensee R (1985) Do markets differ much American Economic Review 75 (1)
341-351
Shepherd W G (1986) On the core concepts of industrial economics in H W De Jong
and W G Shephert eds Mainstreams in Industrial Organization Dordrecht
Martinus Nijhoff Publishers
Singh M amp Davidson W N (2003) Agency costs ownership structure and corporate
governance mechanisms Journal of Banking and Finance 27 793-816
Smith C W amp Warner J B (1979) On financial contracting an analysis of bond
covenants Journal of Financial Economics 7(79) 117-161
Stalk G Evans P amp Schulman L E (1992) Competing on capabilities the new rules
of corporate strategy Harvard Business Review 70(1) 57-69
Stinchcombe A L (1965) Social structure and organizations Handbook of
organizations Rand McNally Chicago
Subrahmanyam A amp Titman S (2001) Feedback from stock prices to cash flows
Journal of Finance 56 (18) 2389-2413
Sundaram A K amp Inkpen A C (2004) Stakeholder theory and ldquothe corporate
revisitedrdquo a reply Journal of Organization Science 15 (3) 370-371
141
Szewczyk S H Tsetsekos G P amp Zantout Z (1996) The valuation of corporate RampD
expenditures evidence from investment opportunities and free cash flow Journal
of Financial Management 25 (1) 105-110
Tabachnick B G amp Fidell L S (2013) Using multivariate statistics (6 ed) Needham
Heights MA Allyn amp Bacon
Thakor R T (2013) Investment opportunities free cash flow and the market values of
foreign and domestic cash holdings Unpublished Working Paper Massachusetts
Institute of Technology
Thompson P amp McHugh D (2002) Work organizations a critical introduction (3rd
ed) Palgrave McMillan
Tirole J (1986) The theory of corporate finance Princeton University Press Princeton
NJ
Venkatraman N Ramanujam V (1986) Measurement of business performance in
strategy research a comparison of approaches The Academy of Management
Review 11(4) 801-814
Vogt S (1997) Cash flow and capital spending Evidence from capital expenditure
announcements Journal of Financial Management 26(2) 44 ndash 57
Waithaka S M Ngugi J K Aiyabei J K Itunga J K amp Kirago P (2012) Effects
of dividend policy on share prices a case of companies at the Nairobi Securities
Exchange Journal of Business Administration and Management 2 (8) 642-648
Wambua P (2013) Effects of agency costs on financial performance of companies listed at
the Nairobi Securities Exchange International Journal of Social Sciences and
Entrepreneurship 1 (5) 587-607
142
Wang G Y (2010) The impacts of free cash flows and agency costs on firm performance
Journal of Service Science and Management 3 408-418
Wernerfelt B (1984) A resource based view of the firm Strategic Management Journal
5(2) 171-180
Wernerfelt B amp Montgomery C A (1985) Tobinrsquos Q and importance of focus in firm
performance American Economic Review 78(1) 246-250
Williams B Onsman A amp Brown T (2012) Is the Australian paramedic a discipline or a
profession A national perspective International Journal of Paramedic Practice
1(5) 162-168
Williams J R (1992) How sustainable is your competitive advantage California
Management Review 34(1) 29-51
World Bank (2000) Corporate governance a framework for implementation A World Bank
Country Study Washington
Yin X amp Zajac E J (2004) The strategygovernance structure fit relationship theory and
evidence franchising arrangements Strategic Management Journal 25(7) 201-242
Wu A D amp Zumbo B D (2008) Understanding and using mediators and moderators
Social Indicators Research 87(3) 367
Zou S amp Stan S (1998) The determinants of export performance a review of the empirical
literature between 1987 and 1997 Journal of Marketing Review 15(5) 333-356
i
APPENDICES
Appendix I Firms Listed at the Nairobi Securities Exchange as at December 31
2015
NO SECTOR
A AGRICULTURAL
1 Eaagads Ltd
2 Kapchorua Tea Co Ltd
3 Kakuzi Ltd
4 Limuru Tea Co Ltd
5 Rea Vipingo Plantations Ltd
6 Sasini Ltd
7 Williamson Tea Kenya Ltd
B AUTOMOBILES AND ACCESSORIES
8 Car and General (K) Ltd
9 Sameer Africa Ltd
10 Marshalls (EA) Ltd
C BANKING
11 Barclays Bank Ltd
12 CFC Stanbic Holdings Ltd
13 IampM Holdings Ltd
14 Diamond Trust Bank Kenya Ltd
15 Housing Finance Co Ltd
16 Kenya Commercial Bank Ltd
17 National Bank of Kenya Ltd
18 NIC Bank Ltd
19 Standard Chartered Bank Ltd
20 Equity Bank Ltd
21 The Co-operative Bank of Kenya Ltd
D COMMERCIAL AND SERVICES
22 Nation Media Group
ii
23 Kenya Airways Ltd
24 Express Ltd
25 Standard Group Ltd
26 TPS Eastern Africa (Serena) Ltd
27 Hutchings Biemer Ltd
28 Uchumi Supermarket Ltd
29 Scangroup Ltd
30 Longhorn Kenya Ltd
E CONSTRUCTION AND ALLIED
31 Athi River Mining
32 Bamburi Cement Ltd
33 Crown Berger Ltd
34 EA Cables Ltd
35 EA Portland Cement Ltd
F ENERGY AND PETROLEUM
36 Kenol-Kobil Ltd
37 Total Kenya Ltd
FIRM AND SECTOR
38 KenGen Ltd
39 Kenya Power amp Lighting Co Ltd
40 Umeme Ltd
G INSURANCE
41 Jubilee Holdings Ltd
42 Pan Africa Insurance Holdings Ltd
43 Kenya Re-Insurance Corporation Ltd
44 Liberty Kenya Holdings Ltd
45 British-American Investments Company ( K) Ltd
46 CIC Insurance Group Ltd
H INVESTMENT
47 Olympia Capital Holdings Ltd
iii
48 Centum Investment Co Ltd
49 Trans-Century Ltd
50 Home Afrika Ltd
51 Kurwitu Ventures
I INVESTMENT SERVICES
52 Nairobi Securities Exchange Ltd
J MANUFACTURING AND ALLIED
53 BOC Kenya Ltd
54 British American Tobacco Kenya Ltd
55 Carbacid Investments Ltd
56 East African Breweries Ltd
57 Mumias Sugar Co Ltd
58 Unga Group Ltd
59 Eveready East Africa Ltd
60 Kenya Orchards Ltd
61 ABaumann CO Ltd
62 Flame Tree Group Holdings Ltd
K TELECOMMUNICATION AND TECHNOLOGY
63 Safaricom Ltd
iv
Appendix II Data Collection Form
Firm X (Indicate Firm name accordingly)
Part A FREE CASH FLOWS
Year
Net
Income
(PAT)
(a)
Depreciation
amp
Amortization
(b)
CAPEX
(crsquo)
Change
in non-
cash
working
capital
(d)
Net
borrowing
(ersquo)
Net
sales
(f)
FCF
= (a +
b ndash c -
d + e)
f
2006
2007
2008
2009
2010
2011
2012
2013
2014
2015
Non-cash working capital includes inventories financial assets held to maturity
receivables and prepayments (current assets) and payables accrued expenses and
current income tax liability (liabilities) For financial and investment firms non-cash
working capital includes prepaid lease rentals intangible assets deferred tax assets
retirement benefit assets and other assets (assets) and taxation payable dividends
payable deferred tax liabilities and retirement benefit liabilities
Net borrowings were determined by comparing current year and previous year long-
term loans
Net sales in case of insurance firms are the equivalent of ldquoNet premium revenuerdquo For
commercial banks it is ldquoTotal operating incomerdquo which is composed of net interest
v
income plus total non-interest income For investment firms it is ldquoIncomerdquo which is
comprised of rental income dividends and interest received and other incomes
PART B FINANCIAL PERFORMANCE
Year Equity Market Value (a) Equity Book Value (b) Tobinrsquos Q = a b
2006
2007
2008
2009
2010
2011
2012
2013
2014
2015
vi
PART C AGENCY COSTS
Year
1 Asset Utilization
Efficiency (AUE)
2 Production Cost Efficiency (PCE)
(a) Net
sales
(b) Total
assets
AUE
= ab
(c) Operating
expenses
(d) Net sales PCE=cd
2006
2007
2008
2009
2010
2011
2012
2013
2014
2015
Net sales in case of insurance firms are the equivalent of ldquoNet premium revenuerdquo For
commercial banks it is ldquoTotal operating incomerdquo which is composed of net interest
income plus total non-interest income For investment firms it is ldquoIncomerdquo which is
comprised of rental income dividends and interest received and other incomes
xii
PART D FIRM CHARACTERISTICS
Firm Size Firm Age
Year (a) Natural Log of Total Assets (b) Natural log of Age (Number of years
since incorporation)
2006
2007
2008
2009
2010
2011
2012
2013
2014
2015
Net sales in case of insurance firms are the equivalent of ldquoNet premium revenuerdquo For
commercial banks it is ldquoTotal operating incomerdquo which is composed of net interest
income plus total non-interest income For investment firms it is ldquoIncomerdquo which is
comprised of rental income dividends and interest received and other incomes

ii
DECLARATION
Declaration by the Candidate
This thesis is my original work and has not been submitted for an academic award in any
University
Signed ----------------------------------------------------- Date ----------------------------
Evans Agala Mutende
D80730402012
Declaration by the Supervisors
This thesis has been submitted for examination with our approval as University
supervisors
Signed ----------------------------------------------------- Date ----------------------------
Dr Mirie Mwangi
Department of Finance and Accounting
School of Business University of Nairobi
Signed ----------------------------------------------------- Date ----------------------------
Prof James Muranga Njihia
Department of Management Science
School of Business University of Nairobi
Signed ----------------------------------------------------- Date ----------------------------
Dr Duncan Elly Ochieng (PhD CIFA)
Department of Finance and Accounting
School of Business University of Nairobi
iii
COPYRIGHT copy
All rights reserved No part of this thesis may be reproduced or used in any form without
prior written permission from the author or the University of Nairobi except for brief
quotations embodied in review articles and research papers Making copies of any part of
this thesis for any purpose other than personal use is a violation of the Kenyan and
international copyright laws
iv
ACKNOWLEDGMENT
Praise be to God almighty who enabled me to go all the way and complete this work I
thank my supervisors Dr Mirie Mwangi Prof James Muranga Njihia and Dr Duncan
Elly Ochieng for their immense support and ensuring that I completed the course I also
thank Prof Erasmus S Kaijage Prof Kibera Dr Iraki Dr Mary Kinoti Dr Iraya and Dr
Josphat Lishenga for their invaluable input My appreciation also goes to Mr Eric Asuma of
the Nairobi Securities Exchange for availing and facilitating data collection Many people
who contributed to the successful completion of this work including Mr Johnstone Lukokolo
Mandila and Ms Miriam V Ongrsquoanyo I say thank you all
v
DEDICATION
I dedicate this work to my dear wife Naomi Khakasa daughter Marion Metah and son
Collins Agala for their encouragement To my dear parents Mr Andrew Mutende and Mrs
Elizabeth Mutende the sacrifice you made for me since 1979 when I joined Kakunga nursery
school to date is immeasurable All my brothers and sisters thank you so much for your
support
vi
TABLE OF CONTENTS
DECLARATION ii
COPYRIGHT copy iii
ACKNOWLEDGMENT iv
DEDICATION v
LIST OF TABLES x
LIST OF FIGURES xi
ABBREVIATIONS AND ACRONYMS xii
ABSTRACT xv
CHAPTER ONE INTRODUCTION 1
11 Background to the Study 1
111 Firm Performance 3
112 Free Cash Flows 6
113 Agency Costs 7
114 Firm Characteristics 9
115 Firms Listed at the Nairobi Securities Exchange 12
12 Research Problem 15
13 Objectives of the Study 19
131 Broad Objective 19
132 Specific Objectives 20
14 Research Hypothesis 20
15 Value of the Study 21
16 Operational Definition of Terms 22
161 Free Cash flows 22
162 Agency Costs 22
163 Firm Characteristics 23
164 Firm Performance 23
17 Organization of the Thesis 24
vii
CHAPTER TWO LITERATURE REVIEW 26
21 Introduction 26
22 Theoretical Foundation of the Study 26
221 Free Cash Flow Hypothesis 27
222 Agency Theory 28
223 Stakeholder Theory 29
224 Stewardship Theory 31
225 The Resource Based View Theory 33
226 Organizational Theory 36
23 Free Cash Flows and Firm Financial Performance 38
24 Free Cash Flows Agency Costs and Firm Financial Performance 40
25 Free Cash Flows Firm Characteristics and Firm Financial Performance 42
26 Free Cash Flows Agency Costs Firm Characteristics and Firm Financial Performance45
27 Summary of Knowledge Gaps 48
28 Conceptual Framework 55
29 Chapter Summary 56
CHAPTER THREE RESEARCH METHODOLOGY 57
31 Introduction 57
32 Research Philosophy 57
33 Research Design 59
34 Population of the Study 59
35 Data Collection 60
36 Reliability and Validity 60
361 Reliability Test 61
362 Validity Test 62
37 Operationalization of the Study Variables 63
viii
38 Data Analysis 66
39 Choice of Panel Data Analysis Model 67
391 Effect of Free Cash Flows on Financial Performance 68
392 Free Cash Flows Agency Costs and Financial Performance 68
393 Free Cash Flows Firm Characteristics and Financial Performance 70
394 Relating all the Variables 71
310 Chapter Summary 74
CHAPTER FOUR DATA ANALYSIS AND FINDINGS 74
41 Introduction 75
42 Pre-estimation Diagnostics 75
421 Normality test 75
422 Reliability Tests 80
423 Test for Linearity 81
424 Bartletts Test for Internal Consistency 82
425 Multicollinearity Test 83
43 Descriptive Statistics 85
44 Chapter Summary 86
CHAPTER FIVE TESTS OF HYPOTHESES AND DISCUSSION 87
51 Introduction 87
52 Correlation Analysis 87
53 Hypotheses Testing Using Regression Analysis 89
531 Free Cash Flows and Financial Performance 90
532 Free Cash Flows Agency Costs and Financial Performance 92
533 Free Cash Flows Firm Characteristics and Financial Performance 97
534 Free Cash Flows Agency Costs Firm Characteristics and Financial Performance
104
54 Discussion 107
ix
541 The Influence of Free Cash Flows on Financial Performance 107
542 The Influence of Agency Costs on the Relationship between Free Cash Flows and
Financial Performance 109
543 The Influence of Firm Characteristics on the Relationship between Free Cash
Flows and Firm Performance 110
544 The Joint Effect of Free Cash Flows Agency Costs and Firm Characteristics on
Financial Performance 112
55 Summary and Presentation of Empirical Models 115
CHAPTER SIX SUMMARY OF FINDINGS CONCLUSIONS AND
RECOMMENDATIONS 117
61 Introduction 117
62 Summary of Findings 118
63 Conclusions 120
64 Contributions of the Study 121
641 Contribution to Theory 121
642 Contribution to Policy 122
643 Contribution to Practice 123
65 Limitations of the Study 124
66 Recommendations of the Study 125
67 Suggestions for Further Research 126
REFERENCES 127
APPENDICES i
Appendix I Firms Listed at the Nairobi Securities Exchange as at December 31 2015 i
Appendix II Data Collection Form iv
x
LIST OF TABLES
Table 21 Summary of Knowledge Gaps 50
Table 31 Operationalization of Study Variables 64
Table 32 A Summary of Statistical Tests of Hypotheses 72
Table 41 Normality Test 76
Table 42 Reliability Scores for Individual Variables 81
Table 43 Test for Linearity 81
Table 44 Bartlettrsquos Test 83
Table 45 Multicollinearity Test 84
Table 46 Descriptive Statistics for Secondary Data ndash 2006 to 2015 85
Table 51 Pearson Product-Moment Correlations among the Dependent Independent
Intervening and Moderating Variables 88
Table 52 Panel Data Results for Free Cash Flows and Financial Performance 90
Table 53 Panel Data Results of Agency Costs as the Dependent Variable and Free Cash flows
as the Independent Variable 93
Table 54 Panel Data Results of Financial Performance as the Dependent Variable while
Agency Costs and Free Cash flows are the Independent Variables 95
Table 55 Panel Data Results for Financial Performance as the Dependent Variable and FCF
and Firm Age as the Predictor Variables 98
Table 56 Panel Data Results for Financial Performance as the Dependent Variable and FCF
and Firm Age as the Predictor Variables Centered Approach 99
Table 57 Panel Data Results for Financial Performance as the Dependent Variable and FCF
and Firm Size as the Predictor Variables 101
Table 58 Panel Data Results for Financial Performance as the Dependent Variable and FCF
and Firm Size as the Predictor Variables Centered Approach 102
Table 59 Panel Data Results for Free Cash Flows Agency Costs Firm Characteristics and
Financial Performance 105
Table 510 Summary of Tests of Hypotheses Results and Conclusions 114
xi
LIST OF FIGURES
ABBREVIATIONS AND ACRONYMS xii
Figure 21 Conceptual Model 55
Figure 31 Path Diagram for Mediation effect of Agency Costs 69
Figure 41 Q-Q Plot for Free cash Flows (2006 ndash 2015)77
Figure 42 Q-Q Plot for Agency Costs (AC) ndash 2006 to 2015 77
Figure 43 Q-Q Plot for Firm Characteristics (Firm Age) ndash 2006 to 2015 78
Figure 44 Q-Q Plot for Firm Characteristics (Firm Size) ndash 2006-2015 79
Figure 45 Q-Q Plot for Firm Financial Performance ndash 2006 to 2015 80
Figure 51 Revised Empirical Model ndash Financial Performance 116
xii
ABBREVIATIONS AND ACRONYMS
AFM Association of Futures Markets
AIMS Alternative Investment Market Segment
ANOVA Analysis of Variance
ASEA African Securities Exchanges Association
BSC Balanced Score Card
CAPEX Capital expenditure
CCP Central Counter Party
CG Corporate Governance
CMA Capital Markets Authority
CSR Corporate Social Responsibility
DA Discretionary accruals
DY Dividend yield
EMIR European Market Infrastructure Regulations
EASEA East African Securities Exchanges Association
FCF Free Cash flows
FISMS Fixed Income Securities Market
FOMS Futures and Options Market Segment
xiii
IAS International Auditing Standards
IDRC The International Development Research Centre
IFRS International Financial Reporting Standards
KMO Kaiser-Meyer-Olkin
MIMS Main Investment Market Segment
NACOSTI National Commission for Science Technology and Innovation
NASI Nairobi Securities Exchange All Share Index
NSE Nairobi Securities Exchange
NPV Net Present Value
OLS Ordinary Least Squares
OTC Over the Counter
PAT Profit after Tax
Q-Q Quantile ndash Quantile
RBV Resource Based View
ROA Return on Assets
ROE Return on Equity
SACCOs Savings and Credit Cooperatives
xiv
SPSS Statistical Package for the Social Sciences
SSE Sustainable Stock Exchanges
RampD Research and Development
TQM Total Quality Management
UK United Kingdom
USA United States of America
VIF Variance Inflation Factor
WFE World Federation of Exchanges
xv
ABSTRACT
Firm performance is affected by various factors both internal and external to the firm
Internal factors include factors such as firm size age liquidity leverage free cash flows
agency costs profitability and growth prospects among others External factors include
regulation and general macro-economic factors This research sought to find out the
influence of agency costs and firm characteristics on the relationship between FCF and
firm performance The first study objective was to establish how FCF influence
performance of NSE listed firms The second objective was to find out how agency costs
influence the relationship between FCF and performance of NSE listed firms Thirdly to
determine how firm characteristics influence the relationship between FCF and
performance of NSE listed firms and lastly to establish the joint effect of FCF agency
costs and firm characteristics on the performance of NSE listed firms The study used
secondary panel data which were obtained from 60 firms listed at the NSE Secondary
data was for the period 2006 to 2015 Multiple and simple regression analyses were
employed Results indicate that FCF have a positive statistically significant effect on
firm performance and also agency costs have a statistically significant positive
intervening effect on the relationship between FCF and firm performance Additionally
firm characteristics have a positive moderating effect on the correlation between FCF and
financial performance Finally FCF agency costs and firm characteristics have a positive
statistically significant joint effect on firm performance These findings are inconsistent
with the agency theory and the FCF hypothesis Conversely the findings seem to support
the stewardship theory The study therefore recommends that firm managers
shareholders practitioners the government and other regulators should enhance firm
monitoring because the benefits derived from investing therein seem to outweigh the
costs Further research needs to be conducted using longitudinal study design and also by
integrating the views of other practitioners in data collection rather than focusing on firm
managers only
1
CHAPTER ONE INTRODUCTION
11 Background to the Study
The separation of firm proprietorship and management in public firms causes conflict of
interest between firm owners (principals) and firm managers (agents) While the primary
incentive of firm owners is to maximize their wealth by improving firm value the goals
of firm managers are varied and may include enrichment of personal wealth and status
This varying of interests sometimes leads managers to engage in insider dealings where
there are no mechanisms for effective monitoring validation and approving of
managerial decisions (Wang 2010)
Jensen and Meckling (1976) argue that managers opt to extract personal gain from the
firms if they do not hold shares in those firms This has the effect of raising agency costs
which are manifested through investment choices that are not efficient and or managers
not providing sufficient or efficient effort Rising agency costs may eventually affect firm
performance (Tirole 1986) Brush Bromiley and Hendrickx (2000) also hypothesize that
managerrsquos personal-interest encourages wastage and wastefulness when free cash flows
(FCF) are present which similarly could increase agency costs and eventually affect firm
performance Firm characteristics such as profitability firm size liquidity leverage sales
growth age of the firm board structure and composition asset growth turnover
dividend payout and growth prospects are argued to have an influence on the correlation
between FCF and firm performance (Subrahmanyam amp Titman 2001 Kogan amp Tian
2012 and Mukras amp Nzioka 2015)
2
Brush et al (2000) observe that agency theory examines how the behavior of managers
could be focused towards shareholdersrsquo interests to minimize agency costs Jensen and
Meckling (1976) and Jensen (1986) describe three kinds of agency costs First the
monitoring cost of managersrsquo decisions second the bonding cost of restricting
covenants and lastly residual loss due to suboptimal managerial actions The goal of
managers is to enhance personal wealth to the detriment of shareholders The FCF
hypothesis posits that this personal-interest encourages wastage when FCF are present
The stewardship theory is in direct contrast to the agency theory It views managers as
stewards who guard and enhance the wealth of shareholders since by so doing utility
functions of the managers are enhanced (Davis Donaldson amp Schoorman 1997)
Stakeholder theory on the other hand views managers and shareholders among others as
stakeholders and can therefore influence or be influenced by the attainment of the goals
and objectives of the firm (Donaldson amp Preston 1995) The resource based view (RBV)
theory contends that financial firm performance is influenced by firm specific
characteristics (Pierce amp Robinson 2011) Organizational theory on the other hand
attempts to describe the effect of size and firm age on firm performance (Kaen amp
Baumann 2003)
Nyongrsquoo (2000) observes that Kenya has had challenges with regard to the agency
problem and corporate governance (CG) in general The result of these challenges has
been generally low firm profits Ongore and KrsquoObonyo (2011) also note that agency
problems were equally experienced across the globe Several cases of firm failures are an
3
indictment of the efficiency and effectiveness of the current CG structures which fail to
deter FCF related agency costs This research centered on the FCF hypothesis and
agency theory seeks to discover the way agency costs and specified firm characteristics
influence the correlation between FCF and the performance of Nairobi Securities
Exchange (NSE) listed firms Ayako Kungu and Githui (2015) observe that whereas
most NSE listed firms record good performance there are others that have presented
declining performance and yet others have even been delisted from the bourse during the
period between 2003 and 2014 Ongore and Krsquo Obonyo (2011) and Njuguna and
Moronge (2013) have attributed the decline during the period to the agency problem
111 Firm Performance
Gleason and Barnum (1982) define firm performance as a firmrsquos ability to achieve
planned outcomes as measured against projected outputs It encompasses outcomes
associated with shareholder return market performance and financial performance On
the other hand Daft (1995) defines firm performance as the ability to achieve objectives
by expending resources effectively and efficiently Firm performance may also be viewed
as incorporating specifically three areas of organizational outcomes shareholder return
financial return and market performance each with its specific indicators (Richard
Divinney Yip amp Johnson 1999)
Performance is an important concept that is at the centre of a firm and its measurement is
critical in determining whether the firm is achieving the desired objectives Market
performance is measured by assessing customer satisfaction customer retention value
4
delivered to customers and market share While the importance of firm performance is
broadly acknowledged debate on the bases for performance measurement still abound
Researchers should also use operational indicators in addition to using financial
indicators These may include product quality introduction of new products marketing
effectiveness and manufacturing value-addition which may replicate the firmrsquos
competitive position in its industry space and might influence financial performance In
operationalization of firm performance the use of multiple indicator approach would be
superior to the use of only a single indicator (Venkataram amp Ramanujan 1986)
Neely (1998) defined performance measurement systems as comprising of three
interrelated components specific measures that quantify the effectiveness and efficiency
of activities a set of measures that jointly evaluate firm performance as a whole and a
supportive structure that allows data to be collected organized examined deduced and
disseminated Performance measurement is therefore multidimensional On the other
hand Bourne Neely Mills and Platts (2003) describe it as the practice of measuring
effectiveness and the efficiency of an action Efficiency is a measure of how cost-
effective the resources of the firm are used when providing the specified customer service
while effectiveness is the extent to which customer needs are met
The Balanced Score Card (BSC) was developed by Kaplan and Norton (2001) and it
measures customer satisfaction financial performance growth perspectives learning and
of performance and efficiency of internal business processes The sustainable BSC has
been applied to integrate the social and environmental aspects into effective application
5
of both conventional firm strategy and explicit firm sustainability strategies (Figge Hanh
Schaltegger amp Wagner 2002)
The triple bottom line performance measurement integrates the corporate economic
environmental and social performance (Norman amp MacDonald 2004) while the
International Development Research Centre (IDRC) model conceives firm performance
in three general areas First is performance in actions that support the operation
(effectiveness) second is performance related to the available resources (efficiency) and
lastly performance is related to long-term capability or continuing relevance (Lusthaus
Anderson amp Murphy 1995) Other performance measurement techniques include the
Performance Prism and the Cambridge Performance Measurement Process (Neely
Adams amp Kennerley 2002)
Dyer and Reeves (1995) observe that there are no performance measures universally
appropriate and multiple measures should therefore be used Wang (2010) and Ongore
and KrsquoObonyo (2011) use ROA ROE and Dividend Yield (DY) to measure financial
performance Szewczyk Tsetsekos and Zantout (1996) and Mojtahedzadeh and
Nahavandi (2009) have used Tobinrsquos Q as a market-based measure of a firmrsquos financial
performance Tobinrsquos Q relates the market value of firmsrsquo equity with their
corresponding book values Employee job satisfaction employee turnover organizational
effectiveness and efficiency have been proposed by Gleason and Barnum (1982) as non-
financial measures of firm performance Hubbard (1998) observes a positive significant
6
correlation between FCF and performance which is manifested through prudent
investment
112 Free Cash Flows
The concept of FCF presented by Jensen (1986) refers to surplus cash available after
financing profitable ventures FCF are therefore described as net operating income minus
capital expenditure (CAPEX) minus cost of inventory and paid out dividends On the
other hand Brealey Myers and Allen (2005) describe FCF as net income profit after tax
(PAT) plus amortization and depreciation minus CAPEX minus changes in non-cash
working-capital add net borrowingsloans Richardson (2006) argues that firms which
have surplus funds risk wasting it in ventures that are not profitable and that because
FCF are financial resources at the managersrsquo discretion to apportion they are also
referred to as idle cash flows
FCF denotes funds that a firm is able to generate after setting aside cash needed to sustain
or increase its assets FCF are important because they allow firms to pursue investments
that could improve value to shareholders In the absence of funds it is hard to create new
products and services acquire new projects pay out dividends and pay debts Some
shareholders believe that FCF show a better perspective of the firmrsquos ability to create
profits because while earnings can often be misrepresented through accounting
gimmicks it is more difficult to fake FCF Positive FCF indicate that the firm is
generating more funds than are being used to run the firm and to reinvest Many small
firms do not have positive FCF because they invest heavily to grow their operations It is
7
worth-noting that generally negative FCF detrimental to the firm Negative FCF could
be an indication that the firm is engaged in huge investment projects If high returns are
earned from these investments then there is a long run potential payoff (Chen Sun amp Xu
2016)
Jensen (1986) argues that managersrsquo personal - interest motive leads to waste and
inefficiency when FCF are present because the objective of the managers is to increase
their personal wealth instead of shareholdersrsquo wealth Therefore when FCF are present
the result is internal inefficiency and wastage of firm resources which leads to increased
agency costs and lower firm performance Similarly Wang (2010) observes that in the
presence of surplus FCF managers tend to abuse the FCF resulting in inefficient resource
allocation and wrongful investment
113 Agency Costs
Agency costs refer to the cost that a firm incurs due to incongruent interests of firmsrsquo
management and shareholders (Berle amp Means 1932) Jensen and Meckling (1976) point
out that the incomplete manager and shareholder contractual relationship can result into
the agency problem The agency problem that is caused by the firm managers would
result in a loss to the wealth of shareholders in the following ways first managers from
the characteristic of personal-interest drive would raise perquisite consumption and
shirking behavior that in turn leads to increased agency costs Secondly managers might
fail to choose the highest Net Present Value (NPV) project and instead choose that which
maximizes their own personal interest thereby exposing shareholders to unnecessary
investment risk
8
Jensen (1986) claims that there are three kinds of agency costs the monitoring cost of
managersrsquo decisions the bonding cost of restricting agreementcontracts and the residual
loss due to suboptimal managersrsquo actions Monitoring costs are manifested once the
shareholders try to regulate or control the managersrsquo actions For example the auditors
are engaged by a firm on shareholdersrsquo behalf to check and control the managersrsquo
activities to confirm conduct that increases value for the shareholders The pricecost of
engaging the auditors is therefore considered an agency cost The bonding cost entails
bond covenants or contracts A bond covenant is an agreement that restricts the firm from
venturing in specified actions such as a limitation on dividend payment Firm claims
could be structured in a way that controls shareholdersrsquo motive to follow a strategy that
does not increase the total firm value This inherent cost is an agency cost And lastly
residual loss is the cost sustained from conflicting shareholder and manager interests
notwithstanding the use of monitoring and bonding (Smith amp Warner 1979)
Brush et al (2000) argue that once a firm has generated excess FCF management tends
to misuse the FCF resulting in increased agency costs which could eventually lower
firm performance Khidmat and Rehman (2014) on the other hand observe that agency
costs of monitoring could increase as a result of increased FCF and consequently improve
firm performance This is because the firm is able to invest in better CG mechanisms
which improve monitoring managerial decisions and hence reduced wastage Agency
costs are therefore expected to mediate the correlation between FCF and firm
performance because they are intermediate output of FCF Wang (2010) states seven
proxy agency cost measures earnings volatility total asset turnover floatation costs
9
advertising research and development (RampD) expenses to sales ratio operating expenses
to sales ratio free cash flows and administrative expenses to sales ratio
Tirole (1986) argues that there are two main ways through which agency costs are
manifested the first one is inefficient choice of investment and the second is insufficient
or inefficient effort spent by managers Therefore agency cost measures should be
contingent on inefficient asset utilization (due to poor investment choices) excessive cost
of production and extravagant perks for managers (which results in unnecessarily high
expenditure) and inefficient effort spent by managers (the results of which is lower
revenue and profitability) Asset utilization efficiency is measured by assets turnover
ratio which is described as the ratio of sales to assets It indicates the way managers use
the assets under their control in generating revenue Production cost efficiency on the
other hand is measured as operating expenses divided by sales Singh and Davidson
(2003) observe that a high level of operating expense is a close estimate of managersrsquo pay
and perquisites in terms of high salaries executive and lavish offices and other corporate
support amenities To a large extent these costs reflect discretionary expenditure at the
disposal of firm managers
114 Firm Characteristics
Zou and Stan (1998) define firm characteristics as a firmrsquos managerial and demographic
variables that in turn encompass part of the firmrsquos internal environment Firm
characteristics have been listed by Kogan and Tian (2012) to include firm size leverage
liquidity sales growth asset growth and turnover Others include ownership structure
board characteristics age of the firm dividend pay-out profitability access to capital
10
markets and growth opportunities (Subrahmanyam amp Titman 2001 and McKnight amp
Weir 2008)
Vogt (1997) argues that the more a firm has FCF the more it engages into capital
investment and hence the higher the performance Smaller firms gear towards rampant
growth thereby utilizing most or all the available FCF in a bid to better firm
performance The relationship between FCF and investment is stronger in small and
medium firms which generally are in the growth stage Adelegan (2009) on the other
hand notes that the influence of firm size is neutral and that firms that are older incline
more on internally generated funds to finance their business investments than small and
medium firms
Cline Williamson and Yore (2014) observe that the FCF problem seems to be intense in
medium and large multinationals that are less reliant on the capital market The smaller
firms that fund their investments with funds that are generated externally do not
experience such declines in wealth This is because firms that are larger have
considerably more FCF that are available and are subsequently less dependent on the
external market When high FCF are available the unconstrained manager may
socialistically fund investment projects that have a negative NPV Increased levels of
FCF lead to sub-optimal allocation of resources in form of value-destroying and cross-
subsidizing investment action that eventually deteriorates firm performance
Firm age and performance relationship is to a large extent driven by selection and
learning effects in the early stages of the firmrsquos life Once a firm is older the relationship
11
could be more indirect due to a correlation between age of the firm and ownership
changes product life cycle size of the firm and management Usually firms that are new
require time to adapt to the environment A new firm needs to catch up with an older firm
when the new firmrsquos performance is lower than that of the older (existing) firm so as to
be competitive in the market Therefore it is expected that firms that are new will show
higher growth rates in productivity than the older firms as a result of high FCF Hence
age of the firm is negatively correlated with productivity growth rate because older firms
have lower FCF (Brouwe Kok amp Fris 2005)
Similarly Cadogan and Diamantopoulos (1995) note that as firms become older and
more experienced they tend to be more bureaucratic and inflexible Demsetz and Lehn
(1985) denote firm size as the log of total assets and argue that in smaller firms agency
costs related to the FCF problem may be relatively lower than in larger firms because of
more growth opportunities available for smaller firms Larger firms tend to overinvest
thereby generating a relatively lower return on assets (ROA)return on equity (ROE)
Opler and Titman (1993) maintain that more likely firms that have high growth
prospects are managed better than those with less growth prospects Such firms are also
less likely to have surplus FCF since any available cash would be spent on projects that
have positive NPV Thakor (2013) further argues that foreign cash in firms that have
good growth opportunities should be valued significantly higher than foreign cash in
firms that have poor growth prospects since firms that have poor growth prospects are
more likely to be adversely affected by the repatriation tax burden and FCF problems
12
stemming from a relatively low shadow price of cash This further implies that foreign
cash for firms that have poor investment prospects ought to be valued at a discount while
foreign cash for firms that have good investment prospects should be valued at a
premium
Heydari Mirzaeifar Javadghayedi and Student (2014) postulate that firm characteristics
can expose a firm to more managerial costs and thus decrease the expected positive effect
of FCF on firm performance Firm characteristics are therefore expected to moderate the
correlation between FCF and firm performance because their interaction affects the
strength and or direction of the correlation between the dependent and independent
variables (Baron amp Kenny 1986) This study focused on firm characteristics of firm size
and age of the firm because their influence on the correlation between FCF and firm
performance seem to be more significant (Demsetz amp Lehn 1985 and Mule Mukras amp
Nzioka 2015)
115 Firms Listed at the Nairobi Securities Exchange
NSE is the primary stock market in Kenya Apart from equities the NSE deals with the
issue and trade of debt instruments NSE is a member of East African Securities
Exchanges Association (EASEA) and the African Securities Exchanges Association
(ASEA) and also an associate member of World Federation of Exchanges (WFE) a
subordinate member of the Association of Futures Markets (AFM) Additionally the
NSE is a partner Exchange in the United Nations Sustainable Stock Exchanges Initiative
(SSE) The NSE is a market for securities approved and controlled by the Capital
13
Markets Authority (CMA) and has 63 listed firms (Appendix I) Introduced in 2008 the
NSE All Share Index (NASI) is a general indicator of market performance The NASI
integrates all the daily transacted shares therefore giving the general outline of the value
of the market as opposed to the activities of selected securitiesrsquo prices The daily trading
volume of the market is valued at over US $5000000 and a total market capitalization
estimate of US $15000000000 Corporate bonds government bonds and equities are
also traded at the NSE (NSE 2015)
Odundo (2009) notes that as part of the NSE market transformation program the CMA
introduced market improvements in 2001 which led to the restructuring of the NSE into
four separate segments The Alternative Investments Market Segment (AIMS) Main
Investments Market Segment (MIMS) Fixed Income Securities Market Segment
(FISMS) and the Futures and Options Market Segment (FOMS) Development of the
capital market has remained Kenyarsquos strategic development goal since the mid-1980s
The government has realized significant reforms over the last three decades to underpin
the countryrsquos development prospects including modernization of the NSE which includes
computerization of trading divergence of listed securities and stocks dematerialization
and improvement of regulatory and supervisory structures The NSE is among the fastest
growing stock exchanges in the developing markets and is the largest in East Africa
(Ayako et al 2015)
The NSE (2015) indicates that Kenyarsquos capital market has continued to develop The
NSE signed up six clearing members as the exchange readied itself to introduce a
14
derivatives market These clearing members include Cooperative bank of Kenya
Barclays bank of Kenya NIC bank CBA and CFC Stanbic bank Other banks are slated
to sign up and the clearing members would by executing the principal role of clearing
and settling deals strengthen the NSErsquos abilities to begin derivatives trading The
derivatives mechanisms will primarily comprise currency futures and stock indices and
will work to expand liquidity in the market increasing the boursersquos product offer The
NSErsquos derivative market which received authorization from CMA will permit
derivatives that are exchange traded and created on various underlying financial
instruments that will include equities and currencies
The universal world norm has been a system of central counterparty (CCP) clearing and
reporting represented by the European Market Infrastructure Regulationsrsquo (EMIR) latest
rules Further to demanding central clearing of standardized Over-the-Counter (OTC)
derivatives that wasnrsquot the practice earlier EMIR presented other numerous processes to
minimize counterparty risk a significant matter which led to contagion in the recent
global financial crisis The NSE derivatives contracts will be exchange traded and
therefore clearing members will be critical components of the CCP clearing network
(NSE 2015) The CMA (2010) shows that as of 2008 the most actively traded market in
Africa was South Africa recording over 70 percent of the whole African securities
markets revenue making it the most liquid securities market in Africa with the NSE
ranking 5th
with 02 per cent contribution
15
The NSE listed firms were selected for this study because data is readily available and
also the data is generally deemed credible Ponnu and Okoth (2009) observe that several
challenges ranging from boardroom wrangles poor decision making lack of oversight to
control by various boards of directors and unethical practices have been evident among
the listed firms resulting in a trend of poor performance Similarly NSE (2015) shows
that several listed firms have previously been delisted liquidated or placed under
receivership on account of the agency problem
12 Research Problem
The FCF hypothesis suggested by Jensen (1986) states that firm managers may invest in
needless negative NPV projects when there is surplus FCF at their disposal The
hypothesis suggests that greater levels of FCF could lead to more unnecessary
administrative waste and inefficiency negatively impacting on firm performance
Demsetz and Lehn (1985) find that in the presence of substantial FCF large firms tend to
have fewer growth opportunities than smaller ones which could lead to an
overinvestment problem thereby negatively impacting on firm performance Similarly
Gul and Tsui (1998) note that an escalation in financial leverage seems to diminish
agency costs because managers are subject to legal bonding of repaying interest and debt
that subsequently decreases misuse of FCF and therefore improves firm performance
The agency problem accounting anomalies and other governance manipulations is a
worldwide phenomenon affecting many firms including Enron Corporation of the United
States of America (USA) and China Aviation (Ongore amp KrsquoObonyo 2011) The World
16
Bank (2000) indicates that the failure of major conglomerates such as the Bank of Credit
and Commerce International and WorldCom in the USA and United Kingdom (UK)
respectively has inspired interest in the agency problem and governance The economic
crisis in Asia has also contributed to the rising profile of the agency problem In the East
African region the agency problem and governance have been discussed in the
framework of state-run companies where corruption malpractice and subsidization of
deteriorating firms by the government have been the major issues of concerns The
Kenyan context has been characterized by appeals for active CG particularly for public
firms (Okiro 2014) The recent financial problems facing Fidelity commercial bank
Charterhouse bank Imperial bank and Chase bank could be related to the agency problem
between shareholders and firm managers (Central Bank of Kenya 2016)
Frentrop (2003) has recounted that there is still lack of consensus on identifying the
extent and dealing with the complications that are intrinsic in CG processes Waithaka
Ngugi Aiyabei Itunga and Kirago (2012) observe that FCF have caused conflict between
firm managers and shareholders which in turn have affected performance of NSE listed
firms Similarly Ongore and KrsquoObonyo (2011) noted existence of agency problems
among firms listed at the NSE which negatively affected their performance These
observations are consistent with Nyongrsquoo (2000) who posits that the low firm
performance across the Kenyan economy is primarily due to agency problems and bad
CG practices
17
Globally empirical literature shows mixed findings regarding FCF and firm performance
For instance Nekhili Amar Chtioui and Lakhal (2014) carried out a study in Australia
and found increased agency costs emanating from the presence of FCF Similarly Brush
et al (2000) conducted a study in the USA and found that weak CG caused inefficiency
in the allocation of FCF While these findings support the argument that FCF negatively
affects firm performance on the contrary Gregory (2005) whose study was carried out
in the UK established that the mergers with higher FCF were performing better than
mergers with lower FCF In addition a study by Szewcyzk et al (1996) in the USA
found that shareholders favored firms that had both significant FCF and investment
opportunities that were profitable Locally Wambua (2013) found a positive correlation
between FCF and performance of NSE listed firms which again invalidates the
hypothesis which states that there is a negative correlation between FCF and performance
of the firm Conversely Njuguna and Moronge (2013) found that agency conflicts within
firms listed at the NSE are related to FCF which negatively affects firm performance
Regarding the moderating effect of firm characteristics Hendricks and Singhal (2001)
found that smaller firms tend to have better performance in terms of higher sales growth
Similarly Kinoti (2012) found a statistically positive moderating effect of firm
characteristics (ownership age of the firm firm size and type of industry) on the
correlation between corporate image and performance of the firm Conversely Njeru
(2013) found that firm characteristics did not have a statistically significant moderating
effect on the correlation between market orientation and performance In view of these
18
contradicting results it was necessary to further investigate the moderating influence of
firm characteristics on the correlation between FCF and performance of the firm
Some prior studies portray or tend to equate FCF to agency costs For instance Jensen
(1986) presents his study as ldquoagency costs of FCF corporate finance and takeoversrdquo
while Lin and Lin (2014) describe their study as ldquoagency costs of FCF and biddersrsquo long-
run takeover performancerdquo Furthermore Wang (2010) mentions seven proxy measures
of agency costs and one of the proxy measures equates FCF to agency costs These
studies do not give a clear distinction between agency costs and FCF This study has
attempted to delineate FCF from agency costs and has also attempted to provide linkages
between all the study variables
Wang (2010) and Lin and Lin (2014) excluded CAPEX and net borrowings in their
operationalization of FCF This study included both CAPEX and net borrowings in the
definition of FCF Additionally unlike Njuguna and Moronge (2013) who used asset
utilization efficiency as the sole measure of agency costs this study also incorporated
production cost efficiency to measure agency costs that arise out of monitoring
managementrsquos actions These measures of FCF and agency costs are more robust
Furthermore some of the prior studies are bivariate For instance Njuguna and Moronge
(2013) and Wambua (2013) focused on the influence of agency costs on firm
performance In this study a multivariate analysis was employed where the joint effects
of FCF agency costs firm characteristics and firm performance were all incorporated
While many of the studies were carried out in developed economies such as Australia
19
France UK and the USA this study focused on firms listed at the NSE employing cross-
sectional and panel data research designs
In summary this study sought to fill the identified knowledge gaps which constitute the
research problem as follows first global empirical study findings are mixed and non-
conclusive This study therefore focused on firms listed at the NSE and used panel data
design Secondly the study sought to delineate FCF from agency costs Third the study
incorporated the major firm characteristics of firm size and age Fourth CAPEX and net
borrowings were incorporated in defining FCF Fifth two measures of agency costs were
incorporated and these are asset utilization efficiency and production cost efficiency
Lastly a multivariate study was adopted as opposed to bivariate This research was
guided by the following study question How significant is the influence of agency costs
and firm characteristics on the relationship between FCF and financial performance of
firms listed at the NSE
13 Objectives of the Study
The broad objectives and specific objectives of the study are here-below stated
131 Broad Objective
The broad objective of this research was to determine the effect of agency costs and firm
characteristics on the relationship between FCF and financial performance of firms listed
at the Nairobi Securities Exchange Kenya
20
132 Specific Objectives
i Establish the relationship between free cash flows and financial performance of
firms listed at the Nairobi Securities Exchange
ii Assess the influence of agency costs on the relationship between free cash flows
and financial performance of firms listed at the Nairobi Securities Exchange
iii Determine the influence of firm characteristics on the relationship between free
cash flows and financial performance of firms listed at the Nairobi Securities
Exchange
iv Establish the joint effect of free cash flows agency costs and firm characteristics
on financial performance of firms listed at the Nairobi Securities Exchange
14 Research Hypothesis
H1 Free cash flows have no significant effect on the financial performance of firms listed
at the Nairobi Securities Exchange
H2 Agency costs have no significant intervening effect on the relationship between free
cash flows and financial performance of firms listed at the Nairobi Securities Exchange
H3 Firm characteristics have no significant moderating effect on the relationship
between free cash flows and financial performance of firms listed at the Nairobi
Securities Exchange
H3a Firm age has no significant moderating effect on the relationship between
FCF and financial performance of firms listed at the NSE
21
H3b Firm size has no significant moderating effect on the relationship between
FCF and financial performance of firms listed at the NSE
H4 There is no joint effect of free cash flows agency costs and firm characteristics on
financial performance of firms listed at the Nairobi Securities Exchange
15 Value of the Study
This study was intended to provide insights into knowledge about how agency costs and
firm characteristics influence the relationship between FCF and the financial performance
of NSE listed firms This research examined the validity of the FCF hypothesis agency
theory stakeholder theory stewardship theory RBV theory and the organizational theory
and established linkages between these theories thereby interrogating existing
knowledge to affirm modify or reject it The research community in finance will benefit
from the study because it is intended to aggregate and provide important quantitative
literature that will bridge the existing knowledge gap regarding FCF agency costs firm
characteristics and financial performance of firms listed at the NSE It will also serve as
a foundation upon which more empirical studies will be built hence propagating
knowledge
This study sought to establish the correlation between FCF agency costs firm
characteristics and firm performance Investors firm managers and other practitioners
will benefit from the study because it delineates FCF from agency costs and also brings
out the linkages between FCF agency costs firm characteristics and firm performance
Firm managers are expected to act more prudently and efficiently in their pursuit of
maximizing shareholdersrsquo wealth through better firm performance Investors and other
22
practitioners will build on the understanding of the linkages between these variables to
help improve firm performance
The NSE and the listed firms have high growth potential given the various initiatives
being undertaken at the bourse such as demutualization restructuring and introduction of
derivatives trading The government NSE and CMA stand to benefit from this study
because the insights and intuitions gained from the study will help in the development
and improvement of existing policies guidelines and regulation
16 Operational Definition of Terms
The key study variables have been defined as follows
161 Free Cash flows
The term free cash flows refers to the sum of surplus funds available after funding
profitable projects This is described as net income plus depreciation and amortization
less capital expenditure less change in non-cash working capital plus net borrowing
(Brealey Myers amp Allen 2005)
162 Agency Costs
Agency costs refer to the cost that a firm incurs due to inconsistent interests of
management and shareholders (Berle amp Means 1932)
23
163 Firm Characteristics
Firm characteristics refer to a firmrsquos demographic and managerial variables which in turn
comprise part of the firmrsquos internal environment Firm characteristics include firm size
leverage liquidity sales growth asset growth and turnover age of the firm dividend
pay-out profitability access to capital markets and growth opportunities (Zou amp Stan
1998 Kogan amp Tian 2012 Subrahmanyam amp Titman 2001 and McKnight amp Weir
2008) This study focused on firm size and age of the firm
164 Firm Performance
In this research the term firm performance is used interchangeably with organizational or
corporate performance Firm performance refers to an assessment of an organization in
terms of its ability to achieve its stated objectives over a given period of time Firm
performance is broad and has to be studied with reference to its indicators A firm that is
able to meet its objectives is considered to be successful (Sagwa 2014) For this study
firm performance was measured in terms of financial performance
Financial performance perspective may be measured using Tobinsrsquo Q ROA ROE DY
sales growth rate market share productivity and profitability among others This study
used Tobinrsquos Q to measure financial performance Tobinrsquos Q compares the market value
of a firmrsquos equity with its corresponding book values
24
17 Organization of the Thesis
This thesis contains six chapters The first chapter has the introduction and background to
the study The NSE has also been discussed the research problem research objectives
value of the study scope and how the study is organized In chapter two the theoretical
framework on which the study is based has been discussed
The chapter reviews the theoretical and empirical literature relating to the linkages among
the study variables The theories reviewed are The free cash flow hypothesis agency
theory stakeholder theory stewardship theory RBV theory and the organizational
theory
Empirical literature has focused on the relationships among the variables as follows FCF
and firm performance FCF agency costs and firm performance FCF firm
characteristics and firm performance FCF agency costs firm characteristics and firm
performance A summary of knowledge gaps has been presented and finally the chapter
ends with the conceptual framework that guides the study and the conceptual hypotheses
Chapter three has identified and discussed the philosophical orientation the study design
and population of the study
Additionally it has highlighted data collection methods reliability and validity
considerations operationalization of the study variables and analytical data models
Chapter four presents the findings of the general data analysis starting with test of
25
validity and reliability then the descriptive statistics including frequency tables
percentages standard deviations means and Cronbachrsquos Alpha Coefficient of reliability
A presentation of the results of the test of hypotheses and interpretation has been featured
under chapter five The chapter has concluded by a discussion of the resultsfindings
Chapter six gives a summary of the findings conclusion study implications limitations
and recommendations for further studies
26
CHAPTER TWO LITERATURE REVIEW
21 Introduction
The chapter has explored the theoretical foundations of the study Empirical literature has
also been discussed under four sections as follows First FCF and financial performance
second FCF agency costs and financial performance third FCF firm characteristics
and financial performance and lastly FCF agency costs firm characteristics and
financial performance
This chapter also gives a summary of knowledge gaps a graphical framework of the
study variables (FCF agency costs firm characteristics and financial performance)
depicting the researcherrsquos conceptualization of the study It then concludes with the
conceptual hypotheses
22 Theoretical Foundation of the Study
The theoretical framework upon which this study is based is varied Six theories have
been discussed and these are FCF hypothesis agency theory stakeholder theory
stewardship theory RBV theory and the organization theory The research sought to
establish the influence of agency costs and firm characteristics on the correlation between
FCF and performance of NSE listed firms
Although the agency theory stakeholder theory stewardship theory RBV theory and the
organization theory contribute heavily in attempting to explain the interaction between
27
the identified variables and their combined effect on firm performance the FCF
hypothesis is the overarching theory on which this study is founded
221 Free Cash Flow Hypothesis
The notion of FCF was initially suggested by Jensen (1986) where FCF was described as
net cash flow after subtracting all the needs of positive NPV ventures Jensen (1986)
submits that when there are surplus FCF the severity of the agency conflict between firm
shareholders and firm managers is higher The reason for the conflict is that when there is
excess cash in the firm there is no need for the management to raise cash from the capital
market This gives firm management the freedom to spend invest without being
monitored by capital providers as would have been the case if such funds were raised
from the capital market Shareholders would rather have such excess funds distributed
back to them through share repurchase programs or as dividends if the growth
opportunities for the firms are limited and the funds could not be prudently invested
elsewhere Management on the other hand would waste the surplus funds in unprofitable
investments administrative waste and managerial perks
FCF hypothesis postulates that when firms have made significant FCF and the firms do
not have gainful investment projects available firm managers tend to misuse the FCF
which consequently raises agency costs Critics of the FCF hypothesis claim that it
nurtures short termism by discouraging investment that would bring profit in the long-
run This study is related to the FCF hypothesis because based on the observation by
Brush et al (2000) managersrsquo personal-interest inspires wastefulness and ineffectiveness
28
when there is surplus FCF This study sought to establish the influence of agency costs
and firm characteristics on the relationship between FCF and firm performance In this
study therefore it was expected that FCF would have a negative effect on firm
performance
222 Agency Theory
The agency theory was advanced by Jensen and Meckling (1976) and it avows that
shareholders who are the owners (principals) of the firm hire firm managers (agents)
The principal expects the agent to make decisions and act in the ownerrsquos principalrsquos best
interest The managers agents may however have self-interests that conflict with the
interests of the principals Brush et al (2000) observe that agency theory is founded on
the principle that the objective of the management is to achieve their individual interests
instead of shareholdersrsquo interests and that managersrsquo personal-interest encourages waste
and ineffectiveness when there are surplus FCF
Agency theory suggests mechanisms that aim to resolve the shareholder interests and
those of the management The mechanisms include external control measures like
takeovers (Easterwood 1997) The potential for conflict between shareholders and
managers may also be minimized by the use of internal control measures like non-
executive directorsrsquo monitoring and executive share ownership incentives The advocates
of agency theory postulate that control measures are mandatory for directing dishonest
managerial actions Critics on the other hand argue that control creates stronger personal
behavior lessens proactive organizational actions and honesty and lastly results in
suspicion (Jensen amp Meckling 1976)
29
Divergences in goals and attitude towards risk and decentralization in information are
tenets of the agency theory If the information asymmetry and conflict of interestsrsquo
assumptions and are allayed the agency problem then becomes inconsequential and not
of any interest scientifically If there were no information asymmetry the principal would
simply direct and control the agentrsquos actions and appropriately reward the agent If the
principal and the agent have consistent interests then the agentrsquos incentives are clear
(Podrug 2010)
A critique of the agency approach is that the analytical focus on how to resolve conflict
between the various stakeholders in the firm is too narrow and the shareholders are not
the only ones who make investment in the firm (Donaldson 1990) Additionally Hill
(1990) has argued that even in situations of very specific assets where the possibility of
unscrupulousness is very high there are people who will give precedence to collaboration
and trust and will not initiate opportunistic behavior Just like the FCF hypothesis this
research is related to the agency theory because it is centered on conflict of interests
between firm managers and shareholders One of the objectives of this study is to
determine the influence of agency costs on the relationship between FCF and firm
performance It was expected that the higher the agency costs the higher the effect on the
relationship between FCF and firm performance
223 Stakeholder Theory
Developed by Freeman (1984) stakeholder theory combines business accountability to a
wide collection of stakeholders The theory advances that the management of firms has a
30
network of relationships to serve in its stakeholdersrsquo circle in its achievement of
corporate goals The theory develops the understanding of corporate accountability to
include a broad collection of stakeholders such as customers suppliers business
associates employees government and its agencies financial institutions among others
A stakeholder is defined as any person or group which can influence or is influenced by
the attainment of the personrsquos or grouprsquos objectives
Mitchell Agle and Wood (1997) maintain that a stakeholder may be recognized by
looking at either one or two or all the associative aspects namely first the clout to impact
the firm secondly the legality of affiliation in or with the firm and lastly the
earnestness of their entitlement in or on the firm Unlike agency theory in which the
management work and serve the shareholders stakeholder theorists propose that firm
management has a relationships network for service and these include employees
business partners and suppliers Stakeholder theory attempts to address the collection of
stakeholders eligible and demanding managersrsquo attention (Sundaram amp Inkpen 2004)
Donaldson and Preston (1995) have argued that all stakeholders participating externally
or internally in the firm have an interest to fulfill This includes the characteristics and
behavior of firms incorporating how the firm is run how the board of directors thinks
about firm units the way management think about organization and the nature of the firm
itself In this regard the firm should strive to satisfy not only the welfare of its
shareholders but also the welfare of other relevant stakeholders Hence the board should
ensure that the firm acts on opportunities that enhance value to all the relevant
31
stakeholders and also prevent bad management practices that may expose the firm to
scandals or risk financial distress To achieve these the board should consist of more
members with diverse competencies experience as well as capabilities that will
effectively discharge its governance function
The stakeholdersrsquo model has been criticized by Donaldson and Preston (1995) arguing
that managers may use ldquostakeholderrdquo reasons to justify poor performance Mansell (2013)
has also critiqued the stakeholder theory stating that by using the political notion of a
lsquosocial contractrsquo to the firm stakeholdersrsquo theory weakens the values upon which a
market economy is founded The stakeholder theory is relevant to this study to the extent
that shareholders and firm managers are considered as lsquostakeholdersrsquo and therefore can
influence or are influenced by the accomplishment of the organizationrsquos goals This
theory implies that the relationships of the variables in this study can take any direction
positive negative or no relationship
224 Stewardship Theory
Developed by Donaldson and Davis (1991) stewardship theory has its origins in
sociology and psychology A steward guards and strives to maximize the shareholderrsquos
interests through firm performance since in doing so the value of the steward is also
maximized From this perception the steward is the firm management who work for the
shareholders defending and making returns for them Stewardship theory emphasizes the
role of firm management being stewards incorporating their objectives as part of the
firm Therefore as stewards they are contented and encouraged when the firmrsquos success
is accomplished The stewardship theory is quite the opposite of the agency theory It
32
submits that firm managers are honest and upright stewards of the assets delegated to
them under their care and thus making monitoring useless The theory opposes the
agency theory which assumes that managers will act to satisfy their own self-interest
rather than that of the firm Rather stewards who are managers executives and board of
directors are satisfied and motivated when firm objectives are achieved (Donaldson amp
Davis 1991 and Davis et al 1997)
Davis et al (1997) argues that stewards derive greater utility at personal level by
satisfying firm objectives than through self-serving behavior and as such the managers
and directors are also concerned about their personal reputation as expert decision
makers which drives their effort towards better firm performance of the firms they serve
According to the stewardship theory other non-financial motivations such as need for
accomplishment and gratitude personal fulfillment gained by successful achievement of
the goals of the firm respect for authority and peers as well as the firmrsquos work ethics do
impact on the actions of the stewards Superior firm performance is connected to having
majority of inside directors as opposed to external directors since inside directors know
the firm better and are better placed to manage than outside directors
Daily Dalton and Cannella (2003) discern that in order to guard their reputation as
decision makers in firms firm managers are motivated to run the firm with the main
objective of maximizing firm performance Similarly Fama (1980) suggests that firm
managers are also protecting their careers so as to be seen as efficient and effective
stewards of their firms Davis et al (1997) have critiqued the stewardship theory arguing
33
that the role of the lsquostewardrsquo is over-simplified and impracticable and that the theory
emphasizes the personalities and egos of senior directors The stewardship theory is
related to this study to the extent that firm managers are considered lsquostewardsrsquo who act on
behalf of shareholders Just like the stakeholder theory stewardship theory adds value
especially in explaining outcomes where the FCF hypothesis and agency theory are not
supported Since this theory emphasizes the role of firm managers being that of stewards
it was expected that the higher the FCF the higher the firmrsquos performance
225 The Resource Based View Theory
RBV is defined by Pearce and Robinson (2011) as a way of examining and recognizing a
firmrsquos strategic advantages based on observing its distinct mix of skills assets
intangibles and capabilities The RBV theory is concerned with internal firm-specific
factors and their effect on performance Grant (1991) observes that RBV theory views the
firm as a bundle of resources that are combined to generate firm capabilities which it can
use to earn above average profitability Every firm develops capabilities from these
resources and when they are well established these become the basis of the firmrsquos
competitive advantage Penrose (1959) explains the significance of exceptional
packagesbundles of resources controlled by the firm which are critical for performance
These firm resources comprise of tangible assets all capabilities attributes of the firm
organizational processes knowledge and information controlled in order to expand
competence effectiveness and efficiency that will in general lead to greater financial
performance
34
Resources are defined as firm capabilities physical assets and intangibles that are semi-
permanently tied to the firm (Wernerfelt 1984) Barney (2002) observes that the RBV
competitive advantage stems from a firmrsquos unique assets and distinctive capabilities and
assumes that firms can be hypothesized as bundles of resources and that those resources
are heterogeneously dispersed across the firms with resource variances persisting over
time Similarly Baker and Sinkula (2005) note that RBV of the firm suggests that
performance is contingent on the firmrsquos competences and specific resources
The thirst to understand the effects of firm level characteristics on financial performance
has been debated a lot in the research arena Among the arguments presented is that a
firmrsquos financial performance is affected only by structural characteristics within the
industry The other argument is that a firmrsquos financial performance is affected by firm
specific resources Much focus has been given to the firm level characteristics as opposed
to the industry level characteristics because it forms the basis upon which the firms
compete The industry related factors is majorly explained by the competitive focus
approach The RBV theory explains the effect of firm characteristics which are internal
factors to the firm with respect to financial performance (Bain 1959 and Porter 1980)
Researchers have carried out studies to test which of the two commonly disputed factors
(industry factors or firm specific factors) are important in explaining variations in firm
performance Wernerfelt and Montgomery (1985) Schmalensee (1985) Rumelt (1991)
Chang and Singh (2000) and Hawawini Subramanian and Verdin (2003) performed
variance component analysis test to establish the percentage of effects of firm
35
characteristics and industry factors on firm performance as measured by ROA Under the
RBV the firm is seen to be heterogeneous and firms possess a combination of unique
capabilities and assets that are responsible for giving them an upper hand in competition
and enable them achieve superior performance
Wernerfelt (1984) was the earlier supporter of the RBV theory but he did not get much
attention at the time However scholars such as Grant (1991) Stalk Evans and Schulman
(1992) and Williams (1992) revisited Wernerfelt (1984) and found that firms with
particular set of skills and capabilities outperformed their rivals Wernerfelt (1984)
describes a resource as ldquoanything that could be deemed as a strength or weaknessrdquo
According to the RBV of the firm resources (which are inputs for the production of
goods and services) and organizational competences (intangible assets that are founded
learning skills and knowledge in deploying resources) can be sources of competitive
advantage The RBV is criticized for its failure to describe how these resources are
established and organized to realize competitive advantage RBV has also been critiqued
for its inability to contemplate the effect of a dynamic market environment (Lengnick-
Hall amp Wolff 1999 and Priem amp Butler 2001)
Another criticism of the RBV theory is that researchers only concentrate on one resource
type that is intangible assets within a single industry and examine its effect on firm
performance The RBV theory helps in explaining performance variation of intra industry
firms as it specifically addresses firm characteristics rather than industry factors
Financial resources are normally measured by leverage ratios which enable the firm to
36
increase its project financing by borrowing from debt providers Liquidity measures
spontaneous financial resources available to conduct normal business operations
Physical resources as measured by the size of assets is one of the tangible resources the
firm can use to gain competitive advantage while business experience of the firm and
serving board of directors give the firm organizational capabilities that it can use to gain a
competitive advantage over its competitors thus being able to earn an above average
financial performance
The boards of directors are viewed as strategic resources that are responsible for the
advancement of the firms to meet their long-term objectives (Kapelko 2006) RBV is
related to this study because it maintains that a firmrsquos financial performance is influenced
by firm specific characteristics (which are one of the study variables) Based on the RBV
therefore it was expected that the higher the FCF the higher will be firm performance
Firm characteristics were expected to provide an interaction which statistically affects the
strength and or direction of the correlation between FCF and firm performance
226 Organizational Theory
Kaen and Baumann (2003) in an attempt to explain firm size came up with the
organizational theory that explains firm size in relation to profitability as well as
organizational transaction costs agency costs and span of control costs Organizational
theory explains the effect of firm size and age of the firm on firm performance Dean
Robert and Bamford (1998) cite that the size of the firm is somewhat correlated to firm
performance because of concentration industry-sunk costs overall industry profitability
37
and vertical integration Firm size matters in assessing financial performance Large-sized
firms have greater number of departments multi-layer levels of management have more
specialized functions and skills greater formalization and management control is highly
centralized which makes them highly bureaucratized than small-sized firms effectively
making them miss out on profitable opportunities that require urgent attention (Daft
1995)
Hannan and Freeman (1984) Aldrich and Austen (1986) and Meyer and Zucker (1989)
have linked firm size and age of the firm to Inertia Inertia is described as an insufficient
or sluggish adjustment to transformation or opposition to major variations in business
operations which in effect may cause the firm to miss profitable opportunities
Stinchcombe (1965) claims that firms that are older seem to be more experienced and
enjoy the benefits of improvement curve effect which makes them not to be exposed to
the problems of newness and hence enjoy above average performance
Penrose (1959) argues that larger firms are able to generate superior performance because
they have diversified capabilities ability to fully exploit economies of scale and scope
Such firms have formalized procedures of conducting business which ultimately makes
implementation of operations more effective On the contrary Leibenstein (1976) and
Shepherd (1986) argue that firm size is correlated with market power and along with
market power inefficiencies are created leading to inferior performance Thompson and
McHugh (2002) have critiqued the organization theory regarding it as being essentially
38
prescriptive There is an implied belief in underlying values or laws that govern
managersrsquo activities and functions
Another weakness of the organization theory cited by Salaman (1979) is the assumption
that all firms are in some way alike arguing that some firm analysts develop propositions
about firms in general lumping together such dissimilar examples as voluntary
establishments charities and political associations Salaman (1979) observes that it
hinders the analysis of those organizational elements which are radically exposed in
employing firms and not necessarily in all forms of organization Organizational theory
is related to this study because it explains the effect of firm size and age of the firm
(which are firm characteristics) on firm performance These are integral variables in this
study Since the theory cites conflicting views for instance bureaucracy in larger firms
which negatively affects performance on the one hand and economies of scale and
diversified capabilities in larger firms which positively affect firm performance on the
other hand it was expected that the relationship among the study variables would take
any direction Firm characteristics would moderate the relationship between FCF and
firm performance by statistically influencing the strength and or the direction of the
correlation between the predictor and explanatory variables
23 Free Cash Flows and Firm Financial Performance
Wang (2010) studied the impact of FCF on firm performance with empirical data from
Taiwan Stock Market for the period 2002 to 2007 Using a sample of 505 firms
regression analysis was employed in data analysis The study found that FCF had
39
statistically significant effects on firm performance These effects were however
conflicting On the one hand the presence of high FCF escalated imprudent expenditures
that consequently lowered firm performance The results indicated on the other hand that
FCF were generated due to managersrsquo efficiency in operations implying that a positive
correlation between FCF and firm performance
However in his definition of FCF Wang (2010) did not take into account CAPEX and
net borrowings which are critical in the FCF definition Additionally the study focused
on financial performance only The findings by Wang (2010) are partially consistent with
results by Gregory (2005) who studied the long run abnormal performance of UK
acquirers and the correlation between FCF and firm performance Gregory (2005)
established that mergers with greater FCF achieved better than those with lesser FCF
While testing the hypothesis the study used ldquolong term returnsrdquo and also ldquoanalyzed
announcement month returnrdquo However the study did not include daily returns around
announcement which could probably yield different results Furthermore the study
focused on financial performance outcomes only
Brush et al (2000) studied the proposition that sales growths in firms with FCF were less
lucrative than sales growths for firms with lower FCF Data was obtained from firms in
the USA covering eight years 1988 to 1995 and used Tobinrsquos Q to ascertain whether
firms had positive NPV projects available to determine FCF Returns to shareholders
were used as a performance measure The use of shareholder returns was criticized by
Bromiley (1990) because it assumes capital market efficiency which argues that the
returns to a large extent reveal surprises to the market Therefore if the markets expect
40
firmsrsquo sales growths and profitability even very profitable sales growths should not be
reflected in shareholder returns in the periods in which they arose The study found that
firms with higher FCF achieve lower from sales growth than those without or with lower
FCF Since sales growth is a measure of firm performance these findings support the
argument that FCF negatively affects firm performance
The findings by Wang (2010) and Gregory (2005) on the one hand and Brush et al
(2000) on the other hand reveal inconsistencies These contradictions indicate that the
correlation between FCF and firm performance is still unresolved In this study a more
robust measure of FCF was adopted For instance Wang (2010) measured FCF as net
operating income before depreciation minus tax expense minus interest expense minus
share dividends scaled by net sales In this study FCF are defined as in Brealey et al
(2005) as net income add amortization and depreciation minus CAPEX less change in
non-cash working-capital plus net borrowing The study is therefore expected to yield
more reliable and robust results
24 Free Cash Flows Agency Costs and Firm Financial Performance
Lin and Lin (2014) investigated the agency costs of FCF and biddersrsquo long-run takeover
performance in Australia using data for the period 1993 to 2000 The final sample
included 556 acquiring firms The study introduced two proxies of FCF excess
accounting cash flow and excess cash holdings and tested the relationship between
biddersrsquo long-run post-acquisition performance and the level of excess cash The findings
41
indicated that the level of excess cash holdings didnrsquot show a substantial reason for the
cross-sectional disparity in long-run post-acquisition performance
The findings from the flow measure of cash indicated that the acquisitions done by
bidders with surplus accounting cash flow didnrsquot escalate agency costs and therefore were
not value reducing Rather bidders with greater surplus accounting cash flows had better
long-run post-acquisition performance The findings therefore indicate that the
examination of FCF hypothesis in the Australian takeover market is conflicting to the
expectations of the FCF theory This finding is contrary to the argument that substantial
FCF increases agency costs which subsequently negatively impacts on firm performance
However Lin and Linrsquos (2014) definition of FCF ignores CAPEX and net borrowings
which are critical variables
Nekhili et al (2014) analyzed the intervening effect of agency costs of monitoring and
ownership structures in reducing earnings management practices when there is FCF The
sample comprised of 85 French listed firms for the period 2001 to 2010 The results
highlighted the unscrupulous managerial behavior in the presence of high FCF The study
measured FCF by multiplying the retained cash flows by the inverse of Tobinrsquos Q
However like in Lin and Lin (2014) CAPEX and net borrowings were omitted in the
definition of FCF The findings indicated that firms which had high FCF tended to
upwardly manage their earnings Additionally with the availability of high FCF the
tendency of firm managers to use discretionary accruals depended on the firm ownership
and the efficiency and effectiveness of governance mechanisms Precisely independence
42
of audit committees and external audit quality together with firm ownership structure (for
example institutional investors and executive ownership) reduced the extent of earnings
management when FCF were available
Conversely independent directorsrsquo ownership and board independence had no significant
effect on earnings management The results indicate that firm executives employ earnings
management practices that escalate reported earnings This implies that there are
increased agency costs emanating from the presence of high FCF subsequently
negatively affecting firm performance The negative effect of agency costs on the
correlation between FCF and firm performance is also supported by Brush et al (2000)
These results are of interest to this study because the research tried to find out the effect
of agency costs and firm characteristics on the correlation between FCF and performance
of NSE listed firms Agency costs are expected to mediate the correlation between FCF
and firm performance because they are the intermediate output of FCF
25 Free Cash Flows Firm Characteristics and Firm Financial Performance
Demsetz and Lehn (1985) studied the firm characteristics that included structure of
corporate ownership and firm size using 511 firms in the USA Size of the firm was
measured by the mean annual common stock market value and the study period was
1976 to 1980 Ordinary least squares (OLS) regression estimates were employed in data
analysis The findings suggest that in the presence of substantial FCF large firms tend to
overinvest thereby yielding relatively lower performance Large firms tended to have
fewer growth prospects than smaller firms and in the absence of good growth prospects
43
an overinvestment problem is likely to arise thereby negatively impacting on the firmrsquos
performance However the choice of a five-year study period seems too short Literature
indicates that 7 to 10 yearsrsquo study period is preferred (Brush et al 2000 and Nekhili et
al 2014)
In examining the degree of firm level over-investment of FCF Richardson (2006) used
an accounting-based structure to measure over-investment and FCF and confirmed that
over-investment was dominant in firms with the greatest FCF levels The study was
carried out in the USA and used a sample of 58053 firms for the period 1988 to 2002
The study also examined whether there was any association between firmsrsquo governance
structures and FCF over-investment The empirical analysis employed two steps In the
first step the study used an accounting-based structure in measuring both over-
investment and FCF The study defined FCF as cash flow over and above what was
needed to sustain assets in place and to fund new investment projects On the other hand
over-investment was described as investment expenditure over and above that needed to
retain assets in place and to fund probable new investments In measuring over-
investment the study decomposed total investment outlay into two component parts
First it needed investment spending to sustain assets in place and secondly investment
spending in new projects
In the next step the study decomposed investment expenditure into expected investment
outlay and over-investment in negative NPV projects where the latter varied with the
firmrsquos growth prospects industry affiliation funding constraints and other aspects
44
Although the study incorporated the firm characteristics of size liquidity and growth
prospects it focused on financial performance measures only Furthermore the study
excluded age of the firm Results suggest that some governance mechanisms like the
existence of shareholders who are activists seem to lessen over-investment Additionally
firm performance in the presence of FCF was found to be lower in firms with higher
liquidity than those with lower liquidity The findings are consistent with Harford (2002)
who found that cash-rich firms were more probable to undertake acquisitions that
consequently suffer abnormal failures in operational performance
Brouwer et al (2005) investigated whether age of the firm accounted for productivity
differences Data was obtained for the period 1994 to 1999 and the focus was on Dutch
firms Although the dataset included firms from all age cohorts (0-4 years and 5-9 years)
the study focused more on firms of at least 10 years of age Using regression methods the
results showed very few signs of a relationship between productivity (performance) and
age Both growth rate and level of productivity varied between sectors and also differed
with size of the firm There was also no indication that productivity growth rate was
related to the age of the firm On productivity level there were very few signs of the
effects of age The Brouwer et al (2005) study did not fully exploit the panel structure of
the dataset that was available The explicit techniques of estimation that take account of
this structure such as multilevel or panel data estimation techniques are expected to be
more effective
45
Conversely Power (1998) found a negative relationship between the growth rate of
productivity and age at a certain phase in the firmsrsquo lifespan Power (1998) examined the
relationship between plant age and productivity for firms in the manufacturing industry of
the USA for the period 1972 to 1988 The study found that productivity growth rates
decline with age which was credited to the effects of learning Firm characteristics are
expected to moderate the correlation between FCF and performance because their effect
is statistically characterized as an interaction affecting the strength and or direction of
the correlation between FCF and firm performance (Baron amp Kenny 1986)
26 Free Cash Flows Agency Costs Firm Characteristics and Firm Financial
Performance
Investigating the agency costs of FCF corporate finance and takeovers Jensen (1986)
sampled top 200 firms in the oil industry in the USA and found a link between the agency
problem with FCF firm characteristics and firm performance Using regression methods
results suggest that firm managers might misappropriate FCF at their disposal when the
firm does not readily have viable investment opportunities and that agency costs are high
when FCF are combined with poor growth prospects Results also indicate that more debt
would increase efficiency by compelling firms with large FCF but few high-return
investment projects to pay back cash to the creditors Leverage helps in preventing such
firms from misappropriating resources on low-return projects
For industries that are declining within the industry mergers would generate value while
outside industry mergers would likely generate lesser value or negative-returns Mergers
46
within the food industry seemed to reflect the spending of FCF The industry seemingly
generated large cash flows with few growth prospects The findings however seem to be
contradicting because they also indicate that increased leverage escalates agency costs
As leverage increases the typical agency costs of debt rise which include bankruptcy
costs that subsequently negatively affects firm performance
Mojtahedzadeh and Nahavandi (2009) investigated the relationship between agency
problems that arise due to FCF with long term profitability and income management
Using Tobinrsquos Q to measure long term profitability and Adjusted Jones Model to estimate
Discretionary Accruals (DA) panel analysis was used to analyze the data Results from
testing 106 firms listed on Tehran Stock Exchange throughout the years 2003 to 2007
reflect that agency costs emanating from the availability of substantial FCF negatively
affect both long term and short term profitability However the five-year period of study
seems too short and also non-financial performance outcomes were ignored in the study
Similarly Nunes Serrasqueiro and Sequeira (2009) investigated 75 Portuguese service
oriented firms to establish the effect of firm size on profitability (performance) They
introduced control variables of growth prospects leverage liquidity and asset structure
(tangibility)
The study used both dynamic estimators and static panel models Results indicated a
positive statistically significant correlation between firm size and performance They
also found a positive effect of growth prospects and liquidity on profitability but a
negative effect on leverage and asset tangibility on profitability as measured by ROA
47
Results also indicated that substantial FCF negatively affected profitability of the firm
The data employed was for the period 1999 to 2003 a duration which seems too short A
longer study period of seven to ten years would probably yield different results
Milne Purda and Anand (2008) used 1200 Canadian firms for the period 1999 to 2003 to
test the hypothesis that independent boards are more prone than non-independent boards
to willingly embrace mechanisms intended to improve their ability to monitor firm
management The study examined seven mechanisms both in aggregate and individually
through construction of an index that allocated one point for each mechanism embraced
up to a maximum of seven points and conducted multivariate regression analyses in
which the explanatory variable was either the full or the reduced index
Results indicate that the board of directors vigorously monitors decision makers who
have an inclination towards diverting firm resources to their own personal interests as a
consequence of the agency problem and FCF hypothesis thereby negatively impacting on
firm performance The findings also offer evidence that a relatively large number of
acclaimed monitoring mechanisms have been embraced by firms and that the acceptance
rate increases for firms with both independent and executive boards However the Milne
et al (2008) study didnrsquot integrate alterative views for the board of directors such as
influencing management decisions using the advisory role The study also ignored
procedures other than board monitoring that may serve to lessen agency costs
48
Locally Wambua (2013) examined the effects of agency costs on performance of NSE
listed firms The study used regression analysis and results indicated a positive
correlation between FCF and firm performance Furthermore the study found that
liquidity firm size and ownership concentration positively influenced performance of the
listed firms However the study did not incorporate firm age Conflicting results were
found by Njuguna and Moronge (2013) who studied the influence of managerial behavior
of agency costs on performance of firms listed at the NSE Using descriptive research
methodology results indicated that information asymmetry is a source of agency costs
and that agency problems are usually related to FCF In operationalizing the agency costs
however Njuguna and Moronge (2013) used total asset turnover as the only measure of
agency costs and also focused on financial outcomes only
To fill these knowledge gaps this study used two measures to fully integrate agency
costs The two agency cost measures used in this study are operating expenses to sales
ratio and sales to assets ratio These two measures are better measures of agency costs
because they tend to incorporate managerial asset utilization efficiency and production
cost efficiency (Singh amp Davidson 2003 McKnight amp Weir 2008 and Fauver amp
Naranjo 2010)
27 Summary of Knowledge Gaps
Empirical literature shows mixed findings regarding FCF agency costs firm
characteristics and firm performance For instance Jensen (1986) found a negative
correlation between FCF and firm performance results suggesting that management
49
might abuse FCF at their disposal Similar findings are recorded by Brush et al (2000)
Mojtahedzadeh and Nahavandi (2009) Wang (2010) Wambua (2013) Njuguna and
Moronge (2013) and Nekhili et al (2014)
Gregory (2005) on the other hand established that mergers that had a greater degree of
FCF performed better than those with lower FCF Similarly Szewcyzk et al (1996) and
Chang et al (2007) find that investors favored firms with both profitable investment
opportunities and significant FCF Likewise Lin and Lin (2014) established that the
acquisitions made by bidders with surplus FCF were not value decreasing Instead
bidders with higher excess FCF had better long-run post-acquisition performance
This research attempted to fill the following knowledge gaps first the influences of
agency costs and firm characteristics (firm size and age of the firm) on the correlation
between FCF and financial performance of the firm were all integrated Secondly FCF
were measured more robustly by incorporating CAPEX and net borrowings Thirdly
unlike in prior studies such as Wang (2010) and Njuguna and Moronge (2013) which
only focused on asset utilization efficiency to measure agency costs this study employed
two different measures for agency costs First is the asset utilization efficiency and
second is the production cost efficiency The two measures are better because they tend
to fully integrate agency costs Lastly the study used cross-sectional panel data design
The study therefore sought to affirm modify or reject existing empirical literature by
bridging the gaps identified in prior studies
50
Table 21 Summary of Knowledge Gaps
Researcher(s) Focus of Study Methodology Findings Knowledge Gaps How this Study
Addressed Gaps
Demsetz and
Lehn (1985)
Structure of corporate
ownership Causes and
consequences
The study
employed OLS
regression
estimates with
sample of 511
firms in the USA
In the presence of
substantial FCF
large firms tend to
overinvest thereby
negatively
impacting on firm
performance
The study
considered a five-
year period which
seems too short and
the focus did not
include FCF and
agency costs
This study employed
a ten year period
focused on FCF
agency costs firm
characteristics and
performance of firms
listed at the NSE
Jensen (1986) FCF agency costs
corporate finance and
takeovers
The study used
regression analysis
on 200 firms in the
oil industry in the
USA
Managers might
misuse FCF at their
disposal when
investment
opportunities are
not available
The study did not
incorporate firm
characteristics
This study included
firm characteristics
(age and size)
Szewcyzk et
al (1996)
The role of investment
opportunities and FCF in
explaining RampD induced
abnormal returns in the
Used regression
analysis and
measured
performance using
Shareholders
favored firms that
had both high FCF
and profitable
Focus variables
omitted agency
costs
The variables for this
study are FCF
agency costs firm
characteristics and
51
Researcher(s) Focus of Study Methodology Findings Knowledge Gaps How this Study
Addressed Gaps
USA firms Tobinrsquos Q investment
opportunities
firm performance
Gul and Tsui
(1998)
Tested the hypothesis
that FCF and director
stock ownership
interaction was less
likely to occur for firms
with high levels of
leverage
Studied 157 low
growth Australian
firms and used
OLS regression
analyses
Results suggested
that an increase in
financial leverage
seemed to reduce
agency costs
The study ignored
the influence of
liquidity and also
focused on low
growth firms only
This study focused on
firm characteristics of
firm size and age of
the firm
Brush et al
(2000)
FCF hypothesis for sales
growth and firm
performance The study
was conducted in the
USA
Study used
regression analysis
with performance
measured using
Tobinrsquos Q and
shareholder return
Firms with high
FCF perform
poorly and also
weak CG caused
inefficiency in the
allocation of FCF
CAPEX and Net
borrowings were
omitted in FCF
definition
This study included
CAPEX and net
borrowings to
measure FCF
Gregory
(2005)
Long run abnormal
performance of UK
acquirers and the
correlation between FCF
and firm performance
Used long term
returns and
analyzed
announcement
month return
Mergers with
greater FCF
performed better
than firms with
lower FCF
The study did not
incorporate firm
characteristics and
agency costs
The study
incorporated agency
costs and firm
characteristics (age
and size)
52
Researcher(s) Focus of Study Methodology Findings Knowledge Gaps How this Study
Addressed Gaps
Richardson
(2006)
Firm level over-
investment of FCF for
firms in the USA
Used an
accounting-based
structure to
measure over-
investment and
FCF
Found that over-
investment was
intense in firms
with the greatest
FCF levels
The study did not
incorporate firm
characteristics
This study included
firm characteristics
(age and size)
Mojtahedzadeh
and Nahavandi
(2009)
The relationship between
agency problems that rise
due to FCF with long
term profitability and
income management
The study was on firms
listed on the Tehran stock
exchange Iran
Used 106 firms for
the period 2003 to
2007 used Tobinrsquos
Q to measure long-
term profitability
DA was estimated
using the Adjusted
Jones Model
The study found
that agency
problems of FCF
result in short term
and eventually long
term profitability
The study focused
on FCF agency
costs and
profitability and
income and the
study period was
five years
This study focused on
FCF agency costs
firm characteristics
and the performance
of firms quoted at the
NSE Study period
was ten years
Nunes et al
(2009)
Profitability in
Portuguese service
industries
Used both static
panel models and
dynamic
estimators
Found a positive
correlation between
firm characteristics
and performance
and that FCF result
in profitability
The study used data
for four years only
(1999 to 2003)
which seems too
short
This study employed
data for ten years
(2006 to 2015)
53
Researcher(s) Focus of Study Methodology Findings Knowledge Gaps How this Study
Addressed Gaps
Wang (2010) The effect of FCF and
agency costs on firm
performance (firms listed
at the Taiwan stock
market)
Used descriptive
statistics
correlations and
regression analysis
Found no evidence
supporting a
negative correlation
between FCF and
firm performance
CAPEX and Net
borrowing were
omitted in FCF
definition
This study included
CAPEX and net
borrowings in
measuring FCF
Waithaka et al
(2012)
Effects of dividend
policy on share prices of
NSE listed firms Kenya
Used the case
method and
regression analysis
Found that FCF
instigated conflict
between managers
and shareholders
which consequently
affected the firm
performance
The study focused
on dividend policy
and stock
performance
This study focused on
FCF agency costs
firm characteristics
and firm
performance
Njuguna and
Moronge
(2013)
Effect of managerial
behavior of agency costs
on performance of firms
listed at the NSE Kenya
Used descriptive
research and used
asset turnover ratio
to measure agency
costs
Found that FCF
were negatively
related to firm
performance and
information
asymmetry causes
agency problem
The study used only
one proxy measure
of agency costs -
total asset turnover
ratio
This study employed
total assets turnover
and operating
expenses sales
54
Researcher(s) Focus of Study Methodology Findings Knowledge Gaps How this Study
Addressed Gaps
Wambua
(2013)
Effects of agency costs
on performance of firms
listed at the NSE
Regression
analysis was
employed in data
analysis
Got a positive
correlation between
FCF and firm
performance
The study did not
incorporate firm
characteristics
This study included
firm characteristics
(age and size)
Lin and Lin
(2014)
Agency costs of FCF and
biddersrsquo long-run
takeover performance of
Australian firms
Used regression
analysis on 556
firms for the
period 1993 to
2000
Found a positive
correlation between
FCF and firm
performance
CAPEX and Net
borrowing were
omitted in FCF
definition
This study included
CAPEX and net
borrowings in
measuring FCF
Nekhili et al
(2014)
Moderating effect of CG
and ownership in
lessening earnings
management practices
when there is high FCF
The study was conducted
in France
Developed
simultaneous
equations to
address
endogeneity of
FCF and then
employed
Hausman test
They found
opportunistic
behavior of
managers in
presence of FCF
Used firm
characteristics of CG
and ownership as
moderating variable
This study used firm
characteristics of size
and age of the firm as
moderating variable
Source Researcher (2018)
55
28 Conceptual Framework
Figure 21 below shows graphically the researcherrsquos conceptualization of the study
Figure 21 Conceptual Model
Independent Variable Dependent Variable
H01
Intervening Variable
H02
H04
H03
Moderating Variable
Source Researcher (2018)
Free Cash Flows
FCFit = (Net income
(PAT) + depreciation and
amortization - CAPEX -
change in non-cash
working capital + net
borrowing)Sales
Financial Performance
Tobinrsquos Q
Agency Costs
- Asset utilization efficiency ACit
- Production cost efficiency
Firm Characteristics
- Firm Size
- Age of the firm
56
FCF is the independent variable whereas the dependent variable is financial
performance As shown in figure 21 above H01 indicates the effect of FCF on financial
performance Agency costs are the intervening variable and they comprise of asset
utilization efficiency and production cost efficiency In figure 21 above H02 designates
the intervening influence of agency costs on the correlation between FCF and financial
performance In similar manner H03 depicts the moderating influence of firm
characteristics on the correlation between FCF and financial performance Firm
characteristics in the study are firm size and age of the firm Lastly H04 shows the joint
effect of FCF agency costs and firm characteristics on financial performance
29 Chapter Summary
This chapter reviewed theoretical foundation on which the study is grounded The
theories highlighted are The FCF hypothesis agency theory stewardship theory
stakeholder theory RBV theory and the organizational theory Empirical studies were
also examined specifically reviewing the correlation between FCF and financial
performance the intervening role of agency costs on the correlation between FCF and
financial performance the moderating role of firm characteristics on the correlation
between FCF and financial performance and finally the joint effect of FCF agency costs
and firm characteristics on financial performance Findings are mixed with some studies
indicating negative relationships while others showing positive relationships A summary
of knowledge gaps has also been underscored The chapter presented and explained the
conceptual model that guided the study and how it was conceptualized by the researcher
57
CHAPTER THREE RESEARCH METHODOLOGY
31 Introduction
This chapter deliberates on the research methodology used It presents the philosophy
research design study population how data was collected reliability and validity The
operationalization of study variables the techniques of data analysis applied and
summary of the research objectives Their corresponding hypotheses and analytical
models have also been highlighted
32 Research Philosophy
Research is defined by Proctor (1998) as a process to find out the unknown A critical
phase in doing social science research is to decide and validate the preferred research
philosophy embraced by the researcher Inter-related paradigmatic conventions
concerning the nature of reality the researcherrsquos role and the research process initiate
scientific research Research philosophy is the primary essential credence that supports
the options that need to be selected in taking a position in research Philosophy has
consequences on what how and why research is to be conducted (Carson Gilmore Perry
amp Gronhaug 2001)
Research philosophy has broad paradigms There are interpretative and the positivistic
paradigms Perry Reige and Brown (1999) explain the relationships among the
techniques that the researcher employs the researcher and the reality and truth that they
seek The two philosophical traditions that guide research in social science are positivism
58
and phenomenology (Saunders et al 2007) The roots of positivism tradition are
grounded in empiricism (Kerlinger 2002) Positivism is an ontology which makes an
assumption that a person has a straight access to the actual world and it is likely to get
independent information regarding the particular external reality
Interpretivism or Phenomenology is an ontology which makes an assumption that a
person does not have direct access to the real world and the knowledge heshe has
regarding this apparent realm is important in its own terms Within the phenomenological
ontology epistemology is founded on belief or assumption that the person conducting the
research is part of the reality and therefore not objective value-free or independent
Research emphasis is to understand what happens in a particular situation and it
contemplates several realities and diverse perceptions of the researcher (Carson et al
2001)
In this study the two philosophical traditions were examined and positivism was
considered the more appropriate tradition for the study because the study is centered on
prevailing theory and it develops hypotheses that can be verified Positivism made it
possible to make definite statements about the influence of agency costs and firm
characteristics on the correlation between FCF and firm performance grounded on
unbiased assessment and deductive reasoning The study utilized statistical data analysis
techniques and the researcher was objective and independent because individual feelings
were not introduced
59
33 Research Design
Research design involves decisions on where what when how farmuch and through
which means regarding a phenomenon It is the outline employed to direct a research
study to make certain that the research addresses the study problem (Gorard 2013) After
considering various research designs described by research experts such as Cooper and
Schindler (2006) Mugenda and Mugenda (1999) and Muganda (2010) as well as the
purpose of the study the philosophical tradition adopted the topical scope researcher
involvement time period over which the data was collected the nature of the data and
type of data analysis the study design embraced was cross sectional descriptive design
Mojtahedzadeh and Nahavandi (2009) successfully used the cross-sectional research
design in their study of the relationship between agency problems that arise due to FCF
with long term profitability and income management Mwangi (2014) also successfully
employed this study design in determining the influence of membersrsquo income and
conduct of Savings and Credit Cooperatives (SACCOs) in the correlation between
efficiency and characteristics of SACCOS in Kenya The cross-sectional descriptive
design was considered appropriate because of its versatility and leverage in collection of
data from a large number of respondents within a fairly short time period
34 Population of the Study
The target population comprised of the entire 63 firms listed at the NSE (Appendix I) as
at December 31 2015 This was a census study which involved obtaining information
from every member of the population A census of all the NSE listed firms was employed
60
because the number of listed firms at the NSE is relatively small and therefore the study
could easily be carried out
35 Data Collection
Secondary data was collected from published financial statements obtained from the
NSE Time series panel data was collected covering a 10 - year period from 2006 and to
2015 A ten-year period is deemed large enough to yield reliable findings A similar
period was adopted by Gregory and Wang (2010) and Nekhili et al (2014) Appendix II
shows the data collection form
36 Reliability and Validity
The main indicators of the value of a data collection instrument are reliability and validity
of the measures Reliability is among the most essential components of test quality and it
entails consistency or reproducibility or the examineersquos test performance Therefore
reliability is the degree with which research instruments yield consistent results after
repeated trials Reliability of a measure has two parts its stability over time and the
consistency of the instrument in measuring the concept Several methods of computing
test reliability exist and they include decision consistency parallel forms reliability test-
retest reliability inter-rater reliability and internal consistency Decision consistency is
often an appropriate choice for many criterion-referenced tests (Kimberlin amp Winterstein
2008)
61
Validity is the degree with which theory and evidence corroborate interpretations of test
scores occasioned by suggested uses of tests It denotes whether or not the test is
measuring what it anticipated to measure It is perhaps the most essential criteria for the
quality of a test There are several types of validity and these consist of construct validity
criterion-related validity and content validity Construct validity refers to the extent to
that an instrument measures the attribute or hypothetical concept that it was proposed to
measure while content validity is the degree with which the content of the objects reveals
the content purview of interest Lastly criterion-related validity is evaluated when an
individual wants to establish the correlation of scores on a test to a specified benchmark
(AERAAPANCME 2000 and Penfield amp Miller 2004)
361 Reliability Test
Stability was assessed by use of test retest reliability while internal consistency was
assessed using inter-item consistency reliability In testing for reliability Cronbach alpha
was calculated The Cronbachrsquos alpha coefficient was applied in measuring internal
consistency of the measurement scales It is a scale measurement tool that is frequently
used in social sciences for determining internal consistency of factors or items among and
within variables of the study Nunnally (1967) and Oppenheim (1992) argue that alpha
coefficient value of 0700 and above is tolerable
The Cronbachrsquos alpha coefficient was employed because it is suitable for multi-scaled
items The Cronbachrsquos alpha is a broad formula of the Kunder-Richardson (K-R) 20
formula as shown
62
(K) (S2-Σs
2)
KR20 =
(S2) (K-1)
KR20 = Reliability coefficient of internal consistency
S2 = Variance of all scores
K= Number of items employed to measure the model
s2 = Variance of individual items
This study also employed secondary data Kimberlin and Winterstein (2008) argue that
the foremost concern when deciding if secondary data should be used is to confirm that
the data set suitably measures the variables that are required to answer the study
questions Secondary data was collected from audited financial statements of all NSE
listed firms This data is deemed reliable because financial reporting is guided by
International Financial Reporting Standards (IFRS) Furthermore the companies Act
(CAP 486) of the laws of Kenya require that every limited liability firm conducts a
statutory audit at least once annually Such audits are guided by International Auditing
Standards (IAS)
362 Validity Test
Validation of the instrument was accomplished in several ways Pre-test was done by
administering the instrument to eight middle level managers to complete The eight
managers were conveniently selected to review the statement items for clarity meaning
63
and relevance Based on their response the data collection instrument was appropriately
modified Validity shows whether the instrument is testing what it should be testing
Content validity was achieved by establishing whether the items in the data collection
instrument are well balanced in content domain and link up well with theoretical
assumptions centered on the study objectives which involved checking of the content to
establish if it contained representative sample of the objects being measured Criterion-
related validity was established by administering test-retest or stability test on the data
contents in the data collection instrument Construct validity was established by ensuring
that the study variables were properly operationalized This was achieved through
constant consultations and reviews by research experts from the University of Nairobirsquos
School of Business Validity can be measured by use of expert judgment and informed
opinion (Kerlinger 2002)
37 Operationalization of the Study Variables
This study has four variables of interest independent variable dependent variable
intervening variable and a moderating variable Table 33 shows the research variables
and their respective metricsindicators Theoretical and empirical research in the area of
study has guided the choice of the variables
64
Table 31 Operationalization of Study Variables
Variable
Indicator Measure Support from
Literature
Form Section
Independent Variable
Free Cash Flows
Net income (PAT) add
depreciation and
amortization minus CAPEX
minus change in non-cash
working capital add net
borrowing
Net income (PAT) add
depreciation and amortization
minus CAPEX minus change
in non-cash working capital
plus net borrowingNet
Sales
Brealey et al
(2005) and
Nekhili et al
(2014)
Part A of Data
Collection Form
Dependent variable(s) - Firm Performance
Financial
Performance
Tobinrsquos Q Equity market valueEquity
book value
Szewczyk et al
(1996) and
Mojtahedzadeh
and Nahavandi
(2009)
Part B of Data
Collection Form
Intervening Variable(s)
(a) Asset utilization
efficiency = Net sales
to total Assets ratio
(a + b)2 = AC
Tirole (1986)
Part C of Data
Collection Form
65
Variable
Indicator Measure Support from
Literature
Form Section
Agency Costs
(b) Production cost
efficiency = Operating
expenses to net sales
ratio
Tirole (1986)
Singh and
Davidson (2003)
Moderating variable(s)
Firm
Characteristics
Firm Size Natural log of total assets Demsetz and Lehn
(1985)
Part D of Data
Collection Form
Firm Age
n log (number of years since
incorporation)
Ferris and Yan
(2009)
Source Researcher (2018)
66
Non-cash working capital includes inventories financial assets held to maturity
receivables and prepayments (current assets) and payables accrued expenses current
income tax liability (liabilities) For financial and investment firms non-cash working
capital includes prepaid lease rentals intangible assets deferred tax assets and retirement
benefit assets (assets) and taxation payable dividends payable deferred tax liabilities
and retirement benefit liabilities
Net sales in case of insurance firms are the equivalent of ldquoNet premium revenuerdquo For
commercial banks it is ldquoTotal operating incomerdquo which is composed of net interest
income add total non-interest income In case of investment firms it is ldquoIncomerdquo which
is comprised of rental income dividends and interest received and other incomes
38 Data Analysis
Data was analyzed using inferential statistics generated from statistical software using
95 confidence interval as in Aiken and West (1991) Descriptive statistics and
inferential statistics were both employed in data analysis Measures of dispersion and
measures of central tendency were used in profiling the respondent firms
Linear regression analyses were used in establishing the magnitude and nature of the
relationship between the study variables and in testing the relationships hypothesized
This study employed panel data regression analysis using the OLS technique where data
consist of cross-sectional and time series data which was combined into a panel data set
67
and projected with the use of panel data regression Regression analysis is a statistical
tool for examination of relations between variables
The value of the coefficient of determination (R2) indicates the extent of variation in the
dependent (explanatory) variable explained by the independent (predictor) variable Beta
values indicate the extent of variation in the explanatory variable that is attributed to the
extent of variation in the independent variable F ratio measures the model fit or simply
how sound the equation line established fits the data observed Interpretation of statistical
significance of each relationship hypothesized was based on β R2 t F and P ndash values
The study hypotheses were measured using two sets of regression equations The
regression analysis was done using STATA software
39 Choice of Panel Data Analysis Model
Panel data analysis can be categorized into several categories First are the pooled panels
which assume that there exist no distinctive qualities of characters in the dimension set
and there are no common effects across time Second are the fixed effects models which
assume existence of unique qualities of characters which are not the effects of random
variations and which donrsquot differ across time They assume changes in intercepts across
sets or time periods Lastly we have random effects models which have the assumption
that there are distinctive time constant qualities of characters which are the effects of
random variations and do not associate with the characters that are the effects of random
variation They donrsquot relate with the specific regressors The random effect models are
suitable if we want to draw conclusions about the entire population
68
The selection of a suitable model is contingent on the aim of investigation and
complications regarding the exogenity of dependent variables The fixed effects model
and the random effects model were not considered The pooled regression model was
suitable because of its assumption that all the organizations are similar The Pooled
regression model also has an assumption that the coefficients including the intercepts
are identical for all study items (firms) The fixed and random effect models provide for
individuality or heterogeneity among the organizations by letting each organization to
have own intercept that is time invariant
391 Effect of Free Cash Flows on Financial Performance
In establishing the effect of FCF on firm performance FCF is the predictor variable while
financial performance is the explanatory variable In the specification the standard errors
are clustered by firm and year Equation 31 entails panel data for 2006 to 2015
The regression model for hypothesis 1 is as follows
Ǭit = ά + βFCFit + euro -------------------------------------------------------------------------- (31)
Where Ǭ = Financial performance and it indicates the firm i at time t Financial
performance was measured using Tobinrsquos Q ά = Constant term β = Beta Coefficient
FCFit= Free cash flows for firm i at time t where t is the year 2006 to 2015
392 Free Cash Flows Agency Costs and Financial Performance
In analyzing hypothesis 2 the relevant variables are FCF (independent variable) agency
costs (intervening variable) and financial performance (dependent variable) Intervening
effects were examined using hierarchical (stepwise) multiple regression analysis As in
69
Baron and Kenny (1986) the fundamental concept of mediating variables is that in some
way they intervene in the process of transformation between response and stimuli Some
essential features of a mediating variable include the fact that the independent variable
shall affect the mediator variable (path a) the mediator shall affect the dependent
variable (path b) independent variable shall affect the dependent variable (path c) and
that once paths a and b are controlled path c becomes inconsequential or trivial The
mediation path is shown in figure 31 below
Figure 31 Path Diagram for Mediation effect of Agency Costs
c
lsquoa b
Agency costs
Source Researcher (2018)
Mediation was tested through the following three steps Step one entailed the dependent
variable Ǭ (financial performance) being regressed on the independent variable FCF
(Free cash flows) In step two the mediator AC (agency costs) was regressed on the
independent variable FCF In step three Ǭ is regressed on AC and FCF In each step the
120689 coefficient was tested to establish the size and direction of the correlation If a zero
order relationship exists and is significant then proceed to the next step Mediation exists
if FCF coefficient is significant in step 2 and also when the FCF coefficient is
significantly less in step 3 than in step 1
Free cash flows Financial performance
70
In testing intervention between FCF and financial performance the regression model is as
follows
Ǭit = ά + β1FCFit + euroit ------------------------------------------------------------------------ (32a)
AC it = ά + β1FCFit + euroit --------------------------------------------------------------------- (32b)
Ǭit = ά + β1AC it + β2FCF it + euroit ------------------------------------------------------------ (32c)
while controlling the effect of M on Y
Where ACit is the sum of Production cost efficiency (PCEit) and Asset utilization
efficiency (AUEit) divided by 2 (average) for the period 2006 to 2015
393 Free Cash Flows Firm Characteristics and Financial Performance
In testing hypothesis 3 the relevant variables are FCF firm characteristics (moderating
variable) and financial performance The regression models are as follows
Ǭit = ά + β1FCFit + β2AGEit + β3 (AGEit FCFit) + euro---------------------------------- (33a)
Ǭit = ά + β1FCFit + β2SIZit + β3 (SIZit FCFit) + euro------------------------------------- (33b)
Where SIZit = Firm size AGEit = Age of the firm
Equations 33a and 33b represent moderation models For purposes of avoiding possible
high multicollinearity the variables were centered and an interaction term added If the
predictor variable (FCF) and moderator variable (firm characteristics) are not significant
with the interaction term then complete moderation has happened Otherwise if the
independent and moderator variables are significant with the interaction term then
71
moderation has happened but the main effects are also significant (Aiken amp West 1991
and Mackinnon et al 2002)
In equations 33a and 33b above the variables associated with coefficient 1206893 were added
in the model to measure the effect of moderation The effect of moderation variables
firm size and age is characterized statistically as an interaction that affects the strength
and or direction of the correlation between explanatory variable (firm performance) and
the predictor variables (Baron amp Kenny 1986) The term in the model does not imply
multiplication but rather it denotes moderation
394 Relating all the Variables
Hypothesis 4 entails testing all the variables in the conceptual framework In testing for
the effect on financial performance panel data model was applied in measuring the
strength of the relations between the independent moderating intervening and dependent
variables To measure the joint effect of the moderating intervening and independent
variables intercept (constant) was used to determine the nature and extent of effect of all
the variables Additionally R2 was employed in determining the joint effect of the
moderating intervening and independent variables on the dependent variable (financial
performance) The resultant model is as follows
Ǭit = ά + β1FCFit + β2AC it + β3SIZit + β4AGEit + euro----------------------------------------- (34)
Where
72
34 represents the model for the effect on financial performance which utilized secondary
panel data for the period 2006 to 2015 and Ǭit represents financial performance
Table 32 A Summary of Statistical Tests of Hypotheses
Objective Hypothesis Analytical Model Interpretation
i To establish
the relationship
between FCF
and financial
performance of
firms listed at
the NSE
H01 FCF have no
significant effect on
financial performance of
firms listed at the NSE
ANOVA
regression
model
Panel data
regression
model
Test of
assumption
(normality and
multi-
collinearity)
Relationship exists if β is
significant
Relationship will be
determined based on R2
ii To assess the
influence of
agency costs on
the relationship
between FCF
and financial
performance of
firms listed at
the NSE
H02 Agency costs have
no significant
intervening effect on the
relationship between
FCF and financial
performance of firms
listed at the NSE
ANOVA
regression
model
Panel data
regression
model
Test of
assumption
(normality and
multi-
collinearity)
Mediation exists if FCF
coefficient is significant in
step 2 and also when in
step 3 the FCF coefficient
is significantly less than in
step 1
Regression co-efficient and
R2 will be used to affirm the
effect of agency cost on the
relationship between free
cash flow and firm
performance
iiiTo determine
the influence of
firm
characteristics
on the
H03a Firm age has no
significant moderating
effect on the relationship
between FCF and
financial performance of
ANOVA
regression
model
Panel data
regression
Moderation exists when the
interaction term between
firm characteristics and
FCF is a significant (p lt
005) predictor of firm
73
Objective Hypothesis Analytical Model Interpretation
relationship
between FCF
and financial
performance of
firms listed at
the NSE
firms listed at the NSE
H03b Firm size has no
significant moderating
effect on the relationship
between FCF and
financial performance of
firms listed at the NSE
model
Test of
assumption
(normality and
multi-
collinearity)
performance Furthermore
when FCF remains a
significant predictor while
firm characteristics become
insignificant
The intercept of the
regression model will
be used to tests the
influence of firm
characteristics on the
relationship between
free cash flow and firm
performance
Regression co-efficient and
R2 will be used to affirm the
effect of firm characteristics
on the relationship between
FCF and firm performance
iv To establish
the joint effect
of FCF agency
costs and firm
characteristics
on financial
performance of
firms listed at
the NSE
H04 There is no joint
effect of FCF agency
costs and firm
characteristics on
financial performance of
firms listed at the NSE
ANOVA
regression
model
Panel data
regression
model
Test of
assumption
(normality and
multi-
collinearity)
The intercept of the
regression model will be
used to tests the joint effect
of FCF agency costs and
firm characteristics on firm
performance
R2 will be used to get the
joint effect of independent
variables on Firm
Performance
74
310 Chapter Summary
The chapter discussed the study methodology employed and has highlighted the research
philosophy adopted clearly indicating that the study was anchored on the positivist
orientation since it is founded on existing theory and it articulates hypotheses which can
be verified Furthermore the positivist approach made it possible to make categorical
statements
The research design used has also been discussed The research design adopted was
cross sectional descriptive survey The population of the study has been highlighted as a
census of all firms listed at the NSE The chapter has also explained the data collection
methodology Reliability and validity considerations have been discussed
Operationalization of research variables has been deliberated showing a summary table
of the four variables of study indicators how the variables were measured support from
literature and the relevant section of the data collection form Data analysis has been
explained being regression methods using inferential statistics The chapter also
presented a tabulated summary of the research objectives their corresponding hypotheses
and analytical models
75
CHAPTER FOUR DATA ANALYSIS AND FINDINGS
41 Introduction
The study sought to establish the relationships between free cash flows agency costs
firm characteristics and performance of firms listed at the NSE Secondary data were
collected to test the relationships between the study variables This chapter presents an
analysis of the results More specifically the chapter has focused on descriptive statistics
reliability tests validity tests and correlation analysis
42 Pre-estimation Diagnostics
The study used OLS to estimate regression models The use of OLS is based on
normality linearity sampling adequacy and internal consistency of variables used in the
regression model Therefore normality linearity internal consistency and sampling
adequacy of these variables were required for the application of OLS This section
presents the test statistics to verify satisfaction of these assumptions by the data collected
and analyzed
421 Normality test
The Shapiro Wilk test for normality was conducted to test if the variables were normally
distributed The null hypothesis was that the data did not come from a population that
was normally distributed Therefore the alternate hypothesis is that the data originated
from a normally distributed population The test statistics for normality of each variable
are shown in table 41 below
76
Table 41 Normality Test
Variable Test Statistic
Z statistic P value
Free cash flows 1687 0082
Agency costs (AC) 1501 0160
Firm Age 0832 0129
Firm Size 1004 0076
Table 41 above shows that the p-values for all the variables were greater than 005 and
therefore we failed to reject the null hypothesis that the variables were normally
distributed at five per cent level of significance Therefore OLS could be applied on the
data considering that the data met the assumed conditions for application of multiple
regression analysis Field (2013) recommends use of a visual inspection of histograms or
Quantile ndash Quantile (Q-Q) plots to supplement use of tables and numbers These plots are
presented below
77
Figure 41 Q-Q Plot for Free cash Flows (2006 ndash 2015)
The results of the Q-Q plot in figure 41 above exhibits normality because most of the
observations seem to be in a straight line with a few cases appearing to be far away from
the line
Figure 42 Q-Q Plot for Agency Costs (AC) ndash 2006 to 2015
Figure 42 Q-Q plot above for agency costs (AC) reveals normality because the majority
of the observations seem to be along the straight line Outliers were investigated and
78
corrected or eliminated where necessary Large data sets can be analysed even if some
variables do not meet normality assumptions (Tabachnick amp Fiddel 2013)
Figure 43 Q-Q Plot for Firm Characteristics (Firm Age) ndash 2006 to 2015
The above Q-Q in figure 43 exhibits normality This is because most of the observations
seem to be in a straight line with a few cases appearing to be far away from the line
79
Figure 44 Q-Q Plot for Firm Characteristics (Firm Size) ndash 2006-2015
The Q-Q plot for firm size in figure 44 above indicates almost all the observations being
on a straight line This implies normality of the data Outliers were investigated and
corrected or eliminated where necessary
80
Figure 45 Q-Q Plot for Firm Financial Performance ndash 2006 to 2015
The Q-Q plot for financial performance in figure 45 above shows normality
422 Reliability Tests
Reliability tests were carried out through Cronbachs alpha tests in Statistical Package for
the Social Sciences (SPSS) with the findings presented below The results are shown in
Table 42 below Except for financial performance which shows a score of 0672 all the
other variables indicate reliability scores above 0700 which is the accepted score for
reliability (Bonett amp Wright 2014) The research instrument was therefore deemed
reliable
81
Table 42 Reliability Scores for Individual Variables
Variable Item Cronbachs Alpha
Free Cash Flow 0726
Firm Age 0798
Firm Size 0814
Agency Costs-AC 0828
Financial Performance 0672
423 Test for Linearity
In testing whether the variables were linearly associated a correlation analysis was done
The null hypothesis for the test was that there was no linear association The test statistics
for linear associations between the predictor variables and firm performance (explanatory
variable) are shown in table 43 below
Table 43 Test for Linearity
Reference Variable Firm
Performance
Coefficient of Correlation P-Value
Free cash flows 0506 0000
Agency costs (AC) 0521 0000
Firm Age 0619 0000
Firm Size 0590 0000
82
From table 43 above FCF shows a coefficient of correlation of 0506 agency costs (AC)
indicate 0521 firm age 0619 and finally firm size reveal 0590 All the values exceed
05000 meaning that there is a positive correlation Financial performance is the reference
variable All the p-values for the respective coefficients of correlation are 0000 which is
lower than 001
Thus all the predictor variables have a significant positive correlation with financial
performance at five per cent level of significance Therefore the predictor variables and
the explanatory variable (financial performance) move in the same direction which
suggests a linear relationship This positive significant correlation indicates that the
signage coefficients of the predictor variables in the simple regression models are
positive
424 Bartletts Test for Internal Consistency
The study tested the consistency of the items in the designed questionnaire to measure
several variables used in the research by applying the Bartlettrsquos test of sphericity The
null hypothesis of the test was that there was no internal consistency A failure to reject
the null hypothesis implies that the principal components which measure individual
sections have to be established using principal component analysis
Conversely rejecting the null hypothesis implies that all the elements are consistent
internally and that their composites can be applied in measuring the variables concerned
83
Test statistics for each of the sections involved in the linear regression analysis are
presented in table 44 below
Table 44 Bartlettrsquos Test
Variable Degrees of freedom Test statistic
Chi Square P value
Free cash flows 21 4382 0000
Agency costs (AC) 10 2665 0000
Firm age 10 1462 0000
Firm size 10 1621 0000
Financial performance 10 26940 0000
Table 44 above demonstrates that the null hypothesis which states that the variables are
not intercorrelated in each of the sections has to be rejected at five per cent significance
level This is confirmed by all the p-values being less than 001 for the variables
425 Multicollinearity Test
Multicollinearity occurs if there is a strong relationship between two or more independent
variables in a regression model Multicollinearity becomes an issue only in multiple
regressions and not for simple regression analysis Multicollinearity poses several
problems such as increases in standard errors of 120689 coefficients This means that the 120689s
have relatively higher variability across samples and less likely to represent the
population The second problem is limiting the size of R which measures multiple
correlation between the independent variables and the result and R2 the variance of the
84
result for which the independent variables explain making the second predictor to
explain very little of the remaining variance The other problem posed by
multicollinearity is that it reduces the importance of predictors making it hard to measure
the specific significance of a predictor (Field 2009)
To test whether the level of multicollinearity in the estimated models could be tolerated
Variance Inflation Factor (VIF) was used The rule of the thumb is that a value of VIF
that is less than 10 means that the level of multicollinearity can be tolerated (Robinson amp
Schumacker 2009) Since multicollinearity test is only applicable for multivariate
regressions only VIF statistics are reported since the regressions involve more than one
independent variable
Table 45 Multicollinearity Test
Variables VIF
Free Cash Flows 206
Agency costs (AC) 155
Financial Performance 252
Firm Size 109
Firm Age 168
Table 45 above shows that the VIF for all the models estimated ranged from 109 to 235
showing that the VIF results are between the acceptable ranges of 1 to 10 (Robinson amp
85
Schumacker 2009) This shows that the variables did not exhibit multicollinearity and
regression analysis could then be carried out
43 Descriptive Statistics
Table 46 Descriptive Statistics for Secondary Data ndash 2006 to 2015
Variables No Min Max Mean STD
Tobinrsquos Q (Ratio) 600 0867900 6447370 0526600 0634590
FCF (Ratio) 600 -0024530 3145000 16900 011270
AC(Ratio) 600 0003716 6329080 33166898 091646
SIZ (Ratio) 600 -1342200 2810600 04418300 0612300
AGE (n log of year
since incorporation)
600 140884 5400013 3904435 0287000
Table 46 above shows descriptive statistics for secondary data for a 10 year period from
2006 to 2015 Table 46 above gives the descriptive analysis for the main variables used
in the research It shows that the average Tobin Q is 05266 This suggests that on
average firms listed at NSE have recorded fairly impressive performance The Tobinrsquos Q
mean of 05266 suggests that the firmsrsquo market values are less than their book values
Since their market price to book value ratio is less than one the market expects the value
of these firms to reduce in the future because the market price also takes any future
earnings into account at the current price
86
For FCF the average is 169 meaning that most firms listed at NSE have low FCF The
mean for AC was found to be 33166898 indicating a high asset turnover and operating
expenses to sales ratio The average age of the firm is indicated by the log of 3904435
This shows that the firms listed at the NSE are relatively old On average the mean firm
size of listed firms at the NSE is indicated by a log of 04418300 indicating that the firms
have a fairly high asset value
44 Chapter Summary
This chapter presented information on pre-estimation diagnostics These include
normality test reliability test reliability test test for linearity Bartlettrsquos test for internal
consistency and multicollinearity test The chapter also gave results of analysis tests run
on the data that was collected These include descriptive statistics Results were indicated
by standard deviations mean scores minimum scores and maximum scores
87
CHAPTER FIVE TESTS OF HYPOTHESES AND DISCUSSION
51 Introduction
This section presents the hypotheses of the study which are derived from the research
objectives and the results of the hypothesized relationships This study was informed by
the premise that there exists a correlation between FCF and financial performance and
that this relationship is intervened by agency costs and is moderated by firm
characteristics
52 Correlation Analysis
The relationship between strength and direction of the variablesrsquo relationship was
investigated using the Pearson Product Moment correlation coefficient This was
significant so as to assess whether any relationship exists between the variables before
proceeding with further analyses The study employed the following classification strong
if 07 and above moderate if 04 but less than 07 and weak if 0 and less than 04
Apart from analysing the direction and strength of association correlation analysis was
also used to test the presence of multicollinearity between the independent variables
Multicollinearity exists if independent variables are highly correlated (r = or greater than
075) Multicollinearity reduces the importance of predictors making it difficult to assess
the individual importance of a predictor Multicollinearity may lead to poor regression
modelling (Dancey amp Reidy 2011) The results in Table 51 below show that there is no
multicollinearity since all the predictor coefficient results are below 075
88
Table 51 Pearson Product-Moment Correlations among the Dependent
Independent Intervening and Moderating Variables
Firm
performance
Free
cash
flows
Agency
costs
Firm
size
Firm
age
Pearson
Correlation
Firm performance 1 0702 0519 0405 0126
Free cashflows 1 0129 0135 0245
Agency costs 1 0198 0322
Firm size 1 0418
Firm age 1
Source Researcher (2018)
Correlation is significant at the 005 level (2-tailed)
Correlation is significant at the 001 level (2-tailed)
As indicated in Table 51 above there is a strong positive correlation between financial
performance and FCF (r = 0702) On the other hand the correlation between financial
performance and firm size and with agency costs is moderate and positive (r = 0405 and
0519 respectively) The correlation with firm age is weak but positive (r = 0126) All the
correlations were significant at 005 except firm age The relationships between financial
performance and FCF agency costs firm size and firm age moved in the same direction
as hypothesized in the study These variables were further assessed using regression
analysis as shown in section 53 below
89
53 Hypotheses Testing Using Regression Analysis
In order to establish these relationships four hypotheses were formulated and tested For
purposes of testing the hypotheses different regression models were run First finding
out the correlation between FCF and financial performance secondly tests to determine
the intervening effect of agency costs on the correlation between FCF and financial
performance thirdly tests were carried out to establish the moderating effect of firm
characteristics on the relationship between FCF and financial performance and lastly to
find out the joint effect of FCF agency costs and firm characteristics on financial
performance of NSE listed firms
In order to ascertain these relationships the hypotheses were formulated and tested using
simple and multiple linear regression analyses The hypotheses were tested at 95 percent
confidence level (ά = 005) while p-values were used to establish individual significance
of the hypothesized relationships The significance and general robustness of the model
was assessed using F statistic and p-values for significance Overall F statistic value
greater than 1 signifies goodness of fit P-values greater than or equal to 005 indicated
that we would fail to reject the null hypothesis while those with p-values less than 005
signified that the null hypothesis would be rejected ANOVA and panel data analyses
results have been presented and discussed below
90
531 Free Cash Flows and Financial Performance
The study sought to determine the effect of FCF on financial performance and it
employed panel data design Panel data was used in establishing financial performance
which was measured by Tobinrsquos Q (equity market value equity book value) FCF on the
other hand was measured as Net income + depreciation and amortization - CAPEX -
change in non-cash working capital + net borrowing)Net sales The study sought to
identify the effect of FCF on firm financial performance The following hypothesis was
developed
H01 FCF have no significant effect on financial performance of firms listed at the NSE
Maximum likelihood regression model was employed in data analysis The test statistics
regression results with financial performance as the dependent variable and FCF as the
independent variable are reported in Table 52(a) below
Table 52 Panel Data Results for Free Cash Flows and Financial Performance
Model Summary
Model R R2 Adjusted R
2 Standard
Error
1 04890 02391 02106 02258
a Predictors (Constant) Free cash flows
b Dependent Variable Financial performance
91
(a) ANOVA
Model Sum of
Squares
DF Mean
Square
F Sig
Regression 2689 1 2689 5376 0017
Residual 32483 599 0054
Total 35172 600
a Predictors (Constant) Free Cash Flows
b Dependent variable Financial performance
(c) Regression Co-efficients
Model Unstandardized Coefficients Standard
Coefficients
t Sig
B Standard Error Beta
Constant 048011 0011662 020 7229 0000
FCF 0206 00254 0265 54238 00023
Dependent variable Financial performance
The model coefficients are shown in Table 52(c) above The results indicate that FCF is
a significant predictor because the p value is 00023 which is lower than 005 (level of
significance) Furthermore results indicate R2
of 02391 which implies that FCF explain
2391 of the variability in firm financial performance The results have rejected the null
hypothesis implying that FCF have a statistically significant positive effect on financial
performance of firms listed at the NSE The regression model that explains the variation
in financial performance as a consequence of FCF is as shown below
92
Ǭit = 048011 + 0206FCFit
Where
Ǭ = Firm financial performance
FCF =Free cash flows
532 Free Cash Flows Agency Costs and Financial Performance
This study sought to ascertain the effect of agency costs on the relationship between FCF
and financial performance The corresponding hypothesis is
Hypothesis 2 Agency costs have no significant intervening effect on the relationship
between free cash flows and financial performance of firms listed at the Nairobi
Securities Exchange
The study employed secondary panel data in determining the results under this
hypothesis Secondary data was obtained from financial statements and measured agency
costs using asset utilization efficiency (salesassets) and production cost efficiency
(operating expensessales) The values were obtained separately (AUE and PCE) and
added together then divided by two to obtain agency costs (AC)
In testing for mediation intervention first the relationship between the dependent
variable (financial performance) and the independent variable (FCF) was carried out
ignoring the intervening variable (agency costs-AC) This was step number 1 and is
similar to the regressions performed under hypothesis one under section 52 The model
should indicate significance where p = lt005
93
Next is the regression analysis between FCF (the independent variable) and agency costs
(AC) which is a combination of production cost efficiency and asset utilization efficiency
as intervening variable ignoring the financial performance (the dependent variable) The
FCF and AC relationship should be significant (p=lt005) if one is to move to step 3
Under step 3 the regression analysis is done with financial performance as the dependent
variable and both AC and FCF as independent variables Regression results for step 1 are
same as shown in Table 51 earlier Results from step 1 shown in Table 51 indicate the p
value of 00023 and is therefore significant The regression model is specified as Ǭit =
048011 + 0206FCFit This necessitates moving to step 2 the results of which are
depicted in Table 53 below
Table 53 Panel Data Results of Agency Costs as the Dependent Variable and Free
Cash flows as the Independent Variable
a) Model Summary
Model R R Square Adjusted R Square Std Error of the Estimate
1 03356 01126 00958 02290
a Predictors (Constant) FCF
b Dependent Variable Agency costs (AC)
94
b) ANOVA
Model
Sum of
Squares df
Mean
Square F Sig
Regression 6881 1 6881 059 46181 0053
Residual 89226 599 0149 043
Total 96107 600
a Predictors (Constant) FCF
b Dependent Variable Agency costs (AC)
c Coefficients
Model
Unstandardized
Coefficients
Standardized
Coefficients
t Sig B Std Error Beta
1 (Constant) 0117 03042 3840 023
FCF 083 0137 265 2772 048
a Dependent Variable Total Non-Performance
Results in Table 53(c) above indicate that FCF is a significant predictor of AC as shown
by Sig = lt005 Table 53(a) above shows R square of 01126 which implies that 1126
variations in AC are explained by changes in FCF The regression model for the
relationship between FCF and AC ignoring financial performance is given below
AC = 0117 + 0083FCF
95
Since the relationship between FCF and AC is significant (as depicted by Sig = 0048)
we can now move to step 3 where financial performance is the dependent variable while
FCF and AC are predictor variables The results of step 3 are displayed in Table 54
below
Table 54 Panel Data Results of Financial Performance as the Dependent Variable
while Agency Costs and Free Cash flows are the Independent Variables
a Model Summary
Model R R Square Adjusted R Square Std Error of the Estimate
1 07157 05122 04613 02288
a Predictors (Constant) AC FCF
b Dependent Variable Financial Performance
a ANOVA
Model Sum of Squares df Mean Square F Sig
1 Regression 14725 2 73625 62606 0000
Residual 106258 598 01776
Total 120983 600
a Predictors (Constant) AC FCF
b Dependent Variable Financial Performance
96
c Coefficients
Model
Unstandardized Coefficients
Standardized
Coefficients
t Sig B Std Error Beta
1 (Constant) 0187 0342 44409 021
FCF 211 0179 227 13380 071
AC 148 042 282 62376 015
a Predictors (Constant) AC FCF
b Dependent Variable Financial Performance
The findings in Table 54 above indicate that financial performance is significantly
predicted by AC (p =0015 which is lt005) On the contrary FCF does not significantly
predict financial performance This is depicted by (p = 0071 which is gt005) From the
regression results above Adjusted R squared changed from 02106 to 04613 showing a
significant increase in the relationship between FCF and financial performance
This change is attributed to the intervening variablersquos effect It is therefore concluded that
agency costs (AC) have a positive statistically significant intervening effect on the
relationship between FCF and financial performance The null hypothesis that Agency
costs have no significant intervening effect on the relationship between free cash flows
and financial performance of firms listed at the Nairobi Securities Exchange is therefore
rejected The resultant regression model is as shown below
Ǭit = 0187 + 0148ACit+0211FCFit
97
533 Free Cash Flows Firm Characteristics and Financial Performance
This study sought to identify the effect of firm characteristics on the relationship between
FCF and financial performance The corresponding hypothesis is
Hypothesis 3 Firm characteristics have no significant moderating effect on the
relationship between free cash flows and financial performance of firms listed at the
Nairobi securities exchange
The study employed secondary panel data in determining the results under this
hypothesis Since firm characteristics (age and size) are additive each one of them was
tested separately Therefore under this hypothesis two sub-hypotheses were developed
as follows
H03a Firm age has no significant moderating effect on the relationship between free cash
flows and financial performance of firms listed at the Nairobi securities exchange
H03b Firm size has no significant moderating effect on the relationship between free cash
flows and financial performance of firms listed at the Nairobi securities exchange
Secondary data was obtained from financial statements and measured firm characteristics
using firm size and age of the firm Firm size was measured using the natural log of total
assets while age of the firm was measured using the natural log of number of years since
incorporation The moderating effect of firm size and firm age on the relationship
between FCF and firm financial performance was assessed using the centered approach
as by Wu and Zumbo (2008)
98
This involves the following steps Step 1 involves the independent variables and the
moderator variables being regressed against firm financial performance Step 2 on the
other hand entails introduction of the centered approach in the model with the predictor
variable moderating variable and the interaction term being factored into the model The
regression results are shown in Table 55 below
Table 55 Panel Data Results for Financial Performance as the Dependent Variable
and FCF and Firm Age as the Predictor Variables
a Model Summary
Model R R Square Adjusted R Square
Std Error of the
Estimate
1 05894 03474 03109 1573
a Predictors (Constant) FAGE_CENTRED FCF_CENTRED
b Dependent Variable Financial Performance
b ANOVA
Model Sum of Squares df Mean Square F Sig
1 Regression 51189 2 25594 8531 0000
Residual 20440 598 003
Total 255589 600
a Predictors (Constant) FAGE_CENTRED FCF_CENTRED
b Dependent Variable Financial Performance
99
c Coefficients
Model
Unstandardized
Coefficients
Standardized
Coefficients
t Sig B Std Error Beta
1 (Constant) 0041 11662 28109 0044
FCF 1306 0144 088 44238 0023
AGE 201 02607 353 6120 0002
a Dependent Variable Financial Performance
Results in Table 55(a) above show R2 of 03474 and Adjusted R
2 of 03109 Table 55(c)
above shows the coefficients of FCF and AGE as 01306 and 0201 respectively The p
values for FCF and AGE are 0023 and 0002 respectively indicating statistical
significance because each of them is less than 005 Results for Step 2 are displayed in
Table 56 below where the interaction term is introduced
Table 56 Panel Data Results for Financial Performance as the Dependent Variable
and FCF and Firm Age as the Predictor Variables Centered Approach
a Model Summary
Model R R Square Adjusted R Square Std Error of the Estimate
1 06825 046580 042170 041054
a Predictors (Constant) FCF_FAGE_CENTRED FAGE_CENTRED FCF_CENTRED
b Dependent Variable Financial Performance
100
b ANOVA
Model Sum of Squares df Mean Square F Sig
1 Regression 12034 3 401130 29957 0000
Residual 79950 597 01339
Total 91984 600
a Predictors (Constant) FCF_FAGE_CENTRED FAGE_CENTRED FCF_CENTRED
b Dependent Variable Financial Performance
c Coefficients
Model
Unstandardized
Coefficients
Standardized
Coefficients
t Sig B Std Error Beta
1 (Constant) 0065 00245 41263 0001
FCF_CENTRED 0207 00014 0293 74638 0000
AGE_CENTRED 0094 0091 0351 1986 0047
FAGE_CENTRED 0045 002 00204 2230 0027
a Predictors (Constant) FCF_FAGE_CENTRED FAGE_CENTRED FCF_CENTRED
b Dependent Variable Financial Performance
Results from Table 56 above shows R squared change from 03109 to 042170 which is a
change of 01108 (1108 change) which is occasioned by the interaction term This is
also confirmed by the p values which are all less than 005 meaning that firm age
101
positively and significantly moderates the relationship between FCF and financial
performance The regression model for moderation effect of firm age is as shown below
Ǭit = FCFit + AGEit + 0045FAGEit
Table 57 Panel Data Results for Financial Performance as the Dependent Variable
and FCF and Firm Size as the Predictor Variables
a Model Summary
Model R R Square Adjusted R Square Std Error of the Estimate
1 06481 04200 03902 03198
a Predictors (Constant) SIZE FCF
b Dependent Variable Financial performance
b ANOVA
Model
Sum of
Squares df Mean Square F Sig
1 Regression 8447 2 4224 120685 00000
Residual 21456 598 0035
Total 29903 600
a Dependent variable Financial performance
102
c Coefficients
Model
Unstandardized
Coefficients
Standardized
Coefficients
t Sig B Std Error Beta
1 (Constant) 009 002109 53270 00014
FCF 0107 003104 0178 74238 00000
SIZE 0223 009100 1444 19860 00470
a Dependent Variable Financial Performance
Results in Table 57(a) above show R2 of 04200 and Adjusted R
2 of 03902 Table 57(c)
above shows the coefficients of FCF and SIZE as 0107 and 0223 respectively The p
values for FCF and SIZE are 0000 and 0047 respectively indicating statistical
significance because each of them is less than 005 Results for Step 2 are displayed in
Table 58 below where the interaction term is introduced
Table 58 Panel Data Results for Financial Performance as the Dependent Variable
and FCF and Firm Size as the Predictor Variables Centered Approach
a Model Summary
Model R R Square Adjusted R2 Std Error of the Estimate
1 07853 06167 05654 02208
a Predictors (Constant) FCF_CENTRED SIZE_CENTRED FSIZE_CENTRED
b Dependent Variable Financial Performance
103
b ANOVA
Model Sum of Squares df Mean Square F Sig
1 Regression 3138 1 3138 17119 00011
Residual 109846 599 01833
Total 112984 600
a Predictors (Constant) FCF_CENTRED FCF_FSIZE_CENTRED FSIZE_CENTRED
b Dependent Variable Financial Performance
c Coefficients
Model
Unstandardized
Coefficients
Standardized
Coefficients
t Sig B Std Error Beta
1 (Constant) 0144 00245 4826 0021
SIZE_CENTRED 0048 00140 0392 2586 0041
FCF_CENTRED 0155 00140 0132 3938 0003
FSIZE_CENTRED 0227 00327 0472 2679 00981
a Dependent Variable Financial Performance
Results from Table 58 above shows R squared change from 03902 to 05654 which is a
change of 01752 (1752 change) which is occasioned by the interaction term This is
also confirmed by the p values which are all less than 005 meaning that firm size
moderates the relationship between FCF and financial performance The regression
model for moderation effect of firm size is as shown below
104
Ǭit = FCFit + SIZit + 0227FSIZEit
The moderating effect was established as in Stone-Romero and Liakhovitski (2002)
which involves assessing the effects on the dependent variable (non-financial
performance) of the moderating variables (firm size and age) and dependent variable
(FCF) Regression results with non-financial performance as the dependent variable firm
characteristics (firm size and age) and FCF as predictors as shown below
534 Free Cash Flows Agency Costs Firm Characteristics and Financial
Performance
This study sought to establish the joint effect of FCF agency costs and firm
characteristics on firm performance The corresponding hypothesis is as follows
Hypothesis 4 There is no joint effect of free cash flows agency costs and financial
characteristics on performance of firms listed at the Nairobi Securities Exchange
Secondary data was obtained from financial statements The independent variable is FCF
intervening variable is agency costs (AC) The moderating variable is firm characteristics
which are firm size and age of the firm Financial performance was measured using
Tobinrsquos Q and is the dependent variable Panel data results are presented in table 59
below
105
Table 59 Panel Data Results for Free Cash Flows Agency Costs Firm
Characteristics and Financial Performance
a Model Summary
Model R R Square Adjusted R Square Std Error of the Estimate
1 08780 07708 06645 05432
a Predictors (Constant) FCF AC Firm Size Firm Age
b Dependent variable Financial performance
b ANOVA
Model Sum of Squares df Mean Square F Sig
1 Regression 7708 2 3854 22807 0012
Residual 101336 598 0169
Total 7934 600
a Predictors (Constant) FCF AC Firm Size and Firm Age
b Dependent Variable Financial Performance
106
c Coefficients
Model
Unstandardized
Coefficients
Standardized
Coefficients
t Sig B Std Error Beta
1 (Constant) 065 0011 3826 0033
FCF 0144 0024 0081 4938 0020
Age 0107 0027 0150 1233 0074
Size 0231 0069 0102 6586 0010
AC 0314 0034 0259 2901 0032
a Predictors (Constant) FCF AC Firm Size and Firm Age
b Dependent Variable Financial Performance
From the panel study results the intercept (constant) is 0065 with a statistically
significant p-value of 0033 FCF have a coefficient value of 0144 with a p-value of 002
which is significant The findings indicate that FCF still have positive effect on the
performance of the listed firms and the effect is still significant even when control
variables are introduced in the model The effect of agency costs is also positive and
significant at p value 0032 Firm size shows a positive and significant joint effect (p
value is 001) while age has a positive effect but the effect is not significant (p value is
0074) The R2 is 07708 indicating that 7708 of changes in financial performance are
accounted by the joint effect of FCF AC and firm characteristics (size and age)
107
Overall the joint effect of FCF agency costs and firm characteristics on performance of
firms listed at NSE indicates a positive significant relationship The null hypothesis is
therefore rejected There is a significant joint effect of FCF agency costs and firm
characteristics on performance of firms listed at the NSE The regression model that
explains the variation in firm performance as a result of the joint effect of FCF agency
costs and firm characteristics is shown below
Ǭit FCFit +ACit +SIZit +AGEit
Where Ǭit = Financial Performance
FCF= Free Cash flows
AC = Agency Costs (AC)
SIZ = Firm Size
AGE = Firm Age
54 Discussion
The study had four hypotheses with hypothesis 3 having two sub hypotheses one
focusing on firm age and the other on firm size The results under each objective are
discussed here-below
541 The Influence of Free Cash Flows on Financial Performance
The first objective of the study was to establish the influence of FCF on the performance
of firms listed at the NSE This was achieved through analyzing the audited financial
statements of the listed companies (panel data)
108
The results indicate that there is a significant positive relationship between FCF and firm
performance The findings for the influence of FCF on financial performance showed a
statistically significant positive relationship These results are consistent with other
studies on FCF and firm performance For instance Kargar and Ahmadi (2013) found a
positive relationship between FCF and performance of firms listed at the Tehran stock
exchange Similarly Gregory (2005) established that the greater the FCF the better the
performance in merger undertakings Szewczyk et al (1996) and Chang et al (2007)
concluded that shareholders favour businesses that have FCF
In his study on the effects of agency costs on performance of firms listed at the NSE
Wambua (2013) also found a positive relationship between FCF and firm performance
The findings show that increasing FCF disposes more resources to firm managers who
then deploy the resources towards generating more revenues and profits for the firm
The findings are inconsistent with the FCF hypothesis postulated by Jensen (1986) which
suggests that agency conflicts between firm managers and shareholders become more
severe in the presence of substantial FCF thereby negatively affecting firm performance
Furthermore these findings reject the agency theory which was proposed by Jensen and
Meckling (1976) The agency theory is based on the premise that the goal of firm
managers is to maximize their personal wealth and other self-interests instead of
maximizing the wealth of shareholders
On the contrary the findings seem to support the stakeholder theory which advances that
firm management has a network of relationships and therefore corporate accountability
109
includes a broad range of stakeholders such as suppliers business associates financial
institutions the government customers among others Similarly the findings are
consistent with the stewardship theory The theory emphasizes the role of firm managers
as being that of stewards who integrate their goals as part of the firmrsquos goals
542 The Influence of Agency Costs on the Relationship between Free Cash Flows
and Financial Performance
The second objective was to assess the influence of agency costs on the relationship
between FCF and financial performance of firms listed at the NSE The study
hypothesized that agency costs have no significant intervening effect on the relationship
between FCF and performance of firms listed at the NSE The assessment of agency
costs FCF and financial performance was achieved by reviewing financial statements of
companies listed at the NSE The results indicate a statistically significant positive
intervening effect of agency costs on the relationship between FCF and financial
performance
The results reveal that agency cost measure is positive and significantly associated with
firm performance This can be attributed to the role of internal control system in reducing
agency costs associated with residual loss due to suboptimal managerial actions These
findings are supported by Kangarluei Motavassel and Abdollahi (2011) and Khidmat
and Rehman (2014) who established a statistically significant positive effect of agency
costs on the relationship between FCF and firm performance
110
Similarly Lin and Lin (2014) found a positive statistically significant effect of agency
costs on the relationship between FCF and firm performance in the Australian takeover
market These findings are contrary to the argument that substantial FCF increases
agency costs which subsequently affects firm performance negatively The FCF
hypothesis and the agency theory are therefore not supported by the findings On the
contrary the stakeholder theory and the stewardship theory are supported by the results
543 The Influence of Firm Characteristics on the Relationship between Free Cash
Flows and Financial Performance
The third objective of the study was to determine the moderating effect of firm
characteristics on the relationship between FCF and performance of firms listed at the
NSE The firm characteristics evaluated were firm size and age of the firm An
assessment of audited financial statements was carried out to measure FCF firm
characteristics (firm size and age of the firm) and firm financial performance
Results indicate firm size exhibiting a statistically significant positive moderating effect
on the relationship between FCF and firm financial performance Similarly firm age
shows a positive moderating effect on the relationship between FCF and firm financial
performance and the effect is also statistically significant The positive effect of firm size
confirms the results of the study conducted by Nyamweno and Olweny (2014) which
found firm size to be positively related to ROA This indicates that larger firms report
higher financial performance as compared to smaller firms Abbasi and Malik (2015)
clarified the relationship between firm size and financial performance by concluding that
111
larger firms had higher likelihoods of obtaining credit from financial institutions and
would get loans at lower rates because they have superior credit worth ratings and have
lower risk of bankruptcy
Heydari et al (2014) argue that firm characteristics such as firm age and size can expose
a firm to more agency costs related to management and growth prospects thus depressing
the effect of FCF on firm performance This result can be viewed from the perspective of
liability of obsolescence in which organizational performance declines with age
The decline can be attributed to environmental drift resulting from rivalry and
competition and organizational inertia the syndrome of too big or too old to change
Liabilities of obsolescence arise from growing external mismatch with the environment
The results indicate positive effects of firm characteristics on the relationship between
FCF and firm financial performance The results in this study support the RBV theory
which is concerned with internal firm specific factors and their effect on performance
The RBV theory views the firm as a bundle of resources which are combined to create
organizational capabilities that it can use to earn more than average profitability If well
developed competences from these resources become a source of competitive advantage
(Grant 1991)
112
544 The Joint Effect of Free Cash Flows Agency Costs and Firm Characteristics
on Financial Performance
The last objective of the study was to establish the joint effect of FCF agency costs and
firm characteristics on financial performance of firms listed at the NSE Financial
performance was measured by Tobinrsquos Q Firm characteristics that were considered in
the study were firm size and age of the firm Panel data results indicate that there is a
positive statistically significant joint effect of FCF agency costs and firm characteristics
on firm performance These findings support results by Chen et al (2016) who conclude
that large firms which have been in existence for a long time tend to have structures in
place to reduce agency costs
The findings are also similar to Wang (2010) who concluded that there exists a positive
joint effect of firm size FCF and agency cost on firm performance Results of the study
by Jabbary Hajiha Labeshka and Hassanpour (2013) are confirmed by these findings
which reveal that FCF have a positive significant effect on firm performance even with
the inclusion of control variables of agency costs and firm characteristics All the agency
cost coefficients indicate statistically significant positive effects
Emami et al (2014) observe that internal control systems provide an overarching
framework that reduces agency costs and hence positively affecting firm performance
These findings are also similar to Dawar (2014) who established that firm monitoring
costs impact positively on firm performance In testing financial performance firm size
had a coefficient of 0231 and p-value of 001 when jointly tested with other variables
113
indicating that firm size has a positive effect on firm performance even with control
variables introduced
These findings are supported by Banafa (2016) who concluded that firm size affects
performance of firms significantly albeit with small effect when moderated by other
variables In testing financial performance firm age revealed a positive but not
statistically significant effect with a coefficient of 0107 and a p-value of 0074 These
results contradict with Brouwe et al (2005) who concluded that productivity growth
rates are negatively correlated with firm age
Overall the joint effect of FCF agency costs and firm characteristics on performance of
firms listed at NSE indicates a positive significant relationship We therefore reject the
null hypothesis which states that there is no significant joint effect of free cash flows
agency costs and firm characteristics on financial performance of firms listed at the NSE
These results have rejected the FCF hypothesis and the agency theory This is because
FCF firm characteristics and agency costs have indicated a positive joint effect on firm
performance On the other hand the stewardship theory the stakeholder theory and the
RBV theory seem to be supported by the findings The organisational theory which
explains firm size in relation to profitability as well as organizational transaction costs
agency costs and span of control also seems to be supported by the findings of this study
114
Table 510 Summary of Tests of Hypotheses Results and Conclusions
Hypothesis R2
(p-value) Conclusion
H01 FCF have no significant
effect on financial
performance of firms listed at
the NSE
02391
00023
Null Hypothesis rejected
H2 Agency costs (AC) have
no significant intervening
effect on the relationship
between FCF and financial
performance of firms listed at
the NSE
05122
0031
Null Hypothesis rejected
H03a Firm age has no
significant moderating effect
on the relationship between
FCF and financial
performance of firms listed at
the NSE
04658
0047
Null Hypothesis rejected
H03b Firm size has no
significant moderating effect
on the relationship between
FCF and financial
performance of firms listed at
the NSE
06167
0041 Null Hypothesis rejected
H04 There is no joint effect of
FCF agency costs and firm
characteristics on financial
performance of firms listed at
the NSE
07708
0033
Null Hypothesis rejected
115
55 Summary and Presentation of Empirical Models
The chapter presented the study results from analytical tests conducted to verify the study
hypotheses The findings of the statistical analyses carried out were presented and
interpreted The study established that FCF have a statistically significant positive effect
on financial performance This relationship is intervened by agency costs and moderated
by firm characteristics
Agency costs have a statistically significant positive intervening effect on the relationship
between FCF and financial performance On the other hand firm characteristics have a
statistically significant negative moderating effect on the relationship between FCF and
firm financial performance Finally the study established that there is a joint effect of
FCF agency costs and firm characteristics on financial performance of firms listed at the
NSE The joint effect is positive and statistically significant The empirical conceptual
model depicting the relationships between the variables is presented in figure 51 below
116
Figure 51 Revised Empirical Model ndash Financial Performance
Independent Variable Dependent Variable
Intervening Variable H1 Ǭit = 048011 + 0206FCFit
H2 Ǭit = 0187 + 0148ACit + 0211FCFit
H4 Ǭit = 065 + 00144FCFit + 0314ACit + 0231SIZit + 0107AGEit
Ǭit = 065+0207FCFit+0094AGEit + 0045FAGEit
H3 Ǭit = 0144+0155FCFit +0048SIZit+ 0227FSIZit
Moderating Variable
Source Researcher (2018)
Free Cash Flows
FCFit=(Net income
(PAT)+depreciation and
amortization - CAPEX -
change in non-cash
working capital + net
borrowing)Sales
Firm Financial
Performance
- Tobinrsquos Q
Agency Costs
- Asset utilization efficiency AC
- Production cost efficiency
Firm Characteristics
- Firm Size
- Age of the firm
117
CHAPTER SIX SUMMARY OF FINDINGS CONCLUSIONS AND
RECOMMENDATIONS
61 Introduction
This study investigated the relationship between FCF agency costs firm characteristics
and financial performance of firms listed at the NSE The independent variable is FCF
while agency costs are intervening variables and firm characteristics are moderating
variables Financial performance is the dependent variable The chapter has summarized
the findings of the study and made conclusions upon which recommendations are drawn
Discussions conclusions and recommendations have been presented These have been
discussed in light of other studies that have investigated the same or similar variables in
other settings The chapter ends with the study implications to theory policy and
practice and recommendations for further research
The study had four objectives upon which conclusions are aligned to The objectives
were first to stablish the relationship between free cash flows and financial performance
of firms listed at the NSE second to assess the influence of agency costs on the
relationship between free cash flows and financial performance of firms listed at the
NSE third to determine the influence of firm characteristics on the relationship between
free cash flows and financial performance of firms listed at the NSE and lastly to
establish the joint effect of free cash flows agency costs and firm characteristics on
financial performance of firms listed at the NSE
118
62 Summary of Findings
This study was founded on the premise that FCF have an influence on financial
performance and that the relationship between the two is intervened by agency costs and
moderated by firm characteristics A conceptual framework was therefore developed and
the study empirically tested hypotheses which were guided by the study objectives The
first objective of the study was set to find out the relationship between FCF and
performance of firms listed at NSE The findings reveal that FCF have a statistically
significant positive effect on performance of firms listed at the NSE
This finding is supported by the coefficient of determination of 02391 which indicates
the variations in firmsrsquo financial performance (explanatory variable) explained by FCF
(predictor variable) The effect of FCF was established to be statistically significant and
therefore the null hypothesis was rejected Therefore we reject the null hypothesis that
FCF have no statistically significant effect on performance of firms listed at the NSE
The results are inconsistent with the FCF hypothesis advanced by Jensen (1986) which
proposes that agency conflicts between firm managers and shareholders become more
severe in the presence of substantial FCF thereby negatively affecting financial
performance Additionally these findings reject the agency theory which was suggested
by Jensen and Meckling (1976) These results are consistent with Wambua (2013) who
found a positive relationship between FCF and firm performance The findings imply that
increasing FCF avails more resources to firm managers who utilize the funds in
generating more wealth
119
The second objective of the study sought to assess the influence of agency costs on the
relationship between FCF and financial performance of firms listed at the NSE The
findings indicate that agency costs have a positive statistically significant intervening
effect on the relationship between FCF and financial performance of firms listed at the
NSE Thus the study rejected the null hypothesis which states that agency costs have no
significant intervening effect on the relationship between FCF and financial performance
of firms listed at NSE
These findings support Lin and Lin (2014) who found a positive statistically significant
effect of agency costs on the relationship between FCF and firm performance in the
Australian takeover market These findings are contrary to the FCF hypothesis suggested
by Jensen (1986) and the agency theory postulated by Jensen and Meckling (1976)
However the stakeholder theory advanced by Freeman (1984) and the stewardship theory
developed by Donaldson and Davis (1991) seem to be supported by the findings
The third objective of the study sought to establish the influence of firm characteristics on
the relationship between FCF and financial performance of firms listed at the NSE
Results indicate that firm characteristics (both firm size and age) have a positive
significant moderating effect on the relationship between FCF and financial performance
of firms listed at the NSE These findings contradict Heydari et al (2014) who argue that
firm characteristics such as firm age and size can expose a firm to more agency costs
related to management and growth prospects thus depressing the effect of FCF on firm
performance
120
The fourth and final hypothesis sought to establish the joint effect of FCF agency costs
and firm characteristics on financial performance of firms listed at the NSE Results show
positive coefficients for all the variables which means that as FCF agency costs and firm
characteristics jointly increase performance of the NSE listed firms also increases Firm
characteristics show a positive statistically significant joint effect on firm financial
performance and also FCF and agency costs show a positive statistically significant joint
effect on firm financial performance The results have rejected the FCF hypothesis and
the agency theory On the other hand the results seem to support the stewardship theory
the stakeholder RBV theory and the organisational theory
63 Conclusions
Based on the findings of the study FCF is fundamental to firm performance because it
allows firms to invest and grow thereby improving performance Firms should strive to
increase FCF since it has a statistically significant positive effect on financial
performance Similarly firms should invest more in firm monitoring which according to
the findings in this study the benefits derived from investing in firm monitoring
(improved firm performance) outweigh the agency costs of investing therein (in firm
monitoring) This study has found no evidence supporting the FCF hypothesis as
suggested by Jensen (1986) and therefore firms listed at the NSE are not consistent with
the FCF hypothesis
Consistent with these findings Nyamweno and Olweny (2014) found firm size to be
positively related to financial performance Similarly Dawar (2014) found that firm
121
monitoring costs impact positively on financial performance Conflicting with literature
(Kwanum amp Lorpev 2012) firm age indicated a positive effect on the relationship
between FCF and firm financial performance However the findings of this study are
consistent with Banafa (2016) who concluded that firm size affects firm performance
significantly when moderated by other variables It is therefore confirmed that there
exists a strong relationship between FCF agency costs firm characteristics and financial
performance of firms listed at the NSE
64 Contributions of the Study
The study has contributed to knowledge in the areas of FCF and the agency problem firm
characteristics and firm performance More specifically the study has contributed to
theory policy and practice
641 Contribution to Theory
The results of this study have to a large extent rejected the FCF hypothesis advanced by
Jensen (1986) and the agency theory advanced by Jensen and Meckling (1976) which
postulate that when a firm has generated significant FCF and there are no lucrative
investment projects available managers tend to abuse the FCF which results in increased
agency costs The study results have therefore given credence to the critics of the FCF
hypothesis and agency theory who argue that the theories foster short-termism by not
favouring investments that have long run returns Furthermore the findings support the
argument that even in conditions of greatly specific assets where the likelihood of
opportunism is very high there are people who will give precedence to cooperation and
trust and will not engage in opportunistic behavior
122
The study findings have also given credibility to the stewardship theory postulated by
Donaldson and Davis (1991) which emphasizes the role of firm managers as being
stewards incorporating their objectives as part of the firm As stewards they are
contented and encouraged when success of the firm is achieved Agency costs have
shown a positive intervening effect on the relationship between FCF and firm
performance This finding gives credibility to firm monitoring through CG which seems
to have achieved the objective of aligning the interests of firm managers and
shareholders The study findings also imply that firm capabilities and firm characteristics
complement the effects of agency costs on performance
The inclusion of firm characteristics as a moderating variable provided an opportunity to
test the RBV and organizational theories by providing empirical evidence about how the
specific firm characteristics (size and age) affect firm performance This study adopted
two measures of agency costs This measurement approach has enabled the study to offer
a stronger and more robust assessment of the linkages between the study variables
642 Contribution to Policy
The Kenyan context is characterized by calls for effective CG particularly for public
limited liability firms (Okiro 2014) These study findings have refuted the FCF
hypothesis by revealing a positive relationship between FCF and firm performance as
intervened by agency costs This is an indication that investing in firm monitoring is
yielding positive results Adopting good CG mechanisms (firm monitoring which form
123
part of agency costs) is an effective way of improving firm performance Firms should
endeavor to strengthen their monitoring mechanisms so as to increase performance
Improving CG entails having an optimal number of board of directors enhancing board
independence making full disclosure of shareholding and directorrsquo remuneration Policy
makers will therefore maintain CG calls and strive to strengthen and continue developing
policies regulations and prudential guidelines that protect and strengthen shareholders
643 Contribution to Practice
The study findings have shown the fundamental importance of firms generating FCF and
strengthening firm monitoring The joint effect of FCF agency costs and firm
characteristics on firm performance has yielded a positive relationship Firm managers
investors and other practitioners will therefore put more emphasis on the need for firms to
generate FCF and to enhance firm monitoring
Cash flows from operating activities financing activities and investment activities will be
more keenly analyzed with a view to achieve greater efficiency This study has also
delineated FCF from agency costs unlike studies such as Jensen (1986) which generally
regard FCF as agency costs This gives firm managers investors and other practitioners a
better understanding of the variables and their linkages which will enhance effectiveness
and efficiency in firm operations
124
65 Limitations of the Study
The study focused on firms listed at the NSE which operate in a unique environment
Unique factors such as regulatory environment culture and demographics limit the
generalizability of the study results to other countries or markets However this
limitation does not render the study findings applicable to NSE listed firms only Some
aspects could be relevant to other markets
Secondly the major theoretical motivations underlying this study are the FCF hypothesis
and the agency theory Traditionally the board of directors keenly monitors decision
makers who tend to divert resources to their own personal interests The findings support
this view and offer evidence that proper firm monitoring mechanisms yield higher firm
performance A probable limitation of the study is that it does not integrate other CG
mechanisms such as influencing managersrsquo actions through an advisory role
Thirdly the study disregards practices other than board monitoring that may serve to
lessen agency costs Firm monitoring costs were a part of the larger agency cost variable
The omission of alternative board monitoring practices did not therefore undermine the
robustness and or the rigor of the study Fourthly the study used only two firm
characteristics These are firm size and age of the firm Other firm characteristics include
profitability leverage liquidity sales growth among others The study employed size and
age only because they are the most commonly used in literature and their effect on firm
performance is more significant (Demsetz amp Lehn 1985 and Mule Mukras amp Nzioka
2015)
125
Lastly literature indicates at least seven proxy measures of agency costs These are
operating expense to sales ratio total asset turnover advertising and RampD expense to
sales ratio administrative expense to sales ratio earnings volatility firm monitoring
index and FCF This study utilized only two of these measures (total asset turnover and
operating expense to sales ratio) Agency cost measures other than the two used in this
study may yield different findings Employing only one agency cost measure may still be
sufficient and therefore the omission of other measures did not undermine the robustness
and or the rigor of the study
66 Recommendations of the Study
The findings have indicated that there exists a positive relationship between FCF and
financial performance The study therefore recommends that firm managers investors
and other practitioners should focus more on the need for firms to generate FCF Positive
FCF indicate that the firm is making more cash than is used to operate the firm and for
reinvestment Such excess funds can be given back to shareholders as dividends or share
repurchase packages in cases where the firms have limited growth prospects and the
funds could not be better invested somewhere else
It is therefore recommended that regulators policy makers investors and other
practitioners should emphasize on monitoring and CG mechanisms to maintain if not
improve high firm performance Study results indicate that proper monitoring
mechanisms can bring the actions of firm managers into congruence with those of
shareholders which primarily is to maximize the shareholdersrsquo wealth
126
67 Suggestions for Further Research
This study used Tobinrsquos Q in measuring financial performance Further studies need to be
conducted using ROE ROI ROA DY sales growth market share or productivity
Secondly the study population was all firms listed at the NSE These firms cut across
various industry sectors Future studies could focus on specific industries such as
manufacturing financial sector communications agricultural or automobile industry
This is because focusing on a specific industry could yield different results that are
unique for the industry
Thirdly this study used only two firm characteristics as moderating variables These are
firm size and age of the firm Future studies could employ sales growth liquidity growth
prospects profitability asset growth turnover ownership structure dividend pay-out
profitability and access to capital markets among others Use of other moderating
variables may yield different results
Lastly the study only employed two proxy measures of agency costs Future studies
should attempt to use all the suggested seven agency cost measures or the other agency
cost measures not employed in this study This could yield different results or provide
more robustness and rigor in the study
127
REFERENCES
Abbasi A amp Malik A Q (2015) Firm size moderating financial performance in
growing firms Empirical evidence from Pakistan International Journal of
Economics and Financial Issues 5(2) 334ndash339
Adelegan O J (2009) Investment financial factors and cash flow from Nigerian panel
data Journal of African Development 11(1) 77-108
AERA APA amp NCME (2000) Standards for educational and psychological tests
Washington DC American Psychological Association American Educational
Research Association National Council on Measurement in Education
Aldrich H E amp Austen E (1986) Even dwarfs started small Liabilities of size and age
and their strategic implications In Staw B Cummings (Eds) Research in
organizational behavior JAI Press Greenwich CT
Ayako A Kungu G amp Githui T (2015) Determinants of the performance of firms
listed at the Nairobi Securities Exchange Research Journal of Finance and
Accounting 6(12) 157-164
Aiken L S amp West S G (1991) Multiple regression Testing and interpreting
interactions Thousand Oaks CA Sage
Bain J S (1959) Industrial organization New York John Wiley amp Sons
Baker W E amp Sinkula (2005) Market orientation and the new product paradox Journal
of Product Innovation Management 22(6) 485-502
Banafa A (2016) The effect of leverage liquidity and firm size on financial
performance of listed non-financial firms in Kenya Unpublished PhD Thesis
Jomo Kenyatta University of Agriculture and Technology
128
Barney J B (2002) Gaining and sustaining competitive advantage 2nd
ed Reading
Mass Addison-Wesley
Baron R M amp Kenny D A (1986) The moderator-mediator variable distinction in
social psychological research conceptual strategic and statistical considerations
Journal of Personality and Social Psychology 51(6) 1173-1182
Berle A A amp Means G C (1932) The modern corporation and private property
McMillan New York
Bonett D G amp Wright T A (2014) Cronbachrsquos Alpha Reliability Interval estimation
hypothesis testing and sample size planning Journal of Organizational Behavior
36 (1) 3-15
Bourne M Neely A D Mills J F amp Platts K (2003) Implementing performance
measurement systems A literature review International Journal of Business
Performance Management 5 (1) 1-24
Brealey A A Myers S C amp Allen F (2005) Principles of corporate finance (8th
ed)
Boston McGraw-HillIrwin
Bromiley P (1990) Advances in strategic management JAI Press Greenwich
Brouwer P Kok J D amp Fris P (2005) Can firm age account for productivity
differences EIM Business research scientific analysis of entrepreneurship and
SMEs SCALES ndash paper N200421 Zoetermeer Netherlands
Brush H W Bromiley P amp Hendrickx M (2000) The free cash flow hypothesis for
sales growth and firm performance Strategic Management Journal 21 455-472
129
Cadogan J W amp Diamantopoulos A (1995) Narver and Slater Kohli and Jaworski and
the market orientation construct integration and internationalization Journal of
Strategic Marketing 3(1) 41-60
Carson D Gilmore A Perry C amp Gronhaug K (2001) Qualitative marketing
research SAGE publications London
Central Bank of Kenya (2016) Bank supervision annual report
Chang S J amp Singh H (2000) Corporate industry effects on business and competitive
position Strategic Management Journal 21 (1) 739-752
Chen X Sun Y amp Xu X (2016) Free cash flow over-investment and corporate
governance in china Pacific-Basin Finance Journal 37 81ndash103
CMA (2010) A comparative analysis of the performance of African stock markets
[Online] Available wwwcmaorke [Accessed 9 August 2015]
Cline B N Williamson C R amp Yore A (2014) Economic calculation and constraints
on firm size Mississippi State University USA
Cooper D R amp Schindler P S (2006) Business research methods 9th
edition Mac-
Grow-hill publishing co ltd New Delhi India
Daft R L (1995) Organization theory and design (11 ed) West Publishing Company
New York
Daily C M Dalton D R amp Cannella J A A (2003) Corporate governance decades
of dialogue and data The Academy of Management Review 28 (3) 371-382
Dancey C amp Reidy J (2011) Statistics without maths for psychology 5th Edition
Prentice Hall London
130
Davis J Donaldson L amp Schoorman D (1997) Towards a stewardship theory of
management Academy of Management Review 22 (1) 20-47
Dawar V (2014) Agency theory capital structure and firm performance some Indian
evidence Managerial Finance 40(12) 1190ndash1206
Dean T J Robert L B amp Bamford (1998) Differences in large and small firm
responses to environmental context strategic implications from a comparative
analysis of business formations Strategic Management Journal 19(8) 709-728
Demsetz H amp Lehn K (1985) The structure of corporate ownership causes and
consequences Journal of Political Economy 93 (6) 1155-1177
Donaldson L (1990) A rational basis for criticism of organizational economics a reply
to Barney Academy of Management Review 15 394-401
Donaldson L amp Davis J H (1991) Stewardship theory or agency theory CEO
governance and shareholder returns Australian Journal of Management 16 (1)
49-65
Donaldson T amp Preston LE (1995) The stakeholder theory of the corporation
concepts evidence and implications Academy of Management Review 20 (1)
65-91
Dyer L amp Reeves T (1995) Human resource strategies and firm performance what do
we know and where do we go International Journal of Human Resource
Management 31 758-775
Easterwood C (1997) Takeovers and incentives for earnings management an empirical
analysis Journal of Applied Business Research 14 29-48
131
Emami E Salteh H M amp Hasanzadeh R B (2014) Social responsibility and value of
firms listed at Tehranrsquos Stock Exchange International Review of Management
and Business Research 31(21) 332ndash338
Fama E F (1980) Agency problems and theory of the firm Journal of Political
Economy 88(2) 288-307
Fauver L amp Naranjo A (2010) Derivative usage and firm value the influence of
agency costs and monitoring problems Journal of Corporate Finance 16 719-
735
Ferris S P amp Yan X S (2009) Agency costs governance and organizational forms
evidence from the mutual fund industry Journal of Banking and Finance 33 619-
626
Field A (2009) Discovering statistics using SPSS Sage Publications Ltd London
Figge F Hanh T Schaltegger S amp Wagner M (2002) The sustainability Balanced
Score Card - Linking sustainability management to business strategy Business
Strategy and Environment 11 269-284
Freeman R (1984) Strategic management a stakeholder approach Pitman Publishing
Inc Massachusetts
Frentrop P (2003) On the discretionary power of top executives Journal of Asset
Management 5 (2) 91-104
Gleason J M amp Barnum D T (1982) Toward valid measures of public sector
productivity performance measures in urban transit Management Science
28(14) 379-386
Gorard S (2013) Research design robust approaches for the social sciences London
SAGE ISBN
132
Grant R M (1991) The resource based theory of competitive advantage implications
for strategic formulation California Management Review 33(1) 114-135
Gregory A (2005) The long-run abnormal performance of UK acquirers and the free
cash flow hypothesis Journal of Business Finance and Accounting 32(5) 777-
814
Gul F A amp Tsui S T J (1998) A test of the free cash flow and debt monitoring
hypotheses evidence from audit pricing Journal of Accounting and Economics
24 (2) 219-237
Hannan M T amp Freeman J (1984) Structural inertia and organizational change
American Sociological Review 49(2) 149-164
Harford J (2002) Corporate cash reserves and acquisitions The Journal of Finance 54
(6) 1969 ndash 1997
Hawawini G Subramanian V amp Verdin P (2003) Is performance driven by industry
or firm specific factors a new look at evidence Strategic Management Journal
23 (1) 1-16
Hendricks K B amp Singhal V R (2001) Firm characteristics total quality management
and financial performance Journal of Operations Management 19 269-285
Heydari I Mirzaeifar M Javadghayedi M amp Student M A (2014) Investigating the
relationship between free cash flows and firm performance evidence from Tehran
Stock Exchange Indian Journal of Scientific Research 4(6) 269ndash279
Hill C W L (1990) Cooperation opportunism and the invisible hand implications for
transaction cost theory Academy of Management Review 15(3) 500-513
Hubbard R G (1998) Capital market imperfections and investment Journal of
Economic Literature 36 (2) 193-225
133
Jabbary H Hajiha Z Labeshka amp Hassanpour R (2013) Investigation of the effect of
agency costs on firm performance of listed firms at the Tehran Stock Exchange
European Online Journal of Natural and Social Sciences 2(3) 771ndash776
Jensen M (1986) Agency costs of free cash flow corporate finance and takeovers
American Economic Review 76 (2) 323-329
Jensen M C amp Meckling W H (1976) Theory of the firm managerial behavior
agency cost and ownership structure Journal of Financial Economics 3 (4) 305-
360
Kaen F R amp Baumann H D (2003) Firm size employees and profitability in US
manufacturing industries Social Science Research Network Electronic Journal
(1) 1-71
Kapelko M (2006) Evaluate efficiency in the framework of resource based view of the
firm evidence from Polish and Spanish textile amp clothing industry Bellaterra
1(1) 1-56
Kaplan R S amp Norton D P (2001) Transforming Balanced Score Card from
performance measurement to strategic management Part 1 Accounting Horizons
87-104
Kangarluei S J Motavassel M amp Abdollahi T (2011) The investigation and
comparison of free cash flows in the firms listed in Tehran Stock Exchange (TSE)
with an emphasis on earnings management International Journal of Economics
and Business Management 2(2) 5352ndash118
Kargar E F amp Ahmadi G R (2013) The relationship between free cash flows and
agency costs levels evidence from Tehran Stock Exchange Research Journal of
Finance and Accounting 4(14) 51ndash66
134
Kerlinger F N (2002) Foundations of behavioural research Holt Rinehart and
Winston Inc USA
Khidmat W B amp Rehman M U (2014) The impact of free cash flows and agency
costs on firm performance - an empirical analysis of KSE listed companies of
Pakistan Journal of Financial Engineering 01(03) 145 ndash 175
Kimberlin C L amp Winterstein A G (2008) Validity and reliability of measurement
instruments used in research American Society of Health-System Pharmacists 65
Kinoti M A (2012) Factors contributing towards adoption of green marketing
practices in the mobile phone service providers in Kenya Unpublished PhD
Thesis University of Nairobi Kenya
Kogan L amp Tian M (2012) Firm characteristics and empirical factor models a data-
mining experiment International Finance Discussion papers 1070
Kwanum M amp Iorpev L (2012) Capital structure and firm performance evidence from
manufacturing companies in Nigeria International Journal of Business and
Management Tomorrow 2 (5) 1ndash17
Leibenstein H (1976) Beyond economic man Cambridge MA Harvard University
Press
Lengnick-Hall C A amp Wolff J A (1999) Similarities and contradictions in the core
logic of three strategy research streams Strategic Management Journal 20(12)
1109-1132
Lin L amp Lin D (2014) Agency cost of free cash flow and biddersrsquo long-run takeover
performance Universal Journal of Accounting and Finance 2(1) 1-8
135
Lusthaus C Anderson G amp Murphy E (1995) Institutional assessment a framework
for strengthening organizational capacity for IDRCrsquos research partners
International Development Research Centre Ottawa
Mackinnon D P Lockwood C M Hoffman J M West S G amp Sheets V (2002) A
comparison of methods to test mediation and other intervening variable effects
Psychological Methods 7 (1) 83-104
Mbugua D (2015) Market orientation firm characteristics dynamic capabilities and
performance of deposit-taking savings and credit cooperative societies in Kenya
Unpublished PhD Thesis University of Nairobi Kenya
Mansell S (2013) Capitalism corporations and the social contract a critique of
stakeholder theory Cambridge Cambridge University Press
McKnight P J amp Weir C (2008) Agency costs corporate governance mechanisms and
ownership structure in large UK publicly quoted companies a panel data analysis
The Quarterly Review of Economics and Finance 49 (2009) 139-158
Meyer M W amp Zucker L G (1989) Permanently failing organization Sage Beverly
Hills CA
Miller D amp Chen M J (1994) Sources and consequences of competitive inertia
Administrative Science Quarterly 39(1) 1-17
Milne F Purda L amp Anand A (2008) Monitoring to reduce agency costs examining
the behavior of independent and non-independent boards Seattle University Law
Review 33(4) 809-848
Mitchell R K Agle B R amp Wood D J (1997) Toward a theory of stakeholder
identification and salience defining the principle of who and what really counts
Academy of Management Review 22(4) 853-886
136
Mojtahedzadeh V amp Nahavandi N N A P (2009) Free cash flow agency costs
earnings management and investor monitoring Journal of Financial Economics
32 615-635
Muganda N (2010) Applied business and management research Exploring the
principles and practices of research within the context of Africa Africa Nicorp
Publication
Mugenda O M amp Mugenda AG (2003) Research methods quantitative and
qualitative approaches Nairobi Acts Press
Mule R K Mukras S M amp Nzioka O M (2015) Corporate size profitability and
market value an econometric panel analysis of listed firms in Kenya European
Scientific Journal 11 (13) 376-396
Mwangi M (2014) The influence of membersrsquo income and conduct of SACCOs in the
relationship between characteristics and efficiency of SACCOs in Kenya
Unpublished PhD Thesis University of Nairobi Kenya
Nairobi Securities Exchange (2015) History of the NSE [Online] Available
wwwnsecoke [Accessed 26 June 2015]
Neely A (1998) Measuring business performance - why what and how Economist
Books London
Neely A D Adams C amp Kennerley M (2002) The performance prism the scorecard
for measuring and managing business success Pearson Education Limited
London UK
Nekhili M Amar I F B Chtioui T amp Lakhal F (2014) Free cash flow and earnings
management the moderating role of governance and ownership Journal of
Financial Economics 11 (13) 847 ndash 875
137
Njeru W G (2013) Market orientation marketing mix practices firm characteristics
external environment and performance of tour firms in Kenya Unpublished PhD
Thesis University of Nairobi Kenya
Njuguna L amp Moronge M (2013) Influence of the managerial behavior of agency cost
on the performance of listed firms on NSE International Journal of Social
Sciences and Entrepreneurship 1 (7) 397-410
Norman W amp MacDonald C (2004) Getting to the bottom of tripple bottom line
Business Ethics Quarterly 14 (2) 243-262
Nunes P J M Serrasqueiro Z M amp Sequeira T N (2009) Profitability in Portuguese
service industries a panel data approach The Service Industries Journal 29(5)
693-707
Nunnally J (1967) Psychometric theory Mac-Graw-Hill New York
Nyamweno C N amp Olweny T (2014) Effect of working capital management on
performance of firms listed at the Nairobi Securities Exchange Economics and
Finance Review 3(11) 1ndash14
Nyongrsquoo A P (2000) The context of privatization in Kenya African academy of
sciences Colour Printers Nairobi Kenya
Odundo E (2009) Alternative investment options transforming needs into
opportunities Retirement Benefits Authority CMA Workshop
Okiro K O (2014) The influence of capital structure firm size rules and regulations on
the relationship between composite corporate governance and performance of
firms listed on East African Securities Exchanges Unpublished PhD Thesis
University of Nairobi Kenya
138
Ongore V amp KrsquoObonyo P (2011) Effects of selected corporate governance
characteristics on firm performance empirical evidence from Kenya
International Journal of Economics and Financial Issues 1 (3) 99-122
Opler T amp Titman S (1993) The determinants of leveraged buyout activity free cash
flow versus financial distress costs Journal of Finance 48 1985-1999
Oppenheim A N (1992) Questionnaire design interviewing and attitude measurement
Basic books Inc New York
Patton M (1990) Qualitative evaluation and research methods Beverly Hills CA
Sage
Pearce J A amp Robinson R B (2011) Strategic management formulation
implementation and control (12th
ed) New York McGraw HillIrwin
Penfield R amp Miller J M (2004) Improving content validation studies using an
asymmetric confidence interval for the mean of expert ratings Applied
Measurement in Education 17 359-370
Penrose E T (1959) The theory of the growth of the firm Oxford Basil Blackwell
Perry C Reige A amp Brown L (1999) Realismrsquos role among scientific paradigms in
marketing research Irish Marketing Review 12(2) 16-23
Podrug N (2010) Stewardship relations within management hierarchy in large
Croatian companies Doctoral Dissertation Faculty of Economics and Business
Zagreb
139
Ponnu C H amp Okoth M O (2009) Corporate social responsibility disclosure in Kenya
The Nairobi Stock Exchange African Journal of Business Management 3(10)
601-608
Porter M E (1980) Competitive strategy New York The Free Press
Power L (1998) The missing link technology investment and productivity Review of
Economics and Statistics 80(2)300 ndash 313
Priem R L amp Butler J E (2001) Is the resource based view a useful perspective for
strategic management research Academy of Management Review 26(1) 22-40
Proctor S (1998) Philosophy and methods of research process the case of realism
Nurse Researcher 5 (4) 73 ndash 90
Richard P Divinney T M Yip G S amp Johnson G (1999) Measuring organizational
performance towards methodological best practice Journal of Management
35(2) 1340-1378
Richardson S (2006) Over-investment of free cash flow and corporate governance
Review of Accounting Studies 11 159-189
Robinson C amp Schumacker R E (2009) Interaction effects countering variance
inflation factor and interpretation issues Multiple Linear Regression View Points
35(1) 6-11
Rumelt R P (1991) How much does industry matter Strategic Management Journal
12(1) 167 185
Sagwa E V (2014) Human resource management practices and performance of firms
listed at the Nairobi Securities Exchange Unpublished PhD Thesis University of
Nairobi Kenya
140
Salaman G (1979) Work organizations resistance and control Longman London
Saunders M Lewis P amp Thornhill A (2007) Research methods for business students
(4th
ed) Prentice Hall Financial Times Harlow
Schmalensee R (1985) Do markets differ much American Economic Review 75 (1)
341-351
Shepherd W G (1986) On the core concepts of industrial economics in H W De Jong
and W G Shephert eds Mainstreams in Industrial Organization Dordrecht
Martinus Nijhoff Publishers
Singh M amp Davidson W N (2003) Agency costs ownership structure and corporate
governance mechanisms Journal of Banking and Finance 27 793-816
Smith C W amp Warner J B (1979) On financial contracting an analysis of bond
covenants Journal of Financial Economics 7(79) 117-161
Stalk G Evans P amp Schulman L E (1992) Competing on capabilities the new rules
of corporate strategy Harvard Business Review 70(1) 57-69
Stinchcombe A L (1965) Social structure and organizations Handbook of
organizations Rand McNally Chicago
Subrahmanyam A amp Titman S (2001) Feedback from stock prices to cash flows
Journal of Finance 56 (18) 2389-2413
Sundaram A K amp Inkpen A C (2004) Stakeholder theory and ldquothe corporate
revisitedrdquo a reply Journal of Organization Science 15 (3) 370-371
141
Szewczyk S H Tsetsekos G P amp Zantout Z (1996) The valuation of corporate RampD
expenditures evidence from investment opportunities and free cash flow Journal
of Financial Management 25 (1) 105-110
Tabachnick B G amp Fidell L S (2013) Using multivariate statistics (6 ed) Needham
Heights MA Allyn amp Bacon
Thakor R T (2013) Investment opportunities free cash flow and the market values of
foreign and domestic cash holdings Unpublished Working Paper Massachusetts
Institute of Technology
Thompson P amp McHugh D (2002) Work organizations a critical introduction (3rd
ed) Palgrave McMillan
Tirole J (1986) The theory of corporate finance Princeton University Press Princeton
NJ
Venkatraman N Ramanujam V (1986) Measurement of business performance in
strategy research a comparison of approaches The Academy of Management
Review 11(4) 801-814
Vogt S (1997) Cash flow and capital spending Evidence from capital expenditure
announcements Journal of Financial Management 26(2) 44 ndash 57
Waithaka S M Ngugi J K Aiyabei J K Itunga J K amp Kirago P (2012) Effects
of dividend policy on share prices a case of companies at the Nairobi Securities
Exchange Journal of Business Administration and Management 2 (8) 642-648
Wambua P (2013) Effects of agency costs on financial performance of companies listed at
the Nairobi Securities Exchange International Journal of Social Sciences and
Entrepreneurship 1 (5) 587-607
142
Wang G Y (2010) The impacts of free cash flows and agency costs on firm performance
Journal of Service Science and Management 3 408-418
Wernerfelt B (1984) A resource based view of the firm Strategic Management Journal
5(2) 171-180
Wernerfelt B amp Montgomery C A (1985) Tobinrsquos Q and importance of focus in firm
performance American Economic Review 78(1) 246-250
Williams B Onsman A amp Brown T (2012) Is the Australian paramedic a discipline or a
profession A national perspective International Journal of Paramedic Practice
1(5) 162-168
Williams J R (1992) How sustainable is your competitive advantage California
Management Review 34(1) 29-51
World Bank (2000) Corporate governance a framework for implementation A World Bank
Country Study Washington
Yin X amp Zajac E J (2004) The strategygovernance structure fit relationship theory and
evidence franchising arrangements Strategic Management Journal 25(7) 201-242
Wu A D amp Zumbo B D (2008) Understanding and using mediators and moderators
Social Indicators Research 87(3) 367
Zou S amp Stan S (1998) The determinants of export performance a review of the empirical
literature between 1987 and 1997 Journal of Marketing Review 15(5) 333-356
i
APPENDICES
Appendix I Firms Listed at the Nairobi Securities Exchange as at December 31
2015
NO SECTOR
A AGRICULTURAL
1 Eaagads Ltd
2 Kapchorua Tea Co Ltd
3 Kakuzi Ltd
4 Limuru Tea Co Ltd
5 Rea Vipingo Plantations Ltd
6 Sasini Ltd
7 Williamson Tea Kenya Ltd
B AUTOMOBILES AND ACCESSORIES
8 Car and General (K) Ltd
9 Sameer Africa Ltd
10 Marshalls (EA) Ltd
C BANKING
11 Barclays Bank Ltd
12 CFC Stanbic Holdings Ltd
13 IampM Holdings Ltd
14 Diamond Trust Bank Kenya Ltd
15 Housing Finance Co Ltd
16 Kenya Commercial Bank Ltd
17 National Bank of Kenya Ltd
18 NIC Bank Ltd
19 Standard Chartered Bank Ltd
20 Equity Bank Ltd
21 The Co-operative Bank of Kenya Ltd
D COMMERCIAL AND SERVICES
22 Nation Media Group
ii
23 Kenya Airways Ltd
24 Express Ltd
25 Standard Group Ltd
26 TPS Eastern Africa (Serena) Ltd
27 Hutchings Biemer Ltd
28 Uchumi Supermarket Ltd
29 Scangroup Ltd
30 Longhorn Kenya Ltd
E CONSTRUCTION AND ALLIED
31 Athi River Mining
32 Bamburi Cement Ltd
33 Crown Berger Ltd
34 EA Cables Ltd
35 EA Portland Cement Ltd
F ENERGY AND PETROLEUM
36 Kenol-Kobil Ltd
37 Total Kenya Ltd
FIRM AND SECTOR
38 KenGen Ltd
39 Kenya Power amp Lighting Co Ltd
40 Umeme Ltd
G INSURANCE
41 Jubilee Holdings Ltd
42 Pan Africa Insurance Holdings Ltd
43 Kenya Re-Insurance Corporation Ltd
44 Liberty Kenya Holdings Ltd
45 British-American Investments Company ( K) Ltd
46 CIC Insurance Group Ltd
H INVESTMENT
47 Olympia Capital Holdings Ltd
iii
48 Centum Investment Co Ltd
49 Trans-Century Ltd
50 Home Afrika Ltd
51 Kurwitu Ventures
I INVESTMENT SERVICES
52 Nairobi Securities Exchange Ltd
J MANUFACTURING AND ALLIED
53 BOC Kenya Ltd
54 British American Tobacco Kenya Ltd
55 Carbacid Investments Ltd
56 East African Breweries Ltd
57 Mumias Sugar Co Ltd
58 Unga Group Ltd
59 Eveready East Africa Ltd
60 Kenya Orchards Ltd
61 ABaumann CO Ltd
62 Flame Tree Group Holdings Ltd
K TELECOMMUNICATION AND TECHNOLOGY
63 Safaricom Ltd
iv
Appendix II Data Collection Form
Firm X (Indicate Firm name accordingly)
Part A FREE CASH FLOWS
Year
Net
Income
(PAT)
(a)
Depreciation
amp
Amortization
(b)
CAPEX
(crsquo)
Change
in non-
cash
working
capital
(d)
Net
borrowing
(ersquo)
Net
sales
(f)
FCF
= (a +
b ndash c -
d + e)
f
2006
2007
2008
2009
2010
2011
2012
2013
2014
2015
Non-cash working capital includes inventories financial assets held to maturity
receivables and prepayments (current assets) and payables accrued expenses and
current income tax liability (liabilities) For financial and investment firms non-cash
working capital includes prepaid lease rentals intangible assets deferred tax assets
retirement benefit assets and other assets (assets) and taxation payable dividends
payable deferred tax liabilities and retirement benefit liabilities
Net borrowings were determined by comparing current year and previous year long-
term loans
Net sales in case of insurance firms are the equivalent of ldquoNet premium revenuerdquo For
commercial banks it is ldquoTotal operating incomerdquo which is composed of net interest
v
income plus total non-interest income For investment firms it is ldquoIncomerdquo which is
comprised of rental income dividends and interest received and other incomes
PART B FINANCIAL PERFORMANCE
Year Equity Market Value (a) Equity Book Value (b) Tobinrsquos Q = a b
2006
2007
2008
2009
2010
2011
2012
2013
2014
2015
vi
PART C AGENCY COSTS
Year
1 Asset Utilization
Efficiency (AUE)
2 Production Cost Efficiency (PCE)
(a) Net
sales
(b) Total
assets
AUE
= ab
(c) Operating
expenses
(d) Net sales PCE=cd
2006
2007
2008
2009
2010
2011
2012
2013
2014
2015
Net sales in case of insurance firms are the equivalent of ldquoNet premium revenuerdquo For
commercial banks it is ldquoTotal operating incomerdquo which is composed of net interest
income plus total non-interest income For investment firms it is ldquoIncomerdquo which is
comprised of rental income dividends and interest received and other incomes
xii
PART D FIRM CHARACTERISTICS
Firm Size Firm Age
Year (a) Natural Log of Total Assets (b) Natural log of Age (Number of years
since incorporation)
2006
2007
2008
2009
2010
2011
2012
2013
2014
2015
Net sales in case of insurance firms are the equivalent of ldquoNet premium revenuerdquo For
commercial banks it is ldquoTotal operating incomerdquo which is composed of net interest
income plus total non-interest income For investment firms it is ldquoIncomerdquo which is
comprised of rental income dividends and interest received and other incomes

iii
COPYRIGHT copy
All rights reserved No part of this thesis may be reproduced or used in any form without
prior written permission from the author or the University of Nairobi except for brief
quotations embodied in review articles and research papers Making copies of any part of
this thesis for any purpose other than personal use is a violation of the Kenyan and
international copyright laws
iv
ACKNOWLEDGMENT
Praise be to God almighty who enabled me to go all the way and complete this work I
thank my supervisors Dr Mirie Mwangi Prof James Muranga Njihia and Dr Duncan
Elly Ochieng for their immense support and ensuring that I completed the course I also
thank Prof Erasmus S Kaijage Prof Kibera Dr Iraki Dr Mary Kinoti Dr Iraya and Dr
Josphat Lishenga for their invaluable input My appreciation also goes to Mr Eric Asuma of
the Nairobi Securities Exchange for availing and facilitating data collection Many people
who contributed to the successful completion of this work including Mr Johnstone Lukokolo
Mandila and Ms Miriam V Ongrsquoanyo I say thank you all
v
DEDICATION
I dedicate this work to my dear wife Naomi Khakasa daughter Marion Metah and son
Collins Agala for their encouragement To my dear parents Mr Andrew Mutende and Mrs
Elizabeth Mutende the sacrifice you made for me since 1979 when I joined Kakunga nursery
school to date is immeasurable All my brothers and sisters thank you so much for your
support
vi
TABLE OF CONTENTS
DECLARATION ii
COPYRIGHT copy iii
ACKNOWLEDGMENT iv
DEDICATION v
LIST OF TABLES x
LIST OF FIGURES xi
ABBREVIATIONS AND ACRONYMS xii
ABSTRACT xv
CHAPTER ONE INTRODUCTION 1
11 Background to the Study 1
111 Firm Performance 3
112 Free Cash Flows 6
113 Agency Costs 7
114 Firm Characteristics 9
115 Firms Listed at the Nairobi Securities Exchange 12
12 Research Problem 15
13 Objectives of the Study 19
131 Broad Objective 19
132 Specific Objectives 20
14 Research Hypothesis 20
15 Value of the Study 21
16 Operational Definition of Terms 22
161 Free Cash flows 22
162 Agency Costs 22
163 Firm Characteristics 23
164 Firm Performance 23
17 Organization of the Thesis 24
vii
CHAPTER TWO LITERATURE REVIEW 26
21 Introduction 26
22 Theoretical Foundation of the Study 26
221 Free Cash Flow Hypothesis 27
222 Agency Theory 28
223 Stakeholder Theory 29
224 Stewardship Theory 31
225 The Resource Based View Theory 33
226 Organizational Theory 36
23 Free Cash Flows and Firm Financial Performance 38
24 Free Cash Flows Agency Costs and Firm Financial Performance 40
25 Free Cash Flows Firm Characteristics and Firm Financial Performance 42
26 Free Cash Flows Agency Costs Firm Characteristics and Firm Financial Performance45
27 Summary of Knowledge Gaps 48
28 Conceptual Framework 55
29 Chapter Summary 56
CHAPTER THREE RESEARCH METHODOLOGY 57
31 Introduction 57
32 Research Philosophy 57
33 Research Design 59
34 Population of the Study 59
35 Data Collection 60
36 Reliability and Validity 60
361 Reliability Test 61
362 Validity Test 62
37 Operationalization of the Study Variables 63
viii
38 Data Analysis 66
39 Choice of Panel Data Analysis Model 67
391 Effect of Free Cash Flows on Financial Performance 68
392 Free Cash Flows Agency Costs and Financial Performance 68
393 Free Cash Flows Firm Characteristics and Financial Performance 70
394 Relating all the Variables 71
310 Chapter Summary 74
CHAPTER FOUR DATA ANALYSIS AND FINDINGS 74
41 Introduction 75
42 Pre-estimation Diagnostics 75
421 Normality test 75
422 Reliability Tests 80
423 Test for Linearity 81
424 Bartletts Test for Internal Consistency 82
425 Multicollinearity Test 83
43 Descriptive Statistics 85
44 Chapter Summary 86
CHAPTER FIVE TESTS OF HYPOTHESES AND DISCUSSION 87
51 Introduction 87
52 Correlation Analysis 87
53 Hypotheses Testing Using Regression Analysis 89
531 Free Cash Flows and Financial Performance 90
532 Free Cash Flows Agency Costs and Financial Performance 92
533 Free Cash Flows Firm Characteristics and Financial Performance 97
534 Free Cash Flows Agency Costs Firm Characteristics and Financial Performance
104
54 Discussion 107
ix
541 The Influence of Free Cash Flows on Financial Performance 107
542 The Influence of Agency Costs on the Relationship between Free Cash Flows and
Financial Performance 109
543 The Influence of Firm Characteristics on the Relationship between Free Cash
Flows and Firm Performance 110
544 The Joint Effect of Free Cash Flows Agency Costs and Firm Characteristics on
Financial Performance 112
55 Summary and Presentation of Empirical Models 115
CHAPTER SIX SUMMARY OF FINDINGS CONCLUSIONS AND
RECOMMENDATIONS 117
61 Introduction 117
62 Summary of Findings 118
63 Conclusions 120
64 Contributions of the Study 121
641 Contribution to Theory 121
642 Contribution to Policy 122
643 Contribution to Practice 123
65 Limitations of the Study 124
66 Recommendations of the Study 125
67 Suggestions for Further Research 126
REFERENCES 127
APPENDICES i
Appendix I Firms Listed at the Nairobi Securities Exchange as at December 31 2015 i
Appendix II Data Collection Form iv
x
LIST OF TABLES
Table 21 Summary of Knowledge Gaps 50
Table 31 Operationalization of Study Variables 64
Table 32 A Summary of Statistical Tests of Hypotheses 72
Table 41 Normality Test 76
Table 42 Reliability Scores for Individual Variables 81
Table 43 Test for Linearity 81
Table 44 Bartlettrsquos Test 83
Table 45 Multicollinearity Test 84
Table 46 Descriptive Statistics for Secondary Data ndash 2006 to 2015 85
Table 51 Pearson Product-Moment Correlations among the Dependent Independent
Intervening and Moderating Variables 88
Table 52 Panel Data Results for Free Cash Flows and Financial Performance 90
Table 53 Panel Data Results of Agency Costs as the Dependent Variable and Free Cash flows
as the Independent Variable 93
Table 54 Panel Data Results of Financial Performance as the Dependent Variable while
Agency Costs and Free Cash flows are the Independent Variables 95
Table 55 Panel Data Results for Financial Performance as the Dependent Variable and FCF
and Firm Age as the Predictor Variables 98
Table 56 Panel Data Results for Financial Performance as the Dependent Variable and FCF
and Firm Age as the Predictor Variables Centered Approach 99
Table 57 Panel Data Results for Financial Performance as the Dependent Variable and FCF
and Firm Size as the Predictor Variables 101
Table 58 Panel Data Results for Financial Performance as the Dependent Variable and FCF
and Firm Size as the Predictor Variables Centered Approach 102
Table 59 Panel Data Results for Free Cash Flows Agency Costs Firm Characteristics and
Financial Performance 105
Table 510 Summary of Tests of Hypotheses Results and Conclusions 114
xi
LIST OF FIGURES
ABBREVIATIONS AND ACRONYMS xii
Figure 21 Conceptual Model 55
Figure 31 Path Diagram for Mediation effect of Agency Costs 69
Figure 41 Q-Q Plot for Free cash Flows (2006 ndash 2015)77
Figure 42 Q-Q Plot for Agency Costs (AC) ndash 2006 to 2015 77
Figure 43 Q-Q Plot for Firm Characteristics (Firm Age) ndash 2006 to 2015 78
Figure 44 Q-Q Plot for Firm Characteristics (Firm Size) ndash 2006-2015 79
Figure 45 Q-Q Plot for Firm Financial Performance ndash 2006 to 2015 80
Figure 51 Revised Empirical Model ndash Financial Performance 116
xii
ABBREVIATIONS AND ACRONYMS
AFM Association of Futures Markets
AIMS Alternative Investment Market Segment
ANOVA Analysis of Variance
ASEA African Securities Exchanges Association
BSC Balanced Score Card
CAPEX Capital expenditure
CCP Central Counter Party
CG Corporate Governance
CMA Capital Markets Authority
CSR Corporate Social Responsibility
DA Discretionary accruals
DY Dividend yield
EMIR European Market Infrastructure Regulations
EASEA East African Securities Exchanges Association
FCF Free Cash flows
FISMS Fixed Income Securities Market
FOMS Futures and Options Market Segment
xiii
IAS International Auditing Standards
IDRC The International Development Research Centre
IFRS International Financial Reporting Standards
KMO Kaiser-Meyer-Olkin
MIMS Main Investment Market Segment
NACOSTI National Commission for Science Technology and Innovation
NASI Nairobi Securities Exchange All Share Index
NSE Nairobi Securities Exchange
NPV Net Present Value
OLS Ordinary Least Squares
OTC Over the Counter
PAT Profit after Tax
Q-Q Quantile ndash Quantile
RBV Resource Based View
ROA Return on Assets
ROE Return on Equity
SACCOs Savings and Credit Cooperatives
xiv
SPSS Statistical Package for the Social Sciences
SSE Sustainable Stock Exchanges
RampD Research and Development
TQM Total Quality Management
UK United Kingdom
USA United States of America
VIF Variance Inflation Factor
WFE World Federation of Exchanges
xv
ABSTRACT
Firm performance is affected by various factors both internal and external to the firm
Internal factors include factors such as firm size age liquidity leverage free cash flows
agency costs profitability and growth prospects among others External factors include
regulation and general macro-economic factors This research sought to find out the
influence of agency costs and firm characteristics on the relationship between FCF and
firm performance The first study objective was to establish how FCF influence
performance of NSE listed firms The second objective was to find out how agency costs
influence the relationship between FCF and performance of NSE listed firms Thirdly to
determine how firm characteristics influence the relationship between FCF and
performance of NSE listed firms and lastly to establish the joint effect of FCF agency
costs and firm characteristics on the performance of NSE listed firms The study used
secondary panel data which were obtained from 60 firms listed at the NSE Secondary
data was for the period 2006 to 2015 Multiple and simple regression analyses were
employed Results indicate that FCF have a positive statistically significant effect on
firm performance and also agency costs have a statistically significant positive
intervening effect on the relationship between FCF and firm performance Additionally
firm characteristics have a positive moderating effect on the correlation between FCF and
financial performance Finally FCF agency costs and firm characteristics have a positive
statistically significant joint effect on firm performance These findings are inconsistent
with the agency theory and the FCF hypothesis Conversely the findings seem to support
the stewardship theory The study therefore recommends that firm managers
shareholders practitioners the government and other regulators should enhance firm
monitoring because the benefits derived from investing therein seem to outweigh the
costs Further research needs to be conducted using longitudinal study design and also by
integrating the views of other practitioners in data collection rather than focusing on firm
managers only
1
CHAPTER ONE INTRODUCTION
11 Background to the Study
The separation of firm proprietorship and management in public firms causes conflict of
interest between firm owners (principals) and firm managers (agents) While the primary
incentive of firm owners is to maximize their wealth by improving firm value the goals
of firm managers are varied and may include enrichment of personal wealth and status
This varying of interests sometimes leads managers to engage in insider dealings where
there are no mechanisms for effective monitoring validation and approving of
managerial decisions (Wang 2010)
Jensen and Meckling (1976) argue that managers opt to extract personal gain from the
firms if they do not hold shares in those firms This has the effect of raising agency costs
which are manifested through investment choices that are not efficient and or managers
not providing sufficient or efficient effort Rising agency costs may eventually affect firm
performance (Tirole 1986) Brush Bromiley and Hendrickx (2000) also hypothesize that
managerrsquos personal-interest encourages wastage and wastefulness when free cash flows
(FCF) are present which similarly could increase agency costs and eventually affect firm
performance Firm characteristics such as profitability firm size liquidity leverage sales
growth age of the firm board structure and composition asset growth turnover
dividend payout and growth prospects are argued to have an influence on the correlation
between FCF and firm performance (Subrahmanyam amp Titman 2001 Kogan amp Tian
2012 and Mukras amp Nzioka 2015)
2
Brush et al (2000) observe that agency theory examines how the behavior of managers
could be focused towards shareholdersrsquo interests to minimize agency costs Jensen and
Meckling (1976) and Jensen (1986) describe three kinds of agency costs First the
monitoring cost of managersrsquo decisions second the bonding cost of restricting
covenants and lastly residual loss due to suboptimal managerial actions The goal of
managers is to enhance personal wealth to the detriment of shareholders The FCF
hypothesis posits that this personal-interest encourages wastage when FCF are present
The stewardship theory is in direct contrast to the agency theory It views managers as
stewards who guard and enhance the wealth of shareholders since by so doing utility
functions of the managers are enhanced (Davis Donaldson amp Schoorman 1997)
Stakeholder theory on the other hand views managers and shareholders among others as
stakeholders and can therefore influence or be influenced by the attainment of the goals
and objectives of the firm (Donaldson amp Preston 1995) The resource based view (RBV)
theory contends that financial firm performance is influenced by firm specific
characteristics (Pierce amp Robinson 2011) Organizational theory on the other hand
attempts to describe the effect of size and firm age on firm performance (Kaen amp
Baumann 2003)
Nyongrsquoo (2000) observes that Kenya has had challenges with regard to the agency
problem and corporate governance (CG) in general The result of these challenges has
been generally low firm profits Ongore and KrsquoObonyo (2011) also note that agency
problems were equally experienced across the globe Several cases of firm failures are an
3
indictment of the efficiency and effectiveness of the current CG structures which fail to
deter FCF related agency costs This research centered on the FCF hypothesis and
agency theory seeks to discover the way agency costs and specified firm characteristics
influence the correlation between FCF and the performance of Nairobi Securities
Exchange (NSE) listed firms Ayako Kungu and Githui (2015) observe that whereas
most NSE listed firms record good performance there are others that have presented
declining performance and yet others have even been delisted from the bourse during the
period between 2003 and 2014 Ongore and Krsquo Obonyo (2011) and Njuguna and
Moronge (2013) have attributed the decline during the period to the agency problem
111 Firm Performance
Gleason and Barnum (1982) define firm performance as a firmrsquos ability to achieve
planned outcomes as measured against projected outputs It encompasses outcomes
associated with shareholder return market performance and financial performance On
the other hand Daft (1995) defines firm performance as the ability to achieve objectives
by expending resources effectively and efficiently Firm performance may also be viewed
as incorporating specifically three areas of organizational outcomes shareholder return
financial return and market performance each with its specific indicators (Richard
Divinney Yip amp Johnson 1999)
Performance is an important concept that is at the centre of a firm and its measurement is
critical in determining whether the firm is achieving the desired objectives Market
performance is measured by assessing customer satisfaction customer retention value
4
delivered to customers and market share While the importance of firm performance is
broadly acknowledged debate on the bases for performance measurement still abound
Researchers should also use operational indicators in addition to using financial
indicators These may include product quality introduction of new products marketing
effectiveness and manufacturing value-addition which may replicate the firmrsquos
competitive position in its industry space and might influence financial performance In
operationalization of firm performance the use of multiple indicator approach would be
superior to the use of only a single indicator (Venkataram amp Ramanujan 1986)
Neely (1998) defined performance measurement systems as comprising of three
interrelated components specific measures that quantify the effectiveness and efficiency
of activities a set of measures that jointly evaluate firm performance as a whole and a
supportive structure that allows data to be collected organized examined deduced and
disseminated Performance measurement is therefore multidimensional On the other
hand Bourne Neely Mills and Platts (2003) describe it as the practice of measuring
effectiveness and the efficiency of an action Efficiency is a measure of how cost-
effective the resources of the firm are used when providing the specified customer service
while effectiveness is the extent to which customer needs are met
The Balanced Score Card (BSC) was developed by Kaplan and Norton (2001) and it
measures customer satisfaction financial performance growth perspectives learning and
of performance and efficiency of internal business processes The sustainable BSC has
been applied to integrate the social and environmental aspects into effective application
5
of both conventional firm strategy and explicit firm sustainability strategies (Figge Hanh
Schaltegger amp Wagner 2002)
The triple bottom line performance measurement integrates the corporate economic
environmental and social performance (Norman amp MacDonald 2004) while the
International Development Research Centre (IDRC) model conceives firm performance
in three general areas First is performance in actions that support the operation
(effectiveness) second is performance related to the available resources (efficiency) and
lastly performance is related to long-term capability or continuing relevance (Lusthaus
Anderson amp Murphy 1995) Other performance measurement techniques include the
Performance Prism and the Cambridge Performance Measurement Process (Neely
Adams amp Kennerley 2002)
Dyer and Reeves (1995) observe that there are no performance measures universally
appropriate and multiple measures should therefore be used Wang (2010) and Ongore
and KrsquoObonyo (2011) use ROA ROE and Dividend Yield (DY) to measure financial
performance Szewczyk Tsetsekos and Zantout (1996) and Mojtahedzadeh and
Nahavandi (2009) have used Tobinrsquos Q as a market-based measure of a firmrsquos financial
performance Tobinrsquos Q relates the market value of firmsrsquo equity with their
corresponding book values Employee job satisfaction employee turnover organizational
effectiveness and efficiency have been proposed by Gleason and Barnum (1982) as non-
financial measures of firm performance Hubbard (1998) observes a positive significant
6
correlation between FCF and performance which is manifested through prudent
investment
112 Free Cash Flows
The concept of FCF presented by Jensen (1986) refers to surplus cash available after
financing profitable ventures FCF are therefore described as net operating income minus
capital expenditure (CAPEX) minus cost of inventory and paid out dividends On the
other hand Brealey Myers and Allen (2005) describe FCF as net income profit after tax
(PAT) plus amortization and depreciation minus CAPEX minus changes in non-cash
working-capital add net borrowingsloans Richardson (2006) argues that firms which
have surplus funds risk wasting it in ventures that are not profitable and that because
FCF are financial resources at the managersrsquo discretion to apportion they are also
referred to as idle cash flows
FCF denotes funds that a firm is able to generate after setting aside cash needed to sustain
or increase its assets FCF are important because they allow firms to pursue investments
that could improve value to shareholders In the absence of funds it is hard to create new
products and services acquire new projects pay out dividends and pay debts Some
shareholders believe that FCF show a better perspective of the firmrsquos ability to create
profits because while earnings can often be misrepresented through accounting
gimmicks it is more difficult to fake FCF Positive FCF indicate that the firm is
generating more funds than are being used to run the firm and to reinvest Many small
firms do not have positive FCF because they invest heavily to grow their operations It is
7
worth-noting that generally negative FCF detrimental to the firm Negative FCF could
be an indication that the firm is engaged in huge investment projects If high returns are
earned from these investments then there is a long run potential payoff (Chen Sun amp Xu
2016)
Jensen (1986) argues that managersrsquo personal - interest motive leads to waste and
inefficiency when FCF are present because the objective of the managers is to increase
their personal wealth instead of shareholdersrsquo wealth Therefore when FCF are present
the result is internal inefficiency and wastage of firm resources which leads to increased
agency costs and lower firm performance Similarly Wang (2010) observes that in the
presence of surplus FCF managers tend to abuse the FCF resulting in inefficient resource
allocation and wrongful investment
113 Agency Costs
Agency costs refer to the cost that a firm incurs due to incongruent interests of firmsrsquo
management and shareholders (Berle amp Means 1932) Jensen and Meckling (1976) point
out that the incomplete manager and shareholder contractual relationship can result into
the agency problem The agency problem that is caused by the firm managers would
result in a loss to the wealth of shareholders in the following ways first managers from
the characteristic of personal-interest drive would raise perquisite consumption and
shirking behavior that in turn leads to increased agency costs Secondly managers might
fail to choose the highest Net Present Value (NPV) project and instead choose that which
maximizes their own personal interest thereby exposing shareholders to unnecessary
investment risk
8
Jensen (1986) claims that there are three kinds of agency costs the monitoring cost of
managersrsquo decisions the bonding cost of restricting agreementcontracts and the residual
loss due to suboptimal managersrsquo actions Monitoring costs are manifested once the
shareholders try to regulate or control the managersrsquo actions For example the auditors
are engaged by a firm on shareholdersrsquo behalf to check and control the managersrsquo
activities to confirm conduct that increases value for the shareholders The pricecost of
engaging the auditors is therefore considered an agency cost The bonding cost entails
bond covenants or contracts A bond covenant is an agreement that restricts the firm from
venturing in specified actions such as a limitation on dividend payment Firm claims
could be structured in a way that controls shareholdersrsquo motive to follow a strategy that
does not increase the total firm value This inherent cost is an agency cost And lastly
residual loss is the cost sustained from conflicting shareholder and manager interests
notwithstanding the use of monitoring and bonding (Smith amp Warner 1979)
Brush et al (2000) argue that once a firm has generated excess FCF management tends
to misuse the FCF resulting in increased agency costs which could eventually lower
firm performance Khidmat and Rehman (2014) on the other hand observe that agency
costs of monitoring could increase as a result of increased FCF and consequently improve
firm performance This is because the firm is able to invest in better CG mechanisms
which improve monitoring managerial decisions and hence reduced wastage Agency
costs are therefore expected to mediate the correlation between FCF and firm
performance because they are intermediate output of FCF Wang (2010) states seven
proxy agency cost measures earnings volatility total asset turnover floatation costs
9
advertising research and development (RampD) expenses to sales ratio operating expenses
to sales ratio free cash flows and administrative expenses to sales ratio
Tirole (1986) argues that there are two main ways through which agency costs are
manifested the first one is inefficient choice of investment and the second is insufficient
or inefficient effort spent by managers Therefore agency cost measures should be
contingent on inefficient asset utilization (due to poor investment choices) excessive cost
of production and extravagant perks for managers (which results in unnecessarily high
expenditure) and inefficient effort spent by managers (the results of which is lower
revenue and profitability) Asset utilization efficiency is measured by assets turnover
ratio which is described as the ratio of sales to assets It indicates the way managers use
the assets under their control in generating revenue Production cost efficiency on the
other hand is measured as operating expenses divided by sales Singh and Davidson
(2003) observe that a high level of operating expense is a close estimate of managersrsquo pay
and perquisites in terms of high salaries executive and lavish offices and other corporate
support amenities To a large extent these costs reflect discretionary expenditure at the
disposal of firm managers
114 Firm Characteristics
Zou and Stan (1998) define firm characteristics as a firmrsquos managerial and demographic
variables that in turn encompass part of the firmrsquos internal environment Firm
characteristics have been listed by Kogan and Tian (2012) to include firm size leverage
liquidity sales growth asset growth and turnover Others include ownership structure
board characteristics age of the firm dividend pay-out profitability access to capital
10
markets and growth opportunities (Subrahmanyam amp Titman 2001 and McKnight amp
Weir 2008)
Vogt (1997) argues that the more a firm has FCF the more it engages into capital
investment and hence the higher the performance Smaller firms gear towards rampant
growth thereby utilizing most or all the available FCF in a bid to better firm
performance The relationship between FCF and investment is stronger in small and
medium firms which generally are in the growth stage Adelegan (2009) on the other
hand notes that the influence of firm size is neutral and that firms that are older incline
more on internally generated funds to finance their business investments than small and
medium firms
Cline Williamson and Yore (2014) observe that the FCF problem seems to be intense in
medium and large multinationals that are less reliant on the capital market The smaller
firms that fund their investments with funds that are generated externally do not
experience such declines in wealth This is because firms that are larger have
considerably more FCF that are available and are subsequently less dependent on the
external market When high FCF are available the unconstrained manager may
socialistically fund investment projects that have a negative NPV Increased levels of
FCF lead to sub-optimal allocation of resources in form of value-destroying and cross-
subsidizing investment action that eventually deteriorates firm performance
Firm age and performance relationship is to a large extent driven by selection and
learning effects in the early stages of the firmrsquos life Once a firm is older the relationship
11
could be more indirect due to a correlation between age of the firm and ownership
changes product life cycle size of the firm and management Usually firms that are new
require time to adapt to the environment A new firm needs to catch up with an older firm
when the new firmrsquos performance is lower than that of the older (existing) firm so as to
be competitive in the market Therefore it is expected that firms that are new will show
higher growth rates in productivity than the older firms as a result of high FCF Hence
age of the firm is negatively correlated with productivity growth rate because older firms
have lower FCF (Brouwe Kok amp Fris 2005)
Similarly Cadogan and Diamantopoulos (1995) note that as firms become older and
more experienced they tend to be more bureaucratic and inflexible Demsetz and Lehn
(1985) denote firm size as the log of total assets and argue that in smaller firms agency
costs related to the FCF problem may be relatively lower than in larger firms because of
more growth opportunities available for smaller firms Larger firms tend to overinvest
thereby generating a relatively lower return on assets (ROA)return on equity (ROE)
Opler and Titman (1993) maintain that more likely firms that have high growth
prospects are managed better than those with less growth prospects Such firms are also
less likely to have surplus FCF since any available cash would be spent on projects that
have positive NPV Thakor (2013) further argues that foreign cash in firms that have
good growth opportunities should be valued significantly higher than foreign cash in
firms that have poor growth prospects since firms that have poor growth prospects are
more likely to be adversely affected by the repatriation tax burden and FCF problems
12
stemming from a relatively low shadow price of cash This further implies that foreign
cash for firms that have poor investment prospects ought to be valued at a discount while
foreign cash for firms that have good investment prospects should be valued at a
premium
Heydari Mirzaeifar Javadghayedi and Student (2014) postulate that firm characteristics
can expose a firm to more managerial costs and thus decrease the expected positive effect
of FCF on firm performance Firm characteristics are therefore expected to moderate the
correlation between FCF and firm performance because their interaction affects the
strength and or direction of the correlation between the dependent and independent
variables (Baron amp Kenny 1986) This study focused on firm characteristics of firm size
and age of the firm because their influence on the correlation between FCF and firm
performance seem to be more significant (Demsetz amp Lehn 1985 and Mule Mukras amp
Nzioka 2015)
115 Firms Listed at the Nairobi Securities Exchange
NSE is the primary stock market in Kenya Apart from equities the NSE deals with the
issue and trade of debt instruments NSE is a member of East African Securities
Exchanges Association (EASEA) and the African Securities Exchanges Association
(ASEA) and also an associate member of World Federation of Exchanges (WFE) a
subordinate member of the Association of Futures Markets (AFM) Additionally the
NSE is a partner Exchange in the United Nations Sustainable Stock Exchanges Initiative
(SSE) The NSE is a market for securities approved and controlled by the Capital
13
Markets Authority (CMA) and has 63 listed firms (Appendix I) Introduced in 2008 the
NSE All Share Index (NASI) is a general indicator of market performance The NASI
integrates all the daily transacted shares therefore giving the general outline of the value
of the market as opposed to the activities of selected securitiesrsquo prices The daily trading
volume of the market is valued at over US $5000000 and a total market capitalization
estimate of US $15000000000 Corporate bonds government bonds and equities are
also traded at the NSE (NSE 2015)
Odundo (2009) notes that as part of the NSE market transformation program the CMA
introduced market improvements in 2001 which led to the restructuring of the NSE into
four separate segments The Alternative Investments Market Segment (AIMS) Main
Investments Market Segment (MIMS) Fixed Income Securities Market Segment
(FISMS) and the Futures and Options Market Segment (FOMS) Development of the
capital market has remained Kenyarsquos strategic development goal since the mid-1980s
The government has realized significant reforms over the last three decades to underpin
the countryrsquos development prospects including modernization of the NSE which includes
computerization of trading divergence of listed securities and stocks dematerialization
and improvement of regulatory and supervisory structures The NSE is among the fastest
growing stock exchanges in the developing markets and is the largest in East Africa
(Ayako et al 2015)
The NSE (2015) indicates that Kenyarsquos capital market has continued to develop The
NSE signed up six clearing members as the exchange readied itself to introduce a
14
derivatives market These clearing members include Cooperative bank of Kenya
Barclays bank of Kenya NIC bank CBA and CFC Stanbic bank Other banks are slated
to sign up and the clearing members would by executing the principal role of clearing
and settling deals strengthen the NSErsquos abilities to begin derivatives trading The
derivatives mechanisms will primarily comprise currency futures and stock indices and
will work to expand liquidity in the market increasing the boursersquos product offer The
NSErsquos derivative market which received authorization from CMA will permit
derivatives that are exchange traded and created on various underlying financial
instruments that will include equities and currencies
The universal world norm has been a system of central counterparty (CCP) clearing and
reporting represented by the European Market Infrastructure Regulationsrsquo (EMIR) latest
rules Further to demanding central clearing of standardized Over-the-Counter (OTC)
derivatives that wasnrsquot the practice earlier EMIR presented other numerous processes to
minimize counterparty risk a significant matter which led to contagion in the recent
global financial crisis The NSE derivatives contracts will be exchange traded and
therefore clearing members will be critical components of the CCP clearing network
(NSE 2015) The CMA (2010) shows that as of 2008 the most actively traded market in
Africa was South Africa recording over 70 percent of the whole African securities
markets revenue making it the most liquid securities market in Africa with the NSE
ranking 5th
with 02 per cent contribution
15
The NSE listed firms were selected for this study because data is readily available and
also the data is generally deemed credible Ponnu and Okoth (2009) observe that several
challenges ranging from boardroom wrangles poor decision making lack of oversight to
control by various boards of directors and unethical practices have been evident among
the listed firms resulting in a trend of poor performance Similarly NSE (2015) shows
that several listed firms have previously been delisted liquidated or placed under
receivership on account of the agency problem
12 Research Problem
The FCF hypothesis suggested by Jensen (1986) states that firm managers may invest in
needless negative NPV projects when there is surplus FCF at their disposal The
hypothesis suggests that greater levels of FCF could lead to more unnecessary
administrative waste and inefficiency negatively impacting on firm performance
Demsetz and Lehn (1985) find that in the presence of substantial FCF large firms tend to
have fewer growth opportunities than smaller ones which could lead to an
overinvestment problem thereby negatively impacting on firm performance Similarly
Gul and Tsui (1998) note that an escalation in financial leverage seems to diminish
agency costs because managers are subject to legal bonding of repaying interest and debt
that subsequently decreases misuse of FCF and therefore improves firm performance
The agency problem accounting anomalies and other governance manipulations is a
worldwide phenomenon affecting many firms including Enron Corporation of the United
States of America (USA) and China Aviation (Ongore amp KrsquoObonyo 2011) The World
16
Bank (2000) indicates that the failure of major conglomerates such as the Bank of Credit
and Commerce International and WorldCom in the USA and United Kingdom (UK)
respectively has inspired interest in the agency problem and governance The economic
crisis in Asia has also contributed to the rising profile of the agency problem In the East
African region the agency problem and governance have been discussed in the
framework of state-run companies where corruption malpractice and subsidization of
deteriorating firms by the government have been the major issues of concerns The
Kenyan context has been characterized by appeals for active CG particularly for public
firms (Okiro 2014) The recent financial problems facing Fidelity commercial bank
Charterhouse bank Imperial bank and Chase bank could be related to the agency problem
between shareholders and firm managers (Central Bank of Kenya 2016)
Frentrop (2003) has recounted that there is still lack of consensus on identifying the
extent and dealing with the complications that are intrinsic in CG processes Waithaka
Ngugi Aiyabei Itunga and Kirago (2012) observe that FCF have caused conflict between
firm managers and shareholders which in turn have affected performance of NSE listed
firms Similarly Ongore and KrsquoObonyo (2011) noted existence of agency problems
among firms listed at the NSE which negatively affected their performance These
observations are consistent with Nyongrsquoo (2000) who posits that the low firm
performance across the Kenyan economy is primarily due to agency problems and bad
CG practices
17
Globally empirical literature shows mixed findings regarding FCF and firm performance
For instance Nekhili Amar Chtioui and Lakhal (2014) carried out a study in Australia
and found increased agency costs emanating from the presence of FCF Similarly Brush
et al (2000) conducted a study in the USA and found that weak CG caused inefficiency
in the allocation of FCF While these findings support the argument that FCF negatively
affects firm performance on the contrary Gregory (2005) whose study was carried out
in the UK established that the mergers with higher FCF were performing better than
mergers with lower FCF In addition a study by Szewcyzk et al (1996) in the USA
found that shareholders favored firms that had both significant FCF and investment
opportunities that were profitable Locally Wambua (2013) found a positive correlation
between FCF and performance of NSE listed firms which again invalidates the
hypothesis which states that there is a negative correlation between FCF and performance
of the firm Conversely Njuguna and Moronge (2013) found that agency conflicts within
firms listed at the NSE are related to FCF which negatively affects firm performance
Regarding the moderating effect of firm characteristics Hendricks and Singhal (2001)
found that smaller firms tend to have better performance in terms of higher sales growth
Similarly Kinoti (2012) found a statistically positive moderating effect of firm
characteristics (ownership age of the firm firm size and type of industry) on the
correlation between corporate image and performance of the firm Conversely Njeru
(2013) found that firm characteristics did not have a statistically significant moderating
effect on the correlation between market orientation and performance In view of these
18
contradicting results it was necessary to further investigate the moderating influence of
firm characteristics on the correlation between FCF and performance of the firm
Some prior studies portray or tend to equate FCF to agency costs For instance Jensen
(1986) presents his study as ldquoagency costs of FCF corporate finance and takeoversrdquo
while Lin and Lin (2014) describe their study as ldquoagency costs of FCF and biddersrsquo long-
run takeover performancerdquo Furthermore Wang (2010) mentions seven proxy measures
of agency costs and one of the proxy measures equates FCF to agency costs These
studies do not give a clear distinction between agency costs and FCF This study has
attempted to delineate FCF from agency costs and has also attempted to provide linkages
between all the study variables
Wang (2010) and Lin and Lin (2014) excluded CAPEX and net borrowings in their
operationalization of FCF This study included both CAPEX and net borrowings in the
definition of FCF Additionally unlike Njuguna and Moronge (2013) who used asset
utilization efficiency as the sole measure of agency costs this study also incorporated
production cost efficiency to measure agency costs that arise out of monitoring
managementrsquos actions These measures of FCF and agency costs are more robust
Furthermore some of the prior studies are bivariate For instance Njuguna and Moronge
(2013) and Wambua (2013) focused on the influence of agency costs on firm
performance In this study a multivariate analysis was employed where the joint effects
of FCF agency costs firm characteristics and firm performance were all incorporated
While many of the studies were carried out in developed economies such as Australia
19
France UK and the USA this study focused on firms listed at the NSE employing cross-
sectional and panel data research designs
In summary this study sought to fill the identified knowledge gaps which constitute the
research problem as follows first global empirical study findings are mixed and non-
conclusive This study therefore focused on firms listed at the NSE and used panel data
design Secondly the study sought to delineate FCF from agency costs Third the study
incorporated the major firm characteristics of firm size and age Fourth CAPEX and net
borrowings were incorporated in defining FCF Fifth two measures of agency costs were
incorporated and these are asset utilization efficiency and production cost efficiency
Lastly a multivariate study was adopted as opposed to bivariate This research was
guided by the following study question How significant is the influence of agency costs
and firm characteristics on the relationship between FCF and financial performance of
firms listed at the NSE
13 Objectives of the Study
The broad objectives and specific objectives of the study are here-below stated
131 Broad Objective
The broad objective of this research was to determine the effect of agency costs and firm
characteristics on the relationship between FCF and financial performance of firms listed
at the Nairobi Securities Exchange Kenya
20
132 Specific Objectives
i Establish the relationship between free cash flows and financial performance of
firms listed at the Nairobi Securities Exchange
ii Assess the influence of agency costs on the relationship between free cash flows
and financial performance of firms listed at the Nairobi Securities Exchange
iii Determine the influence of firm characteristics on the relationship between free
cash flows and financial performance of firms listed at the Nairobi Securities
Exchange
iv Establish the joint effect of free cash flows agency costs and firm characteristics
on financial performance of firms listed at the Nairobi Securities Exchange
14 Research Hypothesis
H1 Free cash flows have no significant effect on the financial performance of firms listed
at the Nairobi Securities Exchange
H2 Agency costs have no significant intervening effect on the relationship between free
cash flows and financial performance of firms listed at the Nairobi Securities Exchange
H3 Firm characteristics have no significant moderating effect on the relationship
between free cash flows and financial performance of firms listed at the Nairobi
Securities Exchange
H3a Firm age has no significant moderating effect on the relationship between
FCF and financial performance of firms listed at the NSE
21
H3b Firm size has no significant moderating effect on the relationship between
FCF and financial performance of firms listed at the NSE
H4 There is no joint effect of free cash flows agency costs and firm characteristics on
financial performance of firms listed at the Nairobi Securities Exchange
15 Value of the Study
This study was intended to provide insights into knowledge about how agency costs and
firm characteristics influence the relationship between FCF and the financial performance
of NSE listed firms This research examined the validity of the FCF hypothesis agency
theory stakeholder theory stewardship theory RBV theory and the organizational theory
and established linkages between these theories thereby interrogating existing
knowledge to affirm modify or reject it The research community in finance will benefit
from the study because it is intended to aggregate and provide important quantitative
literature that will bridge the existing knowledge gap regarding FCF agency costs firm
characteristics and financial performance of firms listed at the NSE It will also serve as
a foundation upon which more empirical studies will be built hence propagating
knowledge
This study sought to establish the correlation between FCF agency costs firm
characteristics and firm performance Investors firm managers and other practitioners
will benefit from the study because it delineates FCF from agency costs and also brings
out the linkages between FCF agency costs firm characteristics and firm performance
Firm managers are expected to act more prudently and efficiently in their pursuit of
maximizing shareholdersrsquo wealth through better firm performance Investors and other
22
practitioners will build on the understanding of the linkages between these variables to
help improve firm performance
The NSE and the listed firms have high growth potential given the various initiatives
being undertaken at the bourse such as demutualization restructuring and introduction of
derivatives trading The government NSE and CMA stand to benefit from this study
because the insights and intuitions gained from the study will help in the development
and improvement of existing policies guidelines and regulation
16 Operational Definition of Terms
The key study variables have been defined as follows
161 Free Cash flows
The term free cash flows refers to the sum of surplus funds available after funding
profitable projects This is described as net income plus depreciation and amortization
less capital expenditure less change in non-cash working capital plus net borrowing
(Brealey Myers amp Allen 2005)
162 Agency Costs
Agency costs refer to the cost that a firm incurs due to inconsistent interests of
management and shareholders (Berle amp Means 1932)
23
163 Firm Characteristics
Firm characteristics refer to a firmrsquos demographic and managerial variables which in turn
comprise part of the firmrsquos internal environment Firm characteristics include firm size
leverage liquidity sales growth asset growth and turnover age of the firm dividend
pay-out profitability access to capital markets and growth opportunities (Zou amp Stan
1998 Kogan amp Tian 2012 Subrahmanyam amp Titman 2001 and McKnight amp Weir
2008) This study focused on firm size and age of the firm
164 Firm Performance
In this research the term firm performance is used interchangeably with organizational or
corporate performance Firm performance refers to an assessment of an organization in
terms of its ability to achieve its stated objectives over a given period of time Firm
performance is broad and has to be studied with reference to its indicators A firm that is
able to meet its objectives is considered to be successful (Sagwa 2014) For this study
firm performance was measured in terms of financial performance
Financial performance perspective may be measured using Tobinsrsquo Q ROA ROE DY
sales growth rate market share productivity and profitability among others This study
used Tobinrsquos Q to measure financial performance Tobinrsquos Q compares the market value
of a firmrsquos equity with its corresponding book values
24
17 Organization of the Thesis
This thesis contains six chapters The first chapter has the introduction and background to
the study The NSE has also been discussed the research problem research objectives
value of the study scope and how the study is organized In chapter two the theoretical
framework on which the study is based has been discussed
The chapter reviews the theoretical and empirical literature relating to the linkages among
the study variables The theories reviewed are The free cash flow hypothesis agency
theory stakeholder theory stewardship theory RBV theory and the organizational
theory
Empirical literature has focused on the relationships among the variables as follows FCF
and firm performance FCF agency costs and firm performance FCF firm
characteristics and firm performance FCF agency costs firm characteristics and firm
performance A summary of knowledge gaps has been presented and finally the chapter
ends with the conceptual framework that guides the study and the conceptual hypotheses
Chapter three has identified and discussed the philosophical orientation the study design
and population of the study
Additionally it has highlighted data collection methods reliability and validity
considerations operationalization of the study variables and analytical data models
Chapter four presents the findings of the general data analysis starting with test of
25
validity and reliability then the descriptive statistics including frequency tables
percentages standard deviations means and Cronbachrsquos Alpha Coefficient of reliability
A presentation of the results of the test of hypotheses and interpretation has been featured
under chapter five The chapter has concluded by a discussion of the resultsfindings
Chapter six gives a summary of the findings conclusion study implications limitations
and recommendations for further studies
26
CHAPTER TWO LITERATURE REVIEW
21 Introduction
The chapter has explored the theoretical foundations of the study Empirical literature has
also been discussed under four sections as follows First FCF and financial performance
second FCF agency costs and financial performance third FCF firm characteristics
and financial performance and lastly FCF agency costs firm characteristics and
financial performance
This chapter also gives a summary of knowledge gaps a graphical framework of the
study variables (FCF agency costs firm characteristics and financial performance)
depicting the researcherrsquos conceptualization of the study It then concludes with the
conceptual hypotheses
22 Theoretical Foundation of the Study
The theoretical framework upon which this study is based is varied Six theories have
been discussed and these are FCF hypothesis agency theory stakeholder theory
stewardship theory RBV theory and the organization theory The research sought to
establish the influence of agency costs and firm characteristics on the correlation between
FCF and performance of NSE listed firms
Although the agency theory stakeholder theory stewardship theory RBV theory and the
organization theory contribute heavily in attempting to explain the interaction between
27
the identified variables and their combined effect on firm performance the FCF
hypothesis is the overarching theory on which this study is founded
221 Free Cash Flow Hypothesis
The notion of FCF was initially suggested by Jensen (1986) where FCF was described as
net cash flow after subtracting all the needs of positive NPV ventures Jensen (1986)
submits that when there are surplus FCF the severity of the agency conflict between firm
shareholders and firm managers is higher The reason for the conflict is that when there is
excess cash in the firm there is no need for the management to raise cash from the capital
market This gives firm management the freedom to spend invest without being
monitored by capital providers as would have been the case if such funds were raised
from the capital market Shareholders would rather have such excess funds distributed
back to them through share repurchase programs or as dividends if the growth
opportunities for the firms are limited and the funds could not be prudently invested
elsewhere Management on the other hand would waste the surplus funds in unprofitable
investments administrative waste and managerial perks
FCF hypothesis postulates that when firms have made significant FCF and the firms do
not have gainful investment projects available firm managers tend to misuse the FCF
which consequently raises agency costs Critics of the FCF hypothesis claim that it
nurtures short termism by discouraging investment that would bring profit in the long-
run This study is related to the FCF hypothesis because based on the observation by
Brush et al (2000) managersrsquo personal-interest inspires wastefulness and ineffectiveness
28
when there is surplus FCF This study sought to establish the influence of agency costs
and firm characteristics on the relationship between FCF and firm performance In this
study therefore it was expected that FCF would have a negative effect on firm
performance
222 Agency Theory
The agency theory was advanced by Jensen and Meckling (1976) and it avows that
shareholders who are the owners (principals) of the firm hire firm managers (agents)
The principal expects the agent to make decisions and act in the ownerrsquos principalrsquos best
interest The managers agents may however have self-interests that conflict with the
interests of the principals Brush et al (2000) observe that agency theory is founded on
the principle that the objective of the management is to achieve their individual interests
instead of shareholdersrsquo interests and that managersrsquo personal-interest encourages waste
and ineffectiveness when there are surplus FCF
Agency theory suggests mechanisms that aim to resolve the shareholder interests and
those of the management The mechanisms include external control measures like
takeovers (Easterwood 1997) The potential for conflict between shareholders and
managers may also be minimized by the use of internal control measures like non-
executive directorsrsquo monitoring and executive share ownership incentives The advocates
of agency theory postulate that control measures are mandatory for directing dishonest
managerial actions Critics on the other hand argue that control creates stronger personal
behavior lessens proactive organizational actions and honesty and lastly results in
suspicion (Jensen amp Meckling 1976)
29
Divergences in goals and attitude towards risk and decentralization in information are
tenets of the agency theory If the information asymmetry and conflict of interestsrsquo
assumptions and are allayed the agency problem then becomes inconsequential and not
of any interest scientifically If there were no information asymmetry the principal would
simply direct and control the agentrsquos actions and appropriately reward the agent If the
principal and the agent have consistent interests then the agentrsquos incentives are clear
(Podrug 2010)
A critique of the agency approach is that the analytical focus on how to resolve conflict
between the various stakeholders in the firm is too narrow and the shareholders are not
the only ones who make investment in the firm (Donaldson 1990) Additionally Hill
(1990) has argued that even in situations of very specific assets where the possibility of
unscrupulousness is very high there are people who will give precedence to collaboration
and trust and will not initiate opportunistic behavior Just like the FCF hypothesis this
research is related to the agency theory because it is centered on conflict of interests
between firm managers and shareholders One of the objectives of this study is to
determine the influence of agency costs on the relationship between FCF and firm
performance It was expected that the higher the agency costs the higher the effect on the
relationship between FCF and firm performance
223 Stakeholder Theory
Developed by Freeman (1984) stakeholder theory combines business accountability to a
wide collection of stakeholders The theory advances that the management of firms has a
30
network of relationships to serve in its stakeholdersrsquo circle in its achievement of
corporate goals The theory develops the understanding of corporate accountability to
include a broad collection of stakeholders such as customers suppliers business
associates employees government and its agencies financial institutions among others
A stakeholder is defined as any person or group which can influence or is influenced by
the attainment of the personrsquos or grouprsquos objectives
Mitchell Agle and Wood (1997) maintain that a stakeholder may be recognized by
looking at either one or two or all the associative aspects namely first the clout to impact
the firm secondly the legality of affiliation in or with the firm and lastly the
earnestness of their entitlement in or on the firm Unlike agency theory in which the
management work and serve the shareholders stakeholder theorists propose that firm
management has a relationships network for service and these include employees
business partners and suppliers Stakeholder theory attempts to address the collection of
stakeholders eligible and demanding managersrsquo attention (Sundaram amp Inkpen 2004)
Donaldson and Preston (1995) have argued that all stakeholders participating externally
or internally in the firm have an interest to fulfill This includes the characteristics and
behavior of firms incorporating how the firm is run how the board of directors thinks
about firm units the way management think about organization and the nature of the firm
itself In this regard the firm should strive to satisfy not only the welfare of its
shareholders but also the welfare of other relevant stakeholders Hence the board should
ensure that the firm acts on opportunities that enhance value to all the relevant
31
stakeholders and also prevent bad management practices that may expose the firm to
scandals or risk financial distress To achieve these the board should consist of more
members with diverse competencies experience as well as capabilities that will
effectively discharge its governance function
The stakeholdersrsquo model has been criticized by Donaldson and Preston (1995) arguing
that managers may use ldquostakeholderrdquo reasons to justify poor performance Mansell (2013)
has also critiqued the stakeholder theory stating that by using the political notion of a
lsquosocial contractrsquo to the firm stakeholdersrsquo theory weakens the values upon which a
market economy is founded The stakeholder theory is relevant to this study to the extent
that shareholders and firm managers are considered as lsquostakeholdersrsquo and therefore can
influence or are influenced by the accomplishment of the organizationrsquos goals This
theory implies that the relationships of the variables in this study can take any direction
positive negative or no relationship
224 Stewardship Theory
Developed by Donaldson and Davis (1991) stewardship theory has its origins in
sociology and psychology A steward guards and strives to maximize the shareholderrsquos
interests through firm performance since in doing so the value of the steward is also
maximized From this perception the steward is the firm management who work for the
shareholders defending and making returns for them Stewardship theory emphasizes the
role of firm management being stewards incorporating their objectives as part of the
firm Therefore as stewards they are contented and encouraged when the firmrsquos success
is accomplished The stewardship theory is quite the opposite of the agency theory It
32
submits that firm managers are honest and upright stewards of the assets delegated to
them under their care and thus making monitoring useless The theory opposes the
agency theory which assumes that managers will act to satisfy their own self-interest
rather than that of the firm Rather stewards who are managers executives and board of
directors are satisfied and motivated when firm objectives are achieved (Donaldson amp
Davis 1991 and Davis et al 1997)
Davis et al (1997) argues that stewards derive greater utility at personal level by
satisfying firm objectives than through self-serving behavior and as such the managers
and directors are also concerned about their personal reputation as expert decision
makers which drives their effort towards better firm performance of the firms they serve
According to the stewardship theory other non-financial motivations such as need for
accomplishment and gratitude personal fulfillment gained by successful achievement of
the goals of the firm respect for authority and peers as well as the firmrsquos work ethics do
impact on the actions of the stewards Superior firm performance is connected to having
majority of inside directors as opposed to external directors since inside directors know
the firm better and are better placed to manage than outside directors
Daily Dalton and Cannella (2003) discern that in order to guard their reputation as
decision makers in firms firm managers are motivated to run the firm with the main
objective of maximizing firm performance Similarly Fama (1980) suggests that firm
managers are also protecting their careers so as to be seen as efficient and effective
stewards of their firms Davis et al (1997) have critiqued the stewardship theory arguing
33
that the role of the lsquostewardrsquo is over-simplified and impracticable and that the theory
emphasizes the personalities and egos of senior directors The stewardship theory is
related to this study to the extent that firm managers are considered lsquostewardsrsquo who act on
behalf of shareholders Just like the stakeholder theory stewardship theory adds value
especially in explaining outcomes where the FCF hypothesis and agency theory are not
supported Since this theory emphasizes the role of firm managers being that of stewards
it was expected that the higher the FCF the higher the firmrsquos performance
225 The Resource Based View Theory
RBV is defined by Pearce and Robinson (2011) as a way of examining and recognizing a
firmrsquos strategic advantages based on observing its distinct mix of skills assets
intangibles and capabilities The RBV theory is concerned with internal firm-specific
factors and their effect on performance Grant (1991) observes that RBV theory views the
firm as a bundle of resources that are combined to generate firm capabilities which it can
use to earn above average profitability Every firm develops capabilities from these
resources and when they are well established these become the basis of the firmrsquos
competitive advantage Penrose (1959) explains the significance of exceptional
packagesbundles of resources controlled by the firm which are critical for performance
These firm resources comprise of tangible assets all capabilities attributes of the firm
organizational processes knowledge and information controlled in order to expand
competence effectiveness and efficiency that will in general lead to greater financial
performance
34
Resources are defined as firm capabilities physical assets and intangibles that are semi-
permanently tied to the firm (Wernerfelt 1984) Barney (2002) observes that the RBV
competitive advantage stems from a firmrsquos unique assets and distinctive capabilities and
assumes that firms can be hypothesized as bundles of resources and that those resources
are heterogeneously dispersed across the firms with resource variances persisting over
time Similarly Baker and Sinkula (2005) note that RBV of the firm suggests that
performance is contingent on the firmrsquos competences and specific resources
The thirst to understand the effects of firm level characteristics on financial performance
has been debated a lot in the research arena Among the arguments presented is that a
firmrsquos financial performance is affected only by structural characteristics within the
industry The other argument is that a firmrsquos financial performance is affected by firm
specific resources Much focus has been given to the firm level characteristics as opposed
to the industry level characteristics because it forms the basis upon which the firms
compete The industry related factors is majorly explained by the competitive focus
approach The RBV theory explains the effect of firm characteristics which are internal
factors to the firm with respect to financial performance (Bain 1959 and Porter 1980)
Researchers have carried out studies to test which of the two commonly disputed factors
(industry factors or firm specific factors) are important in explaining variations in firm
performance Wernerfelt and Montgomery (1985) Schmalensee (1985) Rumelt (1991)
Chang and Singh (2000) and Hawawini Subramanian and Verdin (2003) performed
variance component analysis test to establish the percentage of effects of firm
35
characteristics and industry factors on firm performance as measured by ROA Under the
RBV the firm is seen to be heterogeneous and firms possess a combination of unique
capabilities and assets that are responsible for giving them an upper hand in competition
and enable them achieve superior performance
Wernerfelt (1984) was the earlier supporter of the RBV theory but he did not get much
attention at the time However scholars such as Grant (1991) Stalk Evans and Schulman
(1992) and Williams (1992) revisited Wernerfelt (1984) and found that firms with
particular set of skills and capabilities outperformed their rivals Wernerfelt (1984)
describes a resource as ldquoanything that could be deemed as a strength or weaknessrdquo
According to the RBV of the firm resources (which are inputs for the production of
goods and services) and organizational competences (intangible assets that are founded
learning skills and knowledge in deploying resources) can be sources of competitive
advantage The RBV is criticized for its failure to describe how these resources are
established and organized to realize competitive advantage RBV has also been critiqued
for its inability to contemplate the effect of a dynamic market environment (Lengnick-
Hall amp Wolff 1999 and Priem amp Butler 2001)
Another criticism of the RBV theory is that researchers only concentrate on one resource
type that is intangible assets within a single industry and examine its effect on firm
performance The RBV theory helps in explaining performance variation of intra industry
firms as it specifically addresses firm characteristics rather than industry factors
Financial resources are normally measured by leverage ratios which enable the firm to
36
increase its project financing by borrowing from debt providers Liquidity measures
spontaneous financial resources available to conduct normal business operations
Physical resources as measured by the size of assets is one of the tangible resources the
firm can use to gain competitive advantage while business experience of the firm and
serving board of directors give the firm organizational capabilities that it can use to gain a
competitive advantage over its competitors thus being able to earn an above average
financial performance
The boards of directors are viewed as strategic resources that are responsible for the
advancement of the firms to meet their long-term objectives (Kapelko 2006) RBV is
related to this study because it maintains that a firmrsquos financial performance is influenced
by firm specific characteristics (which are one of the study variables) Based on the RBV
therefore it was expected that the higher the FCF the higher will be firm performance
Firm characteristics were expected to provide an interaction which statistically affects the
strength and or direction of the correlation between FCF and firm performance
226 Organizational Theory
Kaen and Baumann (2003) in an attempt to explain firm size came up with the
organizational theory that explains firm size in relation to profitability as well as
organizational transaction costs agency costs and span of control costs Organizational
theory explains the effect of firm size and age of the firm on firm performance Dean
Robert and Bamford (1998) cite that the size of the firm is somewhat correlated to firm
performance because of concentration industry-sunk costs overall industry profitability
37
and vertical integration Firm size matters in assessing financial performance Large-sized
firms have greater number of departments multi-layer levels of management have more
specialized functions and skills greater formalization and management control is highly
centralized which makes them highly bureaucratized than small-sized firms effectively
making them miss out on profitable opportunities that require urgent attention (Daft
1995)
Hannan and Freeman (1984) Aldrich and Austen (1986) and Meyer and Zucker (1989)
have linked firm size and age of the firm to Inertia Inertia is described as an insufficient
or sluggish adjustment to transformation or opposition to major variations in business
operations which in effect may cause the firm to miss profitable opportunities
Stinchcombe (1965) claims that firms that are older seem to be more experienced and
enjoy the benefits of improvement curve effect which makes them not to be exposed to
the problems of newness and hence enjoy above average performance
Penrose (1959) argues that larger firms are able to generate superior performance because
they have diversified capabilities ability to fully exploit economies of scale and scope
Such firms have formalized procedures of conducting business which ultimately makes
implementation of operations more effective On the contrary Leibenstein (1976) and
Shepherd (1986) argue that firm size is correlated with market power and along with
market power inefficiencies are created leading to inferior performance Thompson and
McHugh (2002) have critiqued the organization theory regarding it as being essentially
38
prescriptive There is an implied belief in underlying values or laws that govern
managersrsquo activities and functions
Another weakness of the organization theory cited by Salaman (1979) is the assumption
that all firms are in some way alike arguing that some firm analysts develop propositions
about firms in general lumping together such dissimilar examples as voluntary
establishments charities and political associations Salaman (1979) observes that it
hinders the analysis of those organizational elements which are radically exposed in
employing firms and not necessarily in all forms of organization Organizational theory
is related to this study because it explains the effect of firm size and age of the firm
(which are firm characteristics) on firm performance These are integral variables in this
study Since the theory cites conflicting views for instance bureaucracy in larger firms
which negatively affects performance on the one hand and economies of scale and
diversified capabilities in larger firms which positively affect firm performance on the
other hand it was expected that the relationship among the study variables would take
any direction Firm characteristics would moderate the relationship between FCF and
firm performance by statistically influencing the strength and or the direction of the
correlation between the predictor and explanatory variables
23 Free Cash Flows and Firm Financial Performance
Wang (2010) studied the impact of FCF on firm performance with empirical data from
Taiwan Stock Market for the period 2002 to 2007 Using a sample of 505 firms
regression analysis was employed in data analysis The study found that FCF had
39
statistically significant effects on firm performance These effects were however
conflicting On the one hand the presence of high FCF escalated imprudent expenditures
that consequently lowered firm performance The results indicated on the other hand that
FCF were generated due to managersrsquo efficiency in operations implying that a positive
correlation between FCF and firm performance
However in his definition of FCF Wang (2010) did not take into account CAPEX and
net borrowings which are critical in the FCF definition Additionally the study focused
on financial performance only The findings by Wang (2010) are partially consistent with
results by Gregory (2005) who studied the long run abnormal performance of UK
acquirers and the correlation between FCF and firm performance Gregory (2005)
established that mergers with greater FCF achieved better than those with lesser FCF
While testing the hypothesis the study used ldquolong term returnsrdquo and also ldquoanalyzed
announcement month returnrdquo However the study did not include daily returns around
announcement which could probably yield different results Furthermore the study
focused on financial performance outcomes only
Brush et al (2000) studied the proposition that sales growths in firms with FCF were less
lucrative than sales growths for firms with lower FCF Data was obtained from firms in
the USA covering eight years 1988 to 1995 and used Tobinrsquos Q to ascertain whether
firms had positive NPV projects available to determine FCF Returns to shareholders
were used as a performance measure The use of shareholder returns was criticized by
Bromiley (1990) because it assumes capital market efficiency which argues that the
returns to a large extent reveal surprises to the market Therefore if the markets expect
40
firmsrsquo sales growths and profitability even very profitable sales growths should not be
reflected in shareholder returns in the periods in which they arose The study found that
firms with higher FCF achieve lower from sales growth than those without or with lower
FCF Since sales growth is a measure of firm performance these findings support the
argument that FCF negatively affects firm performance
The findings by Wang (2010) and Gregory (2005) on the one hand and Brush et al
(2000) on the other hand reveal inconsistencies These contradictions indicate that the
correlation between FCF and firm performance is still unresolved In this study a more
robust measure of FCF was adopted For instance Wang (2010) measured FCF as net
operating income before depreciation minus tax expense minus interest expense minus
share dividends scaled by net sales In this study FCF are defined as in Brealey et al
(2005) as net income add amortization and depreciation minus CAPEX less change in
non-cash working-capital plus net borrowing The study is therefore expected to yield
more reliable and robust results
24 Free Cash Flows Agency Costs and Firm Financial Performance
Lin and Lin (2014) investigated the agency costs of FCF and biddersrsquo long-run takeover
performance in Australia using data for the period 1993 to 2000 The final sample
included 556 acquiring firms The study introduced two proxies of FCF excess
accounting cash flow and excess cash holdings and tested the relationship between
biddersrsquo long-run post-acquisition performance and the level of excess cash The findings
41
indicated that the level of excess cash holdings didnrsquot show a substantial reason for the
cross-sectional disparity in long-run post-acquisition performance
The findings from the flow measure of cash indicated that the acquisitions done by
bidders with surplus accounting cash flow didnrsquot escalate agency costs and therefore were
not value reducing Rather bidders with greater surplus accounting cash flows had better
long-run post-acquisition performance The findings therefore indicate that the
examination of FCF hypothesis in the Australian takeover market is conflicting to the
expectations of the FCF theory This finding is contrary to the argument that substantial
FCF increases agency costs which subsequently negatively impacts on firm performance
However Lin and Linrsquos (2014) definition of FCF ignores CAPEX and net borrowings
which are critical variables
Nekhili et al (2014) analyzed the intervening effect of agency costs of monitoring and
ownership structures in reducing earnings management practices when there is FCF The
sample comprised of 85 French listed firms for the period 2001 to 2010 The results
highlighted the unscrupulous managerial behavior in the presence of high FCF The study
measured FCF by multiplying the retained cash flows by the inverse of Tobinrsquos Q
However like in Lin and Lin (2014) CAPEX and net borrowings were omitted in the
definition of FCF The findings indicated that firms which had high FCF tended to
upwardly manage their earnings Additionally with the availability of high FCF the
tendency of firm managers to use discretionary accruals depended on the firm ownership
and the efficiency and effectiveness of governance mechanisms Precisely independence
42
of audit committees and external audit quality together with firm ownership structure (for
example institutional investors and executive ownership) reduced the extent of earnings
management when FCF were available
Conversely independent directorsrsquo ownership and board independence had no significant
effect on earnings management The results indicate that firm executives employ earnings
management practices that escalate reported earnings This implies that there are
increased agency costs emanating from the presence of high FCF subsequently
negatively affecting firm performance The negative effect of agency costs on the
correlation between FCF and firm performance is also supported by Brush et al (2000)
These results are of interest to this study because the research tried to find out the effect
of agency costs and firm characteristics on the correlation between FCF and performance
of NSE listed firms Agency costs are expected to mediate the correlation between FCF
and firm performance because they are the intermediate output of FCF
25 Free Cash Flows Firm Characteristics and Firm Financial Performance
Demsetz and Lehn (1985) studied the firm characteristics that included structure of
corporate ownership and firm size using 511 firms in the USA Size of the firm was
measured by the mean annual common stock market value and the study period was
1976 to 1980 Ordinary least squares (OLS) regression estimates were employed in data
analysis The findings suggest that in the presence of substantial FCF large firms tend to
overinvest thereby yielding relatively lower performance Large firms tended to have
fewer growth prospects than smaller firms and in the absence of good growth prospects
43
an overinvestment problem is likely to arise thereby negatively impacting on the firmrsquos
performance However the choice of a five-year study period seems too short Literature
indicates that 7 to 10 yearsrsquo study period is preferred (Brush et al 2000 and Nekhili et
al 2014)
In examining the degree of firm level over-investment of FCF Richardson (2006) used
an accounting-based structure to measure over-investment and FCF and confirmed that
over-investment was dominant in firms with the greatest FCF levels The study was
carried out in the USA and used a sample of 58053 firms for the period 1988 to 2002
The study also examined whether there was any association between firmsrsquo governance
structures and FCF over-investment The empirical analysis employed two steps In the
first step the study used an accounting-based structure in measuring both over-
investment and FCF The study defined FCF as cash flow over and above what was
needed to sustain assets in place and to fund new investment projects On the other hand
over-investment was described as investment expenditure over and above that needed to
retain assets in place and to fund probable new investments In measuring over-
investment the study decomposed total investment outlay into two component parts
First it needed investment spending to sustain assets in place and secondly investment
spending in new projects
In the next step the study decomposed investment expenditure into expected investment
outlay and over-investment in negative NPV projects where the latter varied with the
firmrsquos growth prospects industry affiliation funding constraints and other aspects
44
Although the study incorporated the firm characteristics of size liquidity and growth
prospects it focused on financial performance measures only Furthermore the study
excluded age of the firm Results suggest that some governance mechanisms like the
existence of shareholders who are activists seem to lessen over-investment Additionally
firm performance in the presence of FCF was found to be lower in firms with higher
liquidity than those with lower liquidity The findings are consistent with Harford (2002)
who found that cash-rich firms were more probable to undertake acquisitions that
consequently suffer abnormal failures in operational performance
Brouwer et al (2005) investigated whether age of the firm accounted for productivity
differences Data was obtained for the period 1994 to 1999 and the focus was on Dutch
firms Although the dataset included firms from all age cohorts (0-4 years and 5-9 years)
the study focused more on firms of at least 10 years of age Using regression methods the
results showed very few signs of a relationship between productivity (performance) and
age Both growth rate and level of productivity varied between sectors and also differed
with size of the firm There was also no indication that productivity growth rate was
related to the age of the firm On productivity level there were very few signs of the
effects of age The Brouwer et al (2005) study did not fully exploit the panel structure of
the dataset that was available The explicit techniques of estimation that take account of
this structure such as multilevel or panel data estimation techniques are expected to be
more effective
45
Conversely Power (1998) found a negative relationship between the growth rate of
productivity and age at a certain phase in the firmsrsquo lifespan Power (1998) examined the
relationship between plant age and productivity for firms in the manufacturing industry of
the USA for the period 1972 to 1988 The study found that productivity growth rates
decline with age which was credited to the effects of learning Firm characteristics are
expected to moderate the correlation between FCF and performance because their effect
is statistically characterized as an interaction affecting the strength and or direction of
the correlation between FCF and firm performance (Baron amp Kenny 1986)
26 Free Cash Flows Agency Costs Firm Characteristics and Firm Financial
Performance
Investigating the agency costs of FCF corporate finance and takeovers Jensen (1986)
sampled top 200 firms in the oil industry in the USA and found a link between the agency
problem with FCF firm characteristics and firm performance Using regression methods
results suggest that firm managers might misappropriate FCF at their disposal when the
firm does not readily have viable investment opportunities and that agency costs are high
when FCF are combined with poor growth prospects Results also indicate that more debt
would increase efficiency by compelling firms with large FCF but few high-return
investment projects to pay back cash to the creditors Leverage helps in preventing such
firms from misappropriating resources on low-return projects
For industries that are declining within the industry mergers would generate value while
outside industry mergers would likely generate lesser value or negative-returns Mergers
46
within the food industry seemed to reflect the spending of FCF The industry seemingly
generated large cash flows with few growth prospects The findings however seem to be
contradicting because they also indicate that increased leverage escalates agency costs
As leverage increases the typical agency costs of debt rise which include bankruptcy
costs that subsequently negatively affects firm performance
Mojtahedzadeh and Nahavandi (2009) investigated the relationship between agency
problems that arise due to FCF with long term profitability and income management
Using Tobinrsquos Q to measure long term profitability and Adjusted Jones Model to estimate
Discretionary Accruals (DA) panel analysis was used to analyze the data Results from
testing 106 firms listed on Tehran Stock Exchange throughout the years 2003 to 2007
reflect that agency costs emanating from the availability of substantial FCF negatively
affect both long term and short term profitability However the five-year period of study
seems too short and also non-financial performance outcomes were ignored in the study
Similarly Nunes Serrasqueiro and Sequeira (2009) investigated 75 Portuguese service
oriented firms to establish the effect of firm size on profitability (performance) They
introduced control variables of growth prospects leverage liquidity and asset structure
(tangibility)
The study used both dynamic estimators and static panel models Results indicated a
positive statistically significant correlation between firm size and performance They
also found a positive effect of growth prospects and liquidity on profitability but a
negative effect on leverage and asset tangibility on profitability as measured by ROA
47
Results also indicated that substantial FCF negatively affected profitability of the firm
The data employed was for the period 1999 to 2003 a duration which seems too short A
longer study period of seven to ten years would probably yield different results
Milne Purda and Anand (2008) used 1200 Canadian firms for the period 1999 to 2003 to
test the hypothesis that independent boards are more prone than non-independent boards
to willingly embrace mechanisms intended to improve their ability to monitor firm
management The study examined seven mechanisms both in aggregate and individually
through construction of an index that allocated one point for each mechanism embraced
up to a maximum of seven points and conducted multivariate regression analyses in
which the explanatory variable was either the full or the reduced index
Results indicate that the board of directors vigorously monitors decision makers who
have an inclination towards diverting firm resources to their own personal interests as a
consequence of the agency problem and FCF hypothesis thereby negatively impacting on
firm performance The findings also offer evidence that a relatively large number of
acclaimed monitoring mechanisms have been embraced by firms and that the acceptance
rate increases for firms with both independent and executive boards However the Milne
et al (2008) study didnrsquot integrate alterative views for the board of directors such as
influencing management decisions using the advisory role The study also ignored
procedures other than board monitoring that may serve to lessen agency costs
48
Locally Wambua (2013) examined the effects of agency costs on performance of NSE
listed firms The study used regression analysis and results indicated a positive
correlation between FCF and firm performance Furthermore the study found that
liquidity firm size and ownership concentration positively influenced performance of the
listed firms However the study did not incorporate firm age Conflicting results were
found by Njuguna and Moronge (2013) who studied the influence of managerial behavior
of agency costs on performance of firms listed at the NSE Using descriptive research
methodology results indicated that information asymmetry is a source of agency costs
and that agency problems are usually related to FCF In operationalizing the agency costs
however Njuguna and Moronge (2013) used total asset turnover as the only measure of
agency costs and also focused on financial outcomes only
To fill these knowledge gaps this study used two measures to fully integrate agency
costs The two agency cost measures used in this study are operating expenses to sales
ratio and sales to assets ratio These two measures are better measures of agency costs
because they tend to incorporate managerial asset utilization efficiency and production
cost efficiency (Singh amp Davidson 2003 McKnight amp Weir 2008 and Fauver amp
Naranjo 2010)
27 Summary of Knowledge Gaps
Empirical literature shows mixed findings regarding FCF agency costs firm
characteristics and firm performance For instance Jensen (1986) found a negative
correlation between FCF and firm performance results suggesting that management
49
might abuse FCF at their disposal Similar findings are recorded by Brush et al (2000)
Mojtahedzadeh and Nahavandi (2009) Wang (2010) Wambua (2013) Njuguna and
Moronge (2013) and Nekhili et al (2014)
Gregory (2005) on the other hand established that mergers that had a greater degree of
FCF performed better than those with lower FCF Similarly Szewcyzk et al (1996) and
Chang et al (2007) find that investors favored firms with both profitable investment
opportunities and significant FCF Likewise Lin and Lin (2014) established that the
acquisitions made by bidders with surplus FCF were not value decreasing Instead
bidders with higher excess FCF had better long-run post-acquisition performance
This research attempted to fill the following knowledge gaps first the influences of
agency costs and firm characteristics (firm size and age of the firm) on the correlation
between FCF and financial performance of the firm were all integrated Secondly FCF
were measured more robustly by incorporating CAPEX and net borrowings Thirdly
unlike in prior studies such as Wang (2010) and Njuguna and Moronge (2013) which
only focused on asset utilization efficiency to measure agency costs this study employed
two different measures for agency costs First is the asset utilization efficiency and
second is the production cost efficiency The two measures are better because they tend
to fully integrate agency costs Lastly the study used cross-sectional panel data design
The study therefore sought to affirm modify or reject existing empirical literature by
bridging the gaps identified in prior studies
50
Table 21 Summary of Knowledge Gaps
Researcher(s) Focus of Study Methodology Findings Knowledge Gaps How this Study
Addressed Gaps
Demsetz and
Lehn (1985)
Structure of corporate
ownership Causes and
consequences
The study
employed OLS
regression
estimates with
sample of 511
firms in the USA
In the presence of
substantial FCF
large firms tend to
overinvest thereby
negatively
impacting on firm
performance
The study
considered a five-
year period which
seems too short and
the focus did not
include FCF and
agency costs
This study employed
a ten year period
focused on FCF
agency costs firm
characteristics and
performance of firms
listed at the NSE
Jensen (1986) FCF agency costs
corporate finance and
takeovers
The study used
regression analysis
on 200 firms in the
oil industry in the
USA
Managers might
misuse FCF at their
disposal when
investment
opportunities are
not available
The study did not
incorporate firm
characteristics
This study included
firm characteristics
(age and size)
Szewcyzk et
al (1996)
The role of investment
opportunities and FCF in
explaining RampD induced
abnormal returns in the
Used regression
analysis and
measured
performance using
Shareholders
favored firms that
had both high FCF
and profitable
Focus variables
omitted agency
costs
The variables for this
study are FCF
agency costs firm
characteristics and
51
Researcher(s) Focus of Study Methodology Findings Knowledge Gaps How this Study
Addressed Gaps
USA firms Tobinrsquos Q investment
opportunities
firm performance
Gul and Tsui
(1998)
Tested the hypothesis
that FCF and director
stock ownership
interaction was less
likely to occur for firms
with high levels of
leverage
Studied 157 low
growth Australian
firms and used
OLS regression
analyses
Results suggested
that an increase in
financial leverage
seemed to reduce
agency costs
The study ignored
the influence of
liquidity and also
focused on low
growth firms only
This study focused on
firm characteristics of
firm size and age of
the firm
Brush et al
(2000)
FCF hypothesis for sales
growth and firm
performance The study
was conducted in the
USA
Study used
regression analysis
with performance
measured using
Tobinrsquos Q and
shareholder return
Firms with high
FCF perform
poorly and also
weak CG caused
inefficiency in the
allocation of FCF
CAPEX and Net
borrowings were
omitted in FCF
definition
This study included
CAPEX and net
borrowings to
measure FCF
Gregory
(2005)
Long run abnormal
performance of UK
acquirers and the
correlation between FCF
and firm performance
Used long term
returns and
analyzed
announcement
month return
Mergers with
greater FCF
performed better
than firms with
lower FCF
The study did not
incorporate firm
characteristics and
agency costs
The study
incorporated agency
costs and firm
characteristics (age
and size)
52
Researcher(s) Focus of Study Methodology Findings Knowledge Gaps How this Study
Addressed Gaps
Richardson
(2006)
Firm level over-
investment of FCF for
firms in the USA
Used an
accounting-based
structure to
measure over-
investment and
FCF
Found that over-
investment was
intense in firms
with the greatest
FCF levels
The study did not
incorporate firm
characteristics
This study included
firm characteristics
(age and size)
Mojtahedzadeh
and Nahavandi
(2009)
The relationship between
agency problems that rise
due to FCF with long
term profitability and
income management
The study was on firms
listed on the Tehran stock
exchange Iran
Used 106 firms for
the period 2003 to
2007 used Tobinrsquos
Q to measure long-
term profitability
DA was estimated
using the Adjusted
Jones Model
The study found
that agency
problems of FCF
result in short term
and eventually long
term profitability
The study focused
on FCF agency
costs and
profitability and
income and the
study period was
five years
This study focused on
FCF agency costs
firm characteristics
and the performance
of firms quoted at the
NSE Study period
was ten years
Nunes et al
(2009)
Profitability in
Portuguese service
industries
Used both static
panel models and
dynamic
estimators
Found a positive
correlation between
firm characteristics
and performance
and that FCF result
in profitability
The study used data
for four years only
(1999 to 2003)
which seems too
short
This study employed
data for ten years
(2006 to 2015)
53
Researcher(s) Focus of Study Methodology Findings Knowledge Gaps How this Study
Addressed Gaps
Wang (2010) The effect of FCF and
agency costs on firm
performance (firms listed
at the Taiwan stock
market)
Used descriptive
statistics
correlations and
regression analysis
Found no evidence
supporting a
negative correlation
between FCF and
firm performance
CAPEX and Net
borrowing were
omitted in FCF
definition
This study included
CAPEX and net
borrowings in
measuring FCF
Waithaka et al
(2012)
Effects of dividend
policy on share prices of
NSE listed firms Kenya
Used the case
method and
regression analysis
Found that FCF
instigated conflict
between managers
and shareholders
which consequently
affected the firm
performance
The study focused
on dividend policy
and stock
performance
This study focused on
FCF agency costs
firm characteristics
and firm
performance
Njuguna and
Moronge
(2013)
Effect of managerial
behavior of agency costs
on performance of firms
listed at the NSE Kenya
Used descriptive
research and used
asset turnover ratio
to measure agency
costs
Found that FCF
were negatively
related to firm
performance and
information
asymmetry causes
agency problem
The study used only
one proxy measure
of agency costs -
total asset turnover
ratio
This study employed
total assets turnover
and operating
expenses sales
54
Researcher(s) Focus of Study Methodology Findings Knowledge Gaps How this Study
Addressed Gaps
Wambua
(2013)
Effects of agency costs
on performance of firms
listed at the NSE
Regression
analysis was
employed in data
analysis
Got a positive
correlation between
FCF and firm
performance
The study did not
incorporate firm
characteristics
This study included
firm characteristics
(age and size)
Lin and Lin
(2014)
Agency costs of FCF and
biddersrsquo long-run
takeover performance of
Australian firms
Used regression
analysis on 556
firms for the
period 1993 to
2000
Found a positive
correlation between
FCF and firm
performance
CAPEX and Net
borrowing were
omitted in FCF
definition
This study included
CAPEX and net
borrowings in
measuring FCF
Nekhili et al
(2014)
Moderating effect of CG
and ownership in
lessening earnings
management practices
when there is high FCF
The study was conducted
in France
Developed
simultaneous
equations to
address
endogeneity of
FCF and then
employed
Hausman test
They found
opportunistic
behavior of
managers in
presence of FCF
Used firm
characteristics of CG
and ownership as
moderating variable
This study used firm
characteristics of size
and age of the firm as
moderating variable
Source Researcher (2018)
55
28 Conceptual Framework
Figure 21 below shows graphically the researcherrsquos conceptualization of the study
Figure 21 Conceptual Model
Independent Variable Dependent Variable
H01
Intervening Variable
H02
H04
H03
Moderating Variable
Source Researcher (2018)
Free Cash Flows
FCFit = (Net income
(PAT) + depreciation and
amortization - CAPEX -
change in non-cash
working capital + net
borrowing)Sales
Financial Performance
Tobinrsquos Q
Agency Costs
- Asset utilization efficiency ACit
- Production cost efficiency
Firm Characteristics
- Firm Size
- Age of the firm
56
FCF is the independent variable whereas the dependent variable is financial
performance As shown in figure 21 above H01 indicates the effect of FCF on financial
performance Agency costs are the intervening variable and they comprise of asset
utilization efficiency and production cost efficiency In figure 21 above H02 designates
the intervening influence of agency costs on the correlation between FCF and financial
performance In similar manner H03 depicts the moderating influence of firm
characteristics on the correlation between FCF and financial performance Firm
characteristics in the study are firm size and age of the firm Lastly H04 shows the joint
effect of FCF agency costs and firm characteristics on financial performance
29 Chapter Summary
This chapter reviewed theoretical foundation on which the study is grounded The
theories highlighted are The FCF hypothesis agency theory stewardship theory
stakeholder theory RBV theory and the organizational theory Empirical studies were
also examined specifically reviewing the correlation between FCF and financial
performance the intervening role of agency costs on the correlation between FCF and
financial performance the moderating role of firm characteristics on the correlation
between FCF and financial performance and finally the joint effect of FCF agency costs
and firm characteristics on financial performance Findings are mixed with some studies
indicating negative relationships while others showing positive relationships A summary
of knowledge gaps has also been underscored The chapter presented and explained the
conceptual model that guided the study and how it was conceptualized by the researcher
57
CHAPTER THREE RESEARCH METHODOLOGY
31 Introduction
This chapter deliberates on the research methodology used It presents the philosophy
research design study population how data was collected reliability and validity The
operationalization of study variables the techniques of data analysis applied and
summary of the research objectives Their corresponding hypotheses and analytical
models have also been highlighted
32 Research Philosophy
Research is defined by Proctor (1998) as a process to find out the unknown A critical
phase in doing social science research is to decide and validate the preferred research
philosophy embraced by the researcher Inter-related paradigmatic conventions
concerning the nature of reality the researcherrsquos role and the research process initiate
scientific research Research philosophy is the primary essential credence that supports
the options that need to be selected in taking a position in research Philosophy has
consequences on what how and why research is to be conducted (Carson Gilmore Perry
amp Gronhaug 2001)
Research philosophy has broad paradigms There are interpretative and the positivistic
paradigms Perry Reige and Brown (1999) explain the relationships among the
techniques that the researcher employs the researcher and the reality and truth that they
seek The two philosophical traditions that guide research in social science are positivism
58
and phenomenology (Saunders et al 2007) The roots of positivism tradition are
grounded in empiricism (Kerlinger 2002) Positivism is an ontology which makes an
assumption that a person has a straight access to the actual world and it is likely to get
independent information regarding the particular external reality
Interpretivism or Phenomenology is an ontology which makes an assumption that a
person does not have direct access to the real world and the knowledge heshe has
regarding this apparent realm is important in its own terms Within the phenomenological
ontology epistemology is founded on belief or assumption that the person conducting the
research is part of the reality and therefore not objective value-free or independent
Research emphasis is to understand what happens in a particular situation and it
contemplates several realities and diverse perceptions of the researcher (Carson et al
2001)
In this study the two philosophical traditions were examined and positivism was
considered the more appropriate tradition for the study because the study is centered on
prevailing theory and it develops hypotheses that can be verified Positivism made it
possible to make definite statements about the influence of agency costs and firm
characteristics on the correlation between FCF and firm performance grounded on
unbiased assessment and deductive reasoning The study utilized statistical data analysis
techniques and the researcher was objective and independent because individual feelings
were not introduced
59
33 Research Design
Research design involves decisions on where what when how farmuch and through
which means regarding a phenomenon It is the outline employed to direct a research
study to make certain that the research addresses the study problem (Gorard 2013) After
considering various research designs described by research experts such as Cooper and
Schindler (2006) Mugenda and Mugenda (1999) and Muganda (2010) as well as the
purpose of the study the philosophical tradition adopted the topical scope researcher
involvement time period over which the data was collected the nature of the data and
type of data analysis the study design embraced was cross sectional descriptive design
Mojtahedzadeh and Nahavandi (2009) successfully used the cross-sectional research
design in their study of the relationship between agency problems that arise due to FCF
with long term profitability and income management Mwangi (2014) also successfully
employed this study design in determining the influence of membersrsquo income and
conduct of Savings and Credit Cooperatives (SACCOs) in the correlation between
efficiency and characteristics of SACCOS in Kenya The cross-sectional descriptive
design was considered appropriate because of its versatility and leverage in collection of
data from a large number of respondents within a fairly short time period
34 Population of the Study
The target population comprised of the entire 63 firms listed at the NSE (Appendix I) as
at December 31 2015 This was a census study which involved obtaining information
from every member of the population A census of all the NSE listed firms was employed
60
because the number of listed firms at the NSE is relatively small and therefore the study
could easily be carried out
35 Data Collection
Secondary data was collected from published financial statements obtained from the
NSE Time series panel data was collected covering a 10 - year period from 2006 and to
2015 A ten-year period is deemed large enough to yield reliable findings A similar
period was adopted by Gregory and Wang (2010) and Nekhili et al (2014) Appendix II
shows the data collection form
36 Reliability and Validity
The main indicators of the value of a data collection instrument are reliability and validity
of the measures Reliability is among the most essential components of test quality and it
entails consistency or reproducibility or the examineersquos test performance Therefore
reliability is the degree with which research instruments yield consistent results after
repeated trials Reliability of a measure has two parts its stability over time and the
consistency of the instrument in measuring the concept Several methods of computing
test reliability exist and they include decision consistency parallel forms reliability test-
retest reliability inter-rater reliability and internal consistency Decision consistency is
often an appropriate choice for many criterion-referenced tests (Kimberlin amp Winterstein
2008)
61
Validity is the degree with which theory and evidence corroborate interpretations of test
scores occasioned by suggested uses of tests It denotes whether or not the test is
measuring what it anticipated to measure It is perhaps the most essential criteria for the
quality of a test There are several types of validity and these consist of construct validity
criterion-related validity and content validity Construct validity refers to the extent to
that an instrument measures the attribute or hypothetical concept that it was proposed to
measure while content validity is the degree with which the content of the objects reveals
the content purview of interest Lastly criterion-related validity is evaluated when an
individual wants to establish the correlation of scores on a test to a specified benchmark
(AERAAPANCME 2000 and Penfield amp Miller 2004)
361 Reliability Test
Stability was assessed by use of test retest reliability while internal consistency was
assessed using inter-item consistency reliability In testing for reliability Cronbach alpha
was calculated The Cronbachrsquos alpha coefficient was applied in measuring internal
consistency of the measurement scales It is a scale measurement tool that is frequently
used in social sciences for determining internal consistency of factors or items among and
within variables of the study Nunnally (1967) and Oppenheim (1992) argue that alpha
coefficient value of 0700 and above is tolerable
The Cronbachrsquos alpha coefficient was employed because it is suitable for multi-scaled
items The Cronbachrsquos alpha is a broad formula of the Kunder-Richardson (K-R) 20
formula as shown
62
(K) (S2-Σs
2)
KR20 =
(S2) (K-1)
KR20 = Reliability coefficient of internal consistency
S2 = Variance of all scores
K= Number of items employed to measure the model
s2 = Variance of individual items
This study also employed secondary data Kimberlin and Winterstein (2008) argue that
the foremost concern when deciding if secondary data should be used is to confirm that
the data set suitably measures the variables that are required to answer the study
questions Secondary data was collected from audited financial statements of all NSE
listed firms This data is deemed reliable because financial reporting is guided by
International Financial Reporting Standards (IFRS) Furthermore the companies Act
(CAP 486) of the laws of Kenya require that every limited liability firm conducts a
statutory audit at least once annually Such audits are guided by International Auditing
Standards (IAS)
362 Validity Test
Validation of the instrument was accomplished in several ways Pre-test was done by
administering the instrument to eight middle level managers to complete The eight
managers were conveniently selected to review the statement items for clarity meaning
63
and relevance Based on their response the data collection instrument was appropriately
modified Validity shows whether the instrument is testing what it should be testing
Content validity was achieved by establishing whether the items in the data collection
instrument are well balanced in content domain and link up well with theoretical
assumptions centered on the study objectives which involved checking of the content to
establish if it contained representative sample of the objects being measured Criterion-
related validity was established by administering test-retest or stability test on the data
contents in the data collection instrument Construct validity was established by ensuring
that the study variables were properly operationalized This was achieved through
constant consultations and reviews by research experts from the University of Nairobirsquos
School of Business Validity can be measured by use of expert judgment and informed
opinion (Kerlinger 2002)
37 Operationalization of the Study Variables
This study has four variables of interest independent variable dependent variable
intervening variable and a moderating variable Table 33 shows the research variables
and their respective metricsindicators Theoretical and empirical research in the area of
study has guided the choice of the variables
64
Table 31 Operationalization of Study Variables
Variable
Indicator Measure Support from
Literature
Form Section
Independent Variable
Free Cash Flows
Net income (PAT) add
depreciation and
amortization minus CAPEX
minus change in non-cash
working capital add net
borrowing
Net income (PAT) add
depreciation and amortization
minus CAPEX minus change
in non-cash working capital
plus net borrowingNet
Sales
Brealey et al
(2005) and
Nekhili et al
(2014)
Part A of Data
Collection Form
Dependent variable(s) - Firm Performance
Financial
Performance
Tobinrsquos Q Equity market valueEquity
book value
Szewczyk et al
(1996) and
Mojtahedzadeh
and Nahavandi
(2009)
Part B of Data
Collection Form
Intervening Variable(s)
(a) Asset utilization
efficiency = Net sales
to total Assets ratio
(a + b)2 = AC
Tirole (1986)
Part C of Data
Collection Form
65
Variable
Indicator Measure Support from
Literature
Form Section
Agency Costs
(b) Production cost
efficiency = Operating
expenses to net sales
ratio
Tirole (1986)
Singh and
Davidson (2003)
Moderating variable(s)
Firm
Characteristics
Firm Size Natural log of total assets Demsetz and Lehn
(1985)
Part D of Data
Collection Form
Firm Age
n log (number of years since
incorporation)
Ferris and Yan
(2009)
Source Researcher (2018)
66
Non-cash working capital includes inventories financial assets held to maturity
receivables and prepayments (current assets) and payables accrued expenses current
income tax liability (liabilities) For financial and investment firms non-cash working
capital includes prepaid lease rentals intangible assets deferred tax assets and retirement
benefit assets (assets) and taxation payable dividends payable deferred tax liabilities
and retirement benefit liabilities
Net sales in case of insurance firms are the equivalent of ldquoNet premium revenuerdquo For
commercial banks it is ldquoTotal operating incomerdquo which is composed of net interest
income add total non-interest income In case of investment firms it is ldquoIncomerdquo which
is comprised of rental income dividends and interest received and other incomes
38 Data Analysis
Data was analyzed using inferential statistics generated from statistical software using
95 confidence interval as in Aiken and West (1991) Descriptive statistics and
inferential statistics were both employed in data analysis Measures of dispersion and
measures of central tendency were used in profiling the respondent firms
Linear regression analyses were used in establishing the magnitude and nature of the
relationship between the study variables and in testing the relationships hypothesized
This study employed panel data regression analysis using the OLS technique where data
consist of cross-sectional and time series data which was combined into a panel data set
67
and projected with the use of panel data regression Regression analysis is a statistical
tool for examination of relations between variables
The value of the coefficient of determination (R2) indicates the extent of variation in the
dependent (explanatory) variable explained by the independent (predictor) variable Beta
values indicate the extent of variation in the explanatory variable that is attributed to the
extent of variation in the independent variable F ratio measures the model fit or simply
how sound the equation line established fits the data observed Interpretation of statistical
significance of each relationship hypothesized was based on β R2 t F and P ndash values
The study hypotheses were measured using two sets of regression equations The
regression analysis was done using STATA software
39 Choice of Panel Data Analysis Model
Panel data analysis can be categorized into several categories First are the pooled panels
which assume that there exist no distinctive qualities of characters in the dimension set
and there are no common effects across time Second are the fixed effects models which
assume existence of unique qualities of characters which are not the effects of random
variations and which donrsquot differ across time They assume changes in intercepts across
sets or time periods Lastly we have random effects models which have the assumption
that there are distinctive time constant qualities of characters which are the effects of
random variations and do not associate with the characters that are the effects of random
variation They donrsquot relate with the specific regressors The random effect models are
suitable if we want to draw conclusions about the entire population
68
The selection of a suitable model is contingent on the aim of investigation and
complications regarding the exogenity of dependent variables The fixed effects model
and the random effects model were not considered The pooled regression model was
suitable because of its assumption that all the organizations are similar The Pooled
regression model also has an assumption that the coefficients including the intercepts
are identical for all study items (firms) The fixed and random effect models provide for
individuality or heterogeneity among the organizations by letting each organization to
have own intercept that is time invariant
391 Effect of Free Cash Flows on Financial Performance
In establishing the effect of FCF on firm performance FCF is the predictor variable while
financial performance is the explanatory variable In the specification the standard errors
are clustered by firm and year Equation 31 entails panel data for 2006 to 2015
The regression model for hypothesis 1 is as follows
Ǭit = ά + βFCFit + euro -------------------------------------------------------------------------- (31)
Where Ǭ = Financial performance and it indicates the firm i at time t Financial
performance was measured using Tobinrsquos Q ά = Constant term β = Beta Coefficient
FCFit= Free cash flows for firm i at time t where t is the year 2006 to 2015
392 Free Cash Flows Agency Costs and Financial Performance
In analyzing hypothesis 2 the relevant variables are FCF (independent variable) agency
costs (intervening variable) and financial performance (dependent variable) Intervening
effects were examined using hierarchical (stepwise) multiple regression analysis As in
69
Baron and Kenny (1986) the fundamental concept of mediating variables is that in some
way they intervene in the process of transformation between response and stimuli Some
essential features of a mediating variable include the fact that the independent variable
shall affect the mediator variable (path a) the mediator shall affect the dependent
variable (path b) independent variable shall affect the dependent variable (path c) and
that once paths a and b are controlled path c becomes inconsequential or trivial The
mediation path is shown in figure 31 below
Figure 31 Path Diagram for Mediation effect of Agency Costs
c
lsquoa b
Agency costs
Source Researcher (2018)
Mediation was tested through the following three steps Step one entailed the dependent
variable Ǭ (financial performance) being regressed on the independent variable FCF
(Free cash flows) In step two the mediator AC (agency costs) was regressed on the
independent variable FCF In step three Ǭ is regressed on AC and FCF In each step the
120689 coefficient was tested to establish the size and direction of the correlation If a zero
order relationship exists and is significant then proceed to the next step Mediation exists
if FCF coefficient is significant in step 2 and also when the FCF coefficient is
significantly less in step 3 than in step 1
Free cash flows Financial performance
70
In testing intervention between FCF and financial performance the regression model is as
follows
Ǭit = ά + β1FCFit + euroit ------------------------------------------------------------------------ (32a)
AC it = ά + β1FCFit + euroit --------------------------------------------------------------------- (32b)
Ǭit = ά + β1AC it + β2FCF it + euroit ------------------------------------------------------------ (32c)
while controlling the effect of M on Y
Where ACit is the sum of Production cost efficiency (PCEit) and Asset utilization
efficiency (AUEit) divided by 2 (average) for the period 2006 to 2015
393 Free Cash Flows Firm Characteristics and Financial Performance
In testing hypothesis 3 the relevant variables are FCF firm characteristics (moderating
variable) and financial performance The regression models are as follows
Ǭit = ά + β1FCFit + β2AGEit + β3 (AGEit FCFit) + euro---------------------------------- (33a)
Ǭit = ά + β1FCFit + β2SIZit + β3 (SIZit FCFit) + euro------------------------------------- (33b)
Where SIZit = Firm size AGEit = Age of the firm
Equations 33a and 33b represent moderation models For purposes of avoiding possible
high multicollinearity the variables were centered and an interaction term added If the
predictor variable (FCF) and moderator variable (firm characteristics) are not significant
with the interaction term then complete moderation has happened Otherwise if the
independent and moderator variables are significant with the interaction term then
71
moderation has happened but the main effects are also significant (Aiken amp West 1991
and Mackinnon et al 2002)
In equations 33a and 33b above the variables associated with coefficient 1206893 were added
in the model to measure the effect of moderation The effect of moderation variables
firm size and age is characterized statistically as an interaction that affects the strength
and or direction of the correlation between explanatory variable (firm performance) and
the predictor variables (Baron amp Kenny 1986) The term in the model does not imply
multiplication but rather it denotes moderation
394 Relating all the Variables
Hypothesis 4 entails testing all the variables in the conceptual framework In testing for
the effect on financial performance panel data model was applied in measuring the
strength of the relations between the independent moderating intervening and dependent
variables To measure the joint effect of the moderating intervening and independent
variables intercept (constant) was used to determine the nature and extent of effect of all
the variables Additionally R2 was employed in determining the joint effect of the
moderating intervening and independent variables on the dependent variable (financial
performance) The resultant model is as follows
Ǭit = ά + β1FCFit + β2AC it + β3SIZit + β4AGEit + euro----------------------------------------- (34)
Where
72
34 represents the model for the effect on financial performance which utilized secondary
panel data for the period 2006 to 2015 and Ǭit represents financial performance
Table 32 A Summary of Statistical Tests of Hypotheses
Objective Hypothesis Analytical Model Interpretation
i To establish
the relationship
between FCF
and financial
performance of
firms listed at
the NSE
H01 FCF have no
significant effect on
financial performance of
firms listed at the NSE
ANOVA
regression
model
Panel data
regression
model
Test of
assumption
(normality and
multi-
collinearity)
Relationship exists if β is
significant
Relationship will be
determined based on R2
ii To assess the
influence of
agency costs on
the relationship
between FCF
and financial
performance of
firms listed at
the NSE
H02 Agency costs have
no significant
intervening effect on the
relationship between
FCF and financial
performance of firms
listed at the NSE
ANOVA
regression
model
Panel data
regression
model
Test of
assumption
(normality and
multi-
collinearity)
Mediation exists if FCF
coefficient is significant in
step 2 and also when in
step 3 the FCF coefficient
is significantly less than in
step 1
Regression co-efficient and
R2 will be used to affirm the
effect of agency cost on the
relationship between free
cash flow and firm
performance
iiiTo determine
the influence of
firm
characteristics
on the
H03a Firm age has no
significant moderating
effect on the relationship
between FCF and
financial performance of
ANOVA
regression
model
Panel data
regression
Moderation exists when the
interaction term between
firm characteristics and
FCF is a significant (p lt
005) predictor of firm
73
Objective Hypothesis Analytical Model Interpretation
relationship
between FCF
and financial
performance of
firms listed at
the NSE
firms listed at the NSE
H03b Firm size has no
significant moderating
effect on the relationship
between FCF and
financial performance of
firms listed at the NSE
model
Test of
assumption
(normality and
multi-
collinearity)
performance Furthermore
when FCF remains a
significant predictor while
firm characteristics become
insignificant
The intercept of the
regression model will
be used to tests the
influence of firm
characteristics on the
relationship between
free cash flow and firm
performance
Regression co-efficient and
R2 will be used to affirm the
effect of firm characteristics
on the relationship between
FCF and firm performance
iv To establish
the joint effect
of FCF agency
costs and firm
characteristics
on financial
performance of
firms listed at
the NSE
H04 There is no joint
effect of FCF agency
costs and firm
characteristics on
financial performance of
firms listed at the NSE
ANOVA
regression
model
Panel data
regression
model
Test of
assumption
(normality and
multi-
collinearity)
The intercept of the
regression model will be
used to tests the joint effect
of FCF agency costs and
firm characteristics on firm
performance
R2 will be used to get the
joint effect of independent
variables on Firm
Performance
74
310 Chapter Summary
The chapter discussed the study methodology employed and has highlighted the research
philosophy adopted clearly indicating that the study was anchored on the positivist
orientation since it is founded on existing theory and it articulates hypotheses which can
be verified Furthermore the positivist approach made it possible to make categorical
statements
The research design used has also been discussed The research design adopted was
cross sectional descriptive survey The population of the study has been highlighted as a
census of all firms listed at the NSE The chapter has also explained the data collection
methodology Reliability and validity considerations have been discussed
Operationalization of research variables has been deliberated showing a summary table
of the four variables of study indicators how the variables were measured support from
literature and the relevant section of the data collection form Data analysis has been
explained being regression methods using inferential statistics The chapter also
presented a tabulated summary of the research objectives their corresponding hypotheses
and analytical models
75
CHAPTER FOUR DATA ANALYSIS AND FINDINGS
41 Introduction
The study sought to establish the relationships between free cash flows agency costs
firm characteristics and performance of firms listed at the NSE Secondary data were
collected to test the relationships between the study variables This chapter presents an
analysis of the results More specifically the chapter has focused on descriptive statistics
reliability tests validity tests and correlation analysis
42 Pre-estimation Diagnostics
The study used OLS to estimate regression models The use of OLS is based on
normality linearity sampling adequacy and internal consistency of variables used in the
regression model Therefore normality linearity internal consistency and sampling
adequacy of these variables were required for the application of OLS This section
presents the test statistics to verify satisfaction of these assumptions by the data collected
and analyzed
421 Normality test
The Shapiro Wilk test for normality was conducted to test if the variables were normally
distributed The null hypothesis was that the data did not come from a population that
was normally distributed Therefore the alternate hypothesis is that the data originated
from a normally distributed population The test statistics for normality of each variable
are shown in table 41 below
76
Table 41 Normality Test
Variable Test Statistic
Z statistic P value
Free cash flows 1687 0082
Agency costs (AC) 1501 0160
Firm Age 0832 0129
Firm Size 1004 0076
Table 41 above shows that the p-values for all the variables were greater than 005 and
therefore we failed to reject the null hypothesis that the variables were normally
distributed at five per cent level of significance Therefore OLS could be applied on the
data considering that the data met the assumed conditions for application of multiple
regression analysis Field (2013) recommends use of a visual inspection of histograms or
Quantile ndash Quantile (Q-Q) plots to supplement use of tables and numbers These plots are
presented below
77
Figure 41 Q-Q Plot for Free cash Flows (2006 ndash 2015)
The results of the Q-Q plot in figure 41 above exhibits normality because most of the
observations seem to be in a straight line with a few cases appearing to be far away from
the line
Figure 42 Q-Q Plot for Agency Costs (AC) ndash 2006 to 2015
Figure 42 Q-Q plot above for agency costs (AC) reveals normality because the majority
of the observations seem to be along the straight line Outliers were investigated and
78
corrected or eliminated where necessary Large data sets can be analysed even if some
variables do not meet normality assumptions (Tabachnick amp Fiddel 2013)
Figure 43 Q-Q Plot for Firm Characteristics (Firm Age) ndash 2006 to 2015
The above Q-Q in figure 43 exhibits normality This is because most of the observations
seem to be in a straight line with a few cases appearing to be far away from the line
79
Figure 44 Q-Q Plot for Firm Characteristics (Firm Size) ndash 2006-2015
The Q-Q plot for firm size in figure 44 above indicates almost all the observations being
on a straight line This implies normality of the data Outliers were investigated and
corrected or eliminated where necessary
80
Figure 45 Q-Q Plot for Firm Financial Performance ndash 2006 to 2015
The Q-Q plot for financial performance in figure 45 above shows normality
422 Reliability Tests
Reliability tests were carried out through Cronbachs alpha tests in Statistical Package for
the Social Sciences (SPSS) with the findings presented below The results are shown in
Table 42 below Except for financial performance which shows a score of 0672 all the
other variables indicate reliability scores above 0700 which is the accepted score for
reliability (Bonett amp Wright 2014) The research instrument was therefore deemed
reliable
81
Table 42 Reliability Scores for Individual Variables
Variable Item Cronbachs Alpha
Free Cash Flow 0726
Firm Age 0798
Firm Size 0814
Agency Costs-AC 0828
Financial Performance 0672
423 Test for Linearity
In testing whether the variables were linearly associated a correlation analysis was done
The null hypothesis for the test was that there was no linear association The test statistics
for linear associations between the predictor variables and firm performance (explanatory
variable) are shown in table 43 below
Table 43 Test for Linearity
Reference Variable Firm
Performance
Coefficient of Correlation P-Value
Free cash flows 0506 0000
Agency costs (AC) 0521 0000
Firm Age 0619 0000
Firm Size 0590 0000
82
From table 43 above FCF shows a coefficient of correlation of 0506 agency costs (AC)
indicate 0521 firm age 0619 and finally firm size reveal 0590 All the values exceed
05000 meaning that there is a positive correlation Financial performance is the reference
variable All the p-values for the respective coefficients of correlation are 0000 which is
lower than 001
Thus all the predictor variables have a significant positive correlation with financial
performance at five per cent level of significance Therefore the predictor variables and
the explanatory variable (financial performance) move in the same direction which
suggests a linear relationship This positive significant correlation indicates that the
signage coefficients of the predictor variables in the simple regression models are
positive
424 Bartletts Test for Internal Consistency
The study tested the consistency of the items in the designed questionnaire to measure
several variables used in the research by applying the Bartlettrsquos test of sphericity The
null hypothesis of the test was that there was no internal consistency A failure to reject
the null hypothesis implies that the principal components which measure individual
sections have to be established using principal component analysis
Conversely rejecting the null hypothesis implies that all the elements are consistent
internally and that their composites can be applied in measuring the variables concerned
83
Test statistics for each of the sections involved in the linear regression analysis are
presented in table 44 below
Table 44 Bartlettrsquos Test
Variable Degrees of freedom Test statistic
Chi Square P value
Free cash flows 21 4382 0000
Agency costs (AC) 10 2665 0000
Firm age 10 1462 0000
Firm size 10 1621 0000
Financial performance 10 26940 0000
Table 44 above demonstrates that the null hypothesis which states that the variables are
not intercorrelated in each of the sections has to be rejected at five per cent significance
level This is confirmed by all the p-values being less than 001 for the variables
425 Multicollinearity Test
Multicollinearity occurs if there is a strong relationship between two or more independent
variables in a regression model Multicollinearity becomes an issue only in multiple
regressions and not for simple regression analysis Multicollinearity poses several
problems such as increases in standard errors of 120689 coefficients This means that the 120689s
have relatively higher variability across samples and less likely to represent the
population The second problem is limiting the size of R which measures multiple
correlation between the independent variables and the result and R2 the variance of the
84
result for which the independent variables explain making the second predictor to
explain very little of the remaining variance The other problem posed by
multicollinearity is that it reduces the importance of predictors making it hard to measure
the specific significance of a predictor (Field 2009)
To test whether the level of multicollinearity in the estimated models could be tolerated
Variance Inflation Factor (VIF) was used The rule of the thumb is that a value of VIF
that is less than 10 means that the level of multicollinearity can be tolerated (Robinson amp
Schumacker 2009) Since multicollinearity test is only applicable for multivariate
regressions only VIF statistics are reported since the regressions involve more than one
independent variable
Table 45 Multicollinearity Test
Variables VIF
Free Cash Flows 206
Agency costs (AC) 155
Financial Performance 252
Firm Size 109
Firm Age 168
Table 45 above shows that the VIF for all the models estimated ranged from 109 to 235
showing that the VIF results are between the acceptable ranges of 1 to 10 (Robinson amp
85
Schumacker 2009) This shows that the variables did not exhibit multicollinearity and
regression analysis could then be carried out
43 Descriptive Statistics
Table 46 Descriptive Statistics for Secondary Data ndash 2006 to 2015
Variables No Min Max Mean STD
Tobinrsquos Q (Ratio) 600 0867900 6447370 0526600 0634590
FCF (Ratio) 600 -0024530 3145000 16900 011270
AC(Ratio) 600 0003716 6329080 33166898 091646
SIZ (Ratio) 600 -1342200 2810600 04418300 0612300
AGE (n log of year
since incorporation)
600 140884 5400013 3904435 0287000
Table 46 above shows descriptive statistics for secondary data for a 10 year period from
2006 to 2015 Table 46 above gives the descriptive analysis for the main variables used
in the research It shows that the average Tobin Q is 05266 This suggests that on
average firms listed at NSE have recorded fairly impressive performance The Tobinrsquos Q
mean of 05266 suggests that the firmsrsquo market values are less than their book values
Since their market price to book value ratio is less than one the market expects the value
of these firms to reduce in the future because the market price also takes any future
earnings into account at the current price
86
For FCF the average is 169 meaning that most firms listed at NSE have low FCF The
mean for AC was found to be 33166898 indicating a high asset turnover and operating
expenses to sales ratio The average age of the firm is indicated by the log of 3904435
This shows that the firms listed at the NSE are relatively old On average the mean firm
size of listed firms at the NSE is indicated by a log of 04418300 indicating that the firms
have a fairly high asset value
44 Chapter Summary
This chapter presented information on pre-estimation diagnostics These include
normality test reliability test reliability test test for linearity Bartlettrsquos test for internal
consistency and multicollinearity test The chapter also gave results of analysis tests run
on the data that was collected These include descriptive statistics Results were indicated
by standard deviations mean scores minimum scores and maximum scores
87
CHAPTER FIVE TESTS OF HYPOTHESES AND DISCUSSION
51 Introduction
This section presents the hypotheses of the study which are derived from the research
objectives and the results of the hypothesized relationships This study was informed by
the premise that there exists a correlation between FCF and financial performance and
that this relationship is intervened by agency costs and is moderated by firm
characteristics
52 Correlation Analysis
The relationship between strength and direction of the variablesrsquo relationship was
investigated using the Pearson Product Moment correlation coefficient This was
significant so as to assess whether any relationship exists between the variables before
proceeding with further analyses The study employed the following classification strong
if 07 and above moderate if 04 but less than 07 and weak if 0 and less than 04
Apart from analysing the direction and strength of association correlation analysis was
also used to test the presence of multicollinearity between the independent variables
Multicollinearity exists if independent variables are highly correlated (r = or greater than
075) Multicollinearity reduces the importance of predictors making it difficult to assess
the individual importance of a predictor Multicollinearity may lead to poor regression
modelling (Dancey amp Reidy 2011) The results in Table 51 below show that there is no
multicollinearity since all the predictor coefficient results are below 075
88
Table 51 Pearson Product-Moment Correlations among the Dependent
Independent Intervening and Moderating Variables
Firm
performance
Free
cash
flows
Agency
costs
Firm
size
Firm
age
Pearson
Correlation
Firm performance 1 0702 0519 0405 0126
Free cashflows 1 0129 0135 0245
Agency costs 1 0198 0322
Firm size 1 0418
Firm age 1
Source Researcher (2018)
Correlation is significant at the 005 level (2-tailed)
Correlation is significant at the 001 level (2-tailed)
As indicated in Table 51 above there is a strong positive correlation between financial
performance and FCF (r = 0702) On the other hand the correlation between financial
performance and firm size and with agency costs is moderate and positive (r = 0405 and
0519 respectively) The correlation with firm age is weak but positive (r = 0126) All the
correlations were significant at 005 except firm age The relationships between financial
performance and FCF agency costs firm size and firm age moved in the same direction
as hypothesized in the study These variables were further assessed using regression
analysis as shown in section 53 below
89
53 Hypotheses Testing Using Regression Analysis
In order to establish these relationships four hypotheses were formulated and tested For
purposes of testing the hypotheses different regression models were run First finding
out the correlation between FCF and financial performance secondly tests to determine
the intervening effect of agency costs on the correlation between FCF and financial
performance thirdly tests were carried out to establish the moderating effect of firm
characteristics on the relationship between FCF and financial performance and lastly to
find out the joint effect of FCF agency costs and firm characteristics on financial
performance of NSE listed firms
In order to ascertain these relationships the hypotheses were formulated and tested using
simple and multiple linear regression analyses The hypotheses were tested at 95 percent
confidence level (ά = 005) while p-values were used to establish individual significance
of the hypothesized relationships The significance and general robustness of the model
was assessed using F statistic and p-values for significance Overall F statistic value
greater than 1 signifies goodness of fit P-values greater than or equal to 005 indicated
that we would fail to reject the null hypothesis while those with p-values less than 005
signified that the null hypothesis would be rejected ANOVA and panel data analyses
results have been presented and discussed below
90
531 Free Cash Flows and Financial Performance
The study sought to determine the effect of FCF on financial performance and it
employed panel data design Panel data was used in establishing financial performance
which was measured by Tobinrsquos Q (equity market value equity book value) FCF on the
other hand was measured as Net income + depreciation and amortization - CAPEX -
change in non-cash working capital + net borrowing)Net sales The study sought to
identify the effect of FCF on firm financial performance The following hypothesis was
developed
H01 FCF have no significant effect on financial performance of firms listed at the NSE
Maximum likelihood regression model was employed in data analysis The test statistics
regression results with financial performance as the dependent variable and FCF as the
independent variable are reported in Table 52(a) below
Table 52 Panel Data Results for Free Cash Flows and Financial Performance
Model Summary
Model R R2 Adjusted R
2 Standard
Error
1 04890 02391 02106 02258
a Predictors (Constant) Free cash flows
b Dependent Variable Financial performance
91
(a) ANOVA
Model Sum of
Squares
DF Mean
Square
F Sig
Regression 2689 1 2689 5376 0017
Residual 32483 599 0054
Total 35172 600
a Predictors (Constant) Free Cash Flows
b Dependent variable Financial performance
(c) Regression Co-efficients
Model Unstandardized Coefficients Standard
Coefficients
t Sig
B Standard Error Beta
Constant 048011 0011662 020 7229 0000
FCF 0206 00254 0265 54238 00023
Dependent variable Financial performance
The model coefficients are shown in Table 52(c) above The results indicate that FCF is
a significant predictor because the p value is 00023 which is lower than 005 (level of
significance) Furthermore results indicate R2
of 02391 which implies that FCF explain
2391 of the variability in firm financial performance The results have rejected the null
hypothesis implying that FCF have a statistically significant positive effect on financial
performance of firms listed at the NSE The regression model that explains the variation
in financial performance as a consequence of FCF is as shown below
92
Ǭit = 048011 + 0206FCFit
Where
Ǭ = Firm financial performance
FCF =Free cash flows
532 Free Cash Flows Agency Costs and Financial Performance
This study sought to ascertain the effect of agency costs on the relationship between FCF
and financial performance The corresponding hypothesis is
Hypothesis 2 Agency costs have no significant intervening effect on the relationship
between free cash flows and financial performance of firms listed at the Nairobi
Securities Exchange
The study employed secondary panel data in determining the results under this
hypothesis Secondary data was obtained from financial statements and measured agency
costs using asset utilization efficiency (salesassets) and production cost efficiency
(operating expensessales) The values were obtained separately (AUE and PCE) and
added together then divided by two to obtain agency costs (AC)
In testing for mediation intervention first the relationship between the dependent
variable (financial performance) and the independent variable (FCF) was carried out
ignoring the intervening variable (agency costs-AC) This was step number 1 and is
similar to the regressions performed under hypothesis one under section 52 The model
should indicate significance where p = lt005
93
Next is the regression analysis between FCF (the independent variable) and agency costs
(AC) which is a combination of production cost efficiency and asset utilization efficiency
as intervening variable ignoring the financial performance (the dependent variable) The
FCF and AC relationship should be significant (p=lt005) if one is to move to step 3
Under step 3 the regression analysis is done with financial performance as the dependent
variable and both AC and FCF as independent variables Regression results for step 1 are
same as shown in Table 51 earlier Results from step 1 shown in Table 51 indicate the p
value of 00023 and is therefore significant The regression model is specified as Ǭit =
048011 + 0206FCFit This necessitates moving to step 2 the results of which are
depicted in Table 53 below
Table 53 Panel Data Results of Agency Costs as the Dependent Variable and Free
Cash flows as the Independent Variable
a) Model Summary
Model R R Square Adjusted R Square Std Error of the Estimate
1 03356 01126 00958 02290
a Predictors (Constant) FCF
b Dependent Variable Agency costs (AC)
94
b) ANOVA
Model
Sum of
Squares df
Mean
Square F Sig
Regression 6881 1 6881 059 46181 0053
Residual 89226 599 0149 043
Total 96107 600
a Predictors (Constant) FCF
b Dependent Variable Agency costs (AC)
c Coefficients
Model
Unstandardized
Coefficients
Standardized
Coefficients
t Sig B Std Error Beta
1 (Constant) 0117 03042 3840 023
FCF 083 0137 265 2772 048
a Dependent Variable Total Non-Performance
Results in Table 53(c) above indicate that FCF is a significant predictor of AC as shown
by Sig = lt005 Table 53(a) above shows R square of 01126 which implies that 1126
variations in AC are explained by changes in FCF The regression model for the
relationship between FCF and AC ignoring financial performance is given below
AC = 0117 + 0083FCF
95
Since the relationship between FCF and AC is significant (as depicted by Sig = 0048)
we can now move to step 3 where financial performance is the dependent variable while
FCF and AC are predictor variables The results of step 3 are displayed in Table 54
below
Table 54 Panel Data Results of Financial Performance as the Dependent Variable
while Agency Costs and Free Cash flows are the Independent Variables
a Model Summary
Model R R Square Adjusted R Square Std Error of the Estimate
1 07157 05122 04613 02288
a Predictors (Constant) AC FCF
b Dependent Variable Financial Performance
a ANOVA
Model Sum of Squares df Mean Square F Sig
1 Regression 14725 2 73625 62606 0000
Residual 106258 598 01776
Total 120983 600
a Predictors (Constant) AC FCF
b Dependent Variable Financial Performance
96
c Coefficients
Model
Unstandardized Coefficients
Standardized
Coefficients
t Sig B Std Error Beta
1 (Constant) 0187 0342 44409 021
FCF 211 0179 227 13380 071
AC 148 042 282 62376 015
a Predictors (Constant) AC FCF
b Dependent Variable Financial Performance
The findings in Table 54 above indicate that financial performance is significantly
predicted by AC (p =0015 which is lt005) On the contrary FCF does not significantly
predict financial performance This is depicted by (p = 0071 which is gt005) From the
regression results above Adjusted R squared changed from 02106 to 04613 showing a
significant increase in the relationship between FCF and financial performance
This change is attributed to the intervening variablersquos effect It is therefore concluded that
agency costs (AC) have a positive statistically significant intervening effect on the
relationship between FCF and financial performance The null hypothesis that Agency
costs have no significant intervening effect on the relationship between free cash flows
and financial performance of firms listed at the Nairobi Securities Exchange is therefore
rejected The resultant regression model is as shown below
Ǭit = 0187 + 0148ACit+0211FCFit
97
533 Free Cash Flows Firm Characteristics and Financial Performance
This study sought to identify the effect of firm characteristics on the relationship between
FCF and financial performance The corresponding hypothesis is
Hypothesis 3 Firm characteristics have no significant moderating effect on the
relationship between free cash flows and financial performance of firms listed at the
Nairobi securities exchange
The study employed secondary panel data in determining the results under this
hypothesis Since firm characteristics (age and size) are additive each one of them was
tested separately Therefore under this hypothesis two sub-hypotheses were developed
as follows
H03a Firm age has no significant moderating effect on the relationship between free cash
flows and financial performance of firms listed at the Nairobi securities exchange
H03b Firm size has no significant moderating effect on the relationship between free cash
flows and financial performance of firms listed at the Nairobi securities exchange
Secondary data was obtained from financial statements and measured firm characteristics
using firm size and age of the firm Firm size was measured using the natural log of total
assets while age of the firm was measured using the natural log of number of years since
incorporation The moderating effect of firm size and firm age on the relationship
between FCF and firm financial performance was assessed using the centered approach
as by Wu and Zumbo (2008)
98
This involves the following steps Step 1 involves the independent variables and the
moderator variables being regressed against firm financial performance Step 2 on the
other hand entails introduction of the centered approach in the model with the predictor
variable moderating variable and the interaction term being factored into the model The
regression results are shown in Table 55 below
Table 55 Panel Data Results for Financial Performance as the Dependent Variable
and FCF and Firm Age as the Predictor Variables
a Model Summary
Model R R Square Adjusted R Square
Std Error of the
Estimate
1 05894 03474 03109 1573
a Predictors (Constant) FAGE_CENTRED FCF_CENTRED
b Dependent Variable Financial Performance
b ANOVA
Model Sum of Squares df Mean Square F Sig
1 Regression 51189 2 25594 8531 0000
Residual 20440 598 003
Total 255589 600
a Predictors (Constant) FAGE_CENTRED FCF_CENTRED
b Dependent Variable Financial Performance
99
c Coefficients
Model
Unstandardized
Coefficients
Standardized
Coefficients
t Sig B Std Error Beta
1 (Constant) 0041 11662 28109 0044
FCF 1306 0144 088 44238 0023
AGE 201 02607 353 6120 0002
a Dependent Variable Financial Performance
Results in Table 55(a) above show R2 of 03474 and Adjusted R
2 of 03109 Table 55(c)
above shows the coefficients of FCF and AGE as 01306 and 0201 respectively The p
values for FCF and AGE are 0023 and 0002 respectively indicating statistical
significance because each of them is less than 005 Results for Step 2 are displayed in
Table 56 below where the interaction term is introduced
Table 56 Panel Data Results for Financial Performance as the Dependent Variable
and FCF and Firm Age as the Predictor Variables Centered Approach
a Model Summary
Model R R Square Adjusted R Square Std Error of the Estimate
1 06825 046580 042170 041054
a Predictors (Constant) FCF_FAGE_CENTRED FAGE_CENTRED FCF_CENTRED
b Dependent Variable Financial Performance
100
b ANOVA
Model Sum of Squares df Mean Square F Sig
1 Regression 12034 3 401130 29957 0000
Residual 79950 597 01339
Total 91984 600
a Predictors (Constant) FCF_FAGE_CENTRED FAGE_CENTRED FCF_CENTRED
b Dependent Variable Financial Performance
c Coefficients
Model
Unstandardized
Coefficients
Standardized
Coefficients
t Sig B Std Error Beta
1 (Constant) 0065 00245 41263 0001
FCF_CENTRED 0207 00014 0293 74638 0000
AGE_CENTRED 0094 0091 0351 1986 0047
FAGE_CENTRED 0045 002 00204 2230 0027
a Predictors (Constant) FCF_FAGE_CENTRED FAGE_CENTRED FCF_CENTRED
b Dependent Variable Financial Performance
Results from Table 56 above shows R squared change from 03109 to 042170 which is a
change of 01108 (1108 change) which is occasioned by the interaction term This is
also confirmed by the p values which are all less than 005 meaning that firm age
101
positively and significantly moderates the relationship between FCF and financial
performance The regression model for moderation effect of firm age is as shown below
Ǭit = FCFit + AGEit + 0045FAGEit
Table 57 Panel Data Results for Financial Performance as the Dependent Variable
and FCF and Firm Size as the Predictor Variables
a Model Summary
Model R R Square Adjusted R Square Std Error of the Estimate
1 06481 04200 03902 03198
a Predictors (Constant) SIZE FCF
b Dependent Variable Financial performance
b ANOVA
Model
Sum of
Squares df Mean Square F Sig
1 Regression 8447 2 4224 120685 00000
Residual 21456 598 0035
Total 29903 600
a Dependent variable Financial performance
102
c Coefficients
Model
Unstandardized
Coefficients
Standardized
Coefficients
t Sig B Std Error Beta
1 (Constant) 009 002109 53270 00014
FCF 0107 003104 0178 74238 00000
SIZE 0223 009100 1444 19860 00470
a Dependent Variable Financial Performance
Results in Table 57(a) above show R2 of 04200 and Adjusted R
2 of 03902 Table 57(c)
above shows the coefficients of FCF and SIZE as 0107 and 0223 respectively The p
values for FCF and SIZE are 0000 and 0047 respectively indicating statistical
significance because each of them is less than 005 Results for Step 2 are displayed in
Table 58 below where the interaction term is introduced
Table 58 Panel Data Results for Financial Performance as the Dependent Variable
and FCF and Firm Size as the Predictor Variables Centered Approach
a Model Summary
Model R R Square Adjusted R2 Std Error of the Estimate
1 07853 06167 05654 02208
a Predictors (Constant) FCF_CENTRED SIZE_CENTRED FSIZE_CENTRED
b Dependent Variable Financial Performance
103
b ANOVA
Model Sum of Squares df Mean Square F Sig
1 Regression 3138 1 3138 17119 00011
Residual 109846 599 01833
Total 112984 600
a Predictors (Constant) FCF_CENTRED FCF_FSIZE_CENTRED FSIZE_CENTRED
b Dependent Variable Financial Performance
c Coefficients
Model
Unstandardized
Coefficients
Standardized
Coefficients
t Sig B Std Error Beta
1 (Constant) 0144 00245 4826 0021
SIZE_CENTRED 0048 00140 0392 2586 0041
FCF_CENTRED 0155 00140 0132 3938 0003
FSIZE_CENTRED 0227 00327 0472 2679 00981
a Dependent Variable Financial Performance
Results from Table 58 above shows R squared change from 03902 to 05654 which is a
change of 01752 (1752 change) which is occasioned by the interaction term This is
also confirmed by the p values which are all less than 005 meaning that firm size
moderates the relationship between FCF and financial performance The regression
model for moderation effect of firm size is as shown below
104
Ǭit = FCFit + SIZit + 0227FSIZEit
The moderating effect was established as in Stone-Romero and Liakhovitski (2002)
which involves assessing the effects on the dependent variable (non-financial
performance) of the moderating variables (firm size and age) and dependent variable
(FCF) Regression results with non-financial performance as the dependent variable firm
characteristics (firm size and age) and FCF as predictors as shown below
534 Free Cash Flows Agency Costs Firm Characteristics and Financial
Performance
This study sought to establish the joint effect of FCF agency costs and firm
characteristics on firm performance The corresponding hypothesis is as follows
Hypothesis 4 There is no joint effect of free cash flows agency costs and financial
characteristics on performance of firms listed at the Nairobi Securities Exchange
Secondary data was obtained from financial statements The independent variable is FCF
intervening variable is agency costs (AC) The moderating variable is firm characteristics
which are firm size and age of the firm Financial performance was measured using
Tobinrsquos Q and is the dependent variable Panel data results are presented in table 59
below
105
Table 59 Panel Data Results for Free Cash Flows Agency Costs Firm
Characteristics and Financial Performance
a Model Summary
Model R R Square Adjusted R Square Std Error of the Estimate
1 08780 07708 06645 05432
a Predictors (Constant) FCF AC Firm Size Firm Age
b Dependent variable Financial performance
b ANOVA
Model Sum of Squares df Mean Square F Sig
1 Regression 7708 2 3854 22807 0012
Residual 101336 598 0169
Total 7934 600
a Predictors (Constant) FCF AC Firm Size and Firm Age
b Dependent Variable Financial Performance
106
c Coefficients
Model
Unstandardized
Coefficients
Standardized
Coefficients
t Sig B Std Error Beta
1 (Constant) 065 0011 3826 0033
FCF 0144 0024 0081 4938 0020
Age 0107 0027 0150 1233 0074
Size 0231 0069 0102 6586 0010
AC 0314 0034 0259 2901 0032
a Predictors (Constant) FCF AC Firm Size and Firm Age
b Dependent Variable Financial Performance
From the panel study results the intercept (constant) is 0065 with a statistically
significant p-value of 0033 FCF have a coefficient value of 0144 with a p-value of 002
which is significant The findings indicate that FCF still have positive effect on the
performance of the listed firms and the effect is still significant even when control
variables are introduced in the model The effect of agency costs is also positive and
significant at p value 0032 Firm size shows a positive and significant joint effect (p
value is 001) while age has a positive effect but the effect is not significant (p value is
0074) The R2 is 07708 indicating that 7708 of changes in financial performance are
accounted by the joint effect of FCF AC and firm characteristics (size and age)
107
Overall the joint effect of FCF agency costs and firm characteristics on performance of
firms listed at NSE indicates a positive significant relationship The null hypothesis is
therefore rejected There is a significant joint effect of FCF agency costs and firm
characteristics on performance of firms listed at the NSE The regression model that
explains the variation in firm performance as a result of the joint effect of FCF agency
costs and firm characteristics is shown below
Ǭit FCFit +ACit +SIZit +AGEit
Where Ǭit = Financial Performance
FCF= Free Cash flows
AC = Agency Costs (AC)
SIZ = Firm Size
AGE = Firm Age
54 Discussion
The study had four hypotheses with hypothesis 3 having two sub hypotheses one
focusing on firm age and the other on firm size The results under each objective are
discussed here-below
541 The Influence of Free Cash Flows on Financial Performance
The first objective of the study was to establish the influence of FCF on the performance
of firms listed at the NSE This was achieved through analyzing the audited financial
statements of the listed companies (panel data)
108
The results indicate that there is a significant positive relationship between FCF and firm
performance The findings for the influence of FCF on financial performance showed a
statistically significant positive relationship These results are consistent with other
studies on FCF and firm performance For instance Kargar and Ahmadi (2013) found a
positive relationship between FCF and performance of firms listed at the Tehran stock
exchange Similarly Gregory (2005) established that the greater the FCF the better the
performance in merger undertakings Szewczyk et al (1996) and Chang et al (2007)
concluded that shareholders favour businesses that have FCF
In his study on the effects of agency costs on performance of firms listed at the NSE
Wambua (2013) also found a positive relationship between FCF and firm performance
The findings show that increasing FCF disposes more resources to firm managers who
then deploy the resources towards generating more revenues and profits for the firm
The findings are inconsistent with the FCF hypothesis postulated by Jensen (1986) which
suggests that agency conflicts between firm managers and shareholders become more
severe in the presence of substantial FCF thereby negatively affecting firm performance
Furthermore these findings reject the agency theory which was proposed by Jensen and
Meckling (1976) The agency theory is based on the premise that the goal of firm
managers is to maximize their personal wealth and other self-interests instead of
maximizing the wealth of shareholders
On the contrary the findings seem to support the stakeholder theory which advances that
firm management has a network of relationships and therefore corporate accountability
109
includes a broad range of stakeholders such as suppliers business associates financial
institutions the government customers among others Similarly the findings are
consistent with the stewardship theory The theory emphasizes the role of firm managers
as being that of stewards who integrate their goals as part of the firmrsquos goals
542 The Influence of Agency Costs on the Relationship between Free Cash Flows
and Financial Performance
The second objective was to assess the influence of agency costs on the relationship
between FCF and financial performance of firms listed at the NSE The study
hypothesized that agency costs have no significant intervening effect on the relationship
between FCF and performance of firms listed at the NSE The assessment of agency
costs FCF and financial performance was achieved by reviewing financial statements of
companies listed at the NSE The results indicate a statistically significant positive
intervening effect of agency costs on the relationship between FCF and financial
performance
The results reveal that agency cost measure is positive and significantly associated with
firm performance This can be attributed to the role of internal control system in reducing
agency costs associated with residual loss due to suboptimal managerial actions These
findings are supported by Kangarluei Motavassel and Abdollahi (2011) and Khidmat
and Rehman (2014) who established a statistically significant positive effect of agency
costs on the relationship between FCF and firm performance
110
Similarly Lin and Lin (2014) found a positive statistically significant effect of agency
costs on the relationship between FCF and firm performance in the Australian takeover
market These findings are contrary to the argument that substantial FCF increases
agency costs which subsequently affects firm performance negatively The FCF
hypothesis and the agency theory are therefore not supported by the findings On the
contrary the stakeholder theory and the stewardship theory are supported by the results
543 The Influence of Firm Characteristics on the Relationship between Free Cash
Flows and Financial Performance
The third objective of the study was to determine the moderating effect of firm
characteristics on the relationship between FCF and performance of firms listed at the
NSE The firm characteristics evaluated were firm size and age of the firm An
assessment of audited financial statements was carried out to measure FCF firm
characteristics (firm size and age of the firm) and firm financial performance
Results indicate firm size exhibiting a statistically significant positive moderating effect
on the relationship between FCF and firm financial performance Similarly firm age
shows a positive moderating effect on the relationship between FCF and firm financial
performance and the effect is also statistically significant The positive effect of firm size
confirms the results of the study conducted by Nyamweno and Olweny (2014) which
found firm size to be positively related to ROA This indicates that larger firms report
higher financial performance as compared to smaller firms Abbasi and Malik (2015)
clarified the relationship between firm size and financial performance by concluding that
111
larger firms had higher likelihoods of obtaining credit from financial institutions and
would get loans at lower rates because they have superior credit worth ratings and have
lower risk of bankruptcy
Heydari et al (2014) argue that firm characteristics such as firm age and size can expose
a firm to more agency costs related to management and growth prospects thus depressing
the effect of FCF on firm performance This result can be viewed from the perspective of
liability of obsolescence in which organizational performance declines with age
The decline can be attributed to environmental drift resulting from rivalry and
competition and organizational inertia the syndrome of too big or too old to change
Liabilities of obsolescence arise from growing external mismatch with the environment
The results indicate positive effects of firm characteristics on the relationship between
FCF and firm financial performance The results in this study support the RBV theory
which is concerned with internal firm specific factors and their effect on performance
The RBV theory views the firm as a bundle of resources which are combined to create
organizational capabilities that it can use to earn more than average profitability If well
developed competences from these resources become a source of competitive advantage
(Grant 1991)
112
544 The Joint Effect of Free Cash Flows Agency Costs and Firm Characteristics
on Financial Performance
The last objective of the study was to establish the joint effect of FCF agency costs and
firm characteristics on financial performance of firms listed at the NSE Financial
performance was measured by Tobinrsquos Q Firm characteristics that were considered in
the study were firm size and age of the firm Panel data results indicate that there is a
positive statistically significant joint effect of FCF agency costs and firm characteristics
on firm performance These findings support results by Chen et al (2016) who conclude
that large firms which have been in existence for a long time tend to have structures in
place to reduce agency costs
The findings are also similar to Wang (2010) who concluded that there exists a positive
joint effect of firm size FCF and agency cost on firm performance Results of the study
by Jabbary Hajiha Labeshka and Hassanpour (2013) are confirmed by these findings
which reveal that FCF have a positive significant effect on firm performance even with
the inclusion of control variables of agency costs and firm characteristics All the agency
cost coefficients indicate statistically significant positive effects
Emami et al (2014) observe that internal control systems provide an overarching
framework that reduces agency costs and hence positively affecting firm performance
These findings are also similar to Dawar (2014) who established that firm monitoring
costs impact positively on firm performance In testing financial performance firm size
had a coefficient of 0231 and p-value of 001 when jointly tested with other variables
113
indicating that firm size has a positive effect on firm performance even with control
variables introduced
These findings are supported by Banafa (2016) who concluded that firm size affects
performance of firms significantly albeit with small effect when moderated by other
variables In testing financial performance firm age revealed a positive but not
statistically significant effect with a coefficient of 0107 and a p-value of 0074 These
results contradict with Brouwe et al (2005) who concluded that productivity growth
rates are negatively correlated with firm age
Overall the joint effect of FCF agency costs and firm characteristics on performance of
firms listed at NSE indicates a positive significant relationship We therefore reject the
null hypothesis which states that there is no significant joint effect of free cash flows
agency costs and firm characteristics on financial performance of firms listed at the NSE
These results have rejected the FCF hypothesis and the agency theory This is because
FCF firm characteristics and agency costs have indicated a positive joint effect on firm
performance On the other hand the stewardship theory the stakeholder theory and the
RBV theory seem to be supported by the findings The organisational theory which
explains firm size in relation to profitability as well as organizational transaction costs
agency costs and span of control also seems to be supported by the findings of this study
114
Table 510 Summary of Tests of Hypotheses Results and Conclusions
Hypothesis R2
(p-value) Conclusion
H01 FCF have no significant
effect on financial
performance of firms listed at
the NSE
02391
00023
Null Hypothesis rejected
H2 Agency costs (AC) have
no significant intervening
effect on the relationship
between FCF and financial
performance of firms listed at
the NSE
05122
0031
Null Hypothesis rejected
H03a Firm age has no
significant moderating effect
on the relationship between
FCF and financial
performance of firms listed at
the NSE
04658
0047
Null Hypothesis rejected
H03b Firm size has no
significant moderating effect
on the relationship between
FCF and financial
performance of firms listed at
the NSE
06167
0041 Null Hypothesis rejected
H04 There is no joint effect of
FCF agency costs and firm
characteristics on financial
performance of firms listed at
the NSE
07708
0033
Null Hypothesis rejected
115
55 Summary and Presentation of Empirical Models
The chapter presented the study results from analytical tests conducted to verify the study
hypotheses The findings of the statistical analyses carried out were presented and
interpreted The study established that FCF have a statistically significant positive effect
on financial performance This relationship is intervened by agency costs and moderated
by firm characteristics
Agency costs have a statistically significant positive intervening effect on the relationship
between FCF and financial performance On the other hand firm characteristics have a
statistically significant negative moderating effect on the relationship between FCF and
firm financial performance Finally the study established that there is a joint effect of
FCF agency costs and firm characteristics on financial performance of firms listed at the
NSE The joint effect is positive and statistically significant The empirical conceptual
model depicting the relationships between the variables is presented in figure 51 below
116
Figure 51 Revised Empirical Model ndash Financial Performance
Independent Variable Dependent Variable
Intervening Variable H1 Ǭit = 048011 + 0206FCFit
H2 Ǭit = 0187 + 0148ACit + 0211FCFit
H4 Ǭit = 065 + 00144FCFit + 0314ACit + 0231SIZit + 0107AGEit
Ǭit = 065+0207FCFit+0094AGEit + 0045FAGEit
H3 Ǭit = 0144+0155FCFit +0048SIZit+ 0227FSIZit
Moderating Variable
Source Researcher (2018)
Free Cash Flows
FCFit=(Net income
(PAT)+depreciation and
amortization - CAPEX -
change in non-cash
working capital + net
borrowing)Sales
Firm Financial
Performance
- Tobinrsquos Q
Agency Costs
- Asset utilization efficiency AC
- Production cost efficiency
Firm Characteristics
- Firm Size
- Age of the firm
117
CHAPTER SIX SUMMARY OF FINDINGS CONCLUSIONS AND
RECOMMENDATIONS
61 Introduction
This study investigated the relationship between FCF agency costs firm characteristics
and financial performance of firms listed at the NSE The independent variable is FCF
while agency costs are intervening variables and firm characteristics are moderating
variables Financial performance is the dependent variable The chapter has summarized
the findings of the study and made conclusions upon which recommendations are drawn
Discussions conclusions and recommendations have been presented These have been
discussed in light of other studies that have investigated the same or similar variables in
other settings The chapter ends with the study implications to theory policy and
practice and recommendations for further research
The study had four objectives upon which conclusions are aligned to The objectives
were first to stablish the relationship between free cash flows and financial performance
of firms listed at the NSE second to assess the influence of agency costs on the
relationship between free cash flows and financial performance of firms listed at the
NSE third to determine the influence of firm characteristics on the relationship between
free cash flows and financial performance of firms listed at the NSE and lastly to
establish the joint effect of free cash flows agency costs and firm characteristics on
financial performance of firms listed at the NSE
118
62 Summary of Findings
This study was founded on the premise that FCF have an influence on financial
performance and that the relationship between the two is intervened by agency costs and
moderated by firm characteristics A conceptual framework was therefore developed and
the study empirically tested hypotheses which were guided by the study objectives The
first objective of the study was set to find out the relationship between FCF and
performance of firms listed at NSE The findings reveal that FCF have a statistically
significant positive effect on performance of firms listed at the NSE
This finding is supported by the coefficient of determination of 02391 which indicates
the variations in firmsrsquo financial performance (explanatory variable) explained by FCF
(predictor variable) The effect of FCF was established to be statistically significant and
therefore the null hypothesis was rejected Therefore we reject the null hypothesis that
FCF have no statistically significant effect on performance of firms listed at the NSE
The results are inconsistent with the FCF hypothesis advanced by Jensen (1986) which
proposes that agency conflicts between firm managers and shareholders become more
severe in the presence of substantial FCF thereby negatively affecting financial
performance Additionally these findings reject the agency theory which was suggested
by Jensen and Meckling (1976) These results are consistent with Wambua (2013) who
found a positive relationship between FCF and firm performance The findings imply that
increasing FCF avails more resources to firm managers who utilize the funds in
generating more wealth
119
The second objective of the study sought to assess the influence of agency costs on the
relationship between FCF and financial performance of firms listed at the NSE The
findings indicate that agency costs have a positive statistically significant intervening
effect on the relationship between FCF and financial performance of firms listed at the
NSE Thus the study rejected the null hypothesis which states that agency costs have no
significant intervening effect on the relationship between FCF and financial performance
of firms listed at NSE
These findings support Lin and Lin (2014) who found a positive statistically significant
effect of agency costs on the relationship between FCF and firm performance in the
Australian takeover market These findings are contrary to the FCF hypothesis suggested
by Jensen (1986) and the agency theory postulated by Jensen and Meckling (1976)
However the stakeholder theory advanced by Freeman (1984) and the stewardship theory
developed by Donaldson and Davis (1991) seem to be supported by the findings
The third objective of the study sought to establish the influence of firm characteristics on
the relationship between FCF and financial performance of firms listed at the NSE
Results indicate that firm characteristics (both firm size and age) have a positive
significant moderating effect on the relationship between FCF and financial performance
of firms listed at the NSE These findings contradict Heydari et al (2014) who argue that
firm characteristics such as firm age and size can expose a firm to more agency costs
related to management and growth prospects thus depressing the effect of FCF on firm
performance
120
The fourth and final hypothesis sought to establish the joint effect of FCF agency costs
and firm characteristics on financial performance of firms listed at the NSE Results show
positive coefficients for all the variables which means that as FCF agency costs and firm
characteristics jointly increase performance of the NSE listed firms also increases Firm
characteristics show a positive statistically significant joint effect on firm financial
performance and also FCF and agency costs show a positive statistically significant joint
effect on firm financial performance The results have rejected the FCF hypothesis and
the agency theory On the other hand the results seem to support the stewardship theory
the stakeholder RBV theory and the organisational theory
63 Conclusions
Based on the findings of the study FCF is fundamental to firm performance because it
allows firms to invest and grow thereby improving performance Firms should strive to
increase FCF since it has a statistically significant positive effect on financial
performance Similarly firms should invest more in firm monitoring which according to
the findings in this study the benefits derived from investing in firm monitoring
(improved firm performance) outweigh the agency costs of investing therein (in firm
monitoring) This study has found no evidence supporting the FCF hypothesis as
suggested by Jensen (1986) and therefore firms listed at the NSE are not consistent with
the FCF hypothesis
Consistent with these findings Nyamweno and Olweny (2014) found firm size to be
positively related to financial performance Similarly Dawar (2014) found that firm
121
monitoring costs impact positively on financial performance Conflicting with literature
(Kwanum amp Lorpev 2012) firm age indicated a positive effect on the relationship
between FCF and firm financial performance However the findings of this study are
consistent with Banafa (2016) who concluded that firm size affects firm performance
significantly when moderated by other variables It is therefore confirmed that there
exists a strong relationship between FCF agency costs firm characteristics and financial
performance of firms listed at the NSE
64 Contributions of the Study
The study has contributed to knowledge in the areas of FCF and the agency problem firm
characteristics and firm performance More specifically the study has contributed to
theory policy and practice
641 Contribution to Theory
The results of this study have to a large extent rejected the FCF hypothesis advanced by
Jensen (1986) and the agency theory advanced by Jensen and Meckling (1976) which
postulate that when a firm has generated significant FCF and there are no lucrative
investment projects available managers tend to abuse the FCF which results in increased
agency costs The study results have therefore given credence to the critics of the FCF
hypothesis and agency theory who argue that the theories foster short-termism by not
favouring investments that have long run returns Furthermore the findings support the
argument that even in conditions of greatly specific assets where the likelihood of
opportunism is very high there are people who will give precedence to cooperation and
trust and will not engage in opportunistic behavior
122
The study findings have also given credibility to the stewardship theory postulated by
Donaldson and Davis (1991) which emphasizes the role of firm managers as being
stewards incorporating their objectives as part of the firm As stewards they are
contented and encouraged when success of the firm is achieved Agency costs have
shown a positive intervening effect on the relationship between FCF and firm
performance This finding gives credibility to firm monitoring through CG which seems
to have achieved the objective of aligning the interests of firm managers and
shareholders The study findings also imply that firm capabilities and firm characteristics
complement the effects of agency costs on performance
The inclusion of firm characteristics as a moderating variable provided an opportunity to
test the RBV and organizational theories by providing empirical evidence about how the
specific firm characteristics (size and age) affect firm performance This study adopted
two measures of agency costs This measurement approach has enabled the study to offer
a stronger and more robust assessment of the linkages between the study variables
642 Contribution to Policy
The Kenyan context is characterized by calls for effective CG particularly for public
limited liability firms (Okiro 2014) These study findings have refuted the FCF
hypothesis by revealing a positive relationship between FCF and firm performance as
intervened by agency costs This is an indication that investing in firm monitoring is
yielding positive results Adopting good CG mechanisms (firm monitoring which form
123
part of agency costs) is an effective way of improving firm performance Firms should
endeavor to strengthen their monitoring mechanisms so as to increase performance
Improving CG entails having an optimal number of board of directors enhancing board
independence making full disclosure of shareholding and directorrsquo remuneration Policy
makers will therefore maintain CG calls and strive to strengthen and continue developing
policies regulations and prudential guidelines that protect and strengthen shareholders
643 Contribution to Practice
The study findings have shown the fundamental importance of firms generating FCF and
strengthening firm monitoring The joint effect of FCF agency costs and firm
characteristics on firm performance has yielded a positive relationship Firm managers
investors and other practitioners will therefore put more emphasis on the need for firms to
generate FCF and to enhance firm monitoring
Cash flows from operating activities financing activities and investment activities will be
more keenly analyzed with a view to achieve greater efficiency This study has also
delineated FCF from agency costs unlike studies such as Jensen (1986) which generally
regard FCF as agency costs This gives firm managers investors and other practitioners a
better understanding of the variables and their linkages which will enhance effectiveness
and efficiency in firm operations
124
65 Limitations of the Study
The study focused on firms listed at the NSE which operate in a unique environment
Unique factors such as regulatory environment culture and demographics limit the
generalizability of the study results to other countries or markets However this
limitation does not render the study findings applicable to NSE listed firms only Some
aspects could be relevant to other markets
Secondly the major theoretical motivations underlying this study are the FCF hypothesis
and the agency theory Traditionally the board of directors keenly monitors decision
makers who tend to divert resources to their own personal interests The findings support
this view and offer evidence that proper firm monitoring mechanisms yield higher firm
performance A probable limitation of the study is that it does not integrate other CG
mechanisms such as influencing managersrsquo actions through an advisory role
Thirdly the study disregards practices other than board monitoring that may serve to
lessen agency costs Firm monitoring costs were a part of the larger agency cost variable
The omission of alternative board monitoring practices did not therefore undermine the
robustness and or the rigor of the study Fourthly the study used only two firm
characteristics These are firm size and age of the firm Other firm characteristics include
profitability leverage liquidity sales growth among others The study employed size and
age only because they are the most commonly used in literature and their effect on firm
performance is more significant (Demsetz amp Lehn 1985 and Mule Mukras amp Nzioka
2015)
125
Lastly literature indicates at least seven proxy measures of agency costs These are
operating expense to sales ratio total asset turnover advertising and RampD expense to
sales ratio administrative expense to sales ratio earnings volatility firm monitoring
index and FCF This study utilized only two of these measures (total asset turnover and
operating expense to sales ratio) Agency cost measures other than the two used in this
study may yield different findings Employing only one agency cost measure may still be
sufficient and therefore the omission of other measures did not undermine the robustness
and or the rigor of the study
66 Recommendations of the Study
The findings have indicated that there exists a positive relationship between FCF and
financial performance The study therefore recommends that firm managers investors
and other practitioners should focus more on the need for firms to generate FCF Positive
FCF indicate that the firm is making more cash than is used to operate the firm and for
reinvestment Such excess funds can be given back to shareholders as dividends or share
repurchase packages in cases where the firms have limited growth prospects and the
funds could not be better invested somewhere else
It is therefore recommended that regulators policy makers investors and other
practitioners should emphasize on monitoring and CG mechanisms to maintain if not
improve high firm performance Study results indicate that proper monitoring
mechanisms can bring the actions of firm managers into congruence with those of
shareholders which primarily is to maximize the shareholdersrsquo wealth
126
67 Suggestions for Further Research
This study used Tobinrsquos Q in measuring financial performance Further studies need to be
conducted using ROE ROI ROA DY sales growth market share or productivity
Secondly the study population was all firms listed at the NSE These firms cut across
various industry sectors Future studies could focus on specific industries such as
manufacturing financial sector communications agricultural or automobile industry
This is because focusing on a specific industry could yield different results that are
unique for the industry
Thirdly this study used only two firm characteristics as moderating variables These are
firm size and age of the firm Future studies could employ sales growth liquidity growth
prospects profitability asset growth turnover ownership structure dividend pay-out
profitability and access to capital markets among others Use of other moderating
variables may yield different results
Lastly the study only employed two proxy measures of agency costs Future studies
should attempt to use all the suggested seven agency cost measures or the other agency
cost measures not employed in this study This could yield different results or provide
more robustness and rigor in the study
127
REFERENCES
Abbasi A amp Malik A Q (2015) Firm size moderating financial performance in
growing firms Empirical evidence from Pakistan International Journal of
Economics and Financial Issues 5(2) 334ndash339
Adelegan O J (2009) Investment financial factors and cash flow from Nigerian panel
data Journal of African Development 11(1) 77-108
AERA APA amp NCME (2000) Standards for educational and psychological tests
Washington DC American Psychological Association American Educational
Research Association National Council on Measurement in Education
Aldrich H E amp Austen E (1986) Even dwarfs started small Liabilities of size and age
and their strategic implications In Staw B Cummings (Eds) Research in
organizational behavior JAI Press Greenwich CT
Ayako A Kungu G amp Githui T (2015) Determinants of the performance of firms
listed at the Nairobi Securities Exchange Research Journal of Finance and
Accounting 6(12) 157-164
Aiken L S amp West S G (1991) Multiple regression Testing and interpreting
interactions Thousand Oaks CA Sage
Bain J S (1959) Industrial organization New York John Wiley amp Sons
Baker W E amp Sinkula (2005) Market orientation and the new product paradox Journal
of Product Innovation Management 22(6) 485-502
Banafa A (2016) The effect of leverage liquidity and firm size on financial
performance of listed non-financial firms in Kenya Unpublished PhD Thesis
Jomo Kenyatta University of Agriculture and Technology
128
Barney J B (2002) Gaining and sustaining competitive advantage 2nd
ed Reading
Mass Addison-Wesley
Baron R M amp Kenny D A (1986) The moderator-mediator variable distinction in
social psychological research conceptual strategic and statistical considerations
Journal of Personality and Social Psychology 51(6) 1173-1182
Berle A A amp Means G C (1932) The modern corporation and private property
McMillan New York
Bonett D G amp Wright T A (2014) Cronbachrsquos Alpha Reliability Interval estimation
hypothesis testing and sample size planning Journal of Organizational Behavior
36 (1) 3-15
Bourne M Neely A D Mills J F amp Platts K (2003) Implementing performance
measurement systems A literature review International Journal of Business
Performance Management 5 (1) 1-24
Brealey A A Myers S C amp Allen F (2005) Principles of corporate finance (8th
ed)
Boston McGraw-HillIrwin
Bromiley P (1990) Advances in strategic management JAI Press Greenwich
Brouwer P Kok J D amp Fris P (2005) Can firm age account for productivity
differences EIM Business research scientific analysis of entrepreneurship and
SMEs SCALES ndash paper N200421 Zoetermeer Netherlands
Brush H W Bromiley P amp Hendrickx M (2000) The free cash flow hypothesis for
sales growth and firm performance Strategic Management Journal 21 455-472
129
Cadogan J W amp Diamantopoulos A (1995) Narver and Slater Kohli and Jaworski and
the market orientation construct integration and internationalization Journal of
Strategic Marketing 3(1) 41-60
Carson D Gilmore A Perry C amp Gronhaug K (2001) Qualitative marketing
research SAGE publications London
Central Bank of Kenya (2016) Bank supervision annual report
Chang S J amp Singh H (2000) Corporate industry effects on business and competitive
position Strategic Management Journal 21 (1) 739-752
Chen X Sun Y amp Xu X (2016) Free cash flow over-investment and corporate
governance in china Pacific-Basin Finance Journal 37 81ndash103
CMA (2010) A comparative analysis of the performance of African stock markets
[Online] Available wwwcmaorke [Accessed 9 August 2015]
Cline B N Williamson C R amp Yore A (2014) Economic calculation and constraints
on firm size Mississippi State University USA
Cooper D R amp Schindler P S (2006) Business research methods 9th
edition Mac-
Grow-hill publishing co ltd New Delhi India
Daft R L (1995) Organization theory and design (11 ed) West Publishing Company
New York
Daily C M Dalton D R amp Cannella J A A (2003) Corporate governance decades
of dialogue and data The Academy of Management Review 28 (3) 371-382
Dancey C amp Reidy J (2011) Statistics without maths for psychology 5th Edition
Prentice Hall London
130
Davis J Donaldson L amp Schoorman D (1997) Towards a stewardship theory of
management Academy of Management Review 22 (1) 20-47
Dawar V (2014) Agency theory capital structure and firm performance some Indian
evidence Managerial Finance 40(12) 1190ndash1206
Dean T J Robert L B amp Bamford (1998) Differences in large and small firm
responses to environmental context strategic implications from a comparative
analysis of business formations Strategic Management Journal 19(8) 709-728
Demsetz H amp Lehn K (1985) The structure of corporate ownership causes and
consequences Journal of Political Economy 93 (6) 1155-1177
Donaldson L (1990) A rational basis for criticism of organizational economics a reply
to Barney Academy of Management Review 15 394-401
Donaldson L amp Davis J H (1991) Stewardship theory or agency theory CEO
governance and shareholder returns Australian Journal of Management 16 (1)
49-65
Donaldson T amp Preston LE (1995) The stakeholder theory of the corporation
concepts evidence and implications Academy of Management Review 20 (1)
65-91
Dyer L amp Reeves T (1995) Human resource strategies and firm performance what do
we know and where do we go International Journal of Human Resource
Management 31 758-775
Easterwood C (1997) Takeovers and incentives for earnings management an empirical
analysis Journal of Applied Business Research 14 29-48
131
Emami E Salteh H M amp Hasanzadeh R B (2014) Social responsibility and value of
firms listed at Tehranrsquos Stock Exchange International Review of Management
and Business Research 31(21) 332ndash338
Fama E F (1980) Agency problems and theory of the firm Journal of Political
Economy 88(2) 288-307
Fauver L amp Naranjo A (2010) Derivative usage and firm value the influence of
agency costs and monitoring problems Journal of Corporate Finance 16 719-
735
Ferris S P amp Yan X S (2009) Agency costs governance and organizational forms
evidence from the mutual fund industry Journal of Banking and Finance 33 619-
626
Field A (2009) Discovering statistics using SPSS Sage Publications Ltd London
Figge F Hanh T Schaltegger S amp Wagner M (2002) The sustainability Balanced
Score Card - Linking sustainability management to business strategy Business
Strategy and Environment 11 269-284
Freeman R (1984) Strategic management a stakeholder approach Pitman Publishing
Inc Massachusetts
Frentrop P (2003) On the discretionary power of top executives Journal of Asset
Management 5 (2) 91-104
Gleason J M amp Barnum D T (1982) Toward valid measures of public sector
productivity performance measures in urban transit Management Science
28(14) 379-386
Gorard S (2013) Research design robust approaches for the social sciences London
SAGE ISBN
132
Grant R M (1991) The resource based theory of competitive advantage implications
for strategic formulation California Management Review 33(1) 114-135
Gregory A (2005) The long-run abnormal performance of UK acquirers and the free
cash flow hypothesis Journal of Business Finance and Accounting 32(5) 777-
814
Gul F A amp Tsui S T J (1998) A test of the free cash flow and debt monitoring
hypotheses evidence from audit pricing Journal of Accounting and Economics
24 (2) 219-237
Hannan M T amp Freeman J (1984) Structural inertia and organizational change
American Sociological Review 49(2) 149-164
Harford J (2002) Corporate cash reserves and acquisitions The Journal of Finance 54
(6) 1969 ndash 1997
Hawawini G Subramanian V amp Verdin P (2003) Is performance driven by industry
or firm specific factors a new look at evidence Strategic Management Journal
23 (1) 1-16
Hendricks K B amp Singhal V R (2001) Firm characteristics total quality management
and financial performance Journal of Operations Management 19 269-285
Heydari I Mirzaeifar M Javadghayedi M amp Student M A (2014) Investigating the
relationship between free cash flows and firm performance evidence from Tehran
Stock Exchange Indian Journal of Scientific Research 4(6) 269ndash279
Hill C W L (1990) Cooperation opportunism and the invisible hand implications for
transaction cost theory Academy of Management Review 15(3) 500-513
Hubbard R G (1998) Capital market imperfections and investment Journal of
Economic Literature 36 (2) 193-225
133
Jabbary H Hajiha Z Labeshka amp Hassanpour R (2013) Investigation of the effect of
agency costs on firm performance of listed firms at the Tehran Stock Exchange
European Online Journal of Natural and Social Sciences 2(3) 771ndash776
Jensen M (1986) Agency costs of free cash flow corporate finance and takeovers
American Economic Review 76 (2) 323-329
Jensen M C amp Meckling W H (1976) Theory of the firm managerial behavior
agency cost and ownership structure Journal of Financial Economics 3 (4) 305-
360
Kaen F R amp Baumann H D (2003) Firm size employees and profitability in US
manufacturing industries Social Science Research Network Electronic Journal
(1) 1-71
Kapelko M (2006) Evaluate efficiency in the framework of resource based view of the
firm evidence from Polish and Spanish textile amp clothing industry Bellaterra
1(1) 1-56
Kaplan R S amp Norton D P (2001) Transforming Balanced Score Card from
performance measurement to strategic management Part 1 Accounting Horizons
87-104
Kangarluei S J Motavassel M amp Abdollahi T (2011) The investigation and
comparison of free cash flows in the firms listed in Tehran Stock Exchange (TSE)
with an emphasis on earnings management International Journal of Economics
and Business Management 2(2) 5352ndash118
Kargar E F amp Ahmadi G R (2013) The relationship between free cash flows and
agency costs levels evidence from Tehran Stock Exchange Research Journal of
Finance and Accounting 4(14) 51ndash66
134
Kerlinger F N (2002) Foundations of behavioural research Holt Rinehart and
Winston Inc USA
Khidmat W B amp Rehman M U (2014) The impact of free cash flows and agency
costs on firm performance - an empirical analysis of KSE listed companies of
Pakistan Journal of Financial Engineering 01(03) 145 ndash 175
Kimberlin C L amp Winterstein A G (2008) Validity and reliability of measurement
instruments used in research American Society of Health-System Pharmacists 65
Kinoti M A (2012) Factors contributing towards adoption of green marketing
practices in the mobile phone service providers in Kenya Unpublished PhD
Thesis University of Nairobi Kenya
Kogan L amp Tian M (2012) Firm characteristics and empirical factor models a data-
mining experiment International Finance Discussion papers 1070
Kwanum M amp Iorpev L (2012) Capital structure and firm performance evidence from
manufacturing companies in Nigeria International Journal of Business and
Management Tomorrow 2 (5) 1ndash17
Leibenstein H (1976) Beyond economic man Cambridge MA Harvard University
Press
Lengnick-Hall C A amp Wolff J A (1999) Similarities and contradictions in the core
logic of three strategy research streams Strategic Management Journal 20(12)
1109-1132
Lin L amp Lin D (2014) Agency cost of free cash flow and biddersrsquo long-run takeover
performance Universal Journal of Accounting and Finance 2(1) 1-8
135
Lusthaus C Anderson G amp Murphy E (1995) Institutional assessment a framework
for strengthening organizational capacity for IDRCrsquos research partners
International Development Research Centre Ottawa
Mackinnon D P Lockwood C M Hoffman J M West S G amp Sheets V (2002) A
comparison of methods to test mediation and other intervening variable effects
Psychological Methods 7 (1) 83-104
Mbugua D (2015) Market orientation firm characteristics dynamic capabilities and
performance of deposit-taking savings and credit cooperative societies in Kenya
Unpublished PhD Thesis University of Nairobi Kenya
Mansell S (2013) Capitalism corporations and the social contract a critique of
stakeholder theory Cambridge Cambridge University Press
McKnight P J amp Weir C (2008) Agency costs corporate governance mechanisms and
ownership structure in large UK publicly quoted companies a panel data analysis
The Quarterly Review of Economics and Finance 49 (2009) 139-158
Meyer M W amp Zucker L G (1989) Permanently failing organization Sage Beverly
Hills CA
Miller D amp Chen M J (1994) Sources and consequences of competitive inertia
Administrative Science Quarterly 39(1) 1-17
Milne F Purda L amp Anand A (2008) Monitoring to reduce agency costs examining
the behavior of independent and non-independent boards Seattle University Law
Review 33(4) 809-848
Mitchell R K Agle B R amp Wood D J (1997) Toward a theory of stakeholder
identification and salience defining the principle of who and what really counts
Academy of Management Review 22(4) 853-886
136
Mojtahedzadeh V amp Nahavandi N N A P (2009) Free cash flow agency costs
earnings management and investor monitoring Journal of Financial Economics
32 615-635
Muganda N (2010) Applied business and management research Exploring the
principles and practices of research within the context of Africa Africa Nicorp
Publication
Mugenda O M amp Mugenda AG (2003) Research methods quantitative and
qualitative approaches Nairobi Acts Press
Mule R K Mukras S M amp Nzioka O M (2015) Corporate size profitability and
market value an econometric panel analysis of listed firms in Kenya European
Scientific Journal 11 (13) 376-396
Mwangi M (2014) The influence of membersrsquo income and conduct of SACCOs in the
relationship between characteristics and efficiency of SACCOs in Kenya
Unpublished PhD Thesis University of Nairobi Kenya
Nairobi Securities Exchange (2015) History of the NSE [Online] Available
wwwnsecoke [Accessed 26 June 2015]
Neely A (1998) Measuring business performance - why what and how Economist
Books London
Neely A D Adams C amp Kennerley M (2002) The performance prism the scorecard
for measuring and managing business success Pearson Education Limited
London UK
Nekhili M Amar I F B Chtioui T amp Lakhal F (2014) Free cash flow and earnings
management the moderating role of governance and ownership Journal of
Financial Economics 11 (13) 847 ndash 875
137
Njeru W G (2013) Market orientation marketing mix practices firm characteristics
external environment and performance of tour firms in Kenya Unpublished PhD
Thesis University of Nairobi Kenya
Njuguna L amp Moronge M (2013) Influence of the managerial behavior of agency cost
on the performance of listed firms on NSE International Journal of Social
Sciences and Entrepreneurship 1 (7) 397-410
Norman W amp MacDonald C (2004) Getting to the bottom of tripple bottom line
Business Ethics Quarterly 14 (2) 243-262
Nunes P J M Serrasqueiro Z M amp Sequeira T N (2009) Profitability in Portuguese
service industries a panel data approach The Service Industries Journal 29(5)
693-707
Nunnally J (1967) Psychometric theory Mac-Graw-Hill New York
Nyamweno C N amp Olweny T (2014) Effect of working capital management on
performance of firms listed at the Nairobi Securities Exchange Economics and
Finance Review 3(11) 1ndash14
Nyongrsquoo A P (2000) The context of privatization in Kenya African academy of
sciences Colour Printers Nairobi Kenya
Odundo E (2009) Alternative investment options transforming needs into
opportunities Retirement Benefits Authority CMA Workshop
Okiro K O (2014) The influence of capital structure firm size rules and regulations on
the relationship between composite corporate governance and performance of
firms listed on East African Securities Exchanges Unpublished PhD Thesis
University of Nairobi Kenya
138
Ongore V amp KrsquoObonyo P (2011) Effects of selected corporate governance
characteristics on firm performance empirical evidence from Kenya
International Journal of Economics and Financial Issues 1 (3) 99-122
Opler T amp Titman S (1993) The determinants of leveraged buyout activity free cash
flow versus financial distress costs Journal of Finance 48 1985-1999
Oppenheim A N (1992) Questionnaire design interviewing and attitude measurement
Basic books Inc New York
Patton M (1990) Qualitative evaluation and research methods Beverly Hills CA
Sage
Pearce J A amp Robinson R B (2011) Strategic management formulation
implementation and control (12th
ed) New York McGraw HillIrwin
Penfield R amp Miller J M (2004) Improving content validation studies using an
asymmetric confidence interval for the mean of expert ratings Applied
Measurement in Education 17 359-370
Penrose E T (1959) The theory of the growth of the firm Oxford Basil Blackwell
Perry C Reige A amp Brown L (1999) Realismrsquos role among scientific paradigms in
marketing research Irish Marketing Review 12(2) 16-23
Podrug N (2010) Stewardship relations within management hierarchy in large
Croatian companies Doctoral Dissertation Faculty of Economics and Business
Zagreb
139
Ponnu C H amp Okoth M O (2009) Corporate social responsibility disclosure in Kenya
The Nairobi Stock Exchange African Journal of Business Management 3(10)
601-608
Porter M E (1980) Competitive strategy New York The Free Press
Power L (1998) The missing link technology investment and productivity Review of
Economics and Statistics 80(2)300 ndash 313
Priem R L amp Butler J E (2001) Is the resource based view a useful perspective for
strategic management research Academy of Management Review 26(1) 22-40
Proctor S (1998) Philosophy and methods of research process the case of realism
Nurse Researcher 5 (4) 73 ndash 90
Richard P Divinney T M Yip G S amp Johnson G (1999) Measuring organizational
performance towards methodological best practice Journal of Management
35(2) 1340-1378
Richardson S (2006) Over-investment of free cash flow and corporate governance
Review of Accounting Studies 11 159-189
Robinson C amp Schumacker R E (2009) Interaction effects countering variance
inflation factor and interpretation issues Multiple Linear Regression View Points
35(1) 6-11
Rumelt R P (1991) How much does industry matter Strategic Management Journal
12(1) 167 185
Sagwa E V (2014) Human resource management practices and performance of firms
listed at the Nairobi Securities Exchange Unpublished PhD Thesis University of
Nairobi Kenya
140
Salaman G (1979) Work organizations resistance and control Longman London
Saunders M Lewis P amp Thornhill A (2007) Research methods for business students
(4th
ed) Prentice Hall Financial Times Harlow
Schmalensee R (1985) Do markets differ much American Economic Review 75 (1)
341-351
Shepherd W G (1986) On the core concepts of industrial economics in H W De Jong
and W G Shephert eds Mainstreams in Industrial Organization Dordrecht
Martinus Nijhoff Publishers
Singh M amp Davidson W N (2003) Agency costs ownership structure and corporate
governance mechanisms Journal of Banking and Finance 27 793-816
Smith C W amp Warner J B (1979) On financial contracting an analysis of bond
covenants Journal of Financial Economics 7(79) 117-161
Stalk G Evans P amp Schulman L E (1992) Competing on capabilities the new rules
of corporate strategy Harvard Business Review 70(1) 57-69
Stinchcombe A L (1965) Social structure and organizations Handbook of
organizations Rand McNally Chicago
Subrahmanyam A amp Titman S (2001) Feedback from stock prices to cash flows
Journal of Finance 56 (18) 2389-2413
Sundaram A K amp Inkpen A C (2004) Stakeholder theory and ldquothe corporate
revisitedrdquo a reply Journal of Organization Science 15 (3) 370-371
141
Szewczyk S H Tsetsekos G P amp Zantout Z (1996) The valuation of corporate RampD
expenditures evidence from investment opportunities and free cash flow Journal
of Financial Management 25 (1) 105-110
Tabachnick B G amp Fidell L S (2013) Using multivariate statistics (6 ed) Needham
Heights MA Allyn amp Bacon
Thakor R T (2013) Investment opportunities free cash flow and the market values of
foreign and domestic cash holdings Unpublished Working Paper Massachusetts
Institute of Technology
Thompson P amp McHugh D (2002) Work organizations a critical introduction (3rd
ed) Palgrave McMillan
Tirole J (1986) The theory of corporate finance Princeton University Press Princeton
NJ
Venkatraman N Ramanujam V (1986) Measurement of business performance in
strategy research a comparison of approaches The Academy of Management
Review 11(4) 801-814
Vogt S (1997) Cash flow and capital spending Evidence from capital expenditure
announcements Journal of Financial Management 26(2) 44 ndash 57
Waithaka S M Ngugi J K Aiyabei J K Itunga J K amp Kirago P (2012) Effects
of dividend policy on share prices a case of companies at the Nairobi Securities
Exchange Journal of Business Administration and Management 2 (8) 642-648
Wambua P (2013) Effects of agency costs on financial performance of companies listed at
the Nairobi Securities Exchange International Journal of Social Sciences and
Entrepreneurship 1 (5) 587-607
142
Wang G Y (2010) The impacts of free cash flows and agency costs on firm performance
Journal of Service Science and Management 3 408-418
Wernerfelt B (1984) A resource based view of the firm Strategic Management Journal
5(2) 171-180
Wernerfelt B amp Montgomery C A (1985) Tobinrsquos Q and importance of focus in firm
performance American Economic Review 78(1) 246-250
Williams B Onsman A amp Brown T (2012) Is the Australian paramedic a discipline or a
profession A national perspective International Journal of Paramedic Practice
1(5) 162-168
Williams J R (1992) How sustainable is your competitive advantage California
Management Review 34(1) 29-51
World Bank (2000) Corporate governance a framework for implementation A World Bank
Country Study Washington
Yin X amp Zajac E J (2004) The strategygovernance structure fit relationship theory and
evidence franchising arrangements Strategic Management Journal 25(7) 201-242
Wu A D amp Zumbo B D (2008) Understanding and using mediators and moderators
Social Indicators Research 87(3) 367
Zou S amp Stan S (1998) The determinants of export performance a review of the empirical
literature between 1987 and 1997 Journal of Marketing Review 15(5) 333-356
i
APPENDICES
Appendix I Firms Listed at the Nairobi Securities Exchange as at December 31
2015
NO SECTOR
A AGRICULTURAL
1 Eaagads Ltd
2 Kapchorua Tea Co Ltd
3 Kakuzi Ltd
4 Limuru Tea Co Ltd
5 Rea Vipingo Plantations Ltd
6 Sasini Ltd
7 Williamson Tea Kenya Ltd
B AUTOMOBILES AND ACCESSORIES
8 Car and General (K) Ltd
9 Sameer Africa Ltd
10 Marshalls (EA) Ltd
C BANKING
11 Barclays Bank Ltd
12 CFC Stanbic Holdings Ltd
13 IampM Holdings Ltd
14 Diamond Trust Bank Kenya Ltd
15 Housing Finance Co Ltd
16 Kenya Commercial Bank Ltd
17 National Bank of Kenya Ltd
18 NIC Bank Ltd
19 Standard Chartered Bank Ltd
20 Equity Bank Ltd
21 The Co-operative Bank of Kenya Ltd
D COMMERCIAL AND SERVICES
22 Nation Media Group
ii
23 Kenya Airways Ltd
24 Express Ltd
25 Standard Group Ltd
26 TPS Eastern Africa (Serena) Ltd
27 Hutchings Biemer Ltd
28 Uchumi Supermarket Ltd
29 Scangroup Ltd
30 Longhorn Kenya Ltd
E CONSTRUCTION AND ALLIED
31 Athi River Mining
32 Bamburi Cement Ltd
33 Crown Berger Ltd
34 EA Cables Ltd
35 EA Portland Cement Ltd
F ENERGY AND PETROLEUM
36 Kenol-Kobil Ltd
37 Total Kenya Ltd
FIRM AND SECTOR
38 KenGen Ltd
39 Kenya Power amp Lighting Co Ltd
40 Umeme Ltd
G INSURANCE
41 Jubilee Holdings Ltd
42 Pan Africa Insurance Holdings Ltd
43 Kenya Re-Insurance Corporation Ltd
44 Liberty Kenya Holdings Ltd
45 British-American Investments Company ( K) Ltd
46 CIC Insurance Group Ltd
H INVESTMENT
47 Olympia Capital Holdings Ltd
iii
48 Centum Investment Co Ltd
49 Trans-Century Ltd
50 Home Afrika Ltd
51 Kurwitu Ventures
I INVESTMENT SERVICES
52 Nairobi Securities Exchange Ltd
J MANUFACTURING AND ALLIED
53 BOC Kenya Ltd
54 British American Tobacco Kenya Ltd
55 Carbacid Investments Ltd
56 East African Breweries Ltd
57 Mumias Sugar Co Ltd
58 Unga Group Ltd
59 Eveready East Africa Ltd
60 Kenya Orchards Ltd
61 ABaumann CO Ltd
62 Flame Tree Group Holdings Ltd
K TELECOMMUNICATION AND TECHNOLOGY
63 Safaricom Ltd
iv
Appendix II Data Collection Form
Firm X (Indicate Firm name accordingly)
Part A FREE CASH FLOWS
Year
Net
Income
(PAT)
(a)
Depreciation
amp
Amortization
(b)
CAPEX
(crsquo)
Change
in non-
cash
working
capital
(d)
Net
borrowing
(ersquo)
Net
sales
(f)
FCF
= (a +
b ndash c -
d + e)
f
2006
2007
2008
2009
2010
2011
2012
2013
2014
2015
Non-cash working capital includes inventories financial assets held to maturity
receivables and prepayments (current assets) and payables accrued expenses and
current income tax liability (liabilities) For financial and investment firms non-cash
working capital includes prepaid lease rentals intangible assets deferred tax assets
retirement benefit assets and other assets (assets) and taxation payable dividends
payable deferred tax liabilities and retirement benefit liabilities
Net borrowings were determined by comparing current year and previous year long-
term loans
Net sales in case of insurance firms are the equivalent of ldquoNet premium revenuerdquo For
commercial banks it is ldquoTotal operating incomerdquo which is composed of net interest
v
income plus total non-interest income For investment firms it is ldquoIncomerdquo which is
comprised of rental income dividends and interest received and other incomes
PART B FINANCIAL PERFORMANCE
Year Equity Market Value (a) Equity Book Value (b) Tobinrsquos Q = a b
2006
2007
2008
2009
2010
2011
2012
2013
2014
2015
vi
PART C AGENCY COSTS
Year
1 Asset Utilization
Efficiency (AUE)
2 Production Cost Efficiency (PCE)
(a) Net
sales
(b) Total
assets
AUE
= ab
(c) Operating
expenses
(d) Net sales PCE=cd
2006
2007
2008
2009
2010
2011
2012
2013
2014
2015
Net sales in case of insurance firms are the equivalent of ldquoNet premium revenuerdquo For
commercial banks it is ldquoTotal operating incomerdquo which is composed of net interest
income plus total non-interest income For investment firms it is ldquoIncomerdquo which is
comprised of rental income dividends and interest received and other incomes
xii
PART D FIRM CHARACTERISTICS
Firm Size Firm Age
Year (a) Natural Log of Total Assets (b) Natural log of Age (Number of years
since incorporation)
2006
2007
2008
2009
2010
2011
2012
2013
2014
2015
Net sales in case of insurance firms are the equivalent of ldquoNet premium revenuerdquo For
commercial banks it is ldquoTotal operating incomerdquo which is composed of net interest
income plus total non-interest income For investment firms it is ldquoIncomerdquo which is
comprised of rental income dividends and interest received and other incomes

iv
ACKNOWLEDGMENT
Praise be to God almighty who enabled me to go all the way and complete this work I
thank my supervisors Dr Mirie Mwangi Prof James Muranga Njihia and Dr Duncan
Elly Ochieng for their immense support and ensuring that I completed the course I also
thank Prof Erasmus S Kaijage Prof Kibera Dr Iraki Dr Mary Kinoti Dr Iraya and Dr
Josphat Lishenga for their invaluable input My appreciation also goes to Mr Eric Asuma of
the Nairobi Securities Exchange for availing and facilitating data collection Many people
who contributed to the successful completion of this work including Mr Johnstone Lukokolo
Mandila and Ms Miriam V Ongrsquoanyo I say thank you all
v
DEDICATION
I dedicate this work to my dear wife Naomi Khakasa daughter Marion Metah and son
Collins Agala for their encouragement To my dear parents Mr Andrew Mutende and Mrs
Elizabeth Mutende the sacrifice you made for me since 1979 when I joined Kakunga nursery
school to date is immeasurable All my brothers and sisters thank you so much for your
support
vi
TABLE OF CONTENTS
DECLARATION ii
COPYRIGHT copy iii
ACKNOWLEDGMENT iv
DEDICATION v
LIST OF TABLES x
LIST OF FIGURES xi
ABBREVIATIONS AND ACRONYMS xii
ABSTRACT xv
CHAPTER ONE INTRODUCTION 1
11 Background to the Study 1
111 Firm Performance 3
112 Free Cash Flows 6
113 Agency Costs 7
114 Firm Characteristics 9
115 Firms Listed at the Nairobi Securities Exchange 12
12 Research Problem 15
13 Objectives of the Study 19
131 Broad Objective 19
132 Specific Objectives 20
14 Research Hypothesis 20
15 Value of the Study 21
16 Operational Definition of Terms 22
161 Free Cash flows 22
162 Agency Costs 22
163 Firm Characteristics 23
164 Firm Performance 23
17 Organization of the Thesis 24
vii
CHAPTER TWO LITERATURE REVIEW 26
21 Introduction 26
22 Theoretical Foundation of the Study 26
221 Free Cash Flow Hypothesis 27
222 Agency Theory 28
223 Stakeholder Theory 29
224 Stewardship Theory 31
225 The Resource Based View Theory 33
226 Organizational Theory 36
23 Free Cash Flows and Firm Financial Performance 38
24 Free Cash Flows Agency Costs and Firm Financial Performance 40
25 Free Cash Flows Firm Characteristics and Firm Financial Performance 42
26 Free Cash Flows Agency Costs Firm Characteristics and Firm Financial Performance45
27 Summary of Knowledge Gaps 48
28 Conceptual Framework 55
29 Chapter Summary 56
CHAPTER THREE RESEARCH METHODOLOGY 57
31 Introduction 57
32 Research Philosophy 57
33 Research Design 59
34 Population of the Study 59
35 Data Collection 60
36 Reliability and Validity 60
361 Reliability Test 61
362 Validity Test 62
37 Operationalization of the Study Variables 63
viii
38 Data Analysis 66
39 Choice of Panel Data Analysis Model 67
391 Effect of Free Cash Flows on Financial Performance 68
392 Free Cash Flows Agency Costs and Financial Performance 68
393 Free Cash Flows Firm Characteristics and Financial Performance 70
394 Relating all the Variables 71
310 Chapter Summary 74
CHAPTER FOUR DATA ANALYSIS AND FINDINGS 74
41 Introduction 75
42 Pre-estimation Diagnostics 75
421 Normality test 75
422 Reliability Tests 80
423 Test for Linearity 81
424 Bartletts Test for Internal Consistency 82
425 Multicollinearity Test 83
43 Descriptive Statistics 85
44 Chapter Summary 86
CHAPTER FIVE TESTS OF HYPOTHESES AND DISCUSSION 87
51 Introduction 87
52 Correlation Analysis 87
53 Hypotheses Testing Using Regression Analysis 89
531 Free Cash Flows and Financial Performance 90
532 Free Cash Flows Agency Costs and Financial Performance 92
533 Free Cash Flows Firm Characteristics and Financial Performance 97
534 Free Cash Flows Agency Costs Firm Characteristics and Financial Performance
104
54 Discussion 107
ix
541 The Influence of Free Cash Flows on Financial Performance 107
542 The Influence of Agency Costs on the Relationship between Free Cash Flows and
Financial Performance 109
543 The Influence of Firm Characteristics on the Relationship between Free Cash
Flows and Firm Performance 110
544 The Joint Effect of Free Cash Flows Agency Costs and Firm Characteristics on
Financial Performance 112
55 Summary and Presentation of Empirical Models 115
CHAPTER SIX SUMMARY OF FINDINGS CONCLUSIONS AND
RECOMMENDATIONS 117
61 Introduction 117
62 Summary of Findings 118
63 Conclusions 120
64 Contributions of the Study 121
641 Contribution to Theory 121
642 Contribution to Policy 122
643 Contribution to Practice 123
65 Limitations of the Study 124
66 Recommendations of the Study 125
67 Suggestions for Further Research 126
REFERENCES 127
APPENDICES i
Appendix I Firms Listed at the Nairobi Securities Exchange as at December 31 2015 i
Appendix II Data Collection Form iv
x
LIST OF TABLES
Table 21 Summary of Knowledge Gaps 50
Table 31 Operationalization of Study Variables 64
Table 32 A Summary of Statistical Tests of Hypotheses 72
Table 41 Normality Test 76
Table 42 Reliability Scores for Individual Variables 81
Table 43 Test for Linearity 81
Table 44 Bartlettrsquos Test 83
Table 45 Multicollinearity Test 84
Table 46 Descriptive Statistics for Secondary Data ndash 2006 to 2015 85
Table 51 Pearson Product-Moment Correlations among the Dependent Independent
Intervening and Moderating Variables 88
Table 52 Panel Data Results for Free Cash Flows and Financial Performance 90
Table 53 Panel Data Results of Agency Costs as the Dependent Variable and Free Cash flows
as the Independent Variable 93
Table 54 Panel Data Results of Financial Performance as the Dependent Variable while
Agency Costs and Free Cash flows are the Independent Variables 95
Table 55 Panel Data Results for Financial Performance as the Dependent Variable and FCF
and Firm Age as the Predictor Variables 98
Table 56 Panel Data Results for Financial Performance as the Dependent Variable and FCF
and Firm Age as the Predictor Variables Centered Approach 99
Table 57 Panel Data Results for Financial Performance as the Dependent Variable and FCF
and Firm Size as the Predictor Variables 101
Table 58 Panel Data Results for Financial Performance as the Dependent Variable and FCF
and Firm Size as the Predictor Variables Centered Approach 102
Table 59 Panel Data Results for Free Cash Flows Agency Costs Firm Characteristics and
Financial Performance 105
Table 510 Summary of Tests of Hypotheses Results and Conclusions 114
xi
LIST OF FIGURES
ABBREVIATIONS AND ACRONYMS xii
Figure 21 Conceptual Model 55
Figure 31 Path Diagram for Mediation effect of Agency Costs 69
Figure 41 Q-Q Plot for Free cash Flows (2006 ndash 2015)77
Figure 42 Q-Q Plot for Agency Costs (AC) ndash 2006 to 2015 77
Figure 43 Q-Q Plot for Firm Characteristics (Firm Age) ndash 2006 to 2015 78
Figure 44 Q-Q Plot for Firm Characteristics (Firm Size) ndash 2006-2015 79
Figure 45 Q-Q Plot for Firm Financial Performance ndash 2006 to 2015 80
Figure 51 Revised Empirical Model ndash Financial Performance 116
xii
ABBREVIATIONS AND ACRONYMS
AFM Association of Futures Markets
AIMS Alternative Investment Market Segment
ANOVA Analysis of Variance
ASEA African Securities Exchanges Association
BSC Balanced Score Card
CAPEX Capital expenditure
CCP Central Counter Party
CG Corporate Governance
CMA Capital Markets Authority
CSR Corporate Social Responsibility
DA Discretionary accruals
DY Dividend yield
EMIR European Market Infrastructure Regulations
EASEA East African Securities Exchanges Association
FCF Free Cash flows
FISMS Fixed Income Securities Market
FOMS Futures and Options Market Segment
xiii
IAS International Auditing Standards
IDRC The International Development Research Centre
IFRS International Financial Reporting Standards
KMO Kaiser-Meyer-Olkin
MIMS Main Investment Market Segment
NACOSTI National Commission for Science Technology and Innovation
NASI Nairobi Securities Exchange All Share Index
NSE Nairobi Securities Exchange
NPV Net Present Value
OLS Ordinary Least Squares
OTC Over the Counter
PAT Profit after Tax
Q-Q Quantile ndash Quantile
RBV Resource Based View
ROA Return on Assets
ROE Return on Equity
SACCOs Savings and Credit Cooperatives
xiv
SPSS Statistical Package for the Social Sciences
SSE Sustainable Stock Exchanges
RampD Research and Development
TQM Total Quality Management
UK United Kingdom
USA United States of America
VIF Variance Inflation Factor
WFE World Federation of Exchanges
xv
ABSTRACT
Firm performance is affected by various factors both internal and external to the firm
Internal factors include factors such as firm size age liquidity leverage free cash flows
agency costs profitability and growth prospects among others External factors include
regulation and general macro-economic factors This research sought to find out the
influence of agency costs and firm characteristics on the relationship between FCF and
firm performance The first study objective was to establish how FCF influence
performance of NSE listed firms The second objective was to find out how agency costs
influence the relationship between FCF and performance of NSE listed firms Thirdly to
determine how firm characteristics influence the relationship between FCF and
performance of NSE listed firms and lastly to establish the joint effect of FCF agency
costs and firm characteristics on the performance of NSE listed firms The study used
secondary panel data which were obtained from 60 firms listed at the NSE Secondary
data was for the period 2006 to 2015 Multiple and simple regression analyses were
employed Results indicate that FCF have a positive statistically significant effect on
firm performance and also agency costs have a statistically significant positive
intervening effect on the relationship between FCF and firm performance Additionally
firm characteristics have a positive moderating effect on the correlation between FCF and
financial performance Finally FCF agency costs and firm characteristics have a positive
statistically significant joint effect on firm performance These findings are inconsistent
with the agency theory and the FCF hypothesis Conversely the findings seem to support
the stewardship theory The study therefore recommends that firm managers
shareholders practitioners the government and other regulators should enhance firm
monitoring because the benefits derived from investing therein seem to outweigh the
costs Further research needs to be conducted using longitudinal study design and also by
integrating the views of other practitioners in data collection rather than focusing on firm
managers only
1
CHAPTER ONE INTRODUCTION
11 Background to the Study
The separation of firm proprietorship and management in public firms causes conflict of
interest between firm owners (principals) and firm managers (agents) While the primary
incentive of firm owners is to maximize their wealth by improving firm value the goals
of firm managers are varied and may include enrichment of personal wealth and status
This varying of interests sometimes leads managers to engage in insider dealings where
there are no mechanisms for effective monitoring validation and approving of
managerial decisions (Wang 2010)
Jensen and Meckling (1976) argue that managers opt to extract personal gain from the
firms if they do not hold shares in those firms This has the effect of raising agency costs
which are manifested through investment choices that are not efficient and or managers
not providing sufficient or efficient effort Rising agency costs may eventually affect firm
performance (Tirole 1986) Brush Bromiley and Hendrickx (2000) also hypothesize that
managerrsquos personal-interest encourages wastage and wastefulness when free cash flows
(FCF) are present which similarly could increase agency costs and eventually affect firm
performance Firm characteristics such as profitability firm size liquidity leverage sales
growth age of the firm board structure and composition asset growth turnover
dividend payout and growth prospects are argued to have an influence on the correlation
between FCF and firm performance (Subrahmanyam amp Titman 2001 Kogan amp Tian
2012 and Mukras amp Nzioka 2015)
2
Brush et al (2000) observe that agency theory examines how the behavior of managers
could be focused towards shareholdersrsquo interests to minimize agency costs Jensen and
Meckling (1976) and Jensen (1986) describe three kinds of agency costs First the
monitoring cost of managersrsquo decisions second the bonding cost of restricting
covenants and lastly residual loss due to suboptimal managerial actions The goal of
managers is to enhance personal wealth to the detriment of shareholders The FCF
hypothesis posits that this personal-interest encourages wastage when FCF are present
The stewardship theory is in direct contrast to the agency theory It views managers as
stewards who guard and enhance the wealth of shareholders since by so doing utility
functions of the managers are enhanced (Davis Donaldson amp Schoorman 1997)
Stakeholder theory on the other hand views managers and shareholders among others as
stakeholders and can therefore influence or be influenced by the attainment of the goals
and objectives of the firm (Donaldson amp Preston 1995) The resource based view (RBV)
theory contends that financial firm performance is influenced by firm specific
characteristics (Pierce amp Robinson 2011) Organizational theory on the other hand
attempts to describe the effect of size and firm age on firm performance (Kaen amp
Baumann 2003)
Nyongrsquoo (2000) observes that Kenya has had challenges with regard to the agency
problem and corporate governance (CG) in general The result of these challenges has
been generally low firm profits Ongore and KrsquoObonyo (2011) also note that agency
problems were equally experienced across the globe Several cases of firm failures are an
3
indictment of the efficiency and effectiveness of the current CG structures which fail to
deter FCF related agency costs This research centered on the FCF hypothesis and
agency theory seeks to discover the way agency costs and specified firm characteristics
influence the correlation between FCF and the performance of Nairobi Securities
Exchange (NSE) listed firms Ayako Kungu and Githui (2015) observe that whereas
most NSE listed firms record good performance there are others that have presented
declining performance and yet others have even been delisted from the bourse during the
period between 2003 and 2014 Ongore and Krsquo Obonyo (2011) and Njuguna and
Moronge (2013) have attributed the decline during the period to the agency problem
111 Firm Performance
Gleason and Barnum (1982) define firm performance as a firmrsquos ability to achieve
planned outcomes as measured against projected outputs It encompasses outcomes
associated with shareholder return market performance and financial performance On
the other hand Daft (1995) defines firm performance as the ability to achieve objectives
by expending resources effectively and efficiently Firm performance may also be viewed
as incorporating specifically three areas of organizational outcomes shareholder return
financial return and market performance each with its specific indicators (Richard
Divinney Yip amp Johnson 1999)
Performance is an important concept that is at the centre of a firm and its measurement is
critical in determining whether the firm is achieving the desired objectives Market
performance is measured by assessing customer satisfaction customer retention value
4
delivered to customers and market share While the importance of firm performance is
broadly acknowledged debate on the bases for performance measurement still abound
Researchers should also use operational indicators in addition to using financial
indicators These may include product quality introduction of new products marketing
effectiveness and manufacturing value-addition which may replicate the firmrsquos
competitive position in its industry space and might influence financial performance In
operationalization of firm performance the use of multiple indicator approach would be
superior to the use of only a single indicator (Venkataram amp Ramanujan 1986)
Neely (1998) defined performance measurement systems as comprising of three
interrelated components specific measures that quantify the effectiveness and efficiency
of activities a set of measures that jointly evaluate firm performance as a whole and a
supportive structure that allows data to be collected organized examined deduced and
disseminated Performance measurement is therefore multidimensional On the other
hand Bourne Neely Mills and Platts (2003) describe it as the practice of measuring
effectiveness and the efficiency of an action Efficiency is a measure of how cost-
effective the resources of the firm are used when providing the specified customer service
while effectiveness is the extent to which customer needs are met
The Balanced Score Card (BSC) was developed by Kaplan and Norton (2001) and it
measures customer satisfaction financial performance growth perspectives learning and
of performance and efficiency of internal business processes The sustainable BSC has
been applied to integrate the social and environmental aspects into effective application
5
of both conventional firm strategy and explicit firm sustainability strategies (Figge Hanh
Schaltegger amp Wagner 2002)
The triple bottom line performance measurement integrates the corporate economic
environmental and social performance (Norman amp MacDonald 2004) while the
International Development Research Centre (IDRC) model conceives firm performance
in three general areas First is performance in actions that support the operation
(effectiveness) second is performance related to the available resources (efficiency) and
lastly performance is related to long-term capability or continuing relevance (Lusthaus
Anderson amp Murphy 1995) Other performance measurement techniques include the
Performance Prism and the Cambridge Performance Measurement Process (Neely
Adams amp Kennerley 2002)
Dyer and Reeves (1995) observe that there are no performance measures universally
appropriate and multiple measures should therefore be used Wang (2010) and Ongore
and KrsquoObonyo (2011) use ROA ROE and Dividend Yield (DY) to measure financial
performance Szewczyk Tsetsekos and Zantout (1996) and Mojtahedzadeh and
Nahavandi (2009) have used Tobinrsquos Q as a market-based measure of a firmrsquos financial
performance Tobinrsquos Q relates the market value of firmsrsquo equity with their
corresponding book values Employee job satisfaction employee turnover organizational
effectiveness and efficiency have been proposed by Gleason and Barnum (1982) as non-
financial measures of firm performance Hubbard (1998) observes a positive significant
6
correlation between FCF and performance which is manifested through prudent
investment
112 Free Cash Flows
The concept of FCF presented by Jensen (1986) refers to surplus cash available after
financing profitable ventures FCF are therefore described as net operating income minus
capital expenditure (CAPEX) minus cost of inventory and paid out dividends On the
other hand Brealey Myers and Allen (2005) describe FCF as net income profit after tax
(PAT) plus amortization and depreciation minus CAPEX minus changes in non-cash
working-capital add net borrowingsloans Richardson (2006) argues that firms which
have surplus funds risk wasting it in ventures that are not profitable and that because
FCF are financial resources at the managersrsquo discretion to apportion they are also
referred to as idle cash flows
FCF denotes funds that a firm is able to generate after setting aside cash needed to sustain
or increase its assets FCF are important because they allow firms to pursue investments
that could improve value to shareholders In the absence of funds it is hard to create new
products and services acquire new projects pay out dividends and pay debts Some
shareholders believe that FCF show a better perspective of the firmrsquos ability to create
profits because while earnings can often be misrepresented through accounting
gimmicks it is more difficult to fake FCF Positive FCF indicate that the firm is
generating more funds than are being used to run the firm and to reinvest Many small
firms do not have positive FCF because they invest heavily to grow their operations It is
7
worth-noting that generally negative FCF detrimental to the firm Negative FCF could
be an indication that the firm is engaged in huge investment projects If high returns are
earned from these investments then there is a long run potential payoff (Chen Sun amp Xu
2016)
Jensen (1986) argues that managersrsquo personal - interest motive leads to waste and
inefficiency when FCF are present because the objective of the managers is to increase
their personal wealth instead of shareholdersrsquo wealth Therefore when FCF are present
the result is internal inefficiency and wastage of firm resources which leads to increased
agency costs and lower firm performance Similarly Wang (2010) observes that in the
presence of surplus FCF managers tend to abuse the FCF resulting in inefficient resource
allocation and wrongful investment
113 Agency Costs
Agency costs refer to the cost that a firm incurs due to incongruent interests of firmsrsquo
management and shareholders (Berle amp Means 1932) Jensen and Meckling (1976) point
out that the incomplete manager and shareholder contractual relationship can result into
the agency problem The agency problem that is caused by the firm managers would
result in a loss to the wealth of shareholders in the following ways first managers from
the characteristic of personal-interest drive would raise perquisite consumption and
shirking behavior that in turn leads to increased agency costs Secondly managers might
fail to choose the highest Net Present Value (NPV) project and instead choose that which
maximizes their own personal interest thereby exposing shareholders to unnecessary
investment risk
8
Jensen (1986) claims that there are three kinds of agency costs the monitoring cost of
managersrsquo decisions the bonding cost of restricting agreementcontracts and the residual
loss due to suboptimal managersrsquo actions Monitoring costs are manifested once the
shareholders try to regulate or control the managersrsquo actions For example the auditors
are engaged by a firm on shareholdersrsquo behalf to check and control the managersrsquo
activities to confirm conduct that increases value for the shareholders The pricecost of
engaging the auditors is therefore considered an agency cost The bonding cost entails
bond covenants or contracts A bond covenant is an agreement that restricts the firm from
venturing in specified actions such as a limitation on dividend payment Firm claims
could be structured in a way that controls shareholdersrsquo motive to follow a strategy that
does not increase the total firm value This inherent cost is an agency cost And lastly
residual loss is the cost sustained from conflicting shareholder and manager interests
notwithstanding the use of monitoring and bonding (Smith amp Warner 1979)
Brush et al (2000) argue that once a firm has generated excess FCF management tends
to misuse the FCF resulting in increased agency costs which could eventually lower
firm performance Khidmat and Rehman (2014) on the other hand observe that agency
costs of monitoring could increase as a result of increased FCF and consequently improve
firm performance This is because the firm is able to invest in better CG mechanisms
which improve monitoring managerial decisions and hence reduced wastage Agency
costs are therefore expected to mediate the correlation between FCF and firm
performance because they are intermediate output of FCF Wang (2010) states seven
proxy agency cost measures earnings volatility total asset turnover floatation costs
9
advertising research and development (RampD) expenses to sales ratio operating expenses
to sales ratio free cash flows and administrative expenses to sales ratio
Tirole (1986) argues that there are two main ways through which agency costs are
manifested the first one is inefficient choice of investment and the second is insufficient
or inefficient effort spent by managers Therefore agency cost measures should be
contingent on inefficient asset utilization (due to poor investment choices) excessive cost
of production and extravagant perks for managers (which results in unnecessarily high
expenditure) and inefficient effort spent by managers (the results of which is lower
revenue and profitability) Asset utilization efficiency is measured by assets turnover
ratio which is described as the ratio of sales to assets It indicates the way managers use
the assets under their control in generating revenue Production cost efficiency on the
other hand is measured as operating expenses divided by sales Singh and Davidson
(2003) observe that a high level of operating expense is a close estimate of managersrsquo pay
and perquisites in terms of high salaries executive and lavish offices and other corporate
support amenities To a large extent these costs reflect discretionary expenditure at the
disposal of firm managers
114 Firm Characteristics
Zou and Stan (1998) define firm characteristics as a firmrsquos managerial and demographic
variables that in turn encompass part of the firmrsquos internal environment Firm
characteristics have been listed by Kogan and Tian (2012) to include firm size leverage
liquidity sales growth asset growth and turnover Others include ownership structure
board characteristics age of the firm dividend pay-out profitability access to capital
10
markets and growth opportunities (Subrahmanyam amp Titman 2001 and McKnight amp
Weir 2008)
Vogt (1997) argues that the more a firm has FCF the more it engages into capital
investment and hence the higher the performance Smaller firms gear towards rampant
growth thereby utilizing most or all the available FCF in a bid to better firm
performance The relationship between FCF and investment is stronger in small and
medium firms which generally are in the growth stage Adelegan (2009) on the other
hand notes that the influence of firm size is neutral and that firms that are older incline
more on internally generated funds to finance their business investments than small and
medium firms
Cline Williamson and Yore (2014) observe that the FCF problem seems to be intense in
medium and large multinationals that are less reliant on the capital market The smaller
firms that fund their investments with funds that are generated externally do not
experience such declines in wealth This is because firms that are larger have
considerably more FCF that are available and are subsequently less dependent on the
external market When high FCF are available the unconstrained manager may
socialistically fund investment projects that have a negative NPV Increased levels of
FCF lead to sub-optimal allocation of resources in form of value-destroying and cross-
subsidizing investment action that eventually deteriorates firm performance
Firm age and performance relationship is to a large extent driven by selection and
learning effects in the early stages of the firmrsquos life Once a firm is older the relationship
11
could be more indirect due to a correlation between age of the firm and ownership
changes product life cycle size of the firm and management Usually firms that are new
require time to adapt to the environment A new firm needs to catch up with an older firm
when the new firmrsquos performance is lower than that of the older (existing) firm so as to
be competitive in the market Therefore it is expected that firms that are new will show
higher growth rates in productivity than the older firms as a result of high FCF Hence
age of the firm is negatively correlated with productivity growth rate because older firms
have lower FCF (Brouwe Kok amp Fris 2005)
Similarly Cadogan and Diamantopoulos (1995) note that as firms become older and
more experienced they tend to be more bureaucratic and inflexible Demsetz and Lehn
(1985) denote firm size as the log of total assets and argue that in smaller firms agency
costs related to the FCF problem may be relatively lower than in larger firms because of
more growth opportunities available for smaller firms Larger firms tend to overinvest
thereby generating a relatively lower return on assets (ROA)return on equity (ROE)
Opler and Titman (1993) maintain that more likely firms that have high growth
prospects are managed better than those with less growth prospects Such firms are also
less likely to have surplus FCF since any available cash would be spent on projects that
have positive NPV Thakor (2013) further argues that foreign cash in firms that have
good growth opportunities should be valued significantly higher than foreign cash in
firms that have poor growth prospects since firms that have poor growth prospects are
more likely to be adversely affected by the repatriation tax burden and FCF problems
12
stemming from a relatively low shadow price of cash This further implies that foreign
cash for firms that have poor investment prospects ought to be valued at a discount while
foreign cash for firms that have good investment prospects should be valued at a
premium
Heydari Mirzaeifar Javadghayedi and Student (2014) postulate that firm characteristics
can expose a firm to more managerial costs and thus decrease the expected positive effect
of FCF on firm performance Firm characteristics are therefore expected to moderate the
correlation between FCF and firm performance because their interaction affects the
strength and or direction of the correlation between the dependent and independent
variables (Baron amp Kenny 1986) This study focused on firm characteristics of firm size
and age of the firm because their influence on the correlation between FCF and firm
performance seem to be more significant (Demsetz amp Lehn 1985 and Mule Mukras amp
Nzioka 2015)
115 Firms Listed at the Nairobi Securities Exchange
NSE is the primary stock market in Kenya Apart from equities the NSE deals with the
issue and trade of debt instruments NSE is a member of East African Securities
Exchanges Association (EASEA) and the African Securities Exchanges Association
(ASEA) and also an associate member of World Federation of Exchanges (WFE) a
subordinate member of the Association of Futures Markets (AFM) Additionally the
NSE is a partner Exchange in the United Nations Sustainable Stock Exchanges Initiative
(SSE) The NSE is a market for securities approved and controlled by the Capital
13
Markets Authority (CMA) and has 63 listed firms (Appendix I) Introduced in 2008 the
NSE All Share Index (NASI) is a general indicator of market performance The NASI
integrates all the daily transacted shares therefore giving the general outline of the value
of the market as opposed to the activities of selected securitiesrsquo prices The daily trading
volume of the market is valued at over US $5000000 and a total market capitalization
estimate of US $15000000000 Corporate bonds government bonds and equities are
also traded at the NSE (NSE 2015)
Odundo (2009) notes that as part of the NSE market transformation program the CMA
introduced market improvements in 2001 which led to the restructuring of the NSE into
four separate segments The Alternative Investments Market Segment (AIMS) Main
Investments Market Segment (MIMS) Fixed Income Securities Market Segment
(FISMS) and the Futures and Options Market Segment (FOMS) Development of the
capital market has remained Kenyarsquos strategic development goal since the mid-1980s
The government has realized significant reforms over the last three decades to underpin
the countryrsquos development prospects including modernization of the NSE which includes
computerization of trading divergence of listed securities and stocks dematerialization
and improvement of regulatory and supervisory structures The NSE is among the fastest
growing stock exchanges in the developing markets and is the largest in East Africa
(Ayako et al 2015)
The NSE (2015) indicates that Kenyarsquos capital market has continued to develop The
NSE signed up six clearing members as the exchange readied itself to introduce a
14
derivatives market These clearing members include Cooperative bank of Kenya
Barclays bank of Kenya NIC bank CBA and CFC Stanbic bank Other banks are slated
to sign up and the clearing members would by executing the principal role of clearing
and settling deals strengthen the NSErsquos abilities to begin derivatives trading The
derivatives mechanisms will primarily comprise currency futures and stock indices and
will work to expand liquidity in the market increasing the boursersquos product offer The
NSErsquos derivative market which received authorization from CMA will permit
derivatives that are exchange traded and created on various underlying financial
instruments that will include equities and currencies
The universal world norm has been a system of central counterparty (CCP) clearing and
reporting represented by the European Market Infrastructure Regulationsrsquo (EMIR) latest
rules Further to demanding central clearing of standardized Over-the-Counter (OTC)
derivatives that wasnrsquot the practice earlier EMIR presented other numerous processes to
minimize counterparty risk a significant matter which led to contagion in the recent
global financial crisis The NSE derivatives contracts will be exchange traded and
therefore clearing members will be critical components of the CCP clearing network
(NSE 2015) The CMA (2010) shows that as of 2008 the most actively traded market in
Africa was South Africa recording over 70 percent of the whole African securities
markets revenue making it the most liquid securities market in Africa with the NSE
ranking 5th
with 02 per cent contribution
15
The NSE listed firms were selected for this study because data is readily available and
also the data is generally deemed credible Ponnu and Okoth (2009) observe that several
challenges ranging from boardroom wrangles poor decision making lack of oversight to
control by various boards of directors and unethical practices have been evident among
the listed firms resulting in a trend of poor performance Similarly NSE (2015) shows
that several listed firms have previously been delisted liquidated or placed under
receivership on account of the agency problem
12 Research Problem
The FCF hypothesis suggested by Jensen (1986) states that firm managers may invest in
needless negative NPV projects when there is surplus FCF at their disposal The
hypothesis suggests that greater levels of FCF could lead to more unnecessary
administrative waste and inefficiency negatively impacting on firm performance
Demsetz and Lehn (1985) find that in the presence of substantial FCF large firms tend to
have fewer growth opportunities than smaller ones which could lead to an
overinvestment problem thereby negatively impacting on firm performance Similarly
Gul and Tsui (1998) note that an escalation in financial leverage seems to diminish
agency costs because managers are subject to legal bonding of repaying interest and debt
that subsequently decreases misuse of FCF and therefore improves firm performance
The agency problem accounting anomalies and other governance manipulations is a
worldwide phenomenon affecting many firms including Enron Corporation of the United
States of America (USA) and China Aviation (Ongore amp KrsquoObonyo 2011) The World
16
Bank (2000) indicates that the failure of major conglomerates such as the Bank of Credit
and Commerce International and WorldCom in the USA and United Kingdom (UK)
respectively has inspired interest in the agency problem and governance The economic
crisis in Asia has also contributed to the rising profile of the agency problem In the East
African region the agency problem and governance have been discussed in the
framework of state-run companies where corruption malpractice and subsidization of
deteriorating firms by the government have been the major issues of concerns The
Kenyan context has been characterized by appeals for active CG particularly for public
firms (Okiro 2014) The recent financial problems facing Fidelity commercial bank
Charterhouse bank Imperial bank and Chase bank could be related to the agency problem
between shareholders and firm managers (Central Bank of Kenya 2016)
Frentrop (2003) has recounted that there is still lack of consensus on identifying the
extent and dealing with the complications that are intrinsic in CG processes Waithaka
Ngugi Aiyabei Itunga and Kirago (2012) observe that FCF have caused conflict between
firm managers and shareholders which in turn have affected performance of NSE listed
firms Similarly Ongore and KrsquoObonyo (2011) noted existence of agency problems
among firms listed at the NSE which negatively affected their performance These
observations are consistent with Nyongrsquoo (2000) who posits that the low firm
performance across the Kenyan economy is primarily due to agency problems and bad
CG practices
17
Globally empirical literature shows mixed findings regarding FCF and firm performance
For instance Nekhili Amar Chtioui and Lakhal (2014) carried out a study in Australia
and found increased agency costs emanating from the presence of FCF Similarly Brush
et al (2000) conducted a study in the USA and found that weak CG caused inefficiency
in the allocation of FCF While these findings support the argument that FCF negatively
affects firm performance on the contrary Gregory (2005) whose study was carried out
in the UK established that the mergers with higher FCF were performing better than
mergers with lower FCF In addition a study by Szewcyzk et al (1996) in the USA
found that shareholders favored firms that had both significant FCF and investment
opportunities that were profitable Locally Wambua (2013) found a positive correlation
between FCF and performance of NSE listed firms which again invalidates the
hypothesis which states that there is a negative correlation between FCF and performance
of the firm Conversely Njuguna and Moronge (2013) found that agency conflicts within
firms listed at the NSE are related to FCF which negatively affects firm performance
Regarding the moderating effect of firm characteristics Hendricks and Singhal (2001)
found that smaller firms tend to have better performance in terms of higher sales growth
Similarly Kinoti (2012) found a statistically positive moderating effect of firm
characteristics (ownership age of the firm firm size and type of industry) on the
correlation between corporate image and performance of the firm Conversely Njeru
(2013) found that firm characteristics did not have a statistically significant moderating
effect on the correlation between market orientation and performance In view of these
18
contradicting results it was necessary to further investigate the moderating influence of
firm characteristics on the correlation between FCF and performance of the firm
Some prior studies portray or tend to equate FCF to agency costs For instance Jensen
(1986) presents his study as ldquoagency costs of FCF corporate finance and takeoversrdquo
while Lin and Lin (2014) describe their study as ldquoagency costs of FCF and biddersrsquo long-
run takeover performancerdquo Furthermore Wang (2010) mentions seven proxy measures
of agency costs and one of the proxy measures equates FCF to agency costs These
studies do not give a clear distinction between agency costs and FCF This study has
attempted to delineate FCF from agency costs and has also attempted to provide linkages
between all the study variables
Wang (2010) and Lin and Lin (2014) excluded CAPEX and net borrowings in their
operationalization of FCF This study included both CAPEX and net borrowings in the
definition of FCF Additionally unlike Njuguna and Moronge (2013) who used asset
utilization efficiency as the sole measure of agency costs this study also incorporated
production cost efficiency to measure agency costs that arise out of monitoring
managementrsquos actions These measures of FCF and agency costs are more robust
Furthermore some of the prior studies are bivariate For instance Njuguna and Moronge
(2013) and Wambua (2013) focused on the influence of agency costs on firm
performance In this study a multivariate analysis was employed where the joint effects
of FCF agency costs firm characteristics and firm performance were all incorporated
While many of the studies were carried out in developed economies such as Australia
19
France UK and the USA this study focused on firms listed at the NSE employing cross-
sectional and panel data research designs
In summary this study sought to fill the identified knowledge gaps which constitute the
research problem as follows first global empirical study findings are mixed and non-
conclusive This study therefore focused on firms listed at the NSE and used panel data
design Secondly the study sought to delineate FCF from agency costs Third the study
incorporated the major firm characteristics of firm size and age Fourth CAPEX and net
borrowings were incorporated in defining FCF Fifth two measures of agency costs were
incorporated and these are asset utilization efficiency and production cost efficiency
Lastly a multivariate study was adopted as opposed to bivariate This research was
guided by the following study question How significant is the influence of agency costs
and firm characteristics on the relationship between FCF and financial performance of
firms listed at the NSE
13 Objectives of the Study
The broad objectives and specific objectives of the study are here-below stated
131 Broad Objective
The broad objective of this research was to determine the effect of agency costs and firm
characteristics on the relationship between FCF and financial performance of firms listed
at the Nairobi Securities Exchange Kenya
20
132 Specific Objectives
i Establish the relationship between free cash flows and financial performance of
firms listed at the Nairobi Securities Exchange
ii Assess the influence of agency costs on the relationship between free cash flows
and financial performance of firms listed at the Nairobi Securities Exchange
iii Determine the influence of firm characteristics on the relationship between free
cash flows and financial performance of firms listed at the Nairobi Securities
Exchange
iv Establish the joint effect of free cash flows agency costs and firm characteristics
on financial performance of firms listed at the Nairobi Securities Exchange
14 Research Hypothesis
H1 Free cash flows have no significant effect on the financial performance of firms listed
at the Nairobi Securities Exchange
H2 Agency costs have no significant intervening effect on the relationship between free
cash flows and financial performance of firms listed at the Nairobi Securities Exchange
H3 Firm characteristics have no significant moderating effect on the relationship
between free cash flows and financial performance of firms listed at the Nairobi
Securities Exchange
H3a Firm age has no significant moderating effect on the relationship between
FCF and financial performance of firms listed at the NSE
21
H3b Firm size has no significant moderating effect on the relationship between
FCF and financial performance of firms listed at the NSE
H4 There is no joint effect of free cash flows agency costs and firm characteristics on
financial performance of firms listed at the Nairobi Securities Exchange
15 Value of the Study
This study was intended to provide insights into knowledge about how agency costs and
firm characteristics influence the relationship between FCF and the financial performance
of NSE listed firms This research examined the validity of the FCF hypothesis agency
theory stakeholder theory stewardship theory RBV theory and the organizational theory
and established linkages between these theories thereby interrogating existing
knowledge to affirm modify or reject it The research community in finance will benefit
from the study because it is intended to aggregate and provide important quantitative
literature that will bridge the existing knowledge gap regarding FCF agency costs firm
characteristics and financial performance of firms listed at the NSE It will also serve as
a foundation upon which more empirical studies will be built hence propagating
knowledge
This study sought to establish the correlation between FCF agency costs firm
characteristics and firm performance Investors firm managers and other practitioners
will benefit from the study because it delineates FCF from agency costs and also brings
out the linkages between FCF agency costs firm characteristics and firm performance
Firm managers are expected to act more prudently and efficiently in their pursuit of
maximizing shareholdersrsquo wealth through better firm performance Investors and other
22
practitioners will build on the understanding of the linkages between these variables to
help improve firm performance
The NSE and the listed firms have high growth potential given the various initiatives
being undertaken at the bourse such as demutualization restructuring and introduction of
derivatives trading The government NSE and CMA stand to benefit from this study
because the insights and intuitions gained from the study will help in the development
and improvement of existing policies guidelines and regulation
16 Operational Definition of Terms
The key study variables have been defined as follows
161 Free Cash flows
The term free cash flows refers to the sum of surplus funds available after funding
profitable projects This is described as net income plus depreciation and amortization
less capital expenditure less change in non-cash working capital plus net borrowing
(Brealey Myers amp Allen 2005)
162 Agency Costs
Agency costs refer to the cost that a firm incurs due to inconsistent interests of
management and shareholders (Berle amp Means 1932)
23
163 Firm Characteristics
Firm characteristics refer to a firmrsquos demographic and managerial variables which in turn
comprise part of the firmrsquos internal environment Firm characteristics include firm size
leverage liquidity sales growth asset growth and turnover age of the firm dividend
pay-out profitability access to capital markets and growth opportunities (Zou amp Stan
1998 Kogan amp Tian 2012 Subrahmanyam amp Titman 2001 and McKnight amp Weir
2008) This study focused on firm size and age of the firm
164 Firm Performance
In this research the term firm performance is used interchangeably with organizational or
corporate performance Firm performance refers to an assessment of an organization in
terms of its ability to achieve its stated objectives over a given period of time Firm
performance is broad and has to be studied with reference to its indicators A firm that is
able to meet its objectives is considered to be successful (Sagwa 2014) For this study
firm performance was measured in terms of financial performance
Financial performance perspective may be measured using Tobinsrsquo Q ROA ROE DY
sales growth rate market share productivity and profitability among others This study
used Tobinrsquos Q to measure financial performance Tobinrsquos Q compares the market value
of a firmrsquos equity with its corresponding book values
24
17 Organization of the Thesis
This thesis contains six chapters The first chapter has the introduction and background to
the study The NSE has also been discussed the research problem research objectives
value of the study scope and how the study is organized In chapter two the theoretical
framework on which the study is based has been discussed
The chapter reviews the theoretical and empirical literature relating to the linkages among
the study variables The theories reviewed are The free cash flow hypothesis agency
theory stakeholder theory stewardship theory RBV theory and the organizational
theory
Empirical literature has focused on the relationships among the variables as follows FCF
and firm performance FCF agency costs and firm performance FCF firm
characteristics and firm performance FCF agency costs firm characteristics and firm
performance A summary of knowledge gaps has been presented and finally the chapter
ends with the conceptual framework that guides the study and the conceptual hypotheses
Chapter three has identified and discussed the philosophical orientation the study design
and population of the study
Additionally it has highlighted data collection methods reliability and validity
considerations operationalization of the study variables and analytical data models
Chapter four presents the findings of the general data analysis starting with test of
25
validity and reliability then the descriptive statistics including frequency tables
percentages standard deviations means and Cronbachrsquos Alpha Coefficient of reliability
A presentation of the results of the test of hypotheses and interpretation has been featured
under chapter five The chapter has concluded by a discussion of the resultsfindings
Chapter six gives a summary of the findings conclusion study implications limitations
and recommendations for further studies
26
CHAPTER TWO LITERATURE REVIEW
21 Introduction
The chapter has explored the theoretical foundations of the study Empirical literature has
also been discussed under four sections as follows First FCF and financial performance
second FCF agency costs and financial performance third FCF firm characteristics
and financial performance and lastly FCF agency costs firm characteristics and
financial performance
This chapter also gives a summary of knowledge gaps a graphical framework of the
study variables (FCF agency costs firm characteristics and financial performance)
depicting the researcherrsquos conceptualization of the study It then concludes with the
conceptual hypotheses
22 Theoretical Foundation of the Study
The theoretical framework upon which this study is based is varied Six theories have
been discussed and these are FCF hypothesis agency theory stakeholder theory
stewardship theory RBV theory and the organization theory The research sought to
establish the influence of agency costs and firm characteristics on the correlation between
FCF and performance of NSE listed firms
Although the agency theory stakeholder theory stewardship theory RBV theory and the
organization theory contribute heavily in attempting to explain the interaction between
27
the identified variables and their combined effect on firm performance the FCF
hypothesis is the overarching theory on which this study is founded
221 Free Cash Flow Hypothesis
The notion of FCF was initially suggested by Jensen (1986) where FCF was described as
net cash flow after subtracting all the needs of positive NPV ventures Jensen (1986)
submits that when there are surplus FCF the severity of the agency conflict between firm
shareholders and firm managers is higher The reason for the conflict is that when there is
excess cash in the firm there is no need for the management to raise cash from the capital
market This gives firm management the freedom to spend invest without being
monitored by capital providers as would have been the case if such funds were raised
from the capital market Shareholders would rather have such excess funds distributed
back to them through share repurchase programs or as dividends if the growth
opportunities for the firms are limited and the funds could not be prudently invested
elsewhere Management on the other hand would waste the surplus funds in unprofitable
investments administrative waste and managerial perks
FCF hypothesis postulates that when firms have made significant FCF and the firms do
not have gainful investment projects available firm managers tend to misuse the FCF
which consequently raises agency costs Critics of the FCF hypothesis claim that it
nurtures short termism by discouraging investment that would bring profit in the long-
run This study is related to the FCF hypothesis because based on the observation by
Brush et al (2000) managersrsquo personal-interest inspires wastefulness and ineffectiveness
28
when there is surplus FCF This study sought to establish the influence of agency costs
and firm characteristics on the relationship between FCF and firm performance In this
study therefore it was expected that FCF would have a negative effect on firm
performance
222 Agency Theory
The agency theory was advanced by Jensen and Meckling (1976) and it avows that
shareholders who are the owners (principals) of the firm hire firm managers (agents)
The principal expects the agent to make decisions and act in the ownerrsquos principalrsquos best
interest The managers agents may however have self-interests that conflict with the
interests of the principals Brush et al (2000) observe that agency theory is founded on
the principle that the objective of the management is to achieve their individual interests
instead of shareholdersrsquo interests and that managersrsquo personal-interest encourages waste
and ineffectiveness when there are surplus FCF
Agency theory suggests mechanisms that aim to resolve the shareholder interests and
those of the management The mechanisms include external control measures like
takeovers (Easterwood 1997) The potential for conflict between shareholders and
managers may also be minimized by the use of internal control measures like non-
executive directorsrsquo monitoring and executive share ownership incentives The advocates
of agency theory postulate that control measures are mandatory for directing dishonest
managerial actions Critics on the other hand argue that control creates stronger personal
behavior lessens proactive organizational actions and honesty and lastly results in
suspicion (Jensen amp Meckling 1976)
29
Divergences in goals and attitude towards risk and decentralization in information are
tenets of the agency theory If the information asymmetry and conflict of interestsrsquo
assumptions and are allayed the agency problem then becomes inconsequential and not
of any interest scientifically If there were no information asymmetry the principal would
simply direct and control the agentrsquos actions and appropriately reward the agent If the
principal and the agent have consistent interests then the agentrsquos incentives are clear
(Podrug 2010)
A critique of the agency approach is that the analytical focus on how to resolve conflict
between the various stakeholders in the firm is too narrow and the shareholders are not
the only ones who make investment in the firm (Donaldson 1990) Additionally Hill
(1990) has argued that even in situations of very specific assets where the possibility of
unscrupulousness is very high there are people who will give precedence to collaboration
and trust and will not initiate opportunistic behavior Just like the FCF hypothesis this
research is related to the agency theory because it is centered on conflict of interests
between firm managers and shareholders One of the objectives of this study is to
determine the influence of agency costs on the relationship between FCF and firm
performance It was expected that the higher the agency costs the higher the effect on the
relationship between FCF and firm performance
223 Stakeholder Theory
Developed by Freeman (1984) stakeholder theory combines business accountability to a
wide collection of stakeholders The theory advances that the management of firms has a
30
network of relationships to serve in its stakeholdersrsquo circle in its achievement of
corporate goals The theory develops the understanding of corporate accountability to
include a broad collection of stakeholders such as customers suppliers business
associates employees government and its agencies financial institutions among others
A stakeholder is defined as any person or group which can influence or is influenced by
the attainment of the personrsquos or grouprsquos objectives
Mitchell Agle and Wood (1997) maintain that a stakeholder may be recognized by
looking at either one or two or all the associative aspects namely first the clout to impact
the firm secondly the legality of affiliation in or with the firm and lastly the
earnestness of their entitlement in or on the firm Unlike agency theory in which the
management work and serve the shareholders stakeholder theorists propose that firm
management has a relationships network for service and these include employees
business partners and suppliers Stakeholder theory attempts to address the collection of
stakeholders eligible and demanding managersrsquo attention (Sundaram amp Inkpen 2004)
Donaldson and Preston (1995) have argued that all stakeholders participating externally
or internally in the firm have an interest to fulfill This includes the characteristics and
behavior of firms incorporating how the firm is run how the board of directors thinks
about firm units the way management think about organization and the nature of the firm
itself In this regard the firm should strive to satisfy not only the welfare of its
shareholders but also the welfare of other relevant stakeholders Hence the board should
ensure that the firm acts on opportunities that enhance value to all the relevant
31
stakeholders and also prevent bad management practices that may expose the firm to
scandals or risk financial distress To achieve these the board should consist of more
members with diverse competencies experience as well as capabilities that will
effectively discharge its governance function
The stakeholdersrsquo model has been criticized by Donaldson and Preston (1995) arguing
that managers may use ldquostakeholderrdquo reasons to justify poor performance Mansell (2013)
has also critiqued the stakeholder theory stating that by using the political notion of a
lsquosocial contractrsquo to the firm stakeholdersrsquo theory weakens the values upon which a
market economy is founded The stakeholder theory is relevant to this study to the extent
that shareholders and firm managers are considered as lsquostakeholdersrsquo and therefore can
influence or are influenced by the accomplishment of the organizationrsquos goals This
theory implies that the relationships of the variables in this study can take any direction
positive negative or no relationship
224 Stewardship Theory
Developed by Donaldson and Davis (1991) stewardship theory has its origins in
sociology and psychology A steward guards and strives to maximize the shareholderrsquos
interests through firm performance since in doing so the value of the steward is also
maximized From this perception the steward is the firm management who work for the
shareholders defending and making returns for them Stewardship theory emphasizes the
role of firm management being stewards incorporating their objectives as part of the
firm Therefore as stewards they are contented and encouraged when the firmrsquos success
is accomplished The stewardship theory is quite the opposite of the agency theory It
32
submits that firm managers are honest and upright stewards of the assets delegated to
them under their care and thus making monitoring useless The theory opposes the
agency theory which assumes that managers will act to satisfy their own self-interest
rather than that of the firm Rather stewards who are managers executives and board of
directors are satisfied and motivated when firm objectives are achieved (Donaldson amp
Davis 1991 and Davis et al 1997)
Davis et al (1997) argues that stewards derive greater utility at personal level by
satisfying firm objectives than through self-serving behavior and as such the managers
and directors are also concerned about their personal reputation as expert decision
makers which drives their effort towards better firm performance of the firms they serve
According to the stewardship theory other non-financial motivations such as need for
accomplishment and gratitude personal fulfillment gained by successful achievement of
the goals of the firm respect for authority and peers as well as the firmrsquos work ethics do
impact on the actions of the stewards Superior firm performance is connected to having
majority of inside directors as opposed to external directors since inside directors know
the firm better and are better placed to manage than outside directors
Daily Dalton and Cannella (2003) discern that in order to guard their reputation as
decision makers in firms firm managers are motivated to run the firm with the main
objective of maximizing firm performance Similarly Fama (1980) suggests that firm
managers are also protecting their careers so as to be seen as efficient and effective
stewards of their firms Davis et al (1997) have critiqued the stewardship theory arguing
33
that the role of the lsquostewardrsquo is over-simplified and impracticable and that the theory
emphasizes the personalities and egos of senior directors The stewardship theory is
related to this study to the extent that firm managers are considered lsquostewardsrsquo who act on
behalf of shareholders Just like the stakeholder theory stewardship theory adds value
especially in explaining outcomes where the FCF hypothesis and agency theory are not
supported Since this theory emphasizes the role of firm managers being that of stewards
it was expected that the higher the FCF the higher the firmrsquos performance
225 The Resource Based View Theory
RBV is defined by Pearce and Robinson (2011) as a way of examining and recognizing a
firmrsquos strategic advantages based on observing its distinct mix of skills assets
intangibles and capabilities The RBV theory is concerned with internal firm-specific
factors and their effect on performance Grant (1991) observes that RBV theory views the
firm as a bundle of resources that are combined to generate firm capabilities which it can
use to earn above average profitability Every firm develops capabilities from these
resources and when they are well established these become the basis of the firmrsquos
competitive advantage Penrose (1959) explains the significance of exceptional
packagesbundles of resources controlled by the firm which are critical for performance
These firm resources comprise of tangible assets all capabilities attributes of the firm
organizational processes knowledge and information controlled in order to expand
competence effectiveness and efficiency that will in general lead to greater financial
performance
34
Resources are defined as firm capabilities physical assets and intangibles that are semi-
permanently tied to the firm (Wernerfelt 1984) Barney (2002) observes that the RBV
competitive advantage stems from a firmrsquos unique assets and distinctive capabilities and
assumes that firms can be hypothesized as bundles of resources and that those resources
are heterogeneously dispersed across the firms with resource variances persisting over
time Similarly Baker and Sinkula (2005) note that RBV of the firm suggests that
performance is contingent on the firmrsquos competences and specific resources
The thirst to understand the effects of firm level characteristics on financial performance
has been debated a lot in the research arena Among the arguments presented is that a
firmrsquos financial performance is affected only by structural characteristics within the
industry The other argument is that a firmrsquos financial performance is affected by firm
specific resources Much focus has been given to the firm level characteristics as opposed
to the industry level characteristics because it forms the basis upon which the firms
compete The industry related factors is majorly explained by the competitive focus
approach The RBV theory explains the effect of firm characteristics which are internal
factors to the firm with respect to financial performance (Bain 1959 and Porter 1980)
Researchers have carried out studies to test which of the two commonly disputed factors
(industry factors or firm specific factors) are important in explaining variations in firm
performance Wernerfelt and Montgomery (1985) Schmalensee (1985) Rumelt (1991)
Chang and Singh (2000) and Hawawini Subramanian and Verdin (2003) performed
variance component analysis test to establish the percentage of effects of firm
35
characteristics and industry factors on firm performance as measured by ROA Under the
RBV the firm is seen to be heterogeneous and firms possess a combination of unique
capabilities and assets that are responsible for giving them an upper hand in competition
and enable them achieve superior performance
Wernerfelt (1984) was the earlier supporter of the RBV theory but he did not get much
attention at the time However scholars such as Grant (1991) Stalk Evans and Schulman
(1992) and Williams (1992) revisited Wernerfelt (1984) and found that firms with
particular set of skills and capabilities outperformed their rivals Wernerfelt (1984)
describes a resource as ldquoanything that could be deemed as a strength or weaknessrdquo
According to the RBV of the firm resources (which are inputs for the production of
goods and services) and organizational competences (intangible assets that are founded
learning skills and knowledge in deploying resources) can be sources of competitive
advantage The RBV is criticized for its failure to describe how these resources are
established and organized to realize competitive advantage RBV has also been critiqued
for its inability to contemplate the effect of a dynamic market environment (Lengnick-
Hall amp Wolff 1999 and Priem amp Butler 2001)
Another criticism of the RBV theory is that researchers only concentrate on one resource
type that is intangible assets within a single industry and examine its effect on firm
performance The RBV theory helps in explaining performance variation of intra industry
firms as it specifically addresses firm characteristics rather than industry factors
Financial resources are normally measured by leverage ratios which enable the firm to
36
increase its project financing by borrowing from debt providers Liquidity measures
spontaneous financial resources available to conduct normal business operations
Physical resources as measured by the size of assets is one of the tangible resources the
firm can use to gain competitive advantage while business experience of the firm and
serving board of directors give the firm organizational capabilities that it can use to gain a
competitive advantage over its competitors thus being able to earn an above average
financial performance
The boards of directors are viewed as strategic resources that are responsible for the
advancement of the firms to meet their long-term objectives (Kapelko 2006) RBV is
related to this study because it maintains that a firmrsquos financial performance is influenced
by firm specific characteristics (which are one of the study variables) Based on the RBV
therefore it was expected that the higher the FCF the higher will be firm performance
Firm characteristics were expected to provide an interaction which statistically affects the
strength and or direction of the correlation between FCF and firm performance
226 Organizational Theory
Kaen and Baumann (2003) in an attempt to explain firm size came up with the
organizational theory that explains firm size in relation to profitability as well as
organizational transaction costs agency costs and span of control costs Organizational
theory explains the effect of firm size and age of the firm on firm performance Dean
Robert and Bamford (1998) cite that the size of the firm is somewhat correlated to firm
performance because of concentration industry-sunk costs overall industry profitability
37
and vertical integration Firm size matters in assessing financial performance Large-sized
firms have greater number of departments multi-layer levels of management have more
specialized functions and skills greater formalization and management control is highly
centralized which makes them highly bureaucratized than small-sized firms effectively
making them miss out on profitable opportunities that require urgent attention (Daft
1995)
Hannan and Freeman (1984) Aldrich and Austen (1986) and Meyer and Zucker (1989)
have linked firm size and age of the firm to Inertia Inertia is described as an insufficient
or sluggish adjustment to transformation or opposition to major variations in business
operations which in effect may cause the firm to miss profitable opportunities
Stinchcombe (1965) claims that firms that are older seem to be more experienced and
enjoy the benefits of improvement curve effect which makes them not to be exposed to
the problems of newness and hence enjoy above average performance
Penrose (1959) argues that larger firms are able to generate superior performance because
they have diversified capabilities ability to fully exploit economies of scale and scope
Such firms have formalized procedures of conducting business which ultimately makes
implementation of operations more effective On the contrary Leibenstein (1976) and
Shepherd (1986) argue that firm size is correlated with market power and along with
market power inefficiencies are created leading to inferior performance Thompson and
McHugh (2002) have critiqued the organization theory regarding it as being essentially
38
prescriptive There is an implied belief in underlying values or laws that govern
managersrsquo activities and functions
Another weakness of the organization theory cited by Salaman (1979) is the assumption
that all firms are in some way alike arguing that some firm analysts develop propositions
about firms in general lumping together such dissimilar examples as voluntary
establishments charities and political associations Salaman (1979) observes that it
hinders the analysis of those organizational elements which are radically exposed in
employing firms and not necessarily in all forms of organization Organizational theory
is related to this study because it explains the effect of firm size and age of the firm
(which are firm characteristics) on firm performance These are integral variables in this
study Since the theory cites conflicting views for instance bureaucracy in larger firms
which negatively affects performance on the one hand and economies of scale and
diversified capabilities in larger firms which positively affect firm performance on the
other hand it was expected that the relationship among the study variables would take
any direction Firm characteristics would moderate the relationship between FCF and
firm performance by statistically influencing the strength and or the direction of the
correlation between the predictor and explanatory variables
23 Free Cash Flows and Firm Financial Performance
Wang (2010) studied the impact of FCF on firm performance with empirical data from
Taiwan Stock Market for the period 2002 to 2007 Using a sample of 505 firms
regression analysis was employed in data analysis The study found that FCF had
39
statistically significant effects on firm performance These effects were however
conflicting On the one hand the presence of high FCF escalated imprudent expenditures
that consequently lowered firm performance The results indicated on the other hand that
FCF were generated due to managersrsquo efficiency in operations implying that a positive
correlation between FCF and firm performance
However in his definition of FCF Wang (2010) did not take into account CAPEX and
net borrowings which are critical in the FCF definition Additionally the study focused
on financial performance only The findings by Wang (2010) are partially consistent with
results by Gregory (2005) who studied the long run abnormal performance of UK
acquirers and the correlation between FCF and firm performance Gregory (2005)
established that mergers with greater FCF achieved better than those with lesser FCF
While testing the hypothesis the study used ldquolong term returnsrdquo and also ldquoanalyzed
announcement month returnrdquo However the study did not include daily returns around
announcement which could probably yield different results Furthermore the study
focused on financial performance outcomes only
Brush et al (2000) studied the proposition that sales growths in firms with FCF were less
lucrative than sales growths for firms with lower FCF Data was obtained from firms in
the USA covering eight years 1988 to 1995 and used Tobinrsquos Q to ascertain whether
firms had positive NPV projects available to determine FCF Returns to shareholders
were used as a performance measure The use of shareholder returns was criticized by
Bromiley (1990) because it assumes capital market efficiency which argues that the
returns to a large extent reveal surprises to the market Therefore if the markets expect
40
firmsrsquo sales growths and profitability even very profitable sales growths should not be
reflected in shareholder returns in the periods in which they arose The study found that
firms with higher FCF achieve lower from sales growth than those without or with lower
FCF Since sales growth is a measure of firm performance these findings support the
argument that FCF negatively affects firm performance
The findings by Wang (2010) and Gregory (2005) on the one hand and Brush et al
(2000) on the other hand reveal inconsistencies These contradictions indicate that the
correlation between FCF and firm performance is still unresolved In this study a more
robust measure of FCF was adopted For instance Wang (2010) measured FCF as net
operating income before depreciation minus tax expense minus interest expense minus
share dividends scaled by net sales In this study FCF are defined as in Brealey et al
(2005) as net income add amortization and depreciation minus CAPEX less change in
non-cash working-capital plus net borrowing The study is therefore expected to yield
more reliable and robust results
24 Free Cash Flows Agency Costs and Firm Financial Performance
Lin and Lin (2014) investigated the agency costs of FCF and biddersrsquo long-run takeover
performance in Australia using data for the period 1993 to 2000 The final sample
included 556 acquiring firms The study introduced two proxies of FCF excess
accounting cash flow and excess cash holdings and tested the relationship between
biddersrsquo long-run post-acquisition performance and the level of excess cash The findings
41
indicated that the level of excess cash holdings didnrsquot show a substantial reason for the
cross-sectional disparity in long-run post-acquisition performance
The findings from the flow measure of cash indicated that the acquisitions done by
bidders with surplus accounting cash flow didnrsquot escalate agency costs and therefore were
not value reducing Rather bidders with greater surplus accounting cash flows had better
long-run post-acquisition performance The findings therefore indicate that the
examination of FCF hypothesis in the Australian takeover market is conflicting to the
expectations of the FCF theory This finding is contrary to the argument that substantial
FCF increases agency costs which subsequently negatively impacts on firm performance
However Lin and Linrsquos (2014) definition of FCF ignores CAPEX and net borrowings
which are critical variables
Nekhili et al (2014) analyzed the intervening effect of agency costs of monitoring and
ownership structures in reducing earnings management practices when there is FCF The
sample comprised of 85 French listed firms for the period 2001 to 2010 The results
highlighted the unscrupulous managerial behavior in the presence of high FCF The study
measured FCF by multiplying the retained cash flows by the inverse of Tobinrsquos Q
However like in Lin and Lin (2014) CAPEX and net borrowings were omitted in the
definition of FCF The findings indicated that firms which had high FCF tended to
upwardly manage their earnings Additionally with the availability of high FCF the
tendency of firm managers to use discretionary accruals depended on the firm ownership
and the efficiency and effectiveness of governance mechanisms Precisely independence
42
of audit committees and external audit quality together with firm ownership structure (for
example institutional investors and executive ownership) reduced the extent of earnings
management when FCF were available
Conversely independent directorsrsquo ownership and board independence had no significant
effect on earnings management The results indicate that firm executives employ earnings
management practices that escalate reported earnings This implies that there are
increased agency costs emanating from the presence of high FCF subsequently
negatively affecting firm performance The negative effect of agency costs on the
correlation between FCF and firm performance is also supported by Brush et al (2000)
These results are of interest to this study because the research tried to find out the effect
of agency costs and firm characteristics on the correlation between FCF and performance
of NSE listed firms Agency costs are expected to mediate the correlation between FCF
and firm performance because they are the intermediate output of FCF
25 Free Cash Flows Firm Characteristics and Firm Financial Performance
Demsetz and Lehn (1985) studied the firm characteristics that included structure of
corporate ownership and firm size using 511 firms in the USA Size of the firm was
measured by the mean annual common stock market value and the study period was
1976 to 1980 Ordinary least squares (OLS) regression estimates were employed in data
analysis The findings suggest that in the presence of substantial FCF large firms tend to
overinvest thereby yielding relatively lower performance Large firms tended to have
fewer growth prospects than smaller firms and in the absence of good growth prospects
43
an overinvestment problem is likely to arise thereby negatively impacting on the firmrsquos
performance However the choice of a five-year study period seems too short Literature
indicates that 7 to 10 yearsrsquo study period is preferred (Brush et al 2000 and Nekhili et
al 2014)
In examining the degree of firm level over-investment of FCF Richardson (2006) used
an accounting-based structure to measure over-investment and FCF and confirmed that
over-investment was dominant in firms with the greatest FCF levels The study was
carried out in the USA and used a sample of 58053 firms for the period 1988 to 2002
The study also examined whether there was any association between firmsrsquo governance
structures and FCF over-investment The empirical analysis employed two steps In the
first step the study used an accounting-based structure in measuring both over-
investment and FCF The study defined FCF as cash flow over and above what was
needed to sustain assets in place and to fund new investment projects On the other hand
over-investment was described as investment expenditure over and above that needed to
retain assets in place and to fund probable new investments In measuring over-
investment the study decomposed total investment outlay into two component parts
First it needed investment spending to sustain assets in place and secondly investment
spending in new projects
In the next step the study decomposed investment expenditure into expected investment
outlay and over-investment in negative NPV projects where the latter varied with the
firmrsquos growth prospects industry affiliation funding constraints and other aspects
44
Although the study incorporated the firm characteristics of size liquidity and growth
prospects it focused on financial performance measures only Furthermore the study
excluded age of the firm Results suggest that some governance mechanisms like the
existence of shareholders who are activists seem to lessen over-investment Additionally
firm performance in the presence of FCF was found to be lower in firms with higher
liquidity than those with lower liquidity The findings are consistent with Harford (2002)
who found that cash-rich firms were more probable to undertake acquisitions that
consequently suffer abnormal failures in operational performance
Brouwer et al (2005) investigated whether age of the firm accounted for productivity
differences Data was obtained for the period 1994 to 1999 and the focus was on Dutch
firms Although the dataset included firms from all age cohorts (0-4 years and 5-9 years)
the study focused more on firms of at least 10 years of age Using regression methods the
results showed very few signs of a relationship between productivity (performance) and
age Both growth rate and level of productivity varied between sectors and also differed
with size of the firm There was also no indication that productivity growth rate was
related to the age of the firm On productivity level there were very few signs of the
effects of age The Brouwer et al (2005) study did not fully exploit the panel structure of
the dataset that was available The explicit techniques of estimation that take account of
this structure such as multilevel or panel data estimation techniques are expected to be
more effective
45
Conversely Power (1998) found a negative relationship between the growth rate of
productivity and age at a certain phase in the firmsrsquo lifespan Power (1998) examined the
relationship between plant age and productivity for firms in the manufacturing industry of
the USA for the period 1972 to 1988 The study found that productivity growth rates
decline with age which was credited to the effects of learning Firm characteristics are
expected to moderate the correlation between FCF and performance because their effect
is statistically characterized as an interaction affecting the strength and or direction of
the correlation between FCF and firm performance (Baron amp Kenny 1986)
26 Free Cash Flows Agency Costs Firm Characteristics and Firm Financial
Performance
Investigating the agency costs of FCF corporate finance and takeovers Jensen (1986)
sampled top 200 firms in the oil industry in the USA and found a link between the agency
problem with FCF firm characteristics and firm performance Using regression methods
results suggest that firm managers might misappropriate FCF at their disposal when the
firm does not readily have viable investment opportunities and that agency costs are high
when FCF are combined with poor growth prospects Results also indicate that more debt
would increase efficiency by compelling firms with large FCF but few high-return
investment projects to pay back cash to the creditors Leverage helps in preventing such
firms from misappropriating resources on low-return projects
For industries that are declining within the industry mergers would generate value while
outside industry mergers would likely generate lesser value or negative-returns Mergers
46
within the food industry seemed to reflect the spending of FCF The industry seemingly
generated large cash flows with few growth prospects The findings however seem to be
contradicting because they also indicate that increased leverage escalates agency costs
As leverage increases the typical agency costs of debt rise which include bankruptcy
costs that subsequently negatively affects firm performance
Mojtahedzadeh and Nahavandi (2009) investigated the relationship between agency
problems that arise due to FCF with long term profitability and income management
Using Tobinrsquos Q to measure long term profitability and Adjusted Jones Model to estimate
Discretionary Accruals (DA) panel analysis was used to analyze the data Results from
testing 106 firms listed on Tehran Stock Exchange throughout the years 2003 to 2007
reflect that agency costs emanating from the availability of substantial FCF negatively
affect both long term and short term profitability However the five-year period of study
seems too short and also non-financial performance outcomes were ignored in the study
Similarly Nunes Serrasqueiro and Sequeira (2009) investigated 75 Portuguese service
oriented firms to establish the effect of firm size on profitability (performance) They
introduced control variables of growth prospects leverage liquidity and asset structure
(tangibility)
The study used both dynamic estimators and static panel models Results indicated a
positive statistically significant correlation between firm size and performance They
also found a positive effect of growth prospects and liquidity on profitability but a
negative effect on leverage and asset tangibility on profitability as measured by ROA
47
Results also indicated that substantial FCF negatively affected profitability of the firm
The data employed was for the period 1999 to 2003 a duration which seems too short A
longer study period of seven to ten years would probably yield different results
Milne Purda and Anand (2008) used 1200 Canadian firms for the period 1999 to 2003 to
test the hypothesis that independent boards are more prone than non-independent boards
to willingly embrace mechanisms intended to improve their ability to monitor firm
management The study examined seven mechanisms both in aggregate and individually
through construction of an index that allocated one point for each mechanism embraced
up to a maximum of seven points and conducted multivariate regression analyses in
which the explanatory variable was either the full or the reduced index
Results indicate that the board of directors vigorously monitors decision makers who
have an inclination towards diverting firm resources to their own personal interests as a
consequence of the agency problem and FCF hypothesis thereby negatively impacting on
firm performance The findings also offer evidence that a relatively large number of
acclaimed monitoring mechanisms have been embraced by firms and that the acceptance
rate increases for firms with both independent and executive boards However the Milne
et al (2008) study didnrsquot integrate alterative views for the board of directors such as
influencing management decisions using the advisory role The study also ignored
procedures other than board monitoring that may serve to lessen agency costs
48
Locally Wambua (2013) examined the effects of agency costs on performance of NSE
listed firms The study used regression analysis and results indicated a positive
correlation between FCF and firm performance Furthermore the study found that
liquidity firm size and ownership concentration positively influenced performance of the
listed firms However the study did not incorporate firm age Conflicting results were
found by Njuguna and Moronge (2013) who studied the influence of managerial behavior
of agency costs on performance of firms listed at the NSE Using descriptive research
methodology results indicated that information asymmetry is a source of agency costs
and that agency problems are usually related to FCF In operationalizing the agency costs
however Njuguna and Moronge (2013) used total asset turnover as the only measure of
agency costs and also focused on financial outcomes only
To fill these knowledge gaps this study used two measures to fully integrate agency
costs The two agency cost measures used in this study are operating expenses to sales
ratio and sales to assets ratio These two measures are better measures of agency costs
because they tend to incorporate managerial asset utilization efficiency and production
cost efficiency (Singh amp Davidson 2003 McKnight amp Weir 2008 and Fauver amp
Naranjo 2010)
27 Summary of Knowledge Gaps
Empirical literature shows mixed findings regarding FCF agency costs firm
characteristics and firm performance For instance Jensen (1986) found a negative
correlation between FCF and firm performance results suggesting that management
49
might abuse FCF at their disposal Similar findings are recorded by Brush et al (2000)
Mojtahedzadeh and Nahavandi (2009) Wang (2010) Wambua (2013) Njuguna and
Moronge (2013) and Nekhili et al (2014)
Gregory (2005) on the other hand established that mergers that had a greater degree of
FCF performed better than those with lower FCF Similarly Szewcyzk et al (1996) and
Chang et al (2007) find that investors favored firms with both profitable investment
opportunities and significant FCF Likewise Lin and Lin (2014) established that the
acquisitions made by bidders with surplus FCF were not value decreasing Instead
bidders with higher excess FCF had better long-run post-acquisition performance
This research attempted to fill the following knowledge gaps first the influences of
agency costs and firm characteristics (firm size and age of the firm) on the correlation
between FCF and financial performance of the firm were all integrated Secondly FCF
were measured more robustly by incorporating CAPEX and net borrowings Thirdly
unlike in prior studies such as Wang (2010) and Njuguna and Moronge (2013) which
only focused on asset utilization efficiency to measure agency costs this study employed
two different measures for agency costs First is the asset utilization efficiency and
second is the production cost efficiency The two measures are better because they tend
to fully integrate agency costs Lastly the study used cross-sectional panel data design
The study therefore sought to affirm modify or reject existing empirical literature by
bridging the gaps identified in prior studies
50
Table 21 Summary of Knowledge Gaps
Researcher(s) Focus of Study Methodology Findings Knowledge Gaps How this Study
Addressed Gaps
Demsetz and
Lehn (1985)
Structure of corporate
ownership Causes and
consequences
The study
employed OLS
regression
estimates with
sample of 511
firms in the USA
In the presence of
substantial FCF
large firms tend to
overinvest thereby
negatively
impacting on firm
performance
The study
considered a five-
year period which
seems too short and
the focus did not
include FCF and
agency costs
This study employed
a ten year period
focused on FCF
agency costs firm
characteristics and
performance of firms
listed at the NSE
Jensen (1986) FCF agency costs
corporate finance and
takeovers
The study used
regression analysis
on 200 firms in the
oil industry in the
USA
Managers might
misuse FCF at their
disposal when
investment
opportunities are
not available
The study did not
incorporate firm
characteristics
This study included
firm characteristics
(age and size)
Szewcyzk et
al (1996)
The role of investment
opportunities and FCF in
explaining RampD induced
abnormal returns in the
Used regression
analysis and
measured
performance using
Shareholders
favored firms that
had both high FCF
and profitable
Focus variables
omitted agency
costs
The variables for this
study are FCF
agency costs firm
characteristics and
51
Researcher(s) Focus of Study Methodology Findings Knowledge Gaps How this Study
Addressed Gaps
USA firms Tobinrsquos Q investment
opportunities
firm performance
Gul and Tsui
(1998)
Tested the hypothesis
that FCF and director
stock ownership
interaction was less
likely to occur for firms
with high levels of
leverage
Studied 157 low
growth Australian
firms and used
OLS regression
analyses
Results suggested
that an increase in
financial leverage
seemed to reduce
agency costs
The study ignored
the influence of
liquidity and also
focused on low
growth firms only
This study focused on
firm characteristics of
firm size and age of
the firm
Brush et al
(2000)
FCF hypothesis for sales
growth and firm
performance The study
was conducted in the
USA
Study used
regression analysis
with performance
measured using
Tobinrsquos Q and
shareholder return
Firms with high
FCF perform
poorly and also
weak CG caused
inefficiency in the
allocation of FCF
CAPEX and Net
borrowings were
omitted in FCF
definition
This study included
CAPEX and net
borrowings to
measure FCF
Gregory
(2005)
Long run abnormal
performance of UK
acquirers and the
correlation between FCF
and firm performance
Used long term
returns and
analyzed
announcement
month return
Mergers with
greater FCF
performed better
than firms with
lower FCF
The study did not
incorporate firm
characteristics and
agency costs
The study
incorporated agency
costs and firm
characteristics (age
and size)
52
Researcher(s) Focus of Study Methodology Findings Knowledge Gaps How this Study
Addressed Gaps
Richardson
(2006)
Firm level over-
investment of FCF for
firms in the USA
Used an
accounting-based
structure to
measure over-
investment and
FCF
Found that over-
investment was
intense in firms
with the greatest
FCF levels
The study did not
incorporate firm
characteristics
This study included
firm characteristics
(age and size)
Mojtahedzadeh
and Nahavandi
(2009)
The relationship between
agency problems that rise
due to FCF with long
term profitability and
income management
The study was on firms
listed on the Tehran stock
exchange Iran
Used 106 firms for
the period 2003 to
2007 used Tobinrsquos
Q to measure long-
term profitability
DA was estimated
using the Adjusted
Jones Model
The study found
that agency
problems of FCF
result in short term
and eventually long
term profitability
The study focused
on FCF agency
costs and
profitability and
income and the
study period was
five years
This study focused on
FCF agency costs
firm characteristics
and the performance
of firms quoted at the
NSE Study period
was ten years
Nunes et al
(2009)
Profitability in
Portuguese service
industries
Used both static
panel models and
dynamic
estimators
Found a positive
correlation between
firm characteristics
and performance
and that FCF result
in profitability
The study used data
for four years only
(1999 to 2003)
which seems too
short
This study employed
data for ten years
(2006 to 2015)
53
Researcher(s) Focus of Study Methodology Findings Knowledge Gaps How this Study
Addressed Gaps
Wang (2010) The effect of FCF and
agency costs on firm
performance (firms listed
at the Taiwan stock
market)
Used descriptive
statistics
correlations and
regression analysis
Found no evidence
supporting a
negative correlation
between FCF and
firm performance
CAPEX and Net
borrowing were
omitted in FCF
definition
This study included
CAPEX and net
borrowings in
measuring FCF
Waithaka et al
(2012)
Effects of dividend
policy on share prices of
NSE listed firms Kenya
Used the case
method and
regression analysis
Found that FCF
instigated conflict
between managers
and shareholders
which consequently
affected the firm
performance
The study focused
on dividend policy
and stock
performance
This study focused on
FCF agency costs
firm characteristics
and firm
performance
Njuguna and
Moronge
(2013)
Effect of managerial
behavior of agency costs
on performance of firms
listed at the NSE Kenya
Used descriptive
research and used
asset turnover ratio
to measure agency
costs
Found that FCF
were negatively
related to firm
performance and
information
asymmetry causes
agency problem
The study used only
one proxy measure
of agency costs -
total asset turnover
ratio
This study employed
total assets turnover
and operating
expenses sales
54
Researcher(s) Focus of Study Methodology Findings Knowledge Gaps How this Study
Addressed Gaps
Wambua
(2013)
Effects of agency costs
on performance of firms
listed at the NSE
Regression
analysis was
employed in data
analysis
Got a positive
correlation between
FCF and firm
performance
The study did not
incorporate firm
characteristics
This study included
firm characteristics
(age and size)
Lin and Lin
(2014)
Agency costs of FCF and
biddersrsquo long-run
takeover performance of
Australian firms
Used regression
analysis on 556
firms for the
period 1993 to
2000
Found a positive
correlation between
FCF and firm
performance
CAPEX and Net
borrowing were
omitted in FCF
definition
This study included
CAPEX and net
borrowings in
measuring FCF
Nekhili et al
(2014)
Moderating effect of CG
and ownership in
lessening earnings
management practices
when there is high FCF
The study was conducted
in France
Developed
simultaneous
equations to
address
endogeneity of
FCF and then
employed
Hausman test
They found
opportunistic
behavior of
managers in
presence of FCF
Used firm
characteristics of CG
and ownership as
moderating variable
This study used firm
characteristics of size
and age of the firm as
moderating variable
Source Researcher (2018)
55
28 Conceptual Framework
Figure 21 below shows graphically the researcherrsquos conceptualization of the study
Figure 21 Conceptual Model
Independent Variable Dependent Variable
H01
Intervening Variable
H02
H04
H03
Moderating Variable
Source Researcher (2018)
Free Cash Flows
FCFit = (Net income
(PAT) + depreciation and
amortization - CAPEX -
change in non-cash
working capital + net
borrowing)Sales
Financial Performance
Tobinrsquos Q
Agency Costs
- Asset utilization efficiency ACit
- Production cost efficiency
Firm Characteristics
- Firm Size
- Age of the firm
56
FCF is the independent variable whereas the dependent variable is financial
performance As shown in figure 21 above H01 indicates the effect of FCF on financial
performance Agency costs are the intervening variable and they comprise of asset
utilization efficiency and production cost efficiency In figure 21 above H02 designates
the intervening influence of agency costs on the correlation between FCF and financial
performance In similar manner H03 depicts the moderating influence of firm
characteristics on the correlation between FCF and financial performance Firm
characteristics in the study are firm size and age of the firm Lastly H04 shows the joint
effect of FCF agency costs and firm characteristics on financial performance
29 Chapter Summary
This chapter reviewed theoretical foundation on which the study is grounded The
theories highlighted are The FCF hypothesis agency theory stewardship theory
stakeholder theory RBV theory and the organizational theory Empirical studies were
also examined specifically reviewing the correlation between FCF and financial
performance the intervening role of agency costs on the correlation between FCF and
financial performance the moderating role of firm characteristics on the correlation
between FCF and financial performance and finally the joint effect of FCF agency costs
and firm characteristics on financial performance Findings are mixed with some studies
indicating negative relationships while others showing positive relationships A summary
of knowledge gaps has also been underscored The chapter presented and explained the
conceptual model that guided the study and how it was conceptualized by the researcher
57
CHAPTER THREE RESEARCH METHODOLOGY
31 Introduction
This chapter deliberates on the research methodology used It presents the philosophy
research design study population how data was collected reliability and validity The
operationalization of study variables the techniques of data analysis applied and
summary of the research objectives Their corresponding hypotheses and analytical
models have also been highlighted
32 Research Philosophy
Research is defined by Proctor (1998) as a process to find out the unknown A critical
phase in doing social science research is to decide and validate the preferred research
philosophy embraced by the researcher Inter-related paradigmatic conventions
concerning the nature of reality the researcherrsquos role and the research process initiate
scientific research Research philosophy is the primary essential credence that supports
the options that need to be selected in taking a position in research Philosophy has
consequences on what how and why research is to be conducted (Carson Gilmore Perry
amp Gronhaug 2001)
Research philosophy has broad paradigms There are interpretative and the positivistic
paradigms Perry Reige and Brown (1999) explain the relationships among the
techniques that the researcher employs the researcher and the reality and truth that they
seek The two philosophical traditions that guide research in social science are positivism
58
and phenomenology (Saunders et al 2007) The roots of positivism tradition are
grounded in empiricism (Kerlinger 2002) Positivism is an ontology which makes an
assumption that a person has a straight access to the actual world and it is likely to get
independent information regarding the particular external reality
Interpretivism or Phenomenology is an ontology which makes an assumption that a
person does not have direct access to the real world and the knowledge heshe has
regarding this apparent realm is important in its own terms Within the phenomenological
ontology epistemology is founded on belief or assumption that the person conducting the
research is part of the reality and therefore not objective value-free or independent
Research emphasis is to understand what happens in a particular situation and it
contemplates several realities and diverse perceptions of the researcher (Carson et al
2001)
In this study the two philosophical traditions were examined and positivism was
considered the more appropriate tradition for the study because the study is centered on
prevailing theory and it develops hypotheses that can be verified Positivism made it
possible to make definite statements about the influence of agency costs and firm
characteristics on the correlation between FCF and firm performance grounded on
unbiased assessment and deductive reasoning The study utilized statistical data analysis
techniques and the researcher was objective and independent because individual feelings
were not introduced
59
33 Research Design
Research design involves decisions on where what when how farmuch and through
which means regarding a phenomenon It is the outline employed to direct a research
study to make certain that the research addresses the study problem (Gorard 2013) After
considering various research designs described by research experts such as Cooper and
Schindler (2006) Mugenda and Mugenda (1999) and Muganda (2010) as well as the
purpose of the study the philosophical tradition adopted the topical scope researcher
involvement time period over which the data was collected the nature of the data and
type of data analysis the study design embraced was cross sectional descriptive design
Mojtahedzadeh and Nahavandi (2009) successfully used the cross-sectional research
design in their study of the relationship between agency problems that arise due to FCF
with long term profitability and income management Mwangi (2014) also successfully
employed this study design in determining the influence of membersrsquo income and
conduct of Savings and Credit Cooperatives (SACCOs) in the correlation between
efficiency and characteristics of SACCOS in Kenya The cross-sectional descriptive
design was considered appropriate because of its versatility and leverage in collection of
data from a large number of respondents within a fairly short time period
34 Population of the Study
The target population comprised of the entire 63 firms listed at the NSE (Appendix I) as
at December 31 2015 This was a census study which involved obtaining information
from every member of the population A census of all the NSE listed firms was employed
60
because the number of listed firms at the NSE is relatively small and therefore the study
could easily be carried out
35 Data Collection
Secondary data was collected from published financial statements obtained from the
NSE Time series panel data was collected covering a 10 - year period from 2006 and to
2015 A ten-year period is deemed large enough to yield reliable findings A similar
period was adopted by Gregory and Wang (2010) and Nekhili et al (2014) Appendix II
shows the data collection form
36 Reliability and Validity
The main indicators of the value of a data collection instrument are reliability and validity
of the measures Reliability is among the most essential components of test quality and it
entails consistency or reproducibility or the examineersquos test performance Therefore
reliability is the degree with which research instruments yield consistent results after
repeated trials Reliability of a measure has two parts its stability over time and the
consistency of the instrument in measuring the concept Several methods of computing
test reliability exist and they include decision consistency parallel forms reliability test-
retest reliability inter-rater reliability and internal consistency Decision consistency is
often an appropriate choice for many criterion-referenced tests (Kimberlin amp Winterstein
2008)
61
Validity is the degree with which theory and evidence corroborate interpretations of test
scores occasioned by suggested uses of tests It denotes whether or not the test is
measuring what it anticipated to measure It is perhaps the most essential criteria for the
quality of a test There are several types of validity and these consist of construct validity
criterion-related validity and content validity Construct validity refers to the extent to
that an instrument measures the attribute or hypothetical concept that it was proposed to
measure while content validity is the degree with which the content of the objects reveals
the content purview of interest Lastly criterion-related validity is evaluated when an
individual wants to establish the correlation of scores on a test to a specified benchmark
(AERAAPANCME 2000 and Penfield amp Miller 2004)
361 Reliability Test
Stability was assessed by use of test retest reliability while internal consistency was
assessed using inter-item consistency reliability In testing for reliability Cronbach alpha
was calculated The Cronbachrsquos alpha coefficient was applied in measuring internal
consistency of the measurement scales It is a scale measurement tool that is frequently
used in social sciences for determining internal consistency of factors or items among and
within variables of the study Nunnally (1967) and Oppenheim (1992) argue that alpha
coefficient value of 0700 and above is tolerable
The Cronbachrsquos alpha coefficient was employed because it is suitable for multi-scaled
items The Cronbachrsquos alpha is a broad formula of the Kunder-Richardson (K-R) 20
formula as shown
62
(K) (S2-Σs
2)
KR20 =
(S2) (K-1)
KR20 = Reliability coefficient of internal consistency
S2 = Variance of all scores
K= Number of items employed to measure the model
s2 = Variance of individual items
This study also employed secondary data Kimberlin and Winterstein (2008) argue that
the foremost concern when deciding if secondary data should be used is to confirm that
the data set suitably measures the variables that are required to answer the study
questions Secondary data was collected from audited financial statements of all NSE
listed firms This data is deemed reliable because financial reporting is guided by
International Financial Reporting Standards (IFRS) Furthermore the companies Act
(CAP 486) of the laws of Kenya require that every limited liability firm conducts a
statutory audit at least once annually Such audits are guided by International Auditing
Standards (IAS)
362 Validity Test
Validation of the instrument was accomplished in several ways Pre-test was done by
administering the instrument to eight middle level managers to complete The eight
managers were conveniently selected to review the statement items for clarity meaning
63
and relevance Based on their response the data collection instrument was appropriately
modified Validity shows whether the instrument is testing what it should be testing
Content validity was achieved by establishing whether the items in the data collection
instrument are well balanced in content domain and link up well with theoretical
assumptions centered on the study objectives which involved checking of the content to
establish if it contained representative sample of the objects being measured Criterion-
related validity was established by administering test-retest or stability test on the data
contents in the data collection instrument Construct validity was established by ensuring
that the study variables were properly operationalized This was achieved through
constant consultations and reviews by research experts from the University of Nairobirsquos
School of Business Validity can be measured by use of expert judgment and informed
opinion (Kerlinger 2002)
37 Operationalization of the Study Variables
This study has four variables of interest independent variable dependent variable
intervening variable and a moderating variable Table 33 shows the research variables
and their respective metricsindicators Theoretical and empirical research in the area of
study has guided the choice of the variables
64
Table 31 Operationalization of Study Variables
Variable
Indicator Measure Support from
Literature
Form Section
Independent Variable
Free Cash Flows
Net income (PAT) add
depreciation and
amortization minus CAPEX
minus change in non-cash
working capital add net
borrowing
Net income (PAT) add
depreciation and amortization
minus CAPEX minus change
in non-cash working capital
plus net borrowingNet
Sales
Brealey et al
(2005) and
Nekhili et al
(2014)
Part A of Data
Collection Form
Dependent variable(s) - Firm Performance
Financial
Performance
Tobinrsquos Q Equity market valueEquity
book value
Szewczyk et al
(1996) and
Mojtahedzadeh
and Nahavandi
(2009)
Part B of Data
Collection Form
Intervening Variable(s)
(a) Asset utilization
efficiency = Net sales
to total Assets ratio
(a + b)2 = AC
Tirole (1986)
Part C of Data
Collection Form
65
Variable
Indicator Measure Support from
Literature
Form Section
Agency Costs
(b) Production cost
efficiency = Operating
expenses to net sales
ratio
Tirole (1986)
Singh and
Davidson (2003)
Moderating variable(s)
Firm
Characteristics
Firm Size Natural log of total assets Demsetz and Lehn
(1985)
Part D of Data
Collection Form
Firm Age
n log (number of years since
incorporation)
Ferris and Yan
(2009)
Source Researcher (2018)
66
Non-cash working capital includes inventories financial assets held to maturity
receivables and prepayments (current assets) and payables accrued expenses current
income tax liability (liabilities) For financial and investment firms non-cash working
capital includes prepaid lease rentals intangible assets deferred tax assets and retirement
benefit assets (assets) and taxation payable dividends payable deferred tax liabilities
and retirement benefit liabilities
Net sales in case of insurance firms are the equivalent of ldquoNet premium revenuerdquo For
commercial banks it is ldquoTotal operating incomerdquo which is composed of net interest
income add total non-interest income In case of investment firms it is ldquoIncomerdquo which
is comprised of rental income dividends and interest received and other incomes
38 Data Analysis
Data was analyzed using inferential statistics generated from statistical software using
95 confidence interval as in Aiken and West (1991) Descriptive statistics and
inferential statistics were both employed in data analysis Measures of dispersion and
measures of central tendency were used in profiling the respondent firms
Linear regression analyses were used in establishing the magnitude and nature of the
relationship between the study variables and in testing the relationships hypothesized
This study employed panel data regression analysis using the OLS technique where data
consist of cross-sectional and time series data which was combined into a panel data set
67
and projected with the use of panel data regression Regression analysis is a statistical
tool for examination of relations between variables
The value of the coefficient of determination (R2) indicates the extent of variation in the
dependent (explanatory) variable explained by the independent (predictor) variable Beta
values indicate the extent of variation in the explanatory variable that is attributed to the
extent of variation in the independent variable F ratio measures the model fit or simply
how sound the equation line established fits the data observed Interpretation of statistical
significance of each relationship hypothesized was based on β R2 t F and P ndash values
The study hypotheses were measured using two sets of regression equations The
regression analysis was done using STATA software
39 Choice of Panel Data Analysis Model
Panel data analysis can be categorized into several categories First are the pooled panels
which assume that there exist no distinctive qualities of characters in the dimension set
and there are no common effects across time Second are the fixed effects models which
assume existence of unique qualities of characters which are not the effects of random
variations and which donrsquot differ across time They assume changes in intercepts across
sets or time periods Lastly we have random effects models which have the assumption
that there are distinctive time constant qualities of characters which are the effects of
random variations and do not associate with the characters that are the effects of random
variation They donrsquot relate with the specific regressors The random effect models are
suitable if we want to draw conclusions about the entire population
68
The selection of a suitable model is contingent on the aim of investigation and
complications regarding the exogenity of dependent variables The fixed effects model
and the random effects model were not considered The pooled regression model was
suitable because of its assumption that all the organizations are similar The Pooled
regression model also has an assumption that the coefficients including the intercepts
are identical for all study items (firms) The fixed and random effect models provide for
individuality or heterogeneity among the organizations by letting each organization to
have own intercept that is time invariant
391 Effect of Free Cash Flows on Financial Performance
In establishing the effect of FCF on firm performance FCF is the predictor variable while
financial performance is the explanatory variable In the specification the standard errors
are clustered by firm and year Equation 31 entails panel data for 2006 to 2015
The regression model for hypothesis 1 is as follows
Ǭit = ά + βFCFit + euro -------------------------------------------------------------------------- (31)
Where Ǭ = Financial performance and it indicates the firm i at time t Financial
performance was measured using Tobinrsquos Q ά = Constant term β = Beta Coefficient
FCFit= Free cash flows for firm i at time t where t is the year 2006 to 2015
392 Free Cash Flows Agency Costs and Financial Performance
In analyzing hypothesis 2 the relevant variables are FCF (independent variable) agency
costs (intervening variable) and financial performance (dependent variable) Intervening
effects were examined using hierarchical (stepwise) multiple regression analysis As in
69
Baron and Kenny (1986) the fundamental concept of mediating variables is that in some
way they intervene in the process of transformation between response and stimuli Some
essential features of a mediating variable include the fact that the independent variable
shall affect the mediator variable (path a) the mediator shall affect the dependent
variable (path b) independent variable shall affect the dependent variable (path c) and
that once paths a and b are controlled path c becomes inconsequential or trivial The
mediation path is shown in figure 31 below
Figure 31 Path Diagram for Mediation effect of Agency Costs
c
lsquoa b
Agency costs
Source Researcher (2018)
Mediation was tested through the following three steps Step one entailed the dependent
variable Ǭ (financial performance) being regressed on the independent variable FCF
(Free cash flows) In step two the mediator AC (agency costs) was regressed on the
independent variable FCF In step three Ǭ is regressed on AC and FCF In each step the
120689 coefficient was tested to establish the size and direction of the correlation If a zero
order relationship exists and is significant then proceed to the next step Mediation exists
if FCF coefficient is significant in step 2 and also when the FCF coefficient is
significantly less in step 3 than in step 1
Free cash flows Financial performance
70
In testing intervention between FCF and financial performance the regression model is as
follows
Ǭit = ά + β1FCFit + euroit ------------------------------------------------------------------------ (32a)
AC it = ά + β1FCFit + euroit --------------------------------------------------------------------- (32b)
Ǭit = ά + β1AC it + β2FCF it + euroit ------------------------------------------------------------ (32c)
while controlling the effect of M on Y
Where ACit is the sum of Production cost efficiency (PCEit) and Asset utilization
efficiency (AUEit) divided by 2 (average) for the period 2006 to 2015
393 Free Cash Flows Firm Characteristics and Financial Performance
In testing hypothesis 3 the relevant variables are FCF firm characteristics (moderating
variable) and financial performance The regression models are as follows
Ǭit = ά + β1FCFit + β2AGEit + β3 (AGEit FCFit) + euro---------------------------------- (33a)
Ǭit = ά + β1FCFit + β2SIZit + β3 (SIZit FCFit) + euro------------------------------------- (33b)
Where SIZit = Firm size AGEit = Age of the firm
Equations 33a and 33b represent moderation models For purposes of avoiding possible
high multicollinearity the variables were centered and an interaction term added If the
predictor variable (FCF) and moderator variable (firm characteristics) are not significant
with the interaction term then complete moderation has happened Otherwise if the
independent and moderator variables are significant with the interaction term then
71
moderation has happened but the main effects are also significant (Aiken amp West 1991
and Mackinnon et al 2002)
In equations 33a and 33b above the variables associated with coefficient 1206893 were added
in the model to measure the effect of moderation The effect of moderation variables
firm size and age is characterized statistically as an interaction that affects the strength
and or direction of the correlation between explanatory variable (firm performance) and
the predictor variables (Baron amp Kenny 1986) The term in the model does not imply
multiplication but rather it denotes moderation
394 Relating all the Variables
Hypothesis 4 entails testing all the variables in the conceptual framework In testing for
the effect on financial performance panel data model was applied in measuring the
strength of the relations between the independent moderating intervening and dependent
variables To measure the joint effect of the moderating intervening and independent
variables intercept (constant) was used to determine the nature and extent of effect of all
the variables Additionally R2 was employed in determining the joint effect of the
moderating intervening and independent variables on the dependent variable (financial
performance) The resultant model is as follows
Ǭit = ά + β1FCFit + β2AC it + β3SIZit + β4AGEit + euro----------------------------------------- (34)
Where
72
34 represents the model for the effect on financial performance which utilized secondary
panel data for the period 2006 to 2015 and Ǭit represents financial performance
Table 32 A Summary of Statistical Tests of Hypotheses
Objective Hypothesis Analytical Model Interpretation
i To establish
the relationship
between FCF
and financial
performance of
firms listed at
the NSE
H01 FCF have no
significant effect on
financial performance of
firms listed at the NSE
ANOVA
regression
model
Panel data
regression
model
Test of
assumption
(normality and
multi-
collinearity)
Relationship exists if β is
significant
Relationship will be
determined based on R2
ii To assess the
influence of
agency costs on
the relationship
between FCF
and financial
performance of
firms listed at
the NSE
H02 Agency costs have
no significant
intervening effect on the
relationship between
FCF and financial
performance of firms
listed at the NSE
ANOVA
regression
model
Panel data
regression
model
Test of
assumption
(normality and
multi-
collinearity)
Mediation exists if FCF
coefficient is significant in
step 2 and also when in
step 3 the FCF coefficient
is significantly less than in
step 1
Regression co-efficient and
R2 will be used to affirm the
effect of agency cost on the
relationship between free
cash flow and firm
performance
iiiTo determine
the influence of
firm
characteristics
on the
H03a Firm age has no
significant moderating
effect on the relationship
between FCF and
financial performance of
ANOVA
regression
model
Panel data
regression
Moderation exists when the
interaction term between
firm characteristics and
FCF is a significant (p lt
005) predictor of firm
73
Objective Hypothesis Analytical Model Interpretation
relationship
between FCF
and financial
performance of
firms listed at
the NSE
firms listed at the NSE
H03b Firm size has no
significant moderating
effect on the relationship
between FCF and
financial performance of
firms listed at the NSE
model
Test of
assumption
(normality and
multi-
collinearity)
performance Furthermore
when FCF remains a
significant predictor while
firm characteristics become
insignificant
The intercept of the
regression model will
be used to tests the
influence of firm
characteristics on the
relationship between
free cash flow and firm
performance
Regression co-efficient and
R2 will be used to affirm the
effect of firm characteristics
on the relationship between
FCF and firm performance
iv To establish
the joint effect
of FCF agency
costs and firm
characteristics
on financial
performance of
firms listed at
the NSE
H04 There is no joint
effect of FCF agency
costs and firm
characteristics on
financial performance of
firms listed at the NSE
ANOVA
regression
model
Panel data
regression
model
Test of
assumption
(normality and
multi-
collinearity)
The intercept of the
regression model will be
used to tests the joint effect
of FCF agency costs and
firm characteristics on firm
performance
R2 will be used to get the
joint effect of independent
variables on Firm
Performance
74
310 Chapter Summary
The chapter discussed the study methodology employed and has highlighted the research
philosophy adopted clearly indicating that the study was anchored on the positivist
orientation since it is founded on existing theory and it articulates hypotheses which can
be verified Furthermore the positivist approach made it possible to make categorical
statements
The research design used has also been discussed The research design adopted was
cross sectional descriptive survey The population of the study has been highlighted as a
census of all firms listed at the NSE The chapter has also explained the data collection
methodology Reliability and validity considerations have been discussed
Operationalization of research variables has been deliberated showing a summary table
of the four variables of study indicators how the variables were measured support from
literature and the relevant section of the data collection form Data analysis has been
explained being regression methods using inferential statistics The chapter also
presented a tabulated summary of the research objectives their corresponding hypotheses
and analytical models
75
CHAPTER FOUR DATA ANALYSIS AND FINDINGS
41 Introduction
The study sought to establish the relationships between free cash flows agency costs
firm characteristics and performance of firms listed at the NSE Secondary data were
collected to test the relationships between the study variables This chapter presents an
analysis of the results More specifically the chapter has focused on descriptive statistics
reliability tests validity tests and correlation analysis
42 Pre-estimation Diagnostics
The study used OLS to estimate regression models The use of OLS is based on
normality linearity sampling adequacy and internal consistency of variables used in the
regression model Therefore normality linearity internal consistency and sampling
adequacy of these variables were required for the application of OLS This section
presents the test statistics to verify satisfaction of these assumptions by the data collected
and analyzed
421 Normality test
The Shapiro Wilk test for normality was conducted to test if the variables were normally
distributed The null hypothesis was that the data did not come from a population that
was normally distributed Therefore the alternate hypothesis is that the data originated
from a normally distributed population The test statistics for normality of each variable
are shown in table 41 below
76
Table 41 Normality Test
Variable Test Statistic
Z statistic P value
Free cash flows 1687 0082
Agency costs (AC) 1501 0160
Firm Age 0832 0129
Firm Size 1004 0076
Table 41 above shows that the p-values for all the variables were greater than 005 and
therefore we failed to reject the null hypothesis that the variables were normally
distributed at five per cent level of significance Therefore OLS could be applied on the
data considering that the data met the assumed conditions for application of multiple
regression analysis Field (2013) recommends use of a visual inspection of histograms or
Quantile ndash Quantile (Q-Q) plots to supplement use of tables and numbers These plots are
presented below
77
Figure 41 Q-Q Plot for Free cash Flows (2006 ndash 2015)
The results of the Q-Q plot in figure 41 above exhibits normality because most of the
observations seem to be in a straight line with a few cases appearing to be far away from
the line
Figure 42 Q-Q Plot for Agency Costs (AC) ndash 2006 to 2015
Figure 42 Q-Q plot above for agency costs (AC) reveals normality because the majority
of the observations seem to be along the straight line Outliers were investigated and
78
corrected or eliminated where necessary Large data sets can be analysed even if some
variables do not meet normality assumptions (Tabachnick amp Fiddel 2013)
Figure 43 Q-Q Plot for Firm Characteristics (Firm Age) ndash 2006 to 2015
The above Q-Q in figure 43 exhibits normality This is because most of the observations
seem to be in a straight line with a few cases appearing to be far away from the line
79
Figure 44 Q-Q Plot for Firm Characteristics (Firm Size) ndash 2006-2015
The Q-Q plot for firm size in figure 44 above indicates almost all the observations being
on a straight line This implies normality of the data Outliers were investigated and
corrected or eliminated where necessary
80
Figure 45 Q-Q Plot for Firm Financial Performance ndash 2006 to 2015
The Q-Q plot for financial performance in figure 45 above shows normality
422 Reliability Tests
Reliability tests were carried out through Cronbachs alpha tests in Statistical Package for
the Social Sciences (SPSS) with the findings presented below The results are shown in
Table 42 below Except for financial performance which shows a score of 0672 all the
other variables indicate reliability scores above 0700 which is the accepted score for
reliability (Bonett amp Wright 2014) The research instrument was therefore deemed
reliable
81
Table 42 Reliability Scores for Individual Variables
Variable Item Cronbachs Alpha
Free Cash Flow 0726
Firm Age 0798
Firm Size 0814
Agency Costs-AC 0828
Financial Performance 0672
423 Test for Linearity
In testing whether the variables were linearly associated a correlation analysis was done
The null hypothesis for the test was that there was no linear association The test statistics
for linear associations between the predictor variables and firm performance (explanatory
variable) are shown in table 43 below
Table 43 Test for Linearity
Reference Variable Firm
Performance
Coefficient of Correlation P-Value
Free cash flows 0506 0000
Agency costs (AC) 0521 0000
Firm Age 0619 0000
Firm Size 0590 0000
82
From table 43 above FCF shows a coefficient of correlation of 0506 agency costs (AC)
indicate 0521 firm age 0619 and finally firm size reveal 0590 All the values exceed
05000 meaning that there is a positive correlation Financial performance is the reference
variable All the p-values for the respective coefficients of correlation are 0000 which is
lower than 001
Thus all the predictor variables have a significant positive correlation with financial
performance at five per cent level of significance Therefore the predictor variables and
the explanatory variable (financial performance) move in the same direction which
suggests a linear relationship This positive significant correlation indicates that the
signage coefficients of the predictor variables in the simple regression models are
positive
424 Bartletts Test for Internal Consistency
The study tested the consistency of the items in the designed questionnaire to measure
several variables used in the research by applying the Bartlettrsquos test of sphericity The
null hypothesis of the test was that there was no internal consistency A failure to reject
the null hypothesis implies that the principal components which measure individual
sections have to be established using principal component analysis
Conversely rejecting the null hypothesis implies that all the elements are consistent
internally and that their composites can be applied in measuring the variables concerned
83
Test statistics for each of the sections involved in the linear regression analysis are
presented in table 44 below
Table 44 Bartlettrsquos Test
Variable Degrees of freedom Test statistic
Chi Square P value
Free cash flows 21 4382 0000
Agency costs (AC) 10 2665 0000
Firm age 10 1462 0000
Firm size 10 1621 0000
Financial performance 10 26940 0000
Table 44 above demonstrates that the null hypothesis which states that the variables are
not intercorrelated in each of the sections has to be rejected at five per cent significance
level This is confirmed by all the p-values being less than 001 for the variables
425 Multicollinearity Test
Multicollinearity occurs if there is a strong relationship between two or more independent
variables in a regression model Multicollinearity becomes an issue only in multiple
regressions and not for simple regression analysis Multicollinearity poses several
problems such as increases in standard errors of 120689 coefficients This means that the 120689s
have relatively higher variability across samples and less likely to represent the
population The second problem is limiting the size of R which measures multiple
correlation between the independent variables and the result and R2 the variance of the
84
result for which the independent variables explain making the second predictor to
explain very little of the remaining variance The other problem posed by
multicollinearity is that it reduces the importance of predictors making it hard to measure
the specific significance of a predictor (Field 2009)
To test whether the level of multicollinearity in the estimated models could be tolerated
Variance Inflation Factor (VIF) was used The rule of the thumb is that a value of VIF
that is less than 10 means that the level of multicollinearity can be tolerated (Robinson amp
Schumacker 2009) Since multicollinearity test is only applicable for multivariate
regressions only VIF statistics are reported since the regressions involve more than one
independent variable
Table 45 Multicollinearity Test
Variables VIF
Free Cash Flows 206
Agency costs (AC) 155
Financial Performance 252
Firm Size 109
Firm Age 168
Table 45 above shows that the VIF for all the models estimated ranged from 109 to 235
showing that the VIF results are between the acceptable ranges of 1 to 10 (Robinson amp
85
Schumacker 2009) This shows that the variables did not exhibit multicollinearity and
regression analysis could then be carried out
43 Descriptive Statistics
Table 46 Descriptive Statistics for Secondary Data ndash 2006 to 2015
Variables No Min Max Mean STD
Tobinrsquos Q (Ratio) 600 0867900 6447370 0526600 0634590
FCF (Ratio) 600 -0024530 3145000 16900 011270
AC(Ratio) 600 0003716 6329080 33166898 091646
SIZ (Ratio) 600 -1342200 2810600 04418300 0612300
AGE (n log of year
since incorporation)
600 140884 5400013 3904435 0287000
Table 46 above shows descriptive statistics for secondary data for a 10 year period from
2006 to 2015 Table 46 above gives the descriptive analysis for the main variables used
in the research It shows that the average Tobin Q is 05266 This suggests that on
average firms listed at NSE have recorded fairly impressive performance The Tobinrsquos Q
mean of 05266 suggests that the firmsrsquo market values are less than their book values
Since their market price to book value ratio is less than one the market expects the value
of these firms to reduce in the future because the market price also takes any future
earnings into account at the current price
86
For FCF the average is 169 meaning that most firms listed at NSE have low FCF The
mean for AC was found to be 33166898 indicating a high asset turnover and operating
expenses to sales ratio The average age of the firm is indicated by the log of 3904435
This shows that the firms listed at the NSE are relatively old On average the mean firm
size of listed firms at the NSE is indicated by a log of 04418300 indicating that the firms
have a fairly high asset value
44 Chapter Summary
This chapter presented information on pre-estimation diagnostics These include
normality test reliability test reliability test test for linearity Bartlettrsquos test for internal
consistency and multicollinearity test The chapter also gave results of analysis tests run
on the data that was collected These include descriptive statistics Results were indicated
by standard deviations mean scores minimum scores and maximum scores
87
CHAPTER FIVE TESTS OF HYPOTHESES AND DISCUSSION
51 Introduction
This section presents the hypotheses of the study which are derived from the research
objectives and the results of the hypothesized relationships This study was informed by
the premise that there exists a correlation between FCF and financial performance and
that this relationship is intervened by agency costs and is moderated by firm
characteristics
52 Correlation Analysis
The relationship between strength and direction of the variablesrsquo relationship was
investigated using the Pearson Product Moment correlation coefficient This was
significant so as to assess whether any relationship exists between the variables before
proceeding with further analyses The study employed the following classification strong
if 07 and above moderate if 04 but less than 07 and weak if 0 and less than 04
Apart from analysing the direction and strength of association correlation analysis was
also used to test the presence of multicollinearity between the independent variables
Multicollinearity exists if independent variables are highly correlated (r = or greater than
075) Multicollinearity reduces the importance of predictors making it difficult to assess
the individual importance of a predictor Multicollinearity may lead to poor regression
modelling (Dancey amp Reidy 2011) The results in Table 51 below show that there is no
multicollinearity since all the predictor coefficient results are below 075
88
Table 51 Pearson Product-Moment Correlations among the Dependent
Independent Intervening and Moderating Variables
Firm
performance
Free
cash
flows
Agency
costs
Firm
size
Firm
age
Pearson
Correlation
Firm performance 1 0702 0519 0405 0126
Free cashflows 1 0129 0135 0245
Agency costs 1 0198 0322
Firm size 1 0418
Firm age 1
Source Researcher (2018)
Correlation is significant at the 005 level (2-tailed)
Correlation is significant at the 001 level (2-tailed)
As indicated in Table 51 above there is a strong positive correlation between financial
performance and FCF (r = 0702) On the other hand the correlation between financial
performance and firm size and with agency costs is moderate and positive (r = 0405 and
0519 respectively) The correlation with firm age is weak but positive (r = 0126) All the
correlations were significant at 005 except firm age The relationships between financial
performance and FCF agency costs firm size and firm age moved in the same direction
as hypothesized in the study These variables were further assessed using regression
analysis as shown in section 53 below
89
53 Hypotheses Testing Using Regression Analysis
In order to establish these relationships four hypotheses were formulated and tested For
purposes of testing the hypotheses different regression models were run First finding
out the correlation between FCF and financial performance secondly tests to determine
the intervening effect of agency costs on the correlation between FCF and financial
performance thirdly tests were carried out to establish the moderating effect of firm
characteristics on the relationship between FCF and financial performance and lastly to
find out the joint effect of FCF agency costs and firm characteristics on financial
performance of NSE listed firms
In order to ascertain these relationships the hypotheses were formulated and tested using
simple and multiple linear regression analyses The hypotheses were tested at 95 percent
confidence level (ά = 005) while p-values were used to establish individual significance
of the hypothesized relationships The significance and general robustness of the model
was assessed using F statistic and p-values for significance Overall F statistic value
greater than 1 signifies goodness of fit P-values greater than or equal to 005 indicated
that we would fail to reject the null hypothesis while those with p-values less than 005
signified that the null hypothesis would be rejected ANOVA and panel data analyses
results have been presented and discussed below
90
531 Free Cash Flows and Financial Performance
The study sought to determine the effect of FCF on financial performance and it
employed panel data design Panel data was used in establishing financial performance
which was measured by Tobinrsquos Q (equity market value equity book value) FCF on the
other hand was measured as Net income + depreciation and amortization - CAPEX -
change in non-cash working capital + net borrowing)Net sales The study sought to
identify the effect of FCF on firm financial performance The following hypothesis was
developed
H01 FCF have no significant effect on financial performance of firms listed at the NSE
Maximum likelihood regression model was employed in data analysis The test statistics
regression results with financial performance as the dependent variable and FCF as the
independent variable are reported in Table 52(a) below
Table 52 Panel Data Results for Free Cash Flows and Financial Performance
Model Summary
Model R R2 Adjusted R
2 Standard
Error
1 04890 02391 02106 02258
a Predictors (Constant) Free cash flows
b Dependent Variable Financial performance
91
(a) ANOVA
Model Sum of
Squares
DF Mean
Square
F Sig
Regression 2689 1 2689 5376 0017
Residual 32483 599 0054
Total 35172 600
a Predictors (Constant) Free Cash Flows
b Dependent variable Financial performance
(c) Regression Co-efficients
Model Unstandardized Coefficients Standard
Coefficients
t Sig
B Standard Error Beta
Constant 048011 0011662 020 7229 0000
FCF 0206 00254 0265 54238 00023
Dependent variable Financial performance
The model coefficients are shown in Table 52(c) above The results indicate that FCF is
a significant predictor because the p value is 00023 which is lower than 005 (level of
significance) Furthermore results indicate R2
of 02391 which implies that FCF explain
2391 of the variability in firm financial performance The results have rejected the null
hypothesis implying that FCF have a statistically significant positive effect on financial
performance of firms listed at the NSE The regression model that explains the variation
in financial performance as a consequence of FCF is as shown below
92
Ǭit = 048011 + 0206FCFit
Where
Ǭ = Firm financial performance
FCF =Free cash flows
532 Free Cash Flows Agency Costs and Financial Performance
This study sought to ascertain the effect of agency costs on the relationship between FCF
and financial performance The corresponding hypothesis is
Hypothesis 2 Agency costs have no significant intervening effect on the relationship
between free cash flows and financial performance of firms listed at the Nairobi
Securities Exchange
The study employed secondary panel data in determining the results under this
hypothesis Secondary data was obtained from financial statements and measured agency
costs using asset utilization efficiency (salesassets) and production cost efficiency
(operating expensessales) The values were obtained separately (AUE and PCE) and
added together then divided by two to obtain agency costs (AC)
In testing for mediation intervention first the relationship between the dependent
variable (financial performance) and the independent variable (FCF) was carried out
ignoring the intervening variable (agency costs-AC) This was step number 1 and is
similar to the regressions performed under hypothesis one under section 52 The model
should indicate significance where p = lt005
93
Next is the regression analysis between FCF (the independent variable) and agency costs
(AC) which is a combination of production cost efficiency and asset utilization efficiency
as intervening variable ignoring the financial performance (the dependent variable) The
FCF and AC relationship should be significant (p=lt005) if one is to move to step 3
Under step 3 the regression analysis is done with financial performance as the dependent
variable and both AC and FCF as independent variables Regression results for step 1 are
same as shown in Table 51 earlier Results from step 1 shown in Table 51 indicate the p
value of 00023 and is therefore significant The regression model is specified as Ǭit =
048011 + 0206FCFit This necessitates moving to step 2 the results of which are
depicted in Table 53 below
Table 53 Panel Data Results of Agency Costs as the Dependent Variable and Free
Cash flows as the Independent Variable
a) Model Summary
Model R R Square Adjusted R Square Std Error of the Estimate
1 03356 01126 00958 02290
a Predictors (Constant) FCF
b Dependent Variable Agency costs (AC)
94
b) ANOVA
Model
Sum of
Squares df
Mean
Square F Sig
Regression 6881 1 6881 059 46181 0053
Residual 89226 599 0149 043
Total 96107 600
a Predictors (Constant) FCF
b Dependent Variable Agency costs (AC)
c Coefficients
Model
Unstandardized
Coefficients
Standardized
Coefficients
t Sig B Std Error Beta
1 (Constant) 0117 03042 3840 023
FCF 083 0137 265 2772 048
a Dependent Variable Total Non-Performance
Results in Table 53(c) above indicate that FCF is a significant predictor of AC as shown
by Sig = lt005 Table 53(a) above shows R square of 01126 which implies that 1126
variations in AC are explained by changes in FCF The regression model for the
relationship between FCF and AC ignoring financial performance is given below
AC = 0117 + 0083FCF
95
Since the relationship between FCF and AC is significant (as depicted by Sig = 0048)
we can now move to step 3 where financial performance is the dependent variable while
FCF and AC are predictor variables The results of step 3 are displayed in Table 54
below
Table 54 Panel Data Results of Financial Performance as the Dependent Variable
while Agency Costs and Free Cash flows are the Independent Variables
a Model Summary
Model R R Square Adjusted R Square Std Error of the Estimate
1 07157 05122 04613 02288
a Predictors (Constant) AC FCF
b Dependent Variable Financial Performance
a ANOVA
Model Sum of Squares df Mean Square F Sig
1 Regression 14725 2 73625 62606 0000
Residual 106258 598 01776
Total 120983 600
a Predictors (Constant) AC FCF
b Dependent Variable Financial Performance
96
c Coefficients
Model
Unstandardized Coefficients
Standardized
Coefficients
t Sig B Std Error Beta
1 (Constant) 0187 0342 44409 021
FCF 211 0179 227 13380 071
AC 148 042 282 62376 015
a Predictors (Constant) AC FCF
b Dependent Variable Financial Performance
The findings in Table 54 above indicate that financial performance is significantly
predicted by AC (p =0015 which is lt005) On the contrary FCF does not significantly
predict financial performance This is depicted by (p = 0071 which is gt005) From the
regression results above Adjusted R squared changed from 02106 to 04613 showing a
significant increase in the relationship between FCF and financial performance
This change is attributed to the intervening variablersquos effect It is therefore concluded that
agency costs (AC) have a positive statistically significant intervening effect on the
relationship between FCF and financial performance The null hypothesis that Agency
costs have no significant intervening effect on the relationship between free cash flows
and financial performance of firms listed at the Nairobi Securities Exchange is therefore
rejected The resultant regression model is as shown below
Ǭit = 0187 + 0148ACit+0211FCFit
97
533 Free Cash Flows Firm Characteristics and Financial Performance
This study sought to identify the effect of firm characteristics on the relationship between
FCF and financial performance The corresponding hypothesis is
Hypothesis 3 Firm characteristics have no significant moderating effect on the
relationship between free cash flows and financial performance of firms listed at the
Nairobi securities exchange
The study employed secondary panel data in determining the results under this
hypothesis Since firm characteristics (age and size) are additive each one of them was
tested separately Therefore under this hypothesis two sub-hypotheses were developed
as follows
H03a Firm age has no significant moderating effect on the relationship between free cash
flows and financial performance of firms listed at the Nairobi securities exchange
H03b Firm size has no significant moderating effect on the relationship between free cash
flows and financial performance of firms listed at the Nairobi securities exchange
Secondary data was obtained from financial statements and measured firm characteristics
using firm size and age of the firm Firm size was measured using the natural log of total
assets while age of the firm was measured using the natural log of number of years since
incorporation The moderating effect of firm size and firm age on the relationship
between FCF and firm financial performance was assessed using the centered approach
as by Wu and Zumbo (2008)
98
This involves the following steps Step 1 involves the independent variables and the
moderator variables being regressed against firm financial performance Step 2 on the
other hand entails introduction of the centered approach in the model with the predictor
variable moderating variable and the interaction term being factored into the model The
regression results are shown in Table 55 below
Table 55 Panel Data Results for Financial Performance as the Dependent Variable
and FCF and Firm Age as the Predictor Variables
a Model Summary
Model R R Square Adjusted R Square
Std Error of the
Estimate
1 05894 03474 03109 1573
a Predictors (Constant) FAGE_CENTRED FCF_CENTRED
b Dependent Variable Financial Performance
b ANOVA
Model Sum of Squares df Mean Square F Sig
1 Regression 51189 2 25594 8531 0000
Residual 20440 598 003
Total 255589 600
a Predictors (Constant) FAGE_CENTRED FCF_CENTRED
b Dependent Variable Financial Performance
99
c Coefficients
Model
Unstandardized
Coefficients
Standardized
Coefficients
t Sig B Std Error Beta
1 (Constant) 0041 11662 28109 0044
FCF 1306 0144 088 44238 0023
AGE 201 02607 353 6120 0002
a Dependent Variable Financial Performance
Results in Table 55(a) above show R2 of 03474 and Adjusted R
2 of 03109 Table 55(c)
above shows the coefficients of FCF and AGE as 01306 and 0201 respectively The p
values for FCF and AGE are 0023 and 0002 respectively indicating statistical
significance because each of them is less than 005 Results for Step 2 are displayed in
Table 56 below where the interaction term is introduced
Table 56 Panel Data Results for Financial Performance as the Dependent Variable
and FCF and Firm Age as the Predictor Variables Centered Approach
a Model Summary
Model R R Square Adjusted R Square Std Error of the Estimate
1 06825 046580 042170 041054
a Predictors (Constant) FCF_FAGE_CENTRED FAGE_CENTRED FCF_CENTRED
b Dependent Variable Financial Performance
100
b ANOVA
Model Sum of Squares df Mean Square F Sig
1 Regression 12034 3 401130 29957 0000
Residual 79950 597 01339
Total 91984 600
a Predictors (Constant) FCF_FAGE_CENTRED FAGE_CENTRED FCF_CENTRED
b Dependent Variable Financial Performance
c Coefficients
Model
Unstandardized
Coefficients
Standardized
Coefficients
t Sig B Std Error Beta
1 (Constant) 0065 00245 41263 0001
FCF_CENTRED 0207 00014 0293 74638 0000
AGE_CENTRED 0094 0091 0351 1986 0047
FAGE_CENTRED 0045 002 00204 2230 0027
a Predictors (Constant) FCF_FAGE_CENTRED FAGE_CENTRED FCF_CENTRED
b Dependent Variable Financial Performance
Results from Table 56 above shows R squared change from 03109 to 042170 which is a
change of 01108 (1108 change) which is occasioned by the interaction term This is
also confirmed by the p values which are all less than 005 meaning that firm age
101
positively and significantly moderates the relationship between FCF and financial
performance The regression model for moderation effect of firm age is as shown below
Ǭit = FCFit + AGEit + 0045FAGEit
Table 57 Panel Data Results for Financial Performance as the Dependent Variable
and FCF and Firm Size as the Predictor Variables
a Model Summary
Model R R Square Adjusted R Square Std Error of the Estimate
1 06481 04200 03902 03198
a Predictors (Constant) SIZE FCF
b Dependent Variable Financial performance
b ANOVA
Model
Sum of
Squares df Mean Square F Sig
1 Regression 8447 2 4224 120685 00000
Residual 21456 598 0035
Total 29903 600
a Dependent variable Financial performance
102
c Coefficients
Model
Unstandardized
Coefficients
Standardized
Coefficients
t Sig B Std Error Beta
1 (Constant) 009 002109 53270 00014
FCF 0107 003104 0178 74238 00000
SIZE 0223 009100 1444 19860 00470
a Dependent Variable Financial Performance
Results in Table 57(a) above show R2 of 04200 and Adjusted R
2 of 03902 Table 57(c)
above shows the coefficients of FCF and SIZE as 0107 and 0223 respectively The p
values for FCF and SIZE are 0000 and 0047 respectively indicating statistical
significance because each of them is less than 005 Results for Step 2 are displayed in
Table 58 below where the interaction term is introduced
Table 58 Panel Data Results for Financial Performance as the Dependent Variable
and FCF and Firm Size as the Predictor Variables Centered Approach
a Model Summary
Model R R Square Adjusted R2 Std Error of the Estimate
1 07853 06167 05654 02208
a Predictors (Constant) FCF_CENTRED SIZE_CENTRED FSIZE_CENTRED
b Dependent Variable Financial Performance
103
b ANOVA
Model Sum of Squares df Mean Square F Sig
1 Regression 3138 1 3138 17119 00011
Residual 109846 599 01833
Total 112984 600
a Predictors (Constant) FCF_CENTRED FCF_FSIZE_CENTRED FSIZE_CENTRED
b Dependent Variable Financial Performance
c Coefficients
Model
Unstandardized
Coefficients
Standardized
Coefficients
t Sig B Std Error Beta
1 (Constant) 0144 00245 4826 0021
SIZE_CENTRED 0048 00140 0392 2586 0041
FCF_CENTRED 0155 00140 0132 3938 0003
FSIZE_CENTRED 0227 00327 0472 2679 00981
a Dependent Variable Financial Performance
Results from Table 58 above shows R squared change from 03902 to 05654 which is a
change of 01752 (1752 change) which is occasioned by the interaction term This is
also confirmed by the p values which are all less than 005 meaning that firm size
moderates the relationship between FCF and financial performance The regression
model for moderation effect of firm size is as shown below
104
Ǭit = FCFit + SIZit + 0227FSIZEit
The moderating effect was established as in Stone-Romero and Liakhovitski (2002)
which involves assessing the effects on the dependent variable (non-financial
performance) of the moderating variables (firm size and age) and dependent variable
(FCF) Regression results with non-financial performance as the dependent variable firm
characteristics (firm size and age) and FCF as predictors as shown below
534 Free Cash Flows Agency Costs Firm Characteristics and Financial
Performance
This study sought to establish the joint effect of FCF agency costs and firm
characteristics on firm performance The corresponding hypothesis is as follows
Hypothesis 4 There is no joint effect of free cash flows agency costs and financial
characteristics on performance of firms listed at the Nairobi Securities Exchange
Secondary data was obtained from financial statements The independent variable is FCF
intervening variable is agency costs (AC) The moderating variable is firm characteristics
which are firm size and age of the firm Financial performance was measured using
Tobinrsquos Q and is the dependent variable Panel data results are presented in table 59
below
105
Table 59 Panel Data Results for Free Cash Flows Agency Costs Firm
Characteristics and Financial Performance
a Model Summary
Model R R Square Adjusted R Square Std Error of the Estimate
1 08780 07708 06645 05432
a Predictors (Constant) FCF AC Firm Size Firm Age
b Dependent variable Financial performance
b ANOVA
Model Sum of Squares df Mean Square F Sig
1 Regression 7708 2 3854 22807 0012
Residual 101336 598 0169
Total 7934 600
a Predictors (Constant) FCF AC Firm Size and Firm Age
b Dependent Variable Financial Performance
106
c Coefficients
Model
Unstandardized
Coefficients
Standardized
Coefficients
t Sig B Std Error Beta
1 (Constant) 065 0011 3826 0033
FCF 0144 0024 0081 4938 0020
Age 0107 0027 0150 1233 0074
Size 0231 0069 0102 6586 0010
AC 0314 0034 0259 2901 0032
a Predictors (Constant) FCF AC Firm Size and Firm Age
b Dependent Variable Financial Performance
From the panel study results the intercept (constant) is 0065 with a statistically
significant p-value of 0033 FCF have a coefficient value of 0144 with a p-value of 002
which is significant The findings indicate that FCF still have positive effect on the
performance of the listed firms and the effect is still significant even when control
variables are introduced in the model The effect of agency costs is also positive and
significant at p value 0032 Firm size shows a positive and significant joint effect (p
value is 001) while age has a positive effect but the effect is not significant (p value is
0074) The R2 is 07708 indicating that 7708 of changes in financial performance are
accounted by the joint effect of FCF AC and firm characteristics (size and age)
107
Overall the joint effect of FCF agency costs and firm characteristics on performance of
firms listed at NSE indicates a positive significant relationship The null hypothesis is
therefore rejected There is a significant joint effect of FCF agency costs and firm
characteristics on performance of firms listed at the NSE The regression model that
explains the variation in firm performance as a result of the joint effect of FCF agency
costs and firm characteristics is shown below
Ǭit FCFit +ACit +SIZit +AGEit
Where Ǭit = Financial Performance
FCF= Free Cash flows
AC = Agency Costs (AC)
SIZ = Firm Size
AGE = Firm Age
54 Discussion
The study had four hypotheses with hypothesis 3 having two sub hypotheses one
focusing on firm age and the other on firm size The results under each objective are
discussed here-below
541 The Influence of Free Cash Flows on Financial Performance
The first objective of the study was to establish the influence of FCF on the performance
of firms listed at the NSE This was achieved through analyzing the audited financial
statements of the listed companies (panel data)
108
The results indicate that there is a significant positive relationship between FCF and firm
performance The findings for the influence of FCF on financial performance showed a
statistically significant positive relationship These results are consistent with other
studies on FCF and firm performance For instance Kargar and Ahmadi (2013) found a
positive relationship between FCF and performance of firms listed at the Tehran stock
exchange Similarly Gregory (2005) established that the greater the FCF the better the
performance in merger undertakings Szewczyk et al (1996) and Chang et al (2007)
concluded that shareholders favour businesses that have FCF
In his study on the effects of agency costs on performance of firms listed at the NSE
Wambua (2013) also found a positive relationship between FCF and firm performance
The findings show that increasing FCF disposes more resources to firm managers who
then deploy the resources towards generating more revenues and profits for the firm
The findings are inconsistent with the FCF hypothesis postulated by Jensen (1986) which
suggests that agency conflicts between firm managers and shareholders become more
severe in the presence of substantial FCF thereby negatively affecting firm performance
Furthermore these findings reject the agency theory which was proposed by Jensen and
Meckling (1976) The agency theory is based on the premise that the goal of firm
managers is to maximize their personal wealth and other self-interests instead of
maximizing the wealth of shareholders
On the contrary the findings seem to support the stakeholder theory which advances that
firm management has a network of relationships and therefore corporate accountability
109
includes a broad range of stakeholders such as suppliers business associates financial
institutions the government customers among others Similarly the findings are
consistent with the stewardship theory The theory emphasizes the role of firm managers
as being that of stewards who integrate their goals as part of the firmrsquos goals
542 The Influence of Agency Costs on the Relationship between Free Cash Flows
and Financial Performance
The second objective was to assess the influence of agency costs on the relationship
between FCF and financial performance of firms listed at the NSE The study
hypothesized that agency costs have no significant intervening effect on the relationship
between FCF and performance of firms listed at the NSE The assessment of agency
costs FCF and financial performance was achieved by reviewing financial statements of
companies listed at the NSE The results indicate a statistically significant positive
intervening effect of agency costs on the relationship between FCF and financial
performance
The results reveal that agency cost measure is positive and significantly associated with
firm performance This can be attributed to the role of internal control system in reducing
agency costs associated with residual loss due to suboptimal managerial actions These
findings are supported by Kangarluei Motavassel and Abdollahi (2011) and Khidmat
and Rehman (2014) who established a statistically significant positive effect of agency
costs on the relationship between FCF and firm performance
110
Similarly Lin and Lin (2014) found a positive statistically significant effect of agency
costs on the relationship between FCF and firm performance in the Australian takeover
market These findings are contrary to the argument that substantial FCF increases
agency costs which subsequently affects firm performance negatively The FCF
hypothesis and the agency theory are therefore not supported by the findings On the
contrary the stakeholder theory and the stewardship theory are supported by the results
543 The Influence of Firm Characteristics on the Relationship between Free Cash
Flows and Financial Performance
The third objective of the study was to determine the moderating effect of firm
characteristics on the relationship between FCF and performance of firms listed at the
NSE The firm characteristics evaluated were firm size and age of the firm An
assessment of audited financial statements was carried out to measure FCF firm
characteristics (firm size and age of the firm) and firm financial performance
Results indicate firm size exhibiting a statistically significant positive moderating effect
on the relationship between FCF and firm financial performance Similarly firm age
shows a positive moderating effect on the relationship between FCF and firm financial
performance and the effect is also statistically significant The positive effect of firm size
confirms the results of the study conducted by Nyamweno and Olweny (2014) which
found firm size to be positively related to ROA This indicates that larger firms report
higher financial performance as compared to smaller firms Abbasi and Malik (2015)
clarified the relationship between firm size and financial performance by concluding that
111
larger firms had higher likelihoods of obtaining credit from financial institutions and
would get loans at lower rates because they have superior credit worth ratings and have
lower risk of bankruptcy
Heydari et al (2014) argue that firm characteristics such as firm age and size can expose
a firm to more agency costs related to management and growth prospects thus depressing
the effect of FCF on firm performance This result can be viewed from the perspective of
liability of obsolescence in which organizational performance declines with age
The decline can be attributed to environmental drift resulting from rivalry and
competition and organizational inertia the syndrome of too big or too old to change
Liabilities of obsolescence arise from growing external mismatch with the environment
The results indicate positive effects of firm characteristics on the relationship between
FCF and firm financial performance The results in this study support the RBV theory
which is concerned with internal firm specific factors and their effect on performance
The RBV theory views the firm as a bundle of resources which are combined to create
organizational capabilities that it can use to earn more than average profitability If well
developed competences from these resources become a source of competitive advantage
(Grant 1991)
112
544 The Joint Effect of Free Cash Flows Agency Costs and Firm Characteristics
on Financial Performance
The last objective of the study was to establish the joint effect of FCF agency costs and
firm characteristics on financial performance of firms listed at the NSE Financial
performance was measured by Tobinrsquos Q Firm characteristics that were considered in
the study were firm size and age of the firm Panel data results indicate that there is a
positive statistically significant joint effect of FCF agency costs and firm characteristics
on firm performance These findings support results by Chen et al (2016) who conclude
that large firms which have been in existence for a long time tend to have structures in
place to reduce agency costs
The findings are also similar to Wang (2010) who concluded that there exists a positive
joint effect of firm size FCF and agency cost on firm performance Results of the study
by Jabbary Hajiha Labeshka and Hassanpour (2013) are confirmed by these findings
which reveal that FCF have a positive significant effect on firm performance even with
the inclusion of control variables of agency costs and firm characteristics All the agency
cost coefficients indicate statistically significant positive effects
Emami et al (2014) observe that internal control systems provide an overarching
framework that reduces agency costs and hence positively affecting firm performance
These findings are also similar to Dawar (2014) who established that firm monitoring
costs impact positively on firm performance In testing financial performance firm size
had a coefficient of 0231 and p-value of 001 when jointly tested with other variables
113
indicating that firm size has a positive effect on firm performance even with control
variables introduced
These findings are supported by Banafa (2016) who concluded that firm size affects
performance of firms significantly albeit with small effect when moderated by other
variables In testing financial performance firm age revealed a positive but not
statistically significant effect with a coefficient of 0107 and a p-value of 0074 These
results contradict with Brouwe et al (2005) who concluded that productivity growth
rates are negatively correlated with firm age
Overall the joint effect of FCF agency costs and firm characteristics on performance of
firms listed at NSE indicates a positive significant relationship We therefore reject the
null hypothesis which states that there is no significant joint effect of free cash flows
agency costs and firm characteristics on financial performance of firms listed at the NSE
These results have rejected the FCF hypothesis and the agency theory This is because
FCF firm characteristics and agency costs have indicated a positive joint effect on firm
performance On the other hand the stewardship theory the stakeholder theory and the
RBV theory seem to be supported by the findings The organisational theory which
explains firm size in relation to profitability as well as organizational transaction costs
agency costs and span of control also seems to be supported by the findings of this study
114
Table 510 Summary of Tests of Hypotheses Results and Conclusions
Hypothesis R2
(p-value) Conclusion
H01 FCF have no significant
effect on financial
performance of firms listed at
the NSE
02391
00023
Null Hypothesis rejected
H2 Agency costs (AC) have
no significant intervening
effect on the relationship
between FCF and financial
performance of firms listed at
the NSE
05122
0031
Null Hypothesis rejected
H03a Firm age has no
significant moderating effect
on the relationship between
FCF and financial
performance of firms listed at
the NSE
04658
0047
Null Hypothesis rejected
H03b Firm size has no
significant moderating effect
on the relationship between
FCF and financial
performance of firms listed at
the NSE
06167
0041 Null Hypothesis rejected
H04 There is no joint effect of
FCF agency costs and firm
characteristics on financial
performance of firms listed at
the NSE
07708
0033
Null Hypothesis rejected
115
55 Summary and Presentation of Empirical Models
The chapter presented the study results from analytical tests conducted to verify the study
hypotheses The findings of the statistical analyses carried out were presented and
interpreted The study established that FCF have a statistically significant positive effect
on financial performance This relationship is intervened by agency costs and moderated
by firm characteristics
Agency costs have a statistically significant positive intervening effect on the relationship
between FCF and financial performance On the other hand firm characteristics have a
statistically significant negative moderating effect on the relationship between FCF and
firm financial performance Finally the study established that there is a joint effect of
FCF agency costs and firm characteristics on financial performance of firms listed at the
NSE The joint effect is positive and statistically significant The empirical conceptual
model depicting the relationships between the variables is presented in figure 51 below
116
Figure 51 Revised Empirical Model ndash Financial Performance
Independent Variable Dependent Variable
Intervening Variable H1 Ǭit = 048011 + 0206FCFit
H2 Ǭit = 0187 + 0148ACit + 0211FCFit
H4 Ǭit = 065 + 00144FCFit + 0314ACit + 0231SIZit + 0107AGEit
Ǭit = 065+0207FCFit+0094AGEit + 0045FAGEit
H3 Ǭit = 0144+0155FCFit +0048SIZit+ 0227FSIZit
Moderating Variable
Source Researcher (2018)
Free Cash Flows
FCFit=(Net income
(PAT)+depreciation and
amortization - CAPEX -
change in non-cash
working capital + net
borrowing)Sales
Firm Financial
Performance
- Tobinrsquos Q
Agency Costs
- Asset utilization efficiency AC
- Production cost efficiency
Firm Characteristics
- Firm Size
- Age of the firm
117
CHAPTER SIX SUMMARY OF FINDINGS CONCLUSIONS AND
RECOMMENDATIONS
61 Introduction
This study investigated the relationship between FCF agency costs firm characteristics
and financial performance of firms listed at the NSE The independent variable is FCF
while agency costs are intervening variables and firm characteristics are moderating
variables Financial performance is the dependent variable The chapter has summarized
the findings of the study and made conclusions upon which recommendations are drawn
Discussions conclusions and recommendations have been presented These have been
discussed in light of other studies that have investigated the same or similar variables in
other settings The chapter ends with the study implications to theory policy and
practice and recommendations for further research
The study had four objectives upon which conclusions are aligned to The objectives
were first to stablish the relationship between free cash flows and financial performance
of firms listed at the NSE second to assess the influence of agency costs on the
relationship between free cash flows and financial performance of firms listed at the
NSE third to determine the influence of firm characteristics on the relationship between
free cash flows and financial performance of firms listed at the NSE and lastly to
establish the joint effect of free cash flows agency costs and firm characteristics on
financial performance of firms listed at the NSE
118
62 Summary of Findings
This study was founded on the premise that FCF have an influence on financial
performance and that the relationship between the two is intervened by agency costs and
moderated by firm characteristics A conceptual framework was therefore developed and
the study empirically tested hypotheses which were guided by the study objectives The
first objective of the study was set to find out the relationship between FCF and
performance of firms listed at NSE The findings reveal that FCF have a statistically
significant positive effect on performance of firms listed at the NSE
This finding is supported by the coefficient of determination of 02391 which indicates
the variations in firmsrsquo financial performance (explanatory variable) explained by FCF
(predictor variable) The effect of FCF was established to be statistically significant and
therefore the null hypothesis was rejected Therefore we reject the null hypothesis that
FCF have no statistically significant effect on performance of firms listed at the NSE
The results are inconsistent with the FCF hypothesis advanced by Jensen (1986) which
proposes that agency conflicts between firm managers and shareholders become more
severe in the presence of substantial FCF thereby negatively affecting financial
performance Additionally these findings reject the agency theory which was suggested
by Jensen and Meckling (1976) These results are consistent with Wambua (2013) who
found a positive relationship between FCF and firm performance The findings imply that
increasing FCF avails more resources to firm managers who utilize the funds in
generating more wealth
119
The second objective of the study sought to assess the influence of agency costs on the
relationship between FCF and financial performance of firms listed at the NSE The
findings indicate that agency costs have a positive statistically significant intervening
effect on the relationship between FCF and financial performance of firms listed at the
NSE Thus the study rejected the null hypothesis which states that agency costs have no
significant intervening effect on the relationship between FCF and financial performance
of firms listed at NSE
These findings support Lin and Lin (2014) who found a positive statistically significant
effect of agency costs on the relationship between FCF and firm performance in the
Australian takeover market These findings are contrary to the FCF hypothesis suggested
by Jensen (1986) and the agency theory postulated by Jensen and Meckling (1976)
However the stakeholder theory advanced by Freeman (1984) and the stewardship theory
developed by Donaldson and Davis (1991) seem to be supported by the findings
The third objective of the study sought to establish the influence of firm characteristics on
the relationship between FCF and financial performance of firms listed at the NSE
Results indicate that firm characteristics (both firm size and age) have a positive
significant moderating effect on the relationship between FCF and financial performance
of firms listed at the NSE These findings contradict Heydari et al (2014) who argue that
firm characteristics such as firm age and size can expose a firm to more agency costs
related to management and growth prospects thus depressing the effect of FCF on firm
performance
120
The fourth and final hypothesis sought to establish the joint effect of FCF agency costs
and firm characteristics on financial performance of firms listed at the NSE Results show
positive coefficients for all the variables which means that as FCF agency costs and firm
characteristics jointly increase performance of the NSE listed firms also increases Firm
characteristics show a positive statistically significant joint effect on firm financial
performance and also FCF and agency costs show a positive statistically significant joint
effect on firm financial performance The results have rejected the FCF hypothesis and
the agency theory On the other hand the results seem to support the stewardship theory
the stakeholder RBV theory and the organisational theory
63 Conclusions
Based on the findings of the study FCF is fundamental to firm performance because it
allows firms to invest and grow thereby improving performance Firms should strive to
increase FCF since it has a statistically significant positive effect on financial
performance Similarly firms should invest more in firm monitoring which according to
the findings in this study the benefits derived from investing in firm monitoring
(improved firm performance) outweigh the agency costs of investing therein (in firm
monitoring) This study has found no evidence supporting the FCF hypothesis as
suggested by Jensen (1986) and therefore firms listed at the NSE are not consistent with
the FCF hypothesis
Consistent with these findings Nyamweno and Olweny (2014) found firm size to be
positively related to financial performance Similarly Dawar (2014) found that firm
121
monitoring costs impact positively on financial performance Conflicting with literature
(Kwanum amp Lorpev 2012) firm age indicated a positive effect on the relationship
between FCF and firm financial performance However the findings of this study are
consistent with Banafa (2016) who concluded that firm size affects firm performance
significantly when moderated by other variables It is therefore confirmed that there
exists a strong relationship between FCF agency costs firm characteristics and financial
performance of firms listed at the NSE
64 Contributions of the Study
The study has contributed to knowledge in the areas of FCF and the agency problem firm
characteristics and firm performance More specifically the study has contributed to
theory policy and practice
641 Contribution to Theory
The results of this study have to a large extent rejected the FCF hypothesis advanced by
Jensen (1986) and the agency theory advanced by Jensen and Meckling (1976) which
postulate that when a firm has generated significant FCF and there are no lucrative
investment projects available managers tend to abuse the FCF which results in increased
agency costs The study results have therefore given credence to the critics of the FCF
hypothesis and agency theory who argue that the theories foster short-termism by not
favouring investments that have long run returns Furthermore the findings support the
argument that even in conditions of greatly specific assets where the likelihood of
opportunism is very high there are people who will give precedence to cooperation and
trust and will not engage in opportunistic behavior
122
The study findings have also given credibility to the stewardship theory postulated by
Donaldson and Davis (1991) which emphasizes the role of firm managers as being
stewards incorporating their objectives as part of the firm As stewards they are
contented and encouraged when success of the firm is achieved Agency costs have
shown a positive intervening effect on the relationship between FCF and firm
performance This finding gives credibility to firm monitoring through CG which seems
to have achieved the objective of aligning the interests of firm managers and
shareholders The study findings also imply that firm capabilities and firm characteristics
complement the effects of agency costs on performance
The inclusion of firm characteristics as a moderating variable provided an opportunity to
test the RBV and organizational theories by providing empirical evidence about how the
specific firm characteristics (size and age) affect firm performance This study adopted
two measures of agency costs This measurement approach has enabled the study to offer
a stronger and more robust assessment of the linkages between the study variables
642 Contribution to Policy
The Kenyan context is characterized by calls for effective CG particularly for public
limited liability firms (Okiro 2014) These study findings have refuted the FCF
hypothesis by revealing a positive relationship between FCF and firm performance as
intervened by agency costs This is an indication that investing in firm monitoring is
yielding positive results Adopting good CG mechanisms (firm monitoring which form
123
part of agency costs) is an effective way of improving firm performance Firms should
endeavor to strengthen their monitoring mechanisms so as to increase performance
Improving CG entails having an optimal number of board of directors enhancing board
independence making full disclosure of shareholding and directorrsquo remuneration Policy
makers will therefore maintain CG calls and strive to strengthen and continue developing
policies regulations and prudential guidelines that protect and strengthen shareholders
643 Contribution to Practice
The study findings have shown the fundamental importance of firms generating FCF and
strengthening firm monitoring The joint effect of FCF agency costs and firm
characteristics on firm performance has yielded a positive relationship Firm managers
investors and other practitioners will therefore put more emphasis on the need for firms to
generate FCF and to enhance firm monitoring
Cash flows from operating activities financing activities and investment activities will be
more keenly analyzed with a view to achieve greater efficiency This study has also
delineated FCF from agency costs unlike studies such as Jensen (1986) which generally
regard FCF as agency costs This gives firm managers investors and other practitioners a
better understanding of the variables and their linkages which will enhance effectiveness
and efficiency in firm operations
124
65 Limitations of the Study
The study focused on firms listed at the NSE which operate in a unique environment
Unique factors such as regulatory environment culture and demographics limit the
generalizability of the study results to other countries or markets However this
limitation does not render the study findings applicable to NSE listed firms only Some
aspects could be relevant to other markets
Secondly the major theoretical motivations underlying this study are the FCF hypothesis
and the agency theory Traditionally the board of directors keenly monitors decision
makers who tend to divert resources to their own personal interests The findings support
this view and offer evidence that proper firm monitoring mechanisms yield higher firm
performance A probable limitation of the study is that it does not integrate other CG
mechanisms such as influencing managersrsquo actions through an advisory role
Thirdly the study disregards practices other than board monitoring that may serve to
lessen agency costs Firm monitoring costs were a part of the larger agency cost variable
The omission of alternative board monitoring practices did not therefore undermine the
robustness and or the rigor of the study Fourthly the study used only two firm
characteristics These are firm size and age of the firm Other firm characteristics include
profitability leverage liquidity sales growth among others The study employed size and
age only because they are the most commonly used in literature and their effect on firm
performance is more significant (Demsetz amp Lehn 1985 and Mule Mukras amp Nzioka
2015)
125
Lastly literature indicates at least seven proxy measures of agency costs These are
operating expense to sales ratio total asset turnover advertising and RampD expense to
sales ratio administrative expense to sales ratio earnings volatility firm monitoring
index and FCF This study utilized only two of these measures (total asset turnover and
operating expense to sales ratio) Agency cost measures other than the two used in this
study may yield different findings Employing only one agency cost measure may still be
sufficient and therefore the omission of other measures did not undermine the robustness
and or the rigor of the study
66 Recommendations of the Study
The findings have indicated that there exists a positive relationship between FCF and
financial performance The study therefore recommends that firm managers investors
and other practitioners should focus more on the need for firms to generate FCF Positive
FCF indicate that the firm is making more cash than is used to operate the firm and for
reinvestment Such excess funds can be given back to shareholders as dividends or share
repurchase packages in cases where the firms have limited growth prospects and the
funds could not be better invested somewhere else
It is therefore recommended that regulators policy makers investors and other
practitioners should emphasize on monitoring and CG mechanisms to maintain if not
improve high firm performance Study results indicate that proper monitoring
mechanisms can bring the actions of firm managers into congruence with those of
shareholders which primarily is to maximize the shareholdersrsquo wealth
126
67 Suggestions for Further Research
This study used Tobinrsquos Q in measuring financial performance Further studies need to be
conducted using ROE ROI ROA DY sales growth market share or productivity
Secondly the study population was all firms listed at the NSE These firms cut across
various industry sectors Future studies could focus on specific industries such as
manufacturing financial sector communications agricultural or automobile industry
This is because focusing on a specific industry could yield different results that are
unique for the industry
Thirdly this study used only two firm characteristics as moderating variables These are
firm size and age of the firm Future studies could employ sales growth liquidity growth
prospects profitability asset growth turnover ownership structure dividend pay-out
profitability and access to capital markets among others Use of other moderating
variables may yield different results
Lastly the study only employed two proxy measures of agency costs Future studies
should attempt to use all the suggested seven agency cost measures or the other agency
cost measures not employed in this study This could yield different results or provide
more robustness and rigor in the study
127
REFERENCES
Abbasi A amp Malik A Q (2015) Firm size moderating financial performance in
growing firms Empirical evidence from Pakistan International Journal of
Economics and Financial Issues 5(2) 334ndash339
Adelegan O J (2009) Investment financial factors and cash flow from Nigerian panel
data Journal of African Development 11(1) 77-108
AERA APA amp NCME (2000) Standards for educational and psychological tests
Washington DC American Psychological Association American Educational
Research Association National Council on Measurement in Education
Aldrich H E amp Austen E (1986) Even dwarfs started small Liabilities of size and age
and their strategic implications In Staw B Cummings (Eds) Research in
organizational behavior JAI Press Greenwich CT
Ayako A Kungu G amp Githui T (2015) Determinants of the performance of firms
listed at the Nairobi Securities Exchange Research Journal of Finance and
Accounting 6(12) 157-164
Aiken L S amp West S G (1991) Multiple regression Testing and interpreting
interactions Thousand Oaks CA Sage
Bain J S (1959) Industrial organization New York John Wiley amp Sons
Baker W E amp Sinkula (2005) Market orientation and the new product paradox Journal
of Product Innovation Management 22(6) 485-502
Banafa A (2016) The effect of leverage liquidity and firm size on financial
performance of listed non-financial firms in Kenya Unpublished PhD Thesis
Jomo Kenyatta University of Agriculture and Technology
128
Barney J B (2002) Gaining and sustaining competitive advantage 2nd
ed Reading
Mass Addison-Wesley
Baron R M amp Kenny D A (1986) The moderator-mediator variable distinction in
social psychological research conceptual strategic and statistical considerations
Journal of Personality and Social Psychology 51(6) 1173-1182
Berle A A amp Means G C (1932) The modern corporation and private property
McMillan New York
Bonett D G amp Wright T A (2014) Cronbachrsquos Alpha Reliability Interval estimation
hypothesis testing and sample size planning Journal of Organizational Behavior
36 (1) 3-15
Bourne M Neely A D Mills J F amp Platts K (2003) Implementing performance
measurement systems A literature review International Journal of Business
Performance Management 5 (1) 1-24
Brealey A A Myers S C amp Allen F (2005) Principles of corporate finance (8th
ed)
Boston McGraw-HillIrwin
Bromiley P (1990) Advances in strategic management JAI Press Greenwich
Brouwer P Kok J D amp Fris P (2005) Can firm age account for productivity
differences EIM Business research scientific analysis of entrepreneurship and
SMEs SCALES ndash paper N200421 Zoetermeer Netherlands
Brush H W Bromiley P amp Hendrickx M (2000) The free cash flow hypothesis for
sales growth and firm performance Strategic Management Journal 21 455-472
129
Cadogan J W amp Diamantopoulos A (1995) Narver and Slater Kohli and Jaworski and
the market orientation construct integration and internationalization Journal of
Strategic Marketing 3(1) 41-60
Carson D Gilmore A Perry C amp Gronhaug K (2001) Qualitative marketing
research SAGE publications London
Central Bank of Kenya (2016) Bank supervision annual report
Chang S J amp Singh H (2000) Corporate industry effects on business and competitive
position Strategic Management Journal 21 (1) 739-752
Chen X Sun Y amp Xu X (2016) Free cash flow over-investment and corporate
governance in china Pacific-Basin Finance Journal 37 81ndash103
CMA (2010) A comparative analysis of the performance of African stock markets
[Online] Available wwwcmaorke [Accessed 9 August 2015]
Cline B N Williamson C R amp Yore A (2014) Economic calculation and constraints
on firm size Mississippi State University USA
Cooper D R amp Schindler P S (2006) Business research methods 9th
edition Mac-
Grow-hill publishing co ltd New Delhi India
Daft R L (1995) Organization theory and design (11 ed) West Publishing Company
New York
Daily C M Dalton D R amp Cannella J A A (2003) Corporate governance decades
of dialogue and data The Academy of Management Review 28 (3) 371-382
Dancey C amp Reidy J (2011) Statistics without maths for psychology 5th Edition
Prentice Hall London
130
Davis J Donaldson L amp Schoorman D (1997) Towards a stewardship theory of
management Academy of Management Review 22 (1) 20-47
Dawar V (2014) Agency theory capital structure and firm performance some Indian
evidence Managerial Finance 40(12) 1190ndash1206
Dean T J Robert L B amp Bamford (1998) Differences in large and small firm
responses to environmental context strategic implications from a comparative
analysis of business formations Strategic Management Journal 19(8) 709-728
Demsetz H amp Lehn K (1985) The structure of corporate ownership causes and
consequences Journal of Political Economy 93 (6) 1155-1177
Donaldson L (1990) A rational basis for criticism of organizational economics a reply
to Barney Academy of Management Review 15 394-401
Donaldson L amp Davis J H (1991) Stewardship theory or agency theory CEO
governance and shareholder returns Australian Journal of Management 16 (1)
49-65
Donaldson T amp Preston LE (1995) The stakeholder theory of the corporation
concepts evidence and implications Academy of Management Review 20 (1)
65-91
Dyer L amp Reeves T (1995) Human resource strategies and firm performance what do
we know and where do we go International Journal of Human Resource
Management 31 758-775
Easterwood C (1997) Takeovers and incentives for earnings management an empirical
analysis Journal of Applied Business Research 14 29-48
131
Emami E Salteh H M amp Hasanzadeh R B (2014) Social responsibility and value of
firms listed at Tehranrsquos Stock Exchange International Review of Management
and Business Research 31(21) 332ndash338
Fama E F (1980) Agency problems and theory of the firm Journal of Political
Economy 88(2) 288-307
Fauver L amp Naranjo A (2010) Derivative usage and firm value the influence of
agency costs and monitoring problems Journal of Corporate Finance 16 719-
735
Ferris S P amp Yan X S (2009) Agency costs governance and organizational forms
evidence from the mutual fund industry Journal of Banking and Finance 33 619-
626
Field A (2009) Discovering statistics using SPSS Sage Publications Ltd London
Figge F Hanh T Schaltegger S amp Wagner M (2002) The sustainability Balanced
Score Card - Linking sustainability management to business strategy Business
Strategy and Environment 11 269-284
Freeman R (1984) Strategic management a stakeholder approach Pitman Publishing
Inc Massachusetts
Frentrop P (2003) On the discretionary power of top executives Journal of Asset
Management 5 (2) 91-104
Gleason J M amp Barnum D T (1982) Toward valid measures of public sector
productivity performance measures in urban transit Management Science
28(14) 379-386
Gorard S (2013) Research design robust approaches for the social sciences London
SAGE ISBN
132
Grant R M (1991) The resource based theory of competitive advantage implications
for strategic formulation California Management Review 33(1) 114-135
Gregory A (2005) The long-run abnormal performance of UK acquirers and the free
cash flow hypothesis Journal of Business Finance and Accounting 32(5) 777-
814
Gul F A amp Tsui S T J (1998) A test of the free cash flow and debt monitoring
hypotheses evidence from audit pricing Journal of Accounting and Economics
24 (2) 219-237
Hannan M T amp Freeman J (1984) Structural inertia and organizational change
American Sociological Review 49(2) 149-164
Harford J (2002) Corporate cash reserves and acquisitions The Journal of Finance 54
(6) 1969 ndash 1997
Hawawini G Subramanian V amp Verdin P (2003) Is performance driven by industry
or firm specific factors a new look at evidence Strategic Management Journal
23 (1) 1-16
Hendricks K B amp Singhal V R (2001) Firm characteristics total quality management
and financial performance Journal of Operations Management 19 269-285
Heydari I Mirzaeifar M Javadghayedi M amp Student M A (2014) Investigating the
relationship between free cash flows and firm performance evidence from Tehran
Stock Exchange Indian Journal of Scientific Research 4(6) 269ndash279
Hill C W L (1990) Cooperation opportunism and the invisible hand implications for
transaction cost theory Academy of Management Review 15(3) 500-513
Hubbard R G (1998) Capital market imperfections and investment Journal of
Economic Literature 36 (2) 193-225
133
Jabbary H Hajiha Z Labeshka amp Hassanpour R (2013) Investigation of the effect of
agency costs on firm performance of listed firms at the Tehran Stock Exchange
European Online Journal of Natural and Social Sciences 2(3) 771ndash776
Jensen M (1986) Agency costs of free cash flow corporate finance and takeovers
American Economic Review 76 (2) 323-329
Jensen M C amp Meckling W H (1976) Theory of the firm managerial behavior
agency cost and ownership structure Journal of Financial Economics 3 (4) 305-
360
Kaen F R amp Baumann H D (2003) Firm size employees and profitability in US
manufacturing industries Social Science Research Network Electronic Journal
(1) 1-71
Kapelko M (2006) Evaluate efficiency in the framework of resource based view of the
firm evidence from Polish and Spanish textile amp clothing industry Bellaterra
1(1) 1-56
Kaplan R S amp Norton D P (2001) Transforming Balanced Score Card from
performance measurement to strategic management Part 1 Accounting Horizons
87-104
Kangarluei S J Motavassel M amp Abdollahi T (2011) The investigation and
comparison of free cash flows in the firms listed in Tehran Stock Exchange (TSE)
with an emphasis on earnings management International Journal of Economics
and Business Management 2(2) 5352ndash118
Kargar E F amp Ahmadi G R (2013) The relationship between free cash flows and
agency costs levels evidence from Tehran Stock Exchange Research Journal of
Finance and Accounting 4(14) 51ndash66
134
Kerlinger F N (2002) Foundations of behavioural research Holt Rinehart and
Winston Inc USA
Khidmat W B amp Rehman M U (2014) The impact of free cash flows and agency
costs on firm performance - an empirical analysis of KSE listed companies of
Pakistan Journal of Financial Engineering 01(03) 145 ndash 175
Kimberlin C L amp Winterstein A G (2008) Validity and reliability of measurement
instruments used in research American Society of Health-System Pharmacists 65
Kinoti M A (2012) Factors contributing towards adoption of green marketing
practices in the mobile phone service providers in Kenya Unpublished PhD
Thesis University of Nairobi Kenya
Kogan L amp Tian M (2012) Firm characteristics and empirical factor models a data-
mining experiment International Finance Discussion papers 1070
Kwanum M amp Iorpev L (2012) Capital structure and firm performance evidence from
manufacturing companies in Nigeria International Journal of Business and
Management Tomorrow 2 (5) 1ndash17
Leibenstein H (1976) Beyond economic man Cambridge MA Harvard University
Press
Lengnick-Hall C A amp Wolff J A (1999) Similarities and contradictions in the core
logic of three strategy research streams Strategic Management Journal 20(12)
1109-1132
Lin L amp Lin D (2014) Agency cost of free cash flow and biddersrsquo long-run takeover
performance Universal Journal of Accounting and Finance 2(1) 1-8
135
Lusthaus C Anderson G amp Murphy E (1995) Institutional assessment a framework
for strengthening organizational capacity for IDRCrsquos research partners
International Development Research Centre Ottawa
Mackinnon D P Lockwood C M Hoffman J M West S G amp Sheets V (2002) A
comparison of methods to test mediation and other intervening variable effects
Psychological Methods 7 (1) 83-104
Mbugua D (2015) Market orientation firm characteristics dynamic capabilities and
performance of deposit-taking savings and credit cooperative societies in Kenya
Unpublished PhD Thesis University of Nairobi Kenya
Mansell S (2013) Capitalism corporations and the social contract a critique of
stakeholder theory Cambridge Cambridge University Press
McKnight P J amp Weir C (2008) Agency costs corporate governance mechanisms and
ownership structure in large UK publicly quoted companies a panel data analysis
The Quarterly Review of Economics and Finance 49 (2009) 139-158
Meyer M W amp Zucker L G (1989) Permanently failing organization Sage Beverly
Hills CA
Miller D amp Chen M J (1994) Sources and consequences of competitive inertia
Administrative Science Quarterly 39(1) 1-17
Milne F Purda L amp Anand A (2008) Monitoring to reduce agency costs examining
the behavior of independent and non-independent boards Seattle University Law
Review 33(4) 809-848
Mitchell R K Agle B R amp Wood D J (1997) Toward a theory of stakeholder
identification and salience defining the principle of who and what really counts
Academy of Management Review 22(4) 853-886
136
Mojtahedzadeh V amp Nahavandi N N A P (2009) Free cash flow agency costs
earnings management and investor monitoring Journal of Financial Economics
32 615-635
Muganda N (2010) Applied business and management research Exploring the
principles and practices of research within the context of Africa Africa Nicorp
Publication
Mugenda O M amp Mugenda AG (2003) Research methods quantitative and
qualitative approaches Nairobi Acts Press
Mule R K Mukras S M amp Nzioka O M (2015) Corporate size profitability and
market value an econometric panel analysis of listed firms in Kenya European
Scientific Journal 11 (13) 376-396
Mwangi M (2014) The influence of membersrsquo income and conduct of SACCOs in the
relationship between characteristics and efficiency of SACCOs in Kenya
Unpublished PhD Thesis University of Nairobi Kenya
Nairobi Securities Exchange (2015) History of the NSE [Online] Available
wwwnsecoke [Accessed 26 June 2015]
Neely A (1998) Measuring business performance - why what and how Economist
Books London
Neely A D Adams C amp Kennerley M (2002) The performance prism the scorecard
for measuring and managing business success Pearson Education Limited
London UK
Nekhili M Amar I F B Chtioui T amp Lakhal F (2014) Free cash flow and earnings
management the moderating role of governance and ownership Journal of
Financial Economics 11 (13) 847 ndash 875
137
Njeru W G (2013) Market orientation marketing mix practices firm characteristics
external environment and performance of tour firms in Kenya Unpublished PhD
Thesis University of Nairobi Kenya
Njuguna L amp Moronge M (2013) Influence of the managerial behavior of agency cost
on the performance of listed firms on NSE International Journal of Social
Sciences and Entrepreneurship 1 (7) 397-410
Norman W amp MacDonald C (2004) Getting to the bottom of tripple bottom line
Business Ethics Quarterly 14 (2) 243-262
Nunes P J M Serrasqueiro Z M amp Sequeira T N (2009) Profitability in Portuguese
service industries a panel data approach The Service Industries Journal 29(5)
693-707
Nunnally J (1967) Psychometric theory Mac-Graw-Hill New York
Nyamweno C N amp Olweny T (2014) Effect of working capital management on
performance of firms listed at the Nairobi Securities Exchange Economics and
Finance Review 3(11) 1ndash14
Nyongrsquoo A P (2000) The context of privatization in Kenya African academy of
sciences Colour Printers Nairobi Kenya
Odundo E (2009) Alternative investment options transforming needs into
opportunities Retirement Benefits Authority CMA Workshop
Okiro K O (2014) The influence of capital structure firm size rules and regulations on
the relationship between composite corporate governance and performance of
firms listed on East African Securities Exchanges Unpublished PhD Thesis
University of Nairobi Kenya
138
Ongore V amp KrsquoObonyo P (2011) Effects of selected corporate governance
characteristics on firm performance empirical evidence from Kenya
International Journal of Economics and Financial Issues 1 (3) 99-122
Opler T amp Titman S (1993) The determinants of leveraged buyout activity free cash
flow versus financial distress costs Journal of Finance 48 1985-1999
Oppenheim A N (1992) Questionnaire design interviewing and attitude measurement
Basic books Inc New York
Patton M (1990) Qualitative evaluation and research methods Beverly Hills CA
Sage
Pearce J A amp Robinson R B (2011) Strategic management formulation
implementation and control (12th
ed) New York McGraw HillIrwin
Penfield R amp Miller J M (2004) Improving content validation studies using an
asymmetric confidence interval for the mean of expert ratings Applied
Measurement in Education 17 359-370
Penrose E T (1959) The theory of the growth of the firm Oxford Basil Blackwell
Perry C Reige A amp Brown L (1999) Realismrsquos role among scientific paradigms in
marketing research Irish Marketing Review 12(2) 16-23
Podrug N (2010) Stewardship relations within management hierarchy in large
Croatian companies Doctoral Dissertation Faculty of Economics and Business
Zagreb
139
Ponnu C H amp Okoth M O (2009) Corporate social responsibility disclosure in Kenya
The Nairobi Stock Exchange African Journal of Business Management 3(10)
601-608
Porter M E (1980) Competitive strategy New York The Free Press
Power L (1998) The missing link technology investment and productivity Review of
Economics and Statistics 80(2)300 ndash 313
Priem R L amp Butler J E (2001) Is the resource based view a useful perspective for
strategic management research Academy of Management Review 26(1) 22-40
Proctor S (1998) Philosophy and methods of research process the case of realism
Nurse Researcher 5 (4) 73 ndash 90
Richard P Divinney T M Yip G S amp Johnson G (1999) Measuring organizational
performance towards methodological best practice Journal of Management
35(2) 1340-1378
Richardson S (2006) Over-investment of free cash flow and corporate governance
Review of Accounting Studies 11 159-189
Robinson C amp Schumacker R E (2009) Interaction effects countering variance
inflation factor and interpretation issues Multiple Linear Regression View Points
35(1) 6-11
Rumelt R P (1991) How much does industry matter Strategic Management Journal
12(1) 167 185
Sagwa E V (2014) Human resource management practices and performance of firms
listed at the Nairobi Securities Exchange Unpublished PhD Thesis University of
Nairobi Kenya
140
Salaman G (1979) Work organizations resistance and control Longman London
Saunders M Lewis P amp Thornhill A (2007) Research methods for business students
(4th
ed) Prentice Hall Financial Times Harlow
Schmalensee R (1985) Do markets differ much American Economic Review 75 (1)
341-351
Shepherd W G (1986) On the core concepts of industrial economics in H W De Jong
and W G Shephert eds Mainstreams in Industrial Organization Dordrecht
Martinus Nijhoff Publishers
Singh M amp Davidson W N (2003) Agency costs ownership structure and corporate
governance mechanisms Journal of Banking and Finance 27 793-816
Smith C W amp Warner J B (1979) On financial contracting an analysis of bond
covenants Journal of Financial Economics 7(79) 117-161
Stalk G Evans P amp Schulman L E (1992) Competing on capabilities the new rules
of corporate strategy Harvard Business Review 70(1) 57-69
Stinchcombe A L (1965) Social structure and organizations Handbook of
organizations Rand McNally Chicago
Subrahmanyam A amp Titman S (2001) Feedback from stock prices to cash flows
Journal of Finance 56 (18) 2389-2413
Sundaram A K amp Inkpen A C (2004) Stakeholder theory and ldquothe corporate
revisitedrdquo a reply Journal of Organization Science 15 (3) 370-371
141
Szewczyk S H Tsetsekos G P amp Zantout Z (1996) The valuation of corporate RampD
expenditures evidence from investment opportunities and free cash flow Journal
of Financial Management 25 (1) 105-110
Tabachnick B G amp Fidell L S (2013) Using multivariate statistics (6 ed) Needham
Heights MA Allyn amp Bacon
Thakor R T (2013) Investment opportunities free cash flow and the market values of
foreign and domestic cash holdings Unpublished Working Paper Massachusetts
Institute of Technology
Thompson P amp McHugh D (2002) Work organizations a critical introduction (3rd
ed) Palgrave McMillan
Tirole J (1986) The theory of corporate finance Princeton University Press Princeton
NJ
Venkatraman N Ramanujam V (1986) Measurement of business performance in
strategy research a comparison of approaches The Academy of Management
Review 11(4) 801-814
Vogt S (1997) Cash flow and capital spending Evidence from capital expenditure
announcements Journal of Financial Management 26(2) 44 ndash 57
Waithaka S M Ngugi J K Aiyabei J K Itunga J K amp Kirago P (2012) Effects
of dividend policy on share prices a case of companies at the Nairobi Securities
Exchange Journal of Business Administration and Management 2 (8) 642-648
Wambua P (2013) Effects of agency costs on financial performance of companies listed at
the Nairobi Securities Exchange International Journal of Social Sciences and
Entrepreneurship 1 (5) 587-607
142
Wang G Y (2010) The impacts of free cash flows and agency costs on firm performance
Journal of Service Science and Management 3 408-418
Wernerfelt B (1984) A resource based view of the firm Strategic Management Journal
5(2) 171-180
Wernerfelt B amp Montgomery C A (1985) Tobinrsquos Q and importance of focus in firm
performance American Economic Review 78(1) 246-250
Williams B Onsman A amp Brown T (2012) Is the Australian paramedic a discipline or a
profession A national perspective International Journal of Paramedic Practice
1(5) 162-168
Williams J R (1992) How sustainable is your competitive advantage California
Management Review 34(1) 29-51
World Bank (2000) Corporate governance a framework for implementation A World Bank
Country Study Washington
Yin X amp Zajac E J (2004) The strategygovernance structure fit relationship theory and
evidence franchising arrangements Strategic Management Journal 25(7) 201-242
Wu A D amp Zumbo B D (2008) Understanding and using mediators and moderators
Social Indicators Research 87(3) 367
Zou S amp Stan S (1998) The determinants of export performance a review of the empirical
literature between 1987 and 1997 Journal of Marketing Review 15(5) 333-356
i
APPENDICES
Appendix I Firms Listed at the Nairobi Securities Exchange as at December 31
2015
NO SECTOR
A AGRICULTURAL
1 Eaagads Ltd
2 Kapchorua Tea Co Ltd
3 Kakuzi Ltd
4 Limuru Tea Co Ltd
5 Rea Vipingo Plantations Ltd
6 Sasini Ltd
7 Williamson Tea Kenya Ltd
B AUTOMOBILES AND ACCESSORIES
8 Car and General (K) Ltd
9 Sameer Africa Ltd
10 Marshalls (EA) Ltd
C BANKING
11 Barclays Bank Ltd
12 CFC Stanbic Holdings Ltd
13 IampM Holdings Ltd
14 Diamond Trust Bank Kenya Ltd
15 Housing Finance Co Ltd
16 Kenya Commercial Bank Ltd
17 National Bank of Kenya Ltd
18 NIC Bank Ltd
19 Standard Chartered Bank Ltd
20 Equity Bank Ltd
21 The Co-operative Bank of Kenya Ltd
D COMMERCIAL AND SERVICES
22 Nation Media Group
ii
23 Kenya Airways Ltd
24 Express Ltd
25 Standard Group Ltd
26 TPS Eastern Africa (Serena) Ltd
27 Hutchings Biemer Ltd
28 Uchumi Supermarket Ltd
29 Scangroup Ltd
30 Longhorn Kenya Ltd
E CONSTRUCTION AND ALLIED
31 Athi River Mining
32 Bamburi Cement Ltd
33 Crown Berger Ltd
34 EA Cables Ltd
35 EA Portland Cement Ltd
F ENERGY AND PETROLEUM
36 Kenol-Kobil Ltd
37 Total Kenya Ltd
FIRM AND SECTOR
38 KenGen Ltd
39 Kenya Power amp Lighting Co Ltd
40 Umeme Ltd
G INSURANCE
41 Jubilee Holdings Ltd
42 Pan Africa Insurance Holdings Ltd
43 Kenya Re-Insurance Corporation Ltd
44 Liberty Kenya Holdings Ltd
45 British-American Investments Company ( K) Ltd
46 CIC Insurance Group Ltd
H INVESTMENT
47 Olympia Capital Holdings Ltd
iii
48 Centum Investment Co Ltd
49 Trans-Century Ltd
50 Home Afrika Ltd
51 Kurwitu Ventures
I INVESTMENT SERVICES
52 Nairobi Securities Exchange Ltd
J MANUFACTURING AND ALLIED
53 BOC Kenya Ltd
54 British American Tobacco Kenya Ltd
55 Carbacid Investments Ltd
56 East African Breweries Ltd
57 Mumias Sugar Co Ltd
58 Unga Group Ltd
59 Eveready East Africa Ltd
60 Kenya Orchards Ltd
61 ABaumann CO Ltd
62 Flame Tree Group Holdings Ltd
K TELECOMMUNICATION AND TECHNOLOGY
63 Safaricom Ltd
iv
Appendix II Data Collection Form
Firm X (Indicate Firm name accordingly)
Part A FREE CASH FLOWS
Year
Net
Income
(PAT)
(a)
Depreciation
amp
Amortization
(b)
CAPEX
(crsquo)
Change
in non-
cash
working
capital
(d)
Net
borrowing
(ersquo)
Net
sales
(f)
FCF
= (a +
b ndash c -
d + e)
f
2006
2007
2008
2009
2010
2011
2012
2013
2014
2015
Non-cash working capital includes inventories financial assets held to maturity
receivables and prepayments (current assets) and payables accrued expenses and
current income tax liability (liabilities) For financial and investment firms non-cash
working capital includes prepaid lease rentals intangible assets deferred tax assets
retirement benefit assets and other assets (assets) and taxation payable dividends
payable deferred tax liabilities and retirement benefit liabilities
Net borrowings were determined by comparing current year and previous year long-
term loans
Net sales in case of insurance firms are the equivalent of ldquoNet premium revenuerdquo For
commercial banks it is ldquoTotal operating incomerdquo which is composed of net interest
v
income plus total non-interest income For investment firms it is ldquoIncomerdquo which is
comprised of rental income dividends and interest received and other incomes
PART B FINANCIAL PERFORMANCE
Year Equity Market Value (a) Equity Book Value (b) Tobinrsquos Q = a b
2006
2007
2008
2009
2010
2011
2012
2013
2014
2015
vi
PART C AGENCY COSTS
Year
1 Asset Utilization
Efficiency (AUE)
2 Production Cost Efficiency (PCE)
(a) Net
sales
(b) Total
assets
AUE
= ab
(c) Operating
expenses
(d) Net sales PCE=cd
2006
2007
2008
2009
2010
2011
2012
2013
2014
2015
Net sales in case of insurance firms are the equivalent of ldquoNet premium revenuerdquo For
commercial banks it is ldquoTotal operating incomerdquo which is composed of net interest
income plus total non-interest income For investment firms it is ldquoIncomerdquo which is
comprised of rental income dividends and interest received and other incomes
xii
PART D FIRM CHARACTERISTICS
Firm Size Firm Age
Year (a) Natural Log of Total Assets (b) Natural log of Age (Number of years
since incorporation)
2006
2007
2008
2009
2010
2011
2012
2013
2014
2015
Net sales in case of insurance firms are the equivalent of ldquoNet premium revenuerdquo For
commercial banks it is ldquoTotal operating incomerdquo which is composed of net interest
income plus total non-interest income For investment firms it is ldquoIncomerdquo which is
comprised of rental income dividends and interest received and other incomes

v
DEDICATION
I dedicate this work to my dear wife Naomi Khakasa daughter Marion Metah and son
Collins Agala for their encouragement To my dear parents Mr Andrew Mutende and Mrs
Elizabeth Mutende the sacrifice you made for me since 1979 when I joined Kakunga nursery
school to date is immeasurable All my brothers and sisters thank you so much for your
support
vi
TABLE OF CONTENTS
DECLARATION ii
COPYRIGHT copy iii
ACKNOWLEDGMENT iv
DEDICATION v
LIST OF TABLES x
LIST OF FIGURES xi
ABBREVIATIONS AND ACRONYMS xii
ABSTRACT xv
CHAPTER ONE INTRODUCTION 1
11 Background to the Study 1
111 Firm Performance 3
112 Free Cash Flows 6
113 Agency Costs 7
114 Firm Characteristics 9
115 Firms Listed at the Nairobi Securities Exchange 12
12 Research Problem 15
13 Objectives of the Study 19
131 Broad Objective 19
132 Specific Objectives 20
14 Research Hypothesis 20
15 Value of the Study 21
16 Operational Definition of Terms 22
161 Free Cash flows 22
162 Agency Costs 22
163 Firm Characteristics 23
164 Firm Performance 23
17 Organization of the Thesis 24
vii
CHAPTER TWO LITERATURE REVIEW 26
21 Introduction 26
22 Theoretical Foundation of the Study 26
221 Free Cash Flow Hypothesis 27
222 Agency Theory 28
223 Stakeholder Theory 29
224 Stewardship Theory 31
225 The Resource Based View Theory 33
226 Organizational Theory 36
23 Free Cash Flows and Firm Financial Performance 38
24 Free Cash Flows Agency Costs and Firm Financial Performance 40
25 Free Cash Flows Firm Characteristics and Firm Financial Performance 42
26 Free Cash Flows Agency Costs Firm Characteristics and Firm Financial Performance45
27 Summary of Knowledge Gaps 48
28 Conceptual Framework 55
29 Chapter Summary 56
CHAPTER THREE RESEARCH METHODOLOGY 57
31 Introduction 57
32 Research Philosophy 57
33 Research Design 59
34 Population of the Study 59
35 Data Collection 60
36 Reliability and Validity 60
361 Reliability Test 61
362 Validity Test 62
37 Operationalization of the Study Variables 63
viii
38 Data Analysis 66
39 Choice of Panel Data Analysis Model 67
391 Effect of Free Cash Flows on Financial Performance 68
392 Free Cash Flows Agency Costs and Financial Performance 68
393 Free Cash Flows Firm Characteristics and Financial Performance 70
394 Relating all the Variables 71
310 Chapter Summary 74
CHAPTER FOUR DATA ANALYSIS AND FINDINGS 74
41 Introduction 75
42 Pre-estimation Diagnostics 75
421 Normality test 75
422 Reliability Tests 80
423 Test for Linearity 81
424 Bartletts Test for Internal Consistency 82
425 Multicollinearity Test 83
43 Descriptive Statistics 85
44 Chapter Summary 86
CHAPTER FIVE TESTS OF HYPOTHESES AND DISCUSSION 87
51 Introduction 87
52 Correlation Analysis 87
53 Hypotheses Testing Using Regression Analysis 89
531 Free Cash Flows and Financial Performance 90
532 Free Cash Flows Agency Costs and Financial Performance 92
533 Free Cash Flows Firm Characteristics and Financial Performance 97
534 Free Cash Flows Agency Costs Firm Characteristics and Financial Performance
104
54 Discussion 107
ix
541 The Influence of Free Cash Flows on Financial Performance 107
542 The Influence of Agency Costs on the Relationship between Free Cash Flows and
Financial Performance 109
543 The Influence of Firm Characteristics on the Relationship between Free Cash
Flows and Firm Performance 110
544 The Joint Effect of Free Cash Flows Agency Costs and Firm Characteristics on
Financial Performance 112
55 Summary and Presentation of Empirical Models 115
CHAPTER SIX SUMMARY OF FINDINGS CONCLUSIONS AND
RECOMMENDATIONS 117
61 Introduction 117
62 Summary of Findings 118
63 Conclusions 120
64 Contributions of the Study 121
641 Contribution to Theory 121
642 Contribution to Policy 122
643 Contribution to Practice 123
65 Limitations of the Study 124
66 Recommendations of the Study 125
67 Suggestions for Further Research 126
REFERENCES 127
APPENDICES i
Appendix I Firms Listed at the Nairobi Securities Exchange as at December 31 2015 i
Appendix II Data Collection Form iv
x
LIST OF TABLES
Table 21 Summary of Knowledge Gaps 50
Table 31 Operationalization of Study Variables 64
Table 32 A Summary of Statistical Tests of Hypotheses 72
Table 41 Normality Test 76
Table 42 Reliability Scores for Individual Variables 81
Table 43 Test for Linearity 81
Table 44 Bartlettrsquos Test 83
Table 45 Multicollinearity Test 84
Table 46 Descriptive Statistics for Secondary Data ndash 2006 to 2015 85
Table 51 Pearson Product-Moment Correlations among the Dependent Independent
Intervening and Moderating Variables 88
Table 52 Panel Data Results for Free Cash Flows and Financial Performance 90
Table 53 Panel Data Results of Agency Costs as the Dependent Variable and Free Cash flows
as the Independent Variable 93
Table 54 Panel Data Results of Financial Performance as the Dependent Variable while
Agency Costs and Free Cash flows are the Independent Variables 95
Table 55 Panel Data Results for Financial Performance as the Dependent Variable and FCF
and Firm Age as the Predictor Variables 98
Table 56 Panel Data Results for Financial Performance as the Dependent Variable and FCF
and Firm Age as the Predictor Variables Centered Approach 99
Table 57 Panel Data Results for Financial Performance as the Dependent Variable and FCF
and Firm Size as the Predictor Variables 101
Table 58 Panel Data Results for Financial Performance as the Dependent Variable and FCF
and Firm Size as the Predictor Variables Centered Approach 102
Table 59 Panel Data Results for Free Cash Flows Agency Costs Firm Characteristics and
Financial Performance 105
Table 510 Summary of Tests of Hypotheses Results and Conclusions 114
xi
LIST OF FIGURES
ABBREVIATIONS AND ACRONYMS xii
Figure 21 Conceptual Model 55
Figure 31 Path Diagram for Mediation effect of Agency Costs 69
Figure 41 Q-Q Plot for Free cash Flows (2006 ndash 2015)77
Figure 42 Q-Q Plot for Agency Costs (AC) ndash 2006 to 2015 77
Figure 43 Q-Q Plot for Firm Characteristics (Firm Age) ndash 2006 to 2015 78
Figure 44 Q-Q Plot for Firm Characteristics (Firm Size) ndash 2006-2015 79
Figure 45 Q-Q Plot for Firm Financial Performance ndash 2006 to 2015 80
Figure 51 Revised Empirical Model ndash Financial Performance 116
xii
ABBREVIATIONS AND ACRONYMS
AFM Association of Futures Markets
AIMS Alternative Investment Market Segment
ANOVA Analysis of Variance
ASEA African Securities Exchanges Association
BSC Balanced Score Card
CAPEX Capital expenditure
CCP Central Counter Party
CG Corporate Governance
CMA Capital Markets Authority
CSR Corporate Social Responsibility
DA Discretionary accruals
DY Dividend yield
EMIR European Market Infrastructure Regulations
EASEA East African Securities Exchanges Association
FCF Free Cash flows
FISMS Fixed Income Securities Market
FOMS Futures and Options Market Segment
xiii
IAS International Auditing Standards
IDRC The International Development Research Centre
IFRS International Financial Reporting Standards
KMO Kaiser-Meyer-Olkin
MIMS Main Investment Market Segment
NACOSTI National Commission for Science Technology and Innovation
NASI Nairobi Securities Exchange All Share Index
NSE Nairobi Securities Exchange
NPV Net Present Value
OLS Ordinary Least Squares
OTC Over the Counter
PAT Profit after Tax
Q-Q Quantile ndash Quantile
RBV Resource Based View
ROA Return on Assets
ROE Return on Equity
SACCOs Savings and Credit Cooperatives
xiv
SPSS Statistical Package for the Social Sciences
SSE Sustainable Stock Exchanges
RampD Research and Development
TQM Total Quality Management
UK United Kingdom
USA United States of America
VIF Variance Inflation Factor
WFE World Federation of Exchanges
xv
ABSTRACT
Firm performance is affected by various factors both internal and external to the firm
Internal factors include factors such as firm size age liquidity leverage free cash flows
agency costs profitability and growth prospects among others External factors include
regulation and general macro-economic factors This research sought to find out the
influence of agency costs and firm characteristics on the relationship between FCF and
firm performance The first study objective was to establish how FCF influence
performance of NSE listed firms The second objective was to find out how agency costs
influence the relationship between FCF and performance of NSE listed firms Thirdly to
determine how firm characteristics influence the relationship between FCF and
performance of NSE listed firms and lastly to establish the joint effect of FCF agency
costs and firm characteristics on the performance of NSE listed firms The study used
secondary panel data which were obtained from 60 firms listed at the NSE Secondary
data was for the period 2006 to 2015 Multiple and simple regression analyses were
employed Results indicate that FCF have a positive statistically significant effect on
firm performance and also agency costs have a statistically significant positive
intervening effect on the relationship between FCF and firm performance Additionally
firm characteristics have a positive moderating effect on the correlation between FCF and
financial performance Finally FCF agency costs and firm characteristics have a positive
statistically significant joint effect on firm performance These findings are inconsistent
with the agency theory and the FCF hypothesis Conversely the findings seem to support
the stewardship theory The study therefore recommends that firm managers
shareholders practitioners the government and other regulators should enhance firm
monitoring because the benefits derived from investing therein seem to outweigh the
costs Further research needs to be conducted using longitudinal study design and also by
integrating the views of other practitioners in data collection rather than focusing on firm
managers only
1
CHAPTER ONE INTRODUCTION
11 Background to the Study
The separation of firm proprietorship and management in public firms causes conflict of
interest between firm owners (principals) and firm managers (agents) While the primary
incentive of firm owners is to maximize their wealth by improving firm value the goals
of firm managers are varied and may include enrichment of personal wealth and status
This varying of interests sometimes leads managers to engage in insider dealings where
there are no mechanisms for effective monitoring validation and approving of
managerial decisions (Wang 2010)
Jensen and Meckling (1976) argue that managers opt to extract personal gain from the
firms if they do not hold shares in those firms This has the effect of raising agency costs
which are manifested through investment choices that are not efficient and or managers
not providing sufficient or efficient effort Rising agency costs may eventually affect firm
performance (Tirole 1986) Brush Bromiley and Hendrickx (2000) also hypothesize that
managerrsquos personal-interest encourages wastage and wastefulness when free cash flows
(FCF) are present which similarly could increase agency costs and eventually affect firm
performance Firm characteristics such as profitability firm size liquidity leverage sales
growth age of the firm board structure and composition asset growth turnover
dividend payout and growth prospects are argued to have an influence on the correlation
between FCF and firm performance (Subrahmanyam amp Titman 2001 Kogan amp Tian
2012 and Mukras amp Nzioka 2015)
2
Brush et al (2000) observe that agency theory examines how the behavior of managers
could be focused towards shareholdersrsquo interests to minimize agency costs Jensen and
Meckling (1976) and Jensen (1986) describe three kinds of agency costs First the
monitoring cost of managersrsquo decisions second the bonding cost of restricting
covenants and lastly residual loss due to suboptimal managerial actions The goal of
managers is to enhance personal wealth to the detriment of shareholders The FCF
hypothesis posits that this personal-interest encourages wastage when FCF are present
The stewardship theory is in direct contrast to the agency theory It views managers as
stewards who guard and enhance the wealth of shareholders since by so doing utility
functions of the managers are enhanced (Davis Donaldson amp Schoorman 1997)
Stakeholder theory on the other hand views managers and shareholders among others as
stakeholders and can therefore influence or be influenced by the attainment of the goals
and objectives of the firm (Donaldson amp Preston 1995) The resource based view (RBV)
theory contends that financial firm performance is influenced by firm specific
characteristics (Pierce amp Robinson 2011) Organizational theory on the other hand
attempts to describe the effect of size and firm age on firm performance (Kaen amp
Baumann 2003)
Nyongrsquoo (2000) observes that Kenya has had challenges with regard to the agency
problem and corporate governance (CG) in general The result of these challenges has
been generally low firm profits Ongore and KrsquoObonyo (2011) also note that agency
problems were equally experienced across the globe Several cases of firm failures are an
3
indictment of the efficiency and effectiveness of the current CG structures which fail to
deter FCF related agency costs This research centered on the FCF hypothesis and
agency theory seeks to discover the way agency costs and specified firm characteristics
influence the correlation between FCF and the performance of Nairobi Securities
Exchange (NSE) listed firms Ayako Kungu and Githui (2015) observe that whereas
most NSE listed firms record good performance there are others that have presented
declining performance and yet others have even been delisted from the bourse during the
period between 2003 and 2014 Ongore and Krsquo Obonyo (2011) and Njuguna and
Moronge (2013) have attributed the decline during the period to the agency problem
111 Firm Performance
Gleason and Barnum (1982) define firm performance as a firmrsquos ability to achieve
planned outcomes as measured against projected outputs It encompasses outcomes
associated with shareholder return market performance and financial performance On
the other hand Daft (1995) defines firm performance as the ability to achieve objectives
by expending resources effectively and efficiently Firm performance may also be viewed
as incorporating specifically three areas of organizational outcomes shareholder return
financial return and market performance each with its specific indicators (Richard
Divinney Yip amp Johnson 1999)
Performance is an important concept that is at the centre of a firm and its measurement is
critical in determining whether the firm is achieving the desired objectives Market
performance is measured by assessing customer satisfaction customer retention value
4
delivered to customers and market share While the importance of firm performance is
broadly acknowledged debate on the bases for performance measurement still abound
Researchers should also use operational indicators in addition to using financial
indicators These may include product quality introduction of new products marketing
effectiveness and manufacturing value-addition which may replicate the firmrsquos
competitive position in its industry space and might influence financial performance In
operationalization of firm performance the use of multiple indicator approach would be
superior to the use of only a single indicator (Venkataram amp Ramanujan 1986)
Neely (1998) defined performance measurement systems as comprising of three
interrelated components specific measures that quantify the effectiveness and efficiency
of activities a set of measures that jointly evaluate firm performance as a whole and a
supportive structure that allows data to be collected organized examined deduced and
disseminated Performance measurement is therefore multidimensional On the other
hand Bourne Neely Mills and Platts (2003) describe it as the practice of measuring
effectiveness and the efficiency of an action Efficiency is a measure of how cost-
effective the resources of the firm are used when providing the specified customer service
while effectiveness is the extent to which customer needs are met
The Balanced Score Card (BSC) was developed by Kaplan and Norton (2001) and it
measures customer satisfaction financial performance growth perspectives learning and
of performance and efficiency of internal business processes The sustainable BSC has
been applied to integrate the social and environmental aspects into effective application
5
of both conventional firm strategy and explicit firm sustainability strategies (Figge Hanh
Schaltegger amp Wagner 2002)
The triple bottom line performance measurement integrates the corporate economic
environmental and social performance (Norman amp MacDonald 2004) while the
International Development Research Centre (IDRC) model conceives firm performance
in three general areas First is performance in actions that support the operation
(effectiveness) second is performance related to the available resources (efficiency) and
lastly performance is related to long-term capability or continuing relevance (Lusthaus
Anderson amp Murphy 1995) Other performance measurement techniques include the
Performance Prism and the Cambridge Performance Measurement Process (Neely
Adams amp Kennerley 2002)
Dyer and Reeves (1995) observe that there are no performance measures universally
appropriate and multiple measures should therefore be used Wang (2010) and Ongore
and KrsquoObonyo (2011) use ROA ROE and Dividend Yield (DY) to measure financial
performance Szewczyk Tsetsekos and Zantout (1996) and Mojtahedzadeh and
Nahavandi (2009) have used Tobinrsquos Q as a market-based measure of a firmrsquos financial
performance Tobinrsquos Q relates the market value of firmsrsquo equity with their
corresponding book values Employee job satisfaction employee turnover organizational
effectiveness and efficiency have been proposed by Gleason and Barnum (1982) as non-
financial measures of firm performance Hubbard (1998) observes a positive significant
6
correlation between FCF and performance which is manifested through prudent
investment
112 Free Cash Flows
The concept of FCF presented by Jensen (1986) refers to surplus cash available after
financing profitable ventures FCF are therefore described as net operating income minus
capital expenditure (CAPEX) minus cost of inventory and paid out dividends On the
other hand Brealey Myers and Allen (2005) describe FCF as net income profit after tax
(PAT) plus amortization and depreciation minus CAPEX minus changes in non-cash
working-capital add net borrowingsloans Richardson (2006) argues that firms which
have surplus funds risk wasting it in ventures that are not profitable and that because
FCF are financial resources at the managersrsquo discretion to apportion they are also
referred to as idle cash flows
FCF denotes funds that a firm is able to generate after setting aside cash needed to sustain
or increase its assets FCF are important because they allow firms to pursue investments
that could improve value to shareholders In the absence of funds it is hard to create new
products and services acquire new projects pay out dividends and pay debts Some
shareholders believe that FCF show a better perspective of the firmrsquos ability to create
profits because while earnings can often be misrepresented through accounting
gimmicks it is more difficult to fake FCF Positive FCF indicate that the firm is
generating more funds than are being used to run the firm and to reinvest Many small
firms do not have positive FCF because they invest heavily to grow their operations It is
7
worth-noting that generally negative FCF detrimental to the firm Negative FCF could
be an indication that the firm is engaged in huge investment projects If high returns are
earned from these investments then there is a long run potential payoff (Chen Sun amp Xu
2016)
Jensen (1986) argues that managersrsquo personal - interest motive leads to waste and
inefficiency when FCF are present because the objective of the managers is to increase
their personal wealth instead of shareholdersrsquo wealth Therefore when FCF are present
the result is internal inefficiency and wastage of firm resources which leads to increased
agency costs and lower firm performance Similarly Wang (2010) observes that in the
presence of surplus FCF managers tend to abuse the FCF resulting in inefficient resource
allocation and wrongful investment
113 Agency Costs
Agency costs refer to the cost that a firm incurs due to incongruent interests of firmsrsquo
management and shareholders (Berle amp Means 1932) Jensen and Meckling (1976) point
out that the incomplete manager and shareholder contractual relationship can result into
the agency problem The agency problem that is caused by the firm managers would
result in a loss to the wealth of shareholders in the following ways first managers from
the characteristic of personal-interest drive would raise perquisite consumption and
shirking behavior that in turn leads to increased agency costs Secondly managers might
fail to choose the highest Net Present Value (NPV) project and instead choose that which
maximizes their own personal interest thereby exposing shareholders to unnecessary
investment risk
8
Jensen (1986) claims that there are three kinds of agency costs the monitoring cost of
managersrsquo decisions the bonding cost of restricting agreementcontracts and the residual
loss due to suboptimal managersrsquo actions Monitoring costs are manifested once the
shareholders try to regulate or control the managersrsquo actions For example the auditors
are engaged by a firm on shareholdersrsquo behalf to check and control the managersrsquo
activities to confirm conduct that increases value for the shareholders The pricecost of
engaging the auditors is therefore considered an agency cost The bonding cost entails
bond covenants or contracts A bond covenant is an agreement that restricts the firm from
venturing in specified actions such as a limitation on dividend payment Firm claims
could be structured in a way that controls shareholdersrsquo motive to follow a strategy that
does not increase the total firm value This inherent cost is an agency cost And lastly
residual loss is the cost sustained from conflicting shareholder and manager interests
notwithstanding the use of monitoring and bonding (Smith amp Warner 1979)
Brush et al (2000) argue that once a firm has generated excess FCF management tends
to misuse the FCF resulting in increased agency costs which could eventually lower
firm performance Khidmat and Rehman (2014) on the other hand observe that agency
costs of monitoring could increase as a result of increased FCF and consequently improve
firm performance This is because the firm is able to invest in better CG mechanisms
which improve monitoring managerial decisions and hence reduced wastage Agency
costs are therefore expected to mediate the correlation between FCF and firm
performance because they are intermediate output of FCF Wang (2010) states seven
proxy agency cost measures earnings volatility total asset turnover floatation costs
9
advertising research and development (RampD) expenses to sales ratio operating expenses
to sales ratio free cash flows and administrative expenses to sales ratio
Tirole (1986) argues that there are two main ways through which agency costs are
manifested the first one is inefficient choice of investment and the second is insufficient
or inefficient effort spent by managers Therefore agency cost measures should be
contingent on inefficient asset utilization (due to poor investment choices) excessive cost
of production and extravagant perks for managers (which results in unnecessarily high
expenditure) and inefficient effort spent by managers (the results of which is lower
revenue and profitability) Asset utilization efficiency is measured by assets turnover
ratio which is described as the ratio of sales to assets It indicates the way managers use
the assets under their control in generating revenue Production cost efficiency on the
other hand is measured as operating expenses divided by sales Singh and Davidson
(2003) observe that a high level of operating expense is a close estimate of managersrsquo pay
and perquisites in terms of high salaries executive and lavish offices and other corporate
support amenities To a large extent these costs reflect discretionary expenditure at the
disposal of firm managers
114 Firm Characteristics
Zou and Stan (1998) define firm characteristics as a firmrsquos managerial and demographic
variables that in turn encompass part of the firmrsquos internal environment Firm
characteristics have been listed by Kogan and Tian (2012) to include firm size leverage
liquidity sales growth asset growth and turnover Others include ownership structure
board characteristics age of the firm dividend pay-out profitability access to capital
10
markets and growth opportunities (Subrahmanyam amp Titman 2001 and McKnight amp
Weir 2008)
Vogt (1997) argues that the more a firm has FCF the more it engages into capital
investment and hence the higher the performance Smaller firms gear towards rampant
growth thereby utilizing most or all the available FCF in a bid to better firm
performance The relationship between FCF and investment is stronger in small and
medium firms which generally are in the growth stage Adelegan (2009) on the other
hand notes that the influence of firm size is neutral and that firms that are older incline
more on internally generated funds to finance their business investments than small and
medium firms
Cline Williamson and Yore (2014) observe that the FCF problem seems to be intense in
medium and large multinationals that are less reliant on the capital market The smaller
firms that fund their investments with funds that are generated externally do not
experience such declines in wealth This is because firms that are larger have
considerably more FCF that are available and are subsequently less dependent on the
external market When high FCF are available the unconstrained manager may
socialistically fund investment projects that have a negative NPV Increased levels of
FCF lead to sub-optimal allocation of resources in form of value-destroying and cross-
subsidizing investment action that eventually deteriorates firm performance
Firm age and performance relationship is to a large extent driven by selection and
learning effects in the early stages of the firmrsquos life Once a firm is older the relationship
11
could be more indirect due to a correlation between age of the firm and ownership
changes product life cycle size of the firm and management Usually firms that are new
require time to adapt to the environment A new firm needs to catch up with an older firm
when the new firmrsquos performance is lower than that of the older (existing) firm so as to
be competitive in the market Therefore it is expected that firms that are new will show
higher growth rates in productivity than the older firms as a result of high FCF Hence
age of the firm is negatively correlated with productivity growth rate because older firms
have lower FCF (Brouwe Kok amp Fris 2005)
Similarly Cadogan and Diamantopoulos (1995) note that as firms become older and
more experienced they tend to be more bureaucratic and inflexible Demsetz and Lehn
(1985) denote firm size as the log of total assets and argue that in smaller firms agency
costs related to the FCF problem may be relatively lower than in larger firms because of
more growth opportunities available for smaller firms Larger firms tend to overinvest
thereby generating a relatively lower return on assets (ROA)return on equity (ROE)
Opler and Titman (1993) maintain that more likely firms that have high growth
prospects are managed better than those with less growth prospects Such firms are also
less likely to have surplus FCF since any available cash would be spent on projects that
have positive NPV Thakor (2013) further argues that foreign cash in firms that have
good growth opportunities should be valued significantly higher than foreign cash in
firms that have poor growth prospects since firms that have poor growth prospects are
more likely to be adversely affected by the repatriation tax burden and FCF problems
12
stemming from a relatively low shadow price of cash This further implies that foreign
cash for firms that have poor investment prospects ought to be valued at a discount while
foreign cash for firms that have good investment prospects should be valued at a
premium
Heydari Mirzaeifar Javadghayedi and Student (2014) postulate that firm characteristics
can expose a firm to more managerial costs and thus decrease the expected positive effect
of FCF on firm performance Firm characteristics are therefore expected to moderate the
correlation between FCF and firm performance because their interaction affects the
strength and or direction of the correlation between the dependent and independent
variables (Baron amp Kenny 1986) This study focused on firm characteristics of firm size
and age of the firm because their influence on the correlation between FCF and firm
performance seem to be more significant (Demsetz amp Lehn 1985 and Mule Mukras amp
Nzioka 2015)
115 Firms Listed at the Nairobi Securities Exchange
NSE is the primary stock market in Kenya Apart from equities the NSE deals with the
issue and trade of debt instruments NSE is a member of East African Securities
Exchanges Association (EASEA) and the African Securities Exchanges Association
(ASEA) and also an associate member of World Federation of Exchanges (WFE) a
subordinate member of the Association of Futures Markets (AFM) Additionally the
NSE is a partner Exchange in the United Nations Sustainable Stock Exchanges Initiative
(SSE) The NSE is a market for securities approved and controlled by the Capital
13
Markets Authority (CMA) and has 63 listed firms (Appendix I) Introduced in 2008 the
NSE All Share Index (NASI) is a general indicator of market performance The NASI
integrates all the daily transacted shares therefore giving the general outline of the value
of the market as opposed to the activities of selected securitiesrsquo prices The daily trading
volume of the market is valued at over US $5000000 and a total market capitalization
estimate of US $15000000000 Corporate bonds government bonds and equities are
also traded at the NSE (NSE 2015)
Odundo (2009) notes that as part of the NSE market transformation program the CMA
introduced market improvements in 2001 which led to the restructuring of the NSE into
four separate segments The Alternative Investments Market Segment (AIMS) Main
Investments Market Segment (MIMS) Fixed Income Securities Market Segment
(FISMS) and the Futures and Options Market Segment (FOMS) Development of the
capital market has remained Kenyarsquos strategic development goal since the mid-1980s
The government has realized significant reforms over the last three decades to underpin
the countryrsquos development prospects including modernization of the NSE which includes
computerization of trading divergence of listed securities and stocks dematerialization
and improvement of regulatory and supervisory structures The NSE is among the fastest
growing stock exchanges in the developing markets and is the largest in East Africa
(Ayako et al 2015)
The NSE (2015) indicates that Kenyarsquos capital market has continued to develop The
NSE signed up six clearing members as the exchange readied itself to introduce a
14
derivatives market These clearing members include Cooperative bank of Kenya
Barclays bank of Kenya NIC bank CBA and CFC Stanbic bank Other banks are slated
to sign up and the clearing members would by executing the principal role of clearing
and settling deals strengthen the NSErsquos abilities to begin derivatives trading The
derivatives mechanisms will primarily comprise currency futures and stock indices and
will work to expand liquidity in the market increasing the boursersquos product offer The
NSErsquos derivative market which received authorization from CMA will permit
derivatives that are exchange traded and created on various underlying financial
instruments that will include equities and currencies
The universal world norm has been a system of central counterparty (CCP) clearing and
reporting represented by the European Market Infrastructure Regulationsrsquo (EMIR) latest
rules Further to demanding central clearing of standardized Over-the-Counter (OTC)
derivatives that wasnrsquot the practice earlier EMIR presented other numerous processes to
minimize counterparty risk a significant matter which led to contagion in the recent
global financial crisis The NSE derivatives contracts will be exchange traded and
therefore clearing members will be critical components of the CCP clearing network
(NSE 2015) The CMA (2010) shows that as of 2008 the most actively traded market in
Africa was South Africa recording over 70 percent of the whole African securities
markets revenue making it the most liquid securities market in Africa with the NSE
ranking 5th
with 02 per cent contribution
15
The NSE listed firms were selected for this study because data is readily available and
also the data is generally deemed credible Ponnu and Okoth (2009) observe that several
challenges ranging from boardroom wrangles poor decision making lack of oversight to
control by various boards of directors and unethical practices have been evident among
the listed firms resulting in a trend of poor performance Similarly NSE (2015) shows
that several listed firms have previously been delisted liquidated or placed under
receivership on account of the agency problem
12 Research Problem
The FCF hypothesis suggested by Jensen (1986) states that firm managers may invest in
needless negative NPV projects when there is surplus FCF at their disposal The
hypothesis suggests that greater levels of FCF could lead to more unnecessary
administrative waste and inefficiency negatively impacting on firm performance
Demsetz and Lehn (1985) find that in the presence of substantial FCF large firms tend to
have fewer growth opportunities than smaller ones which could lead to an
overinvestment problem thereby negatively impacting on firm performance Similarly
Gul and Tsui (1998) note that an escalation in financial leverage seems to diminish
agency costs because managers are subject to legal bonding of repaying interest and debt
that subsequently decreases misuse of FCF and therefore improves firm performance
The agency problem accounting anomalies and other governance manipulations is a
worldwide phenomenon affecting many firms including Enron Corporation of the United
States of America (USA) and China Aviation (Ongore amp KrsquoObonyo 2011) The World
16
Bank (2000) indicates that the failure of major conglomerates such as the Bank of Credit
and Commerce International and WorldCom in the USA and United Kingdom (UK)
respectively has inspired interest in the agency problem and governance The economic
crisis in Asia has also contributed to the rising profile of the agency problem In the East
African region the agency problem and governance have been discussed in the
framework of state-run companies where corruption malpractice and subsidization of
deteriorating firms by the government have been the major issues of concerns The
Kenyan context has been characterized by appeals for active CG particularly for public
firms (Okiro 2014) The recent financial problems facing Fidelity commercial bank
Charterhouse bank Imperial bank and Chase bank could be related to the agency problem
between shareholders and firm managers (Central Bank of Kenya 2016)
Frentrop (2003) has recounted that there is still lack of consensus on identifying the
extent and dealing with the complications that are intrinsic in CG processes Waithaka
Ngugi Aiyabei Itunga and Kirago (2012) observe that FCF have caused conflict between
firm managers and shareholders which in turn have affected performance of NSE listed
firms Similarly Ongore and KrsquoObonyo (2011) noted existence of agency problems
among firms listed at the NSE which negatively affected their performance These
observations are consistent with Nyongrsquoo (2000) who posits that the low firm
performance across the Kenyan economy is primarily due to agency problems and bad
CG practices
17
Globally empirical literature shows mixed findings regarding FCF and firm performance
For instance Nekhili Amar Chtioui and Lakhal (2014) carried out a study in Australia
and found increased agency costs emanating from the presence of FCF Similarly Brush
et al (2000) conducted a study in the USA and found that weak CG caused inefficiency
in the allocation of FCF While these findings support the argument that FCF negatively
affects firm performance on the contrary Gregory (2005) whose study was carried out
in the UK established that the mergers with higher FCF were performing better than
mergers with lower FCF In addition a study by Szewcyzk et al (1996) in the USA
found that shareholders favored firms that had both significant FCF and investment
opportunities that were profitable Locally Wambua (2013) found a positive correlation
between FCF and performance of NSE listed firms which again invalidates the
hypothesis which states that there is a negative correlation between FCF and performance
of the firm Conversely Njuguna and Moronge (2013) found that agency conflicts within
firms listed at the NSE are related to FCF which negatively affects firm performance
Regarding the moderating effect of firm characteristics Hendricks and Singhal (2001)
found that smaller firms tend to have better performance in terms of higher sales growth
Similarly Kinoti (2012) found a statistically positive moderating effect of firm
characteristics (ownership age of the firm firm size and type of industry) on the
correlation between corporate image and performance of the firm Conversely Njeru
(2013) found that firm characteristics did not have a statistically significant moderating
effect on the correlation between market orientation and performance In view of these
18
contradicting results it was necessary to further investigate the moderating influence of
firm characteristics on the correlation between FCF and performance of the firm
Some prior studies portray or tend to equate FCF to agency costs For instance Jensen
(1986) presents his study as ldquoagency costs of FCF corporate finance and takeoversrdquo
while Lin and Lin (2014) describe their study as ldquoagency costs of FCF and biddersrsquo long-
run takeover performancerdquo Furthermore Wang (2010) mentions seven proxy measures
of agency costs and one of the proxy measures equates FCF to agency costs These
studies do not give a clear distinction between agency costs and FCF This study has
attempted to delineate FCF from agency costs and has also attempted to provide linkages
between all the study variables
Wang (2010) and Lin and Lin (2014) excluded CAPEX and net borrowings in their
operationalization of FCF This study included both CAPEX and net borrowings in the
definition of FCF Additionally unlike Njuguna and Moronge (2013) who used asset
utilization efficiency as the sole measure of agency costs this study also incorporated
production cost efficiency to measure agency costs that arise out of monitoring
managementrsquos actions These measures of FCF and agency costs are more robust
Furthermore some of the prior studies are bivariate For instance Njuguna and Moronge
(2013) and Wambua (2013) focused on the influence of agency costs on firm
performance In this study a multivariate analysis was employed where the joint effects
of FCF agency costs firm characteristics and firm performance were all incorporated
While many of the studies were carried out in developed economies such as Australia
19
France UK and the USA this study focused on firms listed at the NSE employing cross-
sectional and panel data research designs
In summary this study sought to fill the identified knowledge gaps which constitute the
research problem as follows first global empirical study findings are mixed and non-
conclusive This study therefore focused on firms listed at the NSE and used panel data
design Secondly the study sought to delineate FCF from agency costs Third the study
incorporated the major firm characteristics of firm size and age Fourth CAPEX and net
borrowings were incorporated in defining FCF Fifth two measures of agency costs were
incorporated and these are asset utilization efficiency and production cost efficiency
Lastly a multivariate study was adopted as opposed to bivariate This research was
guided by the following study question How significant is the influence of agency costs
and firm characteristics on the relationship between FCF and financial performance of
firms listed at the NSE
13 Objectives of the Study
The broad objectives and specific objectives of the study are here-below stated
131 Broad Objective
The broad objective of this research was to determine the effect of agency costs and firm
characteristics on the relationship between FCF and financial performance of firms listed
at the Nairobi Securities Exchange Kenya
20
132 Specific Objectives
i Establish the relationship between free cash flows and financial performance of
firms listed at the Nairobi Securities Exchange
ii Assess the influence of agency costs on the relationship between free cash flows
and financial performance of firms listed at the Nairobi Securities Exchange
iii Determine the influence of firm characteristics on the relationship between free
cash flows and financial performance of firms listed at the Nairobi Securities
Exchange
iv Establish the joint effect of free cash flows agency costs and firm characteristics
on financial performance of firms listed at the Nairobi Securities Exchange
14 Research Hypothesis
H1 Free cash flows have no significant effect on the financial performance of firms listed
at the Nairobi Securities Exchange
H2 Agency costs have no significant intervening effect on the relationship between free
cash flows and financial performance of firms listed at the Nairobi Securities Exchange
H3 Firm characteristics have no significant moderating effect on the relationship
between free cash flows and financial performance of firms listed at the Nairobi
Securities Exchange
H3a Firm age has no significant moderating effect on the relationship between
FCF and financial performance of firms listed at the NSE
21
H3b Firm size has no significant moderating effect on the relationship between
FCF and financial performance of firms listed at the NSE
H4 There is no joint effect of free cash flows agency costs and firm characteristics on
financial performance of firms listed at the Nairobi Securities Exchange
15 Value of the Study
This study was intended to provide insights into knowledge about how agency costs and
firm characteristics influence the relationship between FCF and the financial performance
of NSE listed firms This research examined the validity of the FCF hypothesis agency
theory stakeholder theory stewardship theory RBV theory and the organizational theory
and established linkages between these theories thereby interrogating existing
knowledge to affirm modify or reject it The research community in finance will benefit
from the study because it is intended to aggregate and provide important quantitative
literature that will bridge the existing knowledge gap regarding FCF agency costs firm
characteristics and financial performance of firms listed at the NSE It will also serve as
a foundation upon which more empirical studies will be built hence propagating
knowledge
This study sought to establish the correlation between FCF agency costs firm
characteristics and firm performance Investors firm managers and other practitioners
will benefit from the study because it delineates FCF from agency costs and also brings
out the linkages between FCF agency costs firm characteristics and firm performance
Firm managers are expected to act more prudently and efficiently in their pursuit of
maximizing shareholdersrsquo wealth through better firm performance Investors and other
22
practitioners will build on the understanding of the linkages between these variables to
help improve firm performance
The NSE and the listed firms have high growth potential given the various initiatives
being undertaken at the bourse such as demutualization restructuring and introduction of
derivatives trading The government NSE and CMA stand to benefit from this study
because the insights and intuitions gained from the study will help in the development
and improvement of existing policies guidelines and regulation
16 Operational Definition of Terms
The key study variables have been defined as follows
161 Free Cash flows
The term free cash flows refers to the sum of surplus funds available after funding
profitable projects This is described as net income plus depreciation and amortization
less capital expenditure less change in non-cash working capital plus net borrowing
(Brealey Myers amp Allen 2005)
162 Agency Costs
Agency costs refer to the cost that a firm incurs due to inconsistent interests of
management and shareholders (Berle amp Means 1932)
23
163 Firm Characteristics
Firm characteristics refer to a firmrsquos demographic and managerial variables which in turn
comprise part of the firmrsquos internal environment Firm characteristics include firm size
leverage liquidity sales growth asset growth and turnover age of the firm dividend
pay-out profitability access to capital markets and growth opportunities (Zou amp Stan
1998 Kogan amp Tian 2012 Subrahmanyam amp Titman 2001 and McKnight amp Weir
2008) This study focused on firm size and age of the firm
164 Firm Performance
In this research the term firm performance is used interchangeably with organizational or
corporate performance Firm performance refers to an assessment of an organization in
terms of its ability to achieve its stated objectives over a given period of time Firm
performance is broad and has to be studied with reference to its indicators A firm that is
able to meet its objectives is considered to be successful (Sagwa 2014) For this study
firm performance was measured in terms of financial performance
Financial performance perspective may be measured using Tobinsrsquo Q ROA ROE DY
sales growth rate market share productivity and profitability among others This study
used Tobinrsquos Q to measure financial performance Tobinrsquos Q compares the market value
of a firmrsquos equity with its corresponding book values
24
17 Organization of the Thesis
This thesis contains six chapters The first chapter has the introduction and background to
the study The NSE has also been discussed the research problem research objectives
value of the study scope and how the study is organized In chapter two the theoretical
framework on which the study is based has been discussed
The chapter reviews the theoretical and empirical literature relating to the linkages among
the study variables The theories reviewed are The free cash flow hypothesis agency
theory stakeholder theory stewardship theory RBV theory and the organizational
theory
Empirical literature has focused on the relationships among the variables as follows FCF
and firm performance FCF agency costs and firm performance FCF firm
characteristics and firm performance FCF agency costs firm characteristics and firm
performance A summary of knowledge gaps has been presented and finally the chapter
ends with the conceptual framework that guides the study and the conceptual hypotheses
Chapter three has identified and discussed the philosophical orientation the study design
and population of the study
Additionally it has highlighted data collection methods reliability and validity
considerations operationalization of the study variables and analytical data models
Chapter four presents the findings of the general data analysis starting with test of
25
validity and reliability then the descriptive statistics including frequency tables
percentages standard deviations means and Cronbachrsquos Alpha Coefficient of reliability
A presentation of the results of the test of hypotheses and interpretation has been featured
under chapter five The chapter has concluded by a discussion of the resultsfindings
Chapter six gives a summary of the findings conclusion study implications limitations
and recommendations for further studies
26
CHAPTER TWO LITERATURE REVIEW
21 Introduction
The chapter has explored the theoretical foundations of the study Empirical literature has
also been discussed under four sections as follows First FCF and financial performance
second FCF agency costs and financial performance third FCF firm characteristics
and financial performance and lastly FCF agency costs firm characteristics and
financial performance
This chapter also gives a summary of knowledge gaps a graphical framework of the
study variables (FCF agency costs firm characteristics and financial performance)
depicting the researcherrsquos conceptualization of the study It then concludes with the
conceptual hypotheses
22 Theoretical Foundation of the Study
The theoretical framework upon which this study is based is varied Six theories have
been discussed and these are FCF hypothesis agency theory stakeholder theory
stewardship theory RBV theory and the organization theory The research sought to
establish the influence of agency costs and firm characteristics on the correlation between
FCF and performance of NSE listed firms
Although the agency theory stakeholder theory stewardship theory RBV theory and the
organization theory contribute heavily in attempting to explain the interaction between
27
the identified variables and their combined effect on firm performance the FCF
hypothesis is the overarching theory on which this study is founded
221 Free Cash Flow Hypothesis
The notion of FCF was initially suggested by Jensen (1986) where FCF was described as
net cash flow after subtracting all the needs of positive NPV ventures Jensen (1986)
submits that when there are surplus FCF the severity of the agency conflict between firm
shareholders and firm managers is higher The reason for the conflict is that when there is
excess cash in the firm there is no need for the management to raise cash from the capital
market This gives firm management the freedom to spend invest without being
monitored by capital providers as would have been the case if such funds were raised
from the capital market Shareholders would rather have such excess funds distributed
back to them through share repurchase programs or as dividends if the growth
opportunities for the firms are limited and the funds could not be prudently invested
elsewhere Management on the other hand would waste the surplus funds in unprofitable
investments administrative waste and managerial perks
FCF hypothesis postulates that when firms have made significant FCF and the firms do
not have gainful investment projects available firm managers tend to misuse the FCF
which consequently raises agency costs Critics of the FCF hypothesis claim that it
nurtures short termism by discouraging investment that would bring profit in the long-
run This study is related to the FCF hypothesis because based on the observation by
Brush et al (2000) managersrsquo personal-interest inspires wastefulness and ineffectiveness
28
when there is surplus FCF This study sought to establish the influence of agency costs
and firm characteristics on the relationship between FCF and firm performance In this
study therefore it was expected that FCF would have a negative effect on firm
performance
222 Agency Theory
The agency theory was advanced by Jensen and Meckling (1976) and it avows that
shareholders who are the owners (principals) of the firm hire firm managers (agents)
The principal expects the agent to make decisions and act in the ownerrsquos principalrsquos best
interest The managers agents may however have self-interests that conflict with the
interests of the principals Brush et al (2000) observe that agency theory is founded on
the principle that the objective of the management is to achieve their individual interests
instead of shareholdersrsquo interests and that managersrsquo personal-interest encourages waste
and ineffectiveness when there are surplus FCF
Agency theory suggests mechanisms that aim to resolve the shareholder interests and
those of the management The mechanisms include external control measures like
takeovers (Easterwood 1997) The potential for conflict between shareholders and
managers may also be minimized by the use of internal control measures like non-
executive directorsrsquo monitoring and executive share ownership incentives The advocates
of agency theory postulate that control measures are mandatory for directing dishonest
managerial actions Critics on the other hand argue that control creates stronger personal
behavior lessens proactive organizational actions and honesty and lastly results in
suspicion (Jensen amp Meckling 1976)
29
Divergences in goals and attitude towards risk and decentralization in information are
tenets of the agency theory If the information asymmetry and conflict of interestsrsquo
assumptions and are allayed the agency problem then becomes inconsequential and not
of any interest scientifically If there were no information asymmetry the principal would
simply direct and control the agentrsquos actions and appropriately reward the agent If the
principal and the agent have consistent interests then the agentrsquos incentives are clear
(Podrug 2010)
A critique of the agency approach is that the analytical focus on how to resolve conflict
between the various stakeholders in the firm is too narrow and the shareholders are not
the only ones who make investment in the firm (Donaldson 1990) Additionally Hill
(1990) has argued that even in situations of very specific assets where the possibility of
unscrupulousness is very high there are people who will give precedence to collaboration
and trust and will not initiate opportunistic behavior Just like the FCF hypothesis this
research is related to the agency theory because it is centered on conflict of interests
between firm managers and shareholders One of the objectives of this study is to
determine the influence of agency costs on the relationship between FCF and firm
performance It was expected that the higher the agency costs the higher the effect on the
relationship between FCF and firm performance
223 Stakeholder Theory
Developed by Freeman (1984) stakeholder theory combines business accountability to a
wide collection of stakeholders The theory advances that the management of firms has a
30
network of relationships to serve in its stakeholdersrsquo circle in its achievement of
corporate goals The theory develops the understanding of corporate accountability to
include a broad collection of stakeholders such as customers suppliers business
associates employees government and its agencies financial institutions among others
A stakeholder is defined as any person or group which can influence or is influenced by
the attainment of the personrsquos or grouprsquos objectives
Mitchell Agle and Wood (1997) maintain that a stakeholder may be recognized by
looking at either one or two or all the associative aspects namely first the clout to impact
the firm secondly the legality of affiliation in or with the firm and lastly the
earnestness of their entitlement in or on the firm Unlike agency theory in which the
management work and serve the shareholders stakeholder theorists propose that firm
management has a relationships network for service and these include employees
business partners and suppliers Stakeholder theory attempts to address the collection of
stakeholders eligible and demanding managersrsquo attention (Sundaram amp Inkpen 2004)
Donaldson and Preston (1995) have argued that all stakeholders participating externally
or internally in the firm have an interest to fulfill This includes the characteristics and
behavior of firms incorporating how the firm is run how the board of directors thinks
about firm units the way management think about organization and the nature of the firm
itself In this regard the firm should strive to satisfy not only the welfare of its
shareholders but also the welfare of other relevant stakeholders Hence the board should
ensure that the firm acts on opportunities that enhance value to all the relevant
31
stakeholders and also prevent bad management practices that may expose the firm to
scandals or risk financial distress To achieve these the board should consist of more
members with diverse competencies experience as well as capabilities that will
effectively discharge its governance function
The stakeholdersrsquo model has been criticized by Donaldson and Preston (1995) arguing
that managers may use ldquostakeholderrdquo reasons to justify poor performance Mansell (2013)
has also critiqued the stakeholder theory stating that by using the political notion of a
lsquosocial contractrsquo to the firm stakeholdersrsquo theory weakens the values upon which a
market economy is founded The stakeholder theory is relevant to this study to the extent
that shareholders and firm managers are considered as lsquostakeholdersrsquo and therefore can
influence or are influenced by the accomplishment of the organizationrsquos goals This
theory implies that the relationships of the variables in this study can take any direction
positive negative or no relationship
224 Stewardship Theory
Developed by Donaldson and Davis (1991) stewardship theory has its origins in
sociology and psychology A steward guards and strives to maximize the shareholderrsquos
interests through firm performance since in doing so the value of the steward is also
maximized From this perception the steward is the firm management who work for the
shareholders defending and making returns for them Stewardship theory emphasizes the
role of firm management being stewards incorporating their objectives as part of the
firm Therefore as stewards they are contented and encouraged when the firmrsquos success
is accomplished The stewardship theory is quite the opposite of the agency theory It
32
submits that firm managers are honest and upright stewards of the assets delegated to
them under their care and thus making monitoring useless The theory opposes the
agency theory which assumes that managers will act to satisfy their own self-interest
rather than that of the firm Rather stewards who are managers executives and board of
directors are satisfied and motivated when firm objectives are achieved (Donaldson amp
Davis 1991 and Davis et al 1997)
Davis et al (1997) argues that stewards derive greater utility at personal level by
satisfying firm objectives than through self-serving behavior and as such the managers
and directors are also concerned about their personal reputation as expert decision
makers which drives their effort towards better firm performance of the firms they serve
According to the stewardship theory other non-financial motivations such as need for
accomplishment and gratitude personal fulfillment gained by successful achievement of
the goals of the firm respect for authority and peers as well as the firmrsquos work ethics do
impact on the actions of the stewards Superior firm performance is connected to having
majority of inside directors as opposed to external directors since inside directors know
the firm better and are better placed to manage than outside directors
Daily Dalton and Cannella (2003) discern that in order to guard their reputation as
decision makers in firms firm managers are motivated to run the firm with the main
objective of maximizing firm performance Similarly Fama (1980) suggests that firm
managers are also protecting their careers so as to be seen as efficient and effective
stewards of their firms Davis et al (1997) have critiqued the stewardship theory arguing
33
that the role of the lsquostewardrsquo is over-simplified and impracticable and that the theory
emphasizes the personalities and egos of senior directors The stewardship theory is
related to this study to the extent that firm managers are considered lsquostewardsrsquo who act on
behalf of shareholders Just like the stakeholder theory stewardship theory adds value
especially in explaining outcomes where the FCF hypothesis and agency theory are not
supported Since this theory emphasizes the role of firm managers being that of stewards
it was expected that the higher the FCF the higher the firmrsquos performance
225 The Resource Based View Theory
RBV is defined by Pearce and Robinson (2011) as a way of examining and recognizing a
firmrsquos strategic advantages based on observing its distinct mix of skills assets
intangibles and capabilities The RBV theory is concerned with internal firm-specific
factors and their effect on performance Grant (1991) observes that RBV theory views the
firm as a bundle of resources that are combined to generate firm capabilities which it can
use to earn above average profitability Every firm develops capabilities from these
resources and when they are well established these become the basis of the firmrsquos
competitive advantage Penrose (1959) explains the significance of exceptional
packagesbundles of resources controlled by the firm which are critical for performance
These firm resources comprise of tangible assets all capabilities attributes of the firm
organizational processes knowledge and information controlled in order to expand
competence effectiveness and efficiency that will in general lead to greater financial
performance
34
Resources are defined as firm capabilities physical assets and intangibles that are semi-
permanently tied to the firm (Wernerfelt 1984) Barney (2002) observes that the RBV
competitive advantage stems from a firmrsquos unique assets and distinctive capabilities and
assumes that firms can be hypothesized as bundles of resources and that those resources
are heterogeneously dispersed across the firms with resource variances persisting over
time Similarly Baker and Sinkula (2005) note that RBV of the firm suggests that
performance is contingent on the firmrsquos competences and specific resources
The thirst to understand the effects of firm level characteristics on financial performance
has been debated a lot in the research arena Among the arguments presented is that a
firmrsquos financial performance is affected only by structural characteristics within the
industry The other argument is that a firmrsquos financial performance is affected by firm
specific resources Much focus has been given to the firm level characteristics as opposed
to the industry level characteristics because it forms the basis upon which the firms
compete The industry related factors is majorly explained by the competitive focus
approach The RBV theory explains the effect of firm characteristics which are internal
factors to the firm with respect to financial performance (Bain 1959 and Porter 1980)
Researchers have carried out studies to test which of the two commonly disputed factors
(industry factors or firm specific factors) are important in explaining variations in firm
performance Wernerfelt and Montgomery (1985) Schmalensee (1985) Rumelt (1991)
Chang and Singh (2000) and Hawawini Subramanian and Verdin (2003) performed
variance component analysis test to establish the percentage of effects of firm
35
characteristics and industry factors on firm performance as measured by ROA Under the
RBV the firm is seen to be heterogeneous and firms possess a combination of unique
capabilities and assets that are responsible for giving them an upper hand in competition
and enable them achieve superior performance
Wernerfelt (1984) was the earlier supporter of the RBV theory but he did not get much
attention at the time However scholars such as Grant (1991) Stalk Evans and Schulman
(1992) and Williams (1992) revisited Wernerfelt (1984) and found that firms with
particular set of skills and capabilities outperformed their rivals Wernerfelt (1984)
describes a resource as ldquoanything that could be deemed as a strength or weaknessrdquo
According to the RBV of the firm resources (which are inputs for the production of
goods and services) and organizational competences (intangible assets that are founded
learning skills and knowledge in deploying resources) can be sources of competitive
advantage The RBV is criticized for its failure to describe how these resources are
established and organized to realize competitive advantage RBV has also been critiqued
for its inability to contemplate the effect of a dynamic market environment (Lengnick-
Hall amp Wolff 1999 and Priem amp Butler 2001)
Another criticism of the RBV theory is that researchers only concentrate on one resource
type that is intangible assets within a single industry and examine its effect on firm
performance The RBV theory helps in explaining performance variation of intra industry
firms as it specifically addresses firm characteristics rather than industry factors
Financial resources are normally measured by leverage ratios which enable the firm to
36
increase its project financing by borrowing from debt providers Liquidity measures
spontaneous financial resources available to conduct normal business operations
Physical resources as measured by the size of assets is one of the tangible resources the
firm can use to gain competitive advantage while business experience of the firm and
serving board of directors give the firm organizational capabilities that it can use to gain a
competitive advantage over its competitors thus being able to earn an above average
financial performance
The boards of directors are viewed as strategic resources that are responsible for the
advancement of the firms to meet their long-term objectives (Kapelko 2006) RBV is
related to this study because it maintains that a firmrsquos financial performance is influenced
by firm specific characteristics (which are one of the study variables) Based on the RBV
therefore it was expected that the higher the FCF the higher will be firm performance
Firm characteristics were expected to provide an interaction which statistically affects the
strength and or direction of the correlation between FCF and firm performance
226 Organizational Theory
Kaen and Baumann (2003) in an attempt to explain firm size came up with the
organizational theory that explains firm size in relation to profitability as well as
organizational transaction costs agency costs and span of control costs Organizational
theory explains the effect of firm size and age of the firm on firm performance Dean
Robert and Bamford (1998) cite that the size of the firm is somewhat correlated to firm
performance because of concentration industry-sunk costs overall industry profitability
37
and vertical integration Firm size matters in assessing financial performance Large-sized
firms have greater number of departments multi-layer levels of management have more
specialized functions and skills greater formalization and management control is highly
centralized which makes them highly bureaucratized than small-sized firms effectively
making them miss out on profitable opportunities that require urgent attention (Daft
1995)
Hannan and Freeman (1984) Aldrich and Austen (1986) and Meyer and Zucker (1989)
have linked firm size and age of the firm to Inertia Inertia is described as an insufficient
or sluggish adjustment to transformation or opposition to major variations in business
operations which in effect may cause the firm to miss profitable opportunities
Stinchcombe (1965) claims that firms that are older seem to be more experienced and
enjoy the benefits of improvement curve effect which makes them not to be exposed to
the problems of newness and hence enjoy above average performance
Penrose (1959) argues that larger firms are able to generate superior performance because
they have diversified capabilities ability to fully exploit economies of scale and scope
Such firms have formalized procedures of conducting business which ultimately makes
implementation of operations more effective On the contrary Leibenstein (1976) and
Shepherd (1986) argue that firm size is correlated with market power and along with
market power inefficiencies are created leading to inferior performance Thompson and
McHugh (2002) have critiqued the organization theory regarding it as being essentially
38
prescriptive There is an implied belief in underlying values or laws that govern
managersrsquo activities and functions
Another weakness of the organization theory cited by Salaman (1979) is the assumption
that all firms are in some way alike arguing that some firm analysts develop propositions
about firms in general lumping together such dissimilar examples as voluntary
establishments charities and political associations Salaman (1979) observes that it
hinders the analysis of those organizational elements which are radically exposed in
employing firms and not necessarily in all forms of organization Organizational theory
is related to this study because it explains the effect of firm size and age of the firm
(which are firm characteristics) on firm performance These are integral variables in this
study Since the theory cites conflicting views for instance bureaucracy in larger firms
which negatively affects performance on the one hand and economies of scale and
diversified capabilities in larger firms which positively affect firm performance on the
other hand it was expected that the relationship among the study variables would take
any direction Firm characteristics would moderate the relationship between FCF and
firm performance by statistically influencing the strength and or the direction of the
correlation between the predictor and explanatory variables
23 Free Cash Flows and Firm Financial Performance
Wang (2010) studied the impact of FCF on firm performance with empirical data from
Taiwan Stock Market for the period 2002 to 2007 Using a sample of 505 firms
regression analysis was employed in data analysis The study found that FCF had
39
statistically significant effects on firm performance These effects were however
conflicting On the one hand the presence of high FCF escalated imprudent expenditures
that consequently lowered firm performance The results indicated on the other hand that
FCF were generated due to managersrsquo efficiency in operations implying that a positive
correlation between FCF and firm performance
However in his definition of FCF Wang (2010) did not take into account CAPEX and
net borrowings which are critical in the FCF definition Additionally the study focused
on financial performance only The findings by Wang (2010) are partially consistent with
results by Gregory (2005) who studied the long run abnormal performance of UK
acquirers and the correlation between FCF and firm performance Gregory (2005)
established that mergers with greater FCF achieved better than those with lesser FCF
While testing the hypothesis the study used ldquolong term returnsrdquo and also ldquoanalyzed
announcement month returnrdquo However the study did not include daily returns around
announcement which could probably yield different results Furthermore the study
focused on financial performance outcomes only
Brush et al (2000) studied the proposition that sales growths in firms with FCF were less
lucrative than sales growths for firms with lower FCF Data was obtained from firms in
the USA covering eight years 1988 to 1995 and used Tobinrsquos Q to ascertain whether
firms had positive NPV projects available to determine FCF Returns to shareholders
were used as a performance measure The use of shareholder returns was criticized by
Bromiley (1990) because it assumes capital market efficiency which argues that the
returns to a large extent reveal surprises to the market Therefore if the markets expect
40
firmsrsquo sales growths and profitability even very profitable sales growths should not be
reflected in shareholder returns in the periods in which they arose The study found that
firms with higher FCF achieve lower from sales growth than those without or with lower
FCF Since sales growth is a measure of firm performance these findings support the
argument that FCF negatively affects firm performance
The findings by Wang (2010) and Gregory (2005) on the one hand and Brush et al
(2000) on the other hand reveal inconsistencies These contradictions indicate that the
correlation between FCF and firm performance is still unresolved In this study a more
robust measure of FCF was adopted For instance Wang (2010) measured FCF as net
operating income before depreciation minus tax expense minus interest expense minus
share dividends scaled by net sales In this study FCF are defined as in Brealey et al
(2005) as net income add amortization and depreciation minus CAPEX less change in
non-cash working-capital plus net borrowing The study is therefore expected to yield
more reliable and robust results
24 Free Cash Flows Agency Costs and Firm Financial Performance
Lin and Lin (2014) investigated the agency costs of FCF and biddersrsquo long-run takeover
performance in Australia using data for the period 1993 to 2000 The final sample
included 556 acquiring firms The study introduced two proxies of FCF excess
accounting cash flow and excess cash holdings and tested the relationship between
biddersrsquo long-run post-acquisition performance and the level of excess cash The findings
41
indicated that the level of excess cash holdings didnrsquot show a substantial reason for the
cross-sectional disparity in long-run post-acquisition performance
The findings from the flow measure of cash indicated that the acquisitions done by
bidders with surplus accounting cash flow didnrsquot escalate agency costs and therefore were
not value reducing Rather bidders with greater surplus accounting cash flows had better
long-run post-acquisition performance The findings therefore indicate that the
examination of FCF hypothesis in the Australian takeover market is conflicting to the
expectations of the FCF theory This finding is contrary to the argument that substantial
FCF increases agency costs which subsequently negatively impacts on firm performance
However Lin and Linrsquos (2014) definition of FCF ignores CAPEX and net borrowings
which are critical variables
Nekhili et al (2014) analyzed the intervening effect of agency costs of monitoring and
ownership structures in reducing earnings management practices when there is FCF The
sample comprised of 85 French listed firms for the period 2001 to 2010 The results
highlighted the unscrupulous managerial behavior in the presence of high FCF The study
measured FCF by multiplying the retained cash flows by the inverse of Tobinrsquos Q
However like in Lin and Lin (2014) CAPEX and net borrowings were omitted in the
definition of FCF The findings indicated that firms which had high FCF tended to
upwardly manage their earnings Additionally with the availability of high FCF the
tendency of firm managers to use discretionary accruals depended on the firm ownership
and the efficiency and effectiveness of governance mechanisms Precisely independence
42
of audit committees and external audit quality together with firm ownership structure (for
example institutional investors and executive ownership) reduced the extent of earnings
management when FCF were available
Conversely independent directorsrsquo ownership and board independence had no significant
effect on earnings management The results indicate that firm executives employ earnings
management practices that escalate reported earnings This implies that there are
increased agency costs emanating from the presence of high FCF subsequently
negatively affecting firm performance The negative effect of agency costs on the
correlation between FCF and firm performance is also supported by Brush et al (2000)
These results are of interest to this study because the research tried to find out the effect
of agency costs and firm characteristics on the correlation between FCF and performance
of NSE listed firms Agency costs are expected to mediate the correlation between FCF
and firm performance because they are the intermediate output of FCF
25 Free Cash Flows Firm Characteristics and Firm Financial Performance
Demsetz and Lehn (1985) studied the firm characteristics that included structure of
corporate ownership and firm size using 511 firms in the USA Size of the firm was
measured by the mean annual common stock market value and the study period was
1976 to 1980 Ordinary least squares (OLS) regression estimates were employed in data
analysis The findings suggest that in the presence of substantial FCF large firms tend to
overinvest thereby yielding relatively lower performance Large firms tended to have
fewer growth prospects than smaller firms and in the absence of good growth prospects
43
an overinvestment problem is likely to arise thereby negatively impacting on the firmrsquos
performance However the choice of a five-year study period seems too short Literature
indicates that 7 to 10 yearsrsquo study period is preferred (Brush et al 2000 and Nekhili et
al 2014)
In examining the degree of firm level over-investment of FCF Richardson (2006) used
an accounting-based structure to measure over-investment and FCF and confirmed that
over-investment was dominant in firms with the greatest FCF levels The study was
carried out in the USA and used a sample of 58053 firms for the period 1988 to 2002
The study also examined whether there was any association between firmsrsquo governance
structures and FCF over-investment The empirical analysis employed two steps In the
first step the study used an accounting-based structure in measuring both over-
investment and FCF The study defined FCF as cash flow over and above what was
needed to sustain assets in place and to fund new investment projects On the other hand
over-investment was described as investment expenditure over and above that needed to
retain assets in place and to fund probable new investments In measuring over-
investment the study decomposed total investment outlay into two component parts
First it needed investment spending to sustain assets in place and secondly investment
spending in new projects
In the next step the study decomposed investment expenditure into expected investment
outlay and over-investment in negative NPV projects where the latter varied with the
firmrsquos growth prospects industry affiliation funding constraints and other aspects
44
Although the study incorporated the firm characteristics of size liquidity and growth
prospects it focused on financial performance measures only Furthermore the study
excluded age of the firm Results suggest that some governance mechanisms like the
existence of shareholders who are activists seem to lessen over-investment Additionally
firm performance in the presence of FCF was found to be lower in firms with higher
liquidity than those with lower liquidity The findings are consistent with Harford (2002)
who found that cash-rich firms were more probable to undertake acquisitions that
consequently suffer abnormal failures in operational performance
Brouwer et al (2005) investigated whether age of the firm accounted for productivity
differences Data was obtained for the period 1994 to 1999 and the focus was on Dutch
firms Although the dataset included firms from all age cohorts (0-4 years and 5-9 years)
the study focused more on firms of at least 10 years of age Using regression methods the
results showed very few signs of a relationship between productivity (performance) and
age Both growth rate and level of productivity varied between sectors and also differed
with size of the firm There was also no indication that productivity growth rate was
related to the age of the firm On productivity level there were very few signs of the
effects of age The Brouwer et al (2005) study did not fully exploit the panel structure of
the dataset that was available The explicit techniques of estimation that take account of
this structure such as multilevel or panel data estimation techniques are expected to be
more effective
45
Conversely Power (1998) found a negative relationship between the growth rate of
productivity and age at a certain phase in the firmsrsquo lifespan Power (1998) examined the
relationship between plant age and productivity for firms in the manufacturing industry of
the USA for the period 1972 to 1988 The study found that productivity growth rates
decline with age which was credited to the effects of learning Firm characteristics are
expected to moderate the correlation between FCF and performance because their effect
is statistically characterized as an interaction affecting the strength and or direction of
the correlation between FCF and firm performance (Baron amp Kenny 1986)
26 Free Cash Flows Agency Costs Firm Characteristics and Firm Financial
Performance
Investigating the agency costs of FCF corporate finance and takeovers Jensen (1986)
sampled top 200 firms in the oil industry in the USA and found a link between the agency
problem with FCF firm characteristics and firm performance Using regression methods
results suggest that firm managers might misappropriate FCF at their disposal when the
firm does not readily have viable investment opportunities and that agency costs are high
when FCF are combined with poor growth prospects Results also indicate that more debt
would increase efficiency by compelling firms with large FCF but few high-return
investment projects to pay back cash to the creditors Leverage helps in preventing such
firms from misappropriating resources on low-return projects
For industries that are declining within the industry mergers would generate value while
outside industry mergers would likely generate lesser value or negative-returns Mergers
46
within the food industry seemed to reflect the spending of FCF The industry seemingly
generated large cash flows with few growth prospects The findings however seem to be
contradicting because they also indicate that increased leverage escalates agency costs
As leverage increases the typical agency costs of debt rise which include bankruptcy
costs that subsequently negatively affects firm performance
Mojtahedzadeh and Nahavandi (2009) investigated the relationship between agency
problems that arise due to FCF with long term profitability and income management
Using Tobinrsquos Q to measure long term profitability and Adjusted Jones Model to estimate
Discretionary Accruals (DA) panel analysis was used to analyze the data Results from
testing 106 firms listed on Tehran Stock Exchange throughout the years 2003 to 2007
reflect that agency costs emanating from the availability of substantial FCF negatively
affect both long term and short term profitability However the five-year period of study
seems too short and also non-financial performance outcomes were ignored in the study
Similarly Nunes Serrasqueiro and Sequeira (2009) investigated 75 Portuguese service
oriented firms to establish the effect of firm size on profitability (performance) They
introduced control variables of growth prospects leverage liquidity and asset structure
(tangibility)
The study used both dynamic estimators and static panel models Results indicated a
positive statistically significant correlation between firm size and performance They
also found a positive effect of growth prospects and liquidity on profitability but a
negative effect on leverage and asset tangibility on profitability as measured by ROA
47
Results also indicated that substantial FCF negatively affected profitability of the firm
The data employed was for the period 1999 to 2003 a duration which seems too short A
longer study period of seven to ten years would probably yield different results
Milne Purda and Anand (2008) used 1200 Canadian firms for the period 1999 to 2003 to
test the hypothesis that independent boards are more prone than non-independent boards
to willingly embrace mechanisms intended to improve their ability to monitor firm
management The study examined seven mechanisms both in aggregate and individually
through construction of an index that allocated one point for each mechanism embraced
up to a maximum of seven points and conducted multivariate regression analyses in
which the explanatory variable was either the full or the reduced index
Results indicate that the board of directors vigorously monitors decision makers who
have an inclination towards diverting firm resources to their own personal interests as a
consequence of the agency problem and FCF hypothesis thereby negatively impacting on
firm performance The findings also offer evidence that a relatively large number of
acclaimed monitoring mechanisms have been embraced by firms and that the acceptance
rate increases for firms with both independent and executive boards However the Milne
et al (2008) study didnrsquot integrate alterative views for the board of directors such as
influencing management decisions using the advisory role The study also ignored
procedures other than board monitoring that may serve to lessen agency costs
48
Locally Wambua (2013) examined the effects of agency costs on performance of NSE
listed firms The study used regression analysis and results indicated a positive
correlation between FCF and firm performance Furthermore the study found that
liquidity firm size and ownership concentration positively influenced performance of the
listed firms However the study did not incorporate firm age Conflicting results were
found by Njuguna and Moronge (2013) who studied the influence of managerial behavior
of agency costs on performance of firms listed at the NSE Using descriptive research
methodology results indicated that information asymmetry is a source of agency costs
and that agency problems are usually related to FCF In operationalizing the agency costs
however Njuguna and Moronge (2013) used total asset turnover as the only measure of
agency costs and also focused on financial outcomes only
To fill these knowledge gaps this study used two measures to fully integrate agency
costs The two agency cost measures used in this study are operating expenses to sales
ratio and sales to assets ratio These two measures are better measures of agency costs
because they tend to incorporate managerial asset utilization efficiency and production
cost efficiency (Singh amp Davidson 2003 McKnight amp Weir 2008 and Fauver amp
Naranjo 2010)
27 Summary of Knowledge Gaps
Empirical literature shows mixed findings regarding FCF agency costs firm
characteristics and firm performance For instance Jensen (1986) found a negative
correlation between FCF and firm performance results suggesting that management
49
might abuse FCF at their disposal Similar findings are recorded by Brush et al (2000)
Mojtahedzadeh and Nahavandi (2009) Wang (2010) Wambua (2013) Njuguna and
Moronge (2013) and Nekhili et al (2014)
Gregory (2005) on the other hand established that mergers that had a greater degree of
FCF performed better than those with lower FCF Similarly Szewcyzk et al (1996) and
Chang et al (2007) find that investors favored firms with both profitable investment
opportunities and significant FCF Likewise Lin and Lin (2014) established that the
acquisitions made by bidders with surplus FCF were not value decreasing Instead
bidders with higher excess FCF had better long-run post-acquisition performance
This research attempted to fill the following knowledge gaps first the influences of
agency costs and firm characteristics (firm size and age of the firm) on the correlation
between FCF and financial performance of the firm were all integrated Secondly FCF
were measured more robustly by incorporating CAPEX and net borrowings Thirdly
unlike in prior studies such as Wang (2010) and Njuguna and Moronge (2013) which
only focused on asset utilization efficiency to measure agency costs this study employed
two different measures for agency costs First is the asset utilization efficiency and
second is the production cost efficiency The two measures are better because they tend
to fully integrate agency costs Lastly the study used cross-sectional panel data design
The study therefore sought to affirm modify or reject existing empirical literature by
bridging the gaps identified in prior studies
50
Table 21 Summary of Knowledge Gaps
Researcher(s) Focus of Study Methodology Findings Knowledge Gaps How this Study
Addressed Gaps
Demsetz and
Lehn (1985)
Structure of corporate
ownership Causes and
consequences
The study
employed OLS
regression
estimates with
sample of 511
firms in the USA
In the presence of
substantial FCF
large firms tend to
overinvest thereby
negatively
impacting on firm
performance
The study
considered a five-
year period which
seems too short and
the focus did not
include FCF and
agency costs
This study employed
a ten year period
focused on FCF
agency costs firm
characteristics and
performance of firms
listed at the NSE
Jensen (1986) FCF agency costs
corporate finance and
takeovers
The study used
regression analysis
on 200 firms in the
oil industry in the
USA
Managers might
misuse FCF at their
disposal when
investment
opportunities are
not available
The study did not
incorporate firm
characteristics
This study included
firm characteristics
(age and size)
Szewcyzk et
al (1996)
The role of investment
opportunities and FCF in
explaining RampD induced
abnormal returns in the
Used regression
analysis and
measured
performance using
Shareholders
favored firms that
had both high FCF
and profitable
Focus variables
omitted agency
costs
The variables for this
study are FCF
agency costs firm
characteristics and
51
Researcher(s) Focus of Study Methodology Findings Knowledge Gaps How this Study
Addressed Gaps
USA firms Tobinrsquos Q investment
opportunities
firm performance
Gul and Tsui
(1998)
Tested the hypothesis
that FCF and director
stock ownership
interaction was less
likely to occur for firms
with high levels of
leverage
Studied 157 low
growth Australian
firms and used
OLS regression
analyses
Results suggested
that an increase in
financial leverage
seemed to reduce
agency costs
The study ignored
the influence of
liquidity and also
focused on low
growth firms only
This study focused on
firm characteristics of
firm size and age of
the firm
Brush et al
(2000)
FCF hypothesis for sales
growth and firm
performance The study
was conducted in the
USA
Study used
regression analysis
with performance
measured using
Tobinrsquos Q and
shareholder return
Firms with high
FCF perform
poorly and also
weak CG caused
inefficiency in the
allocation of FCF
CAPEX and Net
borrowings were
omitted in FCF
definition
This study included
CAPEX and net
borrowings to
measure FCF
Gregory
(2005)
Long run abnormal
performance of UK
acquirers and the
correlation between FCF
and firm performance
Used long term
returns and
analyzed
announcement
month return
Mergers with
greater FCF
performed better
than firms with
lower FCF
The study did not
incorporate firm
characteristics and
agency costs
The study
incorporated agency
costs and firm
characteristics (age
and size)
52
Researcher(s) Focus of Study Methodology Findings Knowledge Gaps How this Study
Addressed Gaps
Richardson
(2006)
Firm level over-
investment of FCF for
firms in the USA
Used an
accounting-based
structure to
measure over-
investment and
FCF
Found that over-
investment was
intense in firms
with the greatest
FCF levels
The study did not
incorporate firm
characteristics
This study included
firm characteristics
(age and size)
Mojtahedzadeh
and Nahavandi
(2009)
The relationship between
agency problems that rise
due to FCF with long
term profitability and
income management
The study was on firms
listed on the Tehran stock
exchange Iran
Used 106 firms for
the period 2003 to
2007 used Tobinrsquos
Q to measure long-
term profitability
DA was estimated
using the Adjusted
Jones Model
The study found
that agency
problems of FCF
result in short term
and eventually long
term profitability
The study focused
on FCF agency
costs and
profitability and
income and the
study period was
five years
This study focused on
FCF agency costs
firm characteristics
and the performance
of firms quoted at the
NSE Study period
was ten years
Nunes et al
(2009)
Profitability in
Portuguese service
industries
Used both static
panel models and
dynamic
estimators
Found a positive
correlation between
firm characteristics
and performance
and that FCF result
in profitability
The study used data
for four years only
(1999 to 2003)
which seems too
short
This study employed
data for ten years
(2006 to 2015)
53
Researcher(s) Focus of Study Methodology Findings Knowledge Gaps How this Study
Addressed Gaps
Wang (2010) The effect of FCF and
agency costs on firm
performance (firms listed
at the Taiwan stock
market)
Used descriptive
statistics
correlations and
regression analysis
Found no evidence
supporting a
negative correlation
between FCF and
firm performance
CAPEX and Net
borrowing were
omitted in FCF
definition
This study included
CAPEX and net
borrowings in
measuring FCF
Waithaka et al
(2012)
Effects of dividend
policy on share prices of
NSE listed firms Kenya
Used the case
method and
regression analysis
Found that FCF
instigated conflict
between managers
and shareholders
which consequently
affected the firm
performance
The study focused
on dividend policy
and stock
performance
This study focused on
FCF agency costs
firm characteristics
and firm
performance
Njuguna and
Moronge
(2013)
Effect of managerial
behavior of agency costs
on performance of firms
listed at the NSE Kenya
Used descriptive
research and used
asset turnover ratio
to measure agency
costs
Found that FCF
were negatively
related to firm
performance and
information
asymmetry causes
agency problem
The study used only
one proxy measure
of agency costs -
total asset turnover
ratio
This study employed
total assets turnover
and operating
expenses sales
54
Researcher(s) Focus of Study Methodology Findings Knowledge Gaps How this Study
Addressed Gaps
Wambua
(2013)
Effects of agency costs
on performance of firms
listed at the NSE
Regression
analysis was
employed in data
analysis
Got a positive
correlation between
FCF and firm
performance
The study did not
incorporate firm
characteristics
This study included
firm characteristics
(age and size)
Lin and Lin
(2014)
Agency costs of FCF and
biddersrsquo long-run
takeover performance of
Australian firms
Used regression
analysis on 556
firms for the
period 1993 to
2000
Found a positive
correlation between
FCF and firm
performance
CAPEX and Net
borrowing were
omitted in FCF
definition
This study included
CAPEX and net
borrowings in
measuring FCF
Nekhili et al
(2014)
Moderating effect of CG
and ownership in
lessening earnings
management practices
when there is high FCF
The study was conducted
in France
Developed
simultaneous
equations to
address
endogeneity of
FCF and then
employed
Hausman test
They found
opportunistic
behavior of
managers in
presence of FCF
Used firm
characteristics of CG
and ownership as
moderating variable
This study used firm
characteristics of size
and age of the firm as
moderating variable
Source Researcher (2018)
55
28 Conceptual Framework
Figure 21 below shows graphically the researcherrsquos conceptualization of the study
Figure 21 Conceptual Model
Independent Variable Dependent Variable
H01
Intervening Variable
H02
H04
H03
Moderating Variable
Source Researcher (2018)
Free Cash Flows
FCFit = (Net income
(PAT) + depreciation and
amortization - CAPEX -
change in non-cash
working capital + net
borrowing)Sales
Financial Performance
Tobinrsquos Q
Agency Costs
- Asset utilization efficiency ACit
- Production cost efficiency
Firm Characteristics
- Firm Size
- Age of the firm
56
FCF is the independent variable whereas the dependent variable is financial
performance As shown in figure 21 above H01 indicates the effect of FCF on financial
performance Agency costs are the intervening variable and they comprise of asset
utilization efficiency and production cost efficiency In figure 21 above H02 designates
the intervening influence of agency costs on the correlation between FCF and financial
performance In similar manner H03 depicts the moderating influence of firm
characteristics on the correlation between FCF and financial performance Firm
characteristics in the study are firm size and age of the firm Lastly H04 shows the joint
effect of FCF agency costs and firm characteristics on financial performance
29 Chapter Summary
This chapter reviewed theoretical foundation on which the study is grounded The
theories highlighted are The FCF hypothesis agency theory stewardship theory
stakeholder theory RBV theory and the organizational theory Empirical studies were
also examined specifically reviewing the correlation between FCF and financial
performance the intervening role of agency costs on the correlation between FCF and
financial performance the moderating role of firm characteristics on the correlation
between FCF and financial performance and finally the joint effect of FCF agency costs
and firm characteristics on financial performance Findings are mixed with some studies
indicating negative relationships while others showing positive relationships A summary
of knowledge gaps has also been underscored The chapter presented and explained the
conceptual model that guided the study and how it was conceptualized by the researcher
57
CHAPTER THREE RESEARCH METHODOLOGY
31 Introduction
This chapter deliberates on the research methodology used It presents the philosophy
research design study population how data was collected reliability and validity The
operationalization of study variables the techniques of data analysis applied and
summary of the research objectives Their corresponding hypotheses and analytical
models have also been highlighted
32 Research Philosophy
Research is defined by Proctor (1998) as a process to find out the unknown A critical
phase in doing social science research is to decide and validate the preferred research
philosophy embraced by the researcher Inter-related paradigmatic conventions
concerning the nature of reality the researcherrsquos role and the research process initiate
scientific research Research philosophy is the primary essential credence that supports
the options that need to be selected in taking a position in research Philosophy has
consequences on what how and why research is to be conducted (Carson Gilmore Perry
amp Gronhaug 2001)
Research philosophy has broad paradigms There are interpretative and the positivistic
paradigms Perry Reige and Brown (1999) explain the relationships among the
techniques that the researcher employs the researcher and the reality and truth that they
seek The two philosophical traditions that guide research in social science are positivism
58
and phenomenology (Saunders et al 2007) The roots of positivism tradition are
grounded in empiricism (Kerlinger 2002) Positivism is an ontology which makes an
assumption that a person has a straight access to the actual world and it is likely to get
independent information regarding the particular external reality
Interpretivism or Phenomenology is an ontology which makes an assumption that a
person does not have direct access to the real world and the knowledge heshe has
regarding this apparent realm is important in its own terms Within the phenomenological
ontology epistemology is founded on belief or assumption that the person conducting the
research is part of the reality and therefore not objective value-free or independent
Research emphasis is to understand what happens in a particular situation and it
contemplates several realities and diverse perceptions of the researcher (Carson et al
2001)
In this study the two philosophical traditions were examined and positivism was
considered the more appropriate tradition for the study because the study is centered on
prevailing theory and it develops hypotheses that can be verified Positivism made it
possible to make definite statements about the influence of agency costs and firm
characteristics on the correlation between FCF and firm performance grounded on
unbiased assessment and deductive reasoning The study utilized statistical data analysis
techniques and the researcher was objective and independent because individual feelings
were not introduced
59
33 Research Design
Research design involves decisions on where what when how farmuch and through
which means regarding a phenomenon It is the outline employed to direct a research
study to make certain that the research addresses the study problem (Gorard 2013) After
considering various research designs described by research experts such as Cooper and
Schindler (2006) Mugenda and Mugenda (1999) and Muganda (2010) as well as the
purpose of the study the philosophical tradition adopted the topical scope researcher
involvement time period over which the data was collected the nature of the data and
type of data analysis the study design embraced was cross sectional descriptive design
Mojtahedzadeh and Nahavandi (2009) successfully used the cross-sectional research
design in their study of the relationship between agency problems that arise due to FCF
with long term profitability and income management Mwangi (2014) also successfully
employed this study design in determining the influence of membersrsquo income and
conduct of Savings and Credit Cooperatives (SACCOs) in the correlation between
efficiency and characteristics of SACCOS in Kenya The cross-sectional descriptive
design was considered appropriate because of its versatility and leverage in collection of
data from a large number of respondents within a fairly short time period
34 Population of the Study
The target population comprised of the entire 63 firms listed at the NSE (Appendix I) as
at December 31 2015 This was a census study which involved obtaining information
from every member of the population A census of all the NSE listed firms was employed
60
because the number of listed firms at the NSE is relatively small and therefore the study
could easily be carried out
35 Data Collection
Secondary data was collected from published financial statements obtained from the
NSE Time series panel data was collected covering a 10 - year period from 2006 and to
2015 A ten-year period is deemed large enough to yield reliable findings A similar
period was adopted by Gregory and Wang (2010) and Nekhili et al (2014) Appendix II
shows the data collection form
36 Reliability and Validity
The main indicators of the value of a data collection instrument are reliability and validity
of the measures Reliability is among the most essential components of test quality and it
entails consistency or reproducibility or the examineersquos test performance Therefore
reliability is the degree with which research instruments yield consistent results after
repeated trials Reliability of a measure has two parts its stability over time and the
consistency of the instrument in measuring the concept Several methods of computing
test reliability exist and they include decision consistency parallel forms reliability test-
retest reliability inter-rater reliability and internal consistency Decision consistency is
often an appropriate choice for many criterion-referenced tests (Kimberlin amp Winterstein
2008)
61
Validity is the degree with which theory and evidence corroborate interpretations of test
scores occasioned by suggested uses of tests It denotes whether or not the test is
measuring what it anticipated to measure It is perhaps the most essential criteria for the
quality of a test There are several types of validity and these consist of construct validity
criterion-related validity and content validity Construct validity refers to the extent to
that an instrument measures the attribute or hypothetical concept that it was proposed to
measure while content validity is the degree with which the content of the objects reveals
the content purview of interest Lastly criterion-related validity is evaluated when an
individual wants to establish the correlation of scores on a test to a specified benchmark
(AERAAPANCME 2000 and Penfield amp Miller 2004)
361 Reliability Test
Stability was assessed by use of test retest reliability while internal consistency was
assessed using inter-item consistency reliability In testing for reliability Cronbach alpha
was calculated The Cronbachrsquos alpha coefficient was applied in measuring internal
consistency of the measurement scales It is a scale measurement tool that is frequently
used in social sciences for determining internal consistency of factors or items among and
within variables of the study Nunnally (1967) and Oppenheim (1992) argue that alpha
coefficient value of 0700 and above is tolerable
The Cronbachrsquos alpha coefficient was employed because it is suitable for multi-scaled
items The Cronbachrsquos alpha is a broad formula of the Kunder-Richardson (K-R) 20
formula as shown
62
(K) (S2-Σs
2)
KR20 =
(S2) (K-1)
KR20 = Reliability coefficient of internal consistency
S2 = Variance of all scores
K= Number of items employed to measure the model
s2 = Variance of individual items
This study also employed secondary data Kimberlin and Winterstein (2008) argue that
the foremost concern when deciding if secondary data should be used is to confirm that
the data set suitably measures the variables that are required to answer the study
questions Secondary data was collected from audited financial statements of all NSE
listed firms This data is deemed reliable because financial reporting is guided by
International Financial Reporting Standards (IFRS) Furthermore the companies Act
(CAP 486) of the laws of Kenya require that every limited liability firm conducts a
statutory audit at least once annually Such audits are guided by International Auditing
Standards (IAS)
362 Validity Test
Validation of the instrument was accomplished in several ways Pre-test was done by
administering the instrument to eight middle level managers to complete The eight
managers were conveniently selected to review the statement items for clarity meaning
63
and relevance Based on their response the data collection instrument was appropriately
modified Validity shows whether the instrument is testing what it should be testing
Content validity was achieved by establishing whether the items in the data collection
instrument are well balanced in content domain and link up well with theoretical
assumptions centered on the study objectives which involved checking of the content to
establish if it contained representative sample of the objects being measured Criterion-
related validity was established by administering test-retest or stability test on the data
contents in the data collection instrument Construct validity was established by ensuring
that the study variables were properly operationalized This was achieved through
constant consultations and reviews by research experts from the University of Nairobirsquos
School of Business Validity can be measured by use of expert judgment and informed
opinion (Kerlinger 2002)
37 Operationalization of the Study Variables
This study has four variables of interest independent variable dependent variable
intervening variable and a moderating variable Table 33 shows the research variables
and their respective metricsindicators Theoretical and empirical research in the area of
study has guided the choice of the variables
64
Table 31 Operationalization of Study Variables
Variable
Indicator Measure Support from
Literature
Form Section
Independent Variable
Free Cash Flows
Net income (PAT) add
depreciation and
amortization minus CAPEX
minus change in non-cash
working capital add net
borrowing
Net income (PAT) add
depreciation and amortization
minus CAPEX minus change
in non-cash working capital
plus net borrowingNet
Sales
Brealey et al
(2005) and
Nekhili et al
(2014)
Part A of Data
Collection Form
Dependent variable(s) - Firm Performance
Financial
Performance
Tobinrsquos Q Equity market valueEquity
book value
Szewczyk et al
(1996) and
Mojtahedzadeh
and Nahavandi
(2009)
Part B of Data
Collection Form
Intervening Variable(s)
(a) Asset utilization
efficiency = Net sales
to total Assets ratio
(a + b)2 = AC
Tirole (1986)
Part C of Data
Collection Form
65
Variable
Indicator Measure Support from
Literature
Form Section
Agency Costs
(b) Production cost
efficiency = Operating
expenses to net sales
ratio
Tirole (1986)
Singh and
Davidson (2003)
Moderating variable(s)
Firm
Characteristics
Firm Size Natural log of total assets Demsetz and Lehn
(1985)
Part D of Data
Collection Form
Firm Age
n log (number of years since
incorporation)
Ferris and Yan
(2009)
Source Researcher (2018)
66
Non-cash working capital includes inventories financial assets held to maturity
receivables and prepayments (current assets) and payables accrued expenses current
income tax liability (liabilities) For financial and investment firms non-cash working
capital includes prepaid lease rentals intangible assets deferred tax assets and retirement
benefit assets (assets) and taxation payable dividends payable deferred tax liabilities
and retirement benefit liabilities
Net sales in case of insurance firms are the equivalent of ldquoNet premium revenuerdquo For
commercial banks it is ldquoTotal operating incomerdquo which is composed of net interest
income add total non-interest income In case of investment firms it is ldquoIncomerdquo which
is comprised of rental income dividends and interest received and other incomes
38 Data Analysis
Data was analyzed using inferential statistics generated from statistical software using
95 confidence interval as in Aiken and West (1991) Descriptive statistics and
inferential statistics were both employed in data analysis Measures of dispersion and
measures of central tendency were used in profiling the respondent firms
Linear regression analyses were used in establishing the magnitude and nature of the
relationship between the study variables and in testing the relationships hypothesized
This study employed panel data regression analysis using the OLS technique where data
consist of cross-sectional and time series data which was combined into a panel data set
67
and projected with the use of panel data regression Regression analysis is a statistical
tool for examination of relations between variables
The value of the coefficient of determination (R2) indicates the extent of variation in the
dependent (explanatory) variable explained by the independent (predictor) variable Beta
values indicate the extent of variation in the explanatory variable that is attributed to the
extent of variation in the independent variable F ratio measures the model fit or simply
how sound the equation line established fits the data observed Interpretation of statistical
significance of each relationship hypothesized was based on β R2 t F and P ndash values
The study hypotheses were measured using two sets of regression equations The
regression analysis was done using STATA software
39 Choice of Panel Data Analysis Model
Panel data analysis can be categorized into several categories First are the pooled panels
which assume that there exist no distinctive qualities of characters in the dimension set
and there are no common effects across time Second are the fixed effects models which
assume existence of unique qualities of characters which are not the effects of random
variations and which donrsquot differ across time They assume changes in intercepts across
sets or time periods Lastly we have random effects models which have the assumption
that there are distinctive time constant qualities of characters which are the effects of
random variations and do not associate with the characters that are the effects of random
variation They donrsquot relate with the specific regressors The random effect models are
suitable if we want to draw conclusions about the entire population
68
The selection of a suitable model is contingent on the aim of investigation and
complications regarding the exogenity of dependent variables The fixed effects model
and the random effects model were not considered The pooled regression model was
suitable because of its assumption that all the organizations are similar The Pooled
regression model also has an assumption that the coefficients including the intercepts
are identical for all study items (firms) The fixed and random effect models provide for
individuality or heterogeneity among the organizations by letting each organization to
have own intercept that is time invariant
391 Effect of Free Cash Flows on Financial Performance
In establishing the effect of FCF on firm performance FCF is the predictor variable while
financial performance is the explanatory variable In the specification the standard errors
are clustered by firm and year Equation 31 entails panel data for 2006 to 2015
The regression model for hypothesis 1 is as follows
Ǭit = ά + βFCFit + euro -------------------------------------------------------------------------- (31)
Where Ǭ = Financial performance and it indicates the firm i at time t Financial
performance was measured using Tobinrsquos Q ά = Constant term β = Beta Coefficient
FCFit= Free cash flows for firm i at time t where t is the year 2006 to 2015
392 Free Cash Flows Agency Costs and Financial Performance
In analyzing hypothesis 2 the relevant variables are FCF (independent variable) agency
costs (intervening variable) and financial performance (dependent variable) Intervening
effects were examined using hierarchical (stepwise) multiple regression analysis As in
69
Baron and Kenny (1986) the fundamental concept of mediating variables is that in some
way they intervene in the process of transformation between response and stimuli Some
essential features of a mediating variable include the fact that the independent variable
shall affect the mediator variable (path a) the mediator shall affect the dependent
variable (path b) independent variable shall affect the dependent variable (path c) and
that once paths a and b are controlled path c becomes inconsequential or trivial The
mediation path is shown in figure 31 below
Figure 31 Path Diagram for Mediation effect of Agency Costs
c
lsquoa b
Agency costs
Source Researcher (2018)
Mediation was tested through the following three steps Step one entailed the dependent
variable Ǭ (financial performance) being regressed on the independent variable FCF
(Free cash flows) In step two the mediator AC (agency costs) was regressed on the
independent variable FCF In step three Ǭ is regressed on AC and FCF In each step the
120689 coefficient was tested to establish the size and direction of the correlation If a zero
order relationship exists and is significant then proceed to the next step Mediation exists
if FCF coefficient is significant in step 2 and also when the FCF coefficient is
significantly less in step 3 than in step 1
Free cash flows Financial performance
70
In testing intervention between FCF and financial performance the regression model is as
follows
Ǭit = ά + β1FCFit + euroit ------------------------------------------------------------------------ (32a)
AC it = ά + β1FCFit + euroit --------------------------------------------------------------------- (32b)
Ǭit = ά + β1AC it + β2FCF it + euroit ------------------------------------------------------------ (32c)
while controlling the effect of M on Y
Where ACit is the sum of Production cost efficiency (PCEit) and Asset utilization
efficiency (AUEit) divided by 2 (average) for the period 2006 to 2015
393 Free Cash Flows Firm Characteristics and Financial Performance
In testing hypothesis 3 the relevant variables are FCF firm characteristics (moderating
variable) and financial performance The regression models are as follows
Ǭit = ά + β1FCFit + β2AGEit + β3 (AGEit FCFit) + euro---------------------------------- (33a)
Ǭit = ά + β1FCFit + β2SIZit + β3 (SIZit FCFit) + euro------------------------------------- (33b)
Where SIZit = Firm size AGEit = Age of the firm
Equations 33a and 33b represent moderation models For purposes of avoiding possible
high multicollinearity the variables were centered and an interaction term added If the
predictor variable (FCF) and moderator variable (firm characteristics) are not significant
with the interaction term then complete moderation has happened Otherwise if the
independent and moderator variables are significant with the interaction term then
71
moderation has happened but the main effects are also significant (Aiken amp West 1991
and Mackinnon et al 2002)
In equations 33a and 33b above the variables associated with coefficient 1206893 were added
in the model to measure the effect of moderation The effect of moderation variables
firm size and age is characterized statistically as an interaction that affects the strength
and or direction of the correlation between explanatory variable (firm performance) and
the predictor variables (Baron amp Kenny 1986) The term in the model does not imply
multiplication but rather it denotes moderation
394 Relating all the Variables
Hypothesis 4 entails testing all the variables in the conceptual framework In testing for
the effect on financial performance panel data model was applied in measuring the
strength of the relations between the independent moderating intervening and dependent
variables To measure the joint effect of the moderating intervening and independent
variables intercept (constant) was used to determine the nature and extent of effect of all
the variables Additionally R2 was employed in determining the joint effect of the
moderating intervening and independent variables on the dependent variable (financial
performance) The resultant model is as follows
Ǭit = ά + β1FCFit + β2AC it + β3SIZit + β4AGEit + euro----------------------------------------- (34)
Where
72
34 represents the model for the effect on financial performance which utilized secondary
panel data for the period 2006 to 2015 and Ǭit represents financial performance
Table 32 A Summary of Statistical Tests of Hypotheses
Objective Hypothesis Analytical Model Interpretation
i To establish
the relationship
between FCF
and financial
performance of
firms listed at
the NSE
H01 FCF have no
significant effect on
financial performance of
firms listed at the NSE
ANOVA
regression
model
Panel data
regression
model
Test of
assumption
(normality and
multi-
collinearity)
Relationship exists if β is
significant
Relationship will be
determined based on R2
ii To assess the
influence of
agency costs on
the relationship
between FCF
and financial
performance of
firms listed at
the NSE
H02 Agency costs have
no significant
intervening effect on the
relationship between
FCF and financial
performance of firms
listed at the NSE
ANOVA
regression
model
Panel data
regression
model
Test of
assumption
(normality and
multi-
collinearity)
Mediation exists if FCF
coefficient is significant in
step 2 and also when in
step 3 the FCF coefficient
is significantly less than in
step 1
Regression co-efficient and
R2 will be used to affirm the
effect of agency cost on the
relationship between free
cash flow and firm
performance
iiiTo determine
the influence of
firm
characteristics
on the
H03a Firm age has no
significant moderating
effect on the relationship
between FCF and
financial performance of
ANOVA
regression
model
Panel data
regression
Moderation exists when the
interaction term between
firm characteristics and
FCF is a significant (p lt
005) predictor of firm
73
Objective Hypothesis Analytical Model Interpretation
relationship
between FCF
and financial
performance of
firms listed at
the NSE
firms listed at the NSE
H03b Firm size has no
significant moderating
effect on the relationship
between FCF and
financial performance of
firms listed at the NSE
model
Test of
assumption
(normality and
multi-
collinearity)
performance Furthermore
when FCF remains a
significant predictor while
firm characteristics become
insignificant
The intercept of the
regression model will
be used to tests the
influence of firm
characteristics on the
relationship between
free cash flow and firm
performance
Regression co-efficient and
R2 will be used to affirm the
effect of firm characteristics
on the relationship between
FCF and firm performance
iv To establish
the joint effect
of FCF agency
costs and firm
characteristics
on financial
performance of
firms listed at
the NSE
H04 There is no joint
effect of FCF agency
costs and firm
characteristics on
financial performance of
firms listed at the NSE
ANOVA
regression
model
Panel data
regression
model
Test of
assumption
(normality and
multi-
collinearity)
The intercept of the
regression model will be
used to tests the joint effect
of FCF agency costs and
firm characteristics on firm
performance
R2 will be used to get the
joint effect of independent
variables on Firm
Performance
74
310 Chapter Summary
The chapter discussed the study methodology employed and has highlighted the research
philosophy adopted clearly indicating that the study was anchored on the positivist
orientation since it is founded on existing theory and it articulates hypotheses which can
be verified Furthermore the positivist approach made it possible to make categorical
statements
The research design used has also been discussed The research design adopted was
cross sectional descriptive survey The population of the study has been highlighted as a
census of all firms listed at the NSE The chapter has also explained the data collection
methodology Reliability and validity considerations have been discussed
Operationalization of research variables has been deliberated showing a summary table
of the four variables of study indicators how the variables were measured support from
literature and the relevant section of the data collection form Data analysis has been
explained being regression methods using inferential statistics The chapter also
presented a tabulated summary of the research objectives their corresponding hypotheses
and analytical models
75
CHAPTER FOUR DATA ANALYSIS AND FINDINGS
41 Introduction
The study sought to establish the relationships between free cash flows agency costs
firm characteristics and performance of firms listed at the NSE Secondary data were
collected to test the relationships between the study variables This chapter presents an
analysis of the results More specifically the chapter has focused on descriptive statistics
reliability tests validity tests and correlation analysis
42 Pre-estimation Diagnostics
The study used OLS to estimate regression models The use of OLS is based on
normality linearity sampling adequacy and internal consistency of variables used in the
regression model Therefore normality linearity internal consistency and sampling
adequacy of these variables were required for the application of OLS This section
presents the test statistics to verify satisfaction of these assumptions by the data collected
and analyzed
421 Normality test
The Shapiro Wilk test for normality was conducted to test if the variables were normally
distributed The null hypothesis was that the data did not come from a population that
was normally distributed Therefore the alternate hypothesis is that the data originated
from a normally distributed population The test statistics for normality of each variable
are shown in table 41 below
76
Table 41 Normality Test
Variable Test Statistic
Z statistic P value
Free cash flows 1687 0082
Agency costs (AC) 1501 0160
Firm Age 0832 0129
Firm Size 1004 0076
Table 41 above shows that the p-values for all the variables were greater than 005 and
therefore we failed to reject the null hypothesis that the variables were normally
distributed at five per cent level of significance Therefore OLS could be applied on the
data considering that the data met the assumed conditions for application of multiple
regression analysis Field (2013) recommends use of a visual inspection of histograms or
Quantile ndash Quantile (Q-Q) plots to supplement use of tables and numbers These plots are
presented below
77
Figure 41 Q-Q Plot for Free cash Flows (2006 ndash 2015)
The results of the Q-Q plot in figure 41 above exhibits normality because most of the
observations seem to be in a straight line with a few cases appearing to be far away from
the line
Figure 42 Q-Q Plot for Agency Costs (AC) ndash 2006 to 2015
Figure 42 Q-Q plot above for agency costs (AC) reveals normality because the majority
of the observations seem to be along the straight line Outliers were investigated and
78
corrected or eliminated where necessary Large data sets can be analysed even if some
variables do not meet normality assumptions (Tabachnick amp Fiddel 2013)
Figure 43 Q-Q Plot for Firm Characteristics (Firm Age) ndash 2006 to 2015
The above Q-Q in figure 43 exhibits normality This is because most of the observations
seem to be in a straight line with a few cases appearing to be far away from the line
79
Figure 44 Q-Q Plot for Firm Characteristics (Firm Size) ndash 2006-2015
The Q-Q plot for firm size in figure 44 above indicates almost all the observations being
on a straight line This implies normality of the data Outliers were investigated and
corrected or eliminated where necessary
80
Figure 45 Q-Q Plot for Firm Financial Performance ndash 2006 to 2015
The Q-Q plot for financial performance in figure 45 above shows normality
422 Reliability Tests
Reliability tests were carried out through Cronbachs alpha tests in Statistical Package for
the Social Sciences (SPSS) with the findings presented below The results are shown in
Table 42 below Except for financial performance which shows a score of 0672 all the
other variables indicate reliability scores above 0700 which is the accepted score for
reliability (Bonett amp Wright 2014) The research instrument was therefore deemed
reliable
81
Table 42 Reliability Scores for Individual Variables
Variable Item Cronbachs Alpha
Free Cash Flow 0726
Firm Age 0798
Firm Size 0814
Agency Costs-AC 0828
Financial Performance 0672
423 Test for Linearity
In testing whether the variables were linearly associated a correlation analysis was done
The null hypothesis for the test was that there was no linear association The test statistics
for linear associations between the predictor variables and firm performance (explanatory
variable) are shown in table 43 below
Table 43 Test for Linearity
Reference Variable Firm
Performance
Coefficient of Correlation P-Value
Free cash flows 0506 0000
Agency costs (AC) 0521 0000
Firm Age 0619 0000
Firm Size 0590 0000
82
From table 43 above FCF shows a coefficient of correlation of 0506 agency costs (AC)
indicate 0521 firm age 0619 and finally firm size reveal 0590 All the values exceed
05000 meaning that there is a positive correlation Financial performance is the reference
variable All the p-values for the respective coefficients of correlation are 0000 which is
lower than 001
Thus all the predictor variables have a significant positive correlation with financial
performance at five per cent level of significance Therefore the predictor variables and
the explanatory variable (financial performance) move in the same direction which
suggests a linear relationship This positive significant correlation indicates that the
signage coefficients of the predictor variables in the simple regression models are
positive
424 Bartletts Test for Internal Consistency
The study tested the consistency of the items in the designed questionnaire to measure
several variables used in the research by applying the Bartlettrsquos test of sphericity The
null hypothesis of the test was that there was no internal consistency A failure to reject
the null hypothesis implies that the principal components which measure individual
sections have to be established using principal component analysis
Conversely rejecting the null hypothesis implies that all the elements are consistent
internally and that their composites can be applied in measuring the variables concerned
83
Test statistics for each of the sections involved in the linear regression analysis are
presented in table 44 below
Table 44 Bartlettrsquos Test
Variable Degrees of freedom Test statistic
Chi Square P value
Free cash flows 21 4382 0000
Agency costs (AC) 10 2665 0000
Firm age 10 1462 0000
Firm size 10 1621 0000
Financial performance 10 26940 0000
Table 44 above demonstrates that the null hypothesis which states that the variables are
not intercorrelated in each of the sections has to be rejected at five per cent significance
level This is confirmed by all the p-values being less than 001 for the variables
425 Multicollinearity Test
Multicollinearity occurs if there is a strong relationship between two or more independent
variables in a regression model Multicollinearity becomes an issue only in multiple
regressions and not for simple regression analysis Multicollinearity poses several
problems such as increases in standard errors of 120689 coefficients This means that the 120689s
have relatively higher variability across samples and less likely to represent the
population The second problem is limiting the size of R which measures multiple
correlation between the independent variables and the result and R2 the variance of the
84
result for which the independent variables explain making the second predictor to
explain very little of the remaining variance The other problem posed by
multicollinearity is that it reduces the importance of predictors making it hard to measure
the specific significance of a predictor (Field 2009)
To test whether the level of multicollinearity in the estimated models could be tolerated
Variance Inflation Factor (VIF) was used The rule of the thumb is that a value of VIF
that is less than 10 means that the level of multicollinearity can be tolerated (Robinson amp
Schumacker 2009) Since multicollinearity test is only applicable for multivariate
regressions only VIF statistics are reported since the regressions involve more than one
independent variable
Table 45 Multicollinearity Test
Variables VIF
Free Cash Flows 206
Agency costs (AC) 155
Financial Performance 252
Firm Size 109
Firm Age 168
Table 45 above shows that the VIF for all the models estimated ranged from 109 to 235
showing that the VIF results are between the acceptable ranges of 1 to 10 (Robinson amp
85
Schumacker 2009) This shows that the variables did not exhibit multicollinearity and
regression analysis could then be carried out
43 Descriptive Statistics
Table 46 Descriptive Statistics for Secondary Data ndash 2006 to 2015
Variables No Min Max Mean STD
Tobinrsquos Q (Ratio) 600 0867900 6447370 0526600 0634590
FCF (Ratio) 600 -0024530 3145000 16900 011270
AC(Ratio) 600 0003716 6329080 33166898 091646
SIZ (Ratio) 600 -1342200 2810600 04418300 0612300
AGE (n log of year
since incorporation)
600 140884 5400013 3904435 0287000
Table 46 above shows descriptive statistics for secondary data for a 10 year period from
2006 to 2015 Table 46 above gives the descriptive analysis for the main variables used
in the research It shows that the average Tobin Q is 05266 This suggests that on
average firms listed at NSE have recorded fairly impressive performance The Tobinrsquos Q
mean of 05266 suggests that the firmsrsquo market values are less than their book values
Since their market price to book value ratio is less than one the market expects the value
of these firms to reduce in the future because the market price also takes any future
earnings into account at the current price
86
For FCF the average is 169 meaning that most firms listed at NSE have low FCF The
mean for AC was found to be 33166898 indicating a high asset turnover and operating
expenses to sales ratio The average age of the firm is indicated by the log of 3904435
This shows that the firms listed at the NSE are relatively old On average the mean firm
size of listed firms at the NSE is indicated by a log of 04418300 indicating that the firms
have a fairly high asset value
44 Chapter Summary
This chapter presented information on pre-estimation diagnostics These include
normality test reliability test reliability test test for linearity Bartlettrsquos test for internal
consistency and multicollinearity test The chapter also gave results of analysis tests run
on the data that was collected These include descriptive statistics Results were indicated
by standard deviations mean scores minimum scores and maximum scores
87
CHAPTER FIVE TESTS OF HYPOTHESES AND DISCUSSION
51 Introduction
This section presents the hypotheses of the study which are derived from the research
objectives and the results of the hypothesized relationships This study was informed by
the premise that there exists a correlation between FCF and financial performance and
that this relationship is intervened by agency costs and is moderated by firm
characteristics
52 Correlation Analysis
The relationship between strength and direction of the variablesrsquo relationship was
investigated using the Pearson Product Moment correlation coefficient This was
significant so as to assess whether any relationship exists between the variables before
proceeding with further analyses The study employed the following classification strong
if 07 and above moderate if 04 but less than 07 and weak if 0 and less than 04
Apart from analysing the direction and strength of association correlation analysis was
also used to test the presence of multicollinearity between the independent variables
Multicollinearity exists if independent variables are highly correlated (r = or greater than
075) Multicollinearity reduces the importance of predictors making it difficult to assess
the individual importance of a predictor Multicollinearity may lead to poor regression
modelling (Dancey amp Reidy 2011) The results in Table 51 below show that there is no
multicollinearity since all the predictor coefficient results are below 075
88
Table 51 Pearson Product-Moment Correlations among the Dependent
Independent Intervening and Moderating Variables
Firm
performance
Free
cash
flows
Agency
costs
Firm
size
Firm
age
Pearson
Correlation
Firm performance 1 0702 0519 0405 0126
Free cashflows 1 0129 0135 0245
Agency costs 1 0198 0322
Firm size 1 0418
Firm age 1
Source Researcher (2018)
Correlation is significant at the 005 level (2-tailed)
Correlation is significant at the 001 level (2-tailed)
As indicated in Table 51 above there is a strong positive correlation between financial
performance and FCF (r = 0702) On the other hand the correlation between financial
performance and firm size and with agency costs is moderate and positive (r = 0405 and
0519 respectively) The correlation with firm age is weak but positive (r = 0126) All the
correlations were significant at 005 except firm age The relationships between financial
performance and FCF agency costs firm size and firm age moved in the same direction
as hypothesized in the study These variables were further assessed using regression
analysis as shown in section 53 below
89
53 Hypotheses Testing Using Regression Analysis
In order to establish these relationships four hypotheses were formulated and tested For
purposes of testing the hypotheses different regression models were run First finding
out the correlation between FCF and financial performance secondly tests to determine
the intervening effect of agency costs on the correlation between FCF and financial
performance thirdly tests were carried out to establish the moderating effect of firm
characteristics on the relationship between FCF and financial performance and lastly to
find out the joint effect of FCF agency costs and firm characteristics on financial
performance of NSE listed firms
In order to ascertain these relationships the hypotheses were formulated and tested using
simple and multiple linear regression analyses The hypotheses were tested at 95 percent
confidence level (ά = 005) while p-values were used to establish individual significance
of the hypothesized relationships The significance and general robustness of the model
was assessed using F statistic and p-values for significance Overall F statistic value
greater than 1 signifies goodness of fit P-values greater than or equal to 005 indicated
that we would fail to reject the null hypothesis while those with p-values less than 005
signified that the null hypothesis would be rejected ANOVA and panel data analyses
results have been presented and discussed below
90
531 Free Cash Flows and Financial Performance
The study sought to determine the effect of FCF on financial performance and it
employed panel data design Panel data was used in establishing financial performance
which was measured by Tobinrsquos Q (equity market value equity book value) FCF on the
other hand was measured as Net income + depreciation and amortization - CAPEX -
change in non-cash working capital + net borrowing)Net sales The study sought to
identify the effect of FCF on firm financial performance The following hypothesis was
developed
H01 FCF have no significant effect on financial performance of firms listed at the NSE
Maximum likelihood regression model was employed in data analysis The test statistics
regression results with financial performance as the dependent variable and FCF as the
independent variable are reported in Table 52(a) below
Table 52 Panel Data Results for Free Cash Flows and Financial Performance
Model Summary
Model R R2 Adjusted R
2 Standard
Error
1 04890 02391 02106 02258
a Predictors (Constant) Free cash flows
b Dependent Variable Financial performance
91
(a) ANOVA
Model Sum of
Squares
DF Mean
Square
F Sig
Regression 2689 1 2689 5376 0017
Residual 32483 599 0054
Total 35172 600
a Predictors (Constant) Free Cash Flows
b Dependent variable Financial performance
(c) Regression Co-efficients
Model Unstandardized Coefficients Standard
Coefficients
t Sig
B Standard Error Beta
Constant 048011 0011662 020 7229 0000
FCF 0206 00254 0265 54238 00023
Dependent variable Financial performance
The model coefficients are shown in Table 52(c) above The results indicate that FCF is
a significant predictor because the p value is 00023 which is lower than 005 (level of
significance) Furthermore results indicate R2
of 02391 which implies that FCF explain
2391 of the variability in firm financial performance The results have rejected the null
hypothesis implying that FCF have a statistically significant positive effect on financial
performance of firms listed at the NSE The regression model that explains the variation
in financial performance as a consequence of FCF is as shown below
92
Ǭit = 048011 + 0206FCFit
Where
Ǭ = Firm financial performance
FCF =Free cash flows
532 Free Cash Flows Agency Costs and Financial Performance
This study sought to ascertain the effect of agency costs on the relationship between FCF
and financial performance The corresponding hypothesis is
Hypothesis 2 Agency costs have no significant intervening effect on the relationship
between free cash flows and financial performance of firms listed at the Nairobi
Securities Exchange
The study employed secondary panel data in determining the results under this
hypothesis Secondary data was obtained from financial statements and measured agency
costs using asset utilization efficiency (salesassets) and production cost efficiency
(operating expensessales) The values were obtained separately (AUE and PCE) and
added together then divided by two to obtain agency costs (AC)
In testing for mediation intervention first the relationship between the dependent
variable (financial performance) and the independent variable (FCF) was carried out
ignoring the intervening variable (agency costs-AC) This was step number 1 and is
similar to the regressions performed under hypothesis one under section 52 The model
should indicate significance where p = lt005
93
Next is the regression analysis between FCF (the independent variable) and agency costs
(AC) which is a combination of production cost efficiency and asset utilization efficiency
as intervening variable ignoring the financial performance (the dependent variable) The
FCF and AC relationship should be significant (p=lt005) if one is to move to step 3
Under step 3 the regression analysis is done with financial performance as the dependent
variable and both AC and FCF as independent variables Regression results for step 1 are
same as shown in Table 51 earlier Results from step 1 shown in Table 51 indicate the p
value of 00023 and is therefore significant The regression model is specified as Ǭit =
048011 + 0206FCFit This necessitates moving to step 2 the results of which are
depicted in Table 53 below
Table 53 Panel Data Results of Agency Costs as the Dependent Variable and Free
Cash flows as the Independent Variable
a) Model Summary
Model R R Square Adjusted R Square Std Error of the Estimate
1 03356 01126 00958 02290
a Predictors (Constant) FCF
b Dependent Variable Agency costs (AC)
94
b) ANOVA
Model
Sum of
Squares df
Mean
Square F Sig
Regression 6881 1 6881 059 46181 0053
Residual 89226 599 0149 043
Total 96107 600
a Predictors (Constant) FCF
b Dependent Variable Agency costs (AC)
c Coefficients
Model
Unstandardized
Coefficients
Standardized
Coefficients
t Sig B Std Error Beta
1 (Constant) 0117 03042 3840 023
FCF 083 0137 265 2772 048
a Dependent Variable Total Non-Performance
Results in Table 53(c) above indicate that FCF is a significant predictor of AC as shown
by Sig = lt005 Table 53(a) above shows R square of 01126 which implies that 1126
variations in AC are explained by changes in FCF The regression model for the
relationship between FCF and AC ignoring financial performance is given below
AC = 0117 + 0083FCF
95
Since the relationship between FCF and AC is significant (as depicted by Sig = 0048)
we can now move to step 3 where financial performance is the dependent variable while
FCF and AC are predictor variables The results of step 3 are displayed in Table 54
below
Table 54 Panel Data Results of Financial Performance as the Dependent Variable
while Agency Costs and Free Cash flows are the Independent Variables
a Model Summary
Model R R Square Adjusted R Square Std Error of the Estimate
1 07157 05122 04613 02288
a Predictors (Constant) AC FCF
b Dependent Variable Financial Performance
a ANOVA
Model Sum of Squares df Mean Square F Sig
1 Regression 14725 2 73625 62606 0000
Residual 106258 598 01776
Total 120983 600
a Predictors (Constant) AC FCF
b Dependent Variable Financial Performance
96
c Coefficients
Model
Unstandardized Coefficients
Standardized
Coefficients
t Sig B Std Error Beta
1 (Constant) 0187 0342 44409 021
FCF 211 0179 227 13380 071
AC 148 042 282 62376 015
a Predictors (Constant) AC FCF
b Dependent Variable Financial Performance
The findings in Table 54 above indicate that financial performance is significantly
predicted by AC (p =0015 which is lt005) On the contrary FCF does not significantly
predict financial performance This is depicted by (p = 0071 which is gt005) From the
regression results above Adjusted R squared changed from 02106 to 04613 showing a
significant increase in the relationship between FCF and financial performance
This change is attributed to the intervening variablersquos effect It is therefore concluded that
agency costs (AC) have a positive statistically significant intervening effect on the
relationship between FCF and financial performance The null hypothesis that Agency
costs have no significant intervening effect on the relationship between free cash flows
and financial performance of firms listed at the Nairobi Securities Exchange is therefore
rejected The resultant regression model is as shown below
Ǭit = 0187 + 0148ACit+0211FCFit
97
533 Free Cash Flows Firm Characteristics and Financial Performance
This study sought to identify the effect of firm characteristics on the relationship between
FCF and financial performance The corresponding hypothesis is
Hypothesis 3 Firm characteristics have no significant moderating effect on the
relationship between free cash flows and financial performance of firms listed at the
Nairobi securities exchange
The study employed secondary panel data in determining the results under this
hypothesis Since firm characteristics (age and size) are additive each one of them was
tested separately Therefore under this hypothesis two sub-hypotheses were developed
as follows
H03a Firm age has no significant moderating effect on the relationship between free cash
flows and financial performance of firms listed at the Nairobi securities exchange
H03b Firm size has no significant moderating effect on the relationship between free cash
flows and financial performance of firms listed at the Nairobi securities exchange
Secondary data was obtained from financial statements and measured firm characteristics
using firm size and age of the firm Firm size was measured using the natural log of total
assets while age of the firm was measured using the natural log of number of years since
incorporation The moderating effect of firm size and firm age on the relationship
between FCF and firm financial performance was assessed using the centered approach
as by Wu and Zumbo (2008)
98
This involves the following steps Step 1 involves the independent variables and the
moderator variables being regressed against firm financial performance Step 2 on the
other hand entails introduction of the centered approach in the model with the predictor
variable moderating variable and the interaction term being factored into the model The
regression results are shown in Table 55 below
Table 55 Panel Data Results for Financial Performance as the Dependent Variable
and FCF and Firm Age as the Predictor Variables
a Model Summary
Model R R Square Adjusted R Square
Std Error of the
Estimate
1 05894 03474 03109 1573
a Predictors (Constant) FAGE_CENTRED FCF_CENTRED
b Dependent Variable Financial Performance
b ANOVA
Model Sum of Squares df Mean Square F Sig
1 Regression 51189 2 25594 8531 0000
Residual 20440 598 003
Total 255589 600
a Predictors (Constant) FAGE_CENTRED FCF_CENTRED
b Dependent Variable Financial Performance
99
c Coefficients
Model
Unstandardized
Coefficients
Standardized
Coefficients
t Sig B Std Error Beta
1 (Constant) 0041 11662 28109 0044
FCF 1306 0144 088 44238 0023
AGE 201 02607 353 6120 0002
a Dependent Variable Financial Performance
Results in Table 55(a) above show R2 of 03474 and Adjusted R
2 of 03109 Table 55(c)
above shows the coefficients of FCF and AGE as 01306 and 0201 respectively The p
values for FCF and AGE are 0023 and 0002 respectively indicating statistical
significance because each of them is less than 005 Results for Step 2 are displayed in
Table 56 below where the interaction term is introduced
Table 56 Panel Data Results for Financial Performance as the Dependent Variable
and FCF and Firm Age as the Predictor Variables Centered Approach
a Model Summary
Model R R Square Adjusted R Square Std Error of the Estimate
1 06825 046580 042170 041054
a Predictors (Constant) FCF_FAGE_CENTRED FAGE_CENTRED FCF_CENTRED
b Dependent Variable Financial Performance
100
b ANOVA
Model Sum of Squares df Mean Square F Sig
1 Regression 12034 3 401130 29957 0000
Residual 79950 597 01339
Total 91984 600
a Predictors (Constant) FCF_FAGE_CENTRED FAGE_CENTRED FCF_CENTRED
b Dependent Variable Financial Performance
c Coefficients
Model
Unstandardized
Coefficients
Standardized
Coefficients
t Sig B Std Error Beta
1 (Constant) 0065 00245 41263 0001
FCF_CENTRED 0207 00014 0293 74638 0000
AGE_CENTRED 0094 0091 0351 1986 0047
FAGE_CENTRED 0045 002 00204 2230 0027
a Predictors (Constant) FCF_FAGE_CENTRED FAGE_CENTRED FCF_CENTRED
b Dependent Variable Financial Performance
Results from Table 56 above shows R squared change from 03109 to 042170 which is a
change of 01108 (1108 change) which is occasioned by the interaction term This is
also confirmed by the p values which are all less than 005 meaning that firm age
101
positively and significantly moderates the relationship between FCF and financial
performance The regression model for moderation effect of firm age is as shown below
Ǭit = FCFit + AGEit + 0045FAGEit
Table 57 Panel Data Results for Financial Performance as the Dependent Variable
and FCF and Firm Size as the Predictor Variables
a Model Summary
Model R R Square Adjusted R Square Std Error of the Estimate
1 06481 04200 03902 03198
a Predictors (Constant) SIZE FCF
b Dependent Variable Financial performance
b ANOVA
Model
Sum of
Squares df Mean Square F Sig
1 Regression 8447 2 4224 120685 00000
Residual 21456 598 0035
Total 29903 600
a Dependent variable Financial performance
102
c Coefficients
Model
Unstandardized
Coefficients
Standardized
Coefficients
t Sig B Std Error Beta
1 (Constant) 009 002109 53270 00014
FCF 0107 003104 0178 74238 00000
SIZE 0223 009100 1444 19860 00470
a Dependent Variable Financial Performance
Results in Table 57(a) above show R2 of 04200 and Adjusted R
2 of 03902 Table 57(c)
above shows the coefficients of FCF and SIZE as 0107 and 0223 respectively The p
values for FCF and SIZE are 0000 and 0047 respectively indicating statistical
significance because each of them is less than 005 Results for Step 2 are displayed in
Table 58 below where the interaction term is introduced
Table 58 Panel Data Results for Financial Performance as the Dependent Variable
and FCF and Firm Size as the Predictor Variables Centered Approach
a Model Summary
Model R R Square Adjusted R2 Std Error of the Estimate
1 07853 06167 05654 02208
a Predictors (Constant) FCF_CENTRED SIZE_CENTRED FSIZE_CENTRED
b Dependent Variable Financial Performance
103
b ANOVA
Model Sum of Squares df Mean Square F Sig
1 Regression 3138 1 3138 17119 00011
Residual 109846 599 01833
Total 112984 600
a Predictors (Constant) FCF_CENTRED FCF_FSIZE_CENTRED FSIZE_CENTRED
b Dependent Variable Financial Performance
c Coefficients
Model
Unstandardized
Coefficients
Standardized
Coefficients
t Sig B Std Error Beta
1 (Constant) 0144 00245 4826 0021
SIZE_CENTRED 0048 00140 0392 2586 0041
FCF_CENTRED 0155 00140 0132 3938 0003
FSIZE_CENTRED 0227 00327 0472 2679 00981
a Dependent Variable Financial Performance
Results from Table 58 above shows R squared change from 03902 to 05654 which is a
change of 01752 (1752 change) which is occasioned by the interaction term This is
also confirmed by the p values which are all less than 005 meaning that firm size
moderates the relationship between FCF and financial performance The regression
model for moderation effect of firm size is as shown below
104
Ǭit = FCFit + SIZit + 0227FSIZEit
The moderating effect was established as in Stone-Romero and Liakhovitski (2002)
which involves assessing the effects on the dependent variable (non-financial
performance) of the moderating variables (firm size and age) and dependent variable
(FCF) Regression results with non-financial performance as the dependent variable firm
characteristics (firm size and age) and FCF as predictors as shown below
534 Free Cash Flows Agency Costs Firm Characteristics and Financial
Performance
This study sought to establish the joint effect of FCF agency costs and firm
characteristics on firm performance The corresponding hypothesis is as follows
Hypothesis 4 There is no joint effect of free cash flows agency costs and financial
characteristics on performance of firms listed at the Nairobi Securities Exchange
Secondary data was obtained from financial statements The independent variable is FCF
intervening variable is agency costs (AC) The moderating variable is firm characteristics
which are firm size and age of the firm Financial performance was measured using
Tobinrsquos Q and is the dependent variable Panel data results are presented in table 59
below
105
Table 59 Panel Data Results for Free Cash Flows Agency Costs Firm
Characteristics and Financial Performance
a Model Summary
Model R R Square Adjusted R Square Std Error of the Estimate
1 08780 07708 06645 05432
a Predictors (Constant) FCF AC Firm Size Firm Age
b Dependent variable Financial performance
b ANOVA
Model Sum of Squares df Mean Square F Sig
1 Regression 7708 2 3854 22807 0012
Residual 101336 598 0169
Total 7934 600
a Predictors (Constant) FCF AC Firm Size and Firm Age
b Dependent Variable Financial Performance
106
c Coefficients
Model
Unstandardized
Coefficients
Standardized
Coefficients
t Sig B Std Error Beta
1 (Constant) 065 0011 3826 0033
FCF 0144 0024 0081 4938 0020
Age 0107 0027 0150 1233 0074
Size 0231 0069 0102 6586 0010
AC 0314 0034 0259 2901 0032
a Predictors (Constant) FCF AC Firm Size and Firm Age
b Dependent Variable Financial Performance
From the panel study results the intercept (constant) is 0065 with a statistically
significant p-value of 0033 FCF have a coefficient value of 0144 with a p-value of 002
which is significant The findings indicate that FCF still have positive effect on the
performance of the listed firms and the effect is still significant even when control
variables are introduced in the model The effect of agency costs is also positive and
significant at p value 0032 Firm size shows a positive and significant joint effect (p
value is 001) while age has a positive effect but the effect is not significant (p value is
0074) The R2 is 07708 indicating that 7708 of changes in financial performance are
accounted by the joint effect of FCF AC and firm characteristics (size and age)
107
Overall the joint effect of FCF agency costs and firm characteristics on performance of
firms listed at NSE indicates a positive significant relationship The null hypothesis is
therefore rejected There is a significant joint effect of FCF agency costs and firm
characteristics on performance of firms listed at the NSE The regression model that
explains the variation in firm performance as a result of the joint effect of FCF agency
costs and firm characteristics is shown below
Ǭit FCFit +ACit +SIZit +AGEit
Where Ǭit = Financial Performance
FCF= Free Cash flows
AC = Agency Costs (AC)
SIZ = Firm Size
AGE = Firm Age
54 Discussion
The study had four hypotheses with hypothesis 3 having two sub hypotheses one
focusing on firm age and the other on firm size The results under each objective are
discussed here-below
541 The Influence of Free Cash Flows on Financial Performance
The first objective of the study was to establish the influence of FCF on the performance
of firms listed at the NSE This was achieved through analyzing the audited financial
statements of the listed companies (panel data)
108
The results indicate that there is a significant positive relationship between FCF and firm
performance The findings for the influence of FCF on financial performance showed a
statistically significant positive relationship These results are consistent with other
studies on FCF and firm performance For instance Kargar and Ahmadi (2013) found a
positive relationship between FCF and performance of firms listed at the Tehran stock
exchange Similarly Gregory (2005) established that the greater the FCF the better the
performance in merger undertakings Szewczyk et al (1996) and Chang et al (2007)
concluded that shareholders favour businesses that have FCF
In his study on the effects of agency costs on performance of firms listed at the NSE
Wambua (2013) also found a positive relationship between FCF and firm performance
The findings show that increasing FCF disposes more resources to firm managers who
then deploy the resources towards generating more revenues and profits for the firm
The findings are inconsistent with the FCF hypothesis postulated by Jensen (1986) which
suggests that agency conflicts between firm managers and shareholders become more
severe in the presence of substantial FCF thereby negatively affecting firm performance
Furthermore these findings reject the agency theory which was proposed by Jensen and
Meckling (1976) The agency theory is based on the premise that the goal of firm
managers is to maximize their personal wealth and other self-interests instead of
maximizing the wealth of shareholders
On the contrary the findings seem to support the stakeholder theory which advances that
firm management has a network of relationships and therefore corporate accountability
109
includes a broad range of stakeholders such as suppliers business associates financial
institutions the government customers among others Similarly the findings are
consistent with the stewardship theory The theory emphasizes the role of firm managers
as being that of stewards who integrate their goals as part of the firmrsquos goals
542 The Influence of Agency Costs on the Relationship between Free Cash Flows
and Financial Performance
The second objective was to assess the influence of agency costs on the relationship
between FCF and financial performance of firms listed at the NSE The study
hypothesized that agency costs have no significant intervening effect on the relationship
between FCF and performance of firms listed at the NSE The assessment of agency
costs FCF and financial performance was achieved by reviewing financial statements of
companies listed at the NSE The results indicate a statistically significant positive
intervening effect of agency costs on the relationship between FCF and financial
performance
The results reveal that agency cost measure is positive and significantly associated with
firm performance This can be attributed to the role of internal control system in reducing
agency costs associated with residual loss due to suboptimal managerial actions These
findings are supported by Kangarluei Motavassel and Abdollahi (2011) and Khidmat
and Rehman (2014) who established a statistically significant positive effect of agency
costs on the relationship between FCF and firm performance
110
Similarly Lin and Lin (2014) found a positive statistically significant effect of agency
costs on the relationship between FCF and firm performance in the Australian takeover
market These findings are contrary to the argument that substantial FCF increases
agency costs which subsequently affects firm performance negatively The FCF
hypothesis and the agency theory are therefore not supported by the findings On the
contrary the stakeholder theory and the stewardship theory are supported by the results
543 The Influence of Firm Characteristics on the Relationship between Free Cash
Flows and Financial Performance
The third objective of the study was to determine the moderating effect of firm
characteristics on the relationship between FCF and performance of firms listed at the
NSE The firm characteristics evaluated were firm size and age of the firm An
assessment of audited financial statements was carried out to measure FCF firm
characteristics (firm size and age of the firm) and firm financial performance
Results indicate firm size exhibiting a statistically significant positive moderating effect
on the relationship between FCF and firm financial performance Similarly firm age
shows a positive moderating effect on the relationship between FCF and firm financial
performance and the effect is also statistically significant The positive effect of firm size
confirms the results of the study conducted by Nyamweno and Olweny (2014) which
found firm size to be positively related to ROA This indicates that larger firms report
higher financial performance as compared to smaller firms Abbasi and Malik (2015)
clarified the relationship between firm size and financial performance by concluding that
111
larger firms had higher likelihoods of obtaining credit from financial institutions and
would get loans at lower rates because they have superior credit worth ratings and have
lower risk of bankruptcy
Heydari et al (2014) argue that firm characteristics such as firm age and size can expose
a firm to more agency costs related to management and growth prospects thus depressing
the effect of FCF on firm performance This result can be viewed from the perspective of
liability of obsolescence in which organizational performance declines with age
The decline can be attributed to environmental drift resulting from rivalry and
competition and organizational inertia the syndrome of too big or too old to change
Liabilities of obsolescence arise from growing external mismatch with the environment
The results indicate positive effects of firm characteristics on the relationship between
FCF and firm financial performance The results in this study support the RBV theory
which is concerned with internal firm specific factors and their effect on performance
The RBV theory views the firm as a bundle of resources which are combined to create
organizational capabilities that it can use to earn more than average profitability If well
developed competences from these resources become a source of competitive advantage
(Grant 1991)
112
544 The Joint Effect of Free Cash Flows Agency Costs and Firm Characteristics
on Financial Performance
The last objective of the study was to establish the joint effect of FCF agency costs and
firm characteristics on financial performance of firms listed at the NSE Financial
performance was measured by Tobinrsquos Q Firm characteristics that were considered in
the study were firm size and age of the firm Panel data results indicate that there is a
positive statistically significant joint effect of FCF agency costs and firm characteristics
on firm performance These findings support results by Chen et al (2016) who conclude
that large firms which have been in existence for a long time tend to have structures in
place to reduce agency costs
The findings are also similar to Wang (2010) who concluded that there exists a positive
joint effect of firm size FCF and agency cost on firm performance Results of the study
by Jabbary Hajiha Labeshka and Hassanpour (2013) are confirmed by these findings
which reveal that FCF have a positive significant effect on firm performance even with
the inclusion of control variables of agency costs and firm characteristics All the agency
cost coefficients indicate statistically significant positive effects
Emami et al (2014) observe that internal control systems provide an overarching
framework that reduces agency costs and hence positively affecting firm performance
These findings are also similar to Dawar (2014) who established that firm monitoring
costs impact positively on firm performance In testing financial performance firm size
had a coefficient of 0231 and p-value of 001 when jointly tested with other variables
113
indicating that firm size has a positive effect on firm performance even with control
variables introduced
These findings are supported by Banafa (2016) who concluded that firm size affects
performance of firms significantly albeit with small effect when moderated by other
variables In testing financial performance firm age revealed a positive but not
statistically significant effect with a coefficient of 0107 and a p-value of 0074 These
results contradict with Brouwe et al (2005) who concluded that productivity growth
rates are negatively correlated with firm age
Overall the joint effect of FCF agency costs and firm characteristics on performance of
firms listed at NSE indicates a positive significant relationship We therefore reject the
null hypothesis which states that there is no significant joint effect of free cash flows
agency costs and firm characteristics on financial performance of firms listed at the NSE
These results have rejected the FCF hypothesis and the agency theory This is because
FCF firm characteristics and agency costs have indicated a positive joint effect on firm
performance On the other hand the stewardship theory the stakeholder theory and the
RBV theory seem to be supported by the findings The organisational theory which
explains firm size in relation to profitability as well as organizational transaction costs
agency costs and span of control also seems to be supported by the findings of this study
114
Table 510 Summary of Tests of Hypotheses Results and Conclusions
Hypothesis R2
(p-value) Conclusion
H01 FCF have no significant
effect on financial
performance of firms listed at
the NSE
02391
00023
Null Hypothesis rejected
H2 Agency costs (AC) have
no significant intervening
effect on the relationship
between FCF and financial
performance of firms listed at
the NSE
05122
0031
Null Hypothesis rejected
H03a Firm age has no
significant moderating effect
on the relationship between
FCF and financial
performance of firms listed at
the NSE
04658
0047
Null Hypothesis rejected
H03b Firm size has no
significant moderating effect
on the relationship between
FCF and financial
performance of firms listed at
the NSE
06167
0041 Null Hypothesis rejected
H04 There is no joint effect of
FCF agency costs and firm
characteristics on financial
performance of firms listed at
the NSE
07708
0033
Null Hypothesis rejected
115
55 Summary and Presentation of Empirical Models
The chapter presented the study results from analytical tests conducted to verify the study
hypotheses The findings of the statistical analyses carried out were presented and
interpreted The study established that FCF have a statistically significant positive effect
on financial performance This relationship is intervened by agency costs and moderated
by firm characteristics
Agency costs have a statistically significant positive intervening effect on the relationship
between FCF and financial performance On the other hand firm characteristics have a
statistically significant negative moderating effect on the relationship between FCF and
firm financial performance Finally the study established that there is a joint effect of
FCF agency costs and firm characteristics on financial performance of firms listed at the
NSE The joint effect is positive and statistically significant The empirical conceptual
model depicting the relationships between the variables is presented in figure 51 below
116
Figure 51 Revised Empirical Model ndash Financial Performance
Independent Variable Dependent Variable
Intervening Variable H1 Ǭit = 048011 + 0206FCFit
H2 Ǭit = 0187 + 0148ACit + 0211FCFit
H4 Ǭit = 065 + 00144FCFit + 0314ACit + 0231SIZit + 0107AGEit
Ǭit = 065+0207FCFit+0094AGEit + 0045FAGEit
H3 Ǭit = 0144+0155FCFit +0048SIZit+ 0227FSIZit
Moderating Variable
Source Researcher (2018)
Free Cash Flows
FCFit=(Net income
(PAT)+depreciation and
amortization - CAPEX -
change in non-cash
working capital + net
borrowing)Sales
Firm Financial
Performance
- Tobinrsquos Q
Agency Costs
- Asset utilization efficiency AC
- Production cost efficiency
Firm Characteristics
- Firm Size
- Age of the firm
117
CHAPTER SIX SUMMARY OF FINDINGS CONCLUSIONS AND
RECOMMENDATIONS
61 Introduction
This study investigated the relationship between FCF agency costs firm characteristics
and financial performance of firms listed at the NSE The independent variable is FCF
while agency costs are intervening variables and firm characteristics are moderating
variables Financial performance is the dependent variable The chapter has summarized
the findings of the study and made conclusions upon which recommendations are drawn
Discussions conclusions and recommendations have been presented These have been
discussed in light of other studies that have investigated the same or similar variables in
other settings The chapter ends with the study implications to theory policy and
practice and recommendations for further research
The study had four objectives upon which conclusions are aligned to The objectives
were first to stablish the relationship between free cash flows and financial performance
of firms listed at the NSE second to assess the influence of agency costs on the
relationship between free cash flows and financial performance of firms listed at the
NSE third to determine the influence of firm characteristics on the relationship between
free cash flows and financial performance of firms listed at the NSE and lastly to
establish the joint effect of free cash flows agency costs and firm characteristics on
financial performance of firms listed at the NSE
118
62 Summary of Findings
This study was founded on the premise that FCF have an influence on financial
performance and that the relationship between the two is intervened by agency costs and
moderated by firm characteristics A conceptual framework was therefore developed and
the study empirically tested hypotheses which were guided by the study objectives The
first objective of the study was set to find out the relationship between FCF and
performance of firms listed at NSE The findings reveal that FCF have a statistically
significant positive effect on performance of firms listed at the NSE
This finding is supported by the coefficient of determination of 02391 which indicates
the variations in firmsrsquo financial performance (explanatory variable) explained by FCF
(predictor variable) The effect of FCF was established to be statistically significant and
therefore the null hypothesis was rejected Therefore we reject the null hypothesis that
FCF have no statistically significant effect on performance of firms listed at the NSE
The results are inconsistent with the FCF hypothesis advanced by Jensen (1986) which
proposes that agency conflicts between firm managers and shareholders become more
severe in the presence of substantial FCF thereby negatively affecting financial
performance Additionally these findings reject the agency theory which was suggested
by Jensen and Meckling (1976) These results are consistent with Wambua (2013) who
found a positive relationship between FCF and firm performance The findings imply that
increasing FCF avails more resources to firm managers who utilize the funds in
generating more wealth
119
The second objective of the study sought to assess the influence of agency costs on the
relationship between FCF and financial performance of firms listed at the NSE The
findings indicate that agency costs have a positive statistically significant intervening
effect on the relationship between FCF and financial performance of firms listed at the
NSE Thus the study rejected the null hypothesis which states that agency costs have no
significant intervening effect on the relationship between FCF and financial performance
of firms listed at NSE
These findings support Lin and Lin (2014) who found a positive statistically significant
effect of agency costs on the relationship between FCF and firm performance in the
Australian takeover market These findings are contrary to the FCF hypothesis suggested
by Jensen (1986) and the agency theory postulated by Jensen and Meckling (1976)
However the stakeholder theory advanced by Freeman (1984) and the stewardship theory
developed by Donaldson and Davis (1991) seem to be supported by the findings
The third objective of the study sought to establish the influence of firm characteristics on
the relationship between FCF and financial performance of firms listed at the NSE
Results indicate that firm characteristics (both firm size and age) have a positive
significant moderating effect on the relationship between FCF and financial performance
of firms listed at the NSE These findings contradict Heydari et al (2014) who argue that
firm characteristics such as firm age and size can expose a firm to more agency costs
related to management and growth prospects thus depressing the effect of FCF on firm
performance
120
The fourth and final hypothesis sought to establish the joint effect of FCF agency costs
and firm characteristics on financial performance of firms listed at the NSE Results show
positive coefficients for all the variables which means that as FCF agency costs and firm
characteristics jointly increase performance of the NSE listed firms also increases Firm
characteristics show a positive statistically significant joint effect on firm financial
performance and also FCF and agency costs show a positive statistically significant joint
effect on firm financial performance The results have rejected the FCF hypothesis and
the agency theory On the other hand the results seem to support the stewardship theory
the stakeholder RBV theory and the organisational theory
63 Conclusions
Based on the findings of the study FCF is fundamental to firm performance because it
allows firms to invest and grow thereby improving performance Firms should strive to
increase FCF since it has a statistically significant positive effect on financial
performance Similarly firms should invest more in firm monitoring which according to
the findings in this study the benefits derived from investing in firm monitoring
(improved firm performance) outweigh the agency costs of investing therein (in firm
monitoring) This study has found no evidence supporting the FCF hypothesis as
suggested by Jensen (1986) and therefore firms listed at the NSE are not consistent with
the FCF hypothesis
Consistent with these findings Nyamweno and Olweny (2014) found firm size to be
positively related to financial performance Similarly Dawar (2014) found that firm
121
monitoring costs impact positively on financial performance Conflicting with literature
(Kwanum amp Lorpev 2012) firm age indicated a positive effect on the relationship
between FCF and firm financial performance However the findings of this study are
consistent with Banafa (2016) who concluded that firm size affects firm performance
significantly when moderated by other variables It is therefore confirmed that there
exists a strong relationship between FCF agency costs firm characteristics and financial
performance of firms listed at the NSE
64 Contributions of the Study
The study has contributed to knowledge in the areas of FCF and the agency problem firm
characteristics and firm performance More specifically the study has contributed to
theory policy and practice
641 Contribution to Theory
The results of this study have to a large extent rejected the FCF hypothesis advanced by
Jensen (1986) and the agency theory advanced by Jensen and Meckling (1976) which
postulate that when a firm has generated significant FCF and there are no lucrative
investment projects available managers tend to abuse the FCF which results in increased
agency costs The study results have therefore given credence to the critics of the FCF
hypothesis and agency theory who argue that the theories foster short-termism by not
favouring investments that have long run returns Furthermore the findings support the
argument that even in conditions of greatly specific assets where the likelihood of
opportunism is very high there are people who will give precedence to cooperation and
trust and will not engage in opportunistic behavior
122
The study findings have also given credibility to the stewardship theory postulated by
Donaldson and Davis (1991) which emphasizes the role of firm managers as being
stewards incorporating their objectives as part of the firm As stewards they are
contented and encouraged when success of the firm is achieved Agency costs have
shown a positive intervening effect on the relationship between FCF and firm
performance This finding gives credibility to firm monitoring through CG which seems
to have achieved the objective of aligning the interests of firm managers and
shareholders The study findings also imply that firm capabilities and firm characteristics
complement the effects of agency costs on performance
The inclusion of firm characteristics as a moderating variable provided an opportunity to
test the RBV and organizational theories by providing empirical evidence about how the
specific firm characteristics (size and age) affect firm performance This study adopted
two measures of agency costs This measurement approach has enabled the study to offer
a stronger and more robust assessment of the linkages between the study variables
642 Contribution to Policy
The Kenyan context is characterized by calls for effective CG particularly for public
limited liability firms (Okiro 2014) These study findings have refuted the FCF
hypothesis by revealing a positive relationship between FCF and firm performance as
intervened by agency costs This is an indication that investing in firm monitoring is
yielding positive results Adopting good CG mechanisms (firm monitoring which form
123
part of agency costs) is an effective way of improving firm performance Firms should
endeavor to strengthen their monitoring mechanisms so as to increase performance
Improving CG entails having an optimal number of board of directors enhancing board
independence making full disclosure of shareholding and directorrsquo remuneration Policy
makers will therefore maintain CG calls and strive to strengthen and continue developing
policies regulations and prudential guidelines that protect and strengthen shareholders
643 Contribution to Practice
The study findings have shown the fundamental importance of firms generating FCF and
strengthening firm monitoring The joint effect of FCF agency costs and firm
characteristics on firm performance has yielded a positive relationship Firm managers
investors and other practitioners will therefore put more emphasis on the need for firms to
generate FCF and to enhance firm monitoring
Cash flows from operating activities financing activities and investment activities will be
more keenly analyzed with a view to achieve greater efficiency This study has also
delineated FCF from agency costs unlike studies such as Jensen (1986) which generally
regard FCF as agency costs This gives firm managers investors and other practitioners a
better understanding of the variables and their linkages which will enhance effectiveness
and efficiency in firm operations
124
65 Limitations of the Study
The study focused on firms listed at the NSE which operate in a unique environment
Unique factors such as regulatory environment culture and demographics limit the
generalizability of the study results to other countries or markets However this
limitation does not render the study findings applicable to NSE listed firms only Some
aspects could be relevant to other markets
Secondly the major theoretical motivations underlying this study are the FCF hypothesis
and the agency theory Traditionally the board of directors keenly monitors decision
makers who tend to divert resources to their own personal interests The findings support
this view and offer evidence that proper firm monitoring mechanisms yield higher firm
performance A probable limitation of the study is that it does not integrate other CG
mechanisms such as influencing managersrsquo actions through an advisory role
Thirdly the study disregards practices other than board monitoring that may serve to
lessen agency costs Firm monitoring costs were a part of the larger agency cost variable
The omission of alternative board monitoring practices did not therefore undermine the
robustness and or the rigor of the study Fourthly the study used only two firm
characteristics These are firm size and age of the firm Other firm characteristics include
profitability leverage liquidity sales growth among others The study employed size and
age only because they are the most commonly used in literature and their effect on firm
performance is more significant (Demsetz amp Lehn 1985 and Mule Mukras amp Nzioka
2015)
125
Lastly literature indicates at least seven proxy measures of agency costs These are
operating expense to sales ratio total asset turnover advertising and RampD expense to
sales ratio administrative expense to sales ratio earnings volatility firm monitoring
index and FCF This study utilized only two of these measures (total asset turnover and
operating expense to sales ratio) Agency cost measures other than the two used in this
study may yield different findings Employing only one agency cost measure may still be
sufficient and therefore the omission of other measures did not undermine the robustness
and or the rigor of the study
66 Recommendations of the Study
The findings have indicated that there exists a positive relationship between FCF and
financial performance The study therefore recommends that firm managers investors
and other practitioners should focus more on the need for firms to generate FCF Positive
FCF indicate that the firm is making more cash than is used to operate the firm and for
reinvestment Such excess funds can be given back to shareholders as dividends or share
repurchase packages in cases where the firms have limited growth prospects and the
funds could not be better invested somewhere else
It is therefore recommended that regulators policy makers investors and other
practitioners should emphasize on monitoring and CG mechanisms to maintain if not
improve high firm performance Study results indicate that proper monitoring
mechanisms can bring the actions of firm managers into congruence with those of
shareholders which primarily is to maximize the shareholdersrsquo wealth
126
67 Suggestions for Further Research
This study used Tobinrsquos Q in measuring financial performance Further studies need to be
conducted using ROE ROI ROA DY sales growth market share or productivity
Secondly the study population was all firms listed at the NSE These firms cut across
various industry sectors Future studies could focus on specific industries such as
manufacturing financial sector communications agricultural or automobile industry
This is because focusing on a specific industry could yield different results that are
unique for the industry
Thirdly this study used only two firm characteristics as moderating variables These are
firm size and age of the firm Future studies could employ sales growth liquidity growth
prospects profitability asset growth turnover ownership structure dividend pay-out
profitability and access to capital markets among others Use of other moderating
variables may yield different results
Lastly the study only employed two proxy measures of agency costs Future studies
should attempt to use all the suggested seven agency cost measures or the other agency
cost measures not employed in this study This could yield different results or provide
more robustness and rigor in the study
127
REFERENCES
Abbasi A amp Malik A Q (2015) Firm size moderating financial performance in
growing firms Empirical evidence from Pakistan International Journal of
Economics and Financial Issues 5(2) 334ndash339
Adelegan O J (2009) Investment financial factors and cash flow from Nigerian panel
data Journal of African Development 11(1) 77-108
AERA APA amp NCME (2000) Standards for educational and psychological tests
Washington DC American Psychological Association American Educational
Research Association National Council on Measurement in Education
Aldrich H E amp Austen E (1986) Even dwarfs started small Liabilities of size and age
and their strategic implications In Staw B Cummings (Eds) Research in
organizational behavior JAI Press Greenwich CT
Ayako A Kungu G amp Githui T (2015) Determinants of the performance of firms
listed at the Nairobi Securities Exchange Research Journal of Finance and
Accounting 6(12) 157-164
Aiken L S amp West S G (1991) Multiple regression Testing and interpreting
interactions Thousand Oaks CA Sage
Bain J S (1959) Industrial organization New York John Wiley amp Sons
Baker W E amp Sinkula (2005) Market orientation and the new product paradox Journal
of Product Innovation Management 22(6) 485-502
Banafa A (2016) The effect of leverage liquidity and firm size on financial
performance of listed non-financial firms in Kenya Unpublished PhD Thesis
Jomo Kenyatta University of Agriculture and Technology
128
Barney J B (2002) Gaining and sustaining competitive advantage 2nd
ed Reading
Mass Addison-Wesley
Baron R M amp Kenny D A (1986) The moderator-mediator variable distinction in
social psychological research conceptual strategic and statistical considerations
Journal of Personality and Social Psychology 51(6) 1173-1182
Berle A A amp Means G C (1932) The modern corporation and private property
McMillan New York
Bonett D G amp Wright T A (2014) Cronbachrsquos Alpha Reliability Interval estimation
hypothesis testing and sample size planning Journal of Organizational Behavior
36 (1) 3-15
Bourne M Neely A D Mills J F amp Platts K (2003) Implementing performance
measurement systems A literature review International Journal of Business
Performance Management 5 (1) 1-24
Brealey A A Myers S C amp Allen F (2005) Principles of corporate finance (8th
ed)
Boston McGraw-HillIrwin
Bromiley P (1990) Advances in strategic management JAI Press Greenwich
Brouwer P Kok J D amp Fris P (2005) Can firm age account for productivity
differences EIM Business research scientific analysis of entrepreneurship and
SMEs SCALES ndash paper N200421 Zoetermeer Netherlands
Brush H W Bromiley P amp Hendrickx M (2000) The free cash flow hypothesis for
sales growth and firm performance Strategic Management Journal 21 455-472
129
Cadogan J W amp Diamantopoulos A (1995) Narver and Slater Kohli and Jaworski and
the market orientation construct integration and internationalization Journal of
Strategic Marketing 3(1) 41-60
Carson D Gilmore A Perry C amp Gronhaug K (2001) Qualitative marketing
research SAGE publications London
Central Bank of Kenya (2016) Bank supervision annual report
Chang S J amp Singh H (2000) Corporate industry effects on business and competitive
position Strategic Management Journal 21 (1) 739-752
Chen X Sun Y amp Xu X (2016) Free cash flow over-investment and corporate
governance in china Pacific-Basin Finance Journal 37 81ndash103
CMA (2010) A comparative analysis of the performance of African stock markets
[Online] Available wwwcmaorke [Accessed 9 August 2015]
Cline B N Williamson C R amp Yore A (2014) Economic calculation and constraints
on firm size Mississippi State University USA
Cooper D R amp Schindler P S (2006) Business research methods 9th
edition Mac-
Grow-hill publishing co ltd New Delhi India
Daft R L (1995) Organization theory and design (11 ed) West Publishing Company
New York
Daily C M Dalton D R amp Cannella J A A (2003) Corporate governance decades
of dialogue and data The Academy of Management Review 28 (3) 371-382
Dancey C amp Reidy J (2011) Statistics without maths for psychology 5th Edition
Prentice Hall London
130
Davis J Donaldson L amp Schoorman D (1997) Towards a stewardship theory of
management Academy of Management Review 22 (1) 20-47
Dawar V (2014) Agency theory capital structure and firm performance some Indian
evidence Managerial Finance 40(12) 1190ndash1206
Dean T J Robert L B amp Bamford (1998) Differences in large and small firm
responses to environmental context strategic implications from a comparative
analysis of business formations Strategic Management Journal 19(8) 709-728
Demsetz H amp Lehn K (1985) The structure of corporate ownership causes and
consequences Journal of Political Economy 93 (6) 1155-1177
Donaldson L (1990) A rational basis for criticism of organizational economics a reply
to Barney Academy of Management Review 15 394-401
Donaldson L amp Davis J H (1991) Stewardship theory or agency theory CEO
governance and shareholder returns Australian Journal of Management 16 (1)
49-65
Donaldson T amp Preston LE (1995) The stakeholder theory of the corporation
concepts evidence and implications Academy of Management Review 20 (1)
65-91
Dyer L amp Reeves T (1995) Human resource strategies and firm performance what do
we know and where do we go International Journal of Human Resource
Management 31 758-775
Easterwood C (1997) Takeovers and incentives for earnings management an empirical
analysis Journal of Applied Business Research 14 29-48
131
Emami E Salteh H M amp Hasanzadeh R B (2014) Social responsibility and value of
firms listed at Tehranrsquos Stock Exchange International Review of Management
and Business Research 31(21) 332ndash338
Fama E F (1980) Agency problems and theory of the firm Journal of Political
Economy 88(2) 288-307
Fauver L amp Naranjo A (2010) Derivative usage and firm value the influence of
agency costs and monitoring problems Journal of Corporate Finance 16 719-
735
Ferris S P amp Yan X S (2009) Agency costs governance and organizational forms
evidence from the mutual fund industry Journal of Banking and Finance 33 619-
626
Field A (2009) Discovering statistics using SPSS Sage Publications Ltd London
Figge F Hanh T Schaltegger S amp Wagner M (2002) The sustainability Balanced
Score Card - Linking sustainability management to business strategy Business
Strategy and Environment 11 269-284
Freeman R (1984) Strategic management a stakeholder approach Pitman Publishing
Inc Massachusetts
Frentrop P (2003) On the discretionary power of top executives Journal of Asset
Management 5 (2) 91-104
Gleason J M amp Barnum D T (1982) Toward valid measures of public sector
productivity performance measures in urban transit Management Science
28(14) 379-386
Gorard S (2013) Research design robust approaches for the social sciences London
SAGE ISBN
132
Grant R M (1991) The resource based theory of competitive advantage implications
for strategic formulation California Management Review 33(1) 114-135
Gregory A (2005) The long-run abnormal performance of UK acquirers and the free
cash flow hypothesis Journal of Business Finance and Accounting 32(5) 777-
814
Gul F A amp Tsui S T J (1998) A test of the free cash flow and debt monitoring
hypotheses evidence from audit pricing Journal of Accounting and Economics
24 (2) 219-237
Hannan M T amp Freeman J (1984) Structural inertia and organizational change
American Sociological Review 49(2) 149-164
Harford J (2002) Corporate cash reserves and acquisitions The Journal of Finance 54
(6) 1969 ndash 1997
Hawawini G Subramanian V amp Verdin P (2003) Is performance driven by industry
or firm specific factors a new look at evidence Strategic Management Journal
23 (1) 1-16
Hendricks K B amp Singhal V R (2001) Firm characteristics total quality management
and financial performance Journal of Operations Management 19 269-285
Heydari I Mirzaeifar M Javadghayedi M amp Student M A (2014) Investigating the
relationship between free cash flows and firm performance evidence from Tehran
Stock Exchange Indian Journal of Scientific Research 4(6) 269ndash279
Hill C W L (1990) Cooperation opportunism and the invisible hand implications for
transaction cost theory Academy of Management Review 15(3) 500-513
Hubbard R G (1998) Capital market imperfections and investment Journal of
Economic Literature 36 (2) 193-225
133
Jabbary H Hajiha Z Labeshka amp Hassanpour R (2013) Investigation of the effect of
agency costs on firm performance of listed firms at the Tehran Stock Exchange
European Online Journal of Natural and Social Sciences 2(3) 771ndash776
Jensen M (1986) Agency costs of free cash flow corporate finance and takeovers
American Economic Review 76 (2) 323-329
Jensen M C amp Meckling W H (1976) Theory of the firm managerial behavior
agency cost and ownership structure Journal of Financial Economics 3 (4) 305-
360
Kaen F R amp Baumann H D (2003) Firm size employees and profitability in US
manufacturing industries Social Science Research Network Electronic Journal
(1) 1-71
Kapelko M (2006) Evaluate efficiency in the framework of resource based view of the
firm evidence from Polish and Spanish textile amp clothing industry Bellaterra
1(1) 1-56
Kaplan R S amp Norton D P (2001) Transforming Balanced Score Card from
performance measurement to strategic management Part 1 Accounting Horizons
87-104
Kangarluei S J Motavassel M amp Abdollahi T (2011) The investigation and
comparison of free cash flows in the firms listed in Tehran Stock Exchange (TSE)
with an emphasis on earnings management International Journal of Economics
and Business Management 2(2) 5352ndash118
Kargar E F amp Ahmadi G R (2013) The relationship between free cash flows and
agency costs levels evidence from Tehran Stock Exchange Research Journal of
Finance and Accounting 4(14) 51ndash66
134
Kerlinger F N (2002) Foundations of behavioural research Holt Rinehart and
Winston Inc USA
Khidmat W B amp Rehman M U (2014) The impact of free cash flows and agency
costs on firm performance - an empirical analysis of KSE listed companies of
Pakistan Journal of Financial Engineering 01(03) 145 ndash 175
Kimberlin C L amp Winterstein A G (2008) Validity and reliability of measurement
instruments used in research American Society of Health-System Pharmacists 65
Kinoti M A (2012) Factors contributing towards adoption of green marketing
practices in the mobile phone service providers in Kenya Unpublished PhD
Thesis University of Nairobi Kenya
Kogan L amp Tian M (2012) Firm characteristics and empirical factor models a data-
mining experiment International Finance Discussion papers 1070
Kwanum M amp Iorpev L (2012) Capital structure and firm performance evidence from
manufacturing companies in Nigeria International Journal of Business and
Management Tomorrow 2 (5) 1ndash17
Leibenstein H (1976) Beyond economic man Cambridge MA Harvard University
Press
Lengnick-Hall C A amp Wolff J A (1999) Similarities and contradictions in the core
logic of three strategy research streams Strategic Management Journal 20(12)
1109-1132
Lin L amp Lin D (2014) Agency cost of free cash flow and biddersrsquo long-run takeover
performance Universal Journal of Accounting and Finance 2(1) 1-8
135
Lusthaus C Anderson G amp Murphy E (1995) Institutional assessment a framework
for strengthening organizational capacity for IDRCrsquos research partners
International Development Research Centre Ottawa
Mackinnon D P Lockwood C M Hoffman J M West S G amp Sheets V (2002) A
comparison of methods to test mediation and other intervening variable effects
Psychological Methods 7 (1) 83-104
Mbugua D (2015) Market orientation firm characteristics dynamic capabilities and
performance of deposit-taking savings and credit cooperative societies in Kenya
Unpublished PhD Thesis University of Nairobi Kenya
Mansell S (2013) Capitalism corporations and the social contract a critique of
stakeholder theory Cambridge Cambridge University Press
McKnight P J amp Weir C (2008) Agency costs corporate governance mechanisms and
ownership structure in large UK publicly quoted companies a panel data analysis
The Quarterly Review of Economics and Finance 49 (2009) 139-158
Meyer M W amp Zucker L G (1989) Permanently failing organization Sage Beverly
Hills CA
Miller D amp Chen M J (1994) Sources and consequences of competitive inertia
Administrative Science Quarterly 39(1) 1-17
Milne F Purda L amp Anand A (2008) Monitoring to reduce agency costs examining
the behavior of independent and non-independent boards Seattle University Law
Review 33(4) 809-848
Mitchell R K Agle B R amp Wood D J (1997) Toward a theory of stakeholder
identification and salience defining the principle of who and what really counts
Academy of Management Review 22(4) 853-886
136
Mojtahedzadeh V amp Nahavandi N N A P (2009) Free cash flow agency costs
earnings management and investor monitoring Journal of Financial Economics
32 615-635
Muganda N (2010) Applied business and management research Exploring the
principles and practices of research within the context of Africa Africa Nicorp
Publication
Mugenda O M amp Mugenda AG (2003) Research methods quantitative and
qualitative approaches Nairobi Acts Press
Mule R K Mukras S M amp Nzioka O M (2015) Corporate size profitability and
market value an econometric panel analysis of listed firms in Kenya European
Scientific Journal 11 (13) 376-396
Mwangi M (2014) The influence of membersrsquo income and conduct of SACCOs in the
relationship between characteristics and efficiency of SACCOs in Kenya
Unpublished PhD Thesis University of Nairobi Kenya
Nairobi Securities Exchange (2015) History of the NSE [Online] Available
wwwnsecoke [Accessed 26 June 2015]
Neely A (1998) Measuring business performance - why what and how Economist
Books London
Neely A D Adams C amp Kennerley M (2002) The performance prism the scorecard
for measuring and managing business success Pearson Education Limited
London UK
Nekhili M Amar I F B Chtioui T amp Lakhal F (2014) Free cash flow and earnings
management the moderating role of governance and ownership Journal of
Financial Economics 11 (13) 847 ndash 875
137
Njeru W G (2013) Market orientation marketing mix practices firm characteristics
external environment and performance of tour firms in Kenya Unpublished PhD
Thesis University of Nairobi Kenya
Njuguna L amp Moronge M (2013) Influence of the managerial behavior of agency cost
on the performance of listed firms on NSE International Journal of Social
Sciences and Entrepreneurship 1 (7) 397-410
Norman W amp MacDonald C (2004) Getting to the bottom of tripple bottom line
Business Ethics Quarterly 14 (2) 243-262
Nunes P J M Serrasqueiro Z M amp Sequeira T N (2009) Profitability in Portuguese
service industries a panel data approach The Service Industries Journal 29(5)
693-707
Nunnally J (1967) Psychometric theory Mac-Graw-Hill New York
Nyamweno C N amp Olweny T (2014) Effect of working capital management on
performance of firms listed at the Nairobi Securities Exchange Economics and
Finance Review 3(11) 1ndash14
Nyongrsquoo A P (2000) The context of privatization in Kenya African academy of
sciences Colour Printers Nairobi Kenya
Odundo E (2009) Alternative investment options transforming needs into
opportunities Retirement Benefits Authority CMA Workshop
Okiro K O (2014) The influence of capital structure firm size rules and regulations on
the relationship between composite corporate governance and performance of
firms listed on East African Securities Exchanges Unpublished PhD Thesis
University of Nairobi Kenya
138
Ongore V amp KrsquoObonyo P (2011) Effects of selected corporate governance
characteristics on firm performance empirical evidence from Kenya
International Journal of Economics and Financial Issues 1 (3) 99-122
Opler T amp Titman S (1993) The determinants of leveraged buyout activity free cash
flow versus financial distress costs Journal of Finance 48 1985-1999
Oppenheim A N (1992) Questionnaire design interviewing and attitude measurement
Basic books Inc New York
Patton M (1990) Qualitative evaluation and research methods Beverly Hills CA
Sage
Pearce J A amp Robinson R B (2011) Strategic management formulation
implementation and control (12th
ed) New York McGraw HillIrwin
Penfield R amp Miller J M (2004) Improving content validation studies using an
asymmetric confidence interval for the mean of expert ratings Applied
Measurement in Education 17 359-370
Penrose E T (1959) The theory of the growth of the firm Oxford Basil Blackwell
Perry C Reige A amp Brown L (1999) Realismrsquos role among scientific paradigms in
marketing research Irish Marketing Review 12(2) 16-23
Podrug N (2010) Stewardship relations within management hierarchy in large
Croatian companies Doctoral Dissertation Faculty of Economics and Business
Zagreb
139
Ponnu C H amp Okoth M O (2009) Corporate social responsibility disclosure in Kenya
The Nairobi Stock Exchange African Journal of Business Management 3(10)
601-608
Porter M E (1980) Competitive strategy New York The Free Press
Power L (1998) The missing link technology investment and productivity Review of
Economics and Statistics 80(2)300 ndash 313
Priem R L amp Butler J E (2001) Is the resource based view a useful perspective for
strategic management research Academy of Management Review 26(1) 22-40
Proctor S (1998) Philosophy and methods of research process the case of realism
Nurse Researcher 5 (4) 73 ndash 90
Richard P Divinney T M Yip G S amp Johnson G (1999) Measuring organizational
performance towards methodological best practice Journal of Management
35(2) 1340-1378
Richardson S (2006) Over-investment of free cash flow and corporate governance
Review of Accounting Studies 11 159-189
Robinson C amp Schumacker R E (2009) Interaction effects countering variance
inflation factor and interpretation issues Multiple Linear Regression View Points
35(1) 6-11
Rumelt R P (1991) How much does industry matter Strategic Management Journal
12(1) 167 185
Sagwa E V (2014) Human resource management practices and performance of firms
listed at the Nairobi Securities Exchange Unpublished PhD Thesis University of
Nairobi Kenya
140
Salaman G (1979) Work organizations resistance and control Longman London
Saunders M Lewis P amp Thornhill A (2007) Research methods for business students
(4th
ed) Prentice Hall Financial Times Harlow
Schmalensee R (1985) Do markets differ much American Economic Review 75 (1)
341-351
Shepherd W G (1986) On the core concepts of industrial economics in H W De Jong
and W G Shephert eds Mainstreams in Industrial Organization Dordrecht
Martinus Nijhoff Publishers
Singh M amp Davidson W N (2003) Agency costs ownership structure and corporate
governance mechanisms Journal of Banking and Finance 27 793-816
Smith C W amp Warner J B (1979) On financial contracting an analysis of bond
covenants Journal of Financial Economics 7(79) 117-161
Stalk G Evans P amp Schulman L E (1992) Competing on capabilities the new rules
of corporate strategy Harvard Business Review 70(1) 57-69
Stinchcombe A L (1965) Social structure and organizations Handbook of
organizations Rand McNally Chicago
Subrahmanyam A amp Titman S (2001) Feedback from stock prices to cash flows
Journal of Finance 56 (18) 2389-2413
Sundaram A K amp Inkpen A C (2004) Stakeholder theory and ldquothe corporate
revisitedrdquo a reply Journal of Organization Science 15 (3) 370-371
141
Szewczyk S H Tsetsekos G P amp Zantout Z (1996) The valuation of corporate RampD
expenditures evidence from investment opportunities and free cash flow Journal
of Financial Management 25 (1) 105-110
Tabachnick B G amp Fidell L S (2013) Using multivariate statistics (6 ed) Needham
Heights MA Allyn amp Bacon
Thakor R T (2013) Investment opportunities free cash flow and the market values of
foreign and domestic cash holdings Unpublished Working Paper Massachusetts
Institute of Technology
Thompson P amp McHugh D (2002) Work organizations a critical introduction (3rd
ed) Palgrave McMillan
Tirole J (1986) The theory of corporate finance Princeton University Press Princeton
NJ
Venkatraman N Ramanujam V (1986) Measurement of business performance in
strategy research a comparison of approaches The Academy of Management
Review 11(4) 801-814
Vogt S (1997) Cash flow and capital spending Evidence from capital expenditure
announcements Journal of Financial Management 26(2) 44 ndash 57
Waithaka S M Ngugi J K Aiyabei J K Itunga J K amp Kirago P (2012) Effects
of dividend policy on share prices a case of companies at the Nairobi Securities
Exchange Journal of Business Administration and Management 2 (8) 642-648
Wambua P (2013) Effects of agency costs on financial performance of companies listed at
the Nairobi Securities Exchange International Journal of Social Sciences and
Entrepreneurship 1 (5) 587-607
142
Wang G Y (2010) The impacts of free cash flows and agency costs on firm performance
Journal of Service Science and Management 3 408-418
Wernerfelt B (1984) A resource based view of the firm Strategic Management Journal
5(2) 171-180
Wernerfelt B amp Montgomery C A (1985) Tobinrsquos Q and importance of focus in firm
performance American Economic Review 78(1) 246-250
Williams B Onsman A amp Brown T (2012) Is the Australian paramedic a discipline or a
profession A national perspective International Journal of Paramedic Practice
1(5) 162-168
Williams J R (1992) How sustainable is your competitive advantage California
Management Review 34(1) 29-51
World Bank (2000) Corporate governance a framework for implementation A World Bank
Country Study Washington
Yin X amp Zajac E J (2004) The strategygovernance structure fit relationship theory and
evidence franchising arrangements Strategic Management Journal 25(7) 201-242
Wu A D amp Zumbo B D (2008) Understanding and using mediators and moderators
Social Indicators Research 87(3) 367
Zou S amp Stan S (1998) The determinants of export performance a review of the empirical
literature between 1987 and 1997 Journal of Marketing Review 15(5) 333-356
i
APPENDICES
Appendix I Firms Listed at the Nairobi Securities Exchange as at December 31
2015
NO SECTOR
A AGRICULTURAL
1 Eaagads Ltd
2 Kapchorua Tea Co Ltd
3 Kakuzi Ltd
4 Limuru Tea Co Ltd
5 Rea Vipingo Plantations Ltd
6 Sasini Ltd
7 Williamson Tea Kenya Ltd
B AUTOMOBILES AND ACCESSORIES
8 Car and General (K) Ltd
9 Sameer Africa Ltd
10 Marshalls (EA) Ltd
C BANKING
11 Barclays Bank Ltd
12 CFC Stanbic Holdings Ltd
13 IampM Holdings Ltd
14 Diamond Trust Bank Kenya Ltd
15 Housing Finance Co Ltd
16 Kenya Commercial Bank Ltd
17 National Bank of Kenya Ltd
18 NIC Bank Ltd
19 Standard Chartered Bank Ltd
20 Equity Bank Ltd
21 The Co-operative Bank of Kenya Ltd
D COMMERCIAL AND SERVICES
22 Nation Media Group
ii
23 Kenya Airways Ltd
24 Express Ltd
25 Standard Group Ltd
26 TPS Eastern Africa (Serena) Ltd
27 Hutchings Biemer Ltd
28 Uchumi Supermarket Ltd
29 Scangroup Ltd
30 Longhorn Kenya Ltd
E CONSTRUCTION AND ALLIED
31 Athi River Mining
32 Bamburi Cement Ltd
33 Crown Berger Ltd
34 EA Cables Ltd
35 EA Portland Cement Ltd
F ENERGY AND PETROLEUM
36 Kenol-Kobil Ltd
37 Total Kenya Ltd
FIRM AND SECTOR
38 KenGen Ltd
39 Kenya Power amp Lighting Co Ltd
40 Umeme Ltd
G INSURANCE
41 Jubilee Holdings Ltd
42 Pan Africa Insurance Holdings Ltd
43 Kenya Re-Insurance Corporation Ltd
44 Liberty Kenya Holdings Ltd
45 British-American Investments Company ( K) Ltd
46 CIC Insurance Group Ltd
H INVESTMENT
47 Olympia Capital Holdings Ltd
iii
48 Centum Investment Co Ltd
49 Trans-Century Ltd
50 Home Afrika Ltd
51 Kurwitu Ventures
I INVESTMENT SERVICES
52 Nairobi Securities Exchange Ltd
J MANUFACTURING AND ALLIED
53 BOC Kenya Ltd
54 British American Tobacco Kenya Ltd
55 Carbacid Investments Ltd
56 East African Breweries Ltd
57 Mumias Sugar Co Ltd
58 Unga Group Ltd
59 Eveready East Africa Ltd
60 Kenya Orchards Ltd
61 ABaumann CO Ltd
62 Flame Tree Group Holdings Ltd
K TELECOMMUNICATION AND TECHNOLOGY
63 Safaricom Ltd
iv
Appendix II Data Collection Form
Firm X (Indicate Firm name accordingly)
Part A FREE CASH FLOWS
Year
Net
Income
(PAT)
(a)
Depreciation
amp
Amortization
(b)
CAPEX
(crsquo)
Change
in non-
cash
working
capital
(d)
Net
borrowing
(ersquo)
Net
sales
(f)
FCF
= (a +
b ndash c -
d + e)
f
2006
2007
2008
2009
2010
2011
2012
2013
2014
2015
Non-cash working capital includes inventories financial assets held to maturity
receivables and prepayments (current assets) and payables accrued expenses and
current income tax liability (liabilities) For financial and investment firms non-cash
working capital includes prepaid lease rentals intangible assets deferred tax assets
retirement benefit assets and other assets (assets) and taxation payable dividends
payable deferred tax liabilities and retirement benefit liabilities
Net borrowings were determined by comparing current year and previous year long-
term loans
Net sales in case of insurance firms are the equivalent of ldquoNet premium revenuerdquo For
commercial banks it is ldquoTotal operating incomerdquo which is composed of net interest
v
income plus total non-interest income For investment firms it is ldquoIncomerdquo which is
comprised of rental income dividends and interest received and other incomes
PART B FINANCIAL PERFORMANCE
Year Equity Market Value (a) Equity Book Value (b) Tobinrsquos Q = a b
2006
2007
2008
2009
2010
2011
2012
2013
2014
2015
vi
PART C AGENCY COSTS
Year
1 Asset Utilization
Efficiency (AUE)
2 Production Cost Efficiency (PCE)
(a) Net
sales
(b) Total
assets
AUE
= ab
(c) Operating
expenses
(d) Net sales PCE=cd
2006
2007
2008
2009
2010
2011
2012
2013
2014
2015
Net sales in case of insurance firms are the equivalent of ldquoNet premium revenuerdquo For
commercial banks it is ldquoTotal operating incomerdquo which is composed of net interest
income plus total non-interest income For investment firms it is ldquoIncomerdquo which is
comprised of rental income dividends and interest received and other incomes
xii
PART D FIRM CHARACTERISTICS
Firm Size Firm Age
Year (a) Natural Log of Total Assets (b) Natural log of Age (Number of years
since incorporation)
2006
2007
2008
2009
2010
2011
2012
2013
2014
2015
Net sales in case of insurance firms are the equivalent of ldquoNet premium revenuerdquo For
commercial banks it is ldquoTotal operating incomerdquo which is composed of net interest
income plus total non-interest income For investment firms it is ldquoIncomerdquo which is
comprised of rental income dividends and interest received and other incomes

vi
TABLE OF CONTENTS
DECLARATION ii
COPYRIGHT copy iii
ACKNOWLEDGMENT iv
DEDICATION v
LIST OF TABLES x
LIST OF FIGURES xi
ABBREVIATIONS AND ACRONYMS xii
ABSTRACT xv
CHAPTER ONE INTRODUCTION 1
11 Background to the Study 1
111 Firm Performance 3
112 Free Cash Flows 6
113 Agency Costs 7
114 Firm Characteristics 9
115 Firms Listed at the Nairobi Securities Exchange 12
12 Research Problem 15
13 Objectives of the Study 19
131 Broad Objective 19
132 Specific Objectives 20
14 Research Hypothesis 20
15 Value of the Study 21
16 Operational Definition of Terms 22
161 Free Cash flows 22
162 Agency Costs 22
163 Firm Characteristics 23
164 Firm Performance 23
17 Organization of the Thesis 24
vii
CHAPTER TWO LITERATURE REVIEW 26
21 Introduction 26
22 Theoretical Foundation of the Study 26
221 Free Cash Flow Hypothesis 27
222 Agency Theory 28
223 Stakeholder Theory 29
224 Stewardship Theory 31
225 The Resource Based View Theory 33
226 Organizational Theory 36
23 Free Cash Flows and Firm Financial Performance 38
24 Free Cash Flows Agency Costs and Firm Financial Performance 40
25 Free Cash Flows Firm Characteristics and Firm Financial Performance 42
26 Free Cash Flows Agency Costs Firm Characteristics and Firm Financial Performance45
27 Summary of Knowledge Gaps 48
28 Conceptual Framework 55
29 Chapter Summary 56
CHAPTER THREE RESEARCH METHODOLOGY 57
31 Introduction 57
32 Research Philosophy 57
33 Research Design 59
34 Population of the Study 59
35 Data Collection 60
36 Reliability and Validity 60
361 Reliability Test 61
362 Validity Test 62
37 Operationalization of the Study Variables 63
viii
38 Data Analysis 66
39 Choice of Panel Data Analysis Model 67
391 Effect of Free Cash Flows on Financial Performance 68
392 Free Cash Flows Agency Costs and Financial Performance 68
393 Free Cash Flows Firm Characteristics and Financial Performance 70
394 Relating all the Variables 71
310 Chapter Summary 74
CHAPTER FOUR DATA ANALYSIS AND FINDINGS 74
41 Introduction 75
42 Pre-estimation Diagnostics 75
421 Normality test 75
422 Reliability Tests 80
423 Test for Linearity 81
424 Bartletts Test for Internal Consistency 82
425 Multicollinearity Test 83
43 Descriptive Statistics 85
44 Chapter Summary 86
CHAPTER FIVE TESTS OF HYPOTHESES AND DISCUSSION 87
51 Introduction 87
52 Correlation Analysis 87
53 Hypotheses Testing Using Regression Analysis 89
531 Free Cash Flows and Financial Performance 90
532 Free Cash Flows Agency Costs and Financial Performance 92
533 Free Cash Flows Firm Characteristics and Financial Performance 97
534 Free Cash Flows Agency Costs Firm Characteristics and Financial Performance
104
54 Discussion 107
ix
541 The Influence of Free Cash Flows on Financial Performance 107
542 The Influence of Agency Costs on the Relationship between Free Cash Flows and
Financial Performance 109
543 The Influence of Firm Characteristics on the Relationship between Free Cash
Flows and Firm Performance 110
544 The Joint Effect of Free Cash Flows Agency Costs and Firm Characteristics on
Financial Performance 112
55 Summary and Presentation of Empirical Models 115
CHAPTER SIX SUMMARY OF FINDINGS CONCLUSIONS AND
RECOMMENDATIONS 117
61 Introduction 117
62 Summary of Findings 118
63 Conclusions 120
64 Contributions of the Study 121
641 Contribution to Theory 121
642 Contribution to Policy 122
643 Contribution to Practice 123
65 Limitations of the Study 124
66 Recommendations of the Study 125
67 Suggestions for Further Research 126
REFERENCES 127
APPENDICES i
Appendix I Firms Listed at the Nairobi Securities Exchange as at December 31 2015 i
Appendix II Data Collection Form iv
x
LIST OF TABLES
Table 21 Summary of Knowledge Gaps 50
Table 31 Operationalization of Study Variables 64
Table 32 A Summary of Statistical Tests of Hypotheses 72
Table 41 Normality Test 76
Table 42 Reliability Scores for Individual Variables 81
Table 43 Test for Linearity 81
Table 44 Bartlettrsquos Test 83
Table 45 Multicollinearity Test 84
Table 46 Descriptive Statistics for Secondary Data ndash 2006 to 2015 85
Table 51 Pearson Product-Moment Correlations among the Dependent Independent
Intervening and Moderating Variables 88
Table 52 Panel Data Results for Free Cash Flows and Financial Performance 90
Table 53 Panel Data Results of Agency Costs as the Dependent Variable and Free Cash flows
as the Independent Variable 93
Table 54 Panel Data Results of Financial Performance as the Dependent Variable while
Agency Costs and Free Cash flows are the Independent Variables 95
Table 55 Panel Data Results for Financial Performance as the Dependent Variable and FCF
and Firm Age as the Predictor Variables 98
Table 56 Panel Data Results for Financial Performance as the Dependent Variable and FCF
and Firm Age as the Predictor Variables Centered Approach 99
Table 57 Panel Data Results for Financial Performance as the Dependent Variable and FCF
and Firm Size as the Predictor Variables 101
Table 58 Panel Data Results for Financial Performance as the Dependent Variable and FCF
and Firm Size as the Predictor Variables Centered Approach 102
Table 59 Panel Data Results for Free Cash Flows Agency Costs Firm Characteristics and
Financial Performance 105
Table 510 Summary of Tests of Hypotheses Results and Conclusions 114
xi
LIST OF FIGURES
ABBREVIATIONS AND ACRONYMS xii
Figure 21 Conceptual Model 55
Figure 31 Path Diagram for Mediation effect of Agency Costs 69
Figure 41 Q-Q Plot for Free cash Flows (2006 ndash 2015)77
Figure 42 Q-Q Plot for Agency Costs (AC) ndash 2006 to 2015 77
Figure 43 Q-Q Plot for Firm Characteristics (Firm Age) ndash 2006 to 2015 78
Figure 44 Q-Q Plot for Firm Characteristics (Firm Size) ndash 2006-2015 79
Figure 45 Q-Q Plot for Firm Financial Performance ndash 2006 to 2015 80
Figure 51 Revised Empirical Model ndash Financial Performance 116
xii
ABBREVIATIONS AND ACRONYMS
AFM Association of Futures Markets
AIMS Alternative Investment Market Segment
ANOVA Analysis of Variance
ASEA African Securities Exchanges Association
BSC Balanced Score Card
CAPEX Capital expenditure
CCP Central Counter Party
CG Corporate Governance
CMA Capital Markets Authority
CSR Corporate Social Responsibility
DA Discretionary accruals
DY Dividend yield
EMIR European Market Infrastructure Regulations
EASEA East African Securities Exchanges Association
FCF Free Cash flows
FISMS Fixed Income Securities Market
FOMS Futures and Options Market Segment
xiii
IAS International Auditing Standards
IDRC The International Development Research Centre
IFRS International Financial Reporting Standards
KMO Kaiser-Meyer-Olkin
MIMS Main Investment Market Segment
NACOSTI National Commission for Science Technology and Innovation
NASI Nairobi Securities Exchange All Share Index
NSE Nairobi Securities Exchange
NPV Net Present Value
OLS Ordinary Least Squares
OTC Over the Counter
PAT Profit after Tax
Q-Q Quantile ndash Quantile
RBV Resource Based View
ROA Return on Assets
ROE Return on Equity
SACCOs Savings and Credit Cooperatives
xiv
SPSS Statistical Package for the Social Sciences
SSE Sustainable Stock Exchanges
RampD Research and Development
TQM Total Quality Management
UK United Kingdom
USA United States of America
VIF Variance Inflation Factor
WFE World Federation of Exchanges
xv
ABSTRACT
Firm performance is affected by various factors both internal and external to the firm
Internal factors include factors such as firm size age liquidity leverage free cash flows
agency costs profitability and growth prospects among others External factors include
regulation and general macro-economic factors This research sought to find out the
influence of agency costs and firm characteristics on the relationship between FCF and
firm performance The first study objective was to establish how FCF influence
performance of NSE listed firms The second objective was to find out how agency costs
influence the relationship between FCF and performance of NSE listed firms Thirdly to
determine how firm characteristics influence the relationship between FCF and
performance of NSE listed firms and lastly to establish the joint effect of FCF agency
costs and firm characteristics on the performance of NSE listed firms The study used
secondary panel data which were obtained from 60 firms listed at the NSE Secondary
data was for the period 2006 to 2015 Multiple and simple regression analyses were
employed Results indicate that FCF have a positive statistically significant effect on
firm performance and also agency costs have a statistically significant positive
intervening effect on the relationship between FCF and firm performance Additionally
firm characteristics have a positive moderating effect on the correlation between FCF and
financial performance Finally FCF agency costs and firm characteristics have a positive
statistically significant joint effect on firm performance These findings are inconsistent
with the agency theory and the FCF hypothesis Conversely the findings seem to support
the stewardship theory The study therefore recommends that firm managers
shareholders practitioners the government and other regulators should enhance firm
monitoring because the benefits derived from investing therein seem to outweigh the
costs Further research needs to be conducted using longitudinal study design and also by
integrating the views of other practitioners in data collection rather than focusing on firm
managers only
1
CHAPTER ONE INTRODUCTION
11 Background to the Study
The separation of firm proprietorship and management in public firms causes conflict of
interest between firm owners (principals) and firm managers (agents) While the primary
incentive of firm owners is to maximize their wealth by improving firm value the goals
of firm managers are varied and may include enrichment of personal wealth and status
This varying of interests sometimes leads managers to engage in insider dealings where
there are no mechanisms for effective monitoring validation and approving of
managerial decisions (Wang 2010)
Jensen and Meckling (1976) argue that managers opt to extract personal gain from the
firms if they do not hold shares in those firms This has the effect of raising agency costs
which are manifested through investment choices that are not efficient and or managers
not providing sufficient or efficient effort Rising agency costs may eventually affect firm
performance (Tirole 1986) Brush Bromiley and Hendrickx (2000) also hypothesize that
managerrsquos personal-interest encourages wastage and wastefulness when free cash flows
(FCF) are present which similarly could increase agency costs and eventually affect firm
performance Firm characteristics such as profitability firm size liquidity leverage sales
growth age of the firm board structure and composition asset growth turnover
dividend payout and growth prospects are argued to have an influence on the correlation
between FCF and firm performance (Subrahmanyam amp Titman 2001 Kogan amp Tian
2012 and Mukras amp Nzioka 2015)
2
Brush et al (2000) observe that agency theory examines how the behavior of managers
could be focused towards shareholdersrsquo interests to minimize agency costs Jensen and
Meckling (1976) and Jensen (1986) describe three kinds of agency costs First the
monitoring cost of managersrsquo decisions second the bonding cost of restricting
covenants and lastly residual loss due to suboptimal managerial actions The goal of
managers is to enhance personal wealth to the detriment of shareholders The FCF
hypothesis posits that this personal-interest encourages wastage when FCF are present
The stewardship theory is in direct contrast to the agency theory It views managers as
stewards who guard and enhance the wealth of shareholders since by so doing utility
functions of the managers are enhanced (Davis Donaldson amp Schoorman 1997)
Stakeholder theory on the other hand views managers and shareholders among others as
stakeholders and can therefore influence or be influenced by the attainment of the goals
and objectives of the firm (Donaldson amp Preston 1995) The resource based view (RBV)
theory contends that financial firm performance is influenced by firm specific
characteristics (Pierce amp Robinson 2011) Organizational theory on the other hand
attempts to describe the effect of size and firm age on firm performance (Kaen amp
Baumann 2003)
Nyongrsquoo (2000) observes that Kenya has had challenges with regard to the agency
problem and corporate governance (CG) in general The result of these challenges has
been generally low firm profits Ongore and KrsquoObonyo (2011) also note that agency
problems were equally experienced across the globe Several cases of firm failures are an
3
indictment of the efficiency and effectiveness of the current CG structures which fail to
deter FCF related agency costs This research centered on the FCF hypothesis and
agency theory seeks to discover the way agency costs and specified firm characteristics
influence the correlation between FCF and the performance of Nairobi Securities
Exchange (NSE) listed firms Ayako Kungu and Githui (2015) observe that whereas
most NSE listed firms record good performance there are others that have presented
declining performance and yet others have even been delisted from the bourse during the
period between 2003 and 2014 Ongore and Krsquo Obonyo (2011) and Njuguna and
Moronge (2013) have attributed the decline during the period to the agency problem
111 Firm Performance
Gleason and Barnum (1982) define firm performance as a firmrsquos ability to achieve
planned outcomes as measured against projected outputs It encompasses outcomes
associated with shareholder return market performance and financial performance On
the other hand Daft (1995) defines firm performance as the ability to achieve objectives
by expending resources effectively and efficiently Firm performance may also be viewed
as incorporating specifically three areas of organizational outcomes shareholder return
financial return and market performance each with its specific indicators (Richard
Divinney Yip amp Johnson 1999)
Performance is an important concept that is at the centre of a firm and its measurement is
critical in determining whether the firm is achieving the desired objectives Market
performance is measured by assessing customer satisfaction customer retention value
4
delivered to customers and market share While the importance of firm performance is
broadly acknowledged debate on the bases for performance measurement still abound
Researchers should also use operational indicators in addition to using financial
indicators These may include product quality introduction of new products marketing
effectiveness and manufacturing value-addition which may replicate the firmrsquos
competitive position in its industry space and might influence financial performance In
operationalization of firm performance the use of multiple indicator approach would be
superior to the use of only a single indicator (Venkataram amp Ramanujan 1986)
Neely (1998) defined performance measurement systems as comprising of three
interrelated components specific measures that quantify the effectiveness and efficiency
of activities a set of measures that jointly evaluate firm performance as a whole and a
supportive structure that allows data to be collected organized examined deduced and
disseminated Performance measurement is therefore multidimensional On the other
hand Bourne Neely Mills and Platts (2003) describe it as the practice of measuring
effectiveness and the efficiency of an action Efficiency is a measure of how cost-
effective the resources of the firm are used when providing the specified customer service
while effectiveness is the extent to which customer needs are met
The Balanced Score Card (BSC) was developed by Kaplan and Norton (2001) and it
measures customer satisfaction financial performance growth perspectives learning and
of performance and efficiency of internal business processes The sustainable BSC has
been applied to integrate the social and environmental aspects into effective application
5
of both conventional firm strategy and explicit firm sustainability strategies (Figge Hanh
Schaltegger amp Wagner 2002)
The triple bottom line performance measurement integrates the corporate economic
environmental and social performance (Norman amp MacDonald 2004) while the
International Development Research Centre (IDRC) model conceives firm performance
in three general areas First is performance in actions that support the operation
(effectiveness) second is performance related to the available resources (efficiency) and
lastly performance is related to long-term capability or continuing relevance (Lusthaus
Anderson amp Murphy 1995) Other performance measurement techniques include the
Performance Prism and the Cambridge Performance Measurement Process (Neely
Adams amp Kennerley 2002)
Dyer and Reeves (1995) observe that there are no performance measures universally
appropriate and multiple measures should therefore be used Wang (2010) and Ongore
and KrsquoObonyo (2011) use ROA ROE and Dividend Yield (DY) to measure financial
performance Szewczyk Tsetsekos and Zantout (1996) and Mojtahedzadeh and
Nahavandi (2009) have used Tobinrsquos Q as a market-based measure of a firmrsquos financial
performance Tobinrsquos Q relates the market value of firmsrsquo equity with their
corresponding book values Employee job satisfaction employee turnover organizational
effectiveness and efficiency have been proposed by Gleason and Barnum (1982) as non-
financial measures of firm performance Hubbard (1998) observes a positive significant
6
correlation between FCF and performance which is manifested through prudent
investment
112 Free Cash Flows
The concept of FCF presented by Jensen (1986) refers to surplus cash available after
financing profitable ventures FCF are therefore described as net operating income minus
capital expenditure (CAPEX) minus cost of inventory and paid out dividends On the
other hand Brealey Myers and Allen (2005) describe FCF as net income profit after tax
(PAT) plus amortization and depreciation minus CAPEX minus changes in non-cash
working-capital add net borrowingsloans Richardson (2006) argues that firms which
have surplus funds risk wasting it in ventures that are not profitable and that because
FCF are financial resources at the managersrsquo discretion to apportion they are also
referred to as idle cash flows
FCF denotes funds that a firm is able to generate after setting aside cash needed to sustain
or increase its assets FCF are important because they allow firms to pursue investments
that could improve value to shareholders In the absence of funds it is hard to create new
products and services acquire new projects pay out dividends and pay debts Some
shareholders believe that FCF show a better perspective of the firmrsquos ability to create
profits because while earnings can often be misrepresented through accounting
gimmicks it is more difficult to fake FCF Positive FCF indicate that the firm is
generating more funds than are being used to run the firm and to reinvest Many small
firms do not have positive FCF because they invest heavily to grow their operations It is
7
worth-noting that generally negative FCF detrimental to the firm Negative FCF could
be an indication that the firm is engaged in huge investment projects If high returns are
earned from these investments then there is a long run potential payoff (Chen Sun amp Xu
2016)
Jensen (1986) argues that managersrsquo personal - interest motive leads to waste and
inefficiency when FCF are present because the objective of the managers is to increase
their personal wealth instead of shareholdersrsquo wealth Therefore when FCF are present
the result is internal inefficiency and wastage of firm resources which leads to increased
agency costs and lower firm performance Similarly Wang (2010) observes that in the
presence of surplus FCF managers tend to abuse the FCF resulting in inefficient resource
allocation and wrongful investment
113 Agency Costs
Agency costs refer to the cost that a firm incurs due to incongruent interests of firmsrsquo
management and shareholders (Berle amp Means 1932) Jensen and Meckling (1976) point
out that the incomplete manager and shareholder contractual relationship can result into
the agency problem The agency problem that is caused by the firm managers would
result in a loss to the wealth of shareholders in the following ways first managers from
the characteristic of personal-interest drive would raise perquisite consumption and
shirking behavior that in turn leads to increased agency costs Secondly managers might
fail to choose the highest Net Present Value (NPV) project and instead choose that which
maximizes their own personal interest thereby exposing shareholders to unnecessary
investment risk
8
Jensen (1986) claims that there are three kinds of agency costs the monitoring cost of
managersrsquo decisions the bonding cost of restricting agreementcontracts and the residual
loss due to suboptimal managersrsquo actions Monitoring costs are manifested once the
shareholders try to regulate or control the managersrsquo actions For example the auditors
are engaged by a firm on shareholdersrsquo behalf to check and control the managersrsquo
activities to confirm conduct that increases value for the shareholders The pricecost of
engaging the auditors is therefore considered an agency cost The bonding cost entails
bond covenants or contracts A bond covenant is an agreement that restricts the firm from
venturing in specified actions such as a limitation on dividend payment Firm claims
could be structured in a way that controls shareholdersrsquo motive to follow a strategy that
does not increase the total firm value This inherent cost is an agency cost And lastly
residual loss is the cost sustained from conflicting shareholder and manager interests
notwithstanding the use of monitoring and bonding (Smith amp Warner 1979)
Brush et al (2000) argue that once a firm has generated excess FCF management tends
to misuse the FCF resulting in increased agency costs which could eventually lower
firm performance Khidmat and Rehman (2014) on the other hand observe that agency
costs of monitoring could increase as a result of increased FCF and consequently improve
firm performance This is because the firm is able to invest in better CG mechanisms
which improve monitoring managerial decisions and hence reduced wastage Agency
costs are therefore expected to mediate the correlation between FCF and firm
performance because they are intermediate output of FCF Wang (2010) states seven
proxy agency cost measures earnings volatility total asset turnover floatation costs
9
advertising research and development (RampD) expenses to sales ratio operating expenses
to sales ratio free cash flows and administrative expenses to sales ratio
Tirole (1986) argues that there are two main ways through which agency costs are
manifested the first one is inefficient choice of investment and the second is insufficient
or inefficient effort spent by managers Therefore agency cost measures should be
contingent on inefficient asset utilization (due to poor investment choices) excessive cost
of production and extravagant perks for managers (which results in unnecessarily high
expenditure) and inefficient effort spent by managers (the results of which is lower
revenue and profitability) Asset utilization efficiency is measured by assets turnover
ratio which is described as the ratio of sales to assets It indicates the way managers use
the assets under their control in generating revenue Production cost efficiency on the
other hand is measured as operating expenses divided by sales Singh and Davidson
(2003) observe that a high level of operating expense is a close estimate of managersrsquo pay
and perquisites in terms of high salaries executive and lavish offices and other corporate
support amenities To a large extent these costs reflect discretionary expenditure at the
disposal of firm managers
114 Firm Characteristics
Zou and Stan (1998) define firm characteristics as a firmrsquos managerial and demographic
variables that in turn encompass part of the firmrsquos internal environment Firm
characteristics have been listed by Kogan and Tian (2012) to include firm size leverage
liquidity sales growth asset growth and turnover Others include ownership structure
board characteristics age of the firm dividend pay-out profitability access to capital
10
markets and growth opportunities (Subrahmanyam amp Titman 2001 and McKnight amp
Weir 2008)
Vogt (1997) argues that the more a firm has FCF the more it engages into capital
investment and hence the higher the performance Smaller firms gear towards rampant
growth thereby utilizing most or all the available FCF in a bid to better firm
performance The relationship between FCF and investment is stronger in small and
medium firms which generally are in the growth stage Adelegan (2009) on the other
hand notes that the influence of firm size is neutral and that firms that are older incline
more on internally generated funds to finance their business investments than small and
medium firms
Cline Williamson and Yore (2014) observe that the FCF problem seems to be intense in
medium and large multinationals that are less reliant on the capital market The smaller
firms that fund their investments with funds that are generated externally do not
experience such declines in wealth This is because firms that are larger have
considerably more FCF that are available and are subsequently less dependent on the
external market When high FCF are available the unconstrained manager may
socialistically fund investment projects that have a negative NPV Increased levels of
FCF lead to sub-optimal allocation of resources in form of value-destroying and cross-
subsidizing investment action that eventually deteriorates firm performance
Firm age and performance relationship is to a large extent driven by selection and
learning effects in the early stages of the firmrsquos life Once a firm is older the relationship
11
could be more indirect due to a correlation between age of the firm and ownership
changes product life cycle size of the firm and management Usually firms that are new
require time to adapt to the environment A new firm needs to catch up with an older firm
when the new firmrsquos performance is lower than that of the older (existing) firm so as to
be competitive in the market Therefore it is expected that firms that are new will show
higher growth rates in productivity than the older firms as a result of high FCF Hence
age of the firm is negatively correlated with productivity growth rate because older firms
have lower FCF (Brouwe Kok amp Fris 2005)
Similarly Cadogan and Diamantopoulos (1995) note that as firms become older and
more experienced they tend to be more bureaucratic and inflexible Demsetz and Lehn
(1985) denote firm size as the log of total assets and argue that in smaller firms agency
costs related to the FCF problem may be relatively lower than in larger firms because of
more growth opportunities available for smaller firms Larger firms tend to overinvest
thereby generating a relatively lower return on assets (ROA)return on equity (ROE)
Opler and Titman (1993) maintain that more likely firms that have high growth
prospects are managed better than those with less growth prospects Such firms are also
less likely to have surplus FCF since any available cash would be spent on projects that
have positive NPV Thakor (2013) further argues that foreign cash in firms that have
good growth opportunities should be valued significantly higher than foreign cash in
firms that have poor growth prospects since firms that have poor growth prospects are
more likely to be adversely affected by the repatriation tax burden and FCF problems
12
stemming from a relatively low shadow price of cash This further implies that foreign
cash for firms that have poor investment prospects ought to be valued at a discount while
foreign cash for firms that have good investment prospects should be valued at a
premium
Heydari Mirzaeifar Javadghayedi and Student (2014) postulate that firm characteristics
can expose a firm to more managerial costs and thus decrease the expected positive effect
of FCF on firm performance Firm characteristics are therefore expected to moderate the
correlation between FCF and firm performance because their interaction affects the
strength and or direction of the correlation between the dependent and independent
variables (Baron amp Kenny 1986) This study focused on firm characteristics of firm size
and age of the firm because their influence on the correlation between FCF and firm
performance seem to be more significant (Demsetz amp Lehn 1985 and Mule Mukras amp
Nzioka 2015)
115 Firms Listed at the Nairobi Securities Exchange
NSE is the primary stock market in Kenya Apart from equities the NSE deals with the
issue and trade of debt instruments NSE is a member of East African Securities
Exchanges Association (EASEA) and the African Securities Exchanges Association
(ASEA) and also an associate member of World Federation of Exchanges (WFE) a
subordinate member of the Association of Futures Markets (AFM) Additionally the
NSE is a partner Exchange in the United Nations Sustainable Stock Exchanges Initiative
(SSE) The NSE is a market for securities approved and controlled by the Capital
13
Markets Authority (CMA) and has 63 listed firms (Appendix I) Introduced in 2008 the
NSE All Share Index (NASI) is a general indicator of market performance The NASI
integrates all the daily transacted shares therefore giving the general outline of the value
of the market as opposed to the activities of selected securitiesrsquo prices The daily trading
volume of the market is valued at over US $5000000 and a total market capitalization
estimate of US $15000000000 Corporate bonds government bonds and equities are
also traded at the NSE (NSE 2015)
Odundo (2009) notes that as part of the NSE market transformation program the CMA
introduced market improvements in 2001 which led to the restructuring of the NSE into
four separate segments The Alternative Investments Market Segment (AIMS) Main
Investments Market Segment (MIMS) Fixed Income Securities Market Segment
(FISMS) and the Futures and Options Market Segment (FOMS) Development of the
capital market has remained Kenyarsquos strategic development goal since the mid-1980s
The government has realized significant reforms over the last three decades to underpin
the countryrsquos development prospects including modernization of the NSE which includes
computerization of trading divergence of listed securities and stocks dematerialization
and improvement of regulatory and supervisory structures The NSE is among the fastest
growing stock exchanges in the developing markets and is the largest in East Africa
(Ayako et al 2015)
The NSE (2015) indicates that Kenyarsquos capital market has continued to develop The
NSE signed up six clearing members as the exchange readied itself to introduce a
14
derivatives market These clearing members include Cooperative bank of Kenya
Barclays bank of Kenya NIC bank CBA and CFC Stanbic bank Other banks are slated
to sign up and the clearing members would by executing the principal role of clearing
and settling deals strengthen the NSErsquos abilities to begin derivatives trading The
derivatives mechanisms will primarily comprise currency futures and stock indices and
will work to expand liquidity in the market increasing the boursersquos product offer The
NSErsquos derivative market which received authorization from CMA will permit
derivatives that are exchange traded and created on various underlying financial
instruments that will include equities and currencies
The universal world norm has been a system of central counterparty (CCP) clearing and
reporting represented by the European Market Infrastructure Regulationsrsquo (EMIR) latest
rules Further to demanding central clearing of standardized Over-the-Counter (OTC)
derivatives that wasnrsquot the practice earlier EMIR presented other numerous processes to
minimize counterparty risk a significant matter which led to contagion in the recent
global financial crisis The NSE derivatives contracts will be exchange traded and
therefore clearing members will be critical components of the CCP clearing network
(NSE 2015) The CMA (2010) shows that as of 2008 the most actively traded market in
Africa was South Africa recording over 70 percent of the whole African securities
markets revenue making it the most liquid securities market in Africa with the NSE
ranking 5th
with 02 per cent contribution
15
The NSE listed firms were selected for this study because data is readily available and
also the data is generally deemed credible Ponnu and Okoth (2009) observe that several
challenges ranging from boardroom wrangles poor decision making lack of oversight to
control by various boards of directors and unethical practices have been evident among
the listed firms resulting in a trend of poor performance Similarly NSE (2015) shows
that several listed firms have previously been delisted liquidated or placed under
receivership on account of the agency problem
12 Research Problem
The FCF hypothesis suggested by Jensen (1986) states that firm managers may invest in
needless negative NPV projects when there is surplus FCF at their disposal The
hypothesis suggests that greater levels of FCF could lead to more unnecessary
administrative waste and inefficiency negatively impacting on firm performance
Demsetz and Lehn (1985) find that in the presence of substantial FCF large firms tend to
have fewer growth opportunities than smaller ones which could lead to an
overinvestment problem thereby negatively impacting on firm performance Similarly
Gul and Tsui (1998) note that an escalation in financial leverage seems to diminish
agency costs because managers are subject to legal bonding of repaying interest and debt
that subsequently decreases misuse of FCF and therefore improves firm performance
The agency problem accounting anomalies and other governance manipulations is a
worldwide phenomenon affecting many firms including Enron Corporation of the United
States of America (USA) and China Aviation (Ongore amp KrsquoObonyo 2011) The World
16
Bank (2000) indicates that the failure of major conglomerates such as the Bank of Credit
and Commerce International and WorldCom in the USA and United Kingdom (UK)
respectively has inspired interest in the agency problem and governance The economic
crisis in Asia has also contributed to the rising profile of the agency problem In the East
African region the agency problem and governance have been discussed in the
framework of state-run companies where corruption malpractice and subsidization of
deteriorating firms by the government have been the major issues of concerns The
Kenyan context has been characterized by appeals for active CG particularly for public
firms (Okiro 2014) The recent financial problems facing Fidelity commercial bank
Charterhouse bank Imperial bank and Chase bank could be related to the agency problem
between shareholders and firm managers (Central Bank of Kenya 2016)
Frentrop (2003) has recounted that there is still lack of consensus on identifying the
extent and dealing with the complications that are intrinsic in CG processes Waithaka
Ngugi Aiyabei Itunga and Kirago (2012) observe that FCF have caused conflict between
firm managers and shareholders which in turn have affected performance of NSE listed
firms Similarly Ongore and KrsquoObonyo (2011) noted existence of agency problems
among firms listed at the NSE which negatively affected their performance These
observations are consistent with Nyongrsquoo (2000) who posits that the low firm
performance across the Kenyan economy is primarily due to agency problems and bad
CG practices
17
Globally empirical literature shows mixed findings regarding FCF and firm performance
For instance Nekhili Amar Chtioui and Lakhal (2014) carried out a study in Australia
and found increased agency costs emanating from the presence of FCF Similarly Brush
et al (2000) conducted a study in the USA and found that weak CG caused inefficiency
in the allocation of FCF While these findings support the argument that FCF negatively
affects firm performance on the contrary Gregory (2005) whose study was carried out
in the UK established that the mergers with higher FCF were performing better than
mergers with lower FCF In addition a study by Szewcyzk et al (1996) in the USA
found that shareholders favored firms that had both significant FCF and investment
opportunities that were profitable Locally Wambua (2013) found a positive correlation
between FCF and performance of NSE listed firms which again invalidates the
hypothesis which states that there is a negative correlation between FCF and performance
of the firm Conversely Njuguna and Moronge (2013) found that agency conflicts within
firms listed at the NSE are related to FCF which negatively affects firm performance
Regarding the moderating effect of firm characteristics Hendricks and Singhal (2001)
found that smaller firms tend to have better performance in terms of higher sales growth
Similarly Kinoti (2012) found a statistically positive moderating effect of firm
characteristics (ownership age of the firm firm size and type of industry) on the
correlation between corporate image and performance of the firm Conversely Njeru
(2013) found that firm characteristics did not have a statistically significant moderating
effect on the correlation between market orientation and performance In view of these
18
contradicting results it was necessary to further investigate the moderating influence of
firm characteristics on the correlation between FCF and performance of the firm
Some prior studies portray or tend to equate FCF to agency costs For instance Jensen
(1986) presents his study as ldquoagency costs of FCF corporate finance and takeoversrdquo
while Lin and Lin (2014) describe their study as ldquoagency costs of FCF and biddersrsquo long-
run takeover performancerdquo Furthermore Wang (2010) mentions seven proxy measures
of agency costs and one of the proxy measures equates FCF to agency costs These
studies do not give a clear distinction between agency costs and FCF This study has
attempted to delineate FCF from agency costs and has also attempted to provide linkages
between all the study variables
Wang (2010) and Lin and Lin (2014) excluded CAPEX and net borrowings in their
operationalization of FCF This study included both CAPEX and net borrowings in the
definition of FCF Additionally unlike Njuguna and Moronge (2013) who used asset
utilization efficiency as the sole measure of agency costs this study also incorporated
production cost efficiency to measure agency costs that arise out of monitoring
managementrsquos actions These measures of FCF and agency costs are more robust
Furthermore some of the prior studies are bivariate For instance Njuguna and Moronge
(2013) and Wambua (2013) focused on the influence of agency costs on firm
performance In this study a multivariate analysis was employed where the joint effects
of FCF agency costs firm characteristics and firm performance were all incorporated
While many of the studies were carried out in developed economies such as Australia
19
France UK and the USA this study focused on firms listed at the NSE employing cross-
sectional and panel data research designs
In summary this study sought to fill the identified knowledge gaps which constitute the
research problem as follows first global empirical study findings are mixed and non-
conclusive This study therefore focused on firms listed at the NSE and used panel data
design Secondly the study sought to delineate FCF from agency costs Third the study
incorporated the major firm characteristics of firm size and age Fourth CAPEX and net
borrowings were incorporated in defining FCF Fifth two measures of agency costs were
incorporated and these are asset utilization efficiency and production cost efficiency
Lastly a multivariate study was adopted as opposed to bivariate This research was
guided by the following study question How significant is the influence of agency costs
and firm characteristics on the relationship between FCF and financial performance of
firms listed at the NSE
13 Objectives of the Study
The broad objectives and specific objectives of the study are here-below stated
131 Broad Objective
The broad objective of this research was to determine the effect of agency costs and firm
characteristics on the relationship between FCF and financial performance of firms listed
at the Nairobi Securities Exchange Kenya
20
132 Specific Objectives
i Establish the relationship between free cash flows and financial performance of
firms listed at the Nairobi Securities Exchange
ii Assess the influence of agency costs on the relationship between free cash flows
and financial performance of firms listed at the Nairobi Securities Exchange
iii Determine the influence of firm characteristics on the relationship between free
cash flows and financial performance of firms listed at the Nairobi Securities
Exchange
iv Establish the joint effect of free cash flows agency costs and firm characteristics
on financial performance of firms listed at the Nairobi Securities Exchange
14 Research Hypothesis
H1 Free cash flows have no significant effect on the financial performance of firms listed
at the Nairobi Securities Exchange
H2 Agency costs have no significant intervening effect on the relationship between free
cash flows and financial performance of firms listed at the Nairobi Securities Exchange
H3 Firm characteristics have no significant moderating effect on the relationship
between free cash flows and financial performance of firms listed at the Nairobi
Securities Exchange
H3a Firm age has no significant moderating effect on the relationship between
FCF and financial performance of firms listed at the NSE
21
H3b Firm size has no significant moderating effect on the relationship between
FCF and financial performance of firms listed at the NSE
H4 There is no joint effect of free cash flows agency costs and firm characteristics on
financial performance of firms listed at the Nairobi Securities Exchange
15 Value of the Study
This study was intended to provide insights into knowledge about how agency costs and
firm characteristics influence the relationship between FCF and the financial performance
of NSE listed firms This research examined the validity of the FCF hypothesis agency
theory stakeholder theory stewardship theory RBV theory and the organizational theory
and established linkages between these theories thereby interrogating existing
knowledge to affirm modify or reject it The research community in finance will benefit
from the study because it is intended to aggregate and provide important quantitative
literature that will bridge the existing knowledge gap regarding FCF agency costs firm
characteristics and financial performance of firms listed at the NSE It will also serve as
a foundation upon which more empirical studies will be built hence propagating
knowledge
This study sought to establish the correlation between FCF agency costs firm
characteristics and firm performance Investors firm managers and other practitioners
will benefit from the study because it delineates FCF from agency costs and also brings
out the linkages between FCF agency costs firm characteristics and firm performance
Firm managers are expected to act more prudently and efficiently in their pursuit of
maximizing shareholdersrsquo wealth through better firm performance Investors and other
22
practitioners will build on the understanding of the linkages between these variables to
help improve firm performance
The NSE and the listed firms have high growth potential given the various initiatives
being undertaken at the bourse such as demutualization restructuring and introduction of
derivatives trading The government NSE and CMA stand to benefit from this study
because the insights and intuitions gained from the study will help in the development
and improvement of existing policies guidelines and regulation
16 Operational Definition of Terms
The key study variables have been defined as follows
161 Free Cash flows
The term free cash flows refers to the sum of surplus funds available after funding
profitable projects This is described as net income plus depreciation and amortization
less capital expenditure less change in non-cash working capital plus net borrowing
(Brealey Myers amp Allen 2005)
162 Agency Costs
Agency costs refer to the cost that a firm incurs due to inconsistent interests of
management and shareholders (Berle amp Means 1932)
23
163 Firm Characteristics
Firm characteristics refer to a firmrsquos demographic and managerial variables which in turn
comprise part of the firmrsquos internal environment Firm characteristics include firm size
leverage liquidity sales growth asset growth and turnover age of the firm dividend
pay-out profitability access to capital markets and growth opportunities (Zou amp Stan
1998 Kogan amp Tian 2012 Subrahmanyam amp Titman 2001 and McKnight amp Weir
2008) This study focused on firm size and age of the firm
164 Firm Performance
In this research the term firm performance is used interchangeably with organizational or
corporate performance Firm performance refers to an assessment of an organization in
terms of its ability to achieve its stated objectives over a given period of time Firm
performance is broad and has to be studied with reference to its indicators A firm that is
able to meet its objectives is considered to be successful (Sagwa 2014) For this study
firm performance was measured in terms of financial performance
Financial performance perspective may be measured using Tobinsrsquo Q ROA ROE DY
sales growth rate market share productivity and profitability among others This study
used Tobinrsquos Q to measure financial performance Tobinrsquos Q compares the market value
of a firmrsquos equity with its corresponding book values
24
17 Organization of the Thesis
This thesis contains six chapters The first chapter has the introduction and background to
the study The NSE has also been discussed the research problem research objectives
value of the study scope and how the study is organized In chapter two the theoretical
framework on which the study is based has been discussed
The chapter reviews the theoretical and empirical literature relating to the linkages among
the study variables The theories reviewed are The free cash flow hypothesis agency
theory stakeholder theory stewardship theory RBV theory and the organizational
theory
Empirical literature has focused on the relationships among the variables as follows FCF
and firm performance FCF agency costs and firm performance FCF firm
characteristics and firm performance FCF agency costs firm characteristics and firm
performance A summary of knowledge gaps has been presented and finally the chapter
ends with the conceptual framework that guides the study and the conceptual hypotheses
Chapter three has identified and discussed the philosophical orientation the study design
and population of the study
Additionally it has highlighted data collection methods reliability and validity
considerations operationalization of the study variables and analytical data models
Chapter four presents the findings of the general data analysis starting with test of
25
validity and reliability then the descriptive statistics including frequency tables
percentages standard deviations means and Cronbachrsquos Alpha Coefficient of reliability
A presentation of the results of the test of hypotheses and interpretation has been featured
under chapter five The chapter has concluded by a discussion of the resultsfindings
Chapter six gives a summary of the findings conclusion study implications limitations
and recommendations for further studies
26
CHAPTER TWO LITERATURE REVIEW
21 Introduction
The chapter has explored the theoretical foundations of the study Empirical literature has
also been discussed under four sections as follows First FCF and financial performance
second FCF agency costs and financial performance third FCF firm characteristics
and financial performance and lastly FCF agency costs firm characteristics and
financial performance
This chapter also gives a summary of knowledge gaps a graphical framework of the
study variables (FCF agency costs firm characteristics and financial performance)
depicting the researcherrsquos conceptualization of the study It then concludes with the
conceptual hypotheses
22 Theoretical Foundation of the Study
The theoretical framework upon which this study is based is varied Six theories have
been discussed and these are FCF hypothesis agency theory stakeholder theory
stewardship theory RBV theory and the organization theory The research sought to
establish the influence of agency costs and firm characteristics on the correlation between
FCF and performance of NSE listed firms
Although the agency theory stakeholder theory stewardship theory RBV theory and the
organization theory contribute heavily in attempting to explain the interaction between
27
the identified variables and their combined effect on firm performance the FCF
hypothesis is the overarching theory on which this study is founded
221 Free Cash Flow Hypothesis
The notion of FCF was initially suggested by Jensen (1986) where FCF was described as
net cash flow after subtracting all the needs of positive NPV ventures Jensen (1986)
submits that when there are surplus FCF the severity of the agency conflict between firm
shareholders and firm managers is higher The reason for the conflict is that when there is
excess cash in the firm there is no need for the management to raise cash from the capital
market This gives firm management the freedom to spend invest without being
monitored by capital providers as would have been the case if such funds were raised
from the capital market Shareholders would rather have such excess funds distributed
back to them through share repurchase programs or as dividends if the growth
opportunities for the firms are limited and the funds could not be prudently invested
elsewhere Management on the other hand would waste the surplus funds in unprofitable
investments administrative waste and managerial perks
FCF hypothesis postulates that when firms have made significant FCF and the firms do
not have gainful investment projects available firm managers tend to misuse the FCF
which consequently raises agency costs Critics of the FCF hypothesis claim that it
nurtures short termism by discouraging investment that would bring profit in the long-
run This study is related to the FCF hypothesis because based on the observation by
Brush et al (2000) managersrsquo personal-interest inspires wastefulness and ineffectiveness
28
when there is surplus FCF This study sought to establish the influence of agency costs
and firm characteristics on the relationship between FCF and firm performance In this
study therefore it was expected that FCF would have a negative effect on firm
performance
222 Agency Theory
The agency theory was advanced by Jensen and Meckling (1976) and it avows that
shareholders who are the owners (principals) of the firm hire firm managers (agents)
The principal expects the agent to make decisions and act in the ownerrsquos principalrsquos best
interest The managers agents may however have self-interests that conflict with the
interests of the principals Brush et al (2000) observe that agency theory is founded on
the principle that the objective of the management is to achieve their individual interests
instead of shareholdersrsquo interests and that managersrsquo personal-interest encourages waste
and ineffectiveness when there are surplus FCF
Agency theory suggests mechanisms that aim to resolve the shareholder interests and
those of the management The mechanisms include external control measures like
takeovers (Easterwood 1997) The potential for conflict between shareholders and
managers may also be minimized by the use of internal control measures like non-
executive directorsrsquo monitoring and executive share ownership incentives The advocates
of agency theory postulate that control measures are mandatory for directing dishonest
managerial actions Critics on the other hand argue that control creates stronger personal
behavior lessens proactive organizational actions and honesty and lastly results in
suspicion (Jensen amp Meckling 1976)
29
Divergences in goals and attitude towards risk and decentralization in information are
tenets of the agency theory If the information asymmetry and conflict of interestsrsquo
assumptions and are allayed the agency problem then becomes inconsequential and not
of any interest scientifically If there were no information asymmetry the principal would
simply direct and control the agentrsquos actions and appropriately reward the agent If the
principal and the agent have consistent interests then the agentrsquos incentives are clear
(Podrug 2010)
A critique of the agency approach is that the analytical focus on how to resolve conflict
between the various stakeholders in the firm is too narrow and the shareholders are not
the only ones who make investment in the firm (Donaldson 1990) Additionally Hill
(1990) has argued that even in situations of very specific assets where the possibility of
unscrupulousness is very high there are people who will give precedence to collaboration
and trust and will not initiate opportunistic behavior Just like the FCF hypothesis this
research is related to the agency theory because it is centered on conflict of interests
between firm managers and shareholders One of the objectives of this study is to
determine the influence of agency costs on the relationship between FCF and firm
performance It was expected that the higher the agency costs the higher the effect on the
relationship between FCF and firm performance
223 Stakeholder Theory
Developed by Freeman (1984) stakeholder theory combines business accountability to a
wide collection of stakeholders The theory advances that the management of firms has a
30
network of relationships to serve in its stakeholdersrsquo circle in its achievement of
corporate goals The theory develops the understanding of corporate accountability to
include a broad collection of stakeholders such as customers suppliers business
associates employees government and its agencies financial institutions among others
A stakeholder is defined as any person or group which can influence or is influenced by
the attainment of the personrsquos or grouprsquos objectives
Mitchell Agle and Wood (1997) maintain that a stakeholder may be recognized by
looking at either one or two or all the associative aspects namely first the clout to impact
the firm secondly the legality of affiliation in or with the firm and lastly the
earnestness of their entitlement in or on the firm Unlike agency theory in which the
management work and serve the shareholders stakeholder theorists propose that firm
management has a relationships network for service and these include employees
business partners and suppliers Stakeholder theory attempts to address the collection of
stakeholders eligible and demanding managersrsquo attention (Sundaram amp Inkpen 2004)
Donaldson and Preston (1995) have argued that all stakeholders participating externally
or internally in the firm have an interest to fulfill This includes the characteristics and
behavior of firms incorporating how the firm is run how the board of directors thinks
about firm units the way management think about organization and the nature of the firm
itself In this regard the firm should strive to satisfy not only the welfare of its
shareholders but also the welfare of other relevant stakeholders Hence the board should
ensure that the firm acts on opportunities that enhance value to all the relevant
31
stakeholders and also prevent bad management practices that may expose the firm to
scandals or risk financial distress To achieve these the board should consist of more
members with diverse competencies experience as well as capabilities that will
effectively discharge its governance function
The stakeholdersrsquo model has been criticized by Donaldson and Preston (1995) arguing
that managers may use ldquostakeholderrdquo reasons to justify poor performance Mansell (2013)
has also critiqued the stakeholder theory stating that by using the political notion of a
lsquosocial contractrsquo to the firm stakeholdersrsquo theory weakens the values upon which a
market economy is founded The stakeholder theory is relevant to this study to the extent
that shareholders and firm managers are considered as lsquostakeholdersrsquo and therefore can
influence or are influenced by the accomplishment of the organizationrsquos goals This
theory implies that the relationships of the variables in this study can take any direction
positive negative or no relationship
224 Stewardship Theory
Developed by Donaldson and Davis (1991) stewardship theory has its origins in
sociology and psychology A steward guards and strives to maximize the shareholderrsquos
interests through firm performance since in doing so the value of the steward is also
maximized From this perception the steward is the firm management who work for the
shareholders defending and making returns for them Stewardship theory emphasizes the
role of firm management being stewards incorporating their objectives as part of the
firm Therefore as stewards they are contented and encouraged when the firmrsquos success
is accomplished The stewardship theory is quite the opposite of the agency theory It
32
submits that firm managers are honest and upright stewards of the assets delegated to
them under their care and thus making monitoring useless The theory opposes the
agency theory which assumes that managers will act to satisfy their own self-interest
rather than that of the firm Rather stewards who are managers executives and board of
directors are satisfied and motivated when firm objectives are achieved (Donaldson amp
Davis 1991 and Davis et al 1997)
Davis et al (1997) argues that stewards derive greater utility at personal level by
satisfying firm objectives than through self-serving behavior and as such the managers
and directors are also concerned about their personal reputation as expert decision
makers which drives their effort towards better firm performance of the firms they serve
According to the stewardship theory other non-financial motivations such as need for
accomplishment and gratitude personal fulfillment gained by successful achievement of
the goals of the firm respect for authority and peers as well as the firmrsquos work ethics do
impact on the actions of the stewards Superior firm performance is connected to having
majority of inside directors as opposed to external directors since inside directors know
the firm better and are better placed to manage than outside directors
Daily Dalton and Cannella (2003) discern that in order to guard their reputation as
decision makers in firms firm managers are motivated to run the firm with the main
objective of maximizing firm performance Similarly Fama (1980) suggests that firm
managers are also protecting their careers so as to be seen as efficient and effective
stewards of their firms Davis et al (1997) have critiqued the stewardship theory arguing
33
that the role of the lsquostewardrsquo is over-simplified and impracticable and that the theory
emphasizes the personalities and egos of senior directors The stewardship theory is
related to this study to the extent that firm managers are considered lsquostewardsrsquo who act on
behalf of shareholders Just like the stakeholder theory stewardship theory adds value
especially in explaining outcomes where the FCF hypothesis and agency theory are not
supported Since this theory emphasizes the role of firm managers being that of stewards
it was expected that the higher the FCF the higher the firmrsquos performance
225 The Resource Based View Theory
RBV is defined by Pearce and Robinson (2011) as a way of examining and recognizing a
firmrsquos strategic advantages based on observing its distinct mix of skills assets
intangibles and capabilities The RBV theory is concerned with internal firm-specific
factors and their effect on performance Grant (1991) observes that RBV theory views the
firm as a bundle of resources that are combined to generate firm capabilities which it can
use to earn above average profitability Every firm develops capabilities from these
resources and when they are well established these become the basis of the firmrsquos
competitive advantage Penrose (1959) explains the significance of exceptional
packagesbundles of resources controlled by the firm which are critical for performance
These firm resources comprise of tangible assets all capabilities attributes of the firm
organizational processes knowledge and information controlled in order to expand
competence effectiveness and efficiency that will in general lead to greater financial
performance
34
Resources are defined as firm capabilities physical assets and intangibles that are semi-
permanently tied to the firm (Wernerfelt 1984) Barney (2002) observes that the RBV
competitive advantage stems from a firmrsquos unique assets and distinctive capabilities and
assumes that firms can be hypothesized as bundles of resources and that those resources
are heterogeneously dispersed across the firms with resource variances persisting over
time Similarly Baker and Sinkula (2005) note that RBV of the firm suggests that
performance is contingent on the firmrsquos competences and specific resources
The thirst to understand the effects of firm level characteristics on financial performance
has been debated a lot in the research arena Among the arguments presented is that a
firmrsquos financial performance is affected only by structural characteristics within the
industry The other argument is that a firmrsquos financial performance is affected by firm
specific resources Much focus has been given to the firm level characteristics as opposed
to the industry level characteristics because it forms the basis upon which the firms
compete The industry related factors is majorly explained by the competitive focus
approach The RBV theory explains the effect of firm characteristics which are internal
factors to the firm with respect to financial performance (Bain 1959 and Porter 1980)
Researchers have carried out studies to test which of the two commonly disputed factors
(industry factors or firm specific factors) are important in explaining variations in firm
performance Wernerfelt and Montgomery (1985) Schmalensee (1985) Rumelt (1991)
Chang and Singh (2000) and Hawawini Subramanian and Verdin (2003) performed
variance component analysis test to establish the percentage of effects of firm
35
characteristics and industry factors on firm performance as measured by ROA Under the
RBV the firm is seen to be heterogeneous and firms possess a combination of unique
capabilities and assets that are responsible for giving them an upper hand in competition
and enable them achieve superior performance
Wernerfelt (1984) was the earlier supporter of the RBV theory but he did not get much
attention at the time However scholars such as Grant (1991) Stalk Evans and Schulman
(1992) and Williams (1992) revisited Wernerfelt (1984) and found that firms with
particular set of skills and capabilities outperformed their rivals Wernerfelt (1984)
describes a resource as ldquoanything that could be deemed as a strength or weaknessrdquo
According to the RBV of the firm resources (which are inputs for the production of
goods and services) and organizational competences (intangible assets that are founded
learning skills and knowledge in deploying resources) can be sources of competitive
advantage The RBV is criticized for its failure to describe how these resources are
established and organized to realize competitive advantage RBV has also been critiqued
for its inability to contemplate the effect of a dynamic market environment (Lengnick-
Hall amp Wolff 1999 and Priem amp Butler 2001)
Another criticism of the RBV theory is that researchers only concentrate on one resource
type that is intangible assets within a single industry and examine its effect on firm
performance The RBV theory helps in explaining performance variation of intra industry
firms as it specifically addresses firm characteristics rather than industry factors
Financial resources are normally measured by leverage ratios which enable the firm to
36
increase its project financing by borrowing from debt providers Liquidity measures
spontaneous financial resources available to conduct normal business operations
Physical resources as measured by the size of assets is one of the tangible resources the
firm can use to gain competitive advantage while business experience of the firm and
serving board of directors give the firm organizational capabilities that it can use to gain a
competitive advantage over its competitors thus being able to earn an above average
financial performance
The boards of directors are viewed as strategic resources that are responsible for the
advancement of the firms to meet their long-term objectives (Kapelko 2006) RBV is
related to this study because it maintains that a firmrsquos financial performance is influenced
by firm specific characteristics (which are one of the study variables) Based on the RBV
therefore it was expected that the higher the FCF the higher will be firm performance
Firm characteristics were expected to provide an interaction which statistically affects the
strength and or direction of the correlation between FCF and firm performance
226 Organizational Theory
Kaen and Baumann (2003) in an attempt to explain firm size came up with the
organizational theory that explains firm size in relation to profitability as well as
organizational transaction costs agency costs and span of control costs Organizational
theory explains the effect of firm size and age of the firm on firm performance Dean
Robert and Bamford (1998) cite that the size of the firm is somewhat correlated to firm
performance because of concentration industry-sunk costs overall industry profitability
37
and vertical integration Firm size matters in assessing financial performance Large-sized
firms have greater number of departments multi-layer levels of management have more
specialized functions and skills greater formalization and management control is highly
centralized which makes them highly bureaucratized than small-sized firms effectively
making them miss out on profitable opportunities that require urgent attention (Daft
1995)
Hannan and Freeman (1984) Aldrich and Austen (1986) and Meyer and Zucker (1989)
have linked firm size and age of the firm to Inertia Inertia is described as an insufficient
or sluggish adjustment to transformation or opposition to major variations in business
operations which in effect may cause the firm to miss profitable opportunities
Stinchcombe (1965) claims that firms that are older seem to be more experienced and
enjoy the benefits of improvement curve effect which makes them not to be exposed to
the problems of newness and hence enjoy above average performance
Penrose (1959) argues that larger firms are able to generate superior performance because
they have diversified capabilities ability to fully exploit economies of scale and scope
Such firms have formalized procedures of conducting business which ultimately makes
implementation of operations more effective On the contrary Leibenstein (1976) and
Shepherd (1986) argue that firm size is correlated with market power and along with
market power inefficiencies are created leading to inferior performance Thompson and
McHugh (2002) have critiqued the organization theory regarding it as being essentially
38
prescriptive There is an implied belief in underlying values or laws that govern
managersrsquo activities and functions
Another weakness of the organization theory cited by Salaman (1979) is the assumption
that all firms are in some way alike arguing that some firm analysts develop propositions
about firms in general lumping together such dissimilar examples as voluntary
establishments charities and political associations Salaman (1979) observes that it
hinders the analysis of those organizational elements which are radically exposed in
employing firms and not necessarily in all forms of organization Organizational theory
is related to this study because it explains the effect of firm size and age of the firm
(which are firm characteristics) on firm performance These are integral variables in this
study Since the theory cites conflicting views for instance bureaucracy in larger firms
which negatively affects performance on the one hand and economies of scale and
diversified capabilities in larger firms which positively affect firm performance on the
other hand it was expected that the relationship among the study variables would take
any direction Firm characteristics would moderate the relationship between FCF and
firm performance by statistically influencing the strength and or the direction of the
correlation between the predictor and explanatory variables
23 Free Cash Flows and Firm Financial Performance
Wang (2010) studied the impact of FCF on firm performance with empirical data from
Taiwan Stock Market for the period 2002 to 2007 Using a sample of 505 firms
regression analysis was employed in data analysis The study found that FCF had
39
statistically significant effects on firm performance These effects were however
conflicting On the one hand the presence of high FCF escalated imprudent expenditures
that consequently lowered firm performance The results indicated on the other hand that
FCF were generated due to managersrsquo efficiency in operations implying that a positive
correlation between FCF and firm performance
However in his definition of FCF Wang (2010) did not take into account CAPEX and
net borrowings which are critical in the FCF definition Additionally the study focused
on financial performance only The findings by Wang (2010) are partially consistent with
results by Gregory (2005) who studied the long run abnormal performance of UK
acquirers and the correlation between FCF and firm performance Gregory (2005)
established that mergers with greater FCF achieved better than those with lesser FCF
While testing the hypothesis the study used ldquolong term returnsrdquo and also ldquoanalyzed
announcement month returnrdquo However the study did not include daily returns around
announcement which could probably yield different results Furthermore the study
focused on financial performance outcomes only
Brush et al (2000) studied the proposition that sales growths in firms with FCF were less
lucrative than sales growths for firms with lower FCF Data was obtained from firms in
the USA covering eight years 1988 to 1995 and used Tobinrsquos Q to ascertain whether
firms had positive NPV projects available to determine FCF Returns to shareholders
were used as a performance measure The use of shareholder returns was criticized by
Bromiley (1990) because it assumes capital market efficiency which argues that the
returns to a large extent reveal surprises to the market Therefore if the markets expect
40
firmsrsquo sales growths and profitability even very profitable sales growths should not be
reflected in shareholder returns in the periods in which they arose The study found that
firms with higher FCF achieve lower from sales growth than those without or with lower
FCF Since sales growth is a measure of firm performance these findings support the
argument that FCF negatively affects firm performance
The findings by Wang (2010) and Gregory (2005) on the one hand and Brush et al
(2000) on the other hand reveal inconsistencies These contradictions indicate that the
correlation between FCF and firm performance is still unresolved In this study a more
robust measure of FCF was adopted For instance Wang (2010) measured FCF as net
operating income before depreciation minus tax expense minus interest expense minus
share dividends scaled by net sales In this study FCF are defined as in Brealey et al
(2005) as net income add amortization and depreciation minus CAPEX less change in
non-cash working-capital plus net borrowing The study is therefore expected to yield
more reliable and robust results
24 Free Cash Flows Agency Costs and Firm Financial Performance
Lin and Lin (2014) investigated the agency costs of FCF and biddersrsquo long-run takeover
performance in Australia using data for the period 1993 to 2000 The final sample
included 556 acquiring firms The study introduced two proxies of FCF excess
accounting cash flow and excess cash holdings and tested the relationship between
biddersrsquo long-run post-acquisition performance and the level of excess cash The findings
41
indicated that the level of excess cash holdings didnrsquot show a substantial reason for the
cross-sectional disparity in long-run post-acquisition performance
The findings from the flow measure of cash indicated that the acquisitions done by
bidders with surplus accounting cash flow didnrsquot escalate agency costs and therefore were
not value reducing Rather bidders with greater surplus accounting cash flows had better
long-run post-acquisition performance The findings therefore indicate that the
examination of FCF hypothesis in the Australian takeover market is conflicting to the
expectations of the FCF theory This finding is contrary to the argument that substantial
FCF increases agency costs which subsequently negatively impacts on firm performance
However Lin and Linrsquos (2014) definition of FCF ignores CAPEX and net borrowings
which are critical variables
Nekhili et al (2014) analyzed the intervening effect of agency costs of monitoring and
ownership structures in reducing earnings management practices when there is FCF The
sample comprised of 85 French listed firms for the period 2001 to 2010 The results
highlighted the unscrupulous managerial behavior in the presence of high FCF The study
measured FCF by multiplying the retained cash flows by the inverse of Tobinrsquos Q
However like in Lin and Lin (2014) CAPEX and net borrowings were omitted in the
definition of FCF The findings indicated that firms which had high FCF tended to
upwardly manage their earnings Additionally with the availability of high FCF the
tendency of firm managers to use discretionary accruals depended on the firm ownership
and the efficiency and effectiveness of governance mechanisms Precisely independence
42
of audit committees and external audit quality together with firm ownership structure (for
example institutional investors and executive ownership) reduced the extent of earnings
management when FCF were available
Conversely independent directorsrsquo ownership and board independence had no significant
effect on earnings management The results indicate that firm executives employ earnings
management practices that escalate reported earnings This implies that there are
increased agency costs emanating from the presence of high FCF subsequently
negatively affecting firm performance The negative effect of agency costs on the
correlation between FCF and firm performance is also supported by Brush et al (2000)
These results are of interest to this study because the research tried to find out the effect
of agency costs and firm characteristics on the correlation between FCF and performance
of NSE listed firms Agency costs are expected to mediate the correlation between FCF
and firm performance because they are the intermediate output of FCF
25 Free Cash Flows Firm Characteristics and Firm Financial Performance
Demsetz and Lehn (1985) studied the firm characteristics that included structure of
corporate ownership and firm size using 511 firms in the USA Size of the firm was
measured by the mean annual common stock market value and the study period was
1976 to 1980 Ordinary least squares (OLS) regression estimates were employed in data
analysis The findings suggest that in the presence of substantial FCF large firms tend to
overinvest thereby yielding relatively lower performance Large firms tended to have
fewer growth prospects than smaller firms and in the absence of good growth prospects
43
an overinvestment problem is likely to arise thereby negatively impacting on the firmrsquos
performance However the choice of a five-year study period seems too short Literature
indicates that 7 to 10 yearsrsquo study period is preferred (Brush et al 2000 and Nekhili et
al 2014)
In examining the degree of firm level over-investment of FCF Richardson (2006) used
an accounting-based structure to measure over-investment and FCF and confirmed that
over-investment was dominant in firms with the greatest FCF levels The study was
carried out in the USA and used a sample of 58053 firms for the period 1988 to 2002
The study also examined whether there was any association between firmsrsquo governance
structures and FCF over-investment The empirical analysis employed two steps In the
first step the study used an accounting-based structure in measuring both over-
investment and FCF The study defined FCF as cash flow over and above what was
needed to sustain assets in place and to fund new investment projects On the other hand
over-investment was described as investment expenditure over and above that needed to
retain assets in place and to fund probable new investments In measuring over-
investment the study decomposed total investment outlay into two component parts
First it needed investment spending to sustain assets in place and secondly investment
spending in new projects
In the next step the study decomposed investment expenditure into expected investment
outlay and over-investment in negative NPV projects where the latter varied with the
firmrsquos growth prospects industry affiliation funding constraints and other aspects
44
Although the study incorporated the firm characteristics of size liquidity and growth
prospects it focused on financial performance measures only Furthermore the study
excluded age of the firm Results suggest that some governance mechanisms like the
existence of shareholders who are activists seem to lessen over-investment Additionally
firm performance in the presence of FCF was found to be lower in firms with higher
liquidity than those with lower liquidity The findings are consistent with Harford (2002)
who found that cash-rich firms were more probable to undertake acquisitions that
consequently suffer abnormal failures in operational performance
Brouwer et al (2005) investigated whether age of the firm accounted for productivity
differences Data was obtained for the period 1994 to 1999 and the focus was on Dutch
firms Although the dataset included firms from all age cohorts (0-4 years and 5-9 years)
the study focused more on firms of at least 10 years of age Using regression methods the
results showed very few signs of a relationship between productivity (performance) and
age Both growth rate and level of productivity varied between sectors and also differed
with size of the firm There was also no indication that productivity growth rate was
related to the age of the firm On productivity level there were very few signs of the
effects of age The Brouwer et al (2005) study did not fully exploit the panel structure of
the dataset that was available The explicit techniques of estimation that take account of
this structure such as multilevel or panel data estimation techniques are expected to be
more effective
45
Conversely Power (1998) found a negative relationship between the growth rate of
productivity and age at a certain phase in the firmsrsquo lifespan Power (1998) examined the
relationship between plant age and productivity for firms in the manufacturing industry of
the USA for the period 1972 to 1988 The study found that productivity growth rates
decline with age which was credited to the effects of learning Firm characteristics are
expected to moderate the correlation between FCF and performance because their effect
is statistically characterized as an interaction affecting the strength and or direction of
the correlation between FCF and firm performance (Baron amp Kenny 1986)
26 Free Cash Flows Agency Costs Firm Characteristics and Firm Financial
Performance
Investigating the agency costs of FCF corporate finance and takeovers Jensen (1986)
sampled top 200 firms in the oil industry in the USA and found a link between the agency
problem with FCF firm characteristics and firm performance Using regression methods
results suggest that firm managers might misappropriate FCF at their disposal when the
firm does not readily have viable investment opportunities and that agency costs are high
when FCF are combined with poor growth prospects Results also indicate that more debt
would increase efficiency by compelling firms with large FCF but few high-return
investment projects to pay back cash to the creditors Leverage helps in preventing such
firms from misappropriating resources on low-return projects
For industries that are declining within the industry mergers would generate value while
outside industry mergers would likely generate lesser value or negative-returns Mergers
46
within the food industry seemed to reflect the spending of FCF The industry seemingly
generated large cash flows with few growth prospects The findings however seem to be
contradicting because they also indicate that increased leverage escalates agency costs
As leverage increases the typical agency costs of debt rise which include bankruptcy
costs that subsequently negatively affects firm performance
Mojtahedzadeh and Nahavandi (2009) investigated the relationship between agency
problems that arise due to FCF with long term profitability and income management
Using Tobinrsquos Q to measure long term profitability and Adjusted Jones Model to estimate
Discretionary Accruals (DA) panel analysis was used to analyze the data Results from
testing 106 firms listed on Tehran Stock Exchange throughout the years 2003 to 2007
reflect that agency costs emanating from the availability of substantial FCF negatively
affect both long term and short term profitability However the five-year period of study
seems too short and also non-financial performance outcomes were ignored in the study
Similarly Nunes Serrasqueiro and Sequeira (2009) investigated 75 Portuguese service
oriented firms to establish the effect of firm size on profitability (performance) They
introduced control variables of growth prospects leverage liquidity and asset structure
(tangibility)
The study used both dynamic estimators and static panel models Results indicated a
positive statistically significant correlation between firm size and performance They
also found a positive effect of growth prospects and liquidity on profitability but a
negative effect on leverage and asset tangibility on profitability as measured by ROA
47
Results also indicated that substantial FCF negatively affected profitability of the firm
The data employed was for the period 1999 to 2003 a duration which seems too short A
longer study period of seven to ten years would probably yield different results
Milne Purda and Anand (2008) used 1200 Canadian firms for the period 1999 to 2003 to
test the hypothesis that independent boards are more prone than non-independent boards
to willingly embrace mechanisms intended to improve their ability to monitor firm
management The study examined seven mechanisms both in aggregate and individually
through construction of an index that allocated one point for each mechanism embraced
up to a maximum of seven points and conducted multivariate regression analyses in
which the explanatory variable was either the full or the reduced index
Results indicate that the board of directors vigorously monitors decision makers who
have an inclination towards diverting firm resources to their own personal interests as a
consequence of the agency problem and FCF hypothesis thereby negatively impacting on
firm performance The findings also offer evidence that a relatively large number of
acclaimed monitoring mechanisms have been embraced by firms and that the acceptance
rate increases for firms with both independent and executive boards However the Milne
et al (2008) study didnrsquot integrate alterative views for the board of directors such as
influencing management decisions using the advisory role The study also ignored
procedures other than board monitoring that may serve to lessen agency costs
48
Locally Wambua (2013) examined the effects of agency costs on performance of NSE
listed firms The study used regression analysis and results indicated a positive
correlation between FCF and firm performance Furthermore the study found that
liquidity firm size and ownership concentration positively influenced performance of the
listed firms However the study did not incorporate firm age Conflicting results were
found by Njuguna and Moronge (2013) who studied the influence of managerial behavior
of agency costs on performance of firms listed at the NSE Using descriptive research
methodology results indicated that information asymmetry is a source of agency costs
and that agency problems are usually related to FCF In operationalizing the agency costs
however Njuguna and Moronge (2013) used total asset turnover as the only measure of
agency costs and also focused on financial outcomes only
To fill these knowledge gaps this study used two measures to fully integrate agency
costs The two agency cost measures used in this study are operating expenses to sales
ratio and sales to assets ratio These two measures are better measures of agency costs
because they tend to incorporate managerial asset utilization efficiency and production
cost efficiency (Singh amp Davidson 2003 McKnight amp Weir 2008 and Fauver amp
Naranjo 2010)
27 Summary of Knowledge Gaps
Empirical literature shows mixed findings regarding FCF agency costs firm
characteristics and firm performance For instance Jensen (1986) found a negative
correlation between FCF and firm performance results suggesting that management
49
might abuse FCF at their disposal Similar findings are recorded by Brush et al (2000)
Mojtahedzadeh and Nahavandi (2009) Wang (2010) Wambua (2013) Njuguna and
Moronge (2013) and Nekhili et al (2014)
Gregory (2005) on the other hand established that mergers that had a greater degree of
FCF performed better than those with lower FCF Similarly Szewcyzk et al (1996) and
Chang et al (2007) find that investors favored firms with both profitable investment
opportunities and significant FCF Likewise Lin and Lin (2014) established that the
acquisitions made by bidders with surplus FCF were not value decreasing Instead
bidders with higher excess FCF had better long-run post-acquisition performance
This research attempted to fill the following knowledge gaps first the influences of
agency costs and firm characteristics (firm size and age of the firm) on the correlation
between FCF and financial performance of the firm were all integrated Secondly FCF
were measured more robustly by incorporating CAPEX and net borrowings Thirdly
unlike in prior studies such as Wang (2010) and Njuguna and Moronge (2013) which
only focused on asset utilization efficiency to measure agency costs this study employed
two different measures for agency costs First is the asset utilization efficiency and
second is the production cost efficiency The two measures are better because they tend
to fully integrate agency costs Lastly the study used cross-sectional panel data design
The study therefore sought to affirm modify or reject existing empirical literature by
bridging the gaps identified in prior studies
50
Table 21 Summary of Knowledge Gaps
Researcher(s) Focus of Study Methodology Findings Knowledge Gaps How this Study
Addressed Gaps
Demsetz and
Lehn (1985)
Structure of corporate
ownership Causes and
consequences
The study
employed OLS
regression
estimates with
sample of 511
firms in the USA
In the presence of
substantial FCF
large firms tend to
overinvest thereby
negatively
impacting on firm
performance
The study
considered a five-
year period which
seems too short and
the focus did not
include FCF and
agency costs
This study employed
a ten year period
focused on FCF
agency costs firm
characteristics and
performance of firms
listed at the NSE
Jensen (1986) FCF agency costs
corporate finance and
takeovers
The study used
regression analysis
on 200 firms in the
oil industry in the
USA
Managers might
misuse FCF at their
disposal when
investment
opportunities are
not available
The study did not
incorporate firm
characteristics
This study included
firm characteristics
(age and size)
Szewcyzk et
al (1996)
The role of investment
opportunities and FCF in
explaining RampD induced
abnormal returns in the
Used regression
analysis and
measured
performance using
Shareholders
favored firms that
had both high FCF
and profitable
Focus variables
omitted agency
costs
The variables for this
study are FCF
agency costs firm
characteristics and
51
Researcher(s) Focus of Study Methodology Findings Knowledge Gaps How this Study
Addressed Gaps
USA firms Tobinrsquos Q investment
opportunities
firm performance
Gul and Tsui
(1998)
Tested the hypothesis
that FCF and director
stock ownership
interaction was less
likely to occur for firms
with high levels of
leverage
Studied 157 low
growth Australian
firms and used
OLS regression
analyses
Results suggested
that an increase in
financial leverage
seemed to reduce
agency costs
The study ignored
the influence of
liquidity and also
focused on low
growth firms only
This study focused on
firm characteristics of
firm size and age of
the firm
Brush et al
(2000)
FCF hypothesis for sales
growth and firm
performance The study
was conducted in the
USA
Study used
regression analysis
with performance
measured using
Tobinrsquos Q and
shareholder return
Firms with high
FCF perform
poorly and also
weak CG caused
inefficiency in the
allocation of FCF
CAPEX and Net
borrowings were
omitted in FCF
definition
This study included
CAPEX and net
borrowings to
measure FCF
Gregory
(2005)
Long run abnormal
performance of UK
acquirers and the
correlation between FCF
and firm performance
Used long term
returns and
analyzed
announcement
month return
Mergers with
greater FCF
performed better
than firms with
lower FCF
The study did not
incorporate firm
characteristics and
agency costs
The study
incorporated agency
costs and firm
characteristics (age
and size)
52
Researcher(s) Focus of Study Methodology Findings Knowledge Gaps How this Study
Addressed Gaps
Richardson
(2006)
Firm level over-
investment of FCF for
firms in the USA
Used an
accounting-based
structure to
measure over-
investment and
FCF
Found that over-
investment was
intense in firms
with the greatest
FCF levels
The study did not
incorporate firm
characteristics
This study included
firm characteristics
(age and size)
Mojtahedzadeh
and Nahavandi
(2009)
The relationship between
agency problems that rise
due to FCF with long
term profitability and
income management
The study was on firms
listed on the Tehran stock
exchange Iran
Used 106 firms for
the period 2003 to
2007 used Tobinrsquos
Q to measure long-
term profitability
DA was estimated
using the Adjusted
Jones Model
The study found
that agency
problems of FCF
result in short term
and eventually long
term profitability
The study focused
on FCF agency
costs and
profitability and
income and the
study period was
five years
This study focused on
FCF agency costs
firm characteristics
and the performance
of firms quoted at the
NSE Study period
was ten years
Nunes et al
(2009)
Profitability in
Portuguese service
industries
Used both static
panel models and
dynamic
estimators
Found a positive
correlation between
firm characteristics
and performance
and that FCF result
in profitability
The study used data
for four years only
(1999 to 2003)
which seems too
short
This study employed
data for ten years
(2006 to 2015)
53
Researcher(s) Focus of Study Methodology Findings Knowledge Gaps How this Study
Addressed Gaps
Wang (2010) The effect of FCF and
agency costs on firm
performance (firms listed
at the Taiwan stock
market)
Used descriptive
statistics
correlations and
regression analysis
Found no evidence
supporting a
negative correlation
between FCF and
firm performance
CAPEX and Net
borrowing were
omitted in FCF
definition
This study included
CAPEX and net
borrowings in
measuring FCF
Waithaka et al
(2012)
Effects of dividend
policy on share prices of
NSE listed firms Kenya
Used the case
method and
regression analysis
Found that FCF
instigated conflict
between managers
and shareholders
which consequently
affected the firm
performance
The study focused
on dividend policy
and stock
performance
This study focused on
FCF agency costs
firm characteristics
and firm
performance
Njuguna and
Moronge
(2013)
Effect of managerial
behavior of agency costs
on performance of firms
listed at the NSE Kenya
Used descriptive
research and used
asset turnover ratio
to measure agency
costs
Found that FCF
were negatively
related to firm
performance and
information
asymmetry causes
agency problem
The study used only
one proxy measure
of agency costs -
total asset turnover
ratio
This study employed
total assets turnover
and operating
expenses sales
54
Researcher(s) Focus of Study Methodology Findings Knowledge Gaps How this Study
Addressed Gaps
Wambua
(2013)
Effects of agency costs
on performance of firms
listed at the NSE
Regression
analysis was
employed in data
analysis
Got a positive
correlation between
FCF and firm
performance
The study did not
incorporate firm
characteristics
This study included
firm characteristics
(age and size)
Lin and Lin
(2014)
Agency costs of FCF and
biddersrsquo long-run
takeover performance of
Australian firms
Used regression
analysis on 556
firms for the
period 1993 to
2000
Found a positive
correlation between
FCF and firm
performance
CAPEX and Net
borrowing were
omitted in FCF
definition
This study included
CAPEX and net
borrowings in
measuring FCF
Nekhili et al
(2014)
Moderating effect of CG
and ownership in
lessening earnings
management practices
when there is high FCF
The study was conducted
in France
Developed
simultaneous
equations to
address
endogeneity of
FCF and then
employed
Hausman test
They found
opportunistic
behavior of
managers in
presence of FCF
Used firm
characteristics of CG
and ownership as
moderating variable
This study used firm
characteristics of size
and age of the firm as
moderating variable
Source Researcher (2018)
55
28 Conceptual Framework
Figure 21 below shows graphically the researcherrsquos conceptualization of the study
Figure 21 Conceptual Model
Independent Variable Dependent Variable
H01
Intervening Variable
H02
H04
H03
Moderating Variable
Source Researcher (2018)
Free Cash Flows
FCFit = (Net income
(PAT) + depreciation and
amortization - CAPEX -
change in non-cash
working capital + net
borrowing)Sales
Financial Performance
Tobinrsquos Q
Agency Costs
- Asset utilization efficiency ACit
- Production cost efficiency
Firm Characteristics
- Firm Size
- Age of the firm
56
FCF is the independent variable whereas the dependent variable is financial
performance As shown in figure 21 above H01 indicates the effect of FCF on financial
performance Agency costs are the intervening variable and they comprise of asset
utilization efficiency and production cost efficiency In figure 21 above H02 designates
the intervening influence of agency costs on the correlation between FCF and financial
performance In similar manner H03 depicts the moderating influence of firm
characteristics on the correlation between FCF and financial performance Firm
characteristics in the study are firm size and age of the firm Lastly H04 shows the joint
effect of FCF agency costs and firm characteristics on financial performance
29 Chapter Summary
This chapter reviewed theoretical foundation on which the study is grounded The
theories highlighted are The FCF hypothesis agency theory stewardship theory
stakeholder theory RBV theory and the organizational theory Empirical studies were
also examined specifically reviewing the correlation between FCF and financial
performance the intervening role of agency costs on the correlation between FCF and
financial performance the moderating role of firm characteristics on the correlation
between FCF and financial performance and finally the joint effect of FCF agency costs
and firm characteristics on financial performance Findings are mixed with some studies
indicating negative relationships while others showing positive relationships A summary
of knowledge gaps has also been underscored The chapter presented and explained the
conceptual model that guided the study and how it was conceptualized by the researcher
57
CHAPTER THREE RESEARCH METHODOLOGY
31 Introduction
This chapter deliberates on the research methodology used It presents the philosophy
research design study population how data was collected reliability and validity The
operationalization of study variables the techniques of data analysis applied and
summary of the research objectives Their corresponding hypotheses and analytical
models have also been highlighted
32 Research Philosophy
Research is defined by Proctor (1998) as a process to find out the unknown A critical
phase in doing social science research is to decide and validate the preferred research
philosophy embraced by the researcher Inter-related paradigmatic conventions
concerning the nature of reality the researcherrsquos role and the research process initiate
scientific research Research philosophy is the primary essential credence that supports
the options that need to be selected in taking a position in research Philosophy has
consequences on what how and why research is to be conducted (Carson Gilmore Perry
amp Gronhaug 2001)
Research philosophy has broad paradigms There are interpretative and the positivistic
paradigms Perry Reige and Brown (1999) explain the relationships among the
techniques that the researcher employs the researcher and the reality and truth that they
seek The two philosophical traditions that guide research in social science are positivism
58
and phenomenology (Saunders et al 2007) The roots of positivism tradition are
grounded in empiricism (Kerlinger 2002) Positivism is an ontology which makes an
assumption that a person has a straight access to the actual world and it is likely to get
independent information regarding the particular external reality
Interpretivism or Phenomenology is an ontology which makes an assumption that a
person does not have direct access to the real world and the knowledge heshe has
regarding this apparent realm is important in its own terms Within the phenomenological
ontology epistemology is founded on belief or assumption that the person conducting the
research is part of the reality and therefore not objective value-free or independent
Research emphasis is to understand what happens in a particular situation and it
contemplates several realities and diverse perceptions of the researcher (Carson et al
2001)
In this study the two philosophical traditions were examined and positivism was
considered the more appropriate tradition for the study because the study is centered on
prevailing theory and it develops hypotheses that can be verified Positivism made it
possible to make definite statements about the influence of agency costs and firm
characteristics on the correlation between FCF and firm performance grounded on
unbiased assessment and deductive reasoning The study utilized statistical data analysis
techniques and the researcher was objective and independent because individual feelings
were not introduced
59
33 Research Design
Research design involves decisions on where what when how farmuch and through
which means regarding a phenomenon It is the outline employed to direct a research
study to make certain that the research addresses the study problem (Gorard 2013) After
considering various research designs described by research experts such as Cooper and
Schindler (2006) Mugenda and Mugenda (1999) and Muganda (2010) as well as the
purpose of the study the philosophical tradition adopted the topical scope researcher
involvement time period over which the data was collected the nature of the data and
type of data analysis the study design embraced was cross sectional descriptive design
Mojtahedzadeh and Nahavandi (2009) successfully used the cross-sectional research
design in their study of the relationship between agency problems that arise due to FCF
with long term profitability and income management Mwangi (2014) also successfully
employed this study design in determining the influence of membersrsquo income and
conduct of Savings and Credit Cooperatives (SACCOs) in the correlation between
efficiency and characteristics of SACCOS in Kenya The cross-sectional descriptive
design was considered appropriate because of its versatility and leverage in collection of
data from a large number of respondents within a fairly short time period
34 Population of the Study
The target population comprised of the entire 63 firms listed at the NSE (Appendix I) as
at December 31 2015 This was a census study which involved obtaining information
from every member of the population A census of all the NSE listed firms was employed
60
because the number of listed firms at the NSE is relatively small and therefore the study
could easily be carried out
35 Data Collection
Secondary data was collected from published financial statements obtained from the
NSE Time series panel data was collected covering a 10 - year period from 2006 and to
2015 A ten-year period is deemed large enough to yield reliable findings A similar
period was adopted by Gregory and Wang (2010) and Nekhili et al (2014) Appendix II
shows the data collection form
36 Reliability and Validity
The main indicators of the value of a data collection instrument are reliability and validity
of the measures Reliability is among the most essential components of test quality and it
entails consistency or reproducibility or the examineersquos test performance Therefore
reliability is the degree with which research instruments yield consistent results after
repeated trials Reliability of a measure has two parts its stability over time and the
consistency of the instrument in measuring the concept Several methods of computing
test reliability exist and they include decision consistency parallel forms reliability test-
retest reliability inter-rater reliability and internal consistency Decision consistency is
often an appropriate choice for many criterion-referenced tests (Kimberlin amp Winterstein
2008)
61
Validity is the degree with which theory and evidence corroborate interpretations of test
scores occasioned by suggested uses of tests It denotes whether or not the test is
measuring what it anticipated to measure It is perhaps the most essential criteria for the
quality of a test There are several types of validity and these consist of construct validity
criterion-related validity and content validity Construct validity refers to the extent to
that an instrument measures the attribute or hypothetical concept that it was proposed to
measure while content validity is the degree with which the content of the objects reveals
the content purview of interest Lastly criterion-related validity is evaluated when an
individual wants to establish the correlation of scores on a test to a specified benchmark
(AERAAPANCME 2000 and Penfield amp Miller 2004)
361 Reliability Test
Stability was assessed by use of test retest reliability while internal consistency was
assessed using inter-item consistency reliability In testing for reliability Cronbach alpha
was calculated The Cronbachrsquos alpha coefficient was applied in measuring internal
consistency of the measurement scales It is a scale measurement tool that is frequently
used in social sciences for determining internal consistency of factors or items among and
within variables of the study Nunnally (1967) and Oppenheim (1992) argue that alpha
coefficient value of 0700 and above is tolerable
The Cronbachrsquos alpha coefficient was employed because it is suitable for multi-scaled
items The Cronbachrsquos alpha is a broad formula of the Kunder-Richardson (K-R) 20
formula as shown
62
(K) (S2-Σs
2)
KR20 =
(S2) (K-1)
KR20 = Reliability coefficient of internal consistency
S2 = Variance of all scores
K= Number of items employed to measure the model
s2 = Variance of individual items
This study also employed secondary data Kimberlin and Winterstein (2008) argue that
the foremost concern when deciding if secondary data should be used is to confirm that
the data set suitably measures the variables that are required to answer the study
questions Secondary data was collected from audited financial statements of all NSE
listed firms This data is deemed reliable because financial reporting is guided by
International Financial Reporting Standards (IFRS) Furthermore the companies Act
(CAP 486) of the laws of Kenya require that every limited liability firm conducts a
statutory audit at least once annually Such audits are guided by International Auditing
Standards (IAS)
362 Validity Test
Validation of the instrument was accomplished in several ways Pre-test was done by
administering the instrument to eight middle level managers to complete The eight
managers were conveniently selected to review the statement items for clarity meaning
63
and relevance Based on their response the data collection instrument was appropriately
modified Validity shows whether the instrument is testing what it should be testing
Content validity was achieved by establishing whether the items in the data collection
instrument are well balanced in content domain and link up well with theoretical
assumptions centered on the study objectives which involved checking of the content to
establish if it contained representative sample of the objects being measured Criterion-
related validity was established by administering test-retest or stability test on the data
contents in the data collection instrument Construct validity was established by ensuring
that the study variables were properly operationalized This was achieved through
constant consultations and reviews by research experts from the University of Nairobirsquos
School of Business Validity can be measured by use of expert judgment and informed
opinion (Kerlinger 2002)
37 Operationalization of the Study Variables
This study has four variables of interest independent variable dependent variable
intervening variable and a moderating variable Table 33 shows the research variables
and their respective metricsindicators Theoretical and empirical research in the area of
study has guided the choice of the variables
64
Table 31 Operationalization of Study Variables
Variable
Indicator Measure Support from
Literature
Form Section
Independent Variable
Free Cash Flows
Net income (PAT) add
depreciation and
amortization minus CAPEX
minus change in non-cash
working capital add net
borrowing
Net income (PAT) add
depreciation and amortization
minus CAPEX minus change
in non-cash working capital
plus net borrowingNet
Sales
Brealey et al
(2005) and
Nekhili et al
(2014)
Part A of Data
Collection Form
Dependent variable(s) - Firm Performance
Financial
Performance
Tobinrsquos Q Equity market valueEquity
book value
Szewczyk et al
(1996) and
Mojtahedzadeh
and Nahavandi
(2009)
Part B of Data
Collection Form
Intervening Variable(s)
(a) Asset utilization
efficiency = Net sales
to total Assets ratio
(a + b)2 = AC
Tirole (1986)
Part C of Data
Collection Form
65
Variable
Indicator Measure Support from
Literature
Form Section
Agency Costs
(b) Production cost
efficiency = Operating
expenses to net sales
ratio
Tirole (1986)
Singh and
Davidson (2003)
Moderating variable(s)
Firm
Characteristics
Firm Size Natural log of total assets Demsetz and Lehn
(1985)
Part D of Data
Collection Form
Firm Age
n log (number of years since
incorporation)
Ferris and Yan
(2009)
Source Researcher (2018)
66
Non-cash working capital includes inventories financial assets held to maturity
receivables and prepayments (current assets) and payables accrued expenses current
income tax liability (liabilities) For financial and investment firms non-cash working
capital includes prepaid lease rentals intangible assets deferred tax assets and retirement
benefit assets (assets) and taxation payable dividends payable deferred tax liabilities
and retirement benefit liabilities
Net sales in case of insurance firms are the equivalent of ldquoNet premium revenuerdquo For
commercial banks it is ldquoTotal operating incomerdquo which is composed of net interest
income add total non-interest income In case of investment firms it is ldquoIncomerdquo which
is comprised of rental income dividends and interest received and other incomes
38 Data Analysis
Data was analyzed using inferential statistics generated from statistical software using
95 confidence interval as in Aiken and West (1991) Descriptive statistics and
inferential statistics were both employed in data analysis Measures of dispersion and
measures of central tendency were used in profiling the respondent firms
Linear regression analyses were used in establishing the magnitude and nature of the
relationship between the study variables and in testing the relationships hypothesized
This study employed panel data regression analysis using the OLS technique where data
consist of cross-sectional and time series data which was combined into a panel data set
67
and projected with the use of panel data regression Regression analysis is a statistical
tool for examination of relations between variables
The value of the coefficient of determination (R2) indicates the extent of variation in the
dependent (explanatory) variable explained by the independent (predictor) variable Beta
values indicate the extent of variation in the explanatory variable that is attributed to the
extent of variation in the independent variable F ratio measures the model fit or simply
how sound the equation line established fits the data observed Interpretation of statistical
significance of each relationship hypothesized was based on β R2 t F and P ndash values
The study hypotheses were measured using two sets of regression equations The
regression analysis was done using STATA software
39 Choice of Panel Data Analysis Model
Panel data analysis can be categorized into several categories First are the pooled panels
which assume that there exist no distinctive qualities of characters in the dimension set
and there are no common effects across time Second are the fixed effects models which
assume existence of unique qualities of characters which are not the effects of random
variations and which donrsquot differ across time They assume changes in intercepts across
sets or time periods Lastly we have random effects models which have the assumption
that there are distinctive time constant qualities of characters which are the effects of
random variations and do not associate with the characters that are the effects of random
variation They donrsquot relate with the specific regressors The random effect models are
suitable if we want to draw conclusions about the entire population
68
The selection of a suitable model is contingent on the aim of investigation and
complications regarding the exogenity of dependent variables The fixed effects model
and the random effects model were not considered The pooled regression model was
suitable because of its assumption that all the organizations are similar The Pooled
regression model also has an assumption that the coefficients including the intercepts
are identical for all study items (firms) The fixed and random effect models provide for
individuality or heterogeneity among the organizations by letting each organization to
have own intercept that is time invariant
391 Effect of Free Cash Flows on Financial Performance
In establishing the effect of FCF on firm performance FCF is the predictor variable while
financial performance is the explanatory variable In the specification the standard errors
are clustered by firm and year Equation 31 entails panel data for 2006 to 2015
The regression model for hypothesis 1 is as follows
Ǭit = ά + βFCFit + euro -------------------------------------------------------------------------- (31)
Where Ǭ = Financial performance and it indicates the firm i at time t Financial
performance was measured using Tobinrsquos Q ά = Constant term β = Beta Coefficient
FCFit= Free cash flows for firm i at time t where t is the year 2006 to 2015
392 Free Cash Flows Agency Costs and Financial Performance
In analyzing hypothesis 2 the relevant variables are FCF (independent variable) agency
costs (intervening variable) and financial performance (dependent variable) Intervening
effects were examined using hierarchical (stepwise) multiple regression analysis As in
69
Baron and Kenny (1986) the fundamental concept of mediating variables is that in some
way they intervene in the process of transformation between response and stimuli Some
essential features of a mediating variable include the fact that the independent variable
shall affect the mediator variable (path a) the mediator shall affect the dependent
variable (path b) independent variable shall affect the dependent variable (path c) and
that once paths a and b are controlled path c becomes inconsequential or trivial The
mediation path is shown in figure 31 below
Figure 31 Path Diagram for Mediation effect of Agency Costs
c
lsquoa b
Agency costs
Source Researcher (2018)
Mediation was tested through the following three steps Step one entailed the dependent
variable Ǭ (financial performance) being regressed on the independent variable FCF
(Free cash flows) In step two the mediator AC (agency costs) was regressed on the
independent variable FCF In step three Ǭ is regressed on AC and FCF In each step the
120689 coefficient was tested to establish the size and direction of the correlation If a zero
order relationship exists and is significant then proceed to the next step Mediation exists
if FCF coefficient is significant in step 2 and also when the FCF coefficient is
significantly less in step 3 than in step 1
Free cash flows Financial performance
70
In testing intervention between FCF and financial performance the regression model is as
follows
Ǭit = ά + β1FCFit + euroit ------------------------------------------------------------------------ (32a)
AC it = ά + β1FCFit + euroit --------------------------------------------------------------------- (32b)
Ǭit = ά + β1AC it + β2FCF it + euroit ------------------------------------------------------------ (32c)
while controlling the effect of M on Y
Where ACit is the sum of Production cost efficiency (PCEit) and Asset utilization
efficiency (AUEit) divided by 2 (average) for the period 2006 to 2015
393 Free Cash Flows Firm Characteristics and Financial Performance
In testing hypothesis 3 the relevant variables are FCF firm characteristics (moderating
variable) and financial performance The regression models are as follows
Ǭit = ά + β1FCFit + β2AGEit + β3 (AGEit FCFit) + euro---------------------------------- (33a)
Ǭit = ά + β1FCFit + β2SIZit + β3 (SIZit FCFit) + euro------------------------------------- (33b)
Where SIZit = Firm size AGEit = Age of the firm
Equations 33a and 33b represent moderation models For purposes of avoiding possible
high multicollinearity the variables were centered and an interaction term added If the
predictor variable (FCF) and moderator variable (firm characteristics) are not significant
with the interaction term then complete moderation has happened Otherwise if the
independent and moderator variables are significant with the interaction term then
71
moderation has happened but the main effects are also significant (Aiken amp West 1991
and Mackinnon et al 2002)
In equations 33a and 33b above the variables associated with coefficient 1206893 were added
in the model to measure the effect of moderation The effect of moderation variables
firm size and age is characterized statistically as an interaction that affects the strength
and or direction of the correlation between explanatory variable (firm performance) and
the predictor variables (Baron amp Kenny 1986) The term in the model does not imply
multiplication but rather it denotes moderation
394 Relating all the Variables
Hypothesis 4 entails testing all the variables in the conceptual framework In testing for
the effect on financial performance panel data model was applied in measuring the
strength of the relations between the independent moderating intervening and dependent
variables To measure the joint effect of the moderating intervening and independent
variables intercept (constant) was used to determine the nature and extent of effect of all
the variables Additionally R2 was employed in determining the joint effect of the
moderating intervening and independent variables on the dependent variable (financial
performance) The resultant model is as follows
Ǭit = ά + β1FCFit + β2AC it + β3SIZit + β4AGEit + euro----------------------------------------- (34)
Where
72
34 represents the model for the effect on financial performance which utilized secondary
panel data for the period 2006 to 2015 and Ǭit represents financial performance
Table 32 A Summary of Statistical Tests of Hypotheses
Objective Hypothesis Analytical Model Interpretation
i To establish
the relationship
between FCF
and financial
performance of
firms listed at
the NSE
H01 FCF have no
significant effect on
financial performance of
firms listed at the NSE
ANOVA
regression
model
Panel data
regression
model
Test of
assumption
(normality and
multi-
collinearity)
Relationship exists if β is
significant
Relationship will be
determined based on R2
ii To assess the
influence of
agency costs on
the relationship
between FCF
and financial
performance of
firms listed at
the NSE
H02 Agency costs have
no significant
intervening effect on the
relationship between
FCF and financial
performance of firms
listed at the NSE
ANOVA
regression
model
Panel data
regression
model
Test of
assumption
(normality and
multi-
collinearity)
Mediation exists if FCF
coefficient is significant in
step 2 and also when in
step 3 the FCF coefficient
is significantly less than in
step 1
Regression co-efficient and
R2 will be used to affirm the
effect of agency cost on the
relationship between free
cash flow and firm
performance
iiiTo determine
the influence of
firm
characteristics
on the
H03a Firm age has no
significant moderating
effect on the relationship
between FCF and
financial performance of
ANOVA
regression
model
Panel data
regression
Moderation exists when the
interaction term between
firm characteristics and
FCF is a significant (p lt
005) predictor of firm
73
Objective Hypothesis Analytical Model Interpretation
relationship
between FCF
and financial
performance of
firms listed at
the NSE
firms listed at the NSE
H03b Firm size has no
significant moderating
effect on the relationship
between FCF and
financial performance of
firms listed at the NSE
model
Test of
assumption
(normality and
multi-
collinearity)
performance Furthermore
when FCF remains a
significant predictor while
firm characteristics become
insignificant
The intercept of the
regression model will
be used to tests the
influence of firm
characteristics on the
relationship between
free cash flow and firm
performance
Regression co-efficient and
R2 will be used to affirm the
effect of firm characteristics
on the relationship between
FCF and firm performance
iv To establish
the joint effect
of FCF agency
costs and firm
characteristics
on financial
performance of
firms listed at
the NSE
H04 There is no joint
effect of FCF agency
costs and firm
characteristics on
financial performance of
firms listed at the NSE
ANOVA
regression
model
Panel data
regression
model
Test of
assumption
(normality and
multi-
collinearity)
The intercept of the
regression model will be
used to tests the joint effect
of FCF agency costs and
firm characteristics on firm
performance
R2 will be used to get the
joint effect of independent
variables on Firm
Performance
74
310 Chapter Summary
The chapter discussed the study methodology employed and has highlighted the research
philosophy adopted clearly indicating that the study was anchored on the positivist
orientation since it is founded on existing theory and it articulates hypotheses which can
be verified Furthermore the positivist approach made it possible to make categorical
statements
The research design used has also been discussed The research design adopted was
cross sectional descriptive survey The population of the study has been highlighted as a
census of all firms listed at the NSE The chapter has also explained the data collection
methodology Reliability and validity considerations have been discussed
Operationalization of research variables has been deliberated showing a summary table
of the four variables of study indicators how the variables were measured support from
literature and the relevant section of the data collection form Data analysis has been
explained being regression methods using inferential statistics The chapter also
presented a tabulated summary of the research objectives their corresponding hypotheses
and analytical models
75
CHAPTER FOUR DATA ANALYSIS AND FINDINGS
41 Introduction
The study sought to establish the relationships between free cash flows agency costs
firm characteristics and performance of firms listed at the NSE Secondary data were
collected to test the relationships between the study variables This chapter presents an
analysis of the results More specifically the chapter has focused on descriptive statistics
reliability tests validity tests and correlation analysis
42 Pre-estimation Diagnostics
The study used OLS to estimate regression models The use of OLS is based on
normality linearity sampling adequacy and internal consistency of variables used in the
regression model Therefore normality linearity internal consistency and sampling
adequacy of these variables were required for the application of OLS This section
presents the test statistics to verify satisfaction of these assumptions by the data collected
and analyzed
421 Normality test
The Shapiro Wilk test for normality was conducted to test if the variables were normally
distributed The null hypothesis was that the data did not come from a population that
was normally distributed Therefore the alternate hypothesis is that the data originated
from a normally distributed population The test statistics for normality of each variable
are shown in table 41 below
76
Table 41 Normality Test
Variable Test Statistic
Z statistic P value
Free cash flows 1687 0082
Agency costs (AC) 1501 0160
Firm Age 0832 0129
Firm Size 1004 0076
Table 41 above shows that the p-values for all the variables were greater than 005 and
therefore we failed to reject the null hypothesis that the variables were normally
distributed at five per cent level of significance Therefore OLS could be applied on the
data considering that the data met the assumed conditions for application of multiple
regression analysis Field (2013) recommends use of a visual inspection of histograms or
Quantile ndash Quantile (Q-Q) plots to supplement use of tables and numbers These plots are
presented below
77
Figure 41 Q-Q Plot for Free cash Flows (2006 ndash 2015)
The results of the Q-Q plot in figure 41 above exhibits normality because most of the
observations seem to be in a straight line with a few cases appearing to be far away from
the line
Figure 42 Q-Q Plot for Agency Costs (AC) ndash 2006 to 2015
Figure 42 Q-Q plot above for agency costs (AC) reveals normality because the majority
of the observations seem to be along the straight line Outliers were investigated and
78
corrected or eliminated where necessary Large data sets can be analysed even if some
variables do not meet normality assumptions (Tabachnick amp Fiddel 2013)
Figure 43 Q-Q Plot for Firm Characteristics (Firm Age) ndash 2006 to 2015
The above Q-Q in figure 43 exhibits normality This is because most of the observations
seem to be in a straight line with a few cases appearing to be far away from the line
79
Figure 44 Q-Q Plot for Firm Characteristics (Firm Size) ndash 2006-2015
The Q-Q plot for firm size in figure 44 above indicates almost all the observations being
on a straight line This implies normality of the data Outliers were investigated and
corrected or eliminated where necessary
80
Figure 45 Q-Q Plot for Firm Financial Performance ndash 2006 to 2015
The Q-Q plot for financial performance in figure 45 above shows normality
422 Reliability Tests
Reliability tests were carried out through Cronbachs alpha tests in Statistical Package for
the Social Sciences (SPSS) with the findings presented below The results are shown in
Table 42 below Except for financial performance which shows a score of 0672 all the
other variables indicate reliability scores above 0700 which is the accepted score for
reliability (Bonett amp Wright 2014) The research instrument was therefore deemed
reliable
81
Table 42 Reliability Scores for Individual Variables
Variable Item Cronbachs Alpha
Free Cash Flow 0726
Firm Age 0798
Firm Size 0814
Agency Costs-AC 0828
Financial Performance 0672
423 Test for Linearity
In testing whether the variables were linearly associated a correlation analysis was done
The null hypothesis for the test was that there was no linear association The test statistics
for linear associations between the predictor variables and firm performance (explanatory
variable) are shown in table 43 below
Table 43 Test for Linearity
Reference Variable Firm
Performance
Coefficient of Correlation P-Value
Free cash flows 0506 0000
Agency costs (AC) 0521 0000
Firm Age 0619 0000
Firm Size 0590 0000
82
From table 43 above FCF shows a coefficient of correlation of 0506 agency costs (AC)
indicate 0521 firm age 0619 and finally firm size reveal 0590 All the values exceed
05000 meaning that there is a positive correlation Financial performance is the reference
variable All the p-values for the respective coefficients of correlation are 0000 which is
lower than 001
Thus all the predictor variables have a significant positive correlation with financial
performance at five per cent level of significance Therefore the predictor variables and
the explanatory variable (financial performance) move in the same direction which
suggests a linear relationship This positive significant correlation indicates that the
signage coefficients of the predictor variables in the simple regression models are
positive
424 Bartletts Test for Internal Consistency
The study tested the consistency of the items in the designed questionnaire to measure
several variables used in the research by applying the Bartlettrsquos test of sphericity The
null hypothesis of the test was that there was no internal consistency A failure to reject
the null hypothesis implies that the principal components which measure individual
sections have to be established using principal component analysis
Conversely rejecting the null hypothesis implies that all the elements are consistent
internally and that their composites can be applied in measuring the variables concerned
83
Test statistics for each of the sections involved in the linear regression analysis are
presented in table 44 below
Table 44 Bartlettrsquos Test
Variable Degrees of freedom Test statistic
Chi Square P value
Free cash flows 21 4382 0000
Agency costs (AC) 10 2665 0000
Firm age 10 1462 0000
Firm size 10 1621 0000
Financial performance 10 26940 0000
Table 44 above demonstrates that the null hypothesis which states that the variables are
not intercorrelated in each of the sections has to be rejected at five per cent significance
level This is confirmed by all the p-values being less than 001 for the variables
425 Multicollinearity Test
Multicollinearity occurs if there is a strong relationship between two or more independent
variables in a regression model Multicollinearity becomes an issue only in multiple
regressions and not for simple regression analysis Multicollinearity poses several
problems such as increases in standard errors of 120689 coefficients This means that the 120689s
have relatively higher variability across samples and less likely to represent the
population The second problem is limiting the size of R which measures multiple
correlation between the independent variables and the result and R2 the variance of the
84
result for which the independent variables explain making the second predictor to
explain very little of the remaining variance The other problem posed by
multicollinearity is that it reduces the importance of predictors making it hard to measure
the specific significance of a predictor (Field 2009)
To test whether the level of multicollinearity in the estimated models could be tolerated
Variance Inflation Factor (VIF) was used The rule of the thumb is that a value of VIF
that is less than 10 means that the level of multicollinearity can be tolerated (Robinson amp
Schumacker 2009) Since multicollinearity test is only applicable for multivariate
regressions only VIF statistics are reported since the regressions involve more than one
independent variable
Table 45 Multicollinearity Test
Variables VIF
Free Cash Flows 206
Agency costs (AC) 155
Financial Performance 252
Firm Size 109
Firm Age 168
Table 45 above shows that the VIF for all the models estimated ranged from 109 to 235
showing that the VIF results are between the acceptable ranges of 1 to 10 (Robinson amp
85
Schumacker 2009) This shows that the variables did not exhibit multicollinearity and
regression analysis could then be carried out
43 Descriptive Statistics
Table 46 Descriptive Statistics for Secondary Data ndash 2006 to 2015
Variables No Min Max Mean STD
Tobinrsquos Q (Ratio) 600 0867900 6447370 0526600 0634590
FCF (Ratio) 600 -0024530 3145000 16900 011270
AC(Ratio) 600 0003716 6329080 33166898 091646
SIZ (Ratio) 600 -1342200 2810600 04418300 0612300
AGE (n log of year
since incorporation)
600 140884 5400013 3904435 0287000
Table 46 above shows descriptive statistics for secondary data for a 10 year period from
2006 to 2015 Table 46 above gives the descriptive analysis for the main variables used
in the research It shows that the average Tobin Q is 05266 This suggests that on
average firms listed at NSE have recorded fairly impressive performance The Tobinrsquos Q
mean of 05266 suggests that the firmsrsquo market values are less than their book values
Since their market price to book value ratio is less than one the market expects the value
of these firms to reduce in the future because the market price also takes any future
earnings into account at the current price
86
For FCF the average is 169 meaning that most firms listed at NSE have low FCF The
mean for AC was found to be 33166898 indicating a high asset turnover and operating
expenses to sales ratio The average age of the firm is indicated by the log of 3904435
This shows that the firms listed at the NSE are relatively old On average the mean firm
size of listed firms at the NSE is indicated by a log of 04418300 indicating that the firms
have a fairly high asset value
44 Chapter Summary
This chapter presented information on pre-estimation diagnostics These include
normality test reliability test reliability test test for linearity Bartlettrsquos test for internal
consistency and multicollinearity test The chapter also gave results of analysis tests run
on the data that was collected These include descriptive statistics Results were indicated
by standard deviations mean scores minimum scores and maximum scores
87
CHAPTER FIVE TESTS OF HYPOTHESES AND DISCUSSION
51 Introduction
This section presents the hypotheses of the study which are derived from the research
objectives and the results of the hypothesized relationships This study was informed by
the premise that there exists a correlation between FCF and financial performance and
that this relationship is intervened by agency costs and is moderated by firm
characteristics
52 Correlation Analysis
The relationship between strength and direction of the variablesrsquo relationship was
investigated using the Pearson Product Moment correlation coefficient This was
significant so as to assess whether any relationship exists between the variables before
proceeding with further analyses The study employed the following classification strong
if 07 and above moderate if 04 but less than 07 and weak if 0 and less than 04
Apart from analysing the direction and strength of association correlation analysis was
also used to test the presence of multicollinearity between the independent variables
Multicollinearity exists if independent variables are highly correlated (r = or greater than
075) Multicollinearity reduces the importance of predictors making it difficult to assess
the individual importance of a predictor Multicollinearity may lead to poor regression
modelling (Dancey amp Reidy 2011) The results in Table 51 below show that there is no
multicollinearity since all the predictor coefficient results are below 075
88
Table 51 Pearson Product-Moment Correlations among the Dependent
Independent Intervening and Moderating Variables
Firm
performance
Free
cash
flows
Agency
costs
Firm
size
Firm
age
Pearson
Correlation
Firm performance 1 0702 0519 0405 0126
Free cashflows 1 0129 0135 0245
Agency costs 1 0198 0322
Firm size 1 0418
Firm age 1
Source Researcher (2018)
Correlation is significant at the 005 level (2-tailed)
Correlation is significant at the 001 level (2-tailed)
As indicated in Table 51 above there is a strong positive correlation between financial
performance and FCF (r = 0702) On the other hand the correlation between financial
performance and firm size and with agency costs is moderate and positive (r = 0405 and
0519 respectively) The correlation with firm age is weak but positive (r = 0126) All the
correlations were significant at 005 except firm age The relationships between financial
performance and FCF agency costs firm size and firm age moved in the same direction
as hypothesized in the study These variables were further assessed using regression
analysis as shown in section 53 below
89
53 Hypotheses Testing Using Regression Analysis
In order to establish these relationships four hypotheses were formulated and tested For
purposes of testing the hypotheses different regression models were run First finding
out the correlation between FCF and financial performance secondly tests to determine
the intervening effect of agency costs on the correlation between FCF and financial
performance thirdly tests were carried out to establish the moderating effect of firm
characteristics on the relationship between FCF and financial performance and lastly to
find out the joint effect of FCF agency costs and firm characteristics on financial
performance of NSE listed firms
In order to ascertain these relationships the hypotheses were formulated and tested using
simple and multiple linear regression analyses The hypotheses were tested at 95 percent
confidence level (ά = 005) while p-values were used to establish individual significance
of the hypothesized relationships The significance and general robustness of the model
was assessed using F statistic and p-values for significance Overall F statistic value
greater than 1 signifies goodness of fit P-values greater than or equal to 005 indicated
that we would fail to reject the null hypothesis while those with p-values less than 005
signified that the null hypothesis would be rejected ANOVA and panel data analyses
results have been presented and discussed below
90
531 Free Cash Flows and Financial Performance
The study sought to determine the effect of FCF on financial performance and it
employed panel data design Panel data was used in establishing financial performance
which was measured by Tobinrsquos Q (equity market value equity book value) FCF on the
other hand was measured as Net income + depreciation and amortization - CAPEX -
change in non-cash working capital + net borrowing)Net sales The study sought to
identify the effect of FCF on firm financial performance The following hypothesis was
developed
H01 FCF have no significant effect on financial performance of firms listed at the NSE
Maximum likelihood regression model was employed in data analysis The test statistics
regression results with financial performance as the dependent variable and FCF as the
independent variable are reported in Table 52(a) below
Table 52 Panel Data Results for Free Cash Flows and Financial Performance
Model Summary
Model R R2 Adjusted R
2 Standard
Error
1 04890 02391 02106 02258
a Predictors (Constant) Free cash flows
b Dependent Variable Financial performance
91
(a) ANOVA
Model Sum of
Squares
DF Mean
Square
F Sig
Regression 2689 1 2689 5376 0017
Residual 32483 599 0054
Total 35172 600
a Predictors (Constant) Free Cash Flows
b Dependent variable Financial performance
(c) Regression Co-efficients
Model Unstandardized Coefficients Standard
Coefficients
t Sig
B Standard Error Beta
Constant 048011 0011662 020 7229 0000
FCF 0206 00254 0265 54238 00023
Dependent variable Financial performance
The model coefficients are shown in Table 52(c) above The results indicate that FCF is
a significant predictor because the p value is 00023 which is lower than 005 (level of
significance) Furthermore results indicate R2
of 02391 which implies that FCF explain
2391 of the variability in firm financial performance The results have rejected the null
hypothesis implying that FCF have a statistically significant positive effect on financial
performance of firms listed at the NSE The regression model that explains the variation
in financial performance as a consequence of FCF is as shown below
92
Ǭit = 048011 + 0206FCFit
Where
Ǭ = Firm financial performance
FCF =Free cash flows
532 Free Cash Flows Agency Costs and Financial Performance
This study sought to ascertain the effect of agency costs on the relationship between FCF
and financial performance The corresponding hypothesis is
Hypothesis 2 Agency costs have no significant intervening effect on the relationship
between free cash flows and financial performance of firms listed at the Nairobi
Securities Exchange
The study employed secondary panel data in determining the results under this
hypothesis Secondary data was obtained from financial statements and measured agency
costs using asset utilization efficiency (salesassets) and production cost efficiency
(operating expensessales) The values were obtained separately (AUE and PCE) and
added together then divided by two to obtain agency costs (AC)
In testing for mediation intervention first the relationship between the dependent
variable (financial performance) and the independent variable (FCF) was carried out
ignoring the intervening variable (agency costs-AC) This was step number 1 and is
similar to the regressions performed under hypothesis one under section 52 The model
should indicate significance where p = lt005
93
Next is the regression analysis between FCF (the independent variable) and agency costs
(AC) which is a combination of production cost efficiency and asset utilization efficiency
as intervening variable ignoring the financial performance (the dependent variable) The
FCF and AC relationship should be significant (p=lt005) if one is to move to step 3
Under step 3 the regression analysis is done with financial performance as the dependent
variable and both AC and FCF as independent variables Regression results for step 1 are
same as shown in Table 51 earlier Results from step 1 shown in Table 51 indicate the p
value of 00023 and is therefore significant The regression model is specified as Ǭit =
048011 + 0206FCFit This necessitates moving to step 2 the results of which are
depicted in Table 53 below
Table 53 Panel Data Results of Agency Costs as the Dependent Variable and Free
Cash flows as the Independent Variable
a) Model Summary
Model R R Square Adjusted R Square Std Error of the Estimate
1 03356 01126 00958 02290
a Predictors (Constant) FCF
b Dependent Variable Agency costs (AC)
94
b) ANOVA
Model
Sum of
Squares df
Mean
Square F Sig
Regression 6881 1 6881 059 46181 0053
Residual 89226 599 0149 043
Total 96107 600
a Predictors (Constant) FCF
b Dependent Variable Agency costs (AC)
c Coefficients
Model
Unstandardized
Coefficients
Standardized
Coefficients
t Sig B Std Error Beta
1 (Constant) 0117 03042 3840 023
FCF 083 0137 265 2772 048
a Dependent Variable Total Non-Performance
Results in Table 53(c) above indicate that FCF is a significant predictor of AC as shown
by Sig = lt005 Table 53(a) above shows R square of 01126 which implies that 1126
variations in AC are explained by changes in FCF The regression model for the
relationship between FCF and AC ignoring financial performance is given below
AC = 0117 + 0083FCF
95
Since the relationship between FCF and AC is significant (as depicted by Sig = 0048)
we can now move to step 3 where financial performance is the dependent variable while
FCF and AC are predictor variables The results of step 3 are displayed in Table 54
below
Table 54 Panel Data Results of Financial Performance as the Dependent Variable
while Agency Costs and Free Cash flows are the Independent Variables
a Model Summary
Model R R Square Adjusted R Square Std Error of the Estimate
1 07157 05122 04613 02288
a Predictors (Constant) AC FCF
b Dependent Variable Financial Performance
a ANOVA
Model Sum of Squares df Mean Square F Sig
1 Regression 14725 2 73625 62606 0000
Residual 106258 598 01776
Total 120983 600
a Predictors (Constant) AC FCF
b Dependent Variable Financial Performance
96
c Coefficients
Model
Unstandardized Coefficients
Standardized
Coefficients
t Sig B Std Error Beta
1 (Constant) 0187 0342 44409 021
FCF 211 0179 227 13380 071
AC 148 042 282 62376 015
a Predictors (Constant) AC FCF
b Dependent Variable Financial Performance
The findings in Table 54 above indicate that financial performance is significantly
predicted by AC (p =0015 which is lt005) On the contrary FCF does not significantly
predict financial performance This is depicted by (p = 0071 which is gt005) From the
regression results above Adjusted R squared changed from 02106 to 04613 showing a
significant increase in the relationship between FCF and financial performance
This change is attributed to the intervening variablersquos effect It is therefore concluded that
agency costs (AC) have a positive statistically significant intervening effect on the
relationship between FCF and financial performance The null hypothesis that Agency
costs have no significant intervening effect on the relationship between free cash flows
and financial performance of firms listed at the Nairobi Securities Exchange is therefore
rejected The resultant regression model is as shown below
Ǭit = 0187 + 0148ACit+0211FCFit
97
533 Free Cash Flows Firm Characteristics and Financial Performance
This study sought to identify the effect of firm characteristics on the relationship between
FCF and financial performance The corresponding hypothesis is
Hypothesis 3 Firm characteristics have no significant moderating effect on the
relationship between free cash flows and financial performance of firms listed at the
Nairobi securities exchange
The study employed secondary panel data in determining the results under this
hypothesis Since firm characteristics (age and size) are additive each one of them was
tested separately Therefore under this hypothesis two sub-hypotheses were developed
as follows
H03a Firm age has no significant moderating effect on the relationship between free cash
flows and financial performance of firms listed at the Nairobi securities exchange
H03b Firm size has no significant moderating effect on the relationship between free cash
flows and financial performance of firms listed at the Nairobi securities exchange
Secondary data was obtained from financial statements and measured firm characteristics
using firm size and age of the firm Firm size was measured using the natural log of total
assets while age of the firm was measured using the natural log of number of years since
incorporation The moderating effect of firm size and firm age on the relationship
between FCF and firm financial performance was assessed using the centered approach
as by Wu and Zumbo (2008)
98
This involves the following steps Step 1 involves the independent variables and the
moderator variables being regressed against firm financial performance Step 2 on the
other hand entails introduction of the centered approach in the model with the predictor
variable moderating variable and the interaction term being factored into the model The
regression results are shown in Table 55 below
Table 55 Panel Data Results for Financial Performance as the Dependent Variable
and FCF and Firm Age as the Predictor Variables
a Model Summary
Model R R Square Adjusted R Square
Std Error of the
Estimate
1 05894 03474 03109 1573
a Predictors (Constant) FAGE_CENTRED FCF_CENTRED
b Dependent Variable Financial Performance
b ANOVA
Model Sum of Squares df Mean Square F Sig
1 Regression 51189 2 25594 8531 0000
Residual 20440 598 003
Total 255589 600
a Predictors (Constant) FAGE_CENTRED FCF_CENTRED
b Dependent Variable Financial Performance
99
c Coefficients
Model
Unstandardized
Coefficients
Standardized
Coefficients
t Sig B Std Error Beta
1 (Constant) 0041 11662 28109 0044
FCF 1306 0144 088 44238 0023
AGE 201 02607 353 6120 0002
a Dependent Variable Financial Performance
Results in Table 55(a) above show R2 of 03474 and Adjusted R
2 of 03109 Table 55(c)
above shows the coefficients of FCF and AGE as 01306 and 0201 respectively The p
values for FCF and AGE are 0023 and 0002 respectively indicating statistical
significance because each of them is less than 005 Results for Step 2 are displayed in
Table 56 below where the interaction term is introduced
Table 56 Panel Data Results for Financial Performance as the Dependent Variable
and FCF and Firm Age as the Predictor Variables Centered Approach
a Model Summary
Model R R Square Adjusted R Square Std Error of the Estimate
1 06825 046580 042170 041054
a Predictors (Constant) FCF_FAGE_CENTRED FAGE_CENTRED FCF_CENTRED
b Dependent Variable Financial Performance
100
b ANOVA
Model Sum of Squares df Mean Square F Sig
1 Regression 12034 3 401130 29957 0000
Residual 79950 597 01339
Total 91984 600
a Predictors (Constant) FCF_FAGE_CENTRED FAGE_CENTRED FCF_CENTRED
b Dependent Variable Financial Performance
c Coefficients
Model
Unstandardized
Coefficients
Standardized
Coefficients
t Sig B Std Error Beta
1 (Constant) 0065 00245 41263 0001
FCF_CENTRED 0207 00014 0293 74638 0000
AGE_CENTRED 0094 0091 0351 1986 0047
FAGE_CENTRED 0045 002 00204 2230 0027
a Predictors (Constant) FCF_FAGE_CENTRED FAGE_CENTRED FCF_CENTRED
b Dependent Variable Financial Performance
Results from Table 56 above shows R squared change from 03109 to 042170 which is a
change of 01108 (1108 change) which is occasioned by the interaction term This is
also confirmed by the p values which are all less than 005 meaning that firm age
101
positively and significantly moderates the relationship between FCF and financial
performance The regression model for moderation effect of firm age is as shown below
Ǭit = FCFit + AGEit + 0045FAGEit
Table 57 Panel Data Results for Financial Performance as the Dependent Variable
and FCF and Firm Size as the Predictor Variables
a Model Summary
Model R R Square Adjusted R Square Std Error of the Estimate
1 06481 04200 03902 03198
a Predictors (Constant) SIZE FCF
b Dependent Variable Financial performance
b ANOVA
Model
Sum of
Squares df Mean Square F Sig
1 Regression 8447 2 4224 120685 00000
Residual 21456 598 0035
Total 29903 600
a Dependent variable Financial performance
102
c Coefficients
Model
Unstandardized
Coefficients
Standardized
Coefficients
t Sig B Std Error Beta
1 (Constant) 009 002109 53270 00014
FCF 0107 003104 0178 74238 00000
SIZE 0223 009100 1444 19860 00470
a Dependent Variable Financial Performance
Results in Table 57(a) above show R2 of 04200 and Adjusted R
2 of 03902 Table 57(c)
above shows the coefficients of FCF and SIZE as 0107 and 0223 respectively The p
values for FCF and SIZE are 0000 and 0047 respectively indicating statistical
significance because each of them is less than 005 Results for Step 2 are displayed in
Table 58 below where the interaction term is introduced
Table 58 Panel Data Results for Financial Performance as the Dependent Variable
and FCF and Firm Size as the Predictor Variables Centered Approach
a Model Summary
Model R R Square Adjusted R2 Std Error of the Estimate
1 07853 06167 05654 02208
a Predictors (Constant) FCF_CENTRED SIZE_CENTRED FSIZE_CENTRED
b Dependent Variable Financial Performance
103
b ANOVA
Model Sum of Squares df Mean Square F Sig
1 Regression 3138 1 3138 17119 00011
Residual 109846 599 01833
Total 112984 600
a Predictors (Constant) FCF_CENTRED FCF_FSIZE_CENTRED FSIZE_CENTRED
b Dependent Variable Financial Performance
c Coefficients
Model
Unstandardized
Coefficients
Standardized
Coefficients
t Sig B Std Error Beta
1 (Constant) 0144 00245 4826 0021
SIZE_CENTRED 0048 00140 0392 2586 0041
FCF_CENTRED 0155 00140 0132 3938 0003
FSIZE_CENTRED 0227 00327 0472 2679 00981
a Dependent Variable Financial Performance
Results from Table 58 above shows R squared change from 03902 to 05654 which is a
change of 01752 (1752 change) which is occasioned by the interaction term This is
also confirmed by the p values which are all less than 005 meaning that firm size
moderates the relationship between FCF and financial performance The regression
model for moderation effect of firm size is as shown below
104
Ǭit = FCFit + SIZit + 0227FSIZEit
The moderating effect was established as in Stone-Romero and Liakhovitski (2002)
which involves assessing the effects on the dependent variable (non-financial
performance) of the moderating variables (firm size and age) and dependent variable
(FCF) Regression results with non-financial performance as the dependent variable firm
characteristics (firm size and age) and FCF as predictors as shown below
534 Free Cash Flows Agency Costs Firm Characteristics and Financial
Performance
This study sought to establish the joint effect of FCF agency costs and firm
characteristics on firm performance The corresponding hypothesis is as follows
Hypothesis 4 There is no joint effect of free cash flows agency costs and financial
characteristics on performance of firms listed at the Nairobi Securities Exchange
Secondary data was obtained from financial statements The independent variable is FCF
intervening variable is agency costs (AC) The moderating variable is firm characteristics
which are firm size and age of the firm Financial performance was measured using
Tobinrsquos Q and is the dependent variable Panel data results are presented in table 59
below
105
Table 59 Panel Data Results for Free Cash Flows Agency Costs Firm
Characteristics and Financial Performance
a Model Summary
Model R R Square Adjusted R Square Std Error of the Estimate
1 08780 07708 06645 05432
a Predictors (Constant) FCF AC Firm Size Firm Age
b Dependent variable Financial performance
b ANOVA
Model Sum of Squares df Mean Square F Sig
1 Regression 7708 2 3854 22807 0012
Residual 101336 598 0169
Total 7934 600
a Predictors (Constant) FCF AC Firm Size and Firm Age
b Dependent Variable Financial Performance
106
c Coefficients
Model
Unstandardized
Coefficients
Standardized
Coefficients
t Sig B Std Error Beta
1 (Constant) 065 0011 3826 0033
FCF 0144 0024 0081 4938 0020
Age 0107 0027 0150 1233 0074
Size 0231 0069 0102 6586 0010
AC 0314 0034 0259 2901 0032
a Predictors (Constant) FCF AC Firm Size and Firm Age
b Dependent Variable Financial Performance
From the panel study results the intercept (constant) is 0065 with a statistically
significant p-value of 0033 FCF have a coefficient value of 0144 with a p-value of 002
which is significant The findings indicate that FCF still have positive effect on the
performance of the listed firms and the effect is still significant even when control
variables are introduced in the model The effect of agency costs is also positive and
significant at p value 0032 Firm size shows a positive and significant joint effect (p
value is 001) while age has a positive effect but the effect is not significant (p value is
0074) The R2 is 07708 indicating that 7708 of changes in financial performance are
accounted by the joint effect of FCF AC and firm characteristics (size and age)
107
Overall the joint effect of FCF agency costs and firm characteristics on performance of
firms listed at NSE indicates a positive significant relationship The null hypothesis is
therefore rejected There is a significant joint effect of FCF agency costs and firm
characteristics on performance of firms listed at the NSE The regression model that
explains the variation in firm performance as a result of the joint effect of FCF agency
costs and firm characteristics is shown below
Ǭit FCFit +ACit +SIZit +AGEit
Where Ǭit = Financial Performance
FCF= Free Cash flows
AC = Agency Costs (AC)
SIZ = Firm Size
AGE = Firm Age
54 Discussion
The study had four hypotheses with hypothesis 3 having two sub hypotheses one
focusing on firm age and the other on firm size The results under each objective are
discussed here-below
541 The Influence of Free Cash Flows on Financial Performance
The first objective of the study was to establish the influence of FCF on the performance
of firms listed at the NSE This was achieved through analyzing the audited financial
statements of the listed companies (panel data)
108
The results indicate that there is a significant positive relationship between FCF and firm
performance The findings for the influence of FCF on financial performance showed a
statistically significant positive relationship These results are consistent with other
studies on FCF and firm performance For instance Kargar and Ahmadi (2013) found a
positive relationship between FCF and performance of firms listed at the Tehran stock
exchange Similarly Gregory (2005) established that the greater the FCF the better the
performance in merger undertakings Szewczyk et al (1996) and Chang et al (2007)
concluded that shareholders favour businesses that have FCF
In his study on the effects of agency costs on performance of firms listed at the NSE
Wambua (2013) also found a positive relationship between FCF and firm performance
The findings show that increasing FCF disposes more resources to firm managers who
then deploy the resources towards generating more revenues and profits for the firm
The findings are inconsistent with the FCF hypothesis postulated by Jensen (1986) which
suggests that agency conflicts between firm managers and shareholders become more
severe in the presence of substantial FCF thereby negatively affecting firm performance
Furthermore these findings reject the agency theory which was proposed by Jensen and
Meckling (1976) The agency theory is based on the premise that the goal of firm
managers is to maximize their personal wealth and other self-interests instead of
maximizing the wealth of shareholders
On the contrary the findings seem to support the stakeholder theory which advances that
firm management has a network of relationships and therefore corporate accountability
109
includes a broad range of stakeholders such as suppliers business associates financial
institutions the government customers among others Similarly the findings are
consistent with the stewardship theory The theory emphasizes the role of firm managers
as being that of stewards who integrate their goals as part of the firmrsquos goals
542 The Influence of Agency Costs on the Relationship between Free Cash Flows
and Financial Performance
The second objective was to assess the influence of agency costs on the relationship
between FCF and financial performance of firms listed at the NSE The study
hypothesized that agency costs have no significant intervening effect on the relationship
between FCF and performance of firms listed at the NSE The assessment of agency
costs FCF and financial performance was achieved by reviewing financial statements of
companies listed at the NSE The results indicate a statistically significant positive
intervening effect of agency costs on the relationship between FCF and financial
performance
The results reveal that agency cost measure is positive and significantly associated with
firm performance This can be attributed to the role of internal control system in reducing
agency costs associated with residual loss due to suboptimal managerial actions These
findings are supported by Kangarluei Motavassel and Abdollahi (2011) and Khidmat
and Rehman (2014) who established a statistically significant positive effect of agency
costs on the relationship between FCF and firm performance
110
Similarly Lin and Lin (2014) found a positive statistically significant effect of agency
costs on the relationship between FCF and firm performance in the Australian takeover
market These findings are contrary to the argument that substantial FCF increases
agency costs which subsequently affects firm performance negatively The FCF
hypothesis and the agency theory are therefore not supported by the findings On the
contrary the stakeholder theory and the stewardship theory are supported by the results
543 The Influence of Firm Characteristics on the Relationship between Free Cash
Flows and Financial Performance
The third objective of the study was to determine the moderating effect of firm
characteristics on the relationship between FCF and performance of firms listed at the
NSE The firm characteristics evaluated were firm size and age of the firm An
assessment of audited financial statements was carried out to measure FCF firm
characteristics (firm size and age of the firm) and firm financial performance
Results indicate firm size exhibiting a statistically significant positive moderating effect
on the relationship between FCF and firm financial performance Similarly firm age
shows a positive moderating effect on the relationship between FCF and firm financial
performance and the effect is also statistically significant The positive effect of firm size
confirms the results of the study conducted by Nyamweno and Olweny (2014) which
found firm size to be positively related to ROA This indicates that larger firms report
higher financial performance as compared to smaller firms Abbasi and Malik (2015)
clarified the relationship between firm size and financial performance by concluding that
111
larger firms had higher likelihoods of obtaining credit from financial institutions and
would get loans at lower rates because they have superior credit worth ratings and have
lower risk of bankruptcy
Heydari et al (2014) argue that firm characteristics such as firm age and size can expose
a firm to more agency costs related to management and growth prospects thus depressing
the effect of FCF on firm performance This result can be viewed from the perspective of
liability of obsolescence in which organizational performance declines with age
The decline can be attributed to environmental drift resulting from rivalry and
competition and organizational inertia the syndrome of too big or too old to change
Liabilities of obsolescence arise from growing external mismatch with the environment
The results indicate positive effects of firm characteristics on the relationship between
FCF and firm financial performance The results in this study support the RBV theory
which is concerned with internal firm specific factors and their effect on performance
The RBV theory views the firm as a bundle of resources which are combined to create
organizational capabilities that it can use to earn more than average profitability If well
developed competences from these resources become a source of competitive advantage
(Grant 1991)
112
544 The Joint Effect of Free Cash Flows Agency Costs and Firm Characteristics
on Financial Performance
The last objective of the study was to establish the joint effect of FCF agency costs and
firm characteristics on financial performance of firms listed at the NSE Financial
performance was measured by Tobinrsquos Q Firm characteristics that were considered in
the study were firm size and age of the firm Panel data results indicate that there is a
positive statistically significant joint effect of FCF agency costs and firm characteristics
on firm performance These findings support results by Chen et al (2016) who conclude
that large firms which have been in existence for a long time tend to have structures in
place to reduce agency costs
The findings are also similar to Wang (2010) who concluded that there exists a positive
joint effect of firm size FCF and agency cost on firm performance Results of the study
by Jabbary Hajiha Labeshka and Hassanpour (2013) are confirmed by these findings
which reveal that FCF have a positive significant effect on firm performance even with
the inclusion of control variables of agency costs and firm characteristics All the agency
cost coefficients indicate statistically significant positive effects
Emami et al (2014) observe that internal control systems provide an overarching
framework that reduces agency costs and hence positively affecting firm performance
These findings are also similar to Dawar (2014) who established that firm monitoring
costs impact positively on firm performance In testing financial performance firm size
had a coefficient of 0231 and p-value of 001 when jointly tested with other variables
113
indicating that firm size has a positive effect on firm performance even with control
variables introduced
These findings are supported by Banafa (2016) who concluded that firm size affects
performance of firms significantly albeit with small effect when moderated by other
variables In testing financial performance firm age revealed a positive but not
statistically significant effect with a coefficient of 0107 and a p-value of 0074 These
results contradict with Brouwe et al (2005) who concluded that productivity growth
rates are negatively correlated with firm age
Overall the joint effect of FCF agency costs and firm characteristics on performance of
firms listed at NSE indicates a positive significant relationship We therefore reject the
null hypothesis which states that there is no significant joint effect of free cash flows
agency costs and firm characteristics on financial performance of firms listed at the NSE
These results have rejected the FCF hypothesis and the agency theory This is because
FCF firm characteristics and agency costs have indicated a positive joint effect on firm
performance On the other hand the stewardship theory the stakeholder theory and the
RBV theory seem to be supported by the findings The organisational theory which
explains firm size in relation to profitability as well as organizational transaction costs
agency costs and span of control also seems to be supported by the findings of this study
114
Table 510 Summary of Tests of Hypotheses Results and Conclusions
Hypothesis R2
(p-value) Conclusion
H01 FCF have no significant
effect on financial
performance of firms listed at
the NSE
02391
00023
Null Hypothesis rejected
H2 Agency costs (AC) have
no significant intervening
effect on the relationship
between FCF and financial
performance of firms listed at
the NSE
05122
0031
Null Hypothesis rejected
H03a Firm age has no
significant moderating effect
on the relationship between
FCF and financial
performance of firms listed at
the NSE
04658
0047
Null Hypothesis rejected
H03b Firm size has no
significant moderating effect
on the relationship between
FCF and financial
performance of firms listed at
the NSE
06167
0041 Null Hypothesis rejected
H04 There is no joint effect of
FCF agency costs and firm
characteristics on financial
performance of firms listed at
the NSE
07708
0033
Null Hypothesis rejected
115
55 Summary and Presentation of Empirical Models
The chapter presented the study results from analytical tests conducted to verify the study
hypotheses The findings of the statistical analyses carried out were presented and
interpreted The study established that FCF have a statistically significant positive effect
on financial performance This relationship is intervened by agency costs and moderated
by firm characteristics
Agency costs have a statistically significant positive intervening effect on the relationship
between FCF and financial performance On the other hand firm characteristics have a
statistically significant negative moderating effect on the relationship between FCF and
firm financial performance Finally the study established that there is a joint effect of
FCF agency costs and firm characteristics on financial performance of firms listed at the
NSE The joint effect is positive and statistically significant The empirical conceptual
model depicting the relationships between the variables is presented in figure 51 below
116
Figure 51 Revised Empirical Model ndash Financial Performance
Independent Variable Dependent Variable
Intervening Variable H1 Ǭit = 048011 + 0206FCFit
H2 Ǭit = 0187 + 0148ACit + 0211FCFit
H4 Ǭit = 065 + 00144FCFit + 0314ACit + 0231SIZit + 0107AGEit
Ǭit = 065+0207FCFit+0094AGEit + 0045FAGEit
H3 Ǭit = 0144+0155FCFit +0048SIZit+ 0227FSIZit
Moderating Variable
Source Researcher (2018)
Free Cash Flows
FCFit=(Net income
(PAT)+depreciation and
amortization - CAPEX -
change in non-cash
working capital + net
borrowing)Sales
Firm Financial
Performance
- Tobinrsquos Q
Agency Costs
- Asset utilization efficiency AC
- Production cost efficiency
Firm Characteristics
- Firm Size
- Age of the firm
117
CHAPTER SIX SUMMARY OF FINDINGS CONCLUSIONS AND
RECOMMENDATIONS
61 Introduction
This study investigated the relationship between FCF agency costs firm characteristics
and financial performance of firms listed at the NSE The independent variable is FCF
while agency costs are intervening variables and firm characteristics are moderating
variables Financial performance is the dependent variable The chapter has summarized
the findings of the study and made conclusions upon which recommendations are drawn
Discussions conclusions and recommendations have been presented These have been
discussed in light of other studies that have investigated the same or similar variables in
other settings The chapter ends with the study implications to theory policy and
practice and recommendations for further research
The study had four objectives upon which conclusions are aligned to The objectives
were first to stablish the relationship between free cash flows and financial performance
of firms listed at the NSE second to assess the influence of agency costs on the
relationship between free cash flows and financial performance of firms listed at the
NSE third to determine the influence of firm characteristics on the relationship between
free cash flows and financial performance of firms listed at the NSE and lastly to
establish the joint effect of free cash flows agency costs and firm characteristics on
financial performance of firms listed at the NSE
118
62 Summary of Findings
This study was founded on the premise that FCF have an influence on financial
performance and that the relationship between the two is intervened by agency costs and
moderated by firm characteristics A conceptual framework was therefore developed and
the study empirically tested hypotheses which were guided by the study objectives The
first objective of the study was set to find out the relationship between FCF and
performance of firms listed at NSE The findings reveal that FCF have a statistically
significant positive effect on performance of firms listed at the NSE
This finding is supported by the coefficient of determination of 02391 which indicates
the variations in firmsrsquo financial performance (explanatory variable) explained by FCF
(predictor variable) The effect of FCF was established to be statistically significant and
therefore the null hypothesis was rejected Therefore we reject the null hypothesis that
FCF have no statistically significant effect on performance of firms listed at the NSE
The results are inconsistent with the FCF hypothesis advanced by Jensen (1986) which
proposes that agency conflicts between firm managers and shareholders become more
severe in the presence of substantial FCF thereby negatively affecting financial
performance Additionally these findings reject the agency theory which was suggested
by Jensen and Meckling (1976) These results are consistent with Wambua (2013) who
found a positive relationship between FCF and firm performance The findings imply that
increasing FCF avails more resources to firm managers who utilize the funds in
generating more wealth
119
The second objective of the study sought to assess the influence of agency costs on the
relationship between FCF and financial performance of firms listed at the NSE The
findings indicate that agency costs have a positive statistically significant intervening
effect on the relationship between FCF and financial performance of firms listed at the
NSE Thus the study rejected the null hypothesis which states that agency costs have no
significant intervening effect on the relationship between FCF and financial performance
of firms listed at NSE
These findings support Lin and Lin (2014) who found a positive statistically significant
effect of agency costs on the relationship between FCF and firm performance in the
Australian takeover market These findings are contrary to the FCF hypothesis suggested
by Jensen (1986) and the agency theory postulated by Jensen and Meckling (1976)
However the stakeholder theory advanced by Freeman (1984) and the stewardship theory
developed by Donaldson and Davis (1991) seem to be supported by the findings
The third objective of the study sought to establish the influence of firm characteristics on
the relationship between FCF and financial performance of firms listed at the NSE
Results indicate that firm characteristics (both firm size and age) have a positive
significant moderating effect on the relationship between FCF and financial performance
of firms listed at the NSE These findings contradict Heydari et al (2014) who argue that
firm characteristics such as firm age and size can expose a firm to more agency costs
related to management and growth prospects thus depressing the effect of FCF on firm
performance
120
The fourth and final hypothesis sought to establish the joint effect of FCF agency costs
and firm characteristics on financial performance of firms listed at the NSE Results show
positive coefficients for all the variables which means that as FCF agency costs and firm
characteristics jointly increase performance of the NSE listed firms also increases Firm
characteristics show a positive statistically significant joint effect on firm financial
performance and also FCF and agency costs show a positive statistically significant joint
effect on firm financial performance The results have rejected the FCF hypothesis and
the agency theory On the other hand the results seem to support the stewardship theory
the stakeholder RBV theory and the organisational theory
63 Conclusions
Based on the findings of the study FCF is fundamental to firm performance because it
allows firms to invest and grow thereby improving performance Firms should strive to
increase FCF since it has a statistically significant positive effect on financial
performance Similarly firms should invest more in firm monitoring which according to
the findings in this study the benefits derived from investing in firm monitoring
(improved firm performance) outweigh the agency costs of investing therein (in firm
monitoring) This study has found no evidence supporting the FCF hypothesis as
suggested by Jensen (1986) and therefore firms listed at the NSE are not consistent with
the FCF hypothesis
Consistent with these findings Nyamweno and Olweny (2014) found firm size to be
positively related to financial performance Similarly Dawar (2014) found that firm
121
monitoring costs impact positively on financial performance Conflicting with literature
(Kwanum amp Lorpev 2012) firm age indicated a positive effect on the relationship
between FCF and firm financial performance However the findings of this study are
consistent with Banafa (2016) who concluded that firm size affects firm performance
significantly when moderated by other variables It is therefore confirmed that there
exists a strong relationship between FCF agency costs firm characteristics and financial
performance of firms listed at the NSE
64 Contributions of the Study
The study has contributed to knowledge in the areas of FCF and the agency problem firm
characteristics and firm performance More specifically the study has contributed to
theory policy and practice
641 Contribution to Theory
The results of this study have to a large extent rejected the FCF hypothesis advanced by
Jensen (1986) and the agency theory advanced by Jensen and Meckling (1976) which
postulate that when a firm has generated significant FCF and there are no lucrative
investment projects available managers tend to abuse the FCF which results in increased
agency costs The study results have therefore given credence to the critics of the FCF
hypothesis and agency theory who argue that the theories foster short-termism by not
favouring investments that have long run returns Furthermore the findings support the
argument that even in conditions of greatly specific assets where the likelihood of
opportunism is very high there are people who will give precedence to cooperation and
trust and will not engage in opportunistic behavior
122
The study findings have also given credibility to the stewardship theory postulated by
Donaldson and Davis (1991) which emphasizes the role of firm managers as being
stewards incorporating their objectives as part of the firm As stewards they are
contented and encouraged when success of the firm is achieved Agency costs have
shown a positive intervening effect on the relationship between FCF and firm
performance This finding gives credibility to firm monitoring through CG which seems
to have achieved the objective of aligning the interests of firm managers and
shareholders The study findings also imply that firm capabilities and firm characteristics
complement the effects of agency costs on performance
The inclusion of firm characteristics as a moderating variable provided an opportunity to
test the RBV and organizational theories by providing empirical evidence about how the
specific firm characteristics (size and age) affect firm performance This study adopted
two measures of agency costs This measurement approach has enabled the study to offer
a stronger and more robust assessment of the linkages between the study variables
642 Contribution to Policy
The Kenyan context is characterized by calls for effective CG particularly for public
limited liability firms (Okiro 2014) These study findings have refuted the FCF
hypothesis by revealing a positive relationship between FCF and firm performance as
intervened by agency costs This is an indication that investing in firm monitoring is
yielding positive results Adopting good CG mechanisms (firm monitoring which form
123
part of agency costs) is an effective way of improving firm performance Firms should
endeavor to strengthen their monitoring mechanisms so as to increase performance
Improving CG entails having an optimal number of board of directors enhancing board
independence making full disclosure of shareholding and directorrsquo remuneration Policy
makers will therefore maintain CG calls and strive to strengthen and continue developing
policies regulations and prudential guidelines that protect and strengthen shareholders
643 Contribution to Practice
The study findings have shown the fundamental importance of firms generating FCF and
strengthening firm monitoring The joint effect of FCF agency costs and firm
characteristics on firm performance has yielded a positive relationship Firm managers
investors and other practitioners will therefore put more emphasis on the need for firms to
generate FCF and to enhance firm monitoring
Cash flows from operating activities financing activities and investment activities will be
more keenly analyzed with a view to achieve greater efficiency This study has also
delineated FCF from agency costs unlike studies such as Jensen (1986) which generally
regard FCF as agency costs This gives firm managers investors and other practitioners a
better understanding of the variables and their linkages which will enhance effectiveness
and efficiency in firm operations
124
65 Limitations of the Study
The study focused on firms listed at the NSE which operate in a unique environment
Unique factors such as regulatory environment culture and demographics limit the
generalizability of the study results to other countries or markets However this
limitation does not render the study findings applicable to NSE listed firms only Some
aspects could be relevant to other markets
Secondly the major theoretical motivations underlying this study are the FCF hypothesis
and the agency theory Traditionally the board of directors keenly monitors decision
makers who tend to divert resources to their own personal interests The findings support
this view and offer evidence that proper firm monitoring mechanisms yield higher firm
performance A probable limitation of the study is that it does not integrate other CG
mechanisms such as influencing managersrsquo actions through an advisory role
Thirdly the study disregards practices other than board monitoring that may serve to
lessen agency costs Firm monitoring costs were a part of the larger agency cost variable
The omission of alternative board monitoring practices did not therefore undermine the
robustness and or the rigor of the study Fourthly the study used only two firm
characteristics These are firm size and age of the firm Other firm characteristics include
profitability leverage liquidity sales growth among others The study employed size and
age only because they are the most commonly used in literature and their effect on firm
performance is more significant (Demsetz amp Lehn 1985 and Mule Mukras amp Nzioka
2015)
125
Lastly literature indicates at least seven proxy measures of agency costs These are
operating expense to sales ratio total asset turnover advertising and RampD expense to
sales ratio administrative expense to sales ratio earnings volatility firm monitoring
index and FCF This study utilized only two of these measures (total asset turnover and
operating expense to sales ratio) Agency cost measures other than the two used in this
study may yield different findings Employing only one agency cost measure may still be
sufficient and therefore the omission of other measures did not undermine the robustness
and or the rigor of the study
66 Recommendations of the Study
The findings have indicated that there exists a positive relationship between FCF and
financial performance The study therefore recommends that firm managers investors
and other practitioners should focus more on the need for firms to generate FCF Positive
FCF indicate that the firm is making more cash than is used to operate the firm and for
reinvestment Such excess funds can be given back to shareholders as dividends or share
repurchase packages in cases where the firms have limited growth prospects and the
funds could not be better invested somewhere else
It is therefore recommended that regulators policy makers investors and other
practitioners should emphasize on monitoring and CG mechanisms to maintain if not
improve high firm performance Study results indicate that proper monitoring
mechanisms can bring the actions of firm managers into congruence with those of
shareholders which primarily is to maximize the shareholdersrsquo wealth
126
67 Suggestions for Further Research
This study used Tobinrsquos Q in measuring financial performance Further studies need to be
conducted using ROE ROI ROA DY sales growth market share or productivity
Secondly the study population was all firms listed at the NSE These firms cut across
various industry sectors Future studies could focus on specific industries such as
manufacturing financial sector communications agricultural or automobile industry
This is because focusing on a specific industry could yield different results that are
unique for the industry
Thirdly this study used only two firm characteristics as moderating variables These are
firm size and age of the firm Future studies could employ sales growth liquidity growth
prospects profitability asset growth turnover ownership structure dividend pay-out
profitability and access to capital markets among others Use of other moderating
variables may yield different results
Lastly the study only employed two proxy measures of agency costs Future studies
should attempt to use all the suggested seven agency cost measures or the other agency
cost measures not employed in this study This could yield different results or provide
more robustness and rigor in the study
127
REFERENCES
Abbasi A amp Malik A Q (2015) Firm size moderating financial performance in
growing firms Empirical evidence from Pakistan International Journal of
Economics and Financial Issues 5(2) 334ndash339
Adelegan O J (2009) Investment financial factors and cash flow from Nigerian panel
data Journal of African Development 11(1) 77-108
AERA APA amp NCME (2000) Standards for educational and psychological tests
Washington DC American Psychological Association American Educational
Research Association National Council on Measurement in Education
Aldrich H E amp Austen E (1986) Even dwarfs started small Liabilities of size and age
and their strategic implications In Staw B Cummings (Eds) Research in
organizational behavior JAI Press Greenwich CT
Ayako A Kungu G amp Githui T (2015) Determinants of the performance of firms
listed at the Nairobi Securities Exchange Research Journal of Finance and
Accounting 6(12) 157-164
Aiken L S amp West S G (1991) Multiple regression Testing and interpreting
interactions Thousand Oaks CA Sage
Bain J S (1959) Industrial organization New York John Wiley amp Sons
Baker W E amp Sinkula (2005) Market orientation and the new product paradox Journal
of Product Innovation Management 22(6) 485-502
Banafa A (2016) The effect of leverage liquidity and firm size on financial
performance of listed non-financial firms in Kenya Unpublished PhD Thesis
Jomo Kenyatta University of Agriculture and Technology
128
Barney J B (2002) Gaining and sustaining competitive advantage 2nd
ed Reading
Mass Addison-Wesley
Baron R M amp Kenny D A (1986) The moderator-mediator variable distinction in
social psychological research conceptual strategic and statistical considerations
Journal of Personality and Social Psychology 51(6) 1173-1182
Berle A A amp Means G C (1932) The modern corporation and private property
McMillan New York
Bonett D G amp Wright T A (2014) Cronbachrsquos Alpha Reliability Interval estimation
hypothesis testing and sample size planning Journal of Organizational Behavior
36 (1) 3-15
Bourne M Neely A D Mills J F amp Platts K (2003) Implementing performance
measurement systems A literature review International Journal of Business
Performance Management 5 (1) 1-24
Brealey A A Myers S C amp Allen F (2005) Principles of corporate finance (8th
ed)
Boston McGraw-HillIrwin
Bromiley P (1990) Advances in strategic management JAI Press Greenwich
Brouwer P Kok J D amp Fris P (2005) Can firm age account for productivity
differences EIM Business research scientific analysis of entrepreneurship and
SMEs SCALES ndash paper N200421 Zoetermeer Netherlands
Brush H W Bromiley P amp Hendrickx M (2000) The free cash flow hypothesis for
sales growth and firm performance Strategic Management Journal 21 455-472
129
Cadogan J W amp Diamantopoulos A (1995) Narver and Slater Kohli and Jaworski and
the market orientation construct integration and internationalization Journal of
Strategic Marketing 3(1) 41-60
Carson D Gilmore A Perry C amp Gronhaug K (2001) Qualitative marketing
research SAGE publications London
Central Bank of Kenya (2016) Bank supervision annual report
Chang S J amp Singh H (2000) Corporate industry effects on business and competitive
position Strategic Management Journal 21 (1) 739-752
Chen X Sun Y amp Xu X (2016) Free cash flow over-investment and corporate
governance in china Pacific-Basin Finance Journal 37 81ndash103
CMA (2010) A comparative analysis of the performance of African stock markets
[Online] Available wwwcmaorke [Accessed 9 August 2015]
Cline B N Williamson C R amp Yore A (2014) Economic calculation and constraints
on firm size Mississippi State University USA
Cooper D R amp Schindler P S (2006) Business research methods 9th
edition Mac-
Grow-hill publishing co ltd New Delhi India
Daft R L (1995) Organization theory and design (11 ed) West Publishing Company
New York
Daily C M Dalton D R amp Cannella J A A (2003) Corporate governance decades
of dialogue and data The Academy of Management Review 28 (3) 371-382
Dancey C amp Reidy J (2011) Statistics without maths for psychology 5th Edition
Prentice Hall London
130
Davis J Donaldson L amp Schoorman D (1997) Towards a stewardship theory of
management Academy of Management Review 22 (1) 20-47
Dawar V (2014) Agency theory capital structure and firm performance some Indian
evidence Managerial Finance 40(12) 1190ndash1206
Dean T J Robert L B amp Bamford (1998) Differences in large and small firm
responses to environmental context strategic implications from a comparative
analysis of business formations Strategic Management Journal 19(8) 709-728
Demsetz H amp Lehn K (1985) The structure of corporate ownership causes and
consequences Journal of Political Economy 93 (6) 1155-1177
Donaldson L (1990) A rational basis for criticism of organizational economics a reply
to Barney Academy of Management Review 15 394-401
Donaldson L amp Davis J H (1991) Stewardship theory or agency theory CEO
governance and shareholder returns Australian Journal of Management 16 (1)
49-65
Donaldson T amp Preston LE (1995) The stakeholder theory of the corporation
concepts evidence and implications Academy of Management Review 20 (1)
65-91
Dyer L amp Reeves T (1995) Human resource strategies and firm performance what do
we know and where do we go International Journal of Human Resource
Management 31 758-775
Easterwood C (1997) Takeovers and incentives for earnings management an empirical
analysis Journal of Applied Business Research 14 29-48
131
Emami E Salteh H M amp Hasanzadeh R B (2014) Social responsibility and value of
firms listed at Tehranrsquos Stock Exchange International Review of Management
and Business Research 31(21) 332ndash338
Fama E F (1980) Agency problems and theory of the firm Journal of Political
Economy 88(2) 288-307
Fauver L amp Naranjo A (2010) Derivative usage and firm value the influence of
agency costs and monitoring problems Journal of Corporate Finance 16 719-
735
Ferris S P amp Yan X S (2009) Agency costs governance and organizational forms
evidence from the mutual fund industry Journal of Banking and Finance 33 619-
626
Field A (2009) Discovering statistics using SPSS Sage Publications Ltd London
Figge F Hanh T Schaltegger S amp Wagner M (2002) The sustainability Balanced
Score Card - Linking sustainability management to business strategy Business
Strategy and Environment 11 269-284
Freeman R (1984) Strategic management a stakeholder approach Pitman Publishing
Inc Massachusetts
Frentrop P (2003) On the discretionary power of top executives Journal of Asset
Management 5 (2) 91-104
Gleason J M amp Barnum D T (1982) Toward valid measures of public sector
productivity performance measures in urban transit Management Science
28(14) 379-386
Gorard S (2013) Research design robust approaches for the social sciences London
SAGE ISBN
132
Grant R M (1991) The resource based theory of competitive advantage implications
for strategic formulation California Management Review 33(1) 114-135
Gregory A (2005) The long-run abnormal performance of UK acquirers and the free
cash flow hypothesis Journal of Business Finance and Accounting 32(5) 777-
814
Gul F A amp Tsui S T J (1998) A test of the free cash flow and debt monitoring
hypotheses evidence from audit pricing Journal of Accounting and Economics
24 (2) 219-237
Hannan M T amp Freeman J (1984) Structural inertia and organizational change
American Sociological Review 49(2) 149-164
Harford J (2002) Corporate cash reserves and acquisitions The Journal of Finance 54
(6) 1969 ndash 1997
Hawawini G Subramanian V amp Verdin P (2003) Is performance driven by industry
or firm specific factors a new look at evidence Strategic Management Journal
23 (1) 1-16
Hendricks K B amp Singhal V R (2001) Firm characteristics total quality management
and financial performance Journal of Operations Management 19 269-285
Heydari I Mirzaeifar M Javadghayedi M amp Student M A (2014) Investigating the
relationship between free cash flows and firm performance evidence from Tehran
Stock Exchange Indian Journal of Scientific Research 4(6) 269ndash279
Hill C W L (1990) Cooperation opportunism and the invisible hand implications for
transaction cost theory Academy of Management Review 15(3) 500-513
Hubbard R G (1998) Capital market imperfections and investment Journal of
Economic Literature 36 (2) 193-225
133
Jabbary H Hajiha Z Labeshka amp Hassanpour R (2013) Investigation of the effect of
agency costs on firm performance of listed firms at the Tehran Stock Exchange
European Online Journal of Natural and Social Sciences 2(3) 771ndash776
Jensen M (1986) Agency costs of free cash flow corporate finance and takeovers
American Economic Review 76 (2) 323-329
Jensen M C amp Meckling W H (1976) Theory of the firm managerial behavior
agency cost and ownership structure Journal of Financial Economics 3 (4) 305-
360
Kaen F R amp Baumann H D (2003) Firm size employees and profitability in US
manufacturing industries Social Science Research Network Electronic Journal
(1) 1-71
Kapelko M (2006) Evaluate efficiency in the framework of resource based view of the
firm evidence from Polish and Spanish textile amp clothing industry Bellaterra
1(1) 1-56
Kaplan R S amp Norton D P (2001) Transforming Balanced Score Card from
performance measurement to strategic management Part 1 Accounting Horizons
87-104
Kangarluei S J Motavassel M amp Abdollahi T (2011) The investigation and
comparison of free cash flows in the firms listed in Tehran Stock Exchange (TSE)
with an emphasis on earnings management International Journal of Economics
and Business Management 2(2) 5352ndash118
Kargar E F amp Ahmadi G R (2013) The relationship between free cash flows and
agency costs levels evidence from Tehran Stock Exchange Research Journal of
Finance and Accounting 4(14) 51ndash66
134
Kerlinger F N (2002) Foundations of behavioural research Holt Rinehart and
Winston Inc USA
Khidmat W B amp Rehman M U (2014) The impact of free cash flows and agency
costs on firm performance - an empirical analysis of KSE listed companies of
Pakistan Journal of Financial Engineering 01(03) 145 ndash 175
Kimberlin C L amp Winterstein A G (2008) Validity and reliability of measurement
instruments used in research American Society of Health-System Pharmacists 65
Kinoti M A (2012) Factors contributing towards adoption of green marketing
practices in the mobile phone service providers in Kenya Unpublished PhD
Thesis University of Nairobi Kenya
Kogan L amp Tian M (2012) Firm characteristics and empirical factor models a data-
mining experiment International Finance Discussion papers 1070
Kwanum M amp Iorpev L (2012) Capital structure and firm performance evidence from
manufacturing companies in Nigeria International Journal of Business and
Management Tomorrow 2 (5) 1ndash17
Leibenstein H (1976) Beyond economic man Cambridge MA Harvard University
Press
Lengnick-Hall C A amp Wolff J A (1999) Similarities and contradictions in the core
logic of three strategy research streams Strategic Management Journal 20(12)
1109-1132
Lin L amp Lin D (2014) Agency cost of free cash flow and biddersrsquo long-run takeover
performance Universal Journal of Accounting and Finance 2(1) 1-8
135
Lusthaus C Anderson G amp Murphy E (1995) Institutional assessment a framework
for strengthening organizational capacity for IDRCrsquos research partners
International Development Research Centre Ottawa
Mackinnon D P Lockwood C M Hoffman J M West S G amp Sheets V (2002) A
comparison of methods to test mediation and other intervening variable effects
Psychological Methods 7 (1) 83-104
Mbugua D (2015) Market orientation firm characteristics dynamic capabilities and
performance of deposit-taking savings and credit cooperative societies in Kenya
Unpublished PhD Thesis University of Nairobi Kenya
Mansell S (2013) Capitalism corporations and the social contract a critique of
stakeholder theory Cambridge Cambridge University Press
McKnight P J amp Weir C (2008) Agency costs corporate governance mechanisms and
ownership structure in large UK publicly quoted companies a panel data analysis
The Quarterly Review of Economics and Finance 49 (2009) 139-158
Meyer M W amp Zucker L G (1989) Permanently failing organization Sage Beverly
Hills CA
Miller D amp Chen M J (1994) Sources and consequences of competitive inertia
Administrative Science Quarterly 39(1) 1-17
Milne F Purda L amp Anand A (2008) Monitoring to reduce agency costs examining
the behavior of independent and non-independent boards Seattle University Law
Review 33(4) 809-848
Mitchell R K Agle B R amp Wood D J (1997) Toward a theory of stakeholder
identification and salience defining the principle of who and what really counts
Academy of Management Review 22(4) 853-886
136
Mojtahedzadeh V amp Nahavandi N N A P (2009) Free cash flow agency costs
earnings management and investor monitoring Journal of Financial Economics
32 615-635
Muganda N (2010) Applied business and management research Exploring the
principles and practices of research within the context of Africa Africa Nicorp
Publication
Mugenda O M amp Mugenda AG (2003) Research methods quantitative and
qualitative approaches Nairobi Acts Press
Mule R K Mukras S M amp Nzioka O M (2015) Corporate size profitability and
market value an econometric panel analysis of listed firms in Kenya European
Scientific Journal 11 (13) 376-396
Mwangi M (2014) The influence of membersrsquo income and conduct of SACCOs in the
relationship between characteristics and efficiency of SACCOs in Kenya
Unpublished PhD Thesis University of Nairobi Kenya
Nairobi Securities Exchange (2015) History of the NSE [Online] Available
wwwnsecoke [Accessed 26 June 2015]
Neely A (1998) Measuring business performance - why what and how Economist
Books London
Neely A D Adams C amp Kennerley M (2002) The performance prism the scorecard
for measuring and managing business success Pearson Education Limited
London UK
Nekhili M Amar I F B Chtioui T amp Lakhal F (2014) Free cash flow and earnings
management the moderating role of governance and ownership Journal of
Financial Economics 11 (13) 847 ndash 875
137
Njeru W G (2013) Market orientation marketing mix practices firm characteristics
external environment and performance of tour firms in Kenya Unpublished PhD
Thesis University of Nairobi Kenya
Njuguna L amp Moronge M (2013) Influence of the managerial behavior of agency cost
on the performance of listed firms on NSE International Journal of Social
Sciences and Entrepreneurship 1 (7) 397-410
Norman W amp MacDonald C (2004) Getting to the bottom of tripple bottom line
Business Ethics Quarterly 14 (2) 243-262
Nunes P J M Serrasqueiro Z M amp Sequeira T N (2009) Profitability in Portuguese
service industries a panel data approach The Service Industries Journal 29(5)
693-707
Nunnally J (1967) Psychometric theory Mac-Graw-Hill New York
Nyamweno C N amp Olweny T (2014) Effect of working capital management on
performance of firms listed at the Nairobi Securities Exchange Economics and
Finance Review 3(11) 1ndash14
Nyongrsquoo A P (2000) The context of privatization in Kenya African academy of
sciences Colour Printers Nairobi Kenya
Odundo E (2009) Alternative investment options transforming needs into
opportunities Retirement Benefits Authority CMA Workshop
Okiro K O (2014) The influence of capital structure firm size rules and regulations on
the relationship between composite corporate governance and performance of
firms listed on East African Securities Exchanges Unpublished PhD Thesis
University of Nairobi Kenya
138
Ongore V amp KrsquoObonyo P (2011) Effects of selected corporate governance
characteristics on firm performance empirical evidence from Kenya
International Journal of Economics and Financial Issues 1 (3) 99-122
Opler T amp Titman S (1993) The determinants of leveraged buyout activity free cash
flow versus financial distress costs Journal of Finance 48 1985-1999
Oppenheim A N (1992) Questionnaire design interviewing and attitude measurement
Basic books Inc New York
Patton M (1990) Qualitative evaluation and research methods Beverly Hills CA
Sage
Pearce J A amp Robinson R B (2011) Strategic management formulation
implementation and control (12th
ed) New York McGraw HillIrwin
Penfield R amp Miller J M (2004) Improving content validation studies using an
asymmetric confidence interval for the mean of expert ratings Applied
Measurement in Education 17 359-370
Penrose E T (1959) The theory of the growth of the firm Oxford Basil Blackwell
Perry C Reige A amp Brown L (1999) Realismrsquos role among scientific paradigms in
marketing research Irish Marketing Review 12(2) 16-23
Podrug N (2010) Stewardship relations within management hierarchy in large
Croatian companies Doctoral Dissertation Faculty of Economics and Business
Zagreb
139
Ponnu C H amp Okoth M O (2009) Corporate social responsibility disclosure in Kenya
The Nairobi Stock Exchange African Journal of Business Management 3(10)
601-608
Porter M E (1980) Competitive strategy New York The Free Press
Power L (1998) The missing link technology investment and productivity Review of
Economics and Statistics 80(2)300 ndash 313
Priem R L amp Butler J E (2001) Is the resource based view a useful perspective for
strategic management research Academy of Management Review 26(1) 22-40
Proctor S (1998) Philosophy and methods of research process the case of realism
Nurse Researcher 5 (4) 73 ndash 90
Richard P Divinney T M Yip G S amp Johnson G (1999) Measuring organizational
performance towards methodological best practice Journal of Management
35(2) 1340-1378
Richardson S (2006) Over-investment of free cash flow and corporate governance
Review of Accounting Studies 11 159-189
Robinson C amp Schumacker R E (2009) Interaction effects countering variance
inflation factor and interpretation issues Multiple Linear Regression View Points
35(1) 6-11
Rumelt R P (1991) How much does industry matter Strategic Management Journal
12(1) 167 185
Sagwa E V (2014) Human resource management practices and performance of firms
listed at the Nairobi Securities Exchange Unpublished PhD Thesis University of
Nairobi Kenya
140
Salaman G (1979) Work organizations resistance and control Longman London
Saunders M Lewis P amp Thornhill A (2007) Research methods for business students
(4th
ed) Prentice Hall Financial Times Harlow
Schmalensee R (1985) Do markets differ much American Economic Review 75 (1)
341-351
Shepherd W G (1986) On the core concepts of industrial economics in H W De Jong
and W G Shephert eds Mainstreams in Industrial Organization Dordrecht
Martinus Nijhoff Publishers
Singh M amp Davidson W N (2003) Agency costs ownership structure and corporate
governance mechanisms Journal of Banking and Finance 27 793-816
Smith C W amp Warner J B (1979) On financial contracting an analysis of bond
covenants Journal of Financial Economics 7(79) 117-161
Stalk G Evans P amp Schulman L E (1992) Competing on capabilities the new rules
of corporate strategy Harvard Business Review 70(1) 57-69
Stinchcombe A L (1965) Social structure and organizations Handbook of
organizations Rand McNally Chicago
Subrahmanyam A amp Titman S (2001) Feedback from stock prices to cash flows
Journal of Finance 56 (18) 2389-2413
Sundaram A K amp Inkpen A C (2004) Stakeholder theory and ldquothe corporate
revisitedrdquo a reply Journal of Organization Science 15 (3) 370-371
141
Szewczyk S H Tsetsekos G P amp Zantout Z (1996) The valuation of corporate RampD
expenditures evidence from investment opportunities and free cash flow Journal
of Financial Management 25 (1) 105-110
Tabachnick B G amp Fidell L S (2013) Using multivariate statistics (6 ed) Needham
Heights MA Allyn amp Bacon
Thakor R T (2013) Investment opportunities free cash flow and the market values of
foreign and domestic cash holdings Unpublished Working Paper Massachusetts
Institute of Technology
Thompson P amp McHugh D (2002) Work organizations a critical introduction (3rd
ed) Palgrave McMillan
Tirole J (1986) The theory of corporate finance Princeton University Press Princeton
NJ
Venkatraman N Ramanujam V (1986) Measurement of business performance in
strategy research a comparison of approaches The Academy of Management
Review 11(4) 801-814
Vogt S (1997) Cash flow and capital spending Evidence from capital expenditure
announcements Journal of Financial Management 26(2) 44 ndash 57
Waithaka S M Ngugi J K Aiyabei J K Itunga J K amp Kirago P (2012) Effects
of dividend policy on share prices a case of companies at the Nairobi Securities
Exchange Journal of Business Administration and Management 2 (8) 642-648
Wambua P (2013) Effects of agency costs on financial performance of companies listed at
the Nairobi Securities Exchange International Journal of Social Sciences and
Entrepreneurship 1 (5) 587-607
142
Wang G Y (2010) The impacts of free cash flows and agency costs on firm performance
Journal of Service Science and Management 3 408-418
Wernerfelt B (1984) A resource based view of the firm Strategic Management Journal
5(2) 171-180
Wernerfelt B amp Montgomery C A (1985) Tobinrsquos Q and importance of focus in firm
performance American Economic Review 78(1) 246-250
Williams B Onsman A amp Brown T (2012) Is the Australian paramedic a discipline or a
profession A national perspective International Journal of Paramedic Practice
1(5) 162-168
Williams J R (1992) How sustainable is your competitive advantage California
Management Review 34(1) 29-51
World Bank (2000) Corporate governance a framework for implementation A World Bank
Country Study Washington
Yin X amp Zajac E J (2004) The strategygovernance structure fit relationship theory and
evidence franchising arrangements Strategic Management Journal 25(7) 201-242
Wu A D amp Zumbo B D (2008) Understanding and using mediators and moderators
Social Indicators Research 87(3) 367
Zou S amp Stan S (1998) The determinants of export performance a review of the empirical
literature between 1987 and 1997 Journal of Marketing Review 15(5) 333-356
i
APPENDICES
Appendix I Firms Listed at the Nairobi Securities Exchange as at December 31
2015
NO SECTOR
A AGRICULTURAL
1 Eaagads Ltd
2 Kapchorua Tea Co Ltd
3 Kakuzi Ltd
4 Limuru Tea Co Ltd
5 Rea Vipingo Plantations Ltd
6 Sasini Ltd
7 Williamson Tea Kenya Ltd
B AUTOMOBILES AND ACCESSORIES
8 Car and General (K) Ltd
9 Sameer Africa Ltd
10 Marshalls (EA) Ltd
C BANKING
11 Barclays Bank Ltd
12 CFC Stanbic Holdings Ltd
13 IampM Holdings Ltd
14 Diamond Trust Bank Kenya Ltd
15 Housing Finance Co Ltd
16 Kenya Commercial Bank Ltd
17 National Bank of Kenya Ltd
18 NIC Bank Ltd
19 Standard Chartered Bank Ltd
20 Equity Bank Ltd
21 The Co-operative Bank of Kenya Ltd
D COMMERCIAL AND SERVICES
22 Nation Media Group
ii
23 Kenya Airways Ltd
24 Express Ltd
25 Standard Group Ltd
26 TPS Eastern Africa (Serena) Ltd
27 Hutchings Biemer Ltd
28 Uchumi Supermarket Ltd
29 Scangroup Ltd
30 Longhorn Kenya Ltd
E CONSTRUCTION AND ALLIED
31 Athi River Mining
32 Bamburi Cement Ltd
33 Crown Berger Ltd
34 EA Cables Ltd
35 EA Portland Cement Ltd
F ENERGY AND PETROLEUM
36 Kenol-Kobil Ltd
37 Total Kenya Ltd
FIRM AND SECTOR
38 KenGen Ltd
39 Kenya Power amp Lighting Co Ltd
40 Umeme Ltd
G INSURANCE
41 Jubilee Holdings Ltd
42 Pan Africa Insurance Holdings Ltd
43 Kenya Re-Insurance Corporation Ltd
44 Liberty Kenya Holdings Ltd
45 British-American Investments Company ( K) Ltd
46 CIC Insurance Group Ltd
H INVESTMENT
47 Olympia Capital Holdings Ltd
iii
48 Centum Investment Co Ltd
49 Trans-Century Ltd
50 Home Afrika Ltd
51 Kurwitu Ventures
I INVESTMENT SERVICES
52 Nairobi Securities Exchange Ltd
J MANUFACTURING AND ALLIED
53 BOC Kenya Ltd
54 British American Tobacco Kenya Ltd
55 Carbacid Investments Ltd
56 East African Breweries Ltd
57 Mumias Sugar Co Ltd
58 Unga Group Ltd
59 Eveready East Africa Ltd
60 Kenya Orchards Ltd
61 ABaumann CO Ltd
62 Flame Tree Group Holdings Ltd
K TELECOMMUNICATION AND TECHNOLOGY
63 Safaricom Ltd
iv
Appendix II Data Collection Form
Firm X (Indicate Firm name accordingly)
Part A FREE CASH FLOWS
Year
Net
Income
(PAT)
(a)
Depreciation
amp
Amortization
(b)
CAPEX
(crsquo)
Change
in non-
cash
working
capital
(d)
Net
borrowing
(ersquo)
Net
sales
(f)
FCF
= (a +
b ndash c -
d + e)
f
2006
2007
2008
2009
2010
2011
2012
2013
2014
2015
Non-cash working capital includes inventories financial assets held to maturity
receivables and prepayments (current assets) and payables accrued expenses and
current income tax liability (liabilities) For financial and investment firms non-cash
working capital includes prepaid lease rentals intangible assets deferred tax assets
retirement benefit assets and other assets (assets) and taxation payable dividends
payable deferred tax liabilities and retirement benefit liabilities
Net borrowings were determined by comparing current year and previous year long-
term loans
Net sales in case of insurance firms are the equivalent of ldquoNet premium revenuerdquo For
commercial banks it is ldquoTotal operating incomerdquo which is composed of net interest
v
income plus total non-interest income For investment firms it is ldquoIncomerdquo which is
comprised of rental income dividends and interest received and other incomes
PART B FINANCIAL PERFORMANCE
Year Equity Market Value (a) Equity Book Value (b) Tobinrsquos Q = a b
2006
2007
2008
2009
2010
2011
2012
2013
2014
2015
vi
PART C AGENCY COSTS
Year
1 Asset Utilization
Efficiency (AUE)
2 Production Cost Efficiency (PCE)
(a) Net
sales
(b) Total
assets
AUE
= ab
(c) Operating
expenses
(d) Net sales PCE=cd
2006
2007
2008
2009
2010
2011
2012
2013
2014
2015
Net sales in case of insurance firms are the equivalent of ldquoNet premium revenuerdquo For
commercial banks it is ldquoTotal operating incomerdquo which is composed of net interest
income plus total non-interest income For investment firms it is ldquoIncomerdquo which is
comprised of rental income dividends and interest received and other incomes
xii
PART D FIRM CHARACTERISTICS
Firm Size Firm Age
Year (a) Natural Log of Total Assets (b) Natural log of Age (Number of years
since incorporation)
2006
2007
2008
2009
2010
2011
2012
2013
2014
2015
Net sales in case of insurance firms are the equivalent of ldquoNet premium revenuerdquo For
commercial banks it is ldquoTotal operating incomerdquo which is composed of net interest
income plus total non-interest income For investment firms it is ldquoIncomerdquo which is
comprised of rental income dividends and interest received and other incomes