free sulfurous acid (fsa) inhibition of biological ...515128/uq515128_oa.pdf · 0 mg so3-s/l 50 mg...
TRANSCRIPT

Accepted Manuscript
Free sulfurous acid (FSA) inhibition of biological thiosulfate reduction (BTR) in thesulfur cycle-driven wastewater treatment process
Jin Qian, Lianlian Wang, Yaoguo Wu, Philip L. Bond, Yuhan Zhang, Xing Chang,Baixue Deng, Li Wei, Qin Li, Qilin Wang
PII: S0045-6535(17)30306-5
DOI: 10.1016/j.chemosphere.2017.02.117
Reference: CHEM 18880
To appear in: ECSN
Received Date: 10 November 2016
Revised Date: 20 February 2017
Accepted Date: 23 February 2017
Please cite this article as: Qian, J., Wang, L., Wu, Y., Bond, P.L., Zhang, Y., Chang, X., Deng, B.,Wei, L., Li, Q., Wang, Q., Free sulfurous acid (FSA) inhibition of biological thiosulfate reduction(BTR) in the sulfur cycle-driven wastewater treatment process, Chemosphere (2017), doi: 10.1016/j.chemosphere.2017.02.117.
This is a PDF file of an unedited manuscript that has been accepted for publication. As a service toour customers we are providing this early version of the manuscript. The manuscript will undergocopyediting, typesetting, and review of the resulting proof before it is published in its final form. Pleasenote that during the production process errors may be discovered which could affect the content, and alllegal disclaimers that apply to the journal pertain.

MANUSCRIP
T
ACCEPTED
ACCEPTED MANUSCRIPT
Graphical Abstract
0
5
10
15
20
25
30
35
40
45
6 7 8 9
Bio
logi
calS
2O32-
redu
cing
acti
vity
(mg
S 2O
32--S
/gV
SS/h
)
pH
0 mg SO3-S/L
50 mg SO3-S/L
100 mg SO3-S/L
150 mg SO3-S/L
200 mg SO3-S/L
0
5
10
15
20
25
30
35
40
0 50 100 150 200
Bio
logi
calS
2O32-
redu
cing
acti
vity
(mg
S 2O
32--S
/gV
SS/h
)
Saline sulfite concentration (mg S/L)
pH=6.0
pH=7.0
pH=8.0
pH=9.0
y = -2.442ln(x) - 4.373R² = 0.9533
0
5
10
15
20
25
30
35
40
0 0.005 0.01 0.015 0.02
Bio
logi
calS
2O32-
redu
cing
acti
vity
(mg
S 2O
32--S
/gV
SS/h
)
FSA concentration (mg H2SO3-S/L)
50 mg SO32--S/L
100 mg SO32--S/L
200 mg SO32--S/L
150 mg SO32--S/L
0 mg SO32--S/L
a b
c

MANUSCRIP
T
ACCEPTED
ACCEPTED MANUSCRIPT
1
Free Sulfurous Acid (FSA) Inhibition of Biological Thiosulfate Reduction (BTR) in the 1
Sulfur Cycle-driven Wastewater Treatment Process 2
3
Jin Qiana,b,c,*, Lianlian Wanga, Yaoguo Wua, Philip L Bondg, Yuhan Zhanga, Xing Changa, 4
Baixue Denga, Li Weid, Qin Lie,f, Qilin Wange,g* 5
6
aDepartment of Applied Chemistry, School of Natural and Applied Sciences, Northwestern 7
Polytechnical University, NO. 127 West Youyi Road, Xi’an 710072, China 8
bState Key Laboratory of Geohazard Prevention and Geoenvironment Protection, Chengdu 9
University of Technology, China 10
cResearch Center for Ecology and Environmental Sciences, Northwestern Polytechnical 11
University, NO. 127 West Youyi Road, Xi’an 710072, China 12
dState Key Laboratory of Urban Water Resource and Environment, Harbin Institute of 13
Technology, Harbin 150090, China 14
eGriffith School of Engineering, Griffith University, Nathan Campus, QLD 4111, Australia 15
fQueensland Miro- and Nanotechnology Centre, Griffith University, Nathan, QLD 4111, 16
Australia 17
gAdvanced Water Management Centre (AWMC), The University of Queensland, QLD 4072, 18
Brisbane, Australia 19
20
*Corresponding authors: 21
E-mail: [email protected] (Q. Wang); Tel.: +61 7 33463229; Fax: +61 7 33654726 22

MANUSCRIP
T
ACCEPTED
ACCEPTED MANUSCRIPT
2
E-mail: [email protected] (J. Qian) 23
24
Abstract: A sulfur cycle-based bioprocess for co-treatment of wet flue gas desulfurization 25
(WFGD) wastes with freshwater sewage has been developed. In this process the removal of 26
organic carbon is mainly associated with biological sulfate or sulfite reduction. Thiosulfate is a 27
major intermediate during biological sulfate/sulfite reduction, and its reduction to sulfide is the 28
rate-limiting step. In this study, the impacts of saline sulfite (the ionized form: HSO3- + SO3
2-) 29
and free sulfurous acid (FSA, the unionized form: H2SO3) sourced from WGFD wastes on the 30
biological thiosulfate reduction (BTR) activities were thoroughly investigated. The BTR activity 31
and sulfate/sulfite-reducing bacteria (SRB) populations in the thiosulfate-reducing up-flow 32
anaerobic sludge bed (UASB) reactor decreased when the FSA was added to the UASB influent. 33
Batch experiment results confirmed that FSA, instead of saline sulfite, was the true inhibitor of 34
BTR. And BTR activities dropped by 50% as the FSA concentrations were increased from 35
8.0×10⁻⁸ to 2.0×10⁻⁴ mg H2SO3-S/L. From an engineering perspective, the findings of this study 36
provide some hints on how to ensure effective thiosulfate accumulation in biological 37
sulfate/sulfite reduction for the subsequent denitrification/denitritation. Such manipulation 38
would result in higher nitrogen removal rates in this co-treatment process of WFGD wastes with 39
municipal sewage. 40
41
Key words: biological thiosulfate reduction (BTR); sulfate/sulfite-reducing bacteria (SRB); 42
saline sulfite (HSO3- + SO3
2-); free sulfurous acid (FSA, H2SO3) 43
44

MANUSCRIP
T
ACCEPTED
ACCEPTED MANUSCRIPT
3
1. Introduction 45
Sulfur bioconversion-associated sewage treatment processes have been reported extensively in 46
the last two decades, among which biological sulfate reductions (BSR) and biological reduced 47
sulfur (i.e. sulfide, thiosulfate, elemental sulfur, etc) oxidations (BSO) play an essential role in 48
the removal of organics and nitrogen respectively (Lens et al., 1998; Cardoso et al., 2006; 49
Manconi et al., 2007; Mora et al., 2014). By linking BSR with BSO and based on the sulfur 50
sources from wet flue gas desulfurization (WFGD) wastes, an integrated process for 51
co-treatment of fresh sewage and WFGD wastes has been developed (Qian et al., 2013). This 52
co-treatment process mainly depends on the sulfur bioconversions from sulfate/sulfite (alkaline 53
absorption of WFGD wastes) reduction to sulfide/thiosulfate, followed by sulfide/thiosulfate 54
oxidation to sulfate (see Fig. S1 in Supporting Information for schematic diagram of the 55
co-treatment process). Due to the low biomass yields of the bacteria involved in this process, i.e. 56
sulfate/sulfite-reducing bacteria (SRB), sulfur oxidizing-denitrifying bacteria and autotrophic 57
nitrifying bacteria, the sludge production rate is only 0.03 to 0.09 g MLVSS/g COD (Jiang et al., 58
2013; Qian et al., 2015a) (MLVSS: mixed liquor volatile suspended solids; COD: chemical 59
oxygen demand), and this results in energy savings and reduction in greenhouse gas emission 60
during the sludge treatment. 61
62
In this co-treatment process, sulfite produced from the WFGD wastes is one of the major sulfur 63
compounds for biological energy conversions. However, negative effects of sulfite in both 64
ionized form (saline sulfite: SO32- + HSO3
-) and unionized forms (free sulfurous acid, FSA: 65
H2SO3) on microorganisms including SRB have been reported. Previous studies have found that 66
MANUSCRIP
T
ACCEPTED
ACCEPTED MANUSCRIPT
4
saline sulfite inhibition on sulfate/sulfite reduction occurs at concentrations as low as 16 mg S/L 67
(Weijma et al., 2000). Zan et al. (2016) recently demonstrated that FSA from 0.002 to 1 mg 68
H2SO3-S/L instead of saline sulfite directly causes the lysis of microorganisms. This implies that 69
FSA, rather than saline sulfite, is the factor exerting the antimicrobial effect on SRB. 70
71
During biological sulfate/sulfite reduction, thiosulfate (i.e. S2O32-) is an important intermediate 72
and its reduction to sulfide is the rate-limiting step during the biological SO42-/SO3
2- reaction 73
(Brunner and Bernasconi, 2005) (see Fig. S2). Additionally, thiosulfate is important in sulfur 74
dependent denitrification as its oxidation is reported to drive denitrification 4-8 times faster than 75
oxidation by sulfide (Cardoso et al., 2006). Therefore, it is important to understand the potential 76
effects of saline sulfite and FSA on these important thiosulfate transformations, including that of 77
biological thiosulfate reduction (BTR). This insight will determine the role of saline sulfite and 78
FSA in this sulfur cycle-based treatment of WFGD wastes as well as to shed light on how to 79
maintain effective S2O32- accumulation for high nitrogen removal in the subsequent 80
S2O32--driven denitrification/denitritation. To the best of the authors’ knowledge, although the 81
effects of saline sulfite and FSA effects on microbial inactivation (Chang et al., 1997), biological 82
SO42-/SO3
2- reduction (Weijma et al., 2000) and sludge treatment (Zan et al., 2016) have been 83
examined, no detailed investigations of the effects of saline sulfite and FSA on BTR have been 84
carried out so far. 85
86
This study aims to thoroughly explore the effects of saline sulfite and FSA on BTR. Long-term 87
impacts of saline sulfite and FSA on BTR activities as well as microbial community structures 88

MANUSCRIP
T
ACCEPTED
ACCEPTED MANUSCRIPT
5
were investigated during the co-treatment process of WFGD wastes with sewage in an up-flow 89
anaerobic sludge bed (UASB) reactor. Batch experiments were conducted and the quantitative 90
relationship between the BTR activities and FSA concentrations were determined. The findings 91
of this study also identified strategies on how to achieve S2O32- accumulation during biological 92
SO42-/SO3
2- reduction, which is then utilized for high nitrogen removal in the co-treatment 93
process. 94
95
2. Materials and Methods 96
2.1 UASB reactor setup and operation 97
A UASB reactor with an effective reactor volume of 1.0 L (height: 51 cm, diameter: 5 cm) was 98
established (Fig. S3). The seeding sludge for the UASB reactor was from a lab-scale biological 99
sulfate reduction–sequential batch reactor (SBR) (see Table S1 for detailed operating conditions). 100
At which time the SBR was at steady state achieving at least 90% sulfate and organic carbon 101
removal. 500 mL of mixed liquor sludge was taken from this SBR reactor and added to the 102
UASB reactor, resulting in an initial MLVSS concentration of 4300 mg/L. Although the typical 103
COD values of municipal sewage in Mainland China and Hong Kong are between 300 and 400 104
mg/L (equivalent to about 150 to 200 mg SO42--S/L), 200 mg COD/L was employed for the 105
UASB reactor’s influent as the electron accepting capacity of S2O32- is only half of that of SO4
2-. 106
The temperature of UASB reactor was kept at 25±1oC in an air conditioned room and its 107
hydraulic retention time (HRT) was maintained at 4 h during the operation. The internal 108
recirculation flow rate was maintained at three times the influent flow rate, this ensured effective 109
mass transfer between the bulk liquid and the biomass. 110
MANUSCRIP
T
ACCEPTED
ACCEPTED MANUSCRIPT
6
111
The reactor was continuously operated for 181 days consisting of 5 stages during which the 112
same influent organic carbon (200 mg COD/L, sodium acetate was used as the sole organic 113
source) and thiosulfate (220 mg S/L) concentrations were maintained, but varying pH (7.0-8.5), 114
influent saline sulfite (0-150 mg S/L) and influent FSA concentrations (0-6.0×10⁻⁴ mg S/L) were 115
applied. The detailed experimental conditions for each stage are shown in Table S2. Overall, 116
Stage I (Day 1 to Day 21) was to evaluate the BTR performance of the UASB reactor at pH 7.0 117
in the absence of added saline sulfite and FSA. Stages II- IV were to examine the effect of saline 118
sulfite and FSA on the BTR in the UASB reactor. The different FSA concentrations in Stages 119
II-IV were obtained by varying the pH and Na2SO3 concentrations (see Table S2). The operating 120
conditions of the UASB reactor at Stage V were the same as those at Stage I. This was to 121
determine whether the inhibited BTR, caused by the saline sulfite and FSA, could be recovered 122
after removal of the influent saline sulfite and FSA. 123
124
During the UASB reactor’s operation, samples of both the influent and effluent were regularly 125
drawn for analyses of COD, sulfide, saline sulfite and thiosulfate. Sludge samples were taken 126
periodically from the bottom, middle, and top of the reactor to determine the mixed liquor 127
suspended solids (MLSS)/MLVSS concentration. In addition, microbial community structures 128
of the sludge were analyzed at the end of Stages I (Day 21), III (Day 97) and V (Day 181) 129
during the UASB reactor operation. 130
131
2.2 Batch Tests 132
MANUSCRIP
T
ACCEPTED
ACCEPTED MANUSCRIPT
7
Three sets of batch tests were performed to evaluate the effect of saline sulfite and FSA and 133
reveal the true inhibitor on BTR. These were performed on sludge taken from the 134
abovementioned UASB reactor at the end of its operation (Stage V). For each batch test, the 135
sludge was washed, using a synthetic wastewater (Table S3), three times to remove the 136
background substrate (i.e. acetate, thiosulfate and sulfide, etc). 2 L serum flasks were used as the 137
batch reactors for all the tests. Nitrogen gas was purged into each batch reactor before the assay 138
for half an hour to exclude oxygen and maintain anaerobic conditions. Afterwards, all reactor 139
flasks were sealed tightly with butyl rubber stoppers and aluminum crimp seals. The reactors 140
were well mixed with magnetic stirrers at 150 rpm. The temperature of each reactor was kept at 141
25±1 oC in an air-conditioned room. Sodium acetate was used as the sole organic carbon source. 142
In order to exclude the possible influence of generated S2-/H2S on BTR activity (O’Flaherty et 143
al., 1998), an FeCl2 solution, at 200 mg Fe2+/L was added to each reactor for all the tests 144
(O’Flaherty et al., 1998). During the batch experiments, the mixed liquor was sampled regularly 145
for the analysis of thiosulfate, saline sulfite and FSA. 146
147
2.2.1 Batch Test I: BTR under different pH conditions in the absence of saline sulfite and FSA 148
Batch test I was conducted to evaluate the effect of pH on BTR in the absence of added saline 149
sulfite and FSA. The pH in four reactors (i.e. Batch reactors 1–4) was adjusted to 6.0, 7.0, 8.0 150
and 9.0, respectively, by addition of Na2HPO4/NaH2PO4 buffer solution, as shown in Table S4. 151
Initial acetate and S2O32- concentrations were 200 mg COD/L and 200 mg S/L, respectively, by 152
addition of sodium acetate and Na2S2O3 stock solutions. The batch tests lasted for 24 h. 153
154

MANUSCRIP
T
ACCEPTED
ACCEPTED MANUSCRIPT
8
2.2.2 Batch Test II: Examine the overall effects of saline sulfite and FSA on BTR activities 155
Batch Test II was carried out to investigate the overall effects of both saline sulfite and FSA on 156
the BTR activities. The same amount of thiosulfate (200 mg S/L) was added into the four batch 157
reactors (i.e. Batch Reactors 5–8, see Table S4). The saline sulfite and FSA concentrations were 158
50~200 mg S/L, and 2.0×10⁻⁴ ~8.0×10⁻⁴ mg H2SO3-S/L, respectively (see Table S4). The pH in 159
each reactor was controlled at 7.0±0.1 using the Na2HPO4/NaH2PO4 buffer solution. The batch 160
tests lasted for 24 hours. 161
162
2.2.3 Batch Test III: BTR under different FSA levels 163
To explore the correlation between FSA concentration and BTR activities, Batch Test III was 164
also conducted by changing the pH and initial Na2SO3 concentrations, according to Eqs. (1) and 165
(2). Different amounts of Na2SO3 (i.e. 50~200 mg S/L) and different pH levels (i.e. 6.0~9.0) 166
were applied to the six batch reactors (i.e. Batch Reactor 9–14) in this test, resulting in the 167
different initial FSA concentrations (i.e. 8.0×10⁻⁸~0.015 mg S/L) in each batch reactor. Detailed 168
information of each batch reactor test is shown in Table S4. The batch tests lasted for 24 h. 169
170
H2SO3 ⇄ HSO3- + H+ pKa1 = 1.91 at 25 0C Eq. (1) 171
HSO3- ⇄ SO3
2- + H+ pKa2 = 7.0 at 25 0C Eq. (2) 172
173
2.3 Sampling and Chemical/Physical Analysis 174
Mixed liquor samples from the batch reactors were taken periodically using a 10-mL syringe 175
and these were immediately filtered through disposable Millipore filters (0.22 µm pore size). 176
MANUSCRIP
T
ACCEPTED
ACCEPTED MANUSCRIPT
9
Saline sulfite concentrations were determined by titration after sample pretreatment as detailed 177
in Qian et al. (2015a). Thiosulfate and acetate were detected with an ion chromatograph 178
(DIONEX-900). Sulfide was measured by the methylene blue method after sample pretreatment 179
with NaOH and ZnAc (APHA, 2005). MLSS/MLVSS were measured according to the Standard 180
Method (APHA, 2005). pH and temperature were monitored using a multi-meter electrode 181
during each test (PHSJ-4F). 182
183
As thiosulfate is an intermediary compound in biological sulfite reduction, BTR activity cannot 184
be directly derived from the profile of S2O32- concentration versus time. In this study, the BTR 185
activity was represented by the rate of thiosulfate utilization (derived from the profile of S2O32- 186
concentration versus time) plus the biological sulfite reduction rate (derived from the profile of 187
saline sulfite concentration versus time) and expressed as kg S2O32--S/d/m3 in the UASB reactor 188
and mg S2O32--S/g MLVSS/h in the batch reactor, respectively. 189
190
2.4 Microbial analysis 191
Sludge samples from the UASB reactor were collected at the end period of Stages I (Day 21), III 192
(Day 97) and V (Day 181) to analyze the structure of microbial communities. The samples were 193
collected by centrifugation under 12,000 rpm for 10 minutes. Around 0.5 g of sludge pellet was 194
stored for each sample at −80 °C until the DNA extractions were performed. Genomic DNA was 195
extracted using the PowerSoil DNA Isolation Kit (MoBio Laboratories, Inc., Carlsbad, CA) 196
following the manufacturer’s protocols. The quality and quantity of DNA were checked with a 197
NanoDrop device (ND-1000, thermo Fisher, USA). 198
MANUSCRIP
T
ACCEPTED
ACCEPTED MANUSCRIPT
10
199
The primer pair 515 F and 926 R targeting the hypervariable V1 and V3 regions was used to 200
amplify the bacterial 16S rRNA gene (Quince et al., 2011). Barcode sequences were 201
incorporated between the 454 adaptor and the forward primer (Table S5). Each 100 µL PCR 202
reaction mixture contained 5 U of Pfu Turbo DNA polymerase (Stratagene, La Jolla, CA, USA), 203
1× Pfu reaction buffer, 0.2 µM of dNTPs (TaKaRa, Dalian, China), 0.1 µM of each primer and 204
20 ng of genomic DNA template. PCR was performed on a thermal cycler (Bio-Rad, USA) with 205
the cycles including an initial denaturation at 94°C for 5min, followed by 30 cycles of 94°C for 206
30s, 53°C for 30s and 72°C for 45s; and a final extension at 72 °C for 10 min. PCR products 207
were purified using Agarose Gel DNA Purification Kit (TaKaRa, China) and quantified with the 208
NanoDrop device. The purified PCR amplicons were sequenced using the ROCHE 454 FLX 209
Titanium platform (Roche, Basel, Switzerland) at the National Human Genome Centre of China 210
(Shang Hai, China). Analysis of the sequences obtained followed the procedures reported in 211
Qian et al. (2015b). 212
213
3. Results and Discussion 214
3.1 UASB reactor performance under different operating conditions 215
In Stage I, as the sulfur source was transformed from sulfate (for the sludge cultivation) to 216
thiosulfate in the UASB reactor, thiosulfate reduction efficiency (65%) and organic carbon 217
removal efficiency (60%) were low initially (Fig. 1a and b). However, the sulfide generation 218
became stable at the end of Stage I and reached 185 mg S/L in the UASB effluent (Fig. 1a), 219
indicating approximately 84% (185/220×100%) thiosulfate was converted to sulfide and the 220

MANUSCRIP
T
ACCEPTED
ACCEPTED MANUSCRIPT
11
BTR rate was 1.11 kg S2O32--S/d/m3. Correspondingly, the effluent COD concentrations 221
stabilized at around 18 mg /L after 16 days, corresponding to a COD removal efficiency of 90% 222
through BTR (Fig. 1b). 223
224
(Position for Fig. 1) 225
226
During the UASB reactor operation Stage II the influent contained 50 mg S/L of Na2SO3 (pH 227
7.0, equivalent to 2.0×10⁻⁴ mg FSA-S/L). It was seen that the effluent sulfide concentration 228
decreased from 185 mg S/L in Stage I to 120 mg S/L in Stage II (Fig. 1a) and the BTR rate 229
decreased from 1.11 to 0.93 kg S2O32--S/d/m3. At the same time, the COD removal efficiency 230
dropped immediately and stabilized at about 75%. This implied an inhibitory effect of saline 231
sulfite and FSA on the BTR. As the influent Na2SO3 concentration was increased to 150 mg S/L 232
(FSA at 6.0×10⁻⁴ mg S/L), sulfide generation in UASB reactor’s effluent dropped from 185 mg 233
S/L (in Stage I without FSA) to 99 mg S/L in Stage III. In Stage III the BTR rate had also 234
dropped to 0.8 kg S2O32--S/d/m3, which was only 72% of that in Stage I. As well, the COD 235
removal efficiency continued to drop to 65% (Fig. 1b). In Stage IV, the UASB reactor’s influent 236
pH was raised to 8.5 and the influent Na2SO3 concentration was kept at 150 mg S/L, 237
corresponding to a lowered FSA concentration of 1.2×10⁻⁶ mg FSA-S/L. In this stage, sulfide 238
generation, thiosulfate reduction as well as organic carbon removal were restored to some extent. 239
As shown in Fig. 1a and b, there were increases in the BTR rate to 0.96 kg S2O32--S/d/m3, the 240
effluent sulfide concentration to 157 mg S/L and the organic carbon removal efficiency to about 241
80%. Therefore, in addition to the Na2SO3 concentration, pH may also play a role in the BTR 242
MANUSCRIP
T
ACCEPTED
ACCEPTED MANUSCRIPT
12
activity, suggesting that the combined effects of pH and Na2SO3 (i.e. FSA) might be the true 243
inhibitor on the BTR activity in the UASB reactor. 244
245
At Stage V, the operating conditions of the UASB reactor were fully restored to those of Stage I. 246
After 20 days into Stage V it was seen that the BTR rate (1.06 S2O32--S/d/m3), sulfide generation 247
(174 mg S/L) and the COD removal efficiency (89%) in UASB reactor were comparable with 248
those in Stage I (Fig. 1). Thus, indicating the biomass activity in the UASB reactor had 249
recovered after eliminating the saline sulfite/FSA addition to the influent. 250
251
3.2 Microbial community shift in UASB reactor 252
9812, 8174 and 9578 quality sequence reads of the 16S rRNA gene (with an average read length 253
of 374 bp) were obtained from the UASB reactor at the end of Stages I, III and V respectively 254
(Fig. 2a). The sequences were clustered into 564, 959 and 670 operational taxonomic units for 255
the three tested sludge samples in Stage I, III and V respectively (Table S6). 256
257
(Position for Fig. 2) 258
259
Excluding the unclassified Bacteria, altogether, 9 bacterial phyla were recovered from the three 260
sludge samples. The majority of the sequences belong to the Firmicutes, Proteobacteria and 261
Bacteroidetes phyla (Fig. 2b). However, at the phylum level microbial community changes are 262
not obvious between the stages with and without the FSA addition to the reactor’s influent. 263
Therefore, the microbial communities were analyzed at the class and genus levels (Fig. 2c and 264

MANUSCRIP
T
ACCEPTED
ACCEPTED MANUSCRIPT
13
d). The sequences were further classified into 17 classes (Fig. 2c), and in all three stages, the 265
dominant classes were Bacilli, Deltaproteobacteria and Clostridia. However, variation of 266
abundances of the classes was detected between the different Stages, with the 267
Deltaproteobacteria having the most significant shifts. As most of the functional SRB genera 268
belong to the class Deltaproteobacteria (Castro et al., 2000), it is possible that this relates to 269
variation of the SRB populations corresponding to the absence and presence of FSA. 270
271
Within the microbial community analysis at the genus level, four to five types of recognized 272
SRB were detected at different levels in each stage, with Desulfomicrobium and Desulfobulbus 273
as the most two abundant genera (see Fig. 2d and Table S7). Species of these two genera can 274
reduce S2O32- to HS-/S2- coupled with the oxidation of organic substrates that include lactate, 275
pyruvate, glycerol and acetate (Barton and Hamilton, 2007; Widdel, 1998; Brenner et al., 2005). 276
These are also previously reported to be the dominant SRB groups in both sulfate and/or 277
sulfite-reducing UASB reactors (Jiang et al., 2013; Qian et al, 2015b). In Stage I, with 278
thiosulfate as the sole sulfur source, the total SRB population accounts for 42.6% at the genus 279
level, of which Desulfomicrobium and Desulfobulbus make up 21.5 and 20.6%, respectively (see 280
Fig. 2d). The enrichment of SRB in Stage I supports the high BTR and COD removal rate in 281
UASB reactor without FSA and saline sulfite (Fig. 1a and b). When the reactor influent was 282
supplemented with FSA at 6.0×10⁻⁴ mg S/L in Stage III, the total SRB abundance sharply 283
decreased to 7.1% at the genus level. The levels of two major SRB genera, i.e. Desulfobulbus 284
and Desulfomicrobium dropped to 3.4 and 0.8%, respectively. The small SRB population in 285
Stage III corresponds to the low BTR activity (Fig. 1a and b). In Stage V, when FSA addition 286
MANUSCRIP
T
ACCEPTED
ACCEPTED MANUSCRIPT
14
was excluded, there was a recovery period according to performance that lasted for around 60 287
days (from Day 122 to Day 181). During that stage the SRB population rebounded to 33.1%, 288
and this corresponded to the recovered BTR activity (see Fig. 1a and b). After this recovery, the 289
Desulfomicrobium and Desulfobulbus levels rose to 21.1% and 11.6%, respectively. Based on 290
the changes of microbial community and reactor performance at the different Stages, these 291
strongly implicate a negative affect of FSA and saline sulfite on the SRB population. 292
293
Typically, in a sulfur reducing reactor operating for municipal sewage treatment, fermentation of 294
organic compounds is an essential microbial process (Jiang et al., 2013). Although the single 295
and simple organic compound (acetate, which is not fermentable) was utilized as electron donor 296
and energy source in this study, certain levels of typical fermenting genera were still detected in 297
the reactor communities (Fig. 2d). The most possible reason should be the sludge lysis to some 298
extent as no sludge was purposely taken during the whole operation period. The organic 299
products from cell lysis (the reactor had a long sludge retention time) and extracellular 300
polymeric substances could contribute the fermentable substrates in the reactor (Wang et al., 301
2013, 2014). High abundance of Trichoccocus, a well-known fermenting bacteria (Liu et al., 302
2002), was detected at 16.9% in Stage III (see Table S7), compared with 0.67 and 6.62% in 303
Stages I and V. Thus, suggesting higher levels of fermentation occurred when FSA was added in 304
Stage III, and possibly this was due to increased cell lysis caused by FSA, as has been reported 305
for sludge treatment previously (Zan et al., 2016). 306
307
3.3 Effects of pH on the BTR 308

MANUSCRIP
T
ACCEPTED
ACCEPTED MANUSCRIPT
15
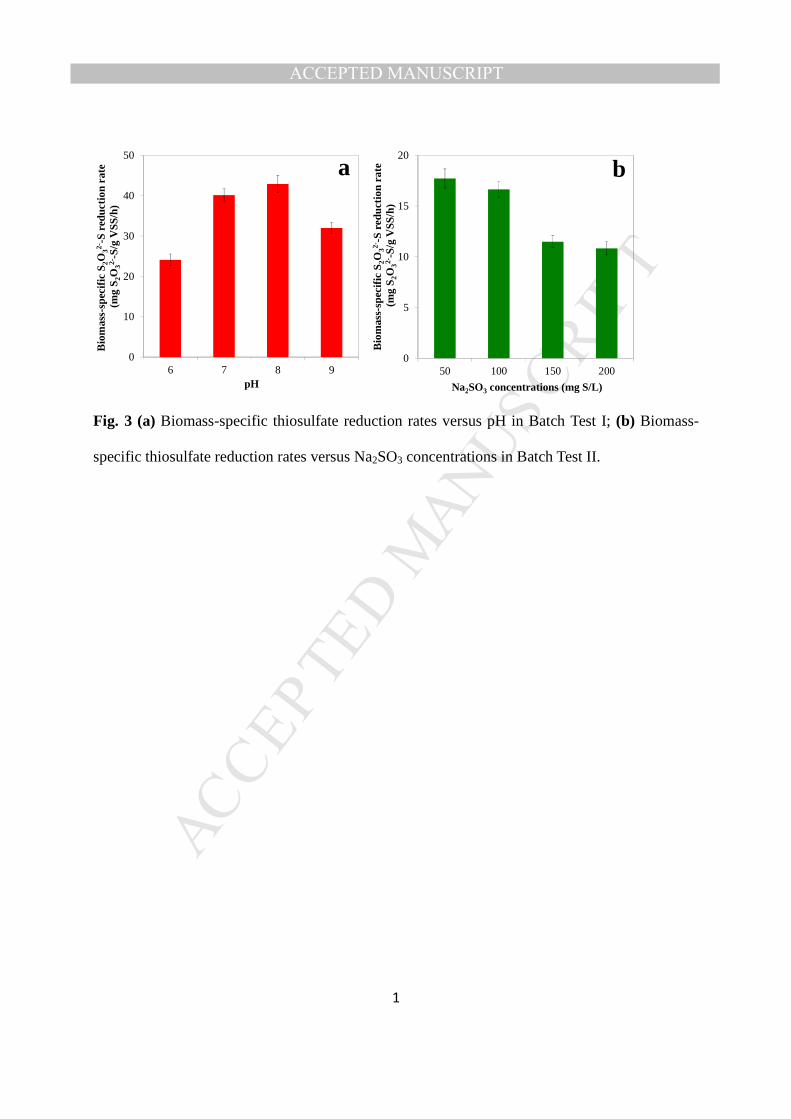
In Batch Test I the BTR activities were determined at different pH in the absence of saline 309
sulfite and FSA (Fig. 3 and Fig. S4a). The BTR activity peaked at between 40 to 43 mg 310
S2O32--S/g MLVSS/h at pH 7.0 and 8.0 (see Fig. 3a). This activity was 1.7 and 1.3 times that at 311
pH 6.0 and 9.0 respectively. Also, this pH related trend is the same as that detected for biological 312
co-sulfate/sulfite reduction where the reducing activity is also highest between pH 7.0 and 8.0 313
(Qian et al., 2015c). Consequently, this finding supports the notion that thiosulfate reduction is 314
the rate-limiting step in biological sulfate/sulfite reduction. 315
316
(Position for Fig. 3) 317
318
3.4 The effects of saline sulfite and FSA concentrations on BTR 319
The effects of different Na2SO3 (that includes both saline sulfite and FSA) concentrations (50 to 320
200 mg S/L) on the BTR activity were examined in Batch Test II when the pH was controlled at 321
7.0 (Fig. 3b). It was seen that the highest biomass-specific thiosulfate reduction rate of 17.7 mg 322
S2O32--S/g MLVSS/h was achieved with the lowest initial addition of Na2SO3 (50 mg S/L) and 323
the activity continually lower when the higher initial Na2SO3 concentrations were added. Such 324
that the biomass-specific S2O32- reducing rate dropped by 39% when the Na2SO3 concentration 325
increased from 50 mg S/L to 200 mg S/L (Fig. 3b). Therefore, the results of this test confirm that 326
Na2SO3 consists of saline sulfite and FSA played a role in the inhibition of the BTR activity. 327
328
3.5 Correlation between FSA (H2SO3) and BTR activity 329

MANUSCRIP
T
ACCEPTED
ACCEPTED MANUSCRIPT
16
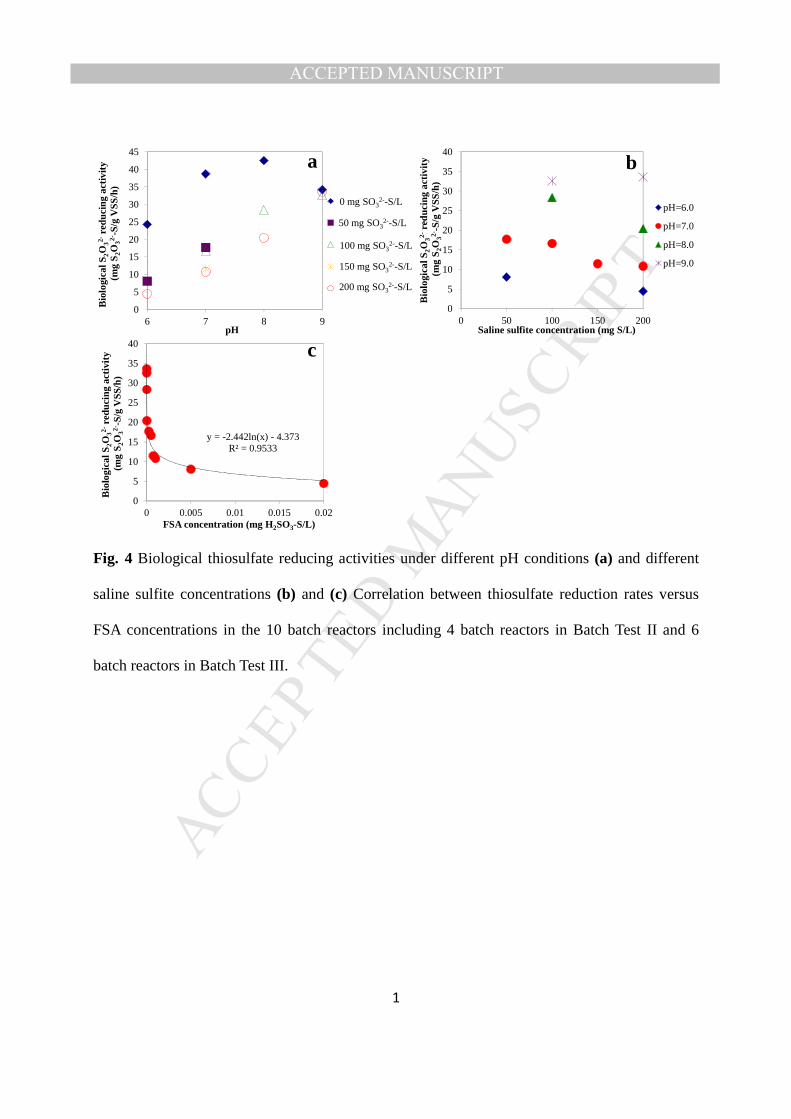
The BTR rates under different FSA levels were examined in Batch Test III. Both the pH and 330
Na2SO3 concentrations were varied in each reactor in this test (Table S4). Based on the results 331
from Batch Tests I, II and III, we examined for the correlations between BTR activity versus pH 332
(Fig. 4a), BTR activity versus saline sulfite concentration (Fig. 4b) and BTR activity versus FSA 333
concentration (Fig. 4c). As confirmed in Batch Test I, the pH really impacts the BTR activity, 334
but the correlation between pH and BTR activity is not strong in the presence of Na2SO3 (Fig. 335
4a). At the same pH level, lower activity was observed at higher Na2SO3 concentrations. 336
Generally, as the saline sulfite concentration increased, the BTR activity was reduced. However, 337
this relationship also depends on pH (Fig. 4b). For example, with initial concentration of 200 mg 338
S/L saline sulfite, the BTR activity varied from 4.4 to 33.6 mg S2O32--S/g MLVSS/h as the pH 339
changed from 6.0 to 9.0. Therefore, the correlation between BTR and saline sulfite 340
concentrations is also not strong. These observations imply that saline sulfite and pH jointly 341
cause the inhibitory effect on thiosulfate reduction. 342
343
(Position for Fig. 4) 344
345
It was seen that the level of inhibition of the BTR had a strong correlation with the FSA 346
concentration, indicating that FSA may be directly causing the inhibition (Fig. 4c). The 347
inhibitory effect of FSA on the BTR was well described by an exponential function (Fig. 4c). 348
The BTR activity decreased significantly with the increased FSA concentration even in the very 349
low range of 0~1.5×10⁻⁵ mg H2SO3-S/L. The BTR activity decreased by 50% as FSA 350
concentrations increased from 8.0×10⁻⁸ (Na2SO3 concentration of 100 mg S/L at pH 9.0) to 351

MANUSCRIP
T
ACCEPTED
ACCEPTED MANUSCRIPT
17
2.0×10⁻⁴ mg H2SO3-S/L (equivalent to a Na2SO3 concentration of 50 mg S/L at pH 7.0). When 352
the FSA concentration increased from 8.0×10⁻⁸ (100 mg Na2SO3-S/L at pH 9.0) to 0.015 mg S/L 353
(200 mg Na2SO3-S/L at pH 6.0), the BTR activity was inhibited by 90%. Consequently, these 354
results suggest that FSA alone rather than saline sulfite or pH, is the true inhibitor of the BTR. 355
356
3.6 Toxicity and inhibition of FSA to microorganisms 357
Sulfite, either in the ionized form (saline sulfite: SO32- + HSO3
-) or unionized form (FSA: 358
H2SO3), is characterized as having potential toxicity to microbial metabolism. Its negative 359
effects are suggested to be through damaging the biomacromolecules such as proteins, lipids and 360
DNA (Armentia-Alvarez et al., 1993; Shi and Mao, 1994; Trotter and Grant, 2002; Pena-Egido 361
et al., 2005), thus leading to the inhibition of microbial activity and growth. Other studies show 362
that after exposure of microorganisms to sulfite, the cellular ATP levels are lowered and cell 363
destruction is observed (Schimz and Holzer, 1979; Hinze and Holzer, 1986; Maier et al., 1986; 364
Prakash et al., 1986). In addition, Park and Hwang (2008) provided the evidence that the 365
addition of saline sulfite/FSA represses the expression of genes involved in transcription, protein 366
biosynthesis and cell growth. 367
368
Other studies also show that the antimicrobial action of saline sulfite/FSA is found to be the 369
greatest at low pH (Ough, 1993; Wedzichab, 1984), further adding support that H2SO3 (FSA) is 370
the true antimicrobial agent rather than saline sulfite. The precise mechanisms of how FSA 371
causes its antimicrobial effect is yet to be determined. The presence of FSA could change the 372
structure of the cell membrane (Jiang et al., 2015), enter the cell and damage intracellular 373

MANUSCRIP
T
ACCEPTED
ACCEPTED MANUSCRIPT
18
components (Stratford and Morgan, 1987), and/or possibly directly cause cell lysis (Zan et al., 374
2016). 375
376
3.7 Implications of this study 377
Thiosulfate, as an intermediate of biological sulfate/sulfite reduction, is an effective electron 378
donor for chemolithoautotrophic denitrification. Unlike the end product of biological 379
sulfate/sulfite reduction, i.e. sulfide, thiosulfate is not reported to be toxic to microorganisms 380
including the denitrifying bacteria (Cardoso et al., 2006). So use of thiosulfate as the electron 381
donor in a wastewater treatment system could induce a high nitrogen removal rate as well as 382
lead to a low sludge yield. Recently, we developed a “nitritation coupled with thiosulfate-driven 383
denitritation (Nitritation-TDD)” process, that achieved a high biological ammonia-nitrogen 384
removal rate of 0.43 kg NH3-N/d/m3 (Qian et al., 2016). To facilitate the application of the 385
Nitritation-TDD process, a key point is to ensure adequate thiosulfate is generated as thiosulfate 386
is generally not directly available from the wastewater. This study on FSA inhibition of BTR 387
provides some hints on how to obtain thiosulfate accumulation in a biological sulfate/sulfite 388
reducing reactor’s effluent. By utilizing the inhibitory potential of FSA on BTR, an optimized 389
sulfur cycle-driven biological process with three short-cut bioreactions is proposed here: 1) 390
biological sulfate/sulfite reduction to thiosulfate (SO42-/SO3
2- → S2O32-,) 2) denitritation with 391
thiosulfate as the electron donor (S2O32- + NO2
- → SO42- + N2↑) and 3) nitritation (NH3 → 392
NO2-). Consequently, this will result in higher nitrogen removal rates and lower sludge yields. 393
The study to achieve this optimized process for co-treatment of wet flue gas desulfurization 394
wastes with freshwater sewage is required and will be carried out in the near future. 395

MANUSCRIP
T
ACCEPTED
ACCEPTED MANUSCRIPT
19
396
4. Conclusions 397
The effects of FSA on biological thiosulfate reduction in a sulfur cycle-driven wastewater 398
treatment process were examined in this study. It was concluded that FSA, instead of saline 399
sulfite, is the true inhibitor of biological thiosulfate reduction. Based on the microbial 400
community analysis, the abundance of the SRB population in the thiosulfate-reducing UASB 401
reactor was sharply decreased from 46.2 to 7.1% at genus level when FSA was added to the 402
reactor’s influent at 6.0×10⁻⁴ mg H2SO3-S/L. The biological thiosulfate reducing activity 403
decreased markedly with the addition of FSA, this was inhibited by 50% when initial FSA 404
concentrations were altered from 8.0×10⁻⁸ to 2.0×10⁻⁴ mg H2SO3-S/L in the batch reactor. The 405
inhibition of FSA on biological thiosulfate reduction was found to recover after the elimination 406
of FSA. 407
408
Acknowledgements 409
This work was financially supported by Natural Science Foundation of China (No. 51608444) 410
and the Open Fund of State Key Laboratory of Geohazard Prevention and Geoenvironment 411
Protection (Grant No. SKLGP2017K026). The authors also gratefully acknowledge the support 412
from National Training Programs of Innovation and Entrepreneurship for undergraduate of 413
China (No. 201610699132 and No. 201610699369). Dr. Qilin Wang acknowledges the supports 414
of Australian Research Council Discovery Early Career Researcher Award (DE160100667), 415
Australian Research Council Discovery Project (DP170102812) and the Philanthropic Grant for 416
Early Career Engineering Researcher (GE12015). 417

MANUSCRIP
T
ACCEPTED
ACCEPTED MANUSCRIPT
20
418
References 419
APHA, 2005. Standard Methods for Water and Wastewater Examination. American Public 420
Health Association, Washington, D.C. 421
Armentia-Alvarez, A., Fernandez-Casero, A., Garcia-Moreno, C., Pena-Egido, M.J., 1993. 422
Residual levels of free and total sulphite in fresh and cooked burgers. Food Addit. Contam. 10, 423
157–165. 424
Barton, L.L., Hamilton, W.A., 2007. Sulphate-reducing Bacteria, Environmental and Engineered 425
Systems. Published in the United State of America by Cambridge University Press, New York. 426
Brenner, D.J., Krieg, N.R., Staley, J.T., 2005. Bergey's Manual® of Systematic Bacteriology. In: 427
The Proteobacteria Part C the Alpha-, Beta-, Delta-, and Epsilonproteobacteria, vol. 2. 428
Brunner, B., Bernasconi, S.M., 2005. A revised isotope fractionation model for dissimilatory 429
sulfate reduction in sulfate reducing bacteria. Geochim. Cosmochim. Ac. 69, 4759–4771. 430
Cardoso, R.B., Sierra-Alvarez, R., Rowlette, P., Flores, E.R., Gomez, J., Field, J.A., 2006. 431
Sulfide oxidation under chemolithoautotrophic denitrifying conditions. Biotechnol. Bioeng. 95, 432
1148–1157. 433
Castro, H.F., Williams, N.H., Ogram, A., 2000. Phylogeny of sulfate-reducing bacteria. FEMS 434
Microbiol. Ecol. 31, 1–9. 435
Chang, I.S., Kim, B.H., Shin, P.K., 1997. Use of sulfite and hydrogen peroxide to control 436
bacterial contamination in ethanol fermentation. Appl. Environ. Microbiol. 63 (1), 1–6. 437
Hinze, H., Holzer, H., 1986. Analysis of energy metabolism after incubation of Saccharomyces 438
cerevisiae with sulfite or nitrite. Arch. Microbiol. 145, 27–31. 439

MANUSCRIP
T
ACCEPTED
ACCEPTED MANUSCRIPT
21
Jiang, F., Zhang, L., Peng, G.L., Liang, S.Y., Qian, J., Wei, L., Chen, G.H., 2013. A novel 440
approach to realize SANI process in freshwater sewage treatment – Use of wet flue gas 441
desulfurization waste streams as sulfur source. Water Res. 47, 5773–5782. 442
Jiang, R., Wang, M., Xue, J., Xu, N., Hou, G., Zhang, W., 2015. Cytotoxicity of sulfurous acid 443
on cell membrane and Bioactivity of Nitrosomonas europaea. Chemosphere 119, 896–901. 444
Lens, P.N.L., Visser, A., Janssen, A.J.H., Pol, L.W.H., Lettinga, G., 1998. Biotechnological 445
treatment of sulfate-rich wastewaters. Crit. Rev. Env. Sci. Technol. 28, 41–88. 446
Liu, J.R., Tanner, R.S., Schumann, P., Weiss, N., McKenzie, C.A., Janssen, P.H., Seviour, E.M., 447
Lawson, P.A., Allen, T.D., Seviour, R.J., 2002. Emended description of the genus Trichococcus, 448
description of Trichococcus collinsii sp. nov., and reclassification of Lactosphaera pasteurii as 449
Trichococcus pasteurii comb. nov. and of Ruminococcus palustris as Trichococcus palustris 450
comb. nov. in the low-GMC Gram-positive bacteria. Int. J. Syst. Evol. Microbiol. 52, 451
1113–1126. 452
Maier, K., Hinze, H., Leuschel, L., 1986. Mechanism of sulfite action on the energy metabolism 453
of Saccharomyces cerevisiae. Biochim. Biophys. Acta. 848, 120–130. 454
Manconi, I., Carucci, A., Lens, P., 2007. Combined removal of sulfur compounds and nitrate by 455
autotrophic denitrification in bioaugmented activated sludge system. Biotechnol. Bioengeering 456
98, 551–560. 457
Mora, M., Guisasola, A., Gamisans, X., Gabriel, D., 2014. Examining thiosulfate-driven 458
autotrophic denitrification through Respirometry. Chemosphere 113, 1–8. 459
Muyzer, G., Stams, A.J.M., 2008. The ecology and biotechnology of sulphate-reducing bacteria. 460
Nat. Rev. Microbiol. 6, 441–454. 461

MANUSCRIP
T
ACCEPTED
ACCEPTED MANUSCRIPT
22
Ough, C.S., 1993. Sulfur dioxide and sulfites, p. 137–190. In P.M. Davidson and A.L. Branen 462
(eds.), Antimicrobials in Foods. Marcel Dekker Inc., New York, N.Y., USA. 463
O’Flaherty, V., Mahony, T., O’Kennedy, R., Colleran, E., 1998. Effect of pH on growth kinetics 464
and sulphide toxicity thresholds of a range of methanogenic, syntrophic and sulphate-reducing 465
bacteria. Process Biochem. 33, 555–569. 466
Park, S., Hwang, Y.S., 2008. Genome-Wide Transcription Responses to Sulfite in 467
Saccharomyces cerevisiae. J. Microbiol. 46, 542–548. 468
Pena-Egido, M.J., Garcia-Alonso, B., Garcia-Moreno, C.J., 2005. S-Sulfonate contents in raw 469
and cooked meat products. Agric. Food. Chem. 53, 4198–4201. 470
Prakash, D., Hinze, H., Holzer, H., 1986. Synergistic effect of mchloroperoxybenzoic acid, 471
sulfite and nitrite on the energy metabolism of Saccharomyces cerevisiae. FEMS Microbiol. Lett. 472
34, 305–308. 473
Qian, J., Jiang, F., Chui, H.K., van Loosdrecht, M.C.M., Chen, G.H., 2013. Industrial flue gas 474
desulfurization waste may offer an opportunity to facilitate SANI® application for significant 475
sludge minimization in freshwater wastewater treatment. Water Sci. Technol. 67, 2822–2826. 476
Qian, J., Lu, H., Jiang, F., Ekama, G.A., Chen, G.H., 2015a. Beneficial Co-Treatment of Simple 477
Wet Flue Gas Desulphurization Wastes and Freshwater Sewage through Development of Mixed 478
Denitrification–SANI process. Chem. Eng. J. 262, 109–118. 479
Qian, J., Liu, R., Wei, L., Lu, H., Chen, G.H., 2015b. System evaluation and microbial analysis 480
of a sulfur cycle-based wastewater treatment process for Co-treatment of simple wet flue gas 481
desulfurization wastes with freshwater sewage. Water Res. 80, 189–199. 482
MANUSCRIP
T
ACCEPTED
ACCEPTED MANUSCRIPT
23
Qian, J., Lu, H., Cui, Y., Wei, L., Liu, R., Chen, G.H., 2015c. Investigation on 483
Thiosulfate-involved Organics and Nitrogen Removal by a Sulfur Cycle-based Biological 484
Wastewater Treatment Process. Water Res. 69, 295–306. 485
Qian, J., Zhou, J., Zhang, Z., Liu, R., Wang, Q., 2016. Biological nitrogen removal through 486
nitritation coupled with thiosulfate-driven denitritation. Sci. Rep. 6:27502. 487
Quince, C., Lanzen, A., Davenport, R., Turnbaugh, P.J., 2011. Removing noise from 488
pyrosequenced amplicons. BMC Bioinformatics 12, 38–56. 489
Ren, N., Wang, A., Zhao, Y., 2009. Ecology of sulfate-reducing bacteria in anaerobic treatment 490
processes, Science, Beijing. 491
Sahinkaya, E., Dursun, N., 2012. Sulfur-oxidizing autotrophic and mixotrophic denitrification 492
processes for drinking water treatment: Elimination of excess sulfate production and alkalinity 493
requirement. Chemosphere 89, 144–149. 494
Schimz, K.L., Holzer, H., 1979. Rapid Decrease of ATP Content in Intact Cells of 495
Saccharomyces cerevisiae After Incubation with Low Concentrations of Sulfite. Arch. Microbiol. 496
121, 225–229. 497
Shi, X., Mao, Y., 1994. 8-Hydroxy-20-deoxyguanosine formation and DNA damage induced by 498
sulfur trioxide anion radicals. Biochem. Biophys. Res. Commun. 205, 141–148. 499
Stratford, M., Morgan, P., Rose, A.H., 1987. Sulphur dioxide resistance in Saccharomyces 500
cerevisiae. J. Gen. Microbiol. 133, 2173–2179. 501
Trotter, E.W., Grant, C.M., 2002. Thioredoxins are required for protection against a reductive 502
stress in the yeast Saccharomyces cerevisiae. Mol. Microbiol. 46, 869–878. 503
Wang, Q., Ye, L., Jiang, G., Jensen, P., Batstone, D., Yuan, Z., 2013. Free nitrous acid (FNA)- 504

MANUSCRIP
T
ACCEPTED
ACCEPTED MANUSCRIPT
24
based pre-treatment enhances methane production from waste activated sludge. Environ. Sci. 505
Technol. 47, 11897-11904. 506
Wang, Q., Jiang, G., Ye, L., Yuan, Z., 2014. Enhancing methane production from waste 507
activated sludge using combined free nitrous acid and heat pre-treatment. Water Res. 63, 71- 508
80. 509
Wedzichab, L., 1984. Chemistry of Sulphur Dioxide in Foods. London: Elsevier Applied 510
Science Publishers. 511
Weijma, J., Hulshoff, P.L.W., Stams, A.J.M., Lettinga, G., 2000. Performance of a thermophilic 512
sulfate and sulfite reducing high rate anaerobic reactor fed with methanol. Biodegradation 11, 513
429–439. 514
Widdel, F., 1988. Microbiology and ecology of sulfate-and sulfur-reducing bacteria. In: Biology 515
of Anaerobic Microorganisms (A. Zehnder, ed.). 516
Zan, F., Hao, T., Chi, K., Ekama, G.A., Chen, G.H., 2016. Using sulfite pretreatment to improve 517
the biodegradability of waste activated sludge. RSC Adv. 6, 71875–71881. 518

MANUSCRIP
T
ACCEPTED
ACCEPTED MANUSCRIPT
25
List of Figures and tables 519
Fig. 1 Thiosulfate reduction/sulfide generation (a) and performance of organic removal (b) in 520
the biological thiosulfate-reducing UASB reactor. 521
Fig. 2 (a) Rarefaction analysis of the sludge samples at Stages I, III and V, respectively. (b) and 522
class (c) levels using RDP classifier with a confidence threshold of 97%; (d) Relative abundance 523
and phylogenetic relationships of different genera retrieved from the sludge (the phylogenetic 524
relationships were calculated by visualizing as a heatmap and using MeV software. The color 525
indicates the percentage of a genus in total sequences). 526
Fig. 3 (a) Biomass-specific thiosulfate reduction rates versus pH in Batch Test I; (b) 527
Biomass-specific thiosulfate reduction rates versus Na2SO3 concentrations in Batch Test II. 528
Fig. 4 Biological thiosulfate reducing activities under different pH conditions (a) and different 529
saline sulfite concentrations (b) and (c) Correlation between thiosulfate reduction rates versus 530
FSA concentrations in the 10 batch reactors including 4 batch reactors in Batch Test II and 6 531
batch reactors in Batch Test III. 532

MANUSCRIP
T
ACCEPTED
ACCEPTED MANUSCRIPT
1
Fig. 1 Thiosulfate reduction/sulfide generation (a) and performance of organic removal (b) in the
biological thiosulfate-reducing UASB reactor
0
50
100
150
200
250
1 8 18 27 38 50 59 75 91 104 118 131 144 171
Sulf
urco
ncen
trat
ion
(mg
S/L
)
Time (Day)
Inf. S2O32- concentration Eff. S2O32- concentration Eff. HS- concentration
Stage I Stage II Stage III Stage IV Stage V
Influent S2O32-
concentrationEffluent S2O3
2-
concentrationEffluent sulfide concentration
a
Stage IVStage IIStage I Stage V
0
20
40
60
80
100
0
50
100
150
200
250
1 8 18 27 38 50 59 75 91 104 118 131 144 171
Ac-
rem
oval
effi
cien
cy%
)
Ac-
conc
entr
atio
n(m
g C
OD
/L)
Time (Day)
Inf. Ac- conc. Eff. Ac- conc. Ac- removal efficiencyInfluent Ac-
concentrationEffluent Ac-
concentration Ac- removal efficiency
Stage III
b

MANUSCRIP
T
ACCEPTED
ACCEPTED MANUSCRIPT
1
Fig. 2 (a) Rarefaction analysis of the sludge samples at Stages I, III and V, respectively. (b) and
class (c) levels using RDP classifier with a confidence threshold of 97%; (d) Relative abundance
and phylogenetic relationships of different genera retrieved from the sludge (the phylogenetic
relationships were calculated by visualizing as a heatmap and using MeV software. The color
indicates the percentage of a genus in total sequences).
MANUSCRIP
T
ACCEPTED
ACCEPTED MANUSCRIPT
1
Fig. 3 (a) Biomass-specific thiosulfate reduction rates versus pH in Batch Test I; (b) Biomass-
specific thiosulfate reduction rates versus Na2SO3 concentrations in Batch Test II.
0
10
20
30
40
50
6 7 8 9
Bio
mas
s-sp
ecif
icS 2
O32-
-Sre
duct
ion
rate
(mg
S 2O
32--S
/gV
SS/h
)
pH
0
5
10
15
20
50 100 150 200B
iom
ass-
spec
ific
S 2O
32--S
redu
ctio
n ra
te(m
gS 2
O32-
-S/g
VSS
/h)
Na2SO3 concentrations (mg S/L)
ba
MANUSCRIP
T
ACCEPTED
ACCEPTED MANUSCRIPT
1
Fig. 4 Biological thiosulfate reducing activities under different pH conditions (a) and different
saline sulfite concentrations (b) and (c) Correlation between thiosulfate reduction rates versus
FSA concentrations in the 10 batch reactors including 4 batch reactors in Batch Test II and 6
batch reactors in Batch Test III.
0
5
10
15
20
25
30
35
40
45
6 7 8 9
Bio
logi
calS
2O32-
redu
cing
acti
vity
(mg
S 2O
32--S
/gV
SS/h
)
pH
0 mg SO3-S/L
50 mg SO3-S/L
100 mg SO3-S/L
150 mg SO3-S/L
200 mg SO3-S/L
0
5
10
15
20
25
30
35
40
0 50 100 150 200
Bio
logi
calS
2O32-
redu
cing
acti
vity
(mg
S 2O
32--S
/gV
SS/h
)
Saline sulfite concentration (mg S/L)
pH=6.0
pH=7.0
pH=8.0
pH=9.0
y = -2.442ln(x) - 4.373R² = 0.9533
0
5
10
15
20
25
30
35
40
0 0.005 0.01 0.015 0.02
Bio
logi
calS
2O32-
redu
cing
acti
vity
(mg
S 2O
32--S
/gV
SS/h
)
FSA concentration (mg H2SO3-S/L)
50 mg SO32--S/L
100 mg SO32--S/L
200 mg SO32--S/L
150 mg SO32--S/L
0 mg SO32--S/L
a b
c

MANUSCRIP
T
ACCEPTED
ACCEPTED MANUSCRIPT
Highlights
� Free sulfurous acid was the true inhibitor of biological S2O32- reduction
� S2O32- reducing activity was depressed at an FSA concentration of 1.5×10⁻⁵ mg
S/L.
� SO42-/SO3
2--reducing bacteria population decreased in the presence of FSA
� FSA inhibition on biological S2O32- reduction is reversible