freedom on the net 2013
DESCRIPTION
Charts and GraphsTRANSCRIPT
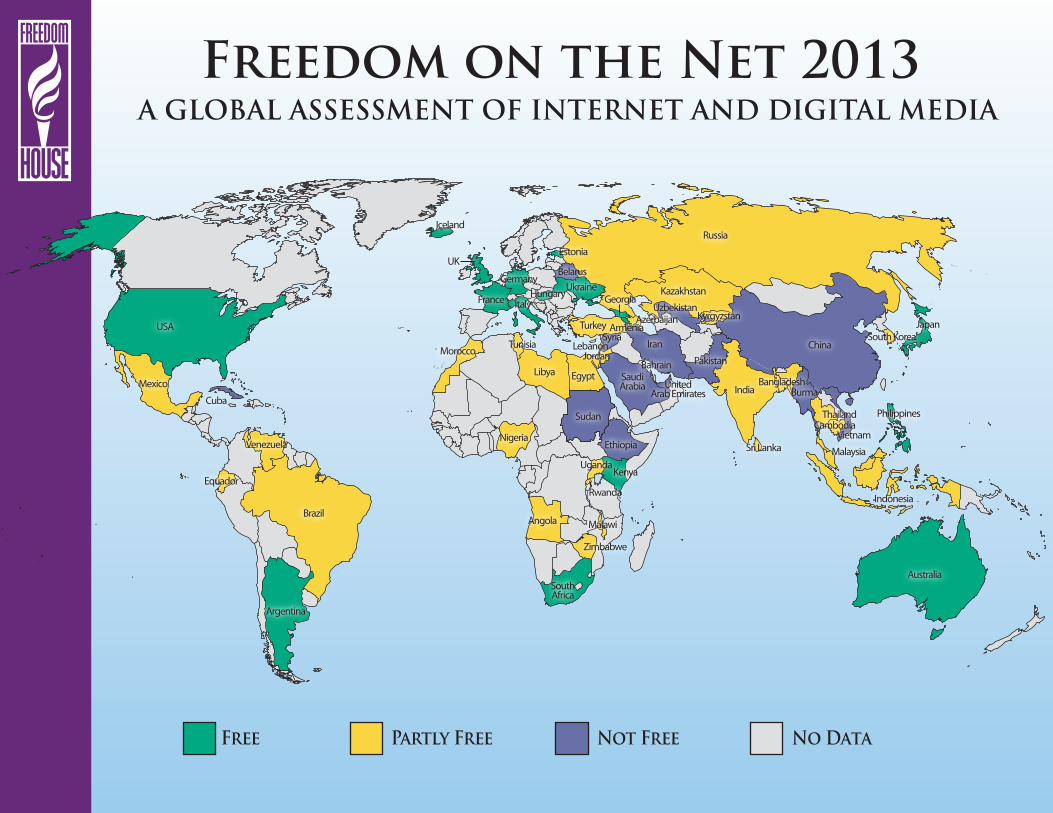
Free Partly Free Not Free No Data
Freedom on the Net 2013A GLOBAL ASSESSMENT OF INTERNET AND DIGITAL MEDIA
Nigeria
Egypt
JordanLebanon
Libya
Tunisia
ItalyFrance
Germany
Iceland
UKBelarus
Estonia
GeorgiaUkraine
Turkey
Hungary Kazakhstan
Russia
USA
Mexico
Cuba
Venezuela
Equador
Brazil
Argentina
AzerbaijanArmenia
UzbekistanKyrgyzstan
IranSyria
Bahrain Pakistan
IndiaBangladesh
Sri Lanka
China
Burma
ThailandCambodia
Vietnam
Malaysia
Indonesia
Australia
South KoreaJapan
Philippines
SaudiArabia United
Arab Emirates
Ethiopia
Sudan
KenyaUganda
Rwanda
Morocco
Malawi
Zimbabwe
Angola
SouthAfrica

FREEDOM ON THE NET 2013
CHARTS AND GRAPHS OF KEY FINDINGS
CHARTS AND GRAPHS OF KEY FINDINGS Freedom on the Net measures the level of internet and digital media freedom in 60 countries. Each country receives a numerical score from 0 (the most free) to 100 (the least free), which serves as the basis for an internet freedom status designation of FREE (0-30 points), PARTLY FREE (31-60 points), or NOT FREE (61-100 points). Ratings are determined through an examination of three broad categories:
A. OBSTACLES TO ACCESS: assesses infrastructural and economic barriers to access; governmental efforts to block specific applications or technologies; and legal, regulatory, and ownership control over internet and mobile phone access providers.
B. LIMITS ON CONTENT: examines filtering and blocking of websites; other forms of censorship and self-censorship; manipulation of content; the diversity of online news media; and usage of digital media for social and political activism.
C. VIOLATIONS OF USER RIGHTS: measures legal protections and restrictions on online activity; surveillance; privacy; and repercussions for online activity, such as legal prosecution, imprisonment, physical attacks, or other forms of harassment.
FREEDOM ON THE NET 2013: GLOBAL SCORES
COUNTRY
FREEDOM ON
THE NET 2013 STATUS
FREEDOM ON
THE NET 2013 TOTAL
0‐100 Points
A. SUBTOTAL: OBSTACLES TO
ACCESS 0‐25 Points
B. SUBTOTAL: LIMITS ON
CONTENT 0‐35 Points
C. SUBTOTAL: VIOLATIONS OF USER RIGHTS 0‐40 Points
ICELAND Free 6 1 1 4
ESTONIA Free 9 1 3 5
GERMANY Free 17 4 4 9
UNITED STATES Free 17 4 1 12
AUSTRALIA Free 18 2 5 11
FRANCE Free 20 4 4 12
JAPAN Free 22 4 7 11
HUNGARY Free 23 5 8 10
ITALY Free 23 5 6 12
UNITED KINGDOM Free 24 2 6 16

FREEDOM ON THE NET 2013
CHARTS AND GRAPHS OF KEY FINDINGS
COUNTRY
FREEDOM ON
THE NET 2013 STATUS
FREEDOM ON
THE NET 2013 TOTAL
0‐100 Points
A. SUBTOTAL: OBSTACLES TO
ACCESS 0‐25 Points
B. SUBTOTAL: LIMITS ON
CONTENT 0‐35 Points
C. SUBTOTAL: VIOLATIONS OF USER RIGHTS 0‐40 Points
PHILIPPINES Free 25 10 5 10
GEORGIA Free 26 8 7 11
SOUTH AFRICA Free 26 7 8 11
ARGENTINA Free 27 8 10 9
KENYA Free 28 9 7 12
UKRAINE Free 28 7 7 14
ARMENIA Free 29 8 9 12
NIGERIA Partly Free 31 10 8 13
BRAZIL Partly Free 32 7 8 17
SOUTH KOREA Partly Free 32 3 13 16
ANGOLA Partly Free 34 15 6 13
UGANDA Partly Free 34 11 8 15
KYRGYZSTAN Partly Free 35 12 10 13
ECUADOR Partly Free 37 10 11 16
MEXICO Partly Free 38 11 10 17
INDONESIA Partly Free 41 11 11 19
TUNISIA Partly Free 41 12 8 21
MALAWI Partly Free 42 16 11 15
MOROCCO Partly Free 42 11 7 24
MALAYSIA Partly Free 44 9 15 20
LEBANON Partly Free 45 14 10 21
LIBYA Partly Free 45 17 9 19
JORDAN Partly Free 46 13 13 20
CAMBODIA Partly Free 47 14 15 18
INDIA Partly Free 47 15 12 20

FREEDOM ON THE NET 2013
CHARTS AND GRAPHS OF KEY FINDINGS
COUNTRY
FREEDOM ON
THE NET 2013 STATUS
FREEDOM ON
THE NET 2013 TOTAL
0‐100 Points
A. SUBTOTAL: OBSTACLES TO
ACCESS 0‐25 Points
B. SUBTOTAL: LIMITS ON
CONTENT 0‐35 Points
C. SUBTOTAL: VIOLATIONS OF USER RIGHTS 0‐40 Points
RWANDA Partly Free 48 12 18 18
BANGLADESH Partly Free 49 13 12 24
TURKEY Partly Free 49 12 18 19
AZERBAIJAN Partly Free 52 13 17 22
VENEZUELA Partly Free 53 16 16 21
RUSSIA Partly Free 54 10 19 25
ZIMBABWE Partly Free 54 16 14 24
SRI LANKA Partly Free 58 15 20 23
KAZAKHSTAN Partly Free 59 15 23 21
EGYPT Partly Free 60 15 12 33
THAILAND Partly Free 60 10 21 29
BURMA Not Free 62 20 16 26
SUDAN Not Free 63 17 19 27
UNITED ARAB EMIRATES Not Free 66 13 22 31
BELARUS Not Free 67 16 22 29
PAKISTAN Not Free 67 20 20 27
SAUDI ARABIA Not Free 70 14 24 32
BAHRAIN Not Free 72 11 26 35
VIETNAM Not Free 75 14 28 33
UZBEKISTAN Not Free 78 20 28 30
ETHIOPIA Not Free 79 22 28 29
SYRIA Not Free 85 24 25 36
CHINA (PRC) Not Free 86 19 29 38
CUBA Not Free 86 24 29 33
IRAN Not Free 91 22 32 37

FREEDOM ON THE NET 2013
CHARTS AND GRAPHS OF KEY FINDINGS
69
1717182022232324252626272828293132323434353738
41414242444545464747484949
52535454
585960606263
666767
7072
757879
858686
91
0 10 20 30 40 50 60 70 80 90 100
IcelandEstonia
GermanyUnited States
AustraliaFranceJapan
HungaryItaly
United KingdomPhilippines
GeorgiaSouth AfricaArgentina
KenyaUkraineArmeniaNigeriaBrazil
South KoreaAngolaUganda
KyrgyzstanEcuadorMexico
IndonesiaTunisiaMalawi
MoroccoMalaysiaLebanon
LibyaJordan
CambodiaIndia
RwandaBangladesh
TurkeyAzerbaijanVenezuela
RussiaZimbabweSri Lanka
KazakhstanEgypt
ThailandBurmaSudanUAE
BelarusPakistan
Saudi ArabiaBahrainVietnam
UzbekistanEthiopia
SyriaChina (PRC)
CubaIran
FREE (0‐30) PARTLY FREE (31‐60) NOT FREE (61‐100)
60 COUNTRY SCORE COMPARISON (0 = Most Free, 100 = Least Free)

FREEDOM ON THE NET 2013
CHARTS AND GRAPHS OF KEY FINDINGS
REGIONAL GRAPHS
22
25
32
41
44
47
47
49
58
60
62
67
75
86
0 10 20 30 40 50 60 70 80 90 100
Japan
Philippines
South Korea
Indonesia
Malaysia
Cambodia
India
Bangladesh
Sri Lanka
Thailand
Burma
Pakistan
Vietnam
China (PRC)
26
28
29
35
49
52
54
59
67
78
0 10 20 30 40 50 60 70 80 90 100
Georgia
Ukraine
Armenia
Kyrgyzstan
Turkey
Azerbaijan
Russia
Kazakhstan
Belarus
Uzbekistan
ASIA (0 = Most Free, 100 = Least Free)
EURASIA (0 = Most Free, 100 = Least Free)
FREE
PARTLY FREE
NOT FREE

FREEDOM ON THE NET 2013
CHARTS AND GRAPHS OF KEY FINDINGS
6
9
17
17
18
20
23
23
24
0 10 20 30 40 50 60 70 80 90 100
Iceland
Estonia
Germany
United States
Australia
France
Hungary
Italy
United Kingdom
27
32
37
38
53
86
0 10 20 30 40 50 60 70 80 90 100
Argentina
Brazil
Ecuador
Mexico
Venezuela
Cuba
AUSTRALIA , EU, ICELAND & UNITED STATES (0 = Most Free, 100 = Least Free)
LATIN AMERICA (0 = Most Free, 100 = Least Free)
FREE
PARTLY FREE
NOT FREE

FREEDOM ON THE NET 2013
CHARTS AND GRAPHS OF KEY FINDINGS
41
42
45
45
46
60
66
70
72
85
91
0 10 20 30 40 50 60 70 80 90 100
Tunisia
Morocco
Lebanon
Libya
Jordan
Egypt
UAE
Saudi Arabia
Bahrain
Syria
Iran
26
28
31
34
34
42
48
54
63
79
0 10 20 30 40 50 60 70 80 90 100
South Africa
Kenya
Nigeria
Angola
Uganda
Malawi
Rwanda
Zimbabwe
Sudan
Ethiopia
MIDDLE EAST & NORTH AFRICA (0 = Most Free, 100 = Least Free)
SUB-SAHARAN AFRICA (0 = Most Free, 100 = Least Free)
FREE
PARTLY FREE
NOT FREE
FREEDOM ON THE NET 2013
CHARTS AND GRAPHS OF KEY FINDINGS
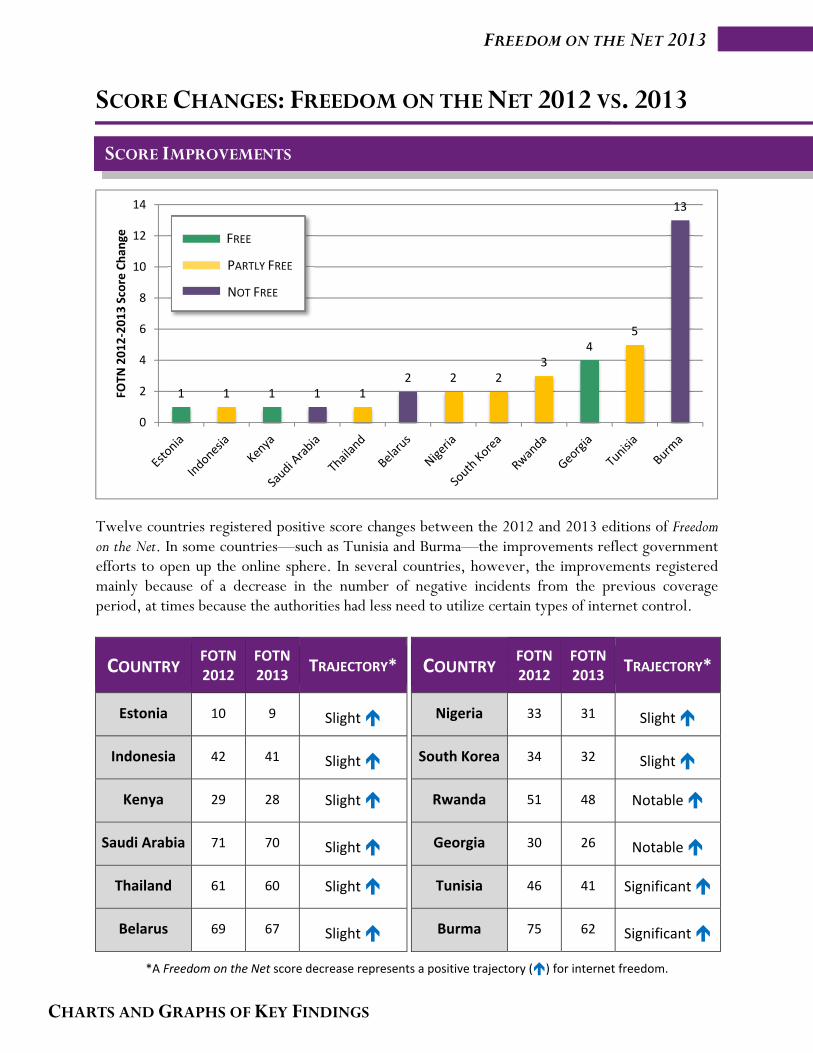
SCORE CHANGES: FREEDOM ON THE NET 2012 VS. 2013
Twelve countries registered positive score changes between the 2012 and 2013 editions of Freedom on the Net. In some countries—such as Tunisia and Burma—the improvements reflect government efforts to open up the online sphere. In several countries, however, the improvements registered mainly because of a decrease in the number of negative incidents from the previous coverage period, at times because the authorities had less need to utilize certain types of internet control.
*A Freedom on the Net score decrease represents a positive trajectory () for internet freedom.
1 1 1 1 12 2 2
34
5
13
0
2
4
6
8
10
12
14
FOTN
2012‐2013 Score Chan
ge
COUNTRY FOTN
2012 FOTN
2013 TRAJECTORY*
Nigeria 33 31 Slight
South Korea 34 32 Slight
Rwanda 51 48 Notable
Georgia 30 26 Notable
Tunisia 46 41 Significant
Burma 75 62 Significant
COUNTRY FOTN
2012 FOTN
2013 TRAJECTORY*
Estonia 10 9 Slight
Indonesia 42 41 Slight
Kenya 29 28 Slight
Saudi Arabia 71 70 Slight
Thailand 61 60 Slight
Belarus 69 67 Slight
SCORE IMPROVEMENTS
FREE
PARTLY FREE
NOT FREE
FREEDOM ON THE NET 2013
CHARTS AND GRAPHS OF KEY FINDINGS
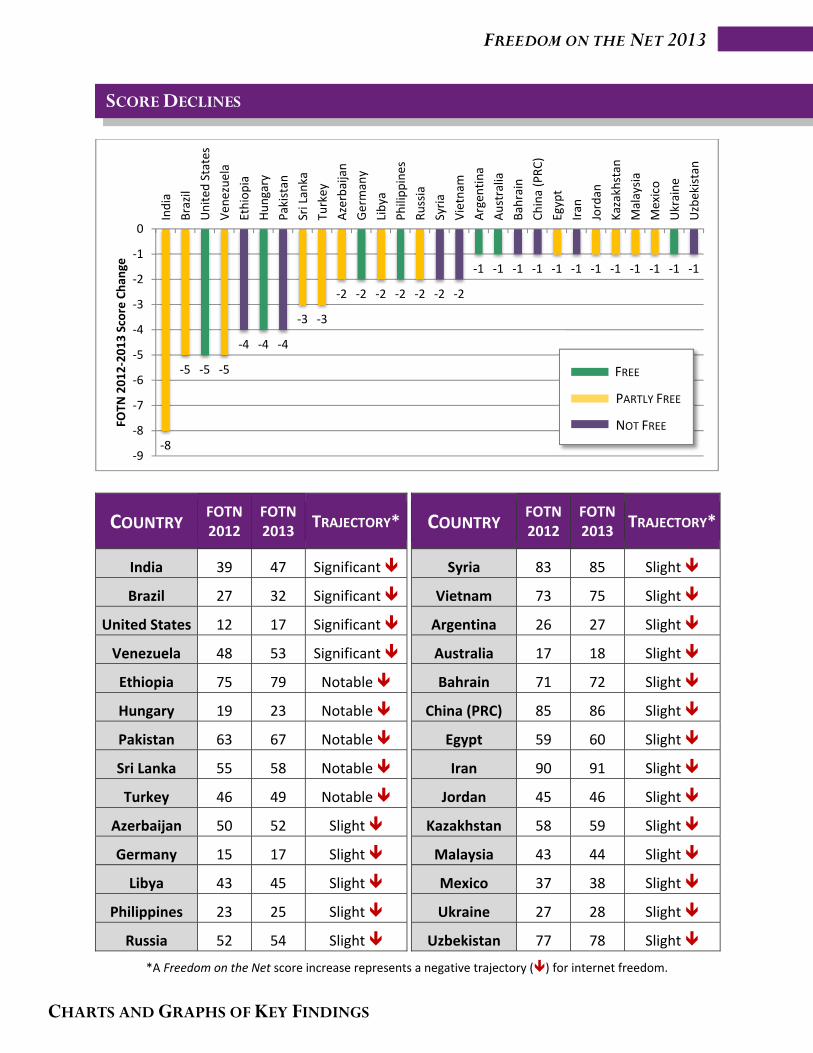
*A Freedom on the Net score increase represents a negative trajectory () for internet freedom.
‐8
‐5 ‐5 ‐5
‐4 ‐4 ‐4
‐3 ‐3
‐2 ‐2 ‐2 ‐2 ‐2 ‐2 ‐2
‐1 ‐1 ‐1 ‐1 ‐1 ‐1 ‐1 ‐1 ‐1 ‐1 ‐1 ‐1
‐9
‐8
‐7
‐6
‐5
‐4
‐3
‐2
‐1
0
India
Brazil
United
States
Ven
ezuela
Ethiopia
Hungary
Pakistan
Sri Lanka
Turkey
Azerbaijan
Germany
Libya
Philippines
Russia
Syria
Vietnam
Argen
tina
Australia
Bahrain
China (PRC)
Egypt
Iran
Jordan
Kazakhstan
Malaysia
Mexico
Ukraine
Uzbekistan
FOTN
2012‐2013 Score Chan
ge
COUNTRY FOTN
2012 FOTN
2013 TRAJECTORY*
Syria 83 85 Slight
Vietnam 73 75 Slight
Argentina 26 27 Slight
Australia 17 18 Slight
Bahrain 71 72 Slight
China (PRC) 85 86 Slight
Egypt 59 60 Slight
Iran 90 91 Slight
Jordan 45 46 Slight
Kazakhstan 58 59 Slight
Malaysia 43 44 Slight
Mexico 37 38 Slight
Ukraine 27 28 Slight
Uzbekistan 77 78 Slight
COUNTRY FOTN
2012 FOTN
2013 TRAJECTORY*
India 39 47 Significant
Brazil 27 32 Significant
United States 12 17 Significant
Venezuela 48 53 Significant
Ethiopia 75 79 Notable
Hungary 19 23 Notable
Pakistan 63 67 Notable
Sri Lanka 55 58 Notable
Turkey 46 49 Notable
Azerbaijan 50 52 Slight
Germany 15 17 Slight
Libya 43 45 Slight
Philippines 23 25 Slight
Russia 52 54 Slight
SCORE DECLINES
FREE
PARTLY FREE
NOT FREE

FREEDOM ON THE NET 2013
CHARTS AND GRAPHS OF KEY FINDINGS
Digital media in several of the 60 countries covered was relatively unobstructed when compared to the more repressive or dangerous environment for traditional media. This difference is evident from the comparison between a country’s score on Freedom House’s Freedom on the Net 2013 and Freedom of the Press 2013 assessments. The figure below shows the 35 countries in this edition with a score difference of 10 points or greater. The bar graph characterizes a country’s Freedom on the Net 2013 score, while the scatterplot () represents the country’s score in Freedom of the Press 2013, which measures media freedom in the broadcast, radio, and print domains. This difference is cause for concern. Pressures that constrain expression in print or broadcast formats have the potential to exert a negative impact, in the short or long term, on the space for online expression.
0
10
20
30
40
50
60
70
80
90
100
Hungary
Italy
Philippines
Geo
rgia
Argen
tina
Ken
ya
Ukraine
Arm
enia
Nigeria
Brazil
Angola
Uganda
Kyrgyzstan
Ecuador
Mexico
Tunisia
Malaw
i
Morocco
Malaysia
Libya
Jordan
Cam
bodia
Rwanda
Azerbaijan
Ven
ezuela
Russia
Zimbabwe
Sri Lanka
Kazakhstan
Burm
a
Sudan
Belarus
Saudi A
rabia
Bahrain
Uzbekistan
Freedom on the Net 2013 and Freedom of the Press 2013 scores
INTERNET FREEDOM VS. PRESS FREEDOM
FREE (0‐20) PARTLY FREE (31‐60) NOT FREE (61‐100)

FREEDOM ON THE NET 2013
CHARTS AND GRAPHS OF KEY FINDINGS
The figure below depicts the relationship between internet penetration rates and the level of digital media freedom in Freedom on the Net 2013. Each point reflects a country’s internet penetration rate, as well as its overall performance in the rest of the survey. The PARTLY FREE countries in the middle are particularly noteworthy. As digital access increases, they have a choice—to move right, and join the countries that are high-tech but NOT FREE; or left, with the FREE countries that better protect expression.
Angola
Argentina
Armenia
Australia
Azerbaijan
Bahrain
Bangladesh
Belarus
Brazil
Burma
Cambodia
China
Cuba
Ecuador
Egypt
Estonia
Ethiopia
France
Georgia
Germany
Hungary
Iceland
India
Indonesia
Iran
Italy
Japan
JordanKazakhstan
Kenya
Kyrgyzstan
Lebanon
Libya
Malawi
Malaysia
Mexico
Morocco
Nigeria
Pakistan
Philippines
Russia
Rwanda
Saudi Arabia
South Africa
South Korea
Sri Lanka
Sudan
Syria
Thailand
Tunisia
Turkey
Uganda
Ukraine
UAE
United KingdomUSA
Uzbekistan
Venezuela
Vietnam
Zimbabwe
0%
10%
20%
30%
40%
50%
60%
70%
80%
90%
100%
0 10 20 30 40 50 60 70 80 90 100
Internet Penetration Rate, 2012 (ITU data)
Freedom on the Net 2013, Adjusted Score (0=Most Free, 100=Least Free)
FREE
PARTLY FREE
NOT FREE
INTERNET FREEDOM VS. INTERNET PENETRATION