freedom to speak up index report 2021
TRANSCRIPT
1
Freedom to Speak Up Index Report 2021
2
Contents
Foreword....................................................................................................................... 3
Key Findings .................................................................................................................. 6
Introduction .................................................................................................................. 7
Summary of results ..................................................................................................... 9
A. FTSU Index – National Averages ........................................................................... 9
B. FTSU Index – By region ....................................................................................... 12
C. FTSU Index – By trust type ................................................................................... 13
D. Trusts with the highest FTSU Index scores ........................................................... 13
E. Trusts with the greatest overall increase & decrease in FTSU Index scores ....... 14
F. FTSU Index by Ethnicity ........................................................................................ 15
G. Q18f by Ethnicity .................................................................................................... 17
H. FTSU Index by Gender ......................................................................................... 18
I. 18f by Gender ......................................................................................................... 19
Conclusions and next steps .................................................................................... 20
Case Studies .............................................................................................................. 21
Isle of Wight NHS Trust ............................................................................................... 21
East Midlands Ambulance Service ............................................................................. 22
South Tees NHS Foundation Trust ............................................................................. 23
Annex 1 ....................................................................................................................... 25
FTSU Index including CQC Overall and Well Led Ratings ........................................ 25
3
Foreword I am often asked by leaders: “How do we know when we’ve
got it right?”. Culture can seem a nebulous concept and
difficult to pin down. It is often described as ‘the way things
are done around here’. But is the culture healthy or toxic?
Leaders wanting to learn how they can do better will be
curious about their culture. They will ask questions, speak to
workers and listen to their Freedom to Speak Up Guardian to
get a sense of their organisation’s culture. They will also look
at different data sets – including, potentially, staff survey
results, sick days, grievances, retention. And they will listen to
the silence – what is missing?
The Freedom to Speak Up (FTSU) Index is one of these indicators which can help
build a picture of what the speaking up culture feels like for workers. It is a metric for
NHS Trusts, drawn from four questions in the NHS Annual Staff Survey, asking
whether staff feel knowledgeable, encouraged and supported to raise concerns, and
if they agree they would be treated fairly if involved in an error, near miss or incident.
Since the introduction of Freedom to Speak Up Guardians in 2016 following the
Francis Freedom to Speak Up Review, the FTSU Index has improved and risen 3.7
percentage points nationally from 75.5 per cent in 2015 to 79.2 per cent in 2020.
While we continue to see an upward trajectory, I am concerned with the continued
disparity between the highest performing organisations and the lowest, with a 21-
percentage point difference between the highest and lowest scoring trusts. More
concerning is that this disparity has increased this year, with the lowest performing
trust showing a 2.9 per cent decrease.
Within this report, we share case studies from some of those organisations who are
among those with the most improved FTSU Index scores. They share their journeys
to provide insight and learning to others who may be facing similar challenges. They
illustrate some of the practical steps they have taken to improve workers’ trust in
speaking up arrangements and their confidence that they will be safe and supported
if they use them.
Do workers feel safe to speak up?
This year, a new question was included in the NHS Staff Survey, asking workers if
they feel safe to speak up about anything that concerns them within their
organisation.1
1 This question has not been included in the FTSU Index scores to enable comparability to previous
years. However, the answers to this question show a very strong positive correlation with the FTSU
Index.
4
We welcome the inclusion of this question, because Freedom to Speak Up is about
more than the ability to raise concerns about patient safety. It is about being able to
speak up about anything which gets in the way of doing a great job, whether that’s
an idea for improvement, ways of working or behaviour.
The answers to this question show a very strong positive correlation with the FTSU
Index, with 66 per cent of staff "agreeing" or "strongly agreeing" that they feel safe to
speak up about anything that concerns them in their organisation. We will be looking
in more depth into the details of the responses to this question in a future report.
All organisations should consider including this question in surveys of their
workforce. The promoters and barriers to speaking up are common to all settings
and organisations. Is it safe to speak up? Will I be listened to? Will action be taken?
Freedom to Speak Up is for everybody who works in health. It includes primary and
secondary care, independent providers, hospices and national bodies. It goes
beyond those surveyed in the NHS Staff Survey and to be truly inclusive needs to
work for locum and agency workers, junior doctors, students, volunteers, contractors
and all workers who may face additional barriers to speaking up.
The inclusivity at the heart of Freedom to Speak Up is why I ask leaders to take this
question and use it to listen to the silence, to reduce the disenfranchisement of
workers seen so starkly during the COVID-19 pandemic. Who is not represented in
your survey responses?
As the health sector evolves to more integrated ways of working, it is essential that
speaking up arrangements are consistent so workers can be confident that when
they speak up, they will be supported, listened to, and the appropriate actions taken.
The Freedom to Speak Up e-learning modules we have developed in association
with Health Education England are for everyone wherever they work in health. They
explain in a clear and consistent way what speaking up is and its importance in
creating an environment in which people are supported to deliver their best. The first
module – Speak Up – is for everybody. The second module, Listen Up, for
managers, builds upon the first and focuses on listening and understanding the
barriers to speaking up. A final module – Follow Up – for senior leaders, will be
launched later in the year to support the development of Freedom to Speak Up as
part of the strategic vision for organisations and systems.
The pandemic has shown how vital Freedom to Speak Up is, not just to ensure that
patients receive the best care, but also to protect the safety of workers. The NHS
staff survey also showed that 18 per cent were considering leaving the NHS
altogether. Everyone who works in health has been under tremendous strain over
the past year, under the most challenging of circumstances. As the sector rebuilds
following the pressures of the pandemic, retaining these highly skilled, dedicated
workers has never been more essential.
Whatever role a worker plays in supporting the health of the nation, they should feel
confident that their voice matters. That when they speak up, their voice will be heard
and that it will be responded to. Just as patients expect the same level of care and
5
compassionate service across the system, a universal, integrated approach to
Freedom to Speak Up will provide workers with the same consistency of worker
experience, no matter what their role or where they work.
We need to work together to ensure that everyone feels safe to speak up, and that
the right actions will be taken when they do. To do so shows through deeds, rather
than words, that people and their wellbeing matters. Only by listening to the silence,
can we work towards making speaking up business as usual.
Dr Henrietta Hughes OBE FRCGP
National Guardian for the NHS
May 2021
Acknowledgements
The 2020 NHS Staff Survey was carried out in the context of the ongoing COVID-19
pandemic. The National Guardian’s Office (NGO) is aware of the pressures the
healthcare sector is under during this time and we greatly appreciate all the work
being done by healthcare workers.
We want to thank everyone who has helped with the preparation of the Freedom to
Speak Up Index and this report. This includes everyone who completed the 2020
NHS Staff Survey, the trusts featured, the NHS Staff Survey team and NHS England
and NHS Improvement, and members of the team at the National Guardian’s Office.
National Guardian’s Office
The National Guardian's Office (NGO) provides supports and challenges to the
healthcare system in England on speaking up.
The NGO leads, trains and supports an expanding network of Freedom to Speak Up
(FTSU) Guardians who support workers to speak up and work within their
organisation to tackle barriers to speaking up.
At the time of publication, there were over 690 Freedom to Speak Up Guardians in a
range of organisations, including NHS trusts, independent health care providers,
primary care organisations, professional and systems regulators, and clinical
commissioning groups.
6
Key Findings
• The national Freedom to Speak Up (FTSU) Index score (79.2%) continued to
improve.
• Six of the top ten performing trusts from last year remained in the top ten list
this year and three trusts from last year remained in the bottom ten scoring
trusts this year.
• An increasing disparity has emerged this year between the highest and lowest
performing trusts. The disparity was 21.0 percentage points in the 2020 NHS
Staff Survey, up from 17.2 percentage points in 2019.
• The FTSU Index continues to be positively correlated with Care Quality
Commission ratings.
• Ambulance trusts remain the lowest performing organisation type, though they
were also the most improved from last year.
• The South East region saw the greatest improvement (1.3 percentage points)
in FTSU Index score from 79.6% to 80.9% this year.
• A new speaking up question was included in the 2020 NHS Staff Survey. The
new question showed that 65.6% of respondents felt safe to speak up about
anything that concerns them in their organisation. The results of this question
also showed a strong positive correlation with the FTSU Index.
7
Introduction Working with NHS England, the National Guardian’s Office (NGO) has brought
together four questions from the NHS Staff Survey into a ‘Freedom to Speak Up
(FTSU) Index’. These questions ask whether staff feel knowledgeable, secure and
encouraged to speak up, and whether they would be treated fairly after an incident.
The FTSU Index seeks to allow trusts to see how an aspect of their FTSU culture
compares with other organisations so learning can be shared, and improvements
made.2
This is the third year in a row that we are publishing the FTSU Index.3 This year’s
index is based on the results from the 2020 NHS Staff Survey.4
Currently, the FTSU Index only includes data for NHS Trusts.5
This year’s results show the national average for the FTSU Index has continued to
rise.
The FTSU Index once again showed a positive correlation between higher index
scores and ratings received by the Care Quality Commission (CQC).6 Trusts with
higher index scores were more likely to be rated ‘good’ or ‘outstanding’ by the CQC.7
NHS Staff Survey questions and the Freedom to Speak Up Index
The FTSU index was calculated as the mean average of responses to the following
four questions from the 2020 NHS Staff Survey:
• % of staff "agreeing" or "strongly agreeing" that their organisation treats staff
who are involved in an error, near miss or incident fairly (question 16a)
• % of staff "agreeing" or "strongly agreeing" that their organisation encourages
them to report errors, near misses or incidents (question 16b)
• % of staff "agreeing" or "strongly agreeing" that if they were concerned about
unsafe clinical practice, they would know how to report it (question 17a)
• % of staff "agreeing" or "strongly agreeing" that they would feel secure raising
concerns about unsafe clinical practice (question 17b)
2 The FTSU Index’s purpose is not to benchmark trusts for their speaking up culture. 3 Please see here (2020) and here (2019) for the previous FTSU Index reports. 4 NHS England and NHS Improvement Staff Survey, https://www.nhsstaffsurveys.com/Page/1105/Latest-Results/NHS-Staff-Survey-Results/ 5 The NGO’s remit extends beyond trusts. However, NHS trust workers make up the majority of those who take part in the NHS Staff Survey, though non-trusts (e.g. some clinical commissioning groups) also participate in the annual survey. 6 The Care Quality Commission (CQC) regulates and inspects many of the organisations where Freedom to Speak Up Guardians support workers to speak up and challenge barriers to speaking up. There are four ratings the CQC give health and social care services they regulate and inspects: outstanding, good, requires improvement and inadequate. 7 Please see below (Annex) for a table with each NHS trusts FTSU Index score (2021) and CQC rating (as of 4 May 2021).
8
The results of the index are representative of those who answered the 2020 NHS
Staff Survey, not the full workforce in these trusts.
The four questions used in the FTSU Index are clinical- and incident-centric and may
not have the same applicability to all staff groups and trust types. Moreover, while
they give an indication of FTSU culture, a healthy speaking up culture is about more
than these issues and includes making improvement suggestions.
There was an additional question included in the 2020 NHS Staff Survey which
focused on workers feeling safe to speak up more generally:
• % of staff "agreeing" or "strongly agreeing" that they would feel safe to speak
up about anything that concerns them in their organisation (question 18f)
Question 18f was not included in this year’s FTSU Index – to allow for comparability
to previous years – but has been analysed alongside the index score for this report.
Please note all figures in this report are rounded to one decimal place which may
show small discrepancies in figures.
The Model Health System
The FTSU Index is also available on the Model Health System.8
Using the Model Health System, trusts can access data on their culture and
engagement, including their FTSU Index and data from their Freedom to Speak Up
Guardian on speaking up cases raised to them, to help build a comprehensive
picture of their organisational culture and identify opportunities to improve.
8 The Model Health System is a data-driven improvement tool that enables NHS health systems and trusts to benchmark quality and productivity. By identifying opportunities for improvement, the Model Health System empowers NHS teams to continuously improve care for patients. The Model Health System incorporates the Model Hospital, which provides hospital provider-level benchmarking.
9
Summary of results
A. FTSU Index – National Averages
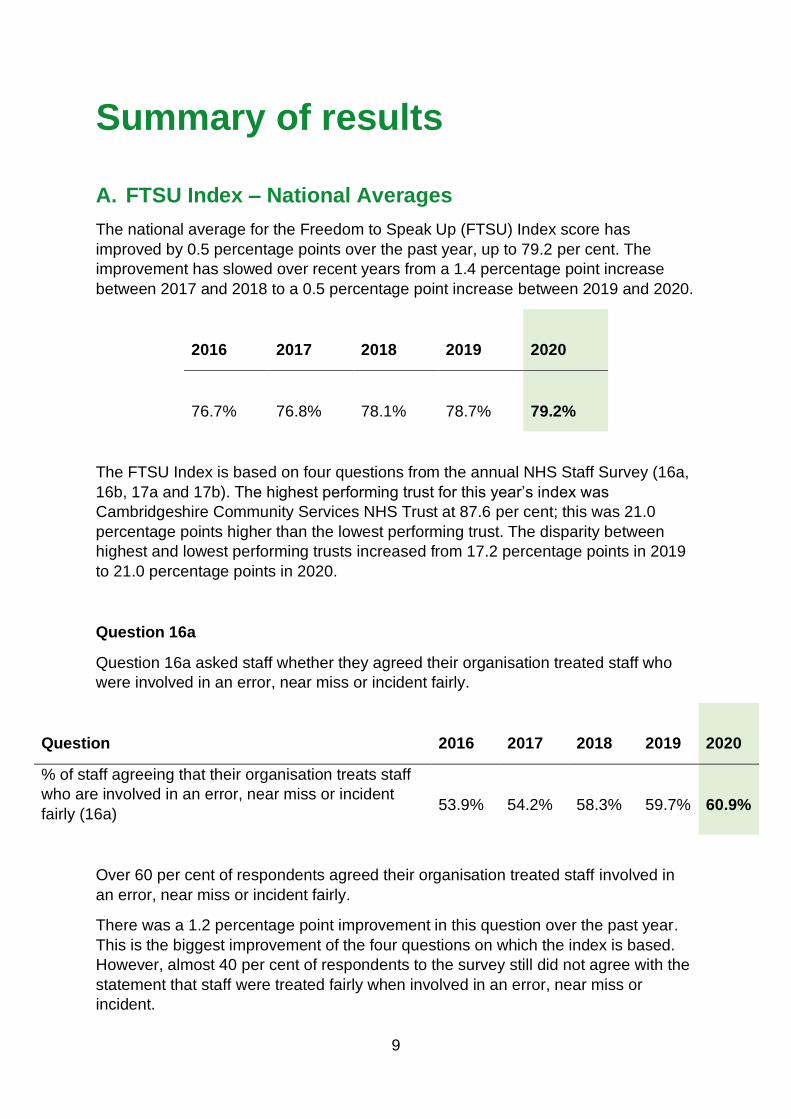
The national average for the Freedom to Speak Up (FTSU) Index score has
improved by 0.5 percentage points over the past year, up to 79.2 per cent. The
improvement has slowed over recent years from a 1.4 percentage point increase
between 2017 and 2018 to a 0.5 percentage point increase between 2019 and 2020.
2016
2017
2018
2019
2020
76.7%
76.8%
78.1%
78.7%
79.2%
The FTSU Index is based on four questions from the annual NHS Staff Survey (16a,
16b, 17a and 17b). The highest performing trust for this year’s index was
Cambridgeshire Community Services NHS Trust at 87.6 per cent; this was 21.0
percentage points higher than the lowest performing trust. The disparity between
highest and lowest performing trusts increased from 17.2 percentage points in 2019
to 21.0 percentage points in 2020.
Question 16a
Question 16a asked staff whether they agreed their organisation treated staff who
were involved in an error, near miss or incident fairly.
Question
2016
2017
2018
2019
2020
% of staff agreeing that their organisation treats staff
who are involved in an error, near miss or incident
fairly (16a)
53.9%
54.2%
58.3%
59.7%
60.9%
Over 60 per cent of respondents agreed their organisation treated staff involved in
an error, near miss or incident fairly.
There was a 1.2 percentage point improvement in this question over the past year.
This is the biggest improvement of the four questions on which the index is based.
However, almost 40 per cent of respondents to the survey still did not agree with the
statement that staff were treated fairly when involved in an error, near miss or
incident.
10
This question saw the largest disparity in trust performance of all four questions. The
highest scoring trust, Solent NHS Trust, scored 74.1 per cent, compared to 36.9 per
cent at the lowest scoring trust.
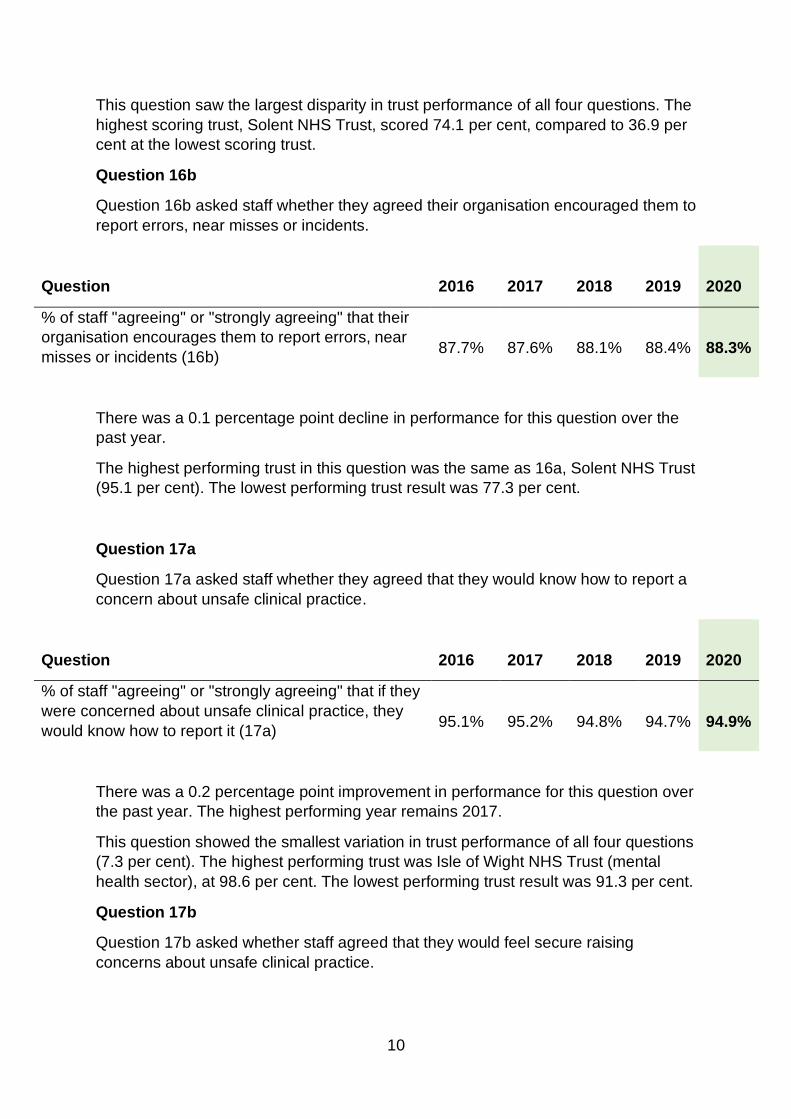
Question 16b
Question 16b asked staff whether they agreed their organisation encouraged them to
report errors, near misses or incidents.
Question
2016
2017
2018
2019
2020
% of staff "agreeing" or "strongly agreeing" that their
organisation encourages them to report errors, near
misses or incidents (16b)
87.7%
87.6%
88.1%
88.4%
88.3%
There was a 0.1 percentage point decline in performance for this question over the
past year.
The highest performing trust in this question was the same as 16a, Solent NHS Trust
(95.1 per cent). The lowest performing trust result was 77.3 per cent.
Question 17a
Question 17a asked staff whether they agreed that they would know how to report a
concern about unsafe clinical practice.
Question
2016
2017
2018
2019
2020
% of staff "agreeing" or "strongly agreeing" that if they
were concerned about unsafe clinical practice, they
would know how to report it (17a)
95.1%
95.2%
94.8%
94.7%
94.9%
There was a 0.2 percentage point improvement in performance for this question over
the past year. The highest performing year remains 2017.
This question showed the smallest variation in trust performance of all four questions
(7.3 per cent). The highest performing trust was Isle of Wight NHS Trust (mental
health sector), at 98.6 per cent. The lowest performing trust result was 91.3 per cent.
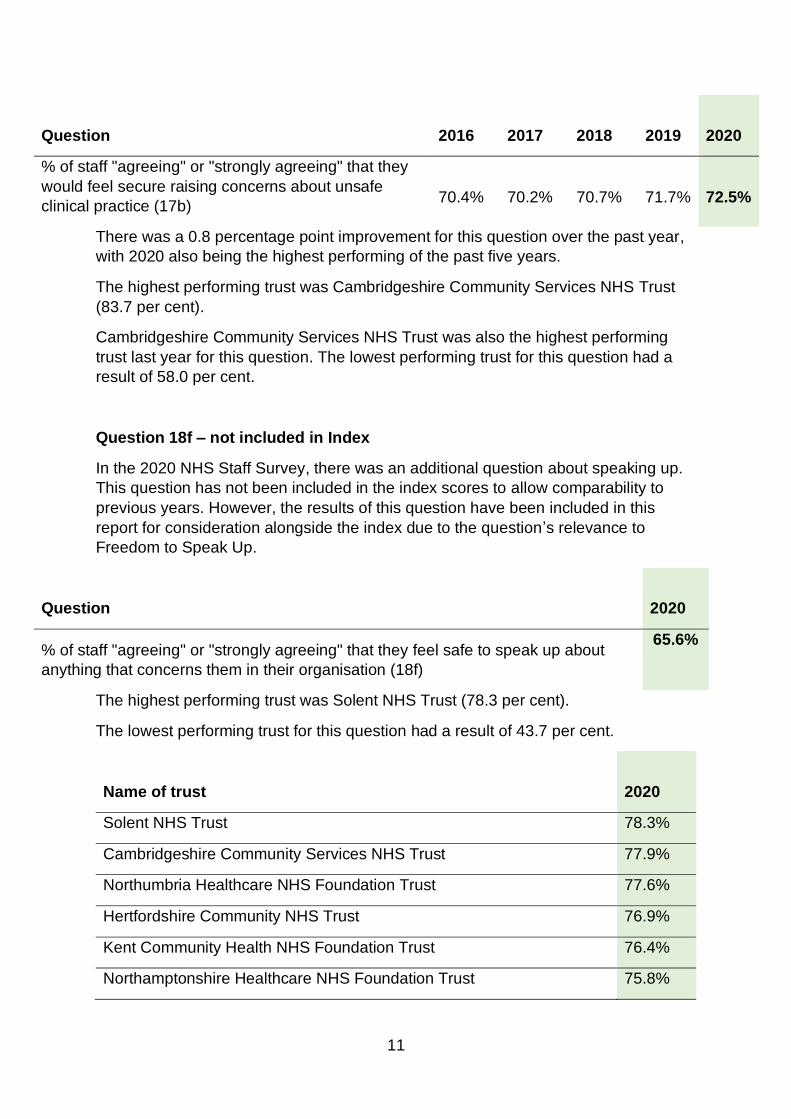
Question 17b
Question 17b asked whether staff agreed that they would feel secure raising
concerns about unsafe clinical practice.
11
Question
2016
2017
2018
2019
2020
% of staff "agreeing" or "strongly agreeing" that they
would feel secure raising concerns about unsafe
clinical practice (17b)
70.4%
70.2%
70.7%
71.7%
72.5%
There was a 0.8 percentage point improvement for this question over the past year,
with 2020 also being the highest performing of the past five years.
The highest performing trust was Cambridgeshire Community Services NHS Trust
(83.7 per cent).
Cambridgeshire Community Services NHS Trust was also the highest performing
trust last year for this question. The lowest performing trust for this question had a
result of 58.0 per cent.
Question 18f – not included in Index
In the 2020 NHS Staff Survey, there was an additional question about speaking up.
This question has not been included in the index scores to allow comparability to
previous years. However, the results of this question have been included in this
report for consideration alongside the index due to the question’s relevance to
Freedom to Speak Up.
Question
2020
% of staff "agreeing" or "strongly agreeing" that they feel safe to speak up about
anything that concerns them in their organisation (18f)
65.6%
The highest performing trust was Solent NHS Trust (78.3 per cent).
The lowest performing trust for this question had a result of 43.7 per cent.
Name of trust
2020
Solent NHS Trust 78.3%
Cambridgeshire Community Services NHS Trust 77.9%
Northumbria Healthcare NHS Foundation Trust 77.6%
Hertfordshire Community NHS Trust 76.9%
Kent Community Health NHS Foundation Trust 76.4%
Northamptonshire Healthcare NHS Foundation Trust 75.8%
12
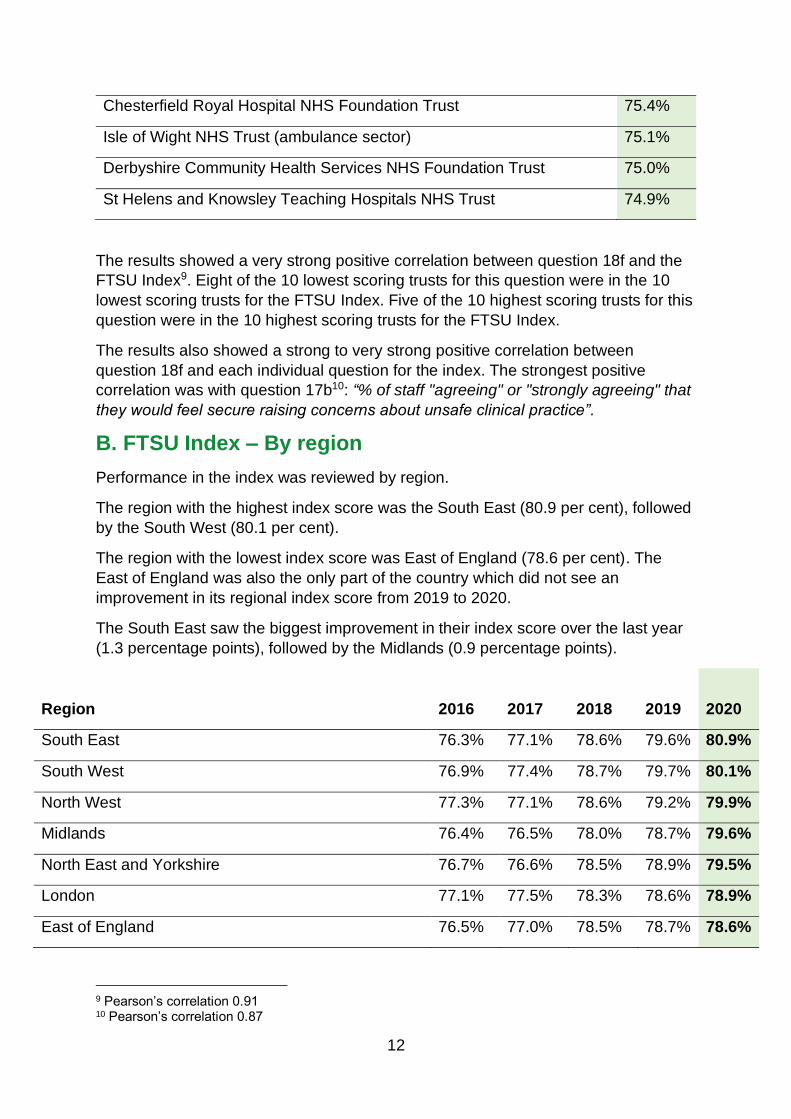
Chesterfield Royal Hospital NHS Foundation Trust 75.4%
Isle of Wight NHS Trust (ambulance sector) 75.1%
Derbyshire Community Health Services NHS Foundation Trust 75.0%
St Helens and Knowsley Teaching Hospitals NHS Trust 74.9%
The results showed a very strong positive correlation between question 18f and the
FTSU Index9. Eight of the 10 lowest scoring trusts for this question were in the 10
lowest scoring trusts for the FTSU Index. Five of the 10 highest scoring trusts for this
question were in the 10 highest scoring trusts for the FTSU Index.
The results also showed a strong to very strong positive correlation between
question 18f and each individual question for the index. The strongest positive
correlation was with question 17b10: “% of staff "agreeing" or "strongly agreeing" that
they would feel secure raising concerns about unsafe clinical practice”.
B. FTSU Index – By region
Performance in the index was reviewed by region.
The region with the highest index score was the South East (80.9 per cent), followed
by the South West (80.1 per cent).
The region with the lowest index score was East of England (78.6 per cent). The
East of England was also the only part of the country which did not see an
improvement in its regional index score from 2019 to 2020.
The South East saw the biggest improvement in their index score over the last year
(1.3 percentage points), followed by the Midlands (0.9 percentage points).
Region
2016
2017
2018
2019
2020
South East 76.3% 77.1% 78.6% 79.6% 80.9%
South West 76.9% 77.4% 78.7% 79.7% 80.1%
North West 77.3% 77.1% 78.6% 79.2% 79.9%
Midlands 76.4% 76.5% 78.0% 78.7% 79.6%
North East and Yorkshire 76.7% 76.6% 78.5% 78.9% 79.5%
London 77.1% 77.5% 78.3% 78.6% 78.9%
East of England 76.5% 77.0% 78.5% 78.7% 78.6%
9 Pearson’s correlation 0.91 10 Pearson’s correlation 0.87
13
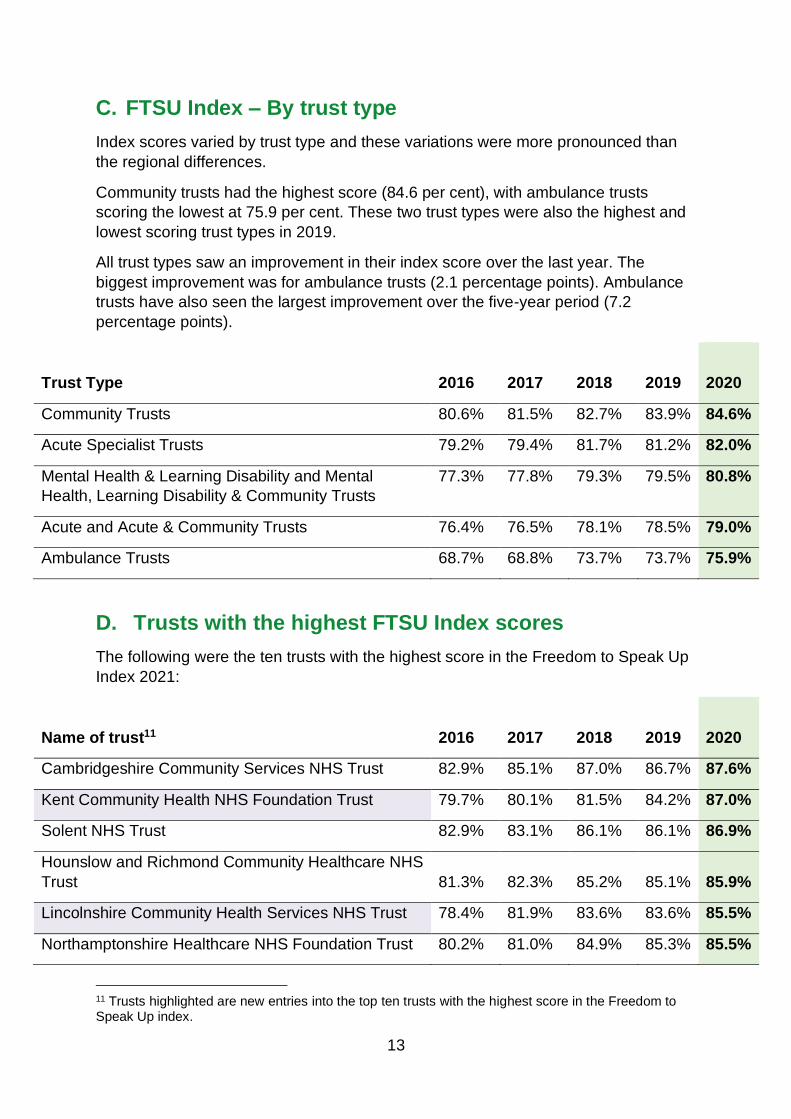
C. FTSU Index – By trust type
Index scores varied by trust type and these variations were more pronounced than
the regional differences.
Community trusts had the highest score (84.6 per cent), with ambulance trusts
scoring the lowest at 75.9 per cent. These two trust types were also the highest and
lowest scoring trust types in 2019.
All trust types saw an improvement in their index score over the last year. The
biggest improvement was for ambulance trusts (2.1 percentage points). Ambulance
trusts have also seen the largest improvement over the five-year period (7.2
percentage points).
Trust Type
2016
2017
2018
2019
2020
Community Trusts 80.6% 81.5% 82.7% 83.9% 84.6%
Acute Specialist Trusts 79.2% 79.4% 81.7% 81.2% 82.0%
Mental Health & Learning Disability and Mental
Health, Learning Disability & Community Trusts
77.3% 77.8% 79.3% 79.5% 80.8%
Acute and Acute & Community Trusts 76.4% 76.5% 78.1% 78.5% 79.0%
Ambulance Trusts 68.7% 68.8% 73.7% 73.7% 75.9%
D. Trusts with the highest FTSU Index scores
The following were the ten trusts with the highest score in the Freedom to Speak Up
Index 2021:
Name of trust11
2016
2017
2018
2019
2020
Cambridgeshire Community Services NHS Trust 82.9% 85.1% 87.0% 86.7% 87.6%
Kent Community Health NHS Foundation Trust 79.7% 80.1% 81.5% 84.2% 87.0%
Solent NHS Trust 82.9% 83.1% 86.1% 86.1% 86.9%
Hounslow and Richmond Community Healthcare NHS
Trust 81.3% 82.3% 85.2% 85.1% 85.9%
Lincolnshire Community Health Services NHS Trust 78.4% 81.9% 83.6% 83.6% 85.5%
Northamptonshire Healthcare NHS Foundation Trust 80.2% 81.0% 84.9% 85.3% 85.5%
11 Trusts highlighted are new entries into the top ten trusts with the highest score in the Freedom to Speak Up index.

14
Hertfordshire Community NHS Trust 81.6% 81.2% 83.2% 84.0% 85.0%
Leeds Community Healthcare NHS Trust 81.6% 83.1% 84.2% 85.1% 84.9%
Sussex Community NHS Foundation Trust 81.1% 82.6% 83.2% 83.9% 84.9%
Liverpool Heart and Chest Hospital NHS Foundation
Trust 83.1% 83.2% 85.6% 84.7% 84.7%
Cambridgeshire Community Services NHS Trust remained the trust with the highest
score in the FTSU Index for the fourth year running. Six of the top 10 trusts were in
the top 10 last year.
E. Trusts with the greatest overall increase and decrease
in FTSU Index scores
The following were the 10 trusts which had the greatest overall increase in their
FTSU Index score from 2019 to 2020:
Name of trust
2019
2020
Percent
age
Point
Change
Isle of Wight NHS Trust (ambulance sector) 77.7% 84.6% 6.9%
East Midlands Ambulance Service NHS Trust 71.8% 76.9% 5.0%
South Tees Hospitals NHS Foundation Trust 73.2% 77.9% 4.6%
Alder Hey Children's NHS Foundation Trust 77.2% 81.7% 4.4%
Isle of Wight NHS Trust (mental health sector) 78.6% 82.9% 4.3%
Nottinghamshire Healthcare NHS Foundation Trust 75.9% 79.9% 4.0%
Bridgewater Community Healthcare NHS Foundation
Trust 78.7% 82.7% 4.0%
Birmingham and Solihull Mental Health NHS Foundation
Trust 74.4% 78.0% 3.7%
Isle of Wight NHS Trust (acute sector) 76.2% 79.8% 3.6%
Central London Community Healthcare NHS Trust 80.6% 83.7% 3.2%

15
The following were the ten trusts which had the greatest overall decrease in their
FTSU Index score:
Name of trust
2019
2020
Percent
age
Point
Change
North Cumbria Integrated Care NHS Foundation Trust 80.2% 75.4% -4.8%
The Royal Orthopaedic Hospital NHS Foundation Trust 83.7% 79.1% -4.7%
West Suffolk NHS Foundation Trust 81.6% 77.4% -4.2%
Mid and South Essex NHS Foundation Trust 80.1% 76.3% -3.9%
South Warwickshire NHS Foundation Trust 84.4% 81.5% -2.9%
East of England Ambulance Service NHS Trust 69.5% 66.6% -2.9%
East Kent Hospitals University NHS Foundation Trust 77.3% 74.4% -2.8%
Harrogate and District NHS Foundation Trust 81.0% 78.4% -2.6%
Great Western Hospitals NHS Foundation Trust 82.0% 79.6% -2.4%
Barking, Havering and Redbridge University Hospitals
NHS Trust 76.6% 74.3% -2.3%
F. FTSU Index by Ethnicity
In his report on the Freedom to Speak Up review, Sir Robert Francis found that
some groups faced barriers to speaking up, including black and ethnic minority
workers.
We reviewed the FTSU Index results by ethnicity.
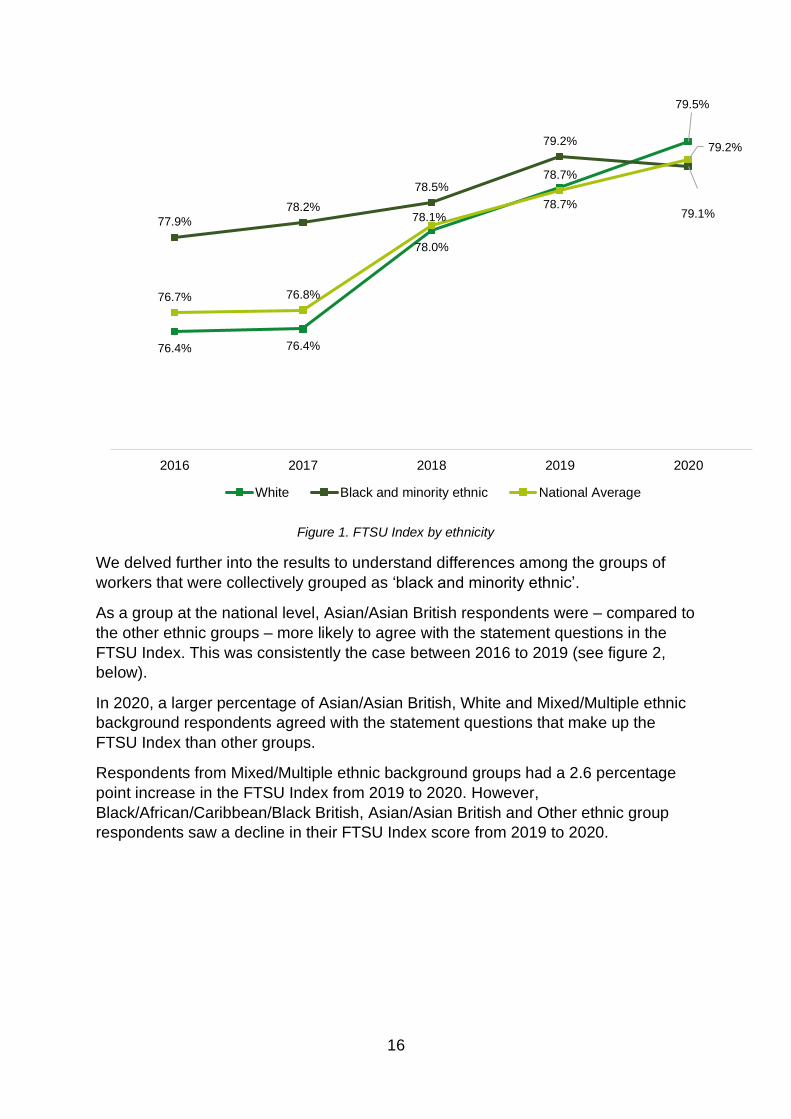
From 2016 to 2019, respondents from black and minority ethnic groups were, as a
group at a national level, more likely than white respondents to agree or strongly
agree with the statement questions that make up the FTSU Index (see figure 1,
below). Over this period, the difference in the responses of black and minority ethnic
staff and white staff decreased and, in 2020, white respondents were more likely to
agree with the statement questions in the FTSU Index.
Compared to the previous index, black and minority ethnic staff taking part in the
2020 NHS Staff Survey were less likely to agree with the questions in the FTSU
index.
16
Figure 1. FTSU Index by ethnicity
We delved further into the results to understand differences among the groups of
workers that were collectively grouped as ‘black and minority ethnic’.
As a group at the national level, Asian/Asian British respondents were – compared to
the other ethnic groups – more likely to agree with the statement questions in the
FTSU Index. This was consistently the case between 2016 to 2019 (see figure 2,
below).
In 2020, a larger percentage of Asian/Asian British, White and Mixed/Multiple ethnic
background respondents agreed with the statement questions that make up the
FTSU Index than other groups.
Respondents from Mixed/Multiple ethnic background groups had a 2.6 percentage
point increase in the FTSU Index from 2019 to 2020. However,
Black/African/Caribbean/Black British, Asian/Asian British and Other ethnic group
respondents saw a decline in their FTSU Index score from 2019 to 2020.
76.4% 76.4%
78.0%
78.7%
79.5%
77.9%
78.2%
78.5%
79.2%
79.1%
76.7% 76.8%
78.1%
78.7%
79.2%
2016 2017 2018 2019 2020
White Black and minority ethnic National Average

17
Figure 2. FTSU Index by ethnicity
G. Q18f by Ethnicity
The results for the additional question in the 2020 staff survey – “% of staff
"agreeing" or "strongly agreeing" that they feel safe to speak up about anything that
concerns them in their organisation” – were also analysed by ethnicity of
respondents.
Compared to black and minority ethnic respondents, white respondents (67.0 per
cent) were more likely to agree that they felt safe to speak up about anything that
concerns them in their organisation (see figure 3, below). This was a much greater
difference (4.9 percentage points) than the FTSU Index (0.4 percentage points).
Figure 3. Q18f by ethnicity
79.5%
78.4%
75.0%
2016 2017 2018 2019 2020
White Mixed/Multiple ethnic background
Asian/Asian British Black/African/Caribbean/Black British
Other ethnic group National Average
67.0%
62.1%
65.6%
White
Black and minority ethnic groups
National Average

18
There were further variations when respondents from black and minority ethnic
groups were split into smaller groups.
Asian/Asian British respondents had the highest rate of these groups for this
question, at 63.9 per cent. Fifty-seven per cent (57.0%) of respondents in the ‘other
ethnic group’ category agreed that they felt safe to speak up about anything that
concerns them in their organisation - 10 percentage points less than white
respondents.
Figure 4. Q18f by ethnicity
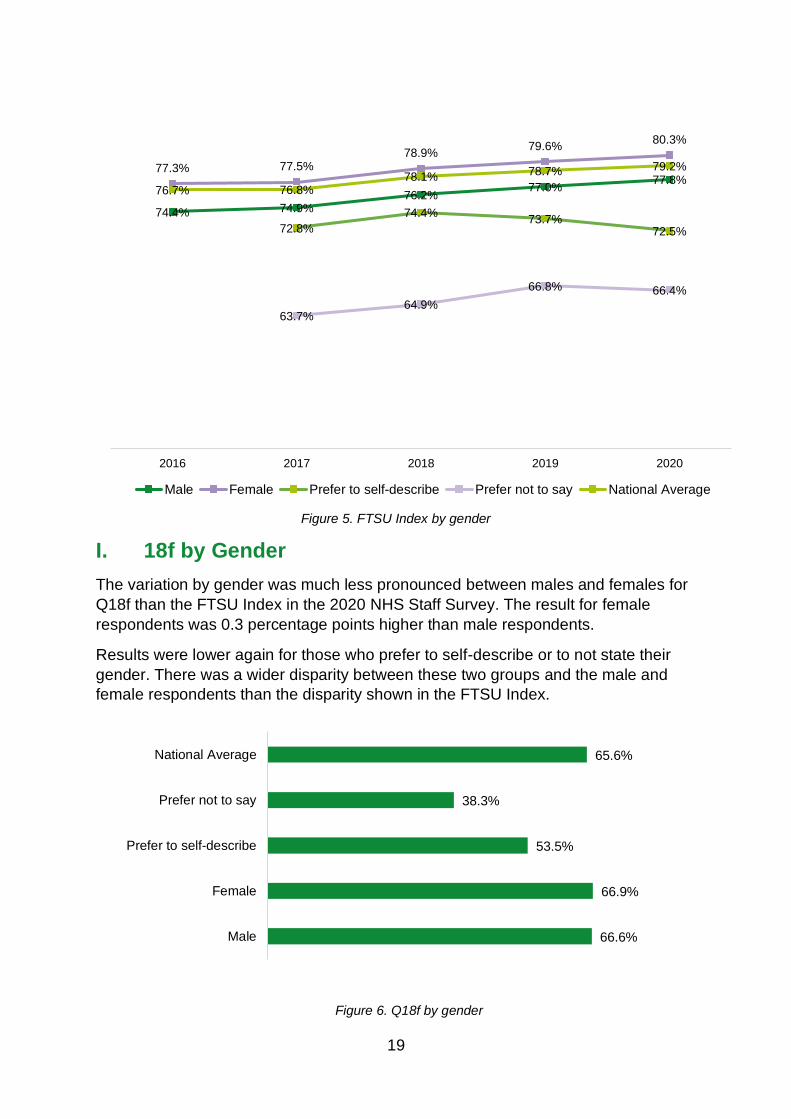
H. FTSU Index by Gender
We reviewed the FTSU Index by gender.
Data from 2016 to 2020 showed females responding to the NHS Staff Survey had a
more positive FTSU Index than males, those who prefer to self-describe or to not
state their gender.
The disparity between females and males was 2.9 percentage points in 2016 and
has lowered to 2.5 percentage points in 2020.
The FTSU Index for respondents who prefer to self-describe their gender has fallen
since 2018, from 74.4 per cent to 72.5 per cent. However, it remains 6.1 percentage
points higher than the FTSU Index for respondents who preferred not to state their
gender.
57.0%
67.0%
60.7%
60.1%
63.9%
65.6%
Other ethnic groups
White
Mixed/Multiple ethnic background
Black/African/Caribbean/Black British
Asian/Asian British
National Average
19
Figure 5. FTSU Index by gender
I. 18f by Gender
The variation by gender was much less pronounced between males and females for
Q18f than the FTSU Index in the 2020 NHS Staff Survey. The result for female
respondents was 0.3 percentage points higher than male respondents.
Results were lower again for those who prefer to self-describe or to not state their
gender. There was a wider disparity between these two groups and the male and
female respondents than the disparity shown in the FTSU Index.
Figure 6. Q18f by gender
74.4% 74.9%76.2%
77.0%77.8%
77.3% 77.5%78.9%
79.6%80.3%
72.8%
74.4%73.7%
72.5%
63.7%64.9%
66.8% 66.4%
76.7% 76.8%78.1% 78.7% 79.2%
2016 2017 2018 2019 2020
Male Female Prefer to self-describe Prefer not to say National Average
66.6%
66.9%
53.5%
38.3%
65.6%
Male
Female
Prefer to self-describe
Prefer not to say
National Average
20
Conclusions and next steps Overall, performance in the FTSU Index has improved. However, the disparity
between the highest and lowest performing trusts has increased. By and large, the
trusts towards the top and bottom of the index have remained the same, suggesting
a lack of upward mobility with regards to staff perceptions of aspects of their
speaking up culture.
Freedom to Speak Up Index
Freedom to Speak Up is about more than the ability to raise concerns about patient
safety. It is about being able to speak up about anything which gets in the way of
doing a great job, whether that’s an idea for improvement, or ways of working, or
behaviour. Therefore, we welcome the new, broader question in the 2020 NHS Staff
Survey, which asked respondents if they feel safe to speak up about anything that
concerns them in their organisation.
We are looking in more depth into the details of the responses to this question.
We invite all organisations to consider using this question, which is not clinically
focused and is applicable to a wider range of organisations, as an additional
measure of their speaking up culture.
Personal characteristics
We will be publishing a further report this year (2021/22) on the potential impact of
personal characteristics on speaking up, with further analysis of results from the
2020 NHS Staff Survey and the 2020 FTSU Guardian Survey.
Speaking up review of ambulance trusts
The FTSU Index suggests a positive speaking up culture is associated with higher
performing organisations as rated by the CQC. This correlation is less apparent with
ambulance trusts which tend to perform less well in the index despite most of them
receiving ‘good’ ratings by the CQC.
In the 2020 FTSU Index report, we committed to working with ambulance trusts and
others to shed light on why ambulance trusts tend to score less well in the index. We
said we would also be working with ambulance trusts and partners to develop a
better understanding of the relationship between the FTSU Index and CQC ratings.
We will commence this work in Q2 2021/22.
21
Case Studies We asked some of the Freedom to Speak Up Guardians whose organisations had
seen the biggest improvements in their FTSU Index from the 2019 to 2020 NHS Staff
surveys to share the work they have been doing to improve their FTSU Index and
speaking up culture.
Isle of Wight NHS Trust
Leisa Gardiner of the Isle of Wight NHS Trust provided a case study of the trust’s
recent performance in the FTSU Index.
The Isle of Wight NHS Trust is the only integrated acute, community, mental health
and ambulance health care provider in England.
Our latest NHS Staff Survey results show that workers feel there has been a
significant improvement in the quality of care, safety, and the health and wellbeing
support on offer to all staff. Morale and engagement have improved with more
people recommending the Trust as a place to work. Importantly we have also seen
improvements across all four divisions in the safety culture.
There has been a real focus on creating an open and honest culture where
communication is free flowing. Our aim is that everyone has an equal opportunity to
speak up, no one is treated differently or discriminated against, that workers feel safe
to speak up and action is taken. This has led to workers feeling valued and
supported. This has been a real IOW NHS Team effort.
The past 12 months have proved challenging, coping with a pandemic, but by
ensuring workers know how and where to raise concerns and that they are
appropriately supported has led to deeper engagement.
During October’s Speak Up Month, I hosted Microsoft Teams sessions for workers
focusing on the importance of speaking up and patient safety. I felt this was crucial at
that time due to the pandemic as workers naturally were concerned about patient
safety and their working environment. Sessions included understanding how
Freedom to Speak Up can influence an open and inclusive culture, psychological
safety at work, and ‘silence isn’t safe’ – involving our people to inspire an open,
honest and just culture.
I also joined the Health and Wellbeing Group and worked closely with the team to
ensure we were doing everything we could to support workers during these
challenging times.
As a Freedom to Speak Up Guardian, being visible and available to workers and to
listen to them when they speak up is key. I ensure I attend staff meetings including
the junior doctors’ forum where I get an opportunity to listen and offer support where
needed. I also recorded a video about how to raise a concern for workers and this is
also shared at staff induction.
22
Maggie Oldham, Chief Executive at Isle of Wight NHS Trust, said:
“Supporting our people to deliver high quality, compassionate care is a key part of
our culture here.
“We are proactive, open and honest and this approach ensures that people can
speak up when something isn’t right.
“It is so important that we create an environment where people are confident to
question things because it helps us to learn and improve and in the end that is what
delivers better care for our community.”
East Midlands Ambulance Service
East Midlands Ambulance Service provided a case study to the NGO following their
5.0 percentage point improvement in the FTSU Index.
In the 2018 FTSU Index Report, East Midlands Ambulance Service (EMAS) had the
dubious honour of being the worst performing Trust with an FTSU Index of only 68.2
per cent.
We knew from our NHS Staff Opinion Survey results and internal cultural audits that
we had issues with our culture.
Some staff told us that they were fearful of reporting incidents and speaking up as
they did not believe that they would be treated fairly. They also did not feel that
action would be taken as a result. This perception of our workers was reflected in our
low rates of Freedom to Speak Up referrals and the high proportion that spoke up
anonymously.
Although our FTSU Index increased to 71.9 per cent in the 2019 Report, placing us
in the top 10 most improved Trusts, we still remained second from bottom of all
Trusts.
We knew that this needed to be urgently addressed. We have been working hard to
create a just and learning culture for all our workers, putting our Trust Values of
Respect, Integrity, Contribution, Teamwork and Competence into practice.
In 2020, we launched a new five-year Quality Improvement Strategy which in
conjunction with our People and Organisational Development Strategy and
Communications Strategy was aimed at improving our culture, making EMAS a
place where people are proud to work.
In addition to recruiting a new Freedom to Speak Up Guardian and launching a
Freedom to Speak Up Online Training module, we have introduced several initiatives
to help support this.
Conversation Café
23
Pre-pandemic, the Chief Executive and executive team, along with department
leads, visited various sites across our region on the “Café bus” with tea, coffee and
biscuits to meet workers. The cafés are an informal opportunity for people to speak
openly about concerns or issues that affect their working environment.
Once the pandemic began, the cafés changed to virtual meetings using a Facebook
Live platform and allowed more people to attend. Workers are encouraged to ask
anything they wish. Questions are answered live in the sessions where possible or
responses are included in our weekly bulletin if not.
Learning from Events
The Clinical and Quality Directorate facilitate 45 minute fortnightly sessions via
Microsoft Teams that all staff and volunteers can join. Cases are presented to share
learning from when things go well as well as when they have gone wrong. Workers
involved in the cases are supported to take part if they wish and the focus is very
much on learning and supporting excellence in practice. A panel of subject matter
experts are available, and questions are encouraged.
We continue to support a just culture where we will learn
from incidents and concerns, supporting our journey
towards a Care Quality Commission rating of
‘outstanding’.
We still have a long way to go but we are proud of just
how far we have come.
South Tees NHS Foundation Trust
At South Tees NHS Foundation Trust, we have some of the most talented and
experienced workers in the country, but they haven’t always been listened to when it
comes to the way services should be organised.
This was something the Care Quality Commission told us in 2019 that we needed to
fix. Since then, we’ve been on a journey to get back to our best.
Following a report by Freedom to Speak Up Guardians in June 2020, the Trust has
embarked on developing a new model. The guardians’ report suggested that
Freedom to Speak Up Guardians who were expected to undertake other more senior
roles may seem less approachable to workers and that a team of guardians recruited
from all levels of the Trust with a variety of backgrounds would be better able to meet
the needs of workers.
This new model has seen a shift in both the way Freedom to Speak Up is
implemented and the views of the 9,000 workers the guardians are supporting. The
Board members, from Chair down, have been proactive in ensuring the Freedom to
Speak Up service was strengthened, and that guardians had access to senior people
whenever they needed.
It was a friend and colleague
that signposted me to FTSU
and I would highly recommend
the same to another colleague.
- Worker feedback
24
To achieve the aim of having a truly representative team, following an open selection
process, a team of four Freedom to Speak Up Guardians working on a part time
basis were appointed in September 2020, giving 75 hours of protected time for the
role. This was felt to be essential if the Trust and the team were to meet their
objectives.
The team’s first priority was to raise the profile of Freedom to Speak Up across the
whole of the Trust and its satellite sites, to inform all workers about the role and how
to access the confidential and impartial service on offer.
To achieve this, the team engaged in a number of strategies, including personal
visits to all Trust sites, marketing materials, attending training and meetings and
forging links with Union representatives, Equality and Diversity and Chaplaincy
groups. The team have also been working with the Trust’s Leadership and Quality
team to embed compassionate leadership throughout the organisation and
supporting our managers to be better leaders.
Other successes in the first six months have included:
• A new Freedom to Speak Up Policy for the Trust.
• Developing a robust communications strategy.
• Having Freedom to Speak Up training included as part of mandatory training
for all staff based on the National Guardian’s Office training for workers and
for middle managers.
• A network of 17 Freedom to Speak Up Champions to support the work of the
guardians, with ring-fenced time for Champions to train and get regular
updates.
• Setting up a secure reporting system for staff with multiple avenues to access
the service.
Over the last six months, verbal and
written feedback has shown that
workers feel secure in speaking up
and are confident that we will deal with
their concerns in an impartial and fair
way whilst respecting their
confidentiality at all steps of the
process.
I have been impressed with the process and
how I have been dealt with since raising my
concerns. I am hopeful that there will be
significant changes in my place of work, going
forward from this. I am glad I spoke to
Guardians and would be willing to do so again
- Worker feedback
25
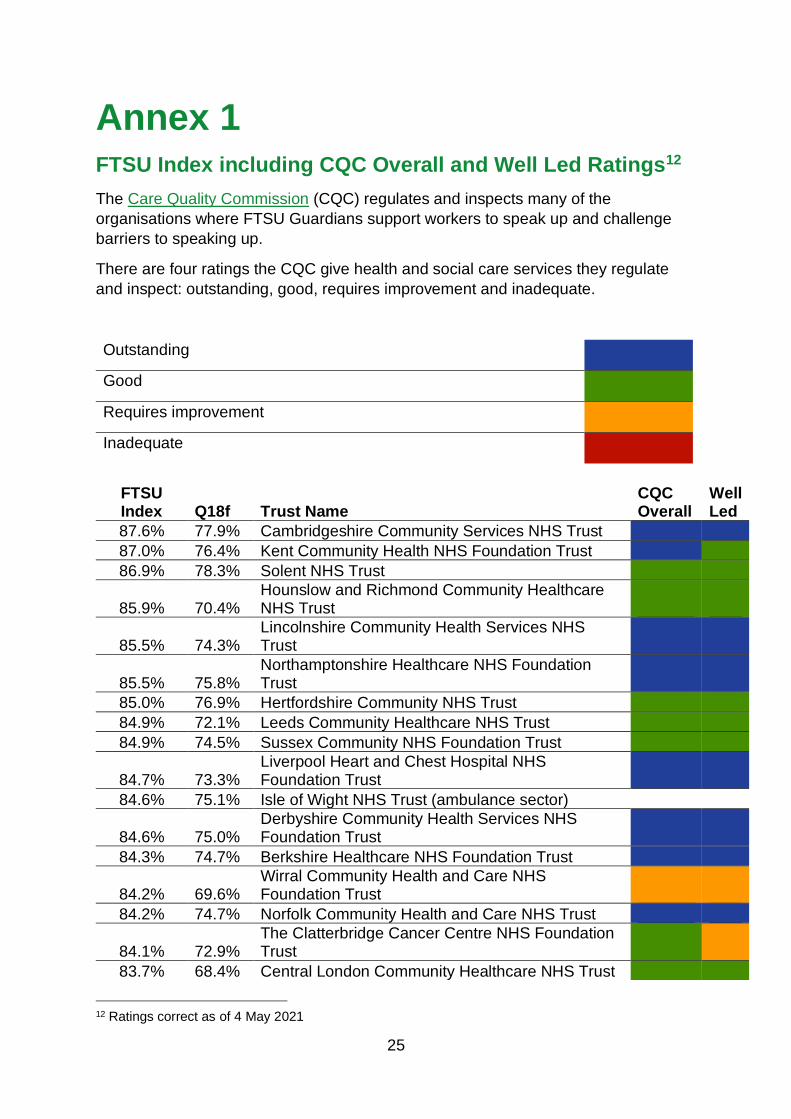
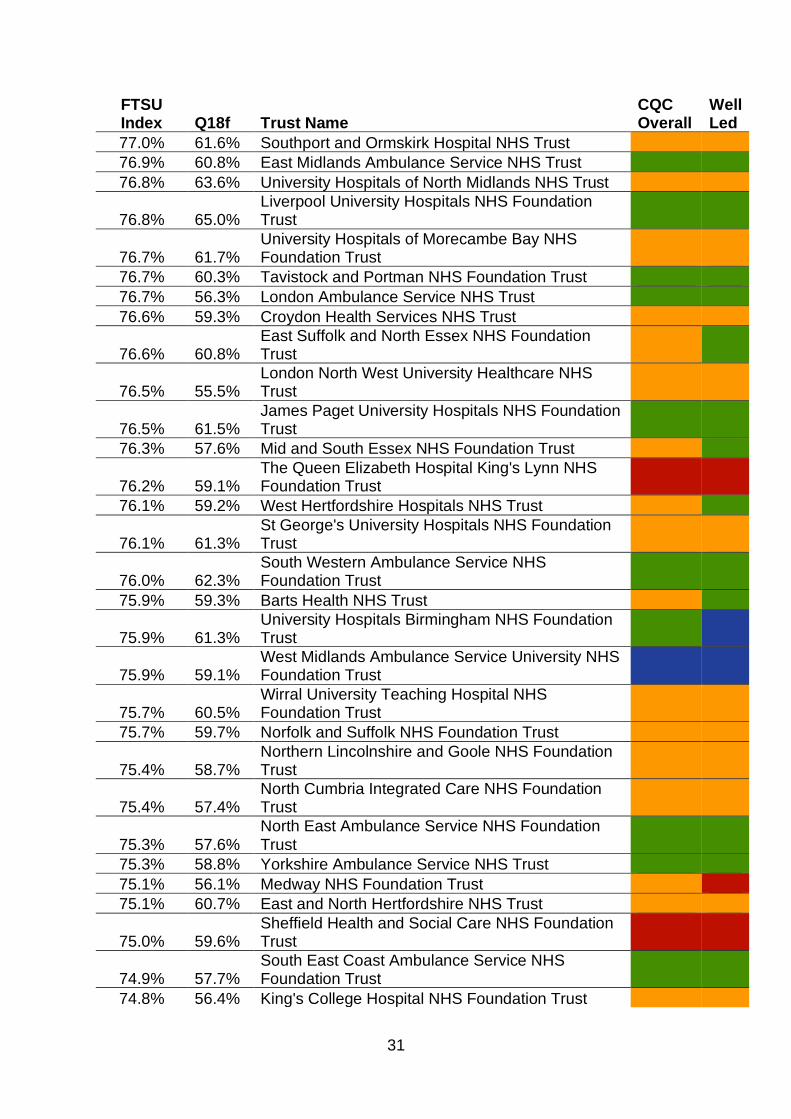
Annex 1 FTSU Index including CQC Overall and Well Led Ratings12
The Care Quality Commission (CQC) regulates and inspects many of the
organisations where FTSU Guardians support workers to speak up and challenge
barriers to speaking up.
There are four ratings the CQC give health and social care services they regulate
and inspect: outstanding, good, requires improvement and inadequate.
Outstanding
Good
Requires improvement
Inadequate
FTSU Index Q18f Trust Name
CQC Overall
Well Led
87.6% 77.9% Cambridgeshire Community Services NHS Trust
87.0% 76.4% Kent Community Health NHS Foundation Trust
86.9% 78.3% Solent NHS Trust
85.9% 70.4% Hounslow and Richmond Community Healthcare NHS Trust
85.5% 74.3% Lincolnshire Community Health Services NHS Trust
85.5% 75.8% Northamptonshire Healthcare NHS Foundation Trust
85.0% 76.9% Hertfordshire Community NHS Trust
84.9% 72.1% Leeds Community Healthcare NHS Trust
84.9% 74.5% Sussex Community NHS Foundation Trust
84.7% 73.3% Liverpool Heart and Chest Hospital NHS Foundation Trust
84.6% 75.1% Isle of Wight NHS Trust (ambulance sector)
84.6% 75.0% Derbyshire Community Health Services NHS Foundation Trust
84.3% 74.7% Berkshire Healthcare NHS Foundation Trust
84.2% 69.6% Wirral Community Health and Care NHS Foundation Trust
84.2% 74.7% Norfolk Community Health and Care NHS Trust
84.1% 72.9% The Clatterbridge Cancer Centre NHS Foundation Trust
83.7% 68.4% Central London Community Healthcare NHS Trust
12 Ratings correct as of 4 May 2021

26
FTSU Index Q18f Trust Name
CQC Overall
Well Led
83.7% 70.6% Royal Surrey County Hospital NHS Foundation Trust
83.6% 74.1% Midlands Partnership NHS Foundation Trust
83.4% 71.6% Hertfordshire Partnership University NHS Foundation Trust
83.2% 72.2% Surrey and Borders Partnership NHS Foundation Trust
83.1% 74.2% The Walton Centre NHS Foundation Trust
83.1% 71.6% The Royal Bournemouth and Christchurch Hospitals NHS Foundation Trust13
83.1% 70.3% The Royal Marsden NHS Foundation Trust
83.1% 73.6% Oxford Health NHS Foundation Trust
83.0% 71.5% Cumbria, Northumberland, Tyne and Wear NHS Foundation Trust
82.9% 72.3% Mersey Care NHS Foundation Trust
82.9% 70.9% Isle of Wight NHS Trust (mental health sector)
82.9% 72.8% North Staffordshire Combined Healthcare NHS Trust
82.8% 77.6% Northumbria Healthcare NHS Foundation Trust
82.7% 73.1% Somerset NHS Foundation Trust
82.7% 68.1% Bridgewater Community Healthcare NHS Foundation Trust
82.7% 71.0% Southern Health NHS Foundation Trust
82.7% 68.8% Herefordshire and Worcestershire Health and Care NHS Trust
82.6% 71.3% Northern Devon Healthcare NHS Trust
82.5% 68.3% Gloucestershire Health and Care NHS Foundation Trust
82.4% 72.9% Lincolnshire Partnership NHS Foundation Trust
82.3% 74.9% St Helens and Knowsley Teaching Hospitals NHS Trust
82.3% 72.8% Surrey and Sussex Healthcare NHS Trust
82.3% 65.8% Royal Brompton and Harefield NHS Foundation Trust14
82.3% 71.1% Yeovil District Hospital NHS Foundation Trust
82.3% 73.9% Guy's and St Thomas' NHS Foundation Trust
82.3% 70.9% Cambridgeshire and Peterborough NHS Foundation Trust
82.2% 71.5% Sherwood Forest Hospitals NHS Foundation Trust
82.2% 72.3% The Robert Jones and Agnes Hunt Orthopaedic Hospital NHS Foundation Trust
82.1% 68.2% Royal Papworth Hospital NHS Foundation Trust
82.1% 69.5% Cambridge University Hospitals NHS Foundation Trust
13 Merged in October 2020 to form University Hospitals Dorset NHS Foundation Trust 14 Merged in February 2021 to form Guy’s and St Thomas’s NHS Foundation Trust

27
FTSU Index Q18f Trust Name
CQC Overall
Well Led
82.0% 73.4% Dorset Healthcare University NHS Foundation Trust
81.9% 73.2% Derbyshire Healthcare NHS Foundation Trust
81.9% 69.8% North West Boroughs Healthcare NHS Foundation Trust
81.8% 70.0% Shropshire Community Health NHS Trust
81.8% 72.1% Queen Victoria Hospital NHS Foundation Trust
81.8% 72.8% Airedale NHS Foundation Trust
81.7% 71.3% Alder Hey Children's NHS Foundation Trust
81.6% 70.8% Cheshire and Wirral Partnership NHS Foundation Trust
81.6% 68.3% North East London NHS Foundation Trust
81.6% 68.2% Portsmouth Hospitals University NHS Trust
81.5% 70.9% South Warwickshire NHS Foundation Trust
81.5% 69.8% Rotherham Doncaster and South Humber NHS Foundation Trust
81.4% 66.4% Gateshead Health NHS Foundation Trust
81.3% 71.7% Mid Cheshire Hospitals NHS Foundation Trust
81.3% 66.7% Devon Partnership NHS Trust
81.2% 68.0% Bolton NHS Foundation Trust
81.2% 66.4% North Tees and Hartlepool NHS Foundation Trust
81.1% 67.0% Isle of Wight NHS Trust (community sector)
81.1% 70.3% Sheffield Children's NHS Foundation Trust
81.1% 65.1% Central and North West London NHS Foundation Trust
81.1% 67.8% Bradford District Care NHS Foundation Trust
81.0% 70.9% Royal Berkshire NHS Foundation Trust
81.0% 75.4% Chesterfield Royal Hospital NHS Foundation Trust
81.0% 68.0% Royal National Orthopaedic Hospital NHS Trust
81.0% 72.4% The Christie NHS Foundation Trust
80.9% 71.3% University Hospital Southampton NHS Foundation Trust
80.9% 66.9% Coventry and Warwickshire Partnership NHS Trust
80.9% 68.4% Birmingham Women's and Children's NHS Foundation Trust
80.8% 69.1% East Lancashire Hospitals NHS Trust
80.8% 67.1% Oxleas NHS Foundation Trust
80.8% 70.1% Sussex Partnership NHS Foundation Trust
80.8% 68.2% University College London Hospitals NHS Foundation Trust
80.8% 72.5% Leeds and York Partnership NHS Foundation Trust
80.7% 66.9% Frimley Health NHS Foundation Trust
80.5% 66.1% Camden and Islington NHS Foundation Trust
80.5% 68.0% Great Ormond Street Hospital for Children NHS Foundation Trust
28
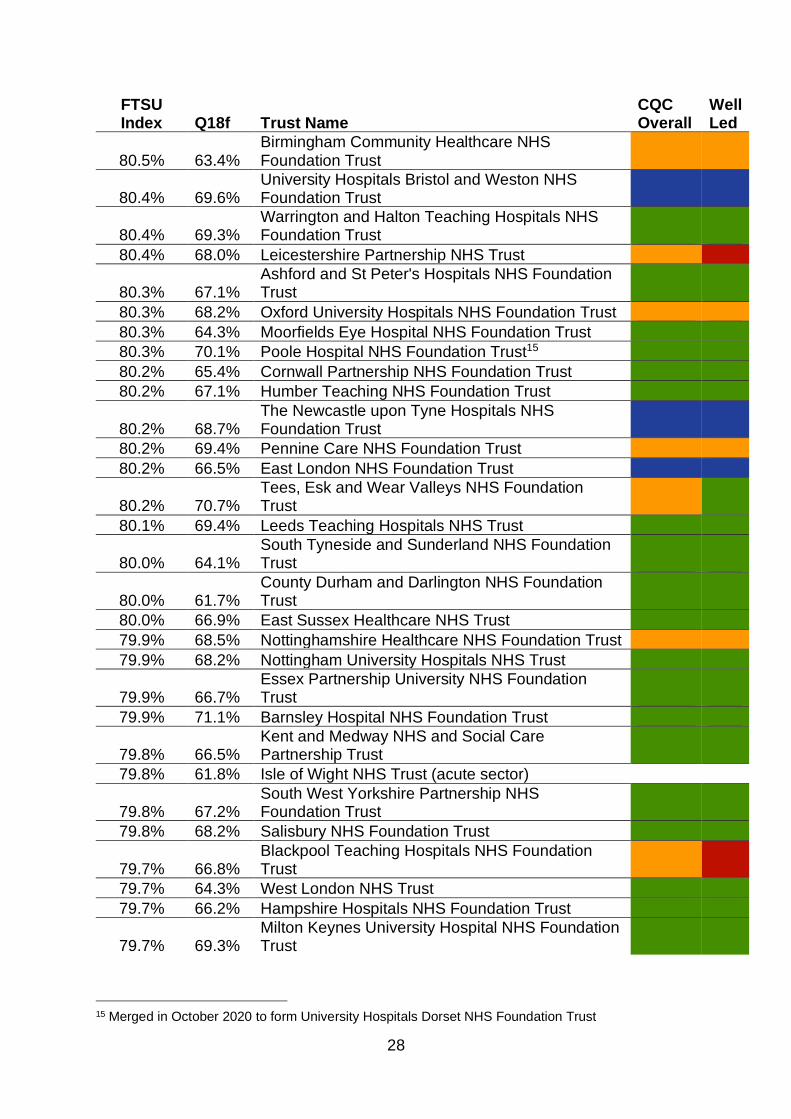
FTSU Index Q18f Trust Name
CQC Overall
Well Led
80.5% 63.4% Birmingham Community Healthcare NHS Foundation Trust
80.4% 69.6% University Hospitals Bristol and Weston NHS Foundation Trust
80.4% 69.3% Warrington and Halton Teaching Hospitals NHS Foundation Trust
80.4% 68.0% Leicestershire Partnership NHS Trust
80.3% 67.1% Ashford and St Peter's Hospitals NHS Foundation Trust
80.3% 68.2% Oxford University Hospitals NHS Foundation Trust
80.3% 64.3% Moorfields Eye Hospital NHS Foundation Trust
80.3% 70.1% Poole Hospital NHS Foundation Trust15
80.2% 65.4% Cornwall Partnership NHS Foundation Trust
80.2% 67.1% Humber Teaching NHS Foundation Trust
80.2% 68.7% The Newcastle upon Tyne Hospitals NHS Foundation Trust
80.2% 69.4% Pennine Care NHS Foundation Trust
80.2% 66.5% East London NHS Foundation Trust
80.2% 70.7% Tees, Esk and Wear Valleys NHS Foundation Trust
80.1% 69.4% Leeds Teaching Hospitals NHS Trust
80.0% 64.1% South Tyneside and Sunderland NHS Foundation Trust
80.0% 61.7% County Durham and Darlington NHS Foundation Trust
80.0% 66.9% East Sussex Healthcare NHS Trust
79.9% 68.5% Nottinghamshire Healthcare NHS Foundation Trust
79.9% 68.2% Nottingham University Hospitals NHS Trust
79.9% 66.7% Essex Partnership University NHS Foundation Trust
79.9% 71.1% Barnsley Hospital NHS Foundation Trust
79.8% 66.5% Kent and Medway NHS and Social Care Partnership Trust
79.8% 61.8% Isle of Wight NHS Trust (acute sector)
79.8% 67.2% South West Yorkshire Partnership NHS Foundation Trust
79.8% 68.2% Salisbury NHS Foundation Trust
79.7% 66.8% Blackpool Teaching Hospitals NHS Foundation Trust
79.7% 64.3% West London NHS Trust
79.7% 66.2% Hampshire Hospitals NHS Foundation Trust
79.7% 69.3% Milton Keynes University Hospital NHS Foundation Trust
15 Merged in October 2020 to form University Hospitals Dorset NHS Foundation Trust
29
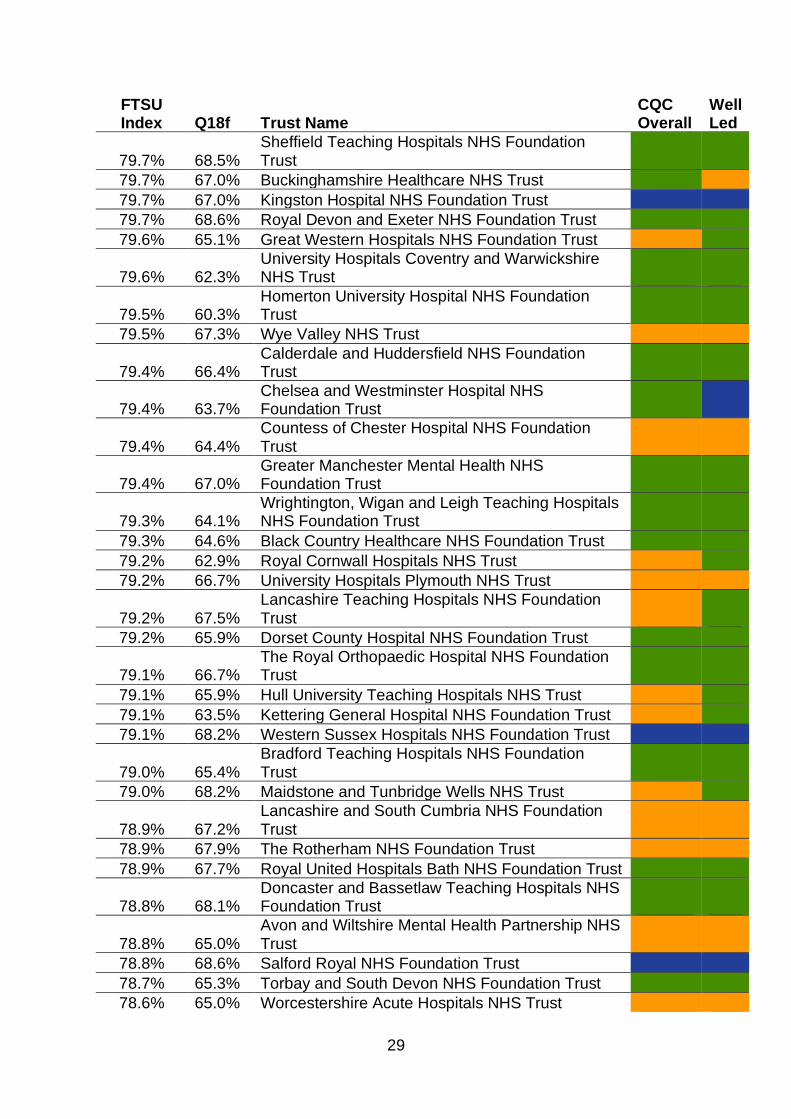
FTSU Index Q18f Trust Name
CQC Overall
Well Led
79.7% 68.5% Sheffield Teaching Hospitals NHS Foundation Trust
79.7% 67.0% Buckinghamshire Healthcare NHS Trust
79.7% 67.0% Kingston Hospital NHS Foundation Trust
79.7% 68.6% Royal Devon and Exeter NHS Foundation Trust
79.6% 65.1% Great Western Hospitals NHS Foundation Trust
79.6% 62.3% University Hospitals Coventry and Warwickshire NHS Trust
79.5% 60.3% Homerton University Hospital NHS Foundation Trust
79.5% 67.3% Wye Valley NHS Trust
79.4% 66.4% Calderdale and Huddersfield NHS Foundation Trust
79.4% 63.7% Chelsea and Westminster Hospital NHS Foundation Trust
79.4% 64.4% Countess of Chester Hospital NHS Foundation Trust
79.4% 67.0% Greater Manchester Mental Health NHS Foundation Trust
79.3% 64.1% Wrightington, Wigan and Leigh Teaching Hospitals NHS Foundation Trust
79.3% 64.6% Black Country Healthcare NHS Foundation Trust
79.2% 62.9% Royal Cornwall Hospitals NHS Trust
79.2% 66.7% University Hospitals Plymouth NHS Trust
79.2% 67.5% Lancashire Teaching Hospitals NHS Foundation Trust
79.2% 65.9% Dorset County Hospital NHS Foundation Trust
79.1% 66.7% The Royal Orthopaedic Hospital NHS Foundation Trust
79.1% 65.9% Hull University Teaching Hospitals NHS Trust
79.1% 63.5% Kettering General Hospital NHS Foundation Trust
79.1% 68.2% Western Sussex Hospitals NHS Foundation Trust
79.0% 65.4% Bradford Teaching Hospitals NHS Foundation Trust
79.0% 68.2% Maidstone and Tunbridge Wells NHS Trust
78.9% 67.2% Lancashire and South Cumbria NHS Foundation Trust
78.9% 67.9% The Rotherham NHS Foundation Trust
78.9% 67.7% Royal United Hospitals Bath NHS Foundation Trust
78.8% 68.1% Doncaster and Bassetlaw Teaching Hospitals NHS Foundation Trust
78.8% 65.0% Avon and Wiltshire Mental Health Partnership NHS Trust
78.8% 68.6% Salford Royal NHS Foundation Trust
78.7% 65.3% Torbay and South Devon NHS Foundation Trust
78.6% 65.0% Worcestershire Acute Hospitals NHS Trust
30
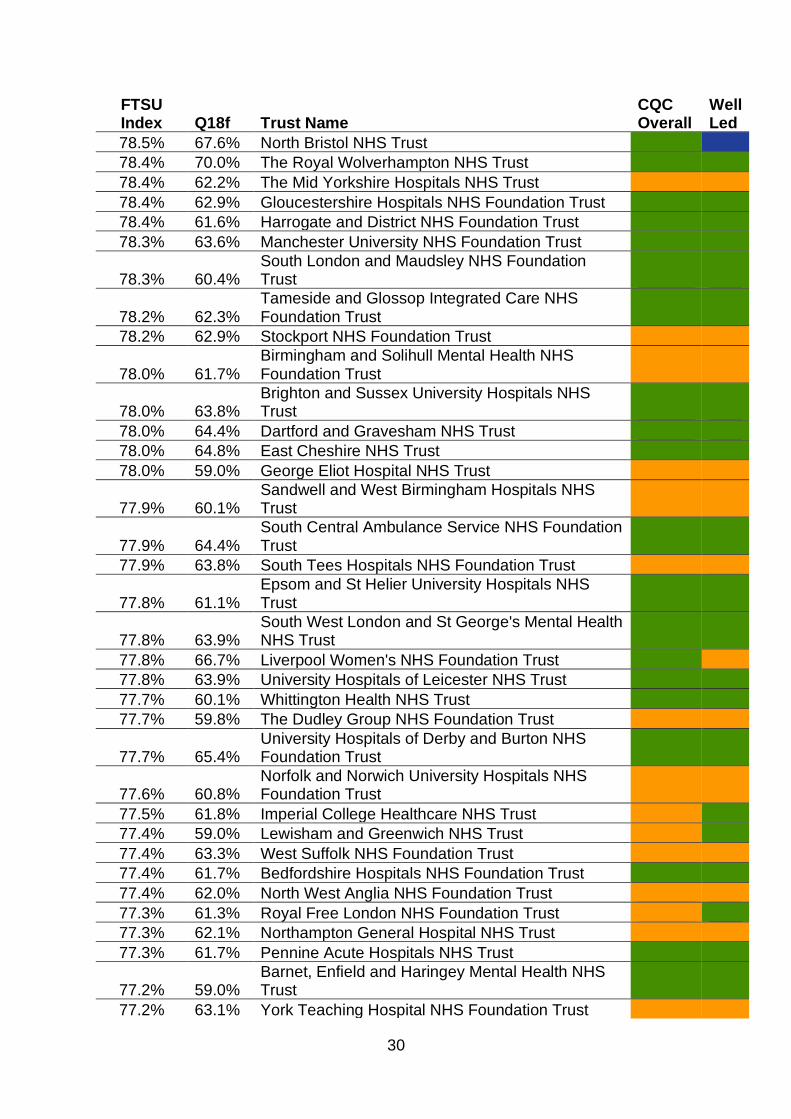
FTSU Index Q18f Trust Name
CQC Overall
Well Led
78.5% 67.6% North Bristol NHS Trust
78.4% 70.0% The Royal Wolverhampton NHS Trust
78.4% 62.2% The Mid Yorkshire Hospitals NHS Trust
78.4% 62.9% Gloucestershire Hospitals NHS Foundation Trust
78.4% 61.6% Harrogate and District NHS Foundation Trust
78.3% 63.6% Manchester University NHS Foundation Trust
78.3% 60.4% South London and Maudsley NHS Foundation Trust
78.2% 62.3% Tameside and Glossop Integrated Care NHS Foundation Trust
78.2% 62.9% Stockport NHS Foundation Trust
78.0% 61.7% Birmingham and Solihull Mental Health NHS Foundation Trust
78.0% 63.8% Brighton and Sussex University Hospitals NHS Trust
78.0% 64.4% Dartford and Gravesham NHS Trust
78.0% 64.8% East Cheshire NHS Trust
78.0% 59.0% George Eliot Hospital NHS Trust
77.9% 60.1% Sandwell and West Birmingham Hospitals NHS Trust
77.9% 64.4% South Central Ambulance Service NHS Foundation Trust
77.9% 63.8% South Tees Hospitals NHS Foundation Trust
77.8% 61.1% Epsom and St Helier University Hospitals NHS Trust
77.8% 63.9% South West London and St George's Mental Health NHS Trust
77.8% 66.7% Liverpool Women's NHS Foundation Trust
77.8% 63.9% University Hospitals of Leicester NHS Trust
77.7% 60.1% Whittington Health NHS Trust
77.7% 59.8% The Dudley Group NHS Foundation Trust
77.7% 65.4% University Hospitals of Derby and Burton NHS Foundation Trust
77.6% 60.8% Norfolk and Norwich University Hospitals NHS Foundation Trust
77.5% 61.8% Imperial College Healthcare NHS Trust
77.4% 59.0% Lewisham and Greenwich NHS Trust
77.4% 63.3% West Suffolk NHS Foundation Trust
77.4% 61.7% Bedfordshire Hospitals NHS Foundation Trust
77.4% 62.0% North West Anglia NHS Foundation Trust
77.3% 61.3% Royal Free London NHS Foundation Trust
77.3% 62.1% Northampton General Hospital NHS Trust
77.3% 61.7% Pennine Acute Hospitals NHS Trust
77.2% 59.0% Barnet, Enfield and Haringey Mental Health NHS Trust
77.2% 63.1% York Teaching Hospital NHS Foundation Trust
31
FTSU Index Q18f Trust Name
CQC Overall
Well Led
77.0% 61.6% Southport and Ormskirk Hospital NHS Trust
76.9% 60.8% East Midlands Ambulance Service NHS Trust
76.8% 63.6% University Hospitals of North Midlands NHS Trust
76.8% 65.0% Liverpool University Hospitals NHS Foundation Trust
76.7% 61.7% University Hospitals of Morecambe Bay NHS Foundation Trust
76.7% 60.3% Tavistock and Portman NHS Foundation Trust
76.7% 56.3% London Ambulance Service NHS Trust
76.6% 59.3% Croydon Health Services NHS Trust
76.6% 60.8% East Suffolk and North Essex NHS Foundation Trust
76.5% 55.5% London North West University Healthcare NHS Trust
76.5% 61.5% James Paget University Hospitals NHS Foundation Trust
76.3% 57.6% Mid and South Essex NHS Foundation Trust
76.2% 59.1% The Queen Elizabeth Hospital King's Lynn NHS Foundation Trust
76.1% 59.2% West Hertfordshire Hospitals NHS Trust
76.1% 61.3% St George's University Hospitals NHS Foundation Trust
76.0% 62.3% South Western Ambulance Service NHS Foundation Trust
75.9% 59.3% Barts Health NHS Trust
75.9% 61.3% University Hospitals Birmingham NHS Foundation Trust
75.9% 59.1% West Midlands Ambulance Service University NHS Foundation Trust
75.7% 60.5% Wirral University Teaching Hospital NHS Foundation Trust
75.7% 59.7% Norfolk and Suffolk NHS Foundation Trust
75.4% 58.7% Northern Lincolnshire and Goole NHS Foundation Trust
75.4% 57.4% North Cumbria Integrated Care NHS Foundation Trust
75.3% 57.6% North East Ambulance Service NHS Foundation Trust
75.3% 58.8% Yorkshire Ambulance Service NHS Trust
75.1% 56.1% Medway NHS Foundation Trust
75.1% 60.7% East and North Hertfordshire NHS Trust
75.0% 59.6% Sheffield Health and Social Care NHS Foundation Trust
74.9% 57.7% South East Coast Ambulance Service NHS Foundation Trust
74.8% 56.4% King's College Hospital NHS Foundation Trust

32
FTSU Index Q18f Trust Name
CQC Overall
Well Led
74.8% 55.8% North Middlesex University Hospital NHS Trust
74.6% 56.2% The Princess Alexandra Hospital NHS Trust
74.4% 55.3% East Kent Hospitals University NHS Foundation Trust
74.4% 59.0% Walsall Healthcare NHS Trust
74.3% 54.4% Barking, Havering and Redbridge University Hospitals NHS Trust
74.2% 58.3% North West Ambulance Service NHS Trust
73.8% 53.6% The Hillingdon Hospitals NHS Foundation Trust
73.6% 54.3% United Lincolnshire Hospitals NHS Trust
71.9% 53.4% The Shrewsbury and Telford Hospital NHS Trust
66.6% 43.7% East of England Ambulance Service NHS Trust