freeport-mcmoran reports first-quarter 2021 results
TRANSCRIPT

Freeport-McMoRan Reports First-Quarter 2021 Results
• Solid execution of operating plans• Production volumes and costs in line with targets• Ramp-up of Grasberg underground mines advancing on schedule• Strong financial results and cash flow generation • Favorable operational and market outlook
▪ Net income attributable to common stock in first-quarter 2021 totaled $718 million, $0.48 per share, and adjusted net income attributable to common stock totaled $756 million, or $0.51 per share, after adjusting for net charges totaling $38 million, $0.03 per share.
▪ Consolidated sales totaled 825 million pounds of copper, 258 thousand ounces of gold and 21 million pounds of molybdenum in first-quarter 2021. Consolidated sales for the year 2021 are expected to approximate 3.85 billion pounds of copper, 1.3 million ounces of gold and 85 million pounds of molybdenum, including 975 million pounds of copper, 330 thousand ounces of gold and 21 million pounds of molybdenum in second-quarter 2021.
▪ Average realized prices in first-quarter 2021 were $3.94 per pound for copper, $1,713 per ounce for gold and $11.62 per pound for molybdenum.
▪ Average unit net cash costs in first-quarter 2021 were $1.39 per pound of copper and are expected to average $1.33 per pound of copper for the year 2021.
▪ Operating cash flows totaled $1.1 billion (net of $0.3 billion of working capital and other uses) in first-quarter 2021. Based on current sales volume and cost estimates, and assuming average prices of $4.00 per pound for copper, $1,750 per ounce for gold and $11.00 per pound for molybdenum for the remainder of 2021, operating cash flows are expected to approximate $6.5 billion (net of $0.1 billion of working capital and other uses) for the year 2021.
▪ Capital expenditures totaled $0.4 billion (including approximately $0.3 billion for major projects) in first-quarter 2021. Capital expenditures for the year 2021, excluding Indonesia smelter expenditures, are expected to approximate $2.3 billion, including $1.4 billion for major projects primarily associated with underground development activities in the Grasberg minerals district in Indonesia.
▪ At March 31, 2021, consolidated debt totaled $9.8 billion and consolidated cash totaled $4.6 billion. FCX had no borrowings and $3.5 billion available under its revolving credit facility at March 31, 2021.
▪ In February 2021, FCX's Board of Directors (Board) adopted a financial policy aligned with strategic objectives of maintaining a strong balance sheet, increasing cash returns to shareholders and advancing opportunities for future growth.
▪ FCX added two new independent directors in April 2021, David P. Abney, retired Chairman and Chief Executive Officer of United Parcel Service, Inc., and Robert W. “Bob” Dudley, retired Group Chief Executive of BP, p.l.c.
1

PHOENIX, AZ, April 22, 2021 - Freeport-McMoRan Inc. (NYSE: FCX) reported first-quarter 2021 net income attributable to common stock of $718 million, $0.48 per share, and adjusted net income attributable to common stock of $756 million, $0.51 per share, after adjusting for net charges totaling $38 million, $0.03 per share. For additional information, refer to the supplemental schedule, "Adjusted Net Income (Loss)," on page VI.
Richard C. Adkerson, Chairman and Chief Executive Officer, said, "During the first quarter, our global team delivered solid operational execution, building a strong foundation for near-term growth in volumes and cash flows. We strengthened our Board of Directors with the addition of David Abney and Bob Dudley, experienced leaders in international business. Our Board adopted a new financial policy aligned with our strategic position as foremost in copper, prioritizing a strong balance sheet, increasing cash returns to shareholders and disciplined investments in profitable long-term growth. We are well positioned for long-term success as a leading producer of copper required for a growing global economy and accelerating demand from copper’s critical role in building infrastructure and the transition to clean energy. Our long-lived and high-quality copper assets are supported by a seasoned and highly motivated global organization focused on building values for all stakeholders."
SUMMARY FINANCIAL DATA
Three Months Ended March 31,2021 2020
(in millions, except per share amounts)Revenuesa,b $ 4,850 $ 2,798 Operating income (loss)a $ 1,532 $ (473) Net income (loss) attributable to common stockc,d $ 718 $ (491) Diluted net income (loss) per share of common stock $ 0.48 $ (0.34)
Diluted weighted-average common shares outstanding 1,477 1,452 Operating cash flowse $ 1,075 $ (38) Capital expenditures $ 370 $ 610 At March 31:
Cash and cash equivalents $ 4,580 $ 1,602 Total debt, including current portion $ 9,809 $ 10,074
a. For segment financial results, refer to the supplemental schedules, "Business Segments," beginning on page VIII.b. Includes favorable (unfavorable) adjustments to prior period provisionally priced concentrate and cathode copper sales
totaling $146 million ($57 million to net income attributable to common stock or $0.04 per share) in first-quarter 2021 and $(107) million ($(45) million to net loss attributable to common stock or $(0.03) per share) in first-quarter 2020. For further discussion, refer to the supplemental schedule, "Derivative Instruments," beginning on page VII.
c. Includes net charges totaling $38 million ($0.03 per share) in first-quarter 2021 and $256 million ($0.18 per share) in first-quarter 2020 that are described in the supplemental schedule, "Adjusted Net Income (Loss)," on page VI.
d. FCX defers recognizing profits on intercompany sales until final sales to third parties occur. For a summary of net impacts from changes in these deferrals, refer to the supplemental schedule, "Deferred Profits," on page VIII.
e. Working capital and other (uses) sources totaled $(336) million in first-quarter 2021 and $119 million in first-quarter 2020.
2

SUMMARY OPERATING DATA
Three Months Ended March 31,2021 2020
Copper (millions of recoverable pounds)Production 910 731 Sales, excluding purchases 825 729 Average realized price per pound $ 3.94 $ 2.43 Site production and delivery costs per pounda $ 1.86 $ 2.19 Unit net cash costs per pounda $ 1.39 $ 1.90
Gold (thousands of recoverable ounces)Production 297 156 Sales 258 144 Average realized price per ounce $ 1,713 $ 1,606
Molybdenum (millions of recoverable pounds)Production 20 19 Sales, excluding purchases 21 21 Average realized price per pound $ 11.62 $ 11.10
a. Reflects per pound weighted-average production and delivery costs and unit net cash costs (net of by-product credits) for all copper mines, before net noncash and other costs. For reconciliations of per pound unit costs by operating division to production and delivery costs applicable to sales reported in FCX's consolidated financial statements, refer to the supplemental schedules, "Product Revenues and Production Costs," beginning on page X.
Responsible Production
2020 Annual Report on Sustainability. Today FCX published its 2020 Annual Report on Sustainability, available on FCX's website at fcx.com. FCX has a long history of environmental, social and governance programs and is continuously striving to improve and embrace evolving stakeholder expectations. This report marks FCX’s 20th year of reporting on its sustainability progress and FCX’s first year reporting in alignment with the Sustainability Accounting Standards Board (SASB) Metals & Mining framework. FCX is committed to building upon its achievements in sustainability and seeks to contribute positively to society by supplying the world with responsibly produced copper.
The Copper Mark. In April 2021, the Morenci operations were awarded the Copper Mark - a new, robust assurance framework demonstrating the copper industry's responsible production practices and contribution to the United Nations Sustainable Development Goals. FCX now has six sites that have achieved the Copper Mark (the Morenci operations, Miami smelter and mine, and El Paso refinery in North America; Cerro Verde and El Abra mines in South America; and Atlantic Copper smelter and refinery in Spain). FCX has future plans to validate all of its copper producing sites against the Copper Mark requirements.
Consolidated Sales Volumes
First-quarter 2021 copper sales of 825 million pounds approximated the January 2021 estimate. First-quarter 2021 copper sales were higher than first-quarter 2020 sales of 729 million pounds of copper, primarily reflecting continued progress of the ramp-up of underground mining at PT Freeport Indonesia (PT-FI), partly offset by timing of shipments.
Gold production in first-quarter 2021 was in line with the January 2021 estimate; however, a deferral of certain shipments in Indonesia to second-quarter 2021 resulted in first-quarter 2021 gold sales of 258 thousand ounces being 6 percent lower than the January 2021 estimate. First-quarter 2021 gold sales were higher than first-quarter 2020 sales of 144 thousand ounces of gold, primarily reflecting continued progress of the ramp-up of underground mining at PT-FI.
First-quarter 2021 molybdenum sales of 21 million pounds were slightly higher than the January 2021 estimate of 20 million pounds of molybdenum and approximated first-quarter 2020 molybdenum sales.
Consolidated sales volumes for the year 2021 are expected to approximate 3.85 billion pounds of copper, 1.3 million ounces of gold and 85 million pounds of molybdenum, including 975 million pounds of copper, 330 thousand ounces of gold and 21 million pounds of molybdenum in second-quarter 2021. Projected sales volumes
3

are dependent on operational performance, continued progress of the ramp-up of underground mining at PT-FI, impacts and duration of the COVID-19 pandemic, timing of shipments, and other factors.
Consolidated Unit Net Cash Costs
Consolidated average unit net cash costs (net of by-product credits) for FCX's copper mines of $1.39 per pound of copper in first-quarter 2021, were significantly lower than the first-quarter 2020 average of $1.90 per pound, primarily reflecting higher sales volumes and by-product credits.
Assuming average prices of $1,750 per ounce of gold and $11.00 per pound of molybdenum for the remainder of 2021 and achievement of current sales volume and cost estimates, consolidated unit net cash costs (net of by-product credits) for FCX's copper mines are expected to average $1.33 per pound of copper for the year 2021. The impact of price changes on consolidated unit net cash costs would approximate $0.03 per pound of copper for each $100 per ounce change in the average price of gold and $0.02 per pound of copper for each $2 per pound change in the average price of molybdenum for the remainder of 2021. Quarterly unit net cash costs vary with fluctuations in sales volumes and realized prices, primarily for gold and molybdenum.
MINING OPERATIONS North America Copper Mines. FCX operates seven open-pit copper mines in North America - Morenci, Bagdad, Safford (including Lone Star), Sierrita and Miami in Arizona, and Chino and Tyrone in New Mexico. In addition to copper, certain of these mines produce molybdenum concentrate, gold and silver. All of the North America mining operations are wholly owned, except for Morenci. FCX records its 72 percent undivided joint venture interest in Morenci using the proportionate consolidation method.
Operating and Development Activities. FCX’s North America operating sites continue to focus on strong execution of operating plans. FCX successfully completed the initial development of the Lone Star copper leach project in the second half of 2020 and is on track to achieve expected annual copper production of approximately 200 million pounds beginning in 2021. FCX is advancing studies for potential near-term incremental oxide expansions and long-term development options for its large-scale sulfide resources at Lone Star.
During first-quarter 2021, mining activities at the Chino mine were restarted at a rate of approximately 100 million pounds of copper per year (approximately 50 percent of capacity).
FCX has substantial resources in the United States (U.S.), primarily associated with existing mining operations, and is advancing the evaluation of project options for future growth.
Operating Data. Following is summary consolidated operating data for the North America copper mines:
Three Months Ended March 31,2021 2020
Copper (millions of recoverable pounds)Production 353 346 Sales, excluding purchases 308 355 Average realized price per pound $ 3.88 $ 2.56
Molybdenum (millions of recoverable pounds)Productiona 8 8
Unit net cash costs per pound of copperb
Site production and delivery, excluding adjustments $ 2.04 $ 2.15 By-product credits (0.30) (0.22) Treatment charges 0.11 0.11 Unit net cash costs $ 1.85 $ 2.04
a. Refer to summary operating data on page 3 for FCX's consolidated molybdenum sales, which includes sales of molybdenum produced at the North America copper mines.
b. For a reconciliation of unit net cash costs per pound to production and delivery costs applicable to sales reported in FCX's consolidated financial statements, refer to the supplemental schedules, "Product Revenues and Production Costs," beginning on page X.
4

FCX's consolidated production volumes from North America in first-quarter 2021 approximated first-quarter 2020. Consolidated copper sales volumes of 308 million pounds in first-quarter 2021 were lower than first-quarter 2020 copper sales volumes of 355 million pounds, primarily reflecting the timing of shipments. North America copper sales are estimated to approximate 1.5 billion pounds for the year 2021, compared with 1.4 billion pounds for the year 2020.
Average unit net cash costs (net of by-product credits) for the North America copper mines of $1.85 per pound of copper in first-quarter 2021 were lower than first-quarter 2020 unit net cash costs of $2.04 per pound, primarily reflecting lower mining costs and higher by-product credits, partly offset by lower sales volumes.
Average unit net cash costs (net of by-product credits) for the North America copper mines are expected to approximate $1.92 per pound of copper for the year 2021, based on achievement of current sales volume and cost estimates and assuming an average molybdenum price of $11.00 per pound for the remainder of 2021. North America's average unit net cash costs for the year 2021 would change by approximately $0.04 per pound for each $2 per pound change in the average price of molybdenum for the remainder of 2021.
South America Mining. FCX operates two copper mines in South America - Cerro Verde in Peru (in which FCX owns a 53.56 percent interest) and El Abra in Chile (in which FCX owns a 51 percent interest). These operations are consolidated in FCX's financial statements. In addition to copper, the Cerro Verde mine produces molybdenum concentrate and silver.
Operating and Development Activities. During first-quarter 2021, Cerro Verde's concentrator facilities exceeded planned milling rates and averaged 390,100 metric tons of ore per day. Operating plan assumptions, which reflect strict COVID-19 restrictions and protocols, include an estimated milling rate of 360,000 metric tons of ore per day for the remainder of 2021, with plans to return to pre-COVID-19 pandemic levels of approximately 400,000 metric tons of ore per day in 2022.
El Abra is implementing plans to increase operating rates during 2021 to pre-COVID-19 pandemic levels, subject to ongoing monitoring of public health conditions in Chile. Stacking rates at El Abra are expected to increase to over 100,000 metric tons of ore per day by mid-2022, resulting in incremental annual production of approximately 70 million pounds of copper.
FCX continues to evaluate a large-scale expansion at El Abra to process additional sulfide material and to achieve higher copper recoveries. El Abra's large sulfide resource could potentially support a major mill project similar to facilities constructed at Cerro Verde in 2015. Technical and economic studies continue to be evaluated to determine the optimal scope and timing for the sulfide project in parallel with extending the life of the current leaching operation.
Operating Data. Following is summary consolidated operating data for South America mining:
Three Months Ended March 31,2021 2020
Copper (millions of recoverable pounds)Production 259 245 Sales 259 247 Average realized price per pound $ 3.96 $ 2.33
Molybdenum (millions of recoverable pounds)Productiona 5 4
Unit net cash costs per pound of copperb
Site production and delivery, excluding adjustments $ 2.01 $ 2.00 c
By-product credits (0.21) (0.17) Treatment charges 0.13 0.16 Royalty on metals 0.01 0.01 Unit net cash costs $ 1.94 $ 2.00
a. Refer to summary operating data on page 3 for FCX's consolidated molybdenum sales, which includes sales of molybdenum produced at Cerro Verde.
5

b. For a reconciliation of unit net cash costs per pound to production and delivery costs applicable to sales reported in FCX's consolidated financial statements, refer to the supplemental schedules, "Product Revenues and Production Costs," beginning on page X.
c. Excludes COVID-19 related costs of $0.08 per pound of copper, primarily associated with idle facility costs at Cerro Verde as a result of the Peruvian government's issuance of a Supreme Decree and declaration of a National Emergency in its efforts to contain the outbreak of COVID-19 and contract cancellation costs at El Abra.
FCX's consolidated copper sales volumes from South America of 259 million pounds in first-quarter 2021 were higher than first-quarter 2020 copper sales volumes of 247 million pounds, primarily reflecting higher milling rates at Cerro Verde.
Copper sales from South America mining are expected to approximate 1.0 billion pounds for the year 2021, consistent with the year 2020.
Average unit net cash costs (net of by-product credits) for South America mining of $1.94 per pound of copper in first-quarter 2021 were lower than first-quarter 2020 unit net cash costs of $2.00 per pound, primarily reflecting higher sales volumes and by-product credits and lower mining costs, partly offset by higher profit sharing costs.
Average unit net cash costs (net of by-product credits) for South America mining are expected to approximate $1.94 per pound of copper for the year 2021, based on current sales volume and cost estimates and assuming an average price of $11.00 per pound of molybdenum for the remainder of 2021.
Indonesia Mining. PT-FI operates one of the world’s largest copper and gold mines at the Grasberg minerals district in Papua, Indonesia. PT-FI produces copper concentrate that contains significant quantities of gold and silver. FCX has a 48.76 percent ownership interest in PT-FI and manages its mining operations. Under the terms of the shareholders agreement, FCX’s economic interest in PT-FI approximates 81 percent through 2022. PT-FI's results are consolidated in FCX's financial statements.
Operating and Development Activities. The ramp-up of underground production at the Grasberg minerals district in Indonesia continues to advance on schedule. First-quarter 2021 highlights include:
• Production approximated 75 percent of the projected ultimate annualized level.
• A total of 50 new drawbells were constructed at the Grasberg Block Cave and Deep Mill Level Zone (DMLZ) underground mines, bringing cumulative open drawbells to over 420.
• Combined average production from the Grasberg Block Cave and DMLZ underground mines approximated 98,500 metric tons of ore per day.
The successful completion of this ramp up is expected to enable PT-FI to generate average annual production for the next several years of 1.55 billion pounds of copper and 1.6 million ounces of gold at an attractive unit net cash cost, providing significant margins and cash flows. PT-FI expects production for the year 2021 to approximate 1.3 billion pounds of copper and 1.3 million ounces of gold, which is nearly double 2020 levels.
PT-FI's estimated annual capital spending on underground mine development projects is expected to average approximately $0.9 billion per year for the two-year period 2021 through 2022, net of scheduled contributions from PT Indonesia Asahan Aluminium (Persero) (PT Inalum, also known as MIND ID). In accordance with applicable accounting guidance, aggregate costs (before scheduled contributions from PT Inalum), which are expected to average $1.1 billion per year for the two-year period 2021 through 2022, will be reflected as an investing activity in FCX's cash flow statement, and contributions from PT Inalum will be reflected as a financing activity.
In March 2021, PT-FI received a one-year extension of its export license through March 15, 2022. Export licenses are valid for one year periods, subject to review and approval by the Indonesia government every six months, depending on smelter construction progress.
Indonesia Smelter. In connection with PT-FI’s 2018 agreement with the Indonesia government associated with the extension of its long-term mining rights, PT-FI committed to construct new domestic smelting capacity totaling 2 million metric tons of concentrate per year by December 2023. Prior to the COVID-19 pandemic, PT-FI selected a site for a greenfield smelter in East Java and initiated ground preparation and commenced engineering and commercial negotiations.
6

During 2020, PT-FI notified the Indonesia government of schedule delays resulting from the COVID-19 pandemic and continues to discuss with the government a revised schedule for the project.
In recent months, PT-FI has explored alternatives to the greenfield smelter and has advanced discussions with the other shareholders of the existing Indonesia smelter (PT Smelting) regarding an expansion to increase smelter concentrate treatment capacity by approximately 30 percent (300,000 metric tons of concentrate per year). Commercial and financial arrangements for this project are being advanced and engineering is in progress. The current estimate for the cost of the expansion, which would be funded by PT-FI, approximates $250 million.
PT-FI has also engaged in discussions with a third party to develop new smelter capacity at an alternate location in Indonesia to fulfill its smelter commitment. To date, commercial discussions have not resulted in a mutually acceptable agreement.
In the interim, PT-FI is continuing planning for the development of a greenfield smelter and related refinery in East Java with a capacity to process 1.7 million metric tons of concentrate per year. The estimated capital cost associated with this project approximates $3 billion. Under this option, PT-FI would finance the smelter development with debt which, pursuant to the shareholders agreement, would be shared 51 percent by PT Inalum and 49 percent by FCX. Construction of new smelter capacity would result in the elimination of export duties, providing an offset to the economic cost associated with the smelter development.
Operating Data. Following is summary consolidated operating data for Indonesia mining:
Three Months Ended March 31,2021 2020
Copper (millions of recoverable pounds)Production 298 140 Sales 258 127 Average realized price per pound $ 4.00 $ 2.28
Gold (thousands of recoverable ounces)Production 294 152 Sales 256 139 Average realized price per ounce $ 1,713 $ 1,606
Unit net cash costs per pound of coppera
Site production and delivery, excluding adjustments $ 1.48 $ 2.68 Gold and silver credits (1.79) (1.85) Treatment charges 0.25 0.30 Export duties 0.11 0.03 Royalty on metals 0.24 0.15 Unit net cash costs $ 0.29 $ 1.31
a. For a reconciliation of unit net cash costs per pound to production and delivery costs applicable to sales reported in FCX's consolidated financial statements, refer to the supplemental schedules, "Product Revenues and Production Costs," beginning on page X.
PT-FI's consolidated sales of 258 million pounds of copper and 256 thousand ounces of gold in first-quarter 2021 were higher than first-quarter 2020 consolidated sales of 127 million pounds of copper and 139 thousand ounces of gold, primarily reflecting higher mining rates and ore grades. Consolidated sales volumes from PT-FI are expected to approximate 1.34 billion pounds of copper and 1.3 million ounces of gold for the year 2021, compared with 804 million pounds of copper and 0.8 million ounces of gold for the year 2020.
PT-FI's first-quarter 2021 production volumes were in line with January 2021 estimates. Changes in shipping schedules resulted in a deferral of certain shipments to second-quarter 2021.
Because of the fixed nature of a large portion of PT-FI's costs, unit net cash costs can vary significantly from quarter to quarter depending on copper and gold volumes. PT-FI's unit net cash costs (including gold and silver credits) of $0.29 per pound of copper in first-quarter 2021, were lower than unit net cash costs of $1.31 per pound in first-quarter 2020, primarily reflecting higher sales volumes.
7

Assuming an average gold price of $1,750 per ounce for the remainder of 2021 and achievement of current sales volume and cost estimates, unit net cash costs (including gold and silver credits) for PT-FI are expected to approximate $0.21 per pound of copper for the year 2021. PT-FI's average unit net cash costs for the year 2021 would change by approximately $0.08 per pound for each $100 per ounce change in the average price of gold for the remainder of 2021.
Molybdenum Mines. FCX operates two wholly owned molybdenum mines in Colorado - the Henderson underground mine and the Climax open-pit mine. The Henderson and Climax mines produce high-purity, chemical-grade molybdenum concentrate, which is typically further processed into value-added molybdenum chemical products. The majority of the molybdenum concentrate produced at the Henderson and Climax mines, as well as from FCX's North America and South America copper mines, is processed at FCX's conversion facilities.
Operating and Development Activities. Production from the molybdenum mines totaled 7 million pounds of molybdenum in both first-quarter 2021 and first-quarter 2020. Refer to summary operating data on page 3 for FCX's consolidated molybdenum sales and average realized prices, which includes sales of molybdenum produced at the Molybdenum mines and from FCX's North America and South America copper mines.
Average unit net cash costs for the Molybdenum mines of $8.98 per pound of molybdenum in first-quarter 2021 were lower than average unit net cash costs of $10.03 per pound in first-quarter 2020, primarily reflecting higher ore grades and lower input and labor costs. Based on current sales volume and cost estimates, average unit net cash costs for the Molybdenum mines are expected to approximate $9.50 per pound of molybdenum for the year 2021.
For a reconciliation of unit net cash costs per pound to production and delivery costs applicable to sales reported in FCX's consolidated financial statements, refer to the supplemental schedules, "Product Revenues and Production Costs," beginning on page X.
EXPLORATION
FCX's mining exploration activities are generally associated with its existing mines, focusing on opportunities to expand reserves and resources to support development of additional future production capacity. Exploration results continue to indicate opportunities for significant future potential reserve additions in North America and South America. Exploration expenditures for the year 2021 are expected to approximate $45 million. FCX has long-lived reserves and a significant resource position in its existing portfolio.
CASH FLOWS, CASH AND DEBT
Operating Cash Flows. FCX generated operating cash flows of $1.1 billion (net of $0.3 billion of working capital and other uses) in first-quarter 2021.
Based on current sales volume and cost estimates, and assuming average prices of $4.00 per pound of copper, $1,750 per ounce of gold and $11.00 per pound of molybdenum for the remainder of 2021, FCX's consolidated operating cash flows are estimated to approximate $6.5 billion (net of $0.1 billion of working capital and other uses) for the year 2021. The impact of price changes for the remainder of 2021 on operating cash flows would approximate $265 million for each $0.10 per pound change in the average price of copper, $70 million for each $100 per ounce change in the average price of gold and $90 million for each $2 per pound change in the average price of molybdenum.
Capital Expenditures. Capital expenditures totaled $0.4 billion in first-quarter 2021 (including approximately $0.3 billion for major projects). Capital expenditures are expected to approximate $2.3 billion for the year 2021, including $1.4 billion for major projects primarily associated with underground development activities in the Grasberg minerals district and exclude Indonesia smelter expenditures.
8

Cash. Following is a summary of the U.S. and international components of consolidated cash and cash equivalents available to the parent company, net of noncontrolling interests' share, taxes and other costs at March 31, 2021 (in billions):
Cash at domestic companies $ 3.5 Cash at international operations 1.1
Total consolidated cash and cash equivalents 4.6 Noncontrolling interests' share (0.5)
Cash, net of noncontrolling interests' share $ 4.1 Withholding taxes — a
Net cash available $ 4.1
a. Rounds to less than $0.1 billion.
Debt. Following is a summary of total debt and the weighted-average interest rates at March 31, 2021 (in millions, except percentages).
Weighted-Average
Interest RateSenior Notes $ 9,141 4.8%Cerro Verde Term Loan 524 2.0%Other 144 1.7%
Total debt $ 9,809 4.6%
At March 31, 2021, FCX had no borrowings, $10 million in letters of credit issued and $3.5 billion available under its revolving credit facility. FCX's 3.55% Senior Notes are due March 2022 ($524 million principal amount), the Cerro Verde Term Loan matures in June 2022, and FCX has no other senior note maturities until March 2023.
FINANCIAL POLICY FCX's Board has adopted a financial policy for the allocation of cash flows aligned with FCX’s strategic
objectives of maintaining a strong balance sheet, increasing cash returns to shareholders and advancing opportunities for future growth. The policy includes a base dividend of $0.30 per share per year and a performance-based payout framework to be implemented following achievement of a net debt target in the range of $3 billion to $4 billion, excluding project debt for additional smelting capacity in Indonesia. Under the performance-based payout framework, up to 50 percent of available cash flows generated after planned capital spending and distributions to noncontrolling interests would be allocated to shareholder returns and the balance to debt reduction and investments in value enhancing growth projects. Available cash flows for performance-based payout distributions in excess of the base dividend will be assessed at least annually.
On March 24, 2021, FCX declared a quarterly cash dividend of $0.075 per share on its common stock, which will be paid on May 3, 2021, to shareholders of record as of April 15, 2021. The declaration of dividends is at the discretion of the Board and will depend upon FCX's financial results, cash requirements, future prospects and other factors deemed relevant by the Board.
WEBCAST INFORMATIONA conference call with securities analysts to discuss FCX's first-quarter 2021 results is scheduled for today
at 10:00 a.m. Eastern Time. The conference call will be broadcast on the Internet along with slides. Interested parties may listen to the conference call live and view the slides by accessing “fcx.com.” A replay of the webcast will be available through Friday, May 21, 2021.
-----------------------------------------------------------------------------------------------------------
FREEPORT: Foremost in CopperFCX is a leading international mining company with headquarters in Phoenix, Arizona. FCX operates large,
long-lived, geographically diverse assets with significant proven and probable reserves of copper, gold and molybdenum. FCX is one of the world’s largest publicly traded copper producers.
9

FCX’s portfolio of assets includes the Grasberg minerals district in Indonesia, one of the world’s largest copper and gold deposits; and significant mining operations in North America and South America, including the large-scale Morenci minerals district in Arizona and the Cerro Verde operation in Peru.
By supplying responsibly produced copper, FCX is proud to be a positive contributor to the world well beyond its operational boundaries. Additional information about FCX is available on FCX's website at fcx.com.Cautionary Statement and Regulation G Disclosure: This press release contains forward-looking statements in which FCX discusses its potential future performance. Forward-looking statements are all statements other than statements of historical facts, such as plans, projections, or expectations relating to ore grades and milling rates; business outlook; production and sales volumes; unit net cash costs; cash flows; capital expenditures; liquidity; operating costs; operating plans; FCX's financial policy; FCX's expectations regarding PT-FI's ramp-up of underground mining activities and future cash flows through 2022; PT-FI's development, financing, construction and completion of a greenfield smelter in Indonesia and possible expansion of the smelter at PT Smelting; FCX’s commitments to deliver responsibly produced copper, including plans to implement and validate all of its operating sites under specific frameworks; improvements in operating procedures and technology; exploration efforts and results; development and production activities, rates and costs; tax rates; export quotas and duties; the impact of copper, gold and molybdenum price changes; the impact of deferred intercompany profits on earnings; mineralization and reserve estimates; execution of the settlement agreements associated with the Louisiana coastal erosion cases and talc-related litigation; and future dividend payments, share purchases and sales. The words “anticipates,” “may,” “can,” “plans,” “believes,” “estimates,” “expects,” “projects,” "targets," “intends,” “likely,” “will,” “should,” “could,” “to be,” ”potential," “assumptions,” “guidance,” “future” and any similar expressions are intended to identify those assertions as forward-looking statements. The declaration of future dividends is at the discretion of the Board and will depend on FCX's financial results, cash requirements, future prospects, global economic conditions, and other factors deemed relevant by the Board.
FCX cautions readers that forward-looking statements are not guarantees of future performance and actual results may differ materially from those anticipated, expected, projected or assumed in the forward-looking statements. Important factors that can cause FCX's actual results to differ materially from those anticipated in the forward-looking statements include, but are not limited to, changes in the credit ratings of FCX; changes in FCX's cash requirements, financial position, financing plans or investment plans; changes in general market, economic, tax, regulatory or industry conditions; the duration and scope of and uncertainties associated with the COVID-19 pandemic, and the impact thereof on commodity prices, FCX’s business and the global economy and any related actions taken by governments and businesses; FCX’s ability to contain and mitigate the risk of spread or major outbreak of COVID-19 at its operating sites, including at PT-FI’s remote operating site in Papua; supply of and demand for, and prices of, copper, gold and molybdenum; mine sequencing; changes in mine plans or operational modifications, delays, deferrals or cancellations; production rates; timing of shipments; results of feasibility studies; potential inventory adjustments; potential impairment of long-lived mining assets; the potential effects of violence in Indonesia generally and in the province of Papua; the Indonesia government's extension of PT-FI's export license after March 15, 2022; risks associated with underground mining; satisfaction of requirements in accordance with PT-FI's special mining license to extend mining rights from 2031 through 2041; the Indonesia government's approval of a deferred schedule for completion of the greenfield smelter in Indonesia; expected results from improvements in operating procedures and technology, including innovation initiatives; industry risks; regulatory changes; political and social risks; labor relations, including labor-related work stoppages; weather- and climate-related risks; environmental risks; litigation results; cybersecurity incidents; changes in general market, economic and industry conditions; financial condition of FCX’s customers, suppliers, vendors, partners and affiliates, particularly during weak economic conditions and extended periods of volatile commodity prices; reductions in liquidity and access to capital; FCX’s ability to comply with its responsible production commitments under specific frameworks and any changes to such frameworks; and other factors described in more detail under the heading “Risk Factors” in FCX's Annual Report on Form 10-K for the year ended December 31, 2020, filed with the U.S. Securities and Exchange Commission (SEC).
Investors are cautioned that many of the assumptions upon which FCX's forward-looking statements are based are likely to change after the date the forward-looking statements are made, including for example commodity prices, which FCX cannot control, and production volumes and costs, some aspects of which FCX may not be able to control. Further, FCX may make changes to its business plans that could affect its results. FCX cautions investors that it undertakes no obligation to update any forward-looking statements, which speak only as of the date made, notwithstanding any changes in its assumptions, changes in business plans, actual experience or other changes.
This press release also contains certain financial measures such as net debt, adjusted net income (loss) and unit net cash costs per pound of copper and molybdenum, which are not recognized under U.S. generally accepted accounting principles. Net debt equals consolidated debt less consolidated cash. As required by SEC Regulation G, reconciliations of these measures to amounts reported in FCX's consolidated financial statements are in the supplemental schedules of this press release.
10

Freeport-McMoRan Inc.SELECTED OPERATING DATA
Three Months Ended March 31,2021 2020 2021 2020
MINING OPERATIONS: Production SalesCOPPER (millions of recoverable pounds) (FCX's net interest in %)
North AmericaMorenci (72%)a 154 173 140 178 Bagdad (100%) 44 46 42 48 Safford (100%) 64 29 51 28 Sierrita (100%) 49 41 42 41 Miami (100%) 4 4 3 4 Chino (100%) 25 42 19 44 Tyrone (100%) 13 11 11 11 Other (100%) — — — 1
Total North America 353 346 308 355
South AmericaCerro Verde (53.56%) 217 203 215 206 El Abra (51%) 42 42 44 41
Total South America 259 245 259 247
IndonesiaGrasberg (48.76%)b 298 140 258 127
Total 910 731 825 c 729 c
Less noncontrolling interests 177 141 170 140 Net 733 590 655 589 Average realized price per pound $ 3.94 $ 2.43
GOLD (thousands of recoverable ounces)(FCX's net interest in %)
North America (100%) 3 4 2 5 Indonesia (48.76%)b 294 152 256 139
Consolidated 297 156 258 144 Less noncontrolling interests 55 29 48 26 Net 242 127 210 118 Average realized price per ounce $ 1,713 $ 1,606
MOLYBDENUM (millions of recoverable pounds)(FCX's net interest in %)
Henderson (100%) 3 2 N/A N/AClimax (100%) 4 5 N/A N/ANorth America copper mines (100%)a 8 8 N/A N/ACerro Verde (53.56%) 5 4 N/A N/A
Consolidated 20 19 21 21 Less noncontrolling interests 2 2 3 3 Net 18 17 18 18 Average realized price per pound $ 11.62 $ 11.10
a. Amounts are net of Morenci's joint venture partners' undivided interests.
b. FCX’s economic interest in PT Freeport Indonesia (PT-FI) approximates 81 percent through 2022 and 48.76 percent thereafter.
c. Consolidated sales volumes exclude purchased copper of 53 million pounds in first-quarter 2021 and 88 million pounds in first-quarter 2020.
I

Freeport-McMoRan Inc.SELECTED OPERATING DATA (continued)
Three Months Ended March 31,2021 2020
100% North America Copper MinesLeach Operations
Leach ore placed in stockpiles (metric tons per day) 705,100 728,100 Average copper ore grade (percent) 0.28 0.27 Copper production (millions of recoverable pounds) 262 235
Mill OperationsOre milled (metric tons per day) 268,000 333,400 Average ore grades (percent):
Copper 0.37 0.32 Molybdenum 0.03 0.02
Copper recovery rate (percent) 78.7 87.0 Production (millions of recoverable pounds):
Copper 151 178 Molybdenum 9 8
100% South America MiningLeach Operations
Leach ore placed in stockpiles (metric tons per day) 153,800 182,500 Average copper ore grade (percent) 0.36 0.37 Copper production (millions of recoverable pounds) 61 63
Mill OperationsOre milled (metric tons per day) 390,100 349,600 a
Average ore grades (percent):Copper 0.31 0.35 Molybdenum 0.01 0.01
Copper recovery rate (percent) 87.6 78.4 Production (millions of recoverable pounds):
Copper 198 182 Molybdenum 5 4
100% Indonesia MiningOre extracted and milled (metric tons per day):
Grasberg Block Cave underground mineb 51,800 19,000 Deep Mill Level Zone underground mineb 46,700 18,500 Deep Ore Zone underground mine 18,600 20,200 Big Gossan underground mine 6,800 6,800 Grasberg open pit — 7,500 c
Total 124,100 d 72,000 Average ore grades:
Copper (percent) 1.41 1.15 Gold (grams per metric ton) 1.08 0.99
Recovery rates (percent):Copper 91.3 91.8 Gold 78.9 76.7
Production (recoverable):Copper (millions of pounds) 298 140 Gold (thousands of ounces) 294 152
100% Molybdenum MinesOre milled (metric tons per day) 18,800 26,900 Average molybdenum ore grade (percent) 0.20 0.15 Molybdenum production (millions of recoverable pounds) 7 7
a. Cerro Verde mill operations were impacted as a result of the Peruvian government's issuance of a Supreme Decree and declaration of a National Emergency in mid-march 2020 associated with its efforts to contain the outbreak of COVID-19.
b. Reflects ore extracted, including ore from development activities that result in metal production.
c. Represents ore from the Grasberg open-pit stockpiles.
d. Does not foot because of rounding.
II

Freeport-McMoRan Inc.CONSOLIDATED STATEMENTS OF OPERATIONS (Unaudited)
Three Months EndedMarch 31,
2021 2020(In Millions, Except Per Share Amounts)
Revenuesa $ 4,850 $ 2,798 Cost of sales:
Production and deliveryb 2,786 2,545 c
Depreciation, depletion and amortization 419 341 c
Metals inventory adjustments 1 222 Total cost of sales 3,206 3,108
Selling, general and administrative expenses 100 110 Mining exploration and research expenses 7 16 Environmental obligations and shutdown costs 5 26 Net loss on sales of assets — 11
Total costs and expenses 3,318 3,271 Operating income (loss) 1,532 (473) Interest expense, netb,d (145) (127) Net loss on early extinguishment of debt — (32) Other income, netb 11 20 Income (loss) before income taxes and equity in affiliated companies' net (losses)
earnings 1,398 (612) (Provision for) benefit from income taxese (443) 60 Equity in affiliated companies' net (losses) earnings (2) 3 Net income (loss) 953 (549) Net (income) loss attributable to noncontrolling interests (235) 58 Net income (loss) attributable to common stockholdersf $ 718 $ (491)
Diluted net income (loss) per share attributable to common stock: $ 0.48 $ (0.34)
Diluted weighted-average common shares outstanding: 1,477 1,452
Dividends declared per share of common stock $ 0.075 $ —
a. Includes adjustments to provisionally priced concentrate and cathode sales. For a summary of adjustments to provisionally priced copper sales, refer to the supplemental schedule, "Derivative Instruments," beginning on page VII.
b. Includes net charges totaling $45 million for first-quarter 2021 and $16 million for first-quarter 2020, which are summarized in the supplemental schedule, "Adjusted Net Income (Loss)," on page VI.
c. Includes COVID-19 related costs totaling $28 million, which are summarized in the supplemental schedule, "Adjusted Net Income (Loss)," on page VI.
d. Consolidated interest costs (before capitalization) totaled $160 million in first-quarter 2021 and $171 million in first-quarter 2020.
e. For a summary of FCX's income taxes, refer to the supplemental schedule, "Income Taxes," on page VII.f. FCX defers recognizing profits on intercompany sales until final sales to third parties occur. For a summary of net impacts
from changes in these deferrals, refer to the supplemental schedule, "Deferred Profits," on page VIII.
III

Freeport-McMoRan Inc.CONSOLIDATED BALANCE SHEETS (Unaudited)
March 31, December 31,2021 2020
(In Millions)ASSETSCurrent assets:
Cash and cash equivalents $ 4,580 $ 3,657 Trade accounts receivable 1,248 892 Income and other tax receivables 522 520 Inventories:
Materials and supplies, net 1,596 1,594 Mill and leach stockpiles 1,007 1,014 Product 1,542 1,285
Other current assets 361 341 Total current assets 10,856 9,303
Property, plant, equipment and mine development costs, net 29,775 29,818 Long-term mill and leach stockpiles 1,475 1,463 Other assets 1,537 1,560 Total assets $ 43,643 $ 42,144
LIABILITIES AND EQUITYCurrent liabilities:
Accounts payable and accrued liabilities $ 2,866 $ 2,708 Current portion of debt 656 34 Accrued income taxes 647 324 Current portion of environmental and asset retirement obligations 331 351 Dividends payable 111 —
Total current liabilities 4,611 3,417 Long-term debt, less current portion 9,153 9,677 Deferred income taxes 4,446 4,408 Environmental and asset retirement obligations, less current portion 3,720 3,705 Other liabilities 2,140 2,269
Total liabilities 24,070 23,476
Equity:Stockholders' equity:
Common stock 160 159 Capital in excess of par value 26,080 26,037 Accumulated deficit (10,963) (11,681) Accumulated other comprehensive loss (580) (583) Common stock held in treasury (3,777) (3,758)
Total stockholders' equity 10,920 10,174 Noncontrolling interestsa 8,653 8,494
Total equity 19,573 18,668 Total liabilities and equity $ 43,643 $ 42,144
a. Includes $4.6 billion associated with the December 2018 PT-FI transaction, including $4.1 billion associated with the PT Indonesia Asahan Aluminium (Persero) acquisition of Rio Tinto's joint venture interest.
IV

Freeport-McMoRan Inc.CONSOLIDATED STATEMENTS OF CASH FLOWS (Unaudited)
Three Months EndedMarch 31,
2021 2020(In Millions)
Cash flow from operating activities:Net income (loss) $ 953 $ (549) Adjustments to reconcile net income (loss) to net cash provided by (used in) operating
activities:
Depreciation, depletion and amortization 419 341 Metals inventory adjustments 1 222 Net loss on sales of assets — 11 Stock-based compensation 41 27 Net charges for environmental and asset retirement obligations, including accretion 39 60 Payments for environmental and asset retirement obligations (54) (71) Net charges for defined pension and postretirement plans — 18 Pension plan contributions (21) (26) Net loss on early extinguishment of debt — 32 Deferred income taxes 38 (118) Charges for Cerro Verde royalty dispute 5 9 Payments for Cerro Verde royalty dispute (38) (57) Other, net 28 (56) Changes in working capital and other:
Accounts receivable (361) 205 Inventories (225) 154 Other current assets 6 (89) Accounts payable and accrued liabilities (42) (149) Accrued income taxes and timing of other tax payments 286 (2)
Net cash provided by (used in) operating activities 1,075 (38)
Cash flow from investing activities:Capital expenditures:
North America copper mines (26) (184) South America (21) (74) Indonesia (310) (326) Molybdenum mines (1) (7) Other (12) (19)
Proceeds from sales of assets 5 66 a
Other, net (3) (2) Net cash used in investing activities (368) (546)
Cash flow from financing activities:Proceeds from debt 130 1,478 Repayments of debt (32) (1,242) Cash dividends paid on common stock — (73) Contributions from noncontrolling interests 41 32 Proceeds from exercised stock options 106 1 Payments for withholding of employee taxes related to stock-based awards (19) (5) Debt financing costs and other, net (1) (18)
Net cash provided by financing activities 225 173
Net increase (decrease) in cash, cash equivalents, restricted cash and restricted cash equivalents 932 (411)
Cash, cash equivalents, restricted cash and restricted cash equivalents at beginning of year 3,903 2,278 Cash, cash equivalents, restricted cash and restricted cash equivalents at end of periodb $ 4,835 $ 1,867
a. Includes $60 million in contingent consideration associated with the 2016 sale of TF Holdings Limited because the average cobalt price exceeded $20 per pound during the 24-month period ending December 31, 2019.
b. Includes restricted cash and restricted cash equivalents of $255 million at March 31, 2021, and $265 million at March 31, 2020.
V

Freeport-McMoRan Inc.ADJUSTED NET INCOME (LOSS)
Adjusted net income (loss) is intended to provide investors and others with information about FCX's recurring operating performance. This information differs from net income (loss) attributable to common stock determined in accordance with U.S. generally accepted accounting principles (GAAP) and should not be considered in isolation or as a substitute for measures of performance determined in accordance with U.S. GAAP. FCX's adjusted net income (loss) follows, which may not be comparable to similarly titled measures reported by other companies (in millions, except per share amounts).
Three Months Ended March 31,2021 2020
Pre-tax After-taxa Per Share Pre-tax After-taxa Per ShareNet income (loss) attributable to common stock N/A $ 718 $ 0.48 N/A $ (491) $ (0.34)
PT-FI charges $ (22) b $ (20) $ (0.01) $ — $ — $ — Metals inventory adjustments (1) (1) — (222) (182) (0.12) COVID-19 related costs — — — (28) c (9) (0.01) Other net charges (23) d (20) (0.01) (16) e (8) (0.01) Net adjustments to environmental obligations and
related litigation reserves 3 3 — (14) (14) (0.01) Net loss on sales of assets — — — (11) (11) (0.01) Net loss on early extinguishment of debt — — — (32) (32) (0.02) Net tax chargesf N/A — — N/A (1) —
$ (44) g $ (38) $ (0.03) g $ (323) $ (256) g $ (0.18)
Adjusted net income (loss) attributable to common stock N/A $ 756 $ 0.51 N/A $ (235) $ (0.16)
a. Reflects impact to FCX net income (loss) attributable to common stock (i.e., net of any taxes and noncontrolling interests).b. Reflects charges recorded in production and delivery ($13 million), interest expense, net ($4 million) and other income, net ($5 million),
associated with contested matters at PT-FI, including an administrative fine levied by the Indonesia government and historical tax audits.
c. Includes $20 million recorded to production and delivery and $8 million to depreciation, depletion, and amortization, primarily related to idle facility costs at Cerro Verde and contract cancellation costs at El Abra.
d. Reflects net charges recorded to production and delivery primarily associated with employee separation charges, international tax matters and asset retirement obligation adjustments.
e. Includes other charges recorded to production and delivery ($5 million), other income, net ($4 million), and interest expense, net ($7 million), primarily related to a change in a tax position at Cerro Verde and asset impairments.
f. Refer to "Income Taxes" below for further discussion of net tax charges.g. Does not foot because of rounding.
VI

Freeport-McMoRan Inc.INCOME TAXES
Following is a summary of the approximate amounts used in the calculation of FCX's consolidated income tax (provision) benefit (in millions, except percentages):
Three Months Ended March 31,2021 2020
Income Tax Income TaxIncome Effective (Provision) Income Effective (Provision)(Loss)a Tax Rate Benefit (Loss)a Tax Rate Benefit
U.S.b $ 185 N/A $ — c $ (451) 1% $ 4 d
South America 493 39% (194) (202) 39% 78 Indonesia 757 42% (315) (19) (63)% (12) e
Eliminations and other (37) N/A 4 60 N/A (11) Rate adjustmentf — N/A 62 — N/A 1 Continuing operations $ 1,398 32% g $ (443) $ (612) 10% g,h $ 60
a. Represents income (loss) before income taxes and equity in affiliated companies' net (losses) earnings.b. In addition to FCX's North America mining operations, the U.S. jurisdiction reflects corporate-level expenses, which include interest
expense associated with senior notes, general and administrative expenses, and environmental obligations and shutdown costs.c. Includes valuation allowance release on prior year unbenefited net operating losses.d. Includes a tax credit of $6 million associated with the removal of a valuation allowance on deferred tax assets. e. Includes a tax charge of $8 million ($7 million net of noncontrolling interest) associated with an unfavorable 2012 Indonesia Supreme
Court ruling.f. In accordance with applicable accounting rules, FCX adjusts its interim provision for income taxes equal to its consolidated tax rate.g. FCX's consolidated effective income tax rate is a function of the combined effective tax rates for the jurisdictions in which it operates. h. FCX's U.S. jurisdiction generated net losses in the first three months of 2020 that did not result in a realized tax benefit; applicable accounting
rules required FCX to adjust its estimated annual effective tax rate to exclude the impact of U.S. net losses.
Assuming achievement of current sales volume and cost estimates and average prices of $4.00 per pound for copper, $1,750 per ounce for gold and $11.00 per pound for molybdenum for the remainder of 2021, FCX estimates its consolidated effective tax rate for the year 2021 would approximate 32 percent. Changes in projected sales volumes and average prices during 2021 would incur tax impacts at estimated effective rates of 40 percent for Peru, 38 percent for Indonesia and 0 percent for the U.S.
DERIVATIVE INSTRUMENTS
For the three months ended March 31, 2021, FCX's mined copper was sold 58 percent in concentrate, 21 percent as cathode and 21 percent as rod from North America operations. Substantially all of FCX's copper concentrate and cathode sales contracts provide final copper pricing in a specified future month (generally one to four months from the shipment date) based primarily on quoted London Metal Exchange (LME) monthly average copper prices. FCX records revenues and invoices customers at the time of shipment based on then-current LME prices, which results in an embedded derivative on provisionally priced concentrate and cathode sales that is adjusted to fair value through earnings each period, using the period-end forward prices, until final pricing on the date of settlement. LME copper settlement prices averaged $3.86 per pound during first-quarter 2021 and settled at $4.01 per pound on March 31, 2021. Because a significant portion of FCX's copper concentrate and cathode sales in any quarterly period usually remain subject to final pricing, the quarter-end forward price is a major determinant of the average recorded copper price for the period. FCX's average realized copper price was $3.94 per pound in first-quarter 2021.
VII

Freeport-McMoRan Inc.DERIVATIVE INSTRUMENTS (continued)
Following is a summary of the adjustments to prior period and current period provisionally priced copper sales (in millions, except per share amounts):
Three Months Ended March 31,2021 2020
PriorPerioda
CurrentPeriodb Total
PriorPerioda
CurrentPeriodb Total
Revenues $ 146 $ 61 $ 207 $ (107) $ (131) $ (238) Net income attributable to common stock $ 57 $ 23 $ 80 $ (45) $ (54) $ (99) Net income per share of common stock $ 0.04 $ 0.02 $ 0.06 $ (0.03) $ (0.04) $ (0.07)
a. Reflects adjustments to provisionally priced copper sales at December 30, 2021 and 2020.b. Reflects adjustments to provisionally priced copper sales during the three months ended March 31, 2021 and 2020.
At March 31, 2021, FCX had provisionally priced copper sales at its copper mining operations totaling 276 million pounds of copper (net of intercompany sales and noncontrolling interests) recorded at an average price of $3.99 per pound, subject to final pricing over the next several months. FCX estimates that each $0.05 change in the price realized from the quarter-end provisional price would have an approximate $8 million effect on 2021 net income attributable to common stock. The LME copper price settled at $4.26 per pound on April 21, 2021.
DEFERRED PROFITS
FCX defers recognizing profits on sales from its mining operations to Atlantic Copper and on 25 percent of PT-FI's sales to PT Smelting (PT-FI's 25 percent-owned Indonesia smelting unit) until final sales to third parties occur. Changes in these deferrals attributable to variability in intercompany volumes resulted in net (reductions) additions to operating income (loss) totaling $(85) million ($(63) million to net income attributable to common stock) in first-quarter 2021 and $11 million ($7 million to net loss attributable to common stock) in first-quarter 2020. FCX's net deferred profits on its inventories at Atlantic Copper and PT Smelting to be recognized in future periods' net income attributable to common stock totaled $121 million at March 31, 2021. Quarterly variations in ore grades, the timing of intercompany shipments and changes in product prices will result in variability in FCX's net deferred profits and quarterly earnings. FCX currently expects second-quarter 2021 results to reflect an increase in net deferred profits, totaling an approximate $60 million reduction to net income, mostly associated with an anticipated increase in sales to Atlantic Copper, which will be recognized in future periods as Atlantic Copper sells final refined products to third parties.
BUSINESS SEGMENTS
FCX has organized its mining operations into four primary divisions – North America copper mines, South America mining, Indonesia mining and Molybdenum mines, and operating segments that meet certain thresholds are reportable segments. Separately disclosed in the following tables are FCX's reportable segments, which include the Morenci, Cerro Verde and Grasberg (Indonesia Mining) copper mines, the Rod & Refining operations and Atlantic Copper Smelting & Refining.
Intersegment sales between FCX’s business segments are based on terms similar to arms-length transactions with third parties at the time of the sale. Intersegment sales may not be reflective of the actual prices ultimately realized because of a variety of factors, including additional processing, the timing of sales to unaffiliated customers and transportation premiums.
FCX allocates certain operating costs, expenses and capital expenditures to its operating divisions and individual segments. However, not all costs and expenses applicable to an operation are allocated. U.S. federal and state income taxes are recorded and managed at the corporate level (included in Corporate, Other & Eliminations), whereas foreign income taxes are recorded and managed at the applicable country level. In addition, most mining exploration and research activities are managed on a consolidated basis, and those costs along with some selling, general and administrative costs, are not allocated to the operating divisions or individual segments. Accordingly, the following segment information reflects management determinations that may not be indicative of what the actual financial performance of each operating division or segment would be if it was an independent entity.
VIII

Freeport-McMoRan Inc. BUSINESS SEGMENTS (continued)
(In millions) Atlantic Corporate,
North America Copper Mines South America Mining Copper OtherOther Cerro Other Indonesia Molybdenum Rod & Smelting & Elimi- FCX
Morenci Mines Total Verde Mines Total Mining Mines Refining & Refining nations TotalThree Months Ended March 31, 2021 Revenues:
Unaffiliated customers $ 4 $ 28 $ 32 $ 917 $ 175 $ 1,092 $ 1,383 a $ — $ 1,309 $ 687 $ 347 b $ 4,850 Intersegment 564 742 1,306 45 — 45 52 70 7 — (1,480) —
Production and delivery 269 480 749 436 103 539 455 57 1,316 673 (1,003) c 2,786 Depreciation, depletion and amortization 34 46 80 89 12 101 199 15 1 7 16 419 Metals inventory adjustments — — — — — — — 1 — — — 1 Selling, general and administrative expenses — 1 1 2 — 2 26 — — 7 64 100 Mining exploration and research expenses — — — — — — — — — — 7 7 Environmental obligations and shutdown costs — — — — — — — — — — 5 5 Operating income (loss) 265 243 508 435 60 495 755 (3) (1) — (222) 1,532
Interest expense, net — — — 13 — 13 1 — — 1 130 145 Provision for (benefit from) income taxes — — — 173 21 194 315 — — — (66) 443 Total assets at March 31, 2021 2,629 5,283 7,912 8,723 1,738 10,461 17,551 1,753 235 997 4,734 43,643 Capital expenditures 10 16 26 20 1 21 310 1 1 6 5 370
Three Months Ended March 31, 2020 Revenues:
Unaffiliated customers $ 2 $ 7 $ 9 $ 376 $ 98 $ 474 $ 445 a $ — $ 1,115 $ 429 $ 326 b $ 2,798 Intersegment 442 534 976 38 — 38 — 71 8 11 (1,104) —
Production and delivery 349 511 860 424 110 534 343 66 1,119 411 (788) 2,545 Depreciation, depletion and amortization 44 48 92 93 15 108 101 16 2 7 15 341 Metals inventory adjustments 4 141 145 — 60 60 — 4 — — 13 222 Selling, general and administrative expenses 1 — 1 2 — 2 28 — — 5 74 110 Mining exploration and research expenses — 1 1 — — — — — — — 15 16 Environmental obligations and shutdown costs — — — — — — — — 1 — 25 26 Net loss on sales of assets — — — — — — — — — — 11 11 Operating income (loss) 46 (160) (114) (105) (87) (192) (27) (15) 1 17 (143) (473)
Interest expense, net 1 — 1 28 — 28 1 — — 3 94 127 (Benefit from) provision for income taxes — — — (52) (26) (78) 12 — — — 6 (60) Total assets at March 31, 2020 2,814 5,093 7,907 8,471 1,655 10,126 16,711 1,788 231 635 2,821 40,219 Capital expenditures 44 140 184 59 15 74 326 7 2 6 11 610
a. Includes PT-FI's sales to PT Smelting totaling $792 million in first-quarter 2021 and $380 million in first-quarter 2020.b. Includes revenues from FCX's molybdenum sales company, which includes sales of molybdenum produced by the Molybdenum mines and by certain of the North America and South America copper
mines.c. Includes charges associated with the major maintenance turnaround at the Miami smelter totaling $68 million.
IX

Freeport-McMoRan Inc.PRODUCT REVENUES AND PRODUCTION COSTS
Unit net cash costs per pound of copper and molybdenum are measures intended to provide investors with information about the cash-generating capacity of FCX's mining operations expressed on a basis relating to the primary metal product for the respective operations. FCX uses this measure for the same purpose and for monitoring operating performance by its mining operations. This information differs from measures of performance determined in accordance with U.S. GAAP and should not be considered in isolation or as a substitute for measures of performance determined in accordance with U.S. GAAP. These measures are presented by other metals mining companies, although FCX's measures may not be comparable to similarly titled measures reported by other companies.
FCX presents gross profit (loss) per pound of copper in the following tables using both a “by-product” method and a “co-product” method. FCX uses the by-product method in its presentation of gross profit (loss) per pound of copper because (i) the majority of its revenues are copper revenues, (ii) it mines ore, which contains copper, gold, molybdenum and other metals, (iii) it is not possible to specifically assign all of FCX's costs to revenues from the copper, gold, molybdenum and other metals it produces and (iv) it is the method used by FCX's management and Board of Directors to monitor FCX's mining operations and to compare mining operations in certain industry publications. In the co-product method presentations, shared costs are allocated to the different products based on their relative revenue values, which will vary to the extent FCX's metals sales volumes and realized prices change.
FCX shows revenue adjustments for prior period open sales as a separate line item. Because these adjustments do not result from current period sales, these amounts have been reflected separately from revenues on current period sales. Noncash and other costs (credits), which are removed from site production and delivery costs in the calculation of unit net cash costs, consist of items such as stock-based compensation costs, long-lived asset impairments, idle facility costs, restructuring and/or unusual charges (credits). As discussed above, gold, molybdenum and other metal revenues at copper mines are reflected as credits against site production and delivery costs in the by-product method. The following schedules are presentations under both the by-product and co-product methods together with reconciliations to amounts reported in FCX's consolidated financial statements.
X
Freeport-McMoRan Inc.PRODUCT REVENUES AND PRODUCTION COSTS (continued)
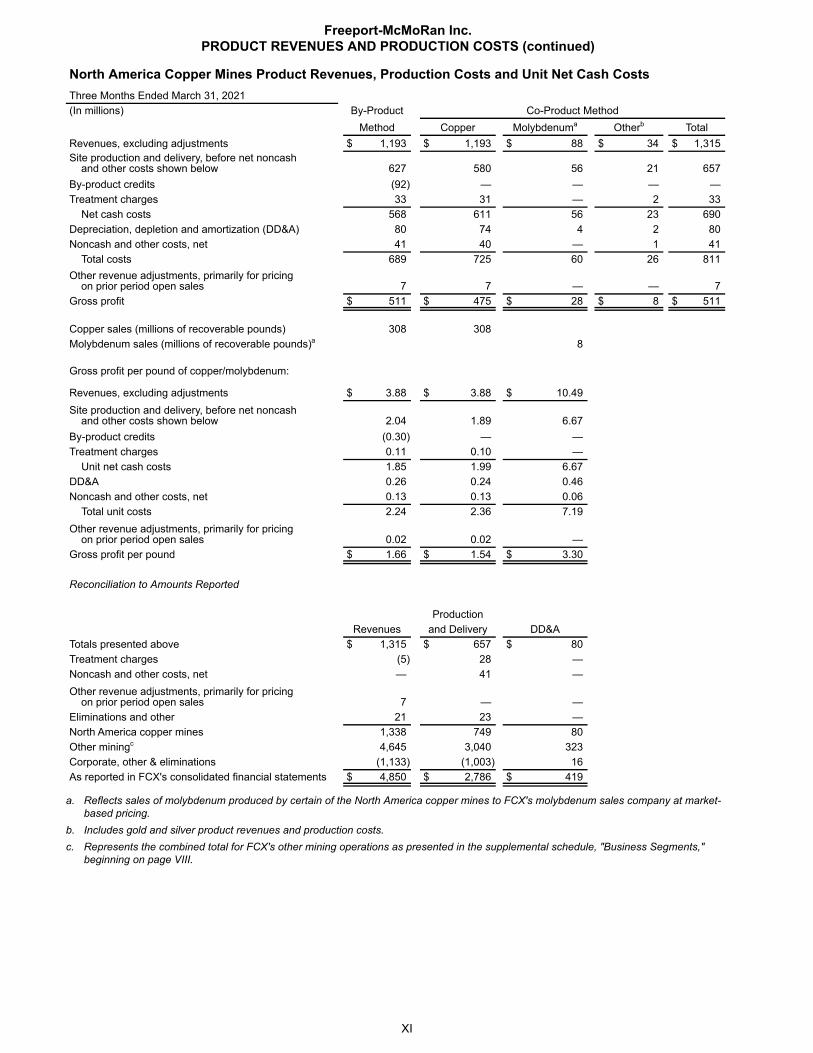
North America Copper Mines Product Revenues, Production Costs and Unit Net Cash CostsThree Months Ended March 31, 2021(In millions) By-Product Co-Product Method
Method Copper Molybdenuma Otherb TotalRevenues, excluding adjustments $ 1,193 $ 1,193 $ 88 $ 34 $ 1,315 Site production and delivery, before net noncash and other costs shown below 627 580 56 21 657 By-product credits (92) — — — — Treatment charges 33 31 — 2 33
Net cash costs 568 611 56 23 690 Depreciation, depletion and amortization (DD&A) 80 74 4 2 80 Noncash and other costs, net 41 40 — 1 41
Total costs 689 725 60 26 811 Other revenue adjustments, primarily for pricing on prior period open sales 7 7 — — 7 Gross profit $ 511 $ 475 $ 28 $ 8 $ 511
Copper sales (millions of recoverable pounds) 308 308 Molybdenum sales (millions of recoverable pounds)a 8
Gross profit per pound of copper/molybdenum:
Revenues, excluding adjustments $ 3.88 $ 3.88 $ 10.49 Site production and delivery, before net noncash and other costs shown below 2.04 1.89 6.67 By-product credits (0.30) — — Treatment charges 0.11 0.10 —
Unit net cash costs 1.85 1.99 6.67 DD&A 0.26 0.24 0.46 Noncash and other costs, net 0.13 0.13 0.06
Total unit costs 2.24 2.36 7.19 Other revenue adjustments, primarily for pricing on prior period open sales 0.02 0.02 — Gross profit per pound $ 1.66 $ 1.54 $ 3.30
Reconciliation to Amounts Reported
ProductionRevenues and Delivery DD&A
Totals presented above $ 1,315 $ 657 $ 80 Treatment charges (5) 28 — Noncash and other costs, net — 41 — Other revenue adjustments, primarily for pricing on prior period open sales 7 — — Eliminations and other 21 23 — North America copper mines 1,338 749 80 Other miningc 4,645 3,040 323 Corporate, other & eliminations (1,133) (1,003) 16 As reported in FCX's consolidated financial statements $ 4,850 $ 2,786 $ 419
a. Reflects sales of molybdenum produced by certain of the North America copper mines to FCX's molybdenum sales company at market-based pricing.
b. Includes gold and silver product revenues and production costs.c. Represents the combined total for FCX's other mining operations as presented in the supplemental schedule, "Business Segments,"
beginning on page VIII.
XI

Freeport-McMoRan Inc.PRODUCT REVENUES AND PRODUCTION COSTS (continued)
North America Copper Mines Product Revenues, Production Costs and Unit Net Cash CostsThree Months Ended March 31, 2020(In millions) By-Product Co-Product Method
Method Copper Molybdenuma Otherb TotalRevenues, excluding adjustments $ 906 $ 906 $ 77 $ 25 $ 1,008 Site production and delivery, before net noncash and other costs shown below 760 698 71 18 787 By-product credits (75) — — — — Treatment charges 38 36 — 2 38
Net cash costs 723 734 71 20 825 DD&A 92 84 6 2 92 Metals inventory adjustments 145 142 — 3 145 Noncash and other costs, net 34 29 2 3 34
Total costs 994 989 79 28 1,096 Other revenue adjustments, primarily for pricing on prior period open sales (22) (22) — — (22) Gross loss $ (110) $ (105) $ (2) $ (3) $ (110)
Copper sales (millions of recoverable pounds) 354 354 Molybdenum sales (millions of recoverable pounds)a 8
Gross loss per pound of copper/molybdenum:
Revenues, excluding adjustments $ 2.56 $ 2.56 $ 9.69 Site production and delivery, before net noncash and other costs shown below 2.15 1.97 8.93 By-product credits (0.22) — — Treatment charges 0.11 0.10 —
Unit net cash costs 2.04 2.07 8.93 DD&A 0.26 0.24 0.73 Metals inventory adjustments 0.41 0.40 — Noncash and other costs, net 0.10 0.09 0.23
Total unit costs 2.81 2.80 9.89 Other revenue adjustments, primarily for pricing on prior period open sales (0.06) (0.06) — Gross loss per pound $ (0.31) $ (0.30) $ (0.20)
Reconciliation to Amounts ReportedMetals
Production InventoryRevenues and Delivery DD&A Adjustments
Totals presented above $ 1,008 $ 787 $ 92 $ 145 Treatment charges (8) 30 — — Noncash and other costs, net — 34 — — Other revenue adjustments, primarily for pricing on prior period open sales (22) — — — Eliminations and other 7 9 — — North America copper mines 985 860 92 145 Other miningc 2,591 2,473 234 64 Corporate, other & eliminations (778) (788) 15 13 As reported in FCX's consolidated financial statements $ 2,798 $ 2,545 $ 341 $ 222
a. Reflects sales of molybdenum produced by certain of the North America copper mines to FCX's molybdenum sales company at market-based pricing.
b. Includes gold and silver product revenues and production costs.c. Represents the combined total for FCX's other mining operations as presented in the supplemental schedule, "Business Segments,"
beginning on page VIII.
XII

Freeport-McMoRan Inc.PRODUCT REVENUES AND PRODUCTION COSTS (continued)
South America Mining Product Revenues, Production Costs and Unit Net Cash CostsThree Months Ended March 31, 2021(In millions) By-Product Co-Product Method
Method Copper Othera TotalRevenues, excluding adjustments $ 1,026 $ 1,026 $ 65 $ 1,091 Site production and delivery, before net noncash and other costs shown below 520 491 39 530 By-product credits (55) — — — Treatment charges 35 35 — 35 Royalty on metals 2 2 — 2
Net cash costs 502 528 39 567 DD&A 101 95 6 101 Noncash and other costs, net 10 9 1 10
Total costs 613 632 46 678 Other revenue adjustments, primarily for pricing on prior period open sales 83 83 — 83 Gross profit $ 496 $ 477 $ 19 $ 496
Copper sales (millions of recoverable pounds) 259 259
Gross profit per pound of copper:
Revenues, excluding adjustments $ 3.96 $ 3.96 Site production and delivery, before net noncash and other costs shown below 2.01 1.90 By-product credits (0.21) — Treatment charges 0.13 0.13 Royalty on metals 0.01 0.01
Unit net cash costs 1.94 2.04 DD&A 0.39 0.37 Noncash and other costs, net 0.04 0.03
Total unit costs 2.37 2.44 Other revenue adjustments, primarily for pricing on prior period open sales 0.32 0.32 Gross profit per pound $ 1.91 $ 1.84
Reconciliation to Amounts Reported
ProductionRevenues and Delivery DD&A
Totals presented above $ 1,091 $ 530 $ 101 Treatment charges (35) — — Royalty on metals (2) — — Noncash and other costs, net — 10 — Other revenue adjustments, primarily for pricing on prior period open sales 83 — — Eliminations and other — (1) — South America mining 1,137 539 101 Other miningb 4,846 3,250 302 Corporate, other & eliminations (1,133) (1,003) 16 As reported in FCX's consolidated financial statements $ 4,850 $ 2,786 $ 419
a. Includes silver sales of 0.9 million ounces ($26.13 per ounce average realized price). Also reflects sales of molybdenum produced by Cerro Verde to FCX's molybdenum sales company at market-based pricing.
b. Represents the combined total for FCX's other mining operations as presented in the supplemental schedule, "Business Segments," beginning on page VIII.
XIII

Freeport-McMoRan Inc.PRODUCT REVENUES AND PRODUCTION COSTS (continued)
South America Mining Product Revenues, Production Costs and Unit Net Cash CostsThree Months Ended March 31, 2020(In millions) By-Product Co-Product Method
Method Copper Othera TotalRevenues, excluding adjustments $ 575 $ 575 $ 54 $ 629 Site production and delivery, before net noncash and other costs shown below 494 457 49 506 By-product credits (42) — — — Treatment charges 40 40 — 40 Royalty on metals 1 1 — 1
Net cash costs 493 498 49 547 DD&A 107 98 9 107 Metals inventory adjustments 60 60 — 60 Noncash and other costs, net 30 b 28 2 30
Total costs 690 684 60 744 Other revenue adjustments, primarily for pricing on prior period open sales (75) (75) — (75) Gross loss $ (190) $ (184) $ (6) $ (190)
Copper sales (millions of recoverable pounds) 247 247
Gross loss per pound of copper:
Revenues, excluding adjustments $ 2.33 $ 2.33 Site production and delivery, before net noncash and other costs shown below 2.00 1.85 By-product credits (0.17) — Treatment charges 0.16 0.16 Royalty on metals 0.01 0.01
Unit net cash costs 2.00 2.02 DD&A 0.44 0.40 Metals inventory adjustments 0.24 0.24 Noncash and other costs, net 0.12 b 0.11
Total unit costs 2.80 2.77 Other revenue adjustments, primarily for pricing on prior period open sales (0.30) (0.30) Gross loss per pound $ (0.77) $ (0.74)
Reconciliation to Amounts ReportedMetals
Production InventoryRevenues and Delivery DD&A Adjustments
Totals presented above $ 629 $ 506 $ 107 $ 60 Treatment charges (40) — — — Royalty on metals (1) — — — Noncash and other costs, net — 30 — — Other revenue adjustments, primarily for pricing on prior period open sales (75) — — — Eliminations and other (1) (2) 1 — South America mining 512 534 108 60 Other miningc 3,064 2,799 218 149 Corporate, other & eliminations (778) (788) 15 13 As reported in FCX's consolidated financial statements $ 2,798 $ 2,545 $ 341 $ 222
a. Includes silver sales of 0.9 million ounces ($17.71 per ounce average realized price). Also reflects sales of molybdenum produced by Cerro Verde to FCX's molybdenum sales company at market-based pricing.
b. Includes COVID-19 related costs of $20 million ($0.08 per pound of copper), primarily associated with idle facility costs at Cerro Verde as a result of the Peruvian government's issuance of a Supreme Decree and declaration of a National Emergency in its efforts to contain the outbreak of COVID-19 and contract cancellation costs at El Abra.
c. Represents the combined total for FCX's other mining operations as presented in the supplemental schedule, "Business Segments," beginning on page VIII.
XIV

Freeport-McMoRan Inc.PRODUCT REVENUES AND PRODUCTION COSTS (continued)
Indonesia Mining Product Revenues, Production Costs and Unit Net Cash CostsThree Months Ended March 31, 2021(In millions) By-Product Co-Product Method
Method Copper Gold Silvera TotalRevenues, excluding adjustments $ 1,032 $ 1,032 $ 437 $ 30 $ 1,499 Site production and delivery, before net noncash and other credits shown below 383 264 112 7 383 Gold and silver credits (462) — — — — Treatment charges 65 45 19 1 65 Export duties 29 20 8 1 29 Royalty on metals 61 42 18 1 61
Net cash costs 76 371 157 10 538 DD&A 199 137 58 4 199 Noncash and other credits, net (8) b (6) (2) — (8)
Total costs 267 502 213 14 729 Other revenue adjustments, primarily for pricing on prior period open sales 65 65 (5) — 60 PT Smelting intercompany loss (49) (34) (14) (1) (49) Gross profit $ 781 $ 561 $ 205 $ 15 $ 781
Copper sales (millions of recoverable pounds) 258 258 Gold sales (thousands of recoverable ounces) 256
Gross profit per pound of copper/per ounce of gold:
Revenues, excluding adjustments $ 4.00 $ 4.00 $ 1,713 Site production and delivery, before net noncash and other credits shown below 1.48 1.02 438 Gold and silver credits (1.79) — — Treatment charges 0.25 0.17 74 Export duties 0.11 0.08 33 Royalty on metals 0.24 0.16 71
Unit net cash costs 0.29 1.43 616 DD&A 0.77 0.53 228 Noncash and other credits, net (0.03) b (0.02) (10)
Total unit costs 1.03 1.94 834 Other revenue adjustments, primarily for pricing on prior period open sales 0.25 0.25 (19) PT Smelting intercompany loss (0.20) (0.14) (56) Gross profit per pound/ounce $ 3.02 $ 2.17 $ 804
Reconciliation to Amounts ReportedProduction
Revenues and Delivery DD&ATotals presented above $ 1,499 $ 383 $ 199 Treatment charges (65) — — Export duties (29) — — Royalty on metals (61) — — Noncash and other credits, net 31 23 — Other revenue adjustments, primarily for pricing on prior period open sales 60 — — PT Smelting intercompany loss — 49 — Indonesia mining 1,435 455 199 Other miningc 4,548 3,334 204 Corporate, other & eliminations (1,133) (1,003) 16 As reported in FCX's consolidated financial statements $ 4,850 $ 2,786 $ 419
a. Includes silver sales of 1.2 million ounces ($24.61 per ounce average realized price).b. Includes credits of $31 million ($0.12 per pound of copper) associated with adjustments to prior year treatment and refining charges and
charges of $13 million ($0.05 per pound of copper) associated with a potential settlement of an administrative fine levied by the Indonesia government.
c. Represents the combined total for FCX's other mining operations as presented in the supplemental schedule, "Business Segments," beginning on page VIII.
XV

Freeport-McMoRan Inc.PRODUCT REVENUES AND PRODUCTION COSTS (continued)
Indonesia Mining Product Revenues, Production Costs and Unit Net Cash Costs
Three Months Ended March 31, 2020(In millions) By-Product Co-Product Method
Method Copper Gold Silvera TotalRevenues, excluding adjustments $ 290 $ 290 $ 223 $ 8 $ 521 Site production and delivery, before net noncash and other costs shown below 341 190 146 5 341 Gold and silver credits (236) — — — — Treatment charges 38 21 16 1 38 Export duties 4 2 2 — 4 Royalty on metals 19 12 7 — 19
Net cash costs 166 225 171 6 402 DD&A 101 56 43 2 101 Noncash and other costs, net 27 15 12 — 27
Total costs 294 296 226 8 530 Other revenue adjustments, primarily for pricing on prior period open sales (20) (20) 5 — (15) PT Smelting intercompany profit 25 14 11 — 25 Gross profit (loss) $ 1 $ (12) $ 13 $ — $ 1
Copper sales (millions of recoverable pounds) 127 127 Gold sales (thousands of recoverable ounces) 139
Gross profit (loss) per pound of copper/per ounce of gold:
Revenues, excluding adjustments $ 2.28 $ 2.28 $ 1,606 Site production and delivery, before net noncash and other costs shown below 2.68 1.49 1,052 Gold and silver credits (1.85) — — Treatment charges 0.30 0.17 118 Export duties 0.03 0.02 11 Royalty on metals 0.15 0.09 50
Unit net cash costs 1.31 1.77 1,231 DD&A 0.79 0.44 310 Noncash and other costs, net 0.21 0.12 82
Total unit costs 2.31 2.33 1,623 Other revenue adjustments, primarily for pricing on prior period open sales (0.16) (0.16) 33 PT Smelting intercompany profit 0.20 0.11 77 Gross profit (loss) per pound/ounce $ 0.01 $ (0.10) $ 93
Reconciliation to Amounts ReportedProduction
Revenues and Delivery DD&ATotals presented above $ 521 $ 341 $ 101 Treatment charges (38) — — Export duties (4) — — Royalty on metals (19) — — Noncash and other costs, net — 27 — Other revenue adjustments, primarily for pricing on prior period open sales (15) — — PT Smelting intercompany profit — (25) — Indonesia mining 445 343 101 Other miningb 3,131 2,990 225 Corporate, other & eliminations (778) (788) 15 As reported in FCX's consolidated financial statements $ 2,798 $ 2,545 $ 341
a. Includes silver sales of 0.6 million ounces ($14.09 per ounce average realized price).b. Represents the combined total for FCX's other mining operations as presented in the supplemental schedule, "Business Segments,"
beginning on page VIII.
XVI

Freeport-McMoRan Inc.PRODUCT REVENUES AND PRODUCTION COSTS (continued)
Molybdenum Mines Product Revenues, Production Costs and Unit Net Cash Costs
Three Months Ended March 31,(In millions) 2021 2020
Revenues, excluding adjustmentsa $ 76 $ 77 Site production and delivery, before net noncash and other costs shown below 54 64 Treatment charges and other 6 6
Net cash costs 60 70 DD&A 15 16 Metals inventory adjustments 1 4 Noncash and other costs, net 3 2
Total costs 79 92 Gross loss $ (3) $ (15)
Molybdenum sales (millions of recoverable pounds)a 7 7
Gross loss per pound of molybdenum:
Revenues, excluding adjustmentsa $ 11.38 $ 10.97 Site production and delivery, before net noncash and other costs shown below 8.13 9.17 Treatment charges and other 0.85 0.86
Unit net cash costs 8.98 10.03 DD&A 2.23 2.29 Metals inventory adjustments 0.13 0.51 Noncash and other costs, net 0.42 0.30
Total unit costs 11.76 13.13 Gross loss per pound $ (0.38) $ (2.16)
Reconciliation to Amounts ReportedMetals
Production InventoryThree Months Ended March 31, 2021 Revenues and Delivery DD&A AdjustmentsTotals presented above $ 76 $ 54 $ 15 $ 1 Treatment charges and other (6) — — — Noncash and other costs, net — 3 — — Molybdenum mines 70 57 15 1 Other miningb 5,913 3,732 388 — Corporate, other & eliminations (1,133) (1,003) 16 — As reported in FCX's consolidated financial statements $ 4,850 $ 2,786 $ 419 $ 1
Three Months Ended March 31, 2020Totals presented above $ 77 $ 64 $ 16 $ 4 Treatment charges and other (6) — — — Noncash and other costs, net — 2 — — Molybdenum mines 71 66 16 4 Other miningb 3,505 3,267 310 205 Corporate, other & eliminations (778) (788) 15 13 As reported in FCX's consolidated financial statements $ 2,798 $ 2,545 $ 341 $ 222
a. Reflects sales of the Molybdenum mines' production to FCX's molybdenum sales company at market-based pricing. On a consolidated basis, realizations are based on the actual contract terms for sales to third parties; as a result, FCX's consolidated average realized price per pound of molybdenum will differ from the amounts reported in this table.
b. Represents the combined total for FCX's other mining operations as presented in the supplemental schedule, "Business Segments," beginning on page VIII. Also includes amounts associated with FCX's molybdenum sales company, which includes sales of molybdenum produced by the Molybdenum mines and by certain of the North America and South America copper mines.
XVII