freight performance measure primer - fhwa … system condition indicators ... florida department of...
TRANSCRIPT

Freight Performance Measure Primer
October 2017
Notice
This document is disseminated under the sponsorship of the U.S. Department of Transportation in the interest of information exchange. The U.S. Government assumes no liability for the use of the information contained in this document. This report does not constitute a standard, specification, or regulation.
The U.S. Government does not endorse products or manufacturers. Trademarks or manufacturers’ names may appear in this report only because they are considered essential to the objective of the document.
Quality Assurance Statement
The Federal Highway Administration (FHWA) provides high-quality information to serve government, industry, and the public in a manner that promotes public understanding. Standards and policies are used to ensure and maximize the quality, objectivity, utility, and integrity of its information. The FHWA periodically reviews quality issues and adjusts its programs and processes to ensure continuous quality improvement.
Front Cover Graphic Source: AECOM.

1. Report No.FHWA-HOP-16-089
2. Government Accession No.
3. Recipient’s Catalog No.
4. Title and SubtitleFreight Performance Measure Primer
5. Report DateOctober 2017
6. Performing Organization Code
7. Author(s)(in alphabetic order) Richard Easley (E-Squared),Nicole Katsikides (FHWA), Keith Kucharek (AECOM),Daniel Shamo (AECOM), and Janie Tiedeman (AECOM)
8. Performing Organization Report No.
9. Performing Organization Name and AddressAECOM4 North Park Drive, Suite 300Hunt Valley, MD 21030
E-Squared Engineering43969 Tavern Dr. Suite 200Ashburn, VA 20147
10. Work Unit No. (TRAIS)
11. Contract or Grant No.DTFH61-11-D-00016-T-13001
12. Sponsoring Agency Name and AddressU.S. Department of TransportationFederal Highway AdministrationOffice of Operations1200 New Jersey Avenue, SEWashington, D.C. 20590
13. Type of Report and Period Covered
Primer 2016-201714. Sponsoring Agency Code
HOP
15. Supplementary NotesJeffrey Purdy (FHWA- HOFM)
16. AbstractThis primer aims to assist States and MPOs with the implementation of performance-based freight planning and programming, as established under MAP-21 and the FAST Acts, by recommending freight performance measurement practices and appropriate performance measures. The primer provides a comprehensive list of freight performance measures with their availability and degree of manipulation needed. It includes chapters on data collection, data analysis, target setting, identifying challenges, best practices, and possible solutions.
17. Key WordsFreight, Performance Measurement,Freight System Performance, Freight Data
18. Distribution StatementNo restrictions
19. Security Classification (of this report)
Unclassified
20. Security Classification (of this page)
Unclassified
21. No. of Pages120
22. PriceN/A
Technical Report Documentation Page
Form DOT F 1700.7 (8-72) Reproduction of completed page authorized

iii
Freight Performance Measure Primer
TABLE OF CONTENTS
EXECUTIVE SUMMARY ...........................................................................................................1CHAPTER 1. INTRODUCTION ................................................................................................7
BACKGROUND ON FREIGHT PERFORMANCE MEASUREMENT ................................7WHY MEASURE ASPECTS OF FREIGHT SYSTEM PERFORMANCE? ..........................8
CHAPTER 2. PERFORMANCE MEASUREMENT .............................................................11FREIGHT PERFORMANCE MEASURES ...........................................................................12LINKAGE OF PERFORMANCE MEASURES TO ECONOMIC IMPACTS .....................14LEVELS OF ANALYSIS .......................................................................................................16
CHAPTER 3. AVAILABLE DATA ............................................................................................23FREQUENTLY USED FREIGHT DATA ..............................................................................23
CHAPTER 4. COMMON FREIGHT MEASURES ................................................................29FREIGHT DEMAND MEASURES .......................................................................................30FREIGHT EFFICIENCY – HIGHWAY SPEEDS, AVERAGE SPEEDS, RELIABILITY ...31FREIGHT MODELING .........................................................................................................34RAILROAD SPEEDS AND RELIABILITY .........................................................................36FREIGHT SYSTEM CONDITION INDICATORS ...............................................................37FREIGHT ENVIRONMENTAL MEASURES ......................................................................38FREIGHT SAFETY MEASURES .........................................................................................39FREIGHT ECONOMIC DEVELOPMENT MEASURES AND ANALYSIS .......................39FREIGHT ACCESSIBILITY MEASURES ...........................................................................42INFRASTRUCTURE-BASED AND NETWORK MEASURES ..........................................42AREA-BASED MEASURES .................................................................................................44FUTURE PROGRAMS (FREIGHT FLUIDITY) ..................................................................48
CHAPTER 5. CHALLENGES WITH FREIGHT PERFORMANCE ANALYSIS .............51SETTING FREIGHT GOALS ................................................................................................51LACK OF CONSISTENCY ...................................................................................................51ABUNDANCE OF INCOMPLETE DATA ............................................................................52FREIGHT Modeling CAPABILITIES AT THE REGIONAL SCALE ..................................52APPLYING THE MEASURES ..............................................................................................52DATA CAPTURE ...................................................................................................................52INTEGRATING DATA ...........................................................................................................53SUSTAINING FREIGHT PERFORMANCE MEASURES ..................................................53

iv
Freight Performance Measure Primer
CHAPTER 6. BEST PRACTICES AND RECOMMENDED FREIGHTPERFORMANCE MEASURES ............................................................................55
BEST PRACTICES: PRIVATE SECTOR ..............................................................................55BEST PRACTICES: PUBLIC SECTOR ................................................................................56RECOMMENDATIONS FOR A COMPREHENSIVE FREIGHT PERFORMANCE
MEASUREMENT PROGRAM ................................................................................59REFERENCES ............................................................................................................................65APPENDIX A. HISTORY OF FEDERAL AUTHORIZATION AND ITS
RELATIONSHIP TO FREIGHT PERFORMANCE MEASURES ...................69APPENDIX B. FREIGHT STAKEHOLDER INTERVIEWEES AND
INTERVIEW QUESTIONS ...................................................................................75APPENDIX C. FREQUENTLY USED FREIGHT DATA ......................................................77APPENDIX D. ADDITIONAL AVAILABLE HIGHWAY DATA ...........................................87APPENDIX E. TERMS AND DEFINITIONS .........................................................................91APPENDIX F. TRUCK PARKING METRICS .......................................................................97APPENDIX G. INNOVATIVE RESEARCH: USING FUEL TAXES TO
TRACK TRUCK MOVEMENT ..........................................................................101
v
Freight Performance Measure Primer
LIST OF FIGURES
Figure 1. Chart. Florida Department of Transportation performance measures graphic. ............17Figure 2. Photo. Truck delivery on streetcar tracks, Washington, D.C. .......................................19Figure 3. Photo. Urban freight delivery, Washington, D.C. .........................................................19Figure 4. Map. U.S. Department of Transportation major freight corridors. ...............................20Figure 5. Photo. Congestion due to construction on I-81, Pennsylvania. ....................................20Figure 6. Map. Philly Freight Finder screenshot showing travel time indexand average speeds for selected time period. ...............................................................................21Figure 7. Map. European map of major roadways. ......................................................................22Figure 8. Equation. Travel Time Equivalent. ...............................................................................33Figure 9. Map. Average truck speeds on select interstate highways, 2010. .................................34Figure 10. Chart. A taxonomy of the most common area-based measurement approaches. .......45Figure 11. Equation. Generic form of an area-based measure. ....................................................46Figure 12. Diagram. Fuel vendor location and average distance of truck travel. ......................102Figure 13. Diagram. Roadway segments attributed to fuel vendor. ...........................................103
LIST OF TABLES
Table 1. Recommended performance measures. ............................................................................2Table 2. Key linkages between performance measures and economic factors. ...........................15Table 3. Frequently used freight data. ..........................................................................................24Table 4. Average train speeds. ......................................................................................................37Table 5. Infrastructure-based measures. .......................................................................................43Table 6. Network coverage and completeness measures. ............................................................44Table 7. Stated goals for transportation policy. ............................................................................60Table 8. Recommended performance measures. ..........................................................................61Table 9. Class 1 Railroads. ...........................................................................................................83Table 10. Tier I truck parking metrics. .........................................................................................97Table 11. Tier II truck parking metrics. ........................................................................................97Table 12. Tier III truck parking metrics. ......................................................................................98


vii
Freight Performance Measure Primer
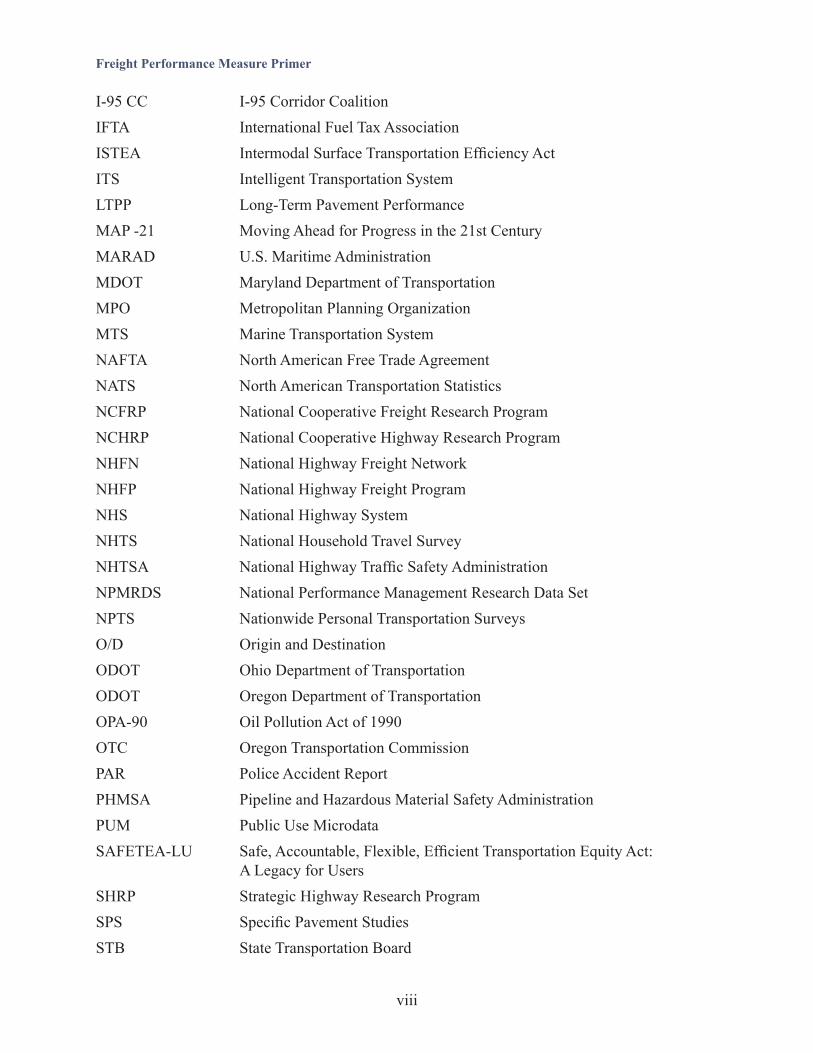
LIST OF ABBREVIATIONS AND SYMBOLS
AADTT Annual Average Daily Truck TrafficAAR Association of American RailroadsAASHTO American Association of State Highway Transportation OfficialsADT Average Daily TrafficAERR Air Emissions Reporting RequirementsATRI American Transportation Research InstituteBAC Blood Alcohol ConcentrationBCA Benefit-Cost AnalysisBNSF Burlington Northern and Santa FeBTS Bureau of Transportation StatisticsCFS Commodity Flow SurveyCMAQ Congestion Mitigation and Air Quality Improvement ProgramDOC Department of CommerceDOT Department of TransportationEIA U.S. Energy Information AdministrationEPA Environmental Protection AgencyF&OS Financial and Operating StatisticsFAC Freight Advisory CommitteeFAF Freight Analysis FrameworkFARS Fatality Analysis Reporting SystemFAST Fixing America’s Surface Transportation (Act)FDOT Florida Department of TransportationFHWA Federal Highway AdministrationFMCSA Federal Motor Carrier Safety AdministrationFPM Freight Performance MeasurementFRA Federal Railroad AdministrationGDP Gross Domestic ProductGES General Estimates SystemGPS General Pavement StudyGPS Global Positioning SystemHPMS Highway Performance Monitoring System
viii
Freight Performance Measure Primer
I-95 CC I-95 Corridor CoalitionIFTA International Fuel Tax AssociationISTEA Intermodal Surface Transportation Efficiency ActITS Intelligent Transportation SystemLTPP Long-Term Pavement PerformanceMAP -21 Moving Ahead for Progress in the 21st CenturyMARAD U.S. Maritime AdministrationMDOT Maryland Department of TransportationMPO Metropolitan Planning OrganizationMTS Marine Transportation SystemNAFTA North American Free Trade AgreementNATS North American Transportation StatisticsNCFRP National Cooperative Freight Research ProgramNCHRP National Cooperative Highway Research ProgramNHFN National Highway Freight NetworkNHFP National Highway Freight ProgramNHS National Highway SystemNHTS National Household Travel SurveyNHTSA National Highway Traffic Safety AdministrationNPMRDS National Performance Management Research Data SetNPTS Nationwide Personal Transportation SurveysO/D Origin and DestinationODOT Ohio Department of TransportationODOT Oregon Department of TransportationOPA-90 Oil Pollution Act of 1990OTC Oregon Transportation CommissionPAR Police Accident ReportPHMSA Pipeline and Hazardous Material Safety AdministrationPUM Public Use MicrodataSAFETEA-LU Safe, Accountable, Flexible, Efficient Transportation Equity Act: A Legacy for UsersSHRP Strategic Highway Research ProgramSPS Specific Pavement StudiesSTB State Transportation Board
ix
Freight Performance Measure Primer
TEA-21 Transportation Equity Act for the 21st CenturyTEU Twenty-Foot Equivalent UnitTOFC Trailer-on-Freight-CarTRB Transportation Research BoardTSA Traffic Safety AdministrationTTI Travel Time IndexUSDOT U.S. Department of TransportationVIUS Vehicle Inventory and Use SurveyVMT Vehicle Miles TraveledWSDOT Washington State Department of Transportation


1
Freight Performance Measure Primer
EXECUTIVE SUMMARY
The U.S. Department of Transportation (USDOT) has been adhering to the Government Performance and Results Act of 1993 since its adaptation. The Act requires the development of strategic plans, annual performance plans, and annual performance reports. The Moving Ahead for Progress in the 21st Century (MAP-21) and the Fixing America’s Surface Transportation (FAST) Acts require the USDOT to establish performance measures in several areas, including the assessment of freight movement on the interstate system.
The Federal Highway Administration (FHWA) Office of Freight Management and Operations is responsible for administering freight performance measurement requirements as outlined in the MAP-21 and FAST Acts. The FHWA assists in the development of freight performance measures through the advancement and dissemination of freight data and tools to support analysis, plans, and project development. FHWA developed this Freight Performance Measure Primer as a tool for State departments of transportation (DOTs) and Metropolitan Planning Organizations (MPOs) to develop meaningful, effective, and consistent performance measurement practices.
Measuring the performance of the freight system can be effective in determining if goals and objectives are being met by State DOTs and MPOs. Performance measure data can be used in communicating programs or policies, evaluating success and tracking progress, and establishing a decision-making tool to identify plans, programs, policies and investments that support freight movement. There are several existing data sources and approaches that States and MPOs can use to get the baseline conditions and performance measures. The FHWA data sources include truck probe data, National Performance Management Research Data Set (NPMRDS), Freight Analysis Framework (FAF) data, the Commodity Flow Survey, the Highway Performance Monitoring System (HPMS) data, and truck parking data. Freight data are available for other modes, including maritime data, pipeline data, railroad data, aviation data, border crossing data, and general economic activity.
There are other common performance measures used by jurisdictions and other entities. These measures include truck travel times, travel time reliability, safety, infrastructure conditions, and congestion. Other tools include freight demand measures (such as freight volume and truck parking) and freight efficiency measures (such as travel time index, mean travel time index, delay, speed, reliability cost, and freight bottlenecks). Similar performance measures are used for freight rail, such as railroad speeds and reliability.
State DOTs and MPOs should work together to fulfill the Federal requirements from MAP-21 and the FAST Acts. These agencies have varying degrees of expertise in analyzing freight data and freight performance management and there are variations among agencies that track performance, such as data consistency and differences in policies. Federal, State, and MPO practitioners face several challenges in developing freight performance measures. These challenges include: developing freight planning goals, understanding the role of States and MPOs in freight planning and funding, accessing multi-modal data, addressing inconsistency in data quality and quantity, and maintaining reliable freight transportation models.

2
Freight Performance Measure Primer
The goal of this primer is to assist States and MPOs by providing information on the most commonly used measurement data and approaches. It will allow practitioners to grow the state of the practice of freight performance measurement. The primer includes information on data collection, data analysis, target setting, identification of challenges, and possible solutions. The recommendations and best practices were developed through interviews conducted with numerous freight stakeholders, research on a diverse set of jurisdictions, and extensive research of current users of freight performance measurement.
The public sector has an interest in identifying measures, including safety, environmental, economic, system efficiency, and security, as well as measuring how regulations and standards are being met. The private sector is concerned with economic measures, particularly those resulting from policy decisions. Several best practices in the private and public sectors exist, including statewide freight plans, coordination among government transportation agencies and private partners, and the Freight Fluidity System that spans the freight modes.
States and MPOs can take the initial step in their freight planning efforts by convening a Freight Advisory Committee (FAC), consisting of public and private stakeholders. These committees can play a role in determining the level of analysis required, thereby selecting the most appropriate freight performance measures. They can also play a role in obtaining the data.
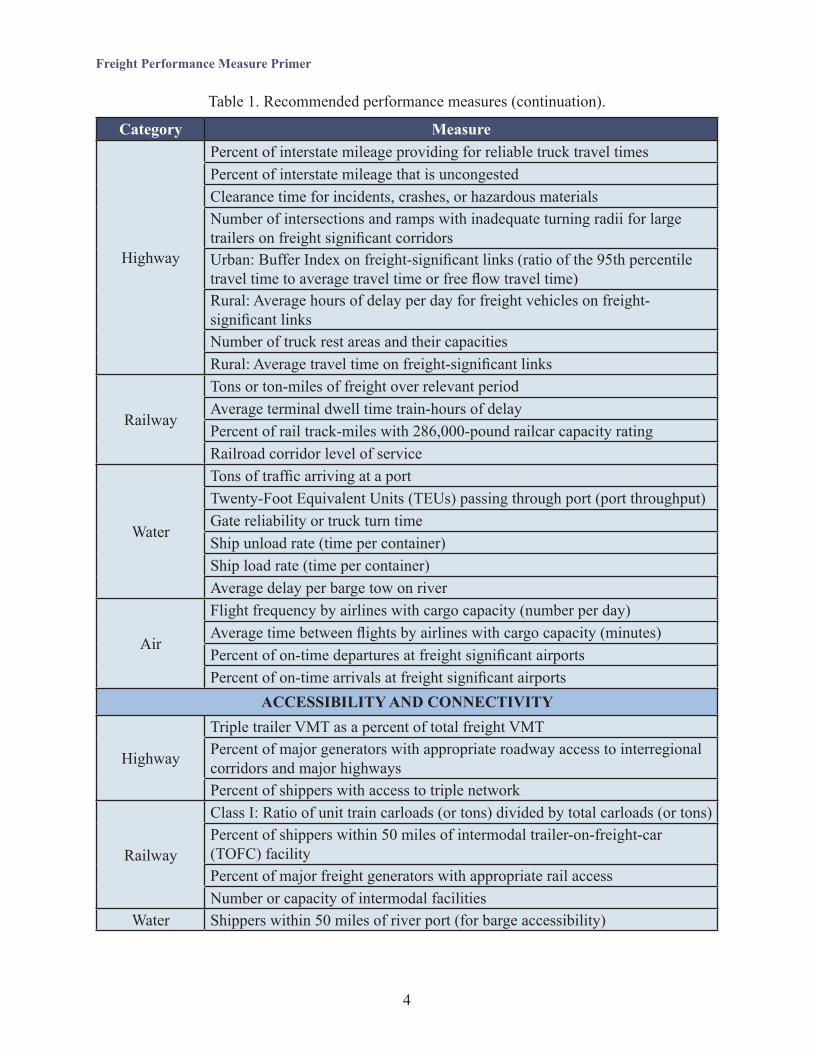
The following table summarizes the potential performance measures that States and MPOs could include in their freight planning effort. The measures are listed by mode for five categories:
• Safety.• Maintenance and Preservation.• Mobility, Reliability, and Congestion.• Accessibility and Connectivity.• Environment.
Category Measure
SAFETY
Highway
Motor carrier crash rate
Motor carrier truck at-fault rate
Number of heavy truck-related fatalities
Capacity of weigh stations – number of trucks processed per hour
National highway system pavement conditions
National highway bridge conditions
National highway system intermodal connector conditionTotal cost of freight loss and damage from accidents/Vehicle Miles Traveled (VMT)
Table 1. Recommended performance measures.

3
Freight Performance Measure Primer
Category MeasureSAFETY
Railway
Total loss and damage from accidents per route-mileTotal loss and damage from accidents per ton movedNumber of at-grade railroad crossings along freight significant corridors such as freeways and interregional corridorsNumber of rail fatalitiesTrain derailments per ton moved
WaterValue of cargo lost or damaged per ton or value of cargo movedContainers damaged or lost per containers handled/total containers
Air
Total loss and damage from accidents divided by value of freightPercent of study airports meeting Traffic Safety Administration (TSA) guidelines for general aviation securityIncidents per 1,000 operations at freight-significant airports
MAINTENANCE AND PRESERVATION
Highway
Percent of pavement in good condition on freight significant highwaysNumber of weight restricted bridges divided by total number of bridgesPercent of bridges that meet good and poor structural condition thresholdsService life remaining on highway pavementBenefit of truck weight enforcement on pavement service life
RailwayMiles of track in expected or Federal Railroad Administration (FRA) Class I divided by total miles of Class I trackNumber of double-stack tunnel restrictions divided by number of tunnels
WaterPercent of tons on river moving though locks with constraintsUnscheduled lock closure time (hours)Channel depths at the port divided by depths at competitive ports
Air Percent of pavement in fair or poor condition at freight-significant airportsMOBILITY, RELIABILITY, AND CONGESTION
Highway
Percent of interstate providing reliable travel timesPercent of interstate where peak hour travel times meet expectationsPercent of non-interstate National Highway System (NHS) providing reliable travel timesPercent of non-interstate NHS where peak hour travel times meet expectationsAnnual hours of excessive delay per capitaUrban: Average hours of delay per day for freight vehicles on freight-significant linksUrban: Travel Time Index (TTI) on freight-significant links (ratio of the peak travel time to free-flow travel time)
Table 1. Recommended performance measures (continuation).
4
Freight Performance Measure Primer
Category Measure
Highway
Percent of interstate mileage providing for reliable truck travel timesPercent of interstate mileage that is uncongestedClearance time for incidents, crashes, or hazardous materialsNumber of intersections and ramps with inadequate turning radii for large trailers on freight significant corridorsUrban: Buffer Index on freight-significant links (ratio of the 95th percentile travel time to average travel time or free flow travel time)Rural: Average hours of delay per day for freight vehicles on freight-significant linksNumber of truck rest areas and their capacitiesRural: Average travel time on freight-significant links
Railway
Tons or ton-miles of freight over relevant periodAverage terminal dwell time train-hours of delayPercent of rail track-miles with 286,000-pound railcar capacity ratingRailroad corridor level of service
Water
Tons of traffic arriving at a portTwenty-Foot Equivalent Units (TEUs) passing through port (port throughput)Gate reliability or truck turn timeShip unload rate (time per container)Ship load rate (time per container)Average delay per barge tow on river
Air
Flight frequency by airlines with cargo capacity (number per day)Average time between flights by airlines with cargo capacity (minutes)Percent of on-time departures at freight significant airportsPercent of on-time arrivals at freight significant airports
ACCESSIBILITY AND CONNECTIVITY
Highway
Triple trailer VMT as a percent of total freight VMTPercent of major generators with appropriate roadway access to interregional corridors and major highwaysPercent of shippers with access to triple network
Railway
Class I: Ratio of unit train carloads (or tons) divided by total carloads (or tons)Percent of shippers within 50 miles of intermodal trailer-on-freight-car (TOFC) facilityPercent of major freight generators with appropriate rail accessNumber or capacity of intermodal facilities
Water Shippers within 50 miles of river port (for barge accessibility)
Table 1. Recommended performance measures (continuation).
5
Freight Performance Measure Primer
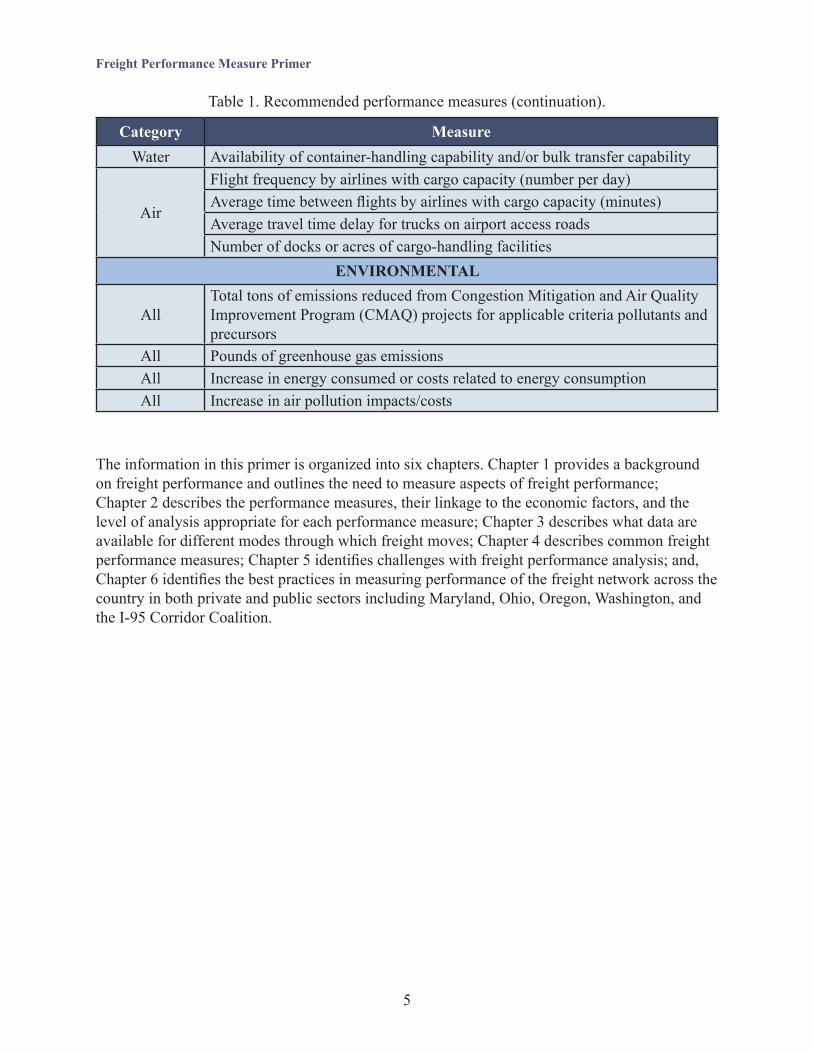
The information in this primer is organized into six chapters. Chapter 1 provides a background on freight performance and outlines the need to measure aspects of freight performance; Chapter 2 describes the performance measures, their linkage to the economic factors, and the level of analysis appropriate for each performance measure; Chapter 3 describes what data are available for different modes through which freight moves; Chapter 4 describes common freight performance measures; Chapter 5 identifies challenges with freight performance analysis; and, Chapter 6 identifies the best practices in measuring performance of the freight network across the country in both private and public sectors including Maryland, Ohio, Oregon, Washington, and the I-95 Corridor Coalition.
Category MeasureWater Availability of container-handling capability and/or bulk transfer capability
Air
Flight frequency by airlines with cargo capacity (number per day)Average time between flights by airlines with cargo capacity (minutes)Average travel time delay for trucks on airport access roadsNumber of docks or acres of cargo-handling facilities
ENVIRONMENTAL
AllTotal tons of emissions reduced from Congestion Mitigation and Air Quality Improvement Program (CMAQ) projects for applicable criteria pollutants and precursors
All Pounds of greenhouse gas emissionsAll Increase in energy consumed or costs related to energy consumptionAll Increase in air pollution impacts/costs
Table 1. Recommended performance measures (continuation).


7
Freight Performance Measure Primer
CHAPTER 1. INTRODUCTION
How well does freight move on the Nation’s transportation system? Where does it go or where does it come from? Does it travel by rail or by truck or both, and how fast? Where are the bottlenecks, and which ones are the worst? And, how does this impact the U.S. economy? These are questions that State, regional, and local transportation decision-makers try to answer as they determine which plans, programs, policies and investments should be implemented to best support freight movement. State and local departments of transportation (DOTs) and Metropolitan Planning Organizations (MPOs) make decisions to prioritize their programs and projects on a regular basis. These efforts have a direct impact on freight system performance. In addition, even though an infrastructure project may not be explicitly freight-specific, it can impact freight system performance. Thus, the measurement of how these projects impact the performance of the freight transportation system is important.
Two major challenges to freight system measurement are the absence of data and the lack of methods of analysis. There are robust data for the movement of people and passenger vehicles, but understanding freight movement presents different types of challenges to the decision-makers. These movements are based upon supply chain decisions made by individual corporations, which can change over time due to economic conditions. Freight often moves across numerous jurisdictions and by multiple modes of transport. Data that captures origins and destinations and multi-modal performance, as well as methodologies of collecting and utilizing data across multiple jurisdictions and modes, are extremely limited for freight.
Currently, decision-makers are only able to use a few data sources that help in identifying trading partners among States and regions, commodities, tonnage, and value. While formats vary, truck data is the most robust and publicly available information to help understand how freight moves and to support thorough freight analysis. The analysis of multi-modal freight flows is not commonly performed in the United States.
This primer is a resource for the States and MPOs, as well as county or municipal decision-makers to use in analyzing freight movement. It provides a collection of the publicly available data and methods currently in use with information on the next generation of freight measurement. It is intended to help improve the practice of freight performance measurement and establish consistency among practitioners throughout the United States. It is also intended to be updated as new data sources and methods are developed. Additional work still needs to be done to improve the comprehensive and multi-modal understanding of freight.
BACKGROUND ON FREIGHT PERFORMANCE MEASUREMENT
Transportation decision-makers need to understand how freight moves and where inefficiencies exist to develop the best policies, plans, and investments that support freight movement. Improving freight movement has direct and positive effects on the national economy, and may also provide environmental and safety benefits. For over a decade, the Federal Highway Administration (FHWA) has led the development of freight data and approaches to better measure and plan for freight. For example, the FHWA has identified freight data by working
8
Freight Performance Measure Primer
with the trucking industry to obtain anonymized truck probe data, which is used to understand speeds and reliability and identify bottlenecks on the Nation’s highways to help improve freight performance. The FHWA has assisted States and MPOs identify freight needs on the Nation’s transportation network. As the focus on freight has grown in the past decade, the FHWA has worked to coordinate data, freight analysis, and planning methods which help decision-makers understand where needs are greatest.
Improving the state of practice is important for State DOTs and MPOs that have varying levels of experience and capabilities in freight performance measurement, data capture, policy development, and planning. Many agencies are familiar with performance measurement, such as the congestion management process or transit service planning, but may not be as familiar with freight performance measurement. Integrating performance measurement across the areas of transportation operations, planning, programming, and evaluation means developing innovative new practices for many agencies (Florida Department of Transportation [FDOT] 2014). Many States and MPOs have little experience with freight programs necessary to comply with Moving Ahead for Progress in the 21st Century (MAP-21) and Fixing America’s Surface Transportation (FAST) Act requirements. This primer gives States and MPOs the tools necessary to be consistent in basic, yet meaningful, measurement practices.
Organizations such as the FHWA, the American Association of State Highway Transportation Officials (AASHTO), MPOs, State DOTs, and the National Cooperative Freight Research Program (NCFRP) have conducted a significant amount of research providing guidance in the establishment of performance measures. The research reveals several common challenges in the development of freight performance measures. A major challenge is identifying exactly what the public sector should measure to best support the economy and balance other policy priorities such as the environment, safety, and energy. Additionally, this research identifies challenges in understanding how freight moves from origin to destination and across several modes of transport. Other challenges include the lack of multi-modal data and undefined and inconsistent approaches to measurement.
Public and private stakeholders agree that the efficient movement of freight is critical to supporting and advancing the Nation’s global economic competitiveness and environmental stewardship. Population growth and the anticipated growth in freight movement over the next 20 to 30 years will worsen congestion on an already congested transportation network, hindering the efficient movement of freight. By focusing on performance measurement and management, public and private freight stakeholders can identify the best means in which improvements can be made to the efficient movement of freight.
WHY MEASURE ASPECTS OF FREIGHT SYSTEM PERFORMANCE?
The United States is home to the world’s largest economy and possesses one of the largest freight systems in the world. The U.S. freight system comprises over four million miles of public roads, 140,000 miles of railways, 360 commercial airports, and 12,000 miles of marine highways. Additionally, the U.S. freight system is supported by trucking firms, railroad companies, maritime companies, aviation companies, and the public agencies that serve and regulate

9
Freight Performance Measure Primer
them. Given the enormity of the freight system and the number of public and private freight stakeholders, there is interest in freight performance measures as a tool to better understand the relationship between efficient freight movement and the economy, environment, safety, and sustainability.
Trucks and rail transport nearly 70 percent of all freight tonnage in the United States. The total tonnage of freight moved in the United States is expected to increase by over 50 percent by 2040. To accommodate the increase in freight demand, more trucks will be needed, but adding more trucks to an already congested road network will worsen mobility. Partnerships within the freight community will foster innovative solutions that reduce congestion safely and efficiently. Freight performance measurement and freight planning tools are vital to understanding and addressing ongoing and future congestion concerns.
While some State DOTs and MPOs have recently begun measuring freight system performance, successful and effective implementation of a performance-based system has not been widely achieved. The U.S. Department of Transportation (USDOT) has been adhering to the Government Performance and Results Act of 1993, which requires development of strategic plans, annual performance plans, and annual performance reports, since its adaptation. The FHWA began developing freight performance measures in 2002 and continues to improve and refine these measures. Today, government agencies are held to a high standard of performance and transparency about publicly available information.
Recent MAP-21 and FAST Act legislations call for more aggressive performance measurement strategies. MAP-21 Section 1115 “National Freight Policy” requires the development or improvement of tools to evaluate and enhance transportation system performance and strategically target the investment of Federal funds. Section 1203 requires the Secretary of Transportation to establish freight performance measures that must be submitted by all States and MPOs. The FAST Act implemented a freight funding program and freight formula program that will require freight plans as part of eligibility for program funding. These plans must demonstrate a link to performance of freight flows and must describe the policies and programs States use to support freight. In response to the Federal legislation, the FHWA Office of Freight Management and Operations has advanced several research efforts to improve freight measurement and to develop multi-modal measurement systems for freight fluidity in cooperation with a variety of stakeholders. Freight-specific performance measures assist in identifying needed transportation improvements, monitor their effectiveness, and establish priorities for freight transportation investments. This information is important for use in freight planning, project development, investment planning, and other needs (Refer to Appendix A for more detail on past and current Federal legislation.).


11
Freight Performance Measure Primer
CHAPTER 2. PERFORMANCE MEASUREMENT
Performance measurement has evolved over the decades into an effective methodology for quantifying goals and objectives and communicating progress toward their attainment. Many State Departments of Transportation (DOTs) have integrated performance measurement into their business practices. Developing and analyzing freight performance measures can be challenging for many reasons, including the large number of possible measures, the extensive and potentially expensive data that might be required, and the computational complexity that is often introduced (Transportation Research Board [TRB], National Cooperative Highway Research Program [NCHRP] 2011).
Transportation agencies tend to place performance measures into one of three categories: agency performance, system performance, and the impact on broader social performance measures. Agency performance focuses on service delivery, such as projects completed. System performance focuses on capacity and conditions of the transportation system as well as issues such as travel times, cost, and safety. Social performance measures deal with broader societal concerns such as economic development and the environment (McMullen et al. 2010).
Traditionally, performance measures at the State level focus on evaluating key highway or transit/rail, and port infrastructure performance such as interstates and national highways, Class I railroads, and key ports. Freight performance measures require a multi-modal evaluation of the performance including highway, rail, waterway, air, and intermodal connections. Performance measure data can be used in several ways:
• Description – They can help describe the effect of a program or policy.• Evaluation – They can be used to assess progress and diagnose what problems or barriers
that need to be addressed.• Accountability – They can be used to set targets for specific staff or programs and can
measure how well they are doing in reaching those goals.• Decision-support – They can help inform which approach would support the most
sustainable outcomes.• Communication – They can be used to explain to your partners or the public what your
program or policy is achieving.
There are many elements that go into the successful development of freight performance measures, including:
• Allow users to examine performance in detail through at-a-glance reporting linked to more extensive performance analysis (Drucker 1995, pp. 1-24; Frigo 2002; Kaplan and Norton 1998).
• Provide reflection of a broad array of performance concerns, not just certain narrow areas.• Allow inclusion of data protocols, common definitions, classification, agreed reporting
cycles, quality control/quality improvement processes, and common consensus among users as to the accuracy and efficiency of the measurement system and the data it uses (Eccles 1991, pp. 25-45).

12
Freight Performance Measure Primer
Most performance measurement systems are evolutionary and start with the current data available. The systems tend to mature, evolve, and improve over time.
Although a universally used comprehensive and consistent set of freight performance measures do not exist, important elements of freight performance are captured in Federal data sources. These data sources are predominantly available for highway and waterway infrastructure conditions, freight volumes, and freight externalities such as air emissions and crashes. Private- sector trade associations often produce robust freight performance metrics that can augment the public agency metrics.
There is no single agency or entity that has the mandate or resources to develop and sustain a comprehensive freight performance measurement program. Many individual agencies and private-sector trade organizations measure components of freight system performance, but there is no single agency compiling a comprehensive reporting system. Therefore, the recommended framework outlined later in this primer seeks to capture the existing performance measurement information from both Federal and private sources.
FREIGHT PERFORMANCE MEASURES
Freight performance measures are tools used to evaluate the level of accountability, efficiency, and effectiveness throughout the various freight modes including air, rail, highway, and water/ marine transportation. Performance measures provide a way to focus attention on the goals that an organization has defined while monitoring whether those goals are being attained. Analyses of freight performance measures assist in the prioritization and selection of specific freight improvement projects in long-range transportation plans, transportation improvement programs, and freight-specific investment programs (McMullen et al. 2010).
Some jurisdictions measure freight performance by linking funding to the existence of these measures. Other jurisdictions are proactively tracking freight performance measures because freight is integral to their economy and impacts congestion, air quality, roadway safety, and infrastructure preservation. Thus, freight performance measures grow in importance each year.
Some jurisdictions measure freight performance to identify priority levels for funding new projects. With input from the private sector, public sector jurisdictions can determine potential freight bottleneck areas. This partnership can also identify major investments planned by the private sector that might result in increased congestion and costly delays to the freight industry and passenger traffic in the region. Public agencies can also better understand the economic benefit that could occur because of these private sector investments.
Measuring freight performance also allows public agencies to establish transparency for public sector funding decisions. Because funding is limited, not all projects can be funded in each fiscal cycle. By collecting and sharing freight performance measures, the public can understand the justification that was used in the funding priority process.
Public jurisdictions are also recognizing that freight performance measures can provide an
13
Freight Performance Measure Primer
indication of the return on investment for the funding of capital improvement projects. Projects such as adding highway capacity, reconfiguring interchanges, and grade separated railroad crossings, can be costly. Capturing existing and future projected freight data allows public agencies to determine if the project will improve freight flow and, therefore, justifies selection of the performance measures. Alternatively, if the project shows no appreciable positive impact to freight flow, the agency can re-evaluate a performance measure.
Surface transportation legislation in the Moving Ahead for Progress in the 21st Century (MAP-21) and the Fixing America’s Surface Transportation (FAST) acts calls for freight planning, freight performance measurement, and the development of tools for freight analysis and data collection to justify eligibility for Federal funding. The Federal Highway Administration (FHWA) has developed freight data and analytical tools to support analysis, plans, and project development. However, more needs to be done to improve freight analysis so that it allows States and Metropolitan Planning Organizations (MPOs) to understand the multi-modal nature of freight.
States and MPOs can use several existing data sources and approaches to get baseline and performance measures that support freight planning. This document identifies the most common data and analytical methods, which will assist State and MPO practitioners to respond to MAP-21 requirements.
A region’s ability (or failure) to relieve traffic congestion and provide a reliable freight network can impact whether jobs are created locally or are shifted elsewhere. Congestion increases travel time for freight movement, which in turn means increased costs for delivery of consumer goods. Workplaces and residents that relocate due to congestion within metropolitan areas equates to tens of millions of dollars lost to local economies—jobs, schools, housing, taxes, and decreased standard of living.
Literature searches on the impacts of truck congestion on the economy have yielded few results. Data on commodity flows are limited and the impacts to the economy may vary depending upon the commodities transported and the types of delivery locations (e.g., manufacturing facilities, urban retail, grocery stores, and restaurants). Many transportation professionals do not have the expertise to analyze economic indicators and the impact the market may have on business development or business relocations and failures. At the same time, many economists are not trained in the field of transportation (multi-modal options, fuel cost impacts, deregulation, distribution center strategies, and variable roadway usage taxes). In addition, the freight industry is struggling to develop highly reliable statistical freight models that can determine mode choice,
“The increasing congestion within the freight transportation system poses a threat to the efficient flow of the nation’s goods and has strained the system in some locations. Moreover, recent growth in international trade has placed even greater pressures on ports, border crossings, and distribution hubs – key links in the freight transportation system. Congestion delays that significantly constrain freight mobility in these areas could result in serious economic implications for the nation.”
-U.S. Government Accountability Office, Freight Transportation: National Policy and Strategies Can Help Improve Mobility; GAO-08-287, p. 1

14
Freight Performance Measure Primer
route choice, and optimal time of day for travel and deliveries. Effective freight performance measures can be a valuable tool in determining a correlation between qualities of freight flows and economic impacts.
Establishing and using freight performance measures provides many benefits. A jurisdiction cannot improve a system if it does not first collect the data necessary to measure and analyze the system. However, the process for choosing the appropriate freight performance measures can be complex. The performance measure depends greatly upon who is using the measure and what the goals may be. It is also important to distinguish between performance goals, measures, and targets. Performance goals are broad statements that describe a desired result or outcome and set the strategic direction for the performance process. Performance measures are used to convey goals in measurable objectives and assess progress toward meeting goals. Performance targets represent the expected success level within a specified period toward reaching the stated goal. For example, an enforcement agency may have the goal to minimize commercial vehicle crashes. Many crashes are due to driver error while other crashes are due to inadequate braking systems or other equipment failures. A performance measure used to track this goal may be the number of safety inspections of commercial vehicles. The target may be to increase the number of safety inspections of commercial vehicles by a yearly percentage. This is a measurable action to achieve the goal to reduce commercial vehicle crashes.
However, performance measures can be in conflict, such as certain highway or enforcement safety measures and travel times measures. For safety purposes, enforcement officers may want to stop as many commercial vehicles as possible to aid in a safe and crash free environment. For economic purposes, however, the goal may be to minimize any freight flow delays into and out of ports which could have a negative impact on safety. Developing a single set of performance measures which will satisfy all agencies and the private sector is not a simple task. What may be beneficial to some stakeholders may be detrimental to others given the disparate sets of objectives from each stakeholder entity.
LINKAGE OF PERFORMANCE MEASURES TO ECONOMIC IMPACTS
There is a direct link between performance measurement and the economy, as shown in Table 2. These relationships were studied in the September 2015 FHWA report “Measuring the Impacts of Freight Transportation Improvements on the Economy and Competitiveness”. The authors note that while some of the performance measures are closely related to each other, they should be considered separately as many times the performance measure is “in the eye of the beholder”. For example, it was noted that average speed and transit time performance measures have similar economic impacts. The difference in these performance measures is in how they are measured and the perspective of the agency using them. The transit time performance measure is more often used by shippers, who focus on how long it takes to move a shipment between two points. The average speed measure is more often used by transportation planners, who are considering how investments in infrastructure can improve the performance of specific segments of the transportation network (ICF & Leidos 2015, p. 12).

15
Freight Performance Measure Primer
The report identifies another example of related performance measures: reliability and transit time variance. Reliability measures the unexpected congestion or delay on a specific roadway segment measured by the variance in travel speeds. This measure would typically be used by a transportation planner. Transit time variance provides a measure of performance from the perspective of the shipper, measuring the level of unexpected delay for the shipment. Transit time differs from reliability because other factors, unrelated to vehicle speeds, can affect the transit time of a shipment. One example is a driver that exhausts his or her hours of service and must stop before completing the delivery. There would be a delay in the shipment’s transit time that was unrelated to the speed at which the vehicle could travel to make the delivery (ICF & Leidos 2015, p. 12).
Table 2. Key linkages between performance measures and economic factors.
Performance Measure Economic Factors
Average speed
Higher average speeds may increase the geographic area from which supplies can be drawn and the effective market into which supplies can be sold (i.e. size of supply and market areas). A larger supply area can mean lower-cost and/or better inputs. A larger market area means greater production in each facility, thus greater productivity.1 It also improves access to and connection with the freight network.2
Reliability A greater probability of on-time delivery reduces both production and distribution costs, due to lower buffer stocks.
Transit times in key freight lanes
Transit time affects the size of supply and market areas for firms in regions served by those lanes. Reduced cost of carriage is achieved due to improved utilization of truck and driver. This reduces both driver labor costs and vehicle operating costs.
Variance in transit times
More predictable transit times means more efficient scheduling and improved utilization of truck and driver. Also, it creates a higher probability of on-time delivery and reduces the cost of reliable service.
Crash rates Crash rates drive insurance costs, loss and damage of goods, and delivery failures.
Pavement quality Smoothness of pavement increases speeds, reduces loss and damage, and lowers vehicle operating costs.
Vehicle operating costs
Lower cost per mile reduces cost to shippers and increases supply and market areas.
1 Greater production does not automatically translate into greater productivity, but that economies of scale may become possible and attainable. Economies of scale can occur as the cost per unit of output decreases with increasing scale. This happens when fixed costs are spread out over more units of output. Economies of scale do have many limits, including exhausting nearby supplies of raw materials or saturating local consumption markets, requiring finished goods to be shipped further to generate new sales. Transportation costs thus play an important role in allowing scale economies.
2 Improving vehicle speeds could improve access to the freight network by reducing the time and cost required to access an intermodal rail facility, making intermodal shipments more economically viable.
16
Freight Performance Measure Primer
Some economic factors are easier to measure than others. For example, the average speed and transit time performance measures affect vehicle and driver costs for the truck, which in turn affect the cost of delivering freight. Estimating driver labor costs is relatively straightforward, as time savings can be translated into monetary values using estimates of average driver wages and benefits (in those cases where drivers are compensated with an hourly wage rate). In situations where drivers are compensated on a per mile basis, the impacts of reducing transit time may be more difficult to determine. Data are also available for the capital and operating costs associated with the truck. The cost of delay for the freight shipper and receiver is more complex, because it depends largely on the type and value of the freight carried, and how the freight shipment is being used by the customer. The average cost of delay for freight can mask a wide range of costs for different commodities, consuming industries, and customers (ICF & Leidos 2015, p. 13).
Estimating how performance measures affect long term productivity improvements in an industry can be more complex. Productivity measurements can include the increase in supply and market areas, level of access to lower cost or higher quality suppliers, improvements to inventory management, and increase in supply chain efficiencies. Productivity improvements can occur when average speed or transit times are reduced. Over the long term, improvements such as these may allow for business reorganization, expansion, and increased economies of scale (ICF & Leidos 2015, p. 13).
LEVELS OF ANALYSIS
Although a review of available literature provides many potential freight performance metrics, the small number of States that do have freight performance measures focus only on a few performance metrics. The National Cooperative Freight Research Program (NCFRP) Report 10 reports that “mature performance measurement States” such as Washington, Missouri, and Minnesota use between five and ten measures. It was noticeable that no two States had the same measures, and in most cases, there were wide differences in the metrics. Although States reported freight performance metrics, most of the metrics were not used to calibrate performance of specific State programs except for Missouri’s customer satisfaction with its motor carrier office. Generic measures such as travel time in freight-significant corridors were likely a contributing factor to State efforts to improve overall travel times. However, it was unlikely for a State DOT to use freight performance measures to make decisions. Most of the measures appear to be indicators of broad trends of overall transportation system performance (TRB, NCFRP 2011, p. 32).
As part of the process to gather information for this primer, interviews were conducted with freight stakeholders from jurisdictions of varying types and sizes. The purpose of the interviews was to get input from practitioners in the field that are working on performance measures for their respective organizations. Interviews were conducted with stakeholders from State DOTs, MPOs, and municipalities, as well as internationally. Stakeholders were asked general questions about their organization’s position on freight performance measures to gather a personal perspective on their organization’s freight performance measurement usage. The interviewees were told that there were no “right” or “wrong” answers, and that the goal of the interviews was
17
Freight Performance Measure Primer
to obtain a ‘real world’ understanding of how freight performance measurement is conducted (or not conducted) within their organization. The interviews are summarized below. The list of interview questions and interviewees can be found in Appendix B.
National
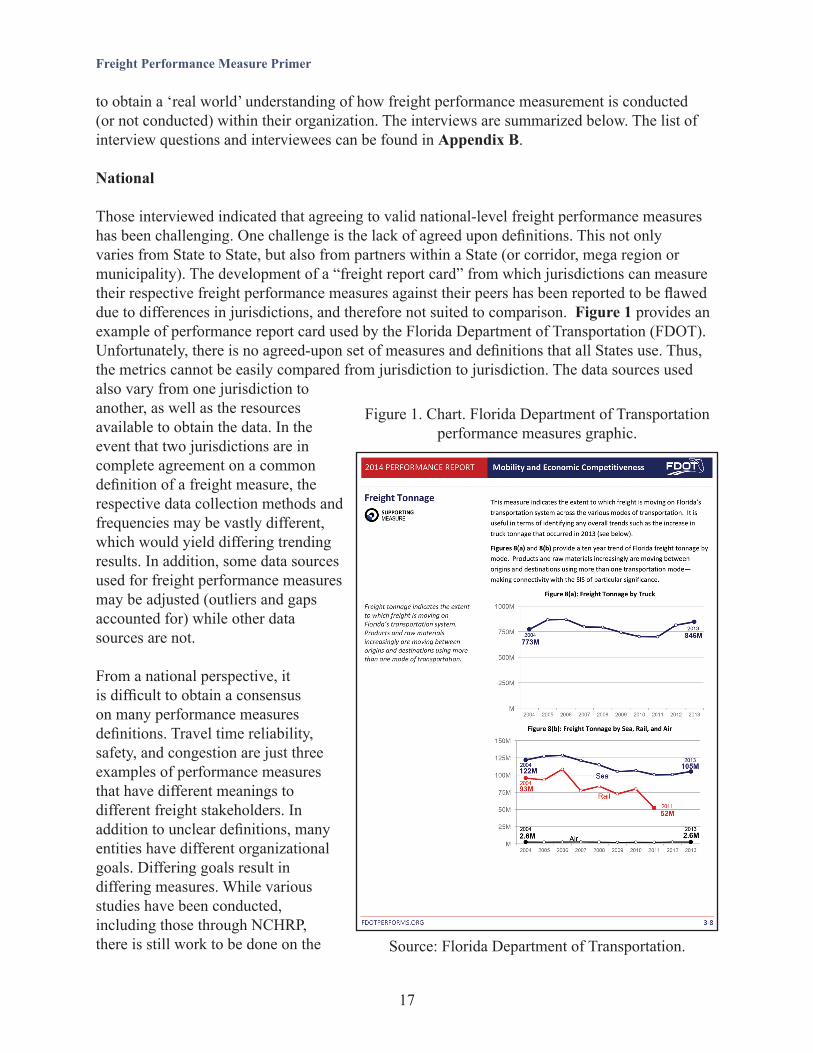
Those interviewed indicated that agreeing to valid national-level freight performance measures has been challenging. One challenge is the lack of agreed upon definitions. This not only varies from State to State, but also from partners within a State (or corridor, mega region or municipality). The development of a “freight report card” from which jurisdictions can measure their respective freight performance measures against their peers has been reported to be flawed due to differences in jurisdictions, and therefore not suited to comparison. Figure 1 provides an example of performance report card used by the Florida Department of Transportation (FDOT). Unfortunately, there is no agreed-upon set of measures and definitions that all States use. Thus, the metrics cannot be easily compared from jurisdiction to jurisdiction. The data sources used also vary from one jurisdiction to another, as well as the resources available to obtain the data. In the event that two jurisdictions are in complete agreement on a common definition of a freight measure, the respective data collection methods and frequencies may be vastly different, which would yield differing trending results. In addition, some data sources used for freight performance measures may be adjusted (outliers and gaps accounted for) while other data sources are not. From a national perspective, it is difficult to obtain a consensus on many performance measures definitions. Travel time reliability, safety, and congestion are just three examples of performance measures that have different meanings to different freight stakeholders. In addition to unclear definitions, many entities have different organizational goals. Differing goals result in differing measures. While various studies have been conducted, including those through NCHRP, there is still work to be done on the Source: Florida Department of Transportation.
Figure 1. Chart. Florida Department of Transportation performance measures graphic.

18
Freight Performance Measure Primer
issue of freight performance measure establishment, uniformity, and universal understanding and acceptability. The FHWA Rulemaking process will ultimately clarify specific performance measures that States and MPOs will be required to adhere to.
States
All States interviewed indicated that their organizations collected some form of freight performance measures, but no two States collected the same measures. The State freight performance measures varied greatly and included various combinations of the following: truck travel times, truck operating costs, truck emissions, transportation network reliability, on time travel performance along freight corridors, maintenance of waterway depths for marine freight, safety, infrastructure (conditions of highways and bridges), congestion, mobility, economic development, environmental, preservation, and percentage of roadway miles of roadway that are upgraded on critical rural freight corridors.
Some States are not measuring freight-specific performance, but are instead applying aggregate measures to freight (extracting data on fatalities that involve trucks or linking travel speeds and using this for freight travel, for example). Several States reported that their data are not fully processed or analyzed. While States often used free data provided by FHWA, all data sources are not free, and the data often has gaps and outliers that must be accounted for before an analysis can be conducted. Some States lack the tools to analyze their own data and they use contractors to analyze raw data, which can limit the ability to experiment with various analytical scenarios. If freight office staff is not able to manipulate the data, they must rely on outside sources to perform the analytical manipulations. Most State DOTs reported having multiple staff members who are exclusively or partially dedicated to freight-related initiatives. This is a departure from the limited staff resources that are available to local and regional agencies.
Freight performance measure data are frequently collected at the State level, but are usually evaluated annually. States routinely collect data in support of various programs such as the Highway Performance Monitoring System (HPMS), which includes data on the extent, condition, performance, use, and operating characteristics of the Nation’s highways. FHWA provides freight data through the Freight Analysis Framework (FAF). However, this data poses a challenge for States that need specific corridor-related data or even targeted regional freight data. The required granularity of data is not available from Federal sources. Some States are using truck probe data which can be helpful, but this type of data is reported to be poor in certain areas due to gaps in data and outliers in the evening and early morning hours.
Depending on the State, there is a large variation in modal freight performance data capture. Some States only evaluate truck data, while others may analyze truck, waterway, and rail data. Some even include air freight in their evaluation. Performance analysis for rail or pipeline is limited because private sector data are difficult to acquire due to the proprietary nature of the information, and some States believe they have little impact on private sector investments and operational parameters.

19
Freight Performance Measure Primer
All States indicated that the requirements of the FAST Act will influence their freight performance measure data collection processes, and agreed that the uniformity in requirements should help as the U.S. Department of Transportation (USDOT) develop State freight “report cards.” Some States noted that it is difficult to develop meaningful comparative assessments since not all States are collecting the same performance measures, or using the same data sources. Some States have the funds to purchase additional data, while others use free sources of data, or data obtained from other departments or agencies, to analyze and produce performance measures within their limited budget. Additionally, the scales of infrastructure can vary greatly from State to State. One State may not have to perform much maintenance on newer infrastructure and can plan (and devote resources to) other projects to enhance freight traffic. Other States must plan projects to maintain current infrastructure while keeping the flow of traffic running as smoothly as possible on already crowded highways and roads.
Both the FAST Act and MAP-21 recommend the establishment of Freight Advisory Committees (FACs), so most States or regions report forming a FAC that holds either regular meetings or ad hoc meetings/consultations. These committees provide valuable stakeholder input to State planners.
Figures 2 and Figure 3 portray the urban environment in Washington D.C. in which freight movement and delivery take place. The figures demonstrate some of the difficulties encountered during urban deliveries and the need to develop meaningful and useful data to combat these delivery concerns.
Regions
National or State-based freight performance data can be difficult to accurately disaggregate down to local or regional levels. Many cities and smaller regional planning organizations do not have dedicated staff for collecting and analyzing freight performance measures data. Figure 4 shows the major U.S. freight corridors where there is extensive data available. Some agencies collect freight performance data while others evaluate existing traffic data and make assumptions
Source: E-Squared Engineering.
Figure 2. Photo. Truck delivery on streetcar tracks, Washington, D.C.
Source: E-Squared Engineering.
Figure 3. Photo. Urban freight delivery, Washington, D.C.
20
Freight Performance Measure Primer
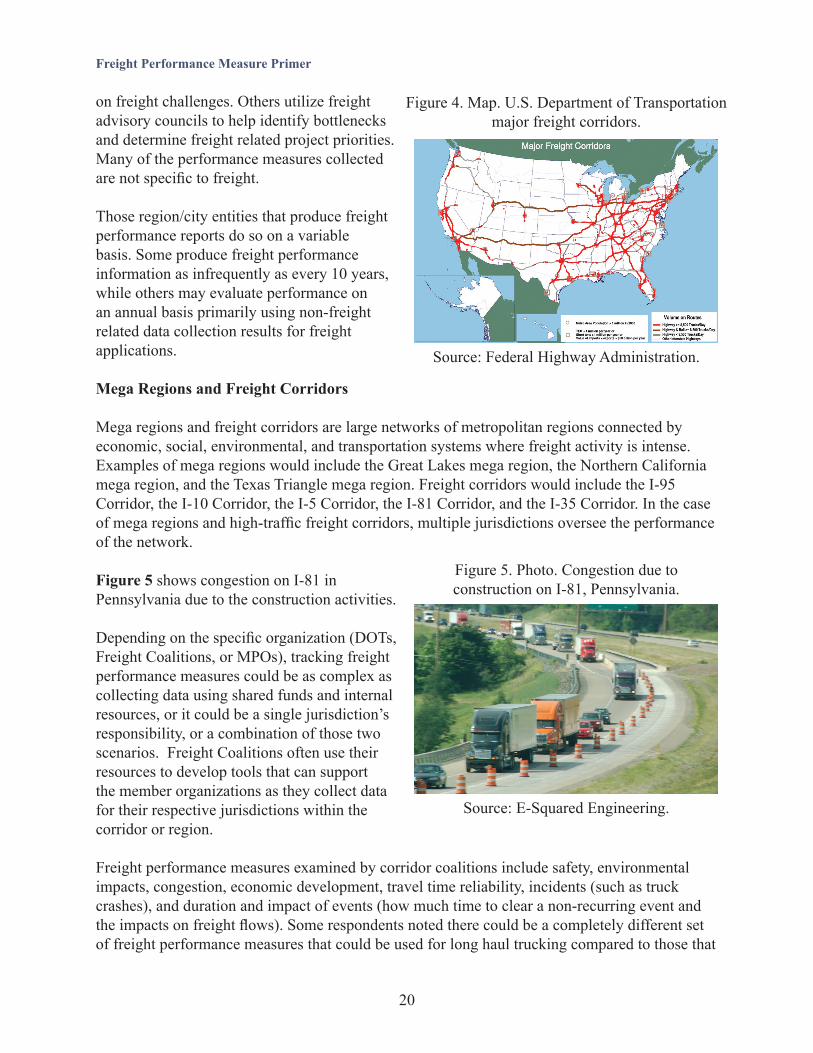
on freight challenges. Others utilize freight advisory councils to help identify bottlenecks and determine freight related project priorities. Many of the performance measures collected are not specific to freight.
Those region/city entities that produce freight performance reports do so on a variable basis. Some produce freight performance information as infrequently as every 10 years, while others may evaluate performance on an annual basis primarily using non-freight related data collection results for freight applications.
Mega Regions and Freight Corridors
Mega regions and freight corridors are large networks of metropolitan regions connected by economic, social, environmental, and transportation systems where freight activity is intense. Examples of mega regions would include the Great Lakes mega region, the Northern California mega region, and the Texas Triangle mega region. Freight corridors would include the I-95 Corridor, the I-10 Corridor, the I-5 Corridor, the I-81 Corridor, and the I-35 Corridor. In the case of mega regions and high-traffic freight corridors, multiple jurisdictions oversee the performance of the network.
Figure 5 shows congestion on I-81 in Pennsylvania due to the construction activities.
Depending on the specific organization (DOTs, Freight Coalitions, or MPOs), tracking freight performance measures could be as complex as collecting data using shared funds and internal resources, or it could be a single jurisdiction’s responsibility, or a combination of those two scenarios. Freight Coalitions often use their resources to develop tools that can support the member organizations as they collect data for their respective jurisdictions within the corridor or region. Freight performance measures examined by corridor coalitions include safety, environmental impacts, congestion, economic development, travel time reliability, incidents (such as truck crashes), and duration and impact of events (how much time to clear a non-recurring event and the impacts on freight flows). Some respondents noted there could be a completely different set of freight performance measures that could be used for long haul trucking compared to those that
Source: Federal Highway Administration.
Figure 4. Map. U.S. Department of Transportation major freight corridors.
Source: E-Squared Engineering.
Figure 5. Photo. Congestion due to construction on I-81, Pennsylvania.

21
Freight Performance Measure Primer
would be used for urban freight delivery. As is the case with other segments (State, region, MPO, city, and county), there is no uniformity in data collection methods, data sources, or definitions of the various performance measures.
Depending on the organization, the analysis of the freight performance measurement can be used for the following purposes: producing reports for informing member jurisdictions, educating the public, developing aggregate reporting tools for freight stakeholders in the region, or prioritizing funding for deploying strategic plan projects.
Some organizations do not create any reporting tools; instead they serve as a collection and dissemination point for their members’ data collection efforts. The Philly Freight Finder is an example of a resource used to explore and track the Philadelphia-Camden-Trenton region freight network. Figure 6 provides a screenshot of the Philly Freight Finder online tool that contains an assortment of information, including truck travel time index information.
The frequency of performance data collection depends largely upon the source of the data. In some cases, the data are collected annually by public agencies (such as State DOTs and city or county agencies) for reports, such as traffic counts and classifications. In other cases, the data may be collected for periods of time every three to ten years (or more). These data collection intervals are often irregular because freight data collection is added to an existing project.
Source: Delaware Valley Regional Planning Commission.
Figure 6. Map. Philly Freight Finder screenshot showing travel time index and average speeds for selected time period.

22
Freight Performance Measure Primer
International
Results of discussions with international representatives were consistent with those within the United States. The freight performance measures examined internationally include waiting times, loading times, shipment times, emissions, utilization rates (efficiency of trucks measured in weight), and congestion.
The truck efficiency performance measures and emissions are collected and reported annually. The data is collected by public agencies, navigation system providers, and motor carriers themselves. Figure 7 shows major roadways of Europe. Most of the freight performance measures collected are for roadways. There is little demand for collecting performance measures on other modes even though there is consensus among some freight industry stakeholders that there is a strong need. There is less interest in other modes because of minimal government investment in non-roadway modes. Border crossing data is abundantly available, primarily for trucks. There is limited data availability for rail and water freight transportation.
Figure 7. Map. European map of major roadways.
Source: Google Maps.

23
Freight Performance Measure Primer
CHAPTER 3. AVAILABLE DATA
Stakeholders have discussed the need for improved data. National-level or aggregated performance measurement data on what, where, and how much freight moves are available publicly in the United States. Only truck probe data is publicly available to measure how freight moves. Access to private sector freight performance data is limited due to proprietary reasons. Limited public sector data availability provides only partial information of the overall freight transportation network, preventing the public sector from adequately planning for freight, advancing freight performance measures, and understanding where investments are needed.
Private sector stakeholders focus largely on supply chains, or goods movement from start to finish. They have excellent sources of data for freight movement. They can identify freight flows down to the shipment and know in real-time where their goods are. They have access to state-of- the-art data and measurement systems and can identify where bottlenecks are occurring so they can continuously improve their supply chains. To stay competitive, however, private sector stakeholders typically do not release this information.
The private sector has partnered with the public sector, especially in recent years, to investigate ways in which they can share data. Many private sector representatives serve on State Freight Advisory Committees (FACs) and provide anecdotal information about where bottlenecks are occurring. Some have provided detail on the value of commodity being moved, related jobs and other information useful to decision-makers. However, this is still only information on what, where, and how much freight is moving.
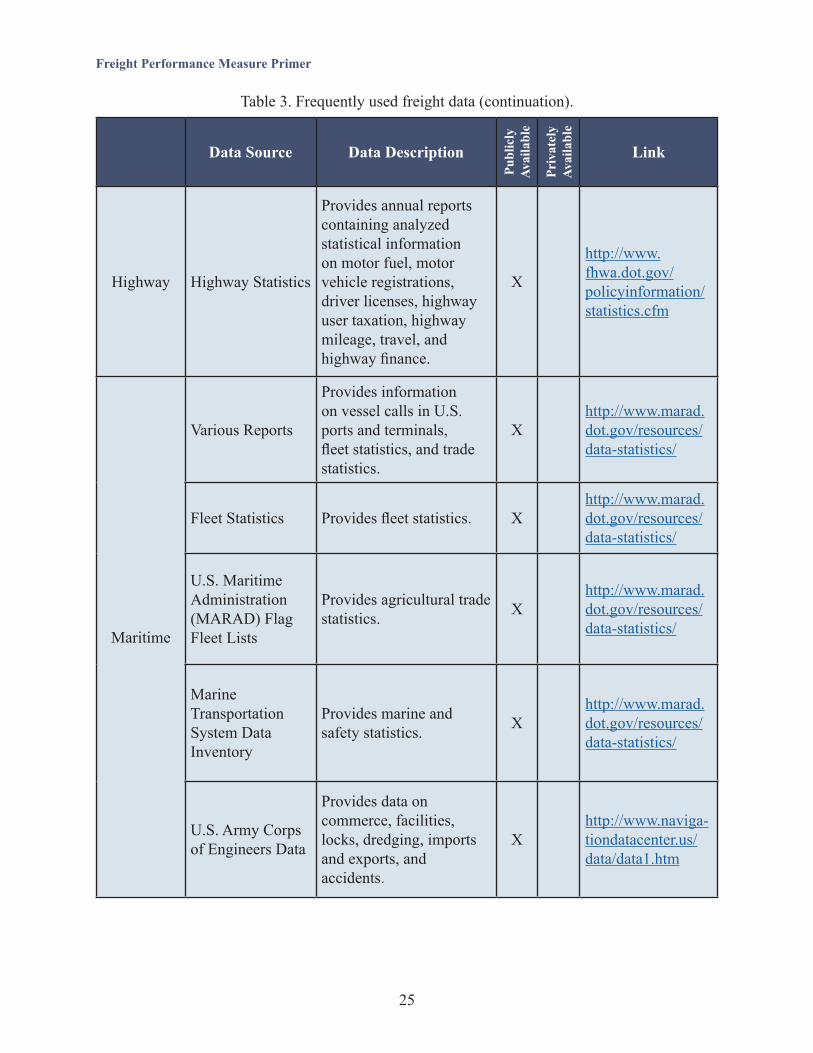
FREQUENTLY USED FREIGHT DATA
Table 3 lists the available data sources currently supporting freight analysis and measurement beginning with the truck probe data, National Performance Management Research Data Set (NPMRDS), Freight Analysis Framework (FAF) data, the Commodity Flow Survey (CFS), the Highway Performance Monitoring System (HPMS) data, and truck parking data, which are most commonly used by States and Metropolitan Planning Organizations (MPOs) for performance and planning. Mostly publicly available or publicly obtainable data are described in this table, with an emphasis on the most common sources. There are opportunities for States and MPOs that can provide access to more robust or processed data in cooperation with the private sector.
The primer identifies publicly available data to use in simple yet meaningful metrics and analysis. For more details on frequently used available freight data, refer to Appendix C, and for additional available highway data, refer to Appendix D.

24
Freight Performance Measure Primer
Data Source Data Description
Publ
icly
Av
aila
ble
Priv
atel
y Av
aila
ble
Link
Highway
Truck Probe Data
Provides information on speed and reliability, identifies bottlenecks, and supports State and regional level analyses of truck movements.
X
http://ops.fhwa.dot.gov/Freight/freight_analysis/perform_meas/index.htm
National Performance Management Research Data Set (NPMRDS)
Provides average travel times measured in 5-minute increments.
X
http://www.ops.fhwa.dot.gov/freight/freight_analysis/perform_meas/index.htm
Commodity Flow Survey (CFS)
Provides national and State-level data on domestic freight shipments.
X
Freight Analysis Framework (FAF)
Integrates data from a variety of sources to create a comprehensive picture of freight movement among States and major metropolitan areas by all modes of transportation.
Xhttp://faf.ornl.gov/fafweb/Extraction0.aspx
Commodity Flow Survey Microdata
Provides access to shipment-level characteristics while continuing to protect the confidentiality.
X
http://www.rita.dot.gov/bts/sites/rita.dot.gov.bts/files/publications/commodity_flow_survey/index.html
Highway Performance Monitoring System (HPMS)
Provides the analysis of highway system condition, performance, and investment needs that make up the biennial Condition and Performance Reports to Congress.
X
https://www.fhwa.dot.gov/policyinformation/hpms.cfm
Table 3. Frequently used freight data.
25
Freight Performance Measure Primer
Data Source Data Description
Publ
icly
Av
aila
ble
Priv
atel
y Av
aila
ble
Link
Highway Highway Statistics
Provides annual reports containing analyzed statistical information on motor fuel, motor vehicle registrations, driver licenses, highway user taxation, highway mileage, travel, and highway finance.
X
http://www.fhwa.dot.gov/policyinformation/statistics.cfm
Maritime
Various Reports
Provides information on vessel calls in U.S. ports and terminals, fleet statistics, and trade statistics.
Xhttp://www.marad.dot.gov/resources/data-statistics/
Fleet Statistics Provides fleet statistics. Xhttp://www.marad.dot.gov/resources/data-statistics/
U.S. Maritime Administration (MARAD) Flag Fleet Lists
Provides agricultural trade statistics. X
http://www.marad.dot.gov/resources/data-statistics/
Marine Transportation System Data Inventory
Provides marine and safety statistics. X
http://www.marad.dot.gov/resources/data-statistics/
U.S. Army Corps of Engineers Data
Provides data on commerce, facilities, locks, dredging, imports and exports, and accidents.
Xhttp://www.naviga-tiondatacenter.us/data/data1.htm
Table 3. Frequently used freight data (continuation).

26
Freight Performance Measure Primer
Data Source Data Description
Publ
icly
Av
aila
ble
Priv
atel
y Av
aila
ble
Link
Pipeline
Oil Pipeline Statistics
Provides statistics on crude oil, gasoline, diesel, propane, jet fuel, ethanol, and other liquid fuels, including petroleum prices, crude reserves and production, refining and processing, imports/exports, stocks, and consumption/sales.
X
http://www.eia.gov/dnav/pet/pet_move_pipe_dc_R20-R10_mbbl_m.htm
Pipeline Safety Statistics
Provides data about federally regulated and State-regulated natural gas pipelines, hazardous liquid pipelines, and liquefied natural gas plants.
Xhttp://www.phmsa.dot.gov/pipeline/library/data-stats
Rail
Surface Transportation Board Rail Waybill Sample
Provides carload waybills for all U.S. rail traffic submitted by those rail carriers terminating 4,500 or more revenue carloads annually.
X Xhttp://www.stb.dot.gov/stb/industry/econ_waybill.html
Association of American Railroads
Provides information on North American freight railroads including finances, operations, performance, input cost indexes, traffic, U.S. carloads, intermodal traffic, and Class 1 rail tons.
X
https://www.aar.org/pages/freight-rail-traffic-data.aspx
Railroad Performance Measures
Provides information on cars on line, train speed, and terminal dwell.
X http://www.railroadpm.org/
Table 3. Frequently used freight data (continuation).

27
Freight Performance Measure Primer
Data Source Data Description
Publ
icly
Av
aila
ble
Priv
atel
y Av
aila
ble
Link
Aviation
Air Cargo Summary Data
Provides a monthly freight summary, including both freight and mail carried by U.S. airlines in all service classes.
Xhttp://www.transtats.bts.gov/freight.asp
Landing Weights
Provides information on landing weights for cargo bearing airports throughout the U.S.
X
http://www.rita.dot.gov/bts/sites/rita.dot.gov.bts/files/publications/state_transportation_statistics/summary/index.html
Border Crossing
Trans-border Freight Data.
Contains freight flow data by commodity type and by mode of transportation.
X
http://transborder.bts.gov/programs/international/transborder/
Texas A&M Transportation Institute Border Data
Provides average travel time of U.S.-bound commercial vehicles.
X
http://bcis.tamu.edu/Commercial/en-US/queryAr-chivedData.aspx
Table 3. Frequently used freight data (continuation).


29
Freight Performance Measure Primer
CHAPTER 4. COMMON FREIGHT MEASURES
Public agencies do not all use the same freight performance measures, but there are some common performance measures that have continually emerged. These include truck travel times, travel time reliability, safety, infrastructure conditions, and congestion. This section provides information and links to common freight performance measures.
Truck travel times – Truck travel times can measure freight flow speeds as well as identify speed trends over time. Truck travel times can be obtained by working with private sector members of a Freight Advisory Committee (FAC). Freight stakeholders can supply average freight delivery travel time data that can be compiled and analyzed. Also, data sources such as National Performance Management Research Data Set (NPMRDS), INRIX and American Transportation Research Institute (ATRI) can provide speed data for links to supplement data collected directly from FAC members.
Travel time reliability – Travel time reliability is used to estimate on-time arrival performance of trucks to their delivery destination. It is measured based on the probability distribution of travel times and compares the spread between the median time and 95 percentile time of all trips. This provides a Planning Time Index that allows shippers to know how much time to plan to ensure a 95 percent on-time arrival performance.
Safety – Safety metrics consist of truck-involved accident reports. This information should consider fatalities, injuries, time of day, weather conditions, speeds, type of roadway, type of truck, and other vehicles involved. Law enforcement typically produces documentation for every truck crash that is reported. While this is a good source of information, it is not uncommon for the information collected by law enforcement (involving truck crashes) to be incomplete. Education of the need for accurate accident reporting is key to obtaining accurate data to serve as performance measures.
Infrastructure (conditions of highways and bridges) – Infrastructure condition data can be analyzed on freight routes to determine freight impacts. States are required to collect Highway Performance Monitoring System (HPMS) data, Proposal and Estimate System (PES) data, and bridge condition inspection data. The data obtained on freight corridors can be used to identify freight performance measures with little to no data collection expense.
Congestion – Congestion data are typically collected via Intelligent Transportation System (ITS) sensors and converted to information that is disseminated to the public through sources like the national 511 system. While this data consists largely of passenger vehicle data in addition to truck data, the congestion levels along identified freight corridors can be used to identify freight performance measures. There are also private sector sources for this data including systems like NPMRDS, INRIX, and ATRI.
30
Freight Performance Measure Primer
FREIGHT DEMAND MEASURES
Several of the common freight demand measures are described below.
Freight Volumes
Freight movement has grown considerably over the past decade and will grow steadily over the long-term. An understanding of current and future freight volumes is an important measurement. The Freight Analysis Framework (FAF) provides comprehensive and multi-modal information to understand levels of freight movement and provides projections for the next 20 years for all modes that practitioners can use in estimates.
The HPMS truck count data can be used to measure truck volumes and provide averages of daily and annual truck traffic. Other modal data can provide baseline information for current demand, which can then be compared to FAF data and projections.
Jason’s Law/Truck Parking
Truck parking shortages are a national safety concern. Jason’s law was passed in 2012 as part of the Moving Ahead for Progress in the 21st Century (MAP-21) to prioritize Federal funding toward construction of safe parking lots for truckers to rest.
Jason’s Law directed the U.S. Department of Transportation (USDOT) to conduct a survey and a comparative assessment to:
• Evaluate the capability of each State to provide adequate parking and rest facilities for commercial motor vehicles engaged in interstate transportation.
• Assess the volume of commercial motor vehicle traffic in each State.• Develop a system of metrics to measure the adequacy of commercial motor vehicle
parking facilities in each State.
These surveys were supplemented by information solicited via customized questionnaires for stakeholder community members, including representatives from truck drivers, trucking firm logistics personnel, and travel plaza and truck stop owners and operators.
In 2015, the Federal Highway Administration (FHWA) published the Jason’s Law Truck Parking Survey as well as a geocoded file with accompanying database of all the public and private facilities and spaces throughout the United States in response to MAP-21 requirements. The results provided an understanding of truck parking facilities, spaces, usage, and other areas of analysis. This information is available athttp://ops.fhwa.dot.gov/Freight/infrastructure/truck_parking/index.htm.
31
Freight Performance Measure Primer
Several additional studies have been completed in recent years to analyze the adequacy of truck parking and the associated safety risks. Many of these studies documented projected growth of truck traffic on the Nation’s highway system, severe truck parking shortages in some regions, a lack of adequate information for truck drivers about parking capacity at existing facilities, and the challenges associated with routing and delivery requirements and accommodating rest periods. The studies’ findings strongly correlate with anecdotal information collected from the trucking industry as well. Additionally, stakeholders supported the development of metrics that would best measure truck parking. Metrics include:
• Number of public and private spaces per State.• Number of spaces in relation to National Highway System (NHS) mileage in the State.• Number of spaces in relation to truck Vehicle Miles Traveled (VMT).• Number of spaces in relation to Gross Domestic Product (GDP) by State.
Other metrics for demand, driver, economic valuation, and safety are included for truck parking in Appendix F.
FREIGHT EFFICIENCY – HIGHWAY SPEEDS, AVERAGE SPEEDS, RELIABILITY
Measuring efficiency can be done at the segment level, facility level, or corridor level. Most data used to obtain travel times such as the NPMRDS, probe data, or other travel time data (i.e., Bluetooth or ITS) are provided at the segment level. To measure efficiency for larger sections of roads, the practitioner will need to aggregate the segments together.
The 2015 “Freight Performance Measure Approaches for Bottlenecks, Arterials, and Linking Volumes to Congestion Report” offers the following performance measures for measuring congestion and reliability, based on travel time (Cambridge Systematics 2015, p. 46):
• Total Delay (vehicle-hours and person-hours) – Actual vehicle-hours (or person-hours)experienced in the highway section minus the vehicle-hours (or person-hours) that would be experienced at the reference speed. It is only possible to calculate Total Delay if traffic volumes have been integrated. If not, unit delay (delay per vehicle) is substituted.
• Mean Travel Time Index – The mean travel time over the highway segment divided by the travel time that would occur at the posted, free flow, or normal speed.
• Travel Time Index (TTI) – The desired comparison percentile (often 95th or 80th) travel time for a segment divided by the travel time that would occur at a free flow, posted, or average travel time speed.
• Hours of Congestion per Year – Number of hours per year that vehicle speeds are below the following thresholds:
o Freeways and multi-lane highways: 50 miles per hour.o Rural two-lane highways: 40 miles per hour.

32
Freight Performance Measure Primer
o Signalized arterials: 30 miles per hour.
In addition to the measures recommended above, there are also “second order performance measures” recommended that are a direct result of changes in congestion and reliability. To simplify, first order performance measures can be directly measured. For example, travel speed can be directly measured and could be considered a first order performance measure. An example of a second order performance measure could be the loss of worker productivity based on lost time at work due to slow congestion related travel speeds (the first order measure). Second order performance measures are most commonly used to estimate impacts of bottlenecks and the benefits of improving them (Cambridge Systematics 2015, pp. 64, 65). Two examples of second order performance measures are delay and reliability costs, which are discussed below.
Delay
Delay Cost – This is the monetized value of delay. It is computed separately for passenger cars and trucks using the following formulas.
Annual Passenger Vehicle Delay Cost = Annual Passenger Vehicle-Hours of Delay × Value of Person Time × Vehicle OccupancyAnnual Commercial Cost = Annual Commercial Vehicle-Hours of Delay × Value of Commercial TimeWhere: the annual vehicle-hours of delay is Total Delay above, broken out by passenger and commercial (trucks) (Cambridge Systematics 2015, p. 64).
Many studies have attempted to quantify the magnitude of delay and then estimate the costs of these delays on an annual basis. One of the most recent studies to address this issue, published in April 2016 by ATRI, calculates Total Delay and Delay Cost utilizing four data sources (NPMRDS, FAF, the FHWA’s Freight Performance Measurement [FPM] program Global Positioning System [GPS] data, and ATRI’s Industry financial data). At the national level, delay associated with weekday traffic congestion on the NHS totaled over 728 million hours in 2014. This amount of delay is the equivalent of 264,781 commercial truck drivers sitting idle for an entire working year. Applying the 2014 national average operational cost per hour of $68.09 equated to just over $49.6 billion in increased operational costs to the trucking industry. Spreading this cost evenly across the 10.9 million registered large trucks in the United States results in an increased average cost per truck of $4,546” (ATRI 2016, p. 14).
For this study, ATRI implemented several standardization procedures so that the results could be compared to future studies that follow the same standardization procedures. “Incorporating these new procedures will allow this 2014 report to become a benchmark of comparison for future study years, as well as allow future year-over-year comparisons” (ATRI 2016, p. 2). The ATRI standardization procedures included:
• Using publicly available highway usage figures for the year studied.• Using the national trucking industry cost of operation figure specific to the year studied.• Establishing a standardized method for quantifying the amount of delay.
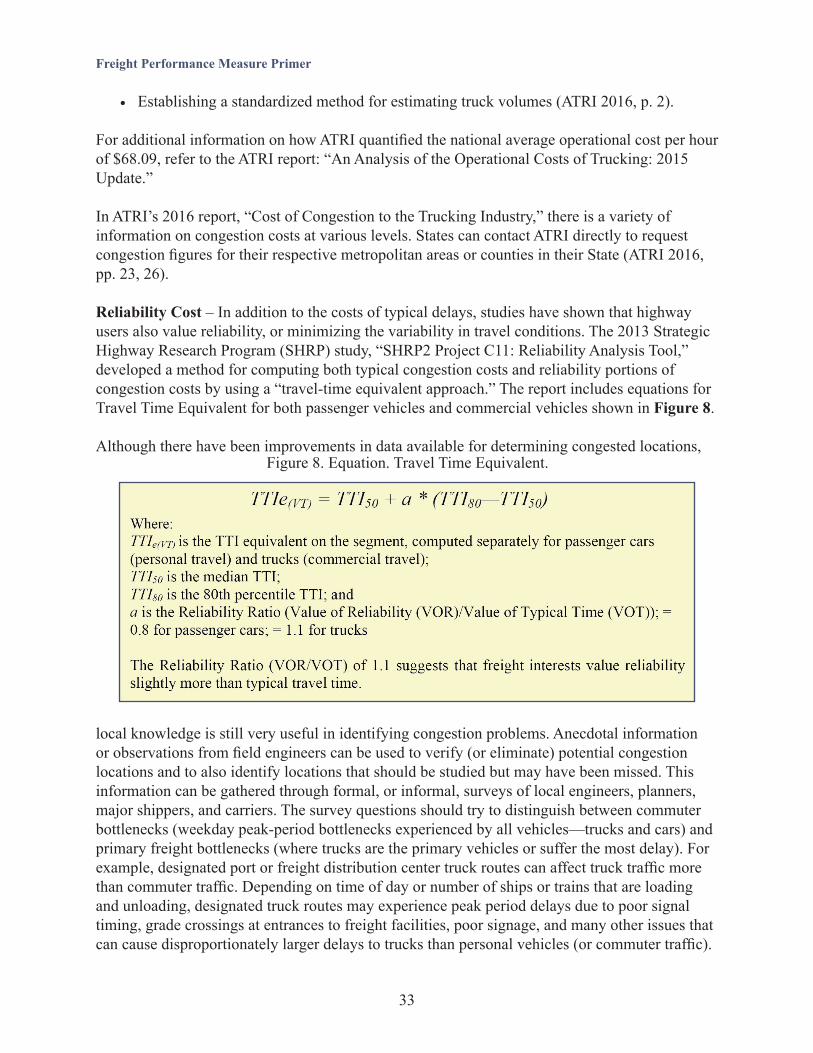
33
Freight Performance Measure Primer
• Establishing a standardized method for estimating truck volumes (ATRI 2016, p. 2).
For additional information on how ATRI quantified the national average operational cost per hour of $68.09, refer to the ATRI report: “An Analysis of the Operational Costs of Trucking: 2015 Update.”
In ATRI’s 2016 report, “Cost of Congestion to the Trucking Industry,” there is a variety of information on congestion costs at various levels. States can contact ATRI directly to request congestion figures for their respective metropolitan areas or counties in their State (ATRI 2016, pp. 23, 26).
Reliability Cost – In addition to the costs of typical delays, studies have shown that highway users also value reliability, or minimizing the variability in travel conditions. The 2013 Strategic Highway Research Program (SHRP) study, “SHRP2 Project C11: Reliability Analysis Tool,” developed a method for computing both typical congestion costs and reliability portions of congestion costs by using a “travel-time equivalent approach.” The report includes equations for Travel Time Equivalent for both passenger vehicles and commercial vehicles shown in Figure 8.
Although there have been improvements in data available for determining congested locations,
local knowledge is still very useful in identifying congestion problems. Anecdotal information or observations from field engineers can be used to verify (or eliminate) potential congestion locations and to also identify locations that should be studied but may have been missed. This information can be gathered through formal, or informal, surveys of local engineers, planners, major shippers, and carriers. The survey questions should try to distinguish between commuter bottlenecks (weekday peak-period bottlenecks experienced by all vehicles—trucks and cars) and primary freight bottlenecks (where trucks are the primary vehicles or suffer the most delay). For example, designated port or freight distribution center truck routes can affect truck traffic more than commuter traffic. Depending on time of day or number of ships or trains that are loading and unloading, designated truck routes may experience peak period delays due to poor signal timing, grade crossings at entrances to freight facilities, poor signage, and many other issues that can cause disproportionately larger delays to trucks than personal vehicles (or commuter traffic).
Figure 8. Equation. Travel Time Equivalent.

34
Freight Performance Measure Primer
A resource for methods for measuring travel time reliability and understanding the calculations is the FHWA Office of Operations, Office of Transportation Management website, http://ops.fhwa.dot.gov/perf_measurement/reliability_measures/index.htm, which has resources that describe measures and gives examples of congestion measures that employ the metrics suggested.
Speed
A common freight performance measure is speed. Freight corridors can have speeds monitored and used as a metric. Speed can also be used as a surrogate for time. While it is not always possible to measure travel times from origin to destination, it is possible to measure speeds. The high cost of congestion and consequences associated with freight delivery delays influence location decisions for distribution centers, manufacturing facilities, and other commercial real estate development.
The FHWA collects national freight link speed data, presented graphically on Figure 9 below. Per USDOT Facts and Figures, the national average truck speed data are collected from 500,000 trucks at 250 freight-significant highway infrastructure locations annually (USDOT website 2016). While the national truck speed data graphic provides a national indication of truck speeds (and heavy congestion zones), it does not have the granularity necessary to establish regional and local priorities based on truck speeds.
FREIGHT MODELING
Freight planning and forecasting employ a variety of tools and techniques, including economic flow models, land use and economic input-output analyses, commodity-based models, vehicle or trip-based models, and other analytic tools. Typically, data for forecasting models is obtained and
Source: Federal Highway Administration.
Figure 9. Map. Average truck speeds on select interstate highways, 2010.
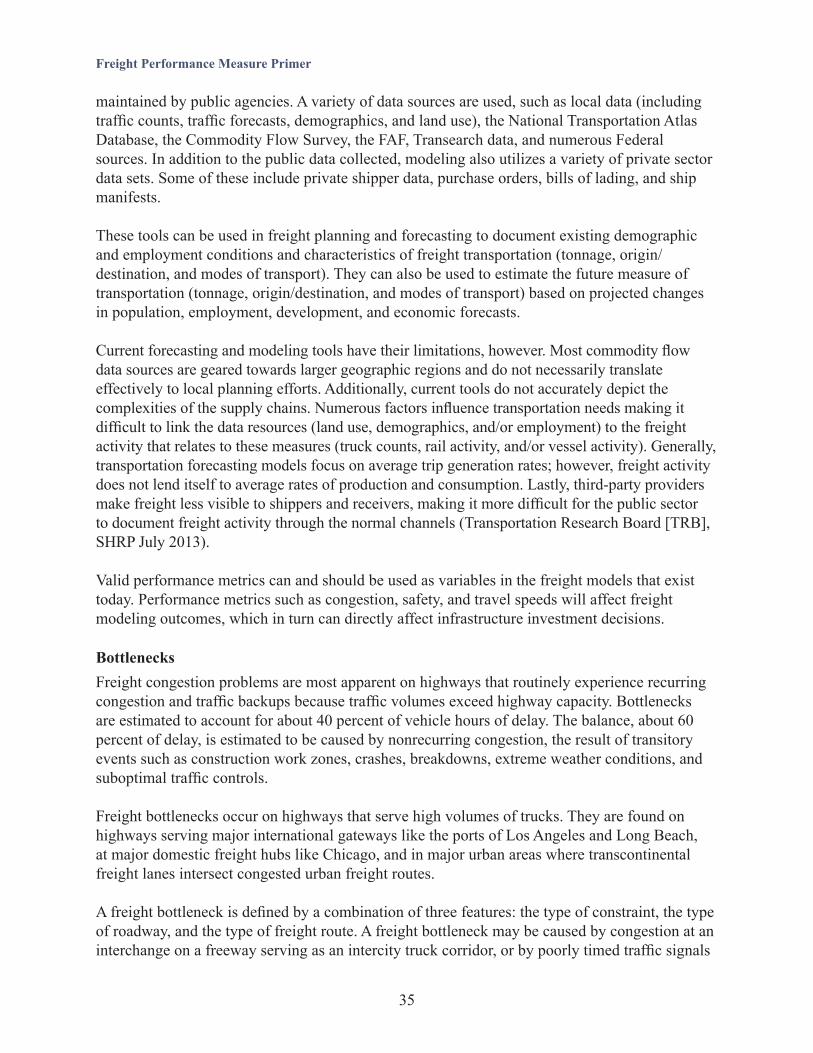
35
Freight Performance Measure Primer
maintained by public agencies. A variety of data sources are used, such as local data (including traffic counts, traffic forecasts, demographics, and land use), the National Transportation Atlas Database, the Commodity Flow Survey, the FAF, Transearch data, and numerous Federal sources. In addition to the public data collected, modeling also utilizes a variety of private sector data sets. Some of these include private shipper data, purchase orders, bills of lading, and ship manifests.
These tools can be used in freight planning and forecasting to document existing demographic and employment conditions and characteristics of freight transportation (tonnage, origin/ destination, and modes of transport). They can also be used to estimate the future measure of transportation (tonnage, origin/destination, and modes of transport) based on projected changes in population, employment, development, and economic forecasts.
Current forecasting and modeling tools have their limitations, however. Most commodity flow data sources are geared towards larger geographic regions and do not necessarily translate effectively to local planning efforts. Additionally, current tools do not accurately depict the complexities of the supply chains. Numerous factors influence transportation needs making it difficult to link the data resources (land use, demographics, and/or employment) to the freight activity that relates to these measures (truck counts, rail activity, and/or vessel activity). Generally, transportation forecasting models focus on average trip generation rates; however, freight activity does not lend itself to average rates of production and consumption. Lastly, third-party providers make freight less visible to shippers and receivers, making it more difficult for the public sector to document freight activity through the normal channels (Transportation Research Board [TRB], SHRP July 2013).
Valid performance metrics can and should be used as variables in the freight models that exist today. Performance metrics such as congestion, safety, and travel speeds will affect freight modeling outcomes, which in turn can directly affect infrastructure investment decisions.
BottlenecksFreight congestion problems are most apparent on highways that routinely experience recurring congestion and traffic backups because traffic volumes exceed highway capacity. Bottlenecks are estimated to account for about 40 percent of vehicle hours of delay. The balance, about 60 percent of delay, is estimated to be caused by nonrecurring congestion, the result of transitory events such as construction work zones, crashes, breakdowns, extreme weather conditions, and suboptimal traffic controls.
Freight bottlenecks occur on highways that serve high volumes of trucks. They are found on highways serving major international gateways like the ports of Los Angeles and Long Beach, at major domestic freight hubs like Chicago, and in major urban areas where transcontinental freight lanes intersect congested urban freight routes.
A freight bottleneck is defined by a combination of three features: the type of constraint, the type of roadway, and the type of freight route. A freight bottleneck may be caused by congestion at an interchange on a freeway serving as an intercity truck corridor, or by poorly timed traffic signals
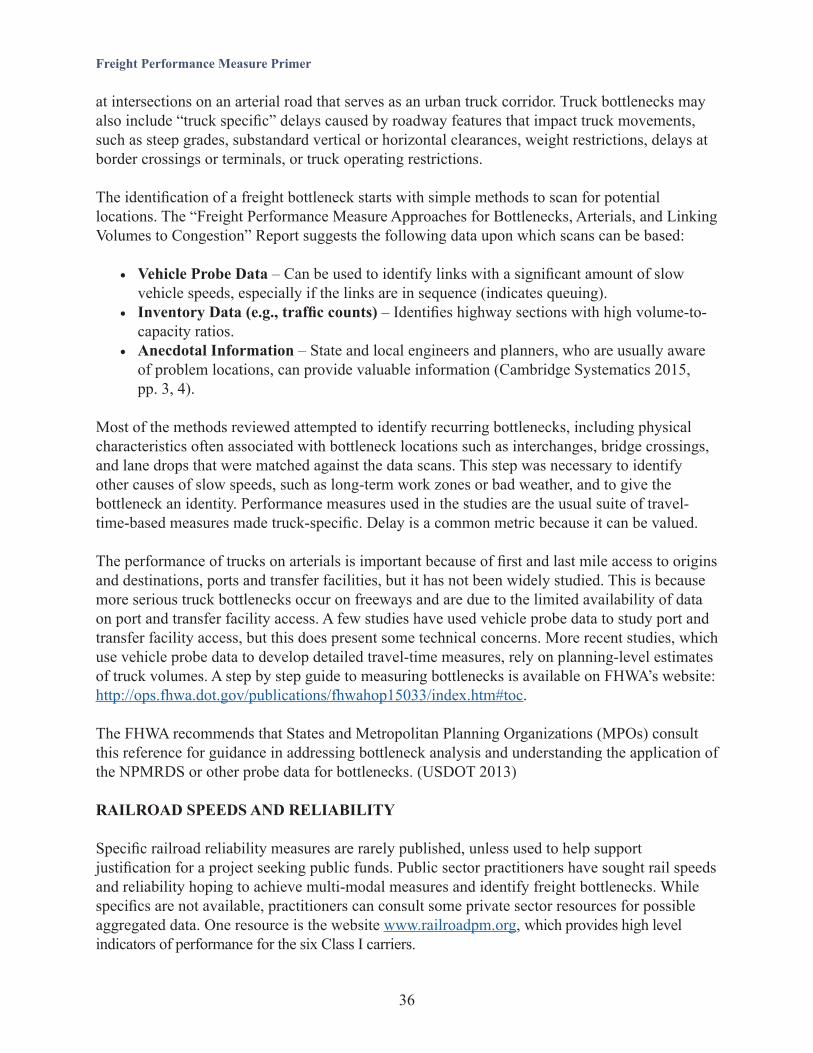
36
Freight Performance Measure Primer
at intersections on an arterial road that serves as an urban truck corridor. Truck bottlenecks may also include “truck specific” delays caused by roadway features that impact truck movements, such as steep grades, substandard vertical or horizontal clearances, weight restrictions, delays at border crossings or terminals, or truck operating restrictions.
The identification of a freight bottleneck starts with simple methods to scan for potential locations. The “Freight Performance Measure Approaches for Bottlenecks, Arterials, and Linking Volumes to Congestion” Report suggests the following data upon which scans can be based:
• Vehicle Probe Data – Can be used to identify links with a significant amount of slow vehicle speeds, especially if the links are in sequence (indicates queuing).
• Inventory Data (e.g., traffic counts) – Identifies highway sections with high volume-to-capacity ratios.
• Anecdotal Information – State and local engineers and planners, who are usually aware of problem locations, can provide valuable information (Cambridge Systematics 2015, pp. 3, 4).
Most of the methods reviewed attempted to identify recurring bottlenecks, including physical characteristics often associated with bottleneck locations such as interchanges, bridge crossings, and lane drops that were matched against the data scans. This step was necessary to identify other causes of slow speeds, such as long-term work zones or bad weather, and to give the bottleneck an identity. Performance measures used in the studies are the usual suite of travel- time-based measures made truck-specific. Delay is a common metric because it can be valued.
The performance of trucks on arterials is important because of first and last mile access to origins and destinations, ports and transfer facilities, but it has not been widely studied. This is because more serious truck bottlenecks occur on freeways and are due to the limited availability of data on port and transfer facility access. A few studies have used vehicle probe data to study port and transfer facility access, but this does present some technical concerns. More recent studies, which use vehicle probe data to develop detailed travel-time measures, rely on planning-level estimates of truck volumes. A step by step guide to measuring bottlenecks is available on FHWA’s website: http://ops.fhwa.dot.gov/publications/fhwahop15033/index.htm#toc.
The FHWA recommends that States and Metropolitan Planning Organizations (MPOs) consult this reference for guidance in addressing bottleneck analysis and understanding the application of the NPMRDS or other probe data for bottlenecks. (USDOT 2013)
RAILROAD SPEEDS AND RELIABILITY
Specific railroad reliability measures are rarely published, unless used to help support justification for a project seeking public funds. Public sector practitioners have sought rail speeds and reliability hoping to achieve multi-modal measures and identify freight bottlenecks. While specifics are not available, practitioners can consult some private sector resources for possible aggregated data. One resource is the website www.railroadpm.org, which provides high level indicators of performance for the six Class I carriers.

37
Freight Performance Measure Primer
Train speeds are measured by the haul times between terminals, with average speed being calculated by dividing train miles by total hours operated (excluding yard and local trains, passenger trains, maintenance-of-way trains, and terminal time) (refer to Table 4 for 52-week unweighted averages). The six major North American railroads voluntarily report train speed on a weekly basis. In addition to a composite speed, the railroads report train speed for various components of their network, such as Intermodal, Multilevel, and Coal Unit. Data is only presented at the national level; therefore, obtaining estimated speeds for a State or region may be challenging.
FREIGHT SYSTEM CONDITION INDICATORS
Bridge Structural Deficiencies
The National Bridge Inventory is the primary source of data for evaluating the conditions of over 116,660 bridges on the NHS in the United States. The overall performance trends for NHS bridges have improved since the early 1990s. Structural deficiencies as a percentage of total bridge deck area on the NHS have dropped from 13.3 percent in 2001 to 9.1 percent in 2010. The primary considerations in classifying structural deficiencies are the bridge component condition ratings for the deck, superstructure, and substructure. These structural deficiencies are considered separately from functional deficiencies such as width, vertical clearance, approach curvature, or other factors that may reflect current design standards and not the structural integrity of the bridge. Certain structural deficiencies could result in load limits, which can affect freight movement. Functional deficiencies may result in vertical or horizontal clearances that hinder freight movement, particularly for oversized loads. States are required to report this information to FHWA, so States and MPOs would already have an assessment of bridge data.
Intermodal Connector Conditions
The NHS freight connectors are the public roads leading to major intermodal terminals. NHS connectors were designated in cooperation with State departments of transportation (DOTs) and MPOs based on criteria developed by DOT. Although they account for less than one percent of NHS mileage, NHS connectors are key conduits for the timely and reliable delivery of goods.
Railroad Operating SpeedMarch 2015 (mph)
Operating SpeedMarch 2016 (mph)
BNSF 23.2 27.6Canadian Pacific 25.6 27.7CSX Transportation 19.4 20.5Kansas City Southern 26.8 26.6Norfolk Southern 21.0 23.7Union Pacific 24.0 26.4Unweighted Average 23.33 25.41
Table 4. Average train speeds.
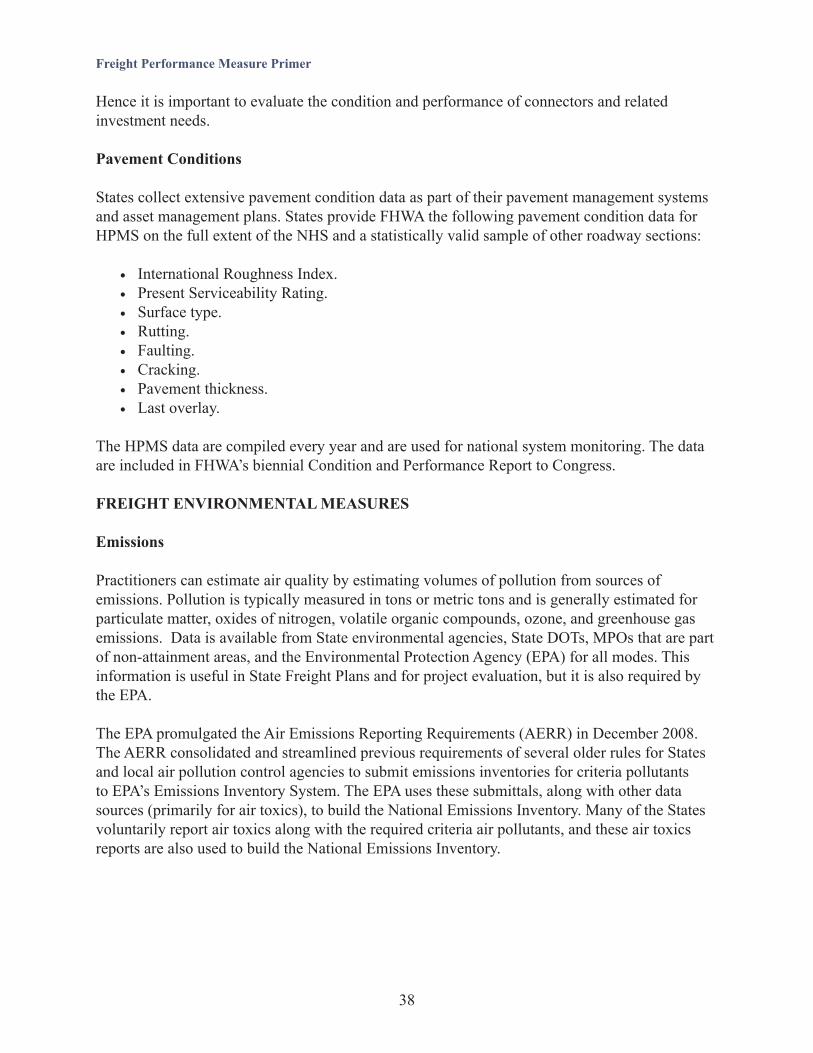
38
Freight Performance Measure Primer
Hence it is important to evaluate the condition and performance of connectors and related investment needs.
Pavement Conditions
States collect extensive pavement condition data as part of their pavement management systems and asset management plans. States provide FHWA the following pavement condition data for HPMS on the full extent of the NHS and a statistically valid sample of other roadway sections:
• International Roughness Index.• Present Serviceability Rating.• Surface type.• Rutting.• Faulting.• Cracking.• Pavement thickness.• Last overlay.
The HPMS data are compiled every year and are used for national system monitoring. The data are included in FHWA’s biennial Condition and Performance Report to Congress.
FREIGHT ENVIRONMENTAL MEASURES
Emissions
Practitioners can estimate air quality by estimating volumes of pollution from sources of emissions. Pollution is typically measured in tons or metric tons and is generally estimated for particulate matter, oxides of nitrogen, volatile organic compounds, ozone, and greenhouse gas emissions. Data is available from State environmental agencies, State DOTs, MPOs that are part of non-attainment areas, and the Environmental Protection Agency (EPA) for all modes. This information is useful in State Freight Plans and for project evaluation, but it is also required by the EPA.
The EPA promulgated the Air Emissions Reporting Requirements (AERR) in December 2008. The AERR consolidated and streamlined previous requirements of several older rules for States and local air pollution control agencies to submit emissions inventories for criteria pollutants to EPA’s Emissions Inventory System. The EPA uses these submittals, along with other data sources (primarily for air toxics), to build the National Emissions Inventory. Many of the States voluntarily report air toxics along with the required criteria air pollutants, and these air toxics reports are also used to build the National Emissions Inventory.

39
Freight Performance Measure Primer
FREIGHT SAFETY MEASURES
Truck Injury and Fatal Crash Rates
Highway injuries and fatalities involving trucks are generally much lower proportionally than the percentage of all highway crashes, despite the higher number of miles traveled by these vehicles each year.
Although truck traffic has a relatively good safety record, concern over truck safety remains significant because of the size, weight, and reduced handling characteristics of trucks compared to automobiles. To provide a more stable measure over time of the trucking industry’s safety performance, the most common measure used is the number of injury and fatal crashes involving trucks per 100 million miles of travel. The National Highway Traffic Safety Administration (NHTSA) is the most reliable source of data for this measure. However, a major challenge is that States code truck-related incidents differently, so a push for common coding is necessary to truly understand the impacts of truck-related injuries and fatalities.
Highway-Rail at-Grade Incidents
Highway-rail at-grade crashes occur when a rail user and a highway user impact at a crossing site. This includes motor vehicles and other highway, roadway, and sidewalk users at both public and private crossings. Overall, the safety for highway-rail at-grade crossings in the United States has improved over the last two decades, most noticeably from 2000 to 2003 and from 2006 to 2008. Although the number of at-grade crossing incidents has decreased, the Federal Railroad Administration (FRA) has prioritized the modernizing of grade crossings and the evaluation of public education and awareness strategies to reduce incidents on railroad rights-of-way. Railroads operating in the United States are required to submit monthly accident reports to FRA and crash data updates are published monthly. The FRA website allows users to query the incident database with a wide range of filters, including railroad, State, county, public and/or private crossings, and start/end date.
FREIGHT ECONOMIC DEVELOPMENT MEASURES AND ANALYSIS
Origin and Destination Pairs
The “Freight Performance Measure Approaches for Bottlenecks, Arterials, and Linking Volumes to Congestion” Report looks at Origin and Destination (O/D) pairs and discusses challenges with obtaining quality O/D data. The report notes that past studies have focused on the facility-based view of truck impacts but truckers and shippers are usually more concerned with the performance of the entire trip. Facility performance is more common since it is at the level at which the data are available to State DOTs. True O/D data that defines entire trips are not readily available to public agencies. The study recommends that in general, incorporating the user’s perspective into freight performance is a key step to advancing the state of the practice. However, both perspectives provide for a comprehensive freight performance management program, especially since most improvements that can be effected by transportation agencies are facility focused (Cambridge Systematics 2015, p. 3).

40
Freight Performance Measure Primer
The GPS readings produce data from on-board or personal devices, but are heavily processed by the vendors so that any specific O/D data are aggregated. This is true of the vendors that provide the data as speeds assigned to a link, usually defined by the Traffic Message Channel standard. When using link data for freight purposes, specific freight truck data (rather than general traffic data) is recommended as several studies have confirmed both route and speed differences between cars (including taxis and limousines) and freight trucks (Cambridge Systematics 2015, p. 3).
A number of methods can be used to understand O/D. First, States and MPOs can talk to their freight stakeholders to understand actual business patterns. Anecdotal information is important to customize O/D analysis and identify the correct locations of interest. Second, the FAF, Commodity Flow Survey, and other economic information, such as the Census Business Patterns, are all great resources to identify origins and destinations or key freight nodes, freight generators, and their trading partners. For more information, consult the FAF documentation and resources on FHWA’s website that illustrate how to apply FAF analysis in an O/D analysis. Additionally, ATRI data can aid in the development of anonymous O/D truck trip models and tables. States may contact ATRI directly for information on obtaining these data. Other methods to obtain performance measure data include working directly with Freight Advisory Committees (FACs) and private sector stakeholders to obtain actual O/D data. Practitioners can also investigate using ITS technology probe data collected through traveler information systems, and partnering with university research centers for collecting O/D survey data from industry representatives.
Economic Evaluation
The U.S. freight network consists of over 985,000 miles of federally aided highways, with most national and international freight moving along the interstates. Freight reliability is essential along these corridors to promote economic competitiveness and economic growth. However, many of these facilities suffer from significant congestion and deteriorating conditions that negatively impact the flow of goods and the economy they support.
Understanding the relationship between freight activity and economic influences, such as fuel prices, employment rates, inflation, and economic trends, provides valuable information on how the freight industry functions and evolves as the economy changes. Understanding these trends is key to obtaining the analytics and insight needed for the continued support of the freight industry’s role in the U.S. economy. FHWA recently published a reference document on how to adapt economic valuation tools for freight analysis. This work focuses on measuring economic performance through three tools: 1) benefit-cost analysis (BCA), 2) economic impact assessments, and 3) analyses focused on estimating the impact of transportation on industry productivity and competitiveness. This document is available on FHWA’s website:http://ops.fhwa.dot.gov/publications/fhwahop15034/ch1.htm.
The practitioner can develop measures of economic activity or benefit for freight projects using these types of measurement tools. These measures can also be used in project or plan development.
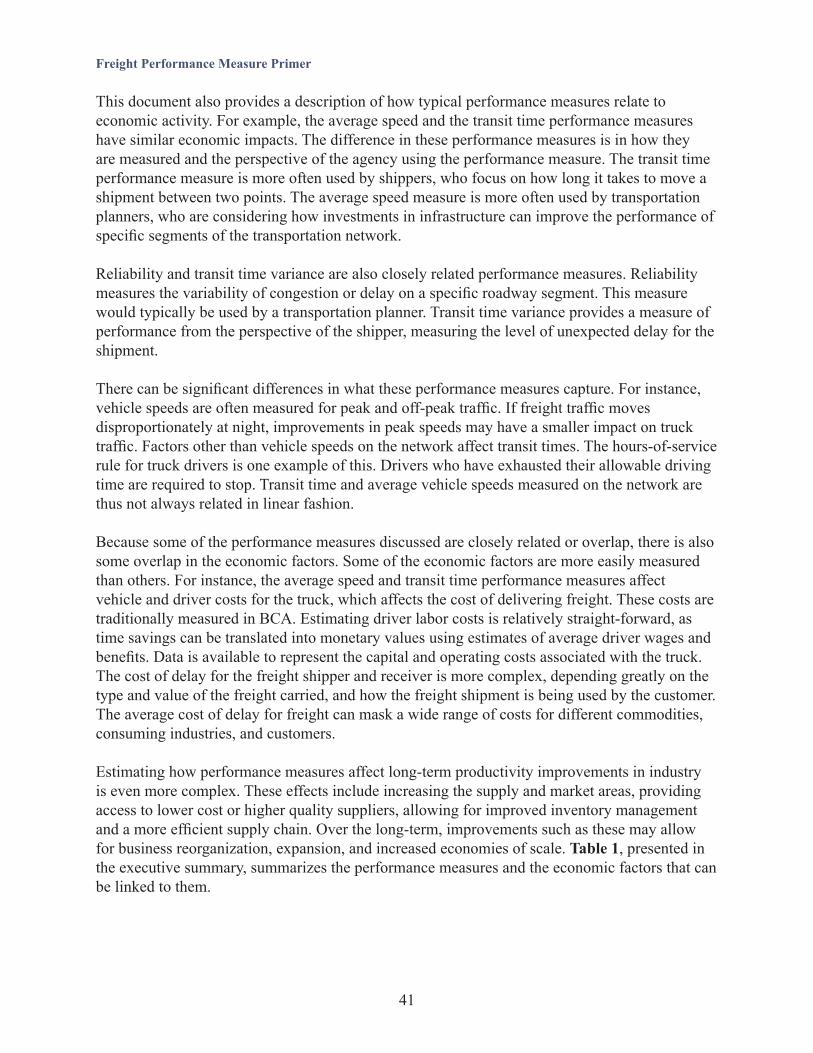
41
Freight Performance Measure Primer
This document also provides a description of how typical performance measures relate to economic activity. For example, the average speed and the transit time performance measures have similar economic impacts. The difference in these performance measures is in how they are measured and the perspective of the agency using the performance measure. The transit time performance measure is more often used by shippers, who focus on how long it takes to move a shipment between two points. The average speed measure is more often used by transportation planners, who are considering how investments in infrastructure can improve the performance of specific segments of the transportation network.
Reliability and transit time variance are also closely related performance measures. Reliability measures the variability of congestion or delay on a specific roadway segment. This measure would typically be used by a transportation planner. Transit time variance provides a measure of performance from the perspective of the shipper, measuring the level of unexpected delay for the shipment.
There can be significant differences in what these performance measures capture. For instance, vehicle speeds are often measured for peak and off-peak traffic. If freight traffic moves disproportionately at night, improvements in peak speeds may have a smaller impact on truck traffic. Factors other than vehicle speeds on the network affect transit times. The hours-of-service rule for truck drivers is one example of this. Drivers who have exhausted their allowable driving time are required to stop. Transit time and average vehicle speeds measured on the network are thus not always related in linear fashion.
Because some of the performance measures discussed are closely related or overlap, there is also some overlap in the economic factors. Some of the economic factors are more easily measured than others. For instance, the average speed and transit time performance measures affect vehicle and driver costs for the truck, which affects the cost of delivering freight. These costs are traditionally measured in BCA. Estimating driver labor costs is relatively straight-forward, as time savings can be translated into monetary values using estimates of average driver wages and benefits. Data is available to represent the capital and operating costs associated with the truck. The cost of delay for the freight shipper and receiver is more complex, depending greatly on the type and value of the freight carried, and how the freight shipment is being used by the customer. The average cost of delay for freight can mask a wide range of costs for different commodities, consuming industries, and customers.
Estimating how performance measures affect long-term productivity improvements in industry is even more complex. These effects include increasing the supply and market areas, providing access to lower cost or higher quality suppliers, allowing for improved inventory management and a more efficient supply chain. Over the long-term, improvements such as these may allow for business reorganization, expansion, and increased economies of scale. Table 1, presented in the executive summary, summarizes the performance measures and the economic factors that can be linked to them.
42
Freight Performance Measure Primer
FREIGHT ACCESSIBILITY MEASURES
Two types of freight accessibility measures are infrastructure-based and area-based. Infrastructure-based measures focus on the mobility associated with transportation infrastructure or services. Area-based measures quantify the accessibility of a given location (Geurs & van Wee 2004).
These two measures differ in their measurement approach, but are interrelated in their capacity to identify and assess freight accessibility problems or constraints. Infrastructure-based measures are best suited to identifying the transportation performance factors that may constitute the sources of accessibility constraints. Area-based measures quantify the accessibility of a given location or user group.
In addition to measures that fit into the more academic categorization of infrastructure- or area- based measures, there is another class of measures that can be classified as network coverage or completeness measures. Rather than measuring performance on specific links or at specific nodes within the transportation network, these additional measures describe properties of the network itself and are addressed along with infrastructure-based measures.
Infrastructure-Based and Network Measures
Infrastructure-based measures capture the level of performance on transportation infrastructure that serves a given place. Infrastructure-based measures are applied at the link- or corridor-level, and in some cases to nodes within the system. They measure factors that affect accessibility and thus overlap considerably with other (non-accessibility) categories of transportation and freight performance measures. Common infrastructure-based measures used to characterize factors affecting freight access are shown in Table 5, along with a description of the infrastructure elements to which they are typically applied, and the other performance areas to which they also relate.
Infrastructure-based measures can be applied to any set of selected links and nodes. In some cases, the measures are applied to specific corridors, links, or nodes that have been identified by planners and freight stakeholders as being particularly important to freight movements. In this case, the measures incorporate an implied focus on origins and destinations. For example, the American Association of State Highway Transportation Officials (AASHTO) Standing Committee on Performance Measurement suggests that targets for their proposed Annual Hours of Truck Delay (AHTD) measure and their Truck Reliability Index (RI80) could be established “for truck trips on multi-state corridors between major city pairs, and at major international border crossings” (AASHTO 2013). Similarly, Virginia experimented with a distance-weighted TTI metric for all road links within a 10-mile buffer of key freight nodes (Michael Baker Inc. et al. 2012). Infrastructure-based measures, however, do not directly incorporate measures of the activities that attract freight movements (i.e., the opportunities afforded by freight accessibility). Area-based measures, discussed in the following section, offer this crucial “access to what” perspective.

43
Freight Performance Measure Primer
Network coverage and completeness measures, like infrastructure measures, capture characteristics of the transportation system without directly measuring land-use and activity distributions in a geographic space. These measures evaluate network properties related to the coverage, directness, and connectivity of the transportation system. In practice, these measures are applied to a geographic area and are used to compare network characteristics across different target areas. Table 6 presents a set of measures that could be applied to a local or regional geography around a point of interest (e.g., a freight generator such as a port or industry cluster). This set of measures was developed and tested by the Virginia Department of Transportation (VDOT) as part of that agency’s pilot on accessibility measures. The local measures capture last-mile issues, while the regional measures are aimed at issues of network connectivity at the scale of a same-day truck delivery market.
Infrastructure-Based Measure Infrastructure Application
Travel time (or speed) Travel time (or speed) on a link, corridor, or between a selected origin-destination pair is a measure of general mobility.
Waiting or transfer time.
Waiting or transfer time at border crossings, ports, intermodal facilities is a specific measure targeted at bottlenecks.
Volume-to-capacity ratio
Volume-to-capacity ratio for a specific facility, mapped across a network, or measuring the number of miles that exceed a certain threshold is a measure of congestion.
Travel time index (TTI)The ratio of a selected upper-bound percentile of travel time to the median travel times on a selected path (link, corridor, or between a selected origin-destination pair) is a measure of unreliability.
Fluidity indicator
Fluidity indicator as defined by Transport Canada, targeted at measuring end-to-end supply chain performance, e.g., “total transit time of inbound containers from overseas markets to strategic North American inland destinations via various Canadian gateways” (Transport Canada 2014) is a measure of fluidity.
Table 5. Infrastructure-based measures.

44
Freight Performance Measure Primer
Area-Based Measures
Area-based measures capture the accessibility of a location or area, relative to a set of other spatially distributed activities. Within the academic literature, area-based measures are more broadly accepted than infrastructure-based measures as measures that capture the full meaning of accessibility—access for whom and to what. They measure accessibility itself, rather than measuring performance or composition of the transportation network that enables or constrains freight access. Nevertheless, infrastructure-based and network measures can also capture elements of accessibility if they are applied to key O/D pairs or to key freight generators. There are three key dimensions of an area-based measure that together define the details of any measurement approach:
• The user group (defining the perspective of the measure).• The attractions or destination to which access is being considered.• The impedances that limit access between the former two.
Figure 10 presents a taxonomy of these three dimensions, with various options presented under each of the three headers.
Local Measures Regional MeasuresLocal measures (e.g., within a 1-mile radius of a key node) are:
• Number of intersections (measures network connectivity)
• Roadway centerline miles• Network directness index (a measure
based on the ratio between straight-line and network distances)
Regional measures (e.g., within a 3-hour/100-mile radius of a key node) are:
• Truck network centerline miles• Double-stack rail miles• Rail track centerline miles• Rail track miles of siding (represents
increased operational efficiency from passing)
• Number of intermodal facilities
Table 6. Network coverage and completeness measures.
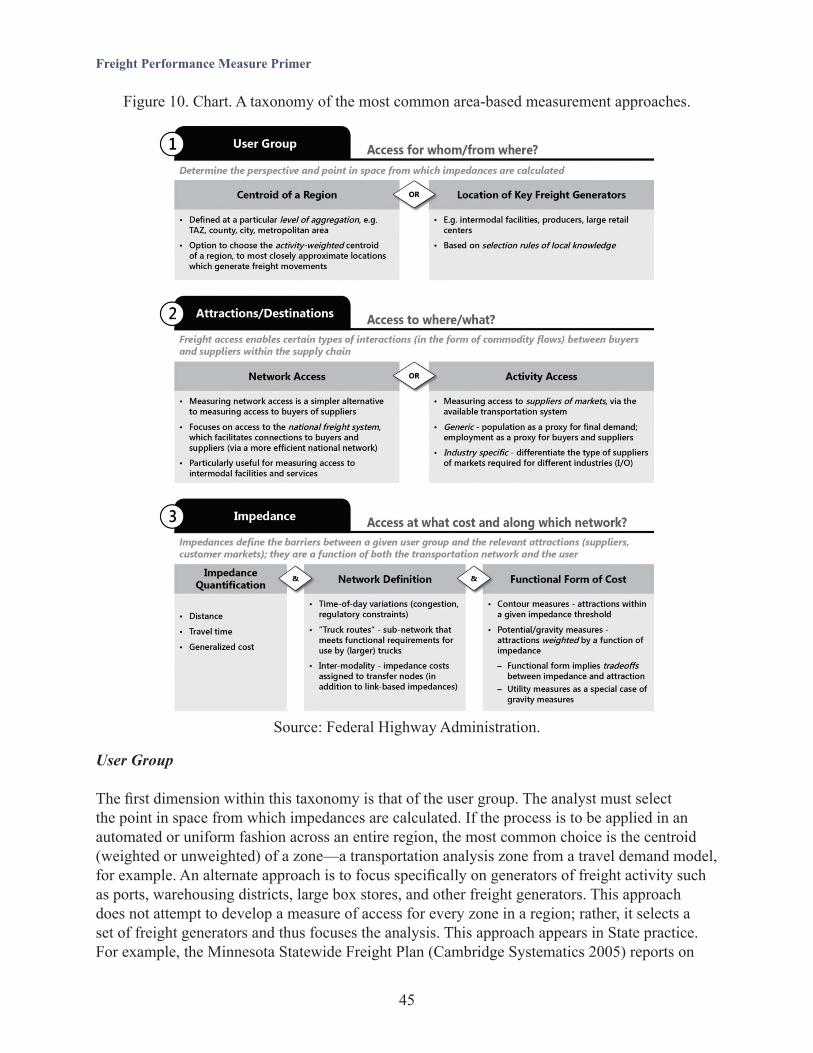
45
Freight Performance Measure Primer
User Group
The first dimension within this taxonomy is that of the user group. The analyst must select the point in space from which impedances are calculated. If the process is to be applied in an automated or uniform fashion across an entire region, the most common choice is the centroid (weighted or unweighted) of a zone—a transportation analysis zone from a travel demand model, for example. An alternate approach is to focus specifically on generators of freight activity such as ports, warehousing districts, large box stores, and other freight generators. This approach does not attempt to develop a measure of access for every zone in a region; rather, it selects a set of freight generators and thus focuses the analysis. This approach appears in State practice. For example, the Minnesota Statewide Freight Plan (Cambridge Systematics 2005) reports on
Source: Federal Highway Administration.
Figure 10. Chart. A taxonomy of the most common area-based measurement approaches.
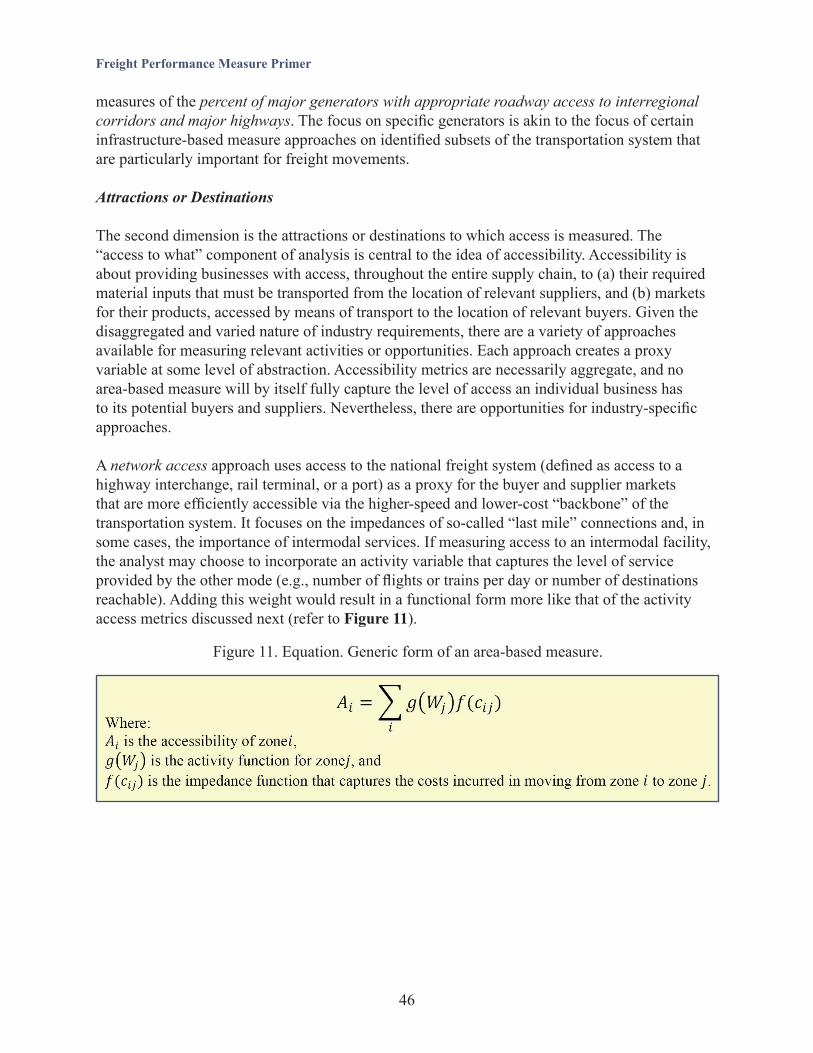
46
Freight Performance Measure Primer
measures of the percent of major generators with appropriate roadway access to interregional corridors and major highways. The focus on specific generators is akin to the focus of certain infrastructure-based measure approaches on identified subsets of the transportation system that are particularly important for freight movements.
Attractions or Destinations
The second dimension is the attractions or destinations to which access is measured. The “access to what” component of analysis is central to the idea of accessibility. Accessibility is about providing businesses with access, throughout the entire supply chain, to (a) their required material inputs that must be transported from the location of relevant suppliers, and (b) markets for their products, accessed by means of transport to the location of relevant buyers. Given the disaggregated and varied nature of industry requirements, there are a variety of approaches available for measuring relevant activities or opportunities. Each approach creates a proxy variable at some level of abstraction. Accessibility metrics are necessarily aggregate, and no area-based measure will by itself fully capture the level of access an individual business has to its potential buyers and suppliers. Nevertheless, there are opportunities for industry-specific approaches.
A network access approach uses access to the national freight system (defined as access to a highway interchange, rail terminal, or a port) as a proxy for the buyer and supplier markets that are more efficiently accessible via the higher-speed and lower-cost “backbone” of the transportation system. It focuses on the impedances of so-called “last mile” connections and, in some cases, the importance of intermodal services. If measuring access to an intermodal facility, the analyst may choose to incorporate an activity variable that captures the level of service provided by the other mode (e.g., number of flights or trains per day or number of destinations reachable). Adding this weight would result in a functional form more like that of the activity access metrics discussed next (refer to Figure 11).
Figure 11. Equation. Generic form of an area-based measure.

47
Freight Performance Measure Primer
Activity access approaches seek to quantify the specific activities that are accessible via the available transportation system (the Wi in Figure 11). The most common approach is to proxy activities by counts of population or employment within a given accessible area. This population most closely acts as a proxy for final demand, while employment serves as a proxy for buyer and supplier firms. This generic approach could also be expanded to an industry-specific approach that would, for a given industry, target known categories of input suppliers and output consumers.
Impedances
The third dimension of calculating an area-based accessibility measure pertains to the quantification of impedances—the barriers between the user group and the identified attractions/ destinations. Here the analyst defines the approach along three dimensions: impedance quantification, network definition, and the functional form used to incorporate impedance values into the overall accessibility metric. Impedance can be quantified in units of travel time, travel cost, or generalized cost (which generally incorporates time, cost, and sometimes other relevant non-monetary costs of freight movements). These costs must be then calculated on a selected network representation of the available transportation system, such as a network within a Geographic Information System (GIS) based system, travel demand model, or other routing software.
Finally, the analyst must select a functional form with which to incorporate impedance values into the overall accessibility metric (the f(cij) in Figure 11). There are two common classes of functional forms adopted for accessibility measures: contour measures (also called cumulative opportunity, isochronic, or threshold measures) and potential/gravity-type measures. Contour measures count the attraction activities within a given impedance threshold from the point of origin. Thresholds are usually selected with some behavioral basis, e.g., using a three-hour threshold to capture the range for same-day truck deliveries. Potential measures, on the other hand, are continuous measures that count all activities in the region, weighted by a function of impedance. The chosen functional form of a gravity measure implies a tradeoff or equivalence between units of impedance and units of attraction (not necessarily 1:1). Utility-based measures are a special form of the more general gravity measure. They are based on a discrete choice theory and represent the utility of available choices, with the choice set being the activities located in all other zones, and the utility function representing preference-based weighting
Note to Reader: There is some conceptual overlap between network access approaches and the network measures. For example, measuring the number of intermodal facilities located within a 100-mile radius of a key node is similar in intent to measuring travel time to the nearest intermodal facility from a given origin zone. The former quantifies the density of intermodal exchange opportunities, while the latter seeks to more directly quantify the experience of a user in search of intermodal access. Similarly, a network access measure that quantifies travel time to the nearest interstate highway interchange for all zones will tend to move up and down with a network measure that counts the number of interstate centerline miles in a region. However, the network measure is constructed more as a density indicator (miles per square mile), while the area-based approach follows the classical accessibility formulation of “access for whom and to what.”

48
Freight Performance Measure Primer
of costs and attractions for a given entity (individual or industry). Utility-based measures are derived from the estimation process used in discrete-choice modeling and represent observed behavior.
FUTURE PROGRAMS (FREIGHT FLUIDITY)
Transport Canada has developed an innovative approach to measuring freight performance that has been an excellent economic development and system improvement tool at the national, provincial, and local government levels. Canada’s “Fluidity System” approach incorporates multi-modal freight movement data on key freight corridors and infrastructure and reveals congestion points and trends. Truck transit GPS travel time data is obtained from a third-party provider and this information is used to understand the multi-modal performance of goods movement in the United States and across the borders of both Canada and Mexico. (Transport Canada 2014).
This information has been used to identify where operational investments are most needed to improve the system and has helped Canada to realize economic and environmental improvement opportunities. Most notably, this national effort has been applied to provincial and local governments, as the tool can be focused both broadly at the total system level and specifically on congestion points. Canada has begun to include select U.S. locations, highlighting the importance of considering freight flows throughout North America and the importance to the regional and global economy.
The FHWA is leading efforts in the United States to implement a fluidity system of freight performance measures and analysis. The FHWA has assembled partners from Canada and Mexico, other operating administrations, Federal agencies, academic institutions, the TRB, and the private sector to discuss and design a path forward for implementing a fluidity system in the United States.
In addition, the I-95 Corridor Coalition (I-95 CC) and Department of Commerce (DOC) are applying the concept of fluidity to major supply chains and corridors in a limited way using only truck probe data. A similar effort is underway with the North American Transportation Statistics Interchange to apply the fluidity concept using probe data to the North American Free Trade Agreement (NAFTA) corridor from Windsor, Ontario to Nueva Laredo, Mexico. These efforts focus on the use of truck probe data and will supplement multi-modal data as their projects progress to illustrate the performance of multi-modal connections. An application of multi-modal freight flows encompassing the full trip of goods (e.g., port to rail to highway to customer) such as the one Canada has implemented has not yet been developed in the United States.
FHWA plans to build on the research path designed through TRB efforts and will use the results of the I-95 CC and DOC concepts to advance corridor and mega- regional approaches to multi-modal fluidity measures. The focus will be on U.S. freight flows, but FHWA intends to coordinate with Canada and Mexico to explore a North American application. This project is supported by stakeholders, USDOT operating administrations, and Federal economic, environment, agriculture, energy, and related agencies. Additionally, this project responds to

49
Freight Performance Measure Primer
calls from the private sector for public sector support for freight infrastructure improvements and economic growth.
The MAP-21 and the Fixing America’s Surface Transportation (FAST) Act legislations require the USDOT to develop new tools and/or improve existing tools to support an outcome- oriented, performance-based approach to evaluating proposed freight related and non-freight related transportation projects. One potential method could be to use fuel tax documentation to approximate monthly truck movements.
Using fuel tax documentation to approximate the movement of trucks across the United States is based on the premise that all truck movements are a series of trips beginning at a fueling station. Each truck travels a certain distance until it runs out of fuel, which is based on the average miles per gallon for specific truck sizes. Origins of all truck trips are identifiable as the addresses of the fueling stations that are reported on the monthly fuel tax reports. Trucks can only travel within an area bounded by the distance allowed on an average fill-up, effectively providing a known area where all truck travel associated with each fueling station occurred. For additional detail on this potential truck movement tracking method, refer to Appendix G.


51
Freight Performance Measure Primer
CHAPTER 5. CHALLENGES WITH FREIGHT PERFORMANCE ANALYSIS
Federal, State, and Metropolitan Planning Organization (MPO) practitioners regularly cite challenges in analyzing freight data. These challenges, which are impediments to measuring freight, include setting goals and understanding the State or MPO role in freight planning and funding, not having multi-modal data, inconsistency in data quantity and quality, and not having reliable freight models. The following section describes these challenges in more detail. This primer aims to help solve these issues by providing information on the most commonly used data and approaches to measurement from which practitioners can work to grow the state of practice for freight performance measures.
SETTING FREIGHT GOALS
The identification of goals is the first step in bringing about change and improvements. Goals are the desired results—the purpose of a program. Objectives are the methods by which the goals will be achieved. Performance measures help agencies evaluate if they are being successful in achieving the established goals and objectives. By understanding what the result should be, agencies can better select improvement projects or programs that will help the agency achieve its goals.
Differences between freight transportation and passenger transportation present challenges to setting goals and defining objectives. Freight is most often carried by private, for-profit companies, which may have different goals than government agencies. Private companies focus on such things as profitability, competitiveness, and customer retention.
Government agencies focus on outcomes that positively impact the public good such as increasing safety for the traveling public and reducing congestion and air pollution. To understand the differences between public and private goals, transportation agencies should gather input from stakeholders with different perspectives to find shared interests that benefit one another. The Florida Department of Transportation’s (FDOT’s) outreach for the Freight Mobility and Trade Plan is a good example and can be found at http://freightmovesflorida.com/wp-content/uploads/2016/11/FMTP-Investment-Element_2014-09-11.pdf.
LACK OF CONSISTENCY
Freight stakeholders and practitioners continue to investigate how best to measure freight performance. Transportation agencies (State departments of transportation [DOTs], MPOs, and local governments) have mostly developed their own freight performance measures based on existing data available and their agency’s goals.
There is currently no standard set of universally accepted freight performance measures. In addition to the inconsistencies in performance measures between different agencies and States, there can also be inconsistency between data sets that support freight performance measures. Cities, counties, regions, or States may all collect similar data but may do so using different methodologies. This makes comparisons of freight performance between them difficult.

52
Freight Performance Measure Primer
ABUNDANCE OF INCOMPLETE DATA
There is a large amount of data available that can be used to develop performance measures. Data on infrastructure conditions and general travel data aggregated from all modes is widely available. Data for measuring freight performance is much more scarce. Many transportation agencies use general performance on key freight corridors as a proxy for measuring the movement of goods. The partnership between the Federal Highway Administration (FHWA) and the American Transportation Research Institute (ATRI), which is providing truck volume and speed data collected through a sample of Global Positioning System (GPS) transmissions, is making additional freight data available. However, even this data is incomplete. This data sample is drawn mostly from large national trucking firms and independent truckers. Recent trends indicate the larger companies are handing off deliveries to smaller delivery companies, which could mean the data is less reliable for important last-mile connections, as these companies are not tracked by ATRI data.
FREIGHT MODELING CAPABILITIES AT THE REGIONAL SCALE
Another challenge is the inability to accurately model the effects of various transportation improvements on freight performance. Many regions have truck forecasting models which were developed from a patchwork of data. These models do not typically cover all modes of freight and are currently incapable of modeling how different improvements or changing economic, demographic, or land use conditions might change freight mode share. There have been, however, some recent improvements in this area. For example, the Tampa Bay Regional Planning Model has a freight component improved by FDOT District 7 to better estimate truck travel. However, freight transportation can cover very long distances. In these cases, even a strong regional truck model may not accurately capture freight that is passing through the region.
APPLYING THE MEASURES
The 2011 the National Cooperative Freight Research Program (NCFRP) Report 10, “Performance Measures for Freight Transportation,” noted most of the agencies that reported using freight performance measures did not rely on these measures to guide decision-making. The freight performance measures were used as indicators of how freight (typically truck freight) was moving through the region, but the measures did not influence the decision-making processes or provide the impetus to amend agency goals or objectives.
DATA CAPTURE
It is important to have common definitions of freight performance measures to ensure consistency and integrity. Several common terms regarding freight data, such as “merging data,” “governing data,” “quality of freight-related data,” and “quantity of freight-related data” are not always clearly understood. Definitions for these concepts are included in the glossary in Appendix E. Terminology referring to freight performance measures data should always be examined and understood before credence is given to any trends identified in performance measure analysis.
53
Freight Performance Measure Primer
The development of performance measures typically include difficult tradeoffs between their predictive or descriptive usefulness, the cost and time involved in acquiring data, and the ability for citizens and elected officials to easily understand the measure’s meaning.
INTEGRATING DATA
The FHWA defines data integration as “the process of combining or linking two or more data sets from different sources to facilitate data sharing, promote effective data gathering and analysis, and support overall information management activities in an organization (Transportation Research Board [TRB], NCFRP 2011).
The “Freight Performance Measure Approaches for Bottlenecks, Arterials, and Linking Volumes to Congestion” Report (Cambridge Systematics 2015) noted that methodologies for producing performance measures from data are very similar, but would benefit from consistent/standardized processing procedures. Developing high-level performance measures from low-level data requires multiple processing steps, and there are usually multiple ways to perform each step. Default values also are often necessary, and these can vary depending on the methodology. The result is that different values can result from processing the same basic data.
SUSTAINING FREIGHT PERFORMANCE MEASURES
Much of the literature on performance measures and the experience of the practitioners interviewed for the NCFRP Report 10 indicated that performance measuring systems tend to mature and improve over time. Input from stakeholders indicated that of the agencies that had comprehensive measurement systems, few had those systems from the beginning.
“Begin with what you have” was a common recommendation from the performance management practitioners interviewed for the report. It was also acknowledged that there is no one proposed freight performance measures system that will meet the needs of all stakeholders. Thus, the practitioners predicted that stakeholders would advocate for additional measures that could be added over time. A perceived benefit of publishing the “Freight System Report Card” was that flaws in the current data would be uncovered as the report card was examined, which should result in improvement of the data.


55
Freight Performance Measure Primer
CHAPTER 6. BEST PRACTICES AND RECOMMENDED FREIGHT PERFORMANCE MEASURES
BEST PRACTICES: PRIVATE SECTOR
Billions of tons of freight worth trillions of dollars move in the United States every year. Trucks account for over 70 percent of the value of all domestic shipments, while rail dominates the long-distance freight market (shipments over 500 miles). Freight performance measures are a key ingredient to successfully, efficiently, and safely moving freight within, into, and out of the United States.
Performance measures can vary in meaning between the private sector and the public sector. The public sector is interested in measuring the effect of policy decisions, such as total shipments, commodity flows, and asset management. The public sector is also interested in measuring the success of regulations and standards.. These include environmental and safety measures, such as emissions of criteria pollutants, employee injuries, and fatalities.
The private sector interests are related but different. Providers are interested in economic measures, such as financial performance, equipment performance, loads, employees, and customer service. While the private sector is also concerned about fatalities and injuries, they also measure the effects of these incidents on insurance costs and liability.
There is a lack of uniformity across the main modes of freight transportation, and less agreement among modes as to the most critical performance measures. Although each mode of freight transportation has its own performance measurement needs, many of the measures across the modes emphasize the financial aspects. Despite the lack of uniformity or consensus of performance measures, several measures do tend to represent all modes of freight transport:
• Average length of haul.• Operating expenses as a percent of revenue.• Revenue per ton-mile.• Tonnage (total, all loads).• Terminal dwell time or empty miles.
The trucking industry is interested in regulations that restrict operational flexibility, rising costs, the cost of satisfying regulations, congestion impacts, and improving safety. Trucking industry issues generally fall into the following subject areas:
• Hours of service regulations.• Driver availability and shortages.• Fuel costs.• Highway congestion.• Toll costs.• Tort and other liability matters.• Environmental controls.

56
Freight Performance Measure Primer
• On-board technology.
The freight transport industry is dominated by Class I railroads, which comprise over 90 percent of freight rail revenue. Thus, the rail performance measures focus primarily on those Class I railroads. Rail freight performance measures typically consist of the following components:
• Average length of haul.• Average tons per carload.• Average tons per train.• Carloads originated.• Containers transported.• Employees.• Freight cars in service.• Freight revenue.• Freight revenue per ton-mile.• Locomotives in service.• Net income.• Operating expense.• Operating ratio.• Operating revenue.• Railroad market share.• Return on average equity.• Ton-miles of freight.
BEST PRACTICES: PUBLIC SECTOR
Most State departments of transportation (DOTs) track general performance measures. There are few, however, that have a robust freight performance measurement system in place. Several States, including Florida, Maryland, Minnesota, Ohio, Oregon, and Washington, have well-established freight programs that offer lessons learned. This primer highlights a few of the States that have proactively developed their freight programs.
Maryland
The Maryland Department of Transportation (MDOT) has a long history of freight planning and freight performance measurement. MDOT, unlike transportation administrations in many other States, is the umbrella organization to other business units including the State Highway Administration, Maryland Transportation Authority, Maryland Port Administration, Maryland Aviation Administration, Maryland Transit Administration, and the Motor Vehicle Administration. While each business unit under the MDOT umbrella is a key component to MDOT’s freight planning efforts, it is the Office of Freight and Multimodalism that is the lynch pin that holds these efforts together.
In 2009, MDOT published the Maryland Statewide Freight Plan. This Plan included a comprehensive review of the current and future freight system in Maryland and outlined policies
57
Freight Performance Measure Primer
and projects necessary to ensure the safe and efficient movement of freight in, out, within, and through Maryland. The Plan concluded that freight is expected to grow in the region by 100 percent by 2035 and identified 138 freight-related projects to address future freight demand, including 95 highway projects, 26 rail projects, and 17 port projects with a value of over $35 billion. Many of these projects have begun construction, and more are in the planning and design phases.
In 2014, the Office of Freight and Multimodalism developed the Strategic Goods Movement Plan, a guiding document for planning and programming. This five-year plan is an update to the 2009 Statewide Freight Plan. However, unlike the Statewide Freight Plan that focused on projects, the Strategic Goods Movement Plan emphasizes policy positions and strategic planning based on qualitative and quantitative analysis. This Plan analyzed trends and long-range projections and was developed with support from multiple stakeholders, including the Freight Stakeholder Advisory Committee, which assisted in identifying issues and outcomes to improve the safety and efficiency of freight transportation. The Freight Stakeholder Advisory Committee consisted of freight stakeholders from the private sector, the Federal Highway Administration (FHWA), the Federal Railroad Administration (FRA), and the public sector.
Ohio
The Ohio Department of Transportation (ODOT) initiated a statewide freight study in 2013 to understand how Ohio’s freight infrastructure is being utilized. The two purposes of the study were to 1) plan and prioritize future strategic investments in Ohio’s freight infrastructure, and 2) guide future economic development activities to make the most efficient use of the existing freight infrastructure. The results of the freight study will help inform and guide the State transportation plan (Parsons Brinckerhoff 2013).
The ODOT studied the freight system challenges that policy makers should be aware of and be prepared to address. The study concluded that truck productivity is down primarily due to driver shortages and changes in Federal regulations. It also noted that, although the interstate system is the trunk line for shippers and carriers, the U.S. and State routes provide much of the access to major customers.
The study also included several observations: manufacturing is making a comeback in the United States; air cargo, while still essential to business, has changed and no longer requires major hub operations; and Federal investment in locks and dams is inadequate on the inland waterway system.
The study evaluated several strategies that would not only benefit Ohio, but would be beneficial for many States and Metropolitan Planning Organizations (MPOs). Some of the strategies include:
• Develop driver training programs for potential truck drivers.• Replace diesel fuel with natural gas to reduce fuel costs.• Public and private air cargo owners should investigate niche markets to convert facilities

58
Freight Performance Measure Primer
from freight hubs to logistics centers based on trucking distribution.• Investigate use of longer combination vehicles.• Evaluate cost-benefit of improving local rail lines for 286,000-pound railcar capacity so
short line users continue to receive cost-effective rail service.
Oregon
In 2005, the Oregon Department of Transportation (ODOT) established a statewide traffic mobility program. This program has been extremely successful with coordination efforts, forecasting conflicts, and resolving freight related issues. ODOT has developed a close partnership with the trucking industry, holding regular meetings to discuss policy issues. Within Oregon, the Oregon Transportation Commission (OTC) makes decisions about investments on the highways and, to a lesser extent, for other freight-moving modes. The OTC uses several broad criteria for making investment decisions, which vary by funding program. For example, “projects that support freight mobility” was one of the prioritization factors established for the 2008–2011 Statewide Transportation Improvement Program (McMullen et al. 2010). Because of this legislation, the OTC was directed to consider factors such as transportation cost reduction, multi-modal connections, system efficiency, project costs, and economic benefits in selecting projects.
Washington
The Washington State Department of Transportation (WSDOT) worked with three State Freight Plan technical teams (urban goods movement, rural economies, and the State’s global gateways) to identify and prioritize WSDOT’s truck freight performance goals. WSDOT coordinated with over 60 freight stakeholders to serve on these teams, including carriers, local governments, ports, air quality experts, laborers, and academic experts. These stakeholders helped determine performance goals that align with both State and Federal policies and are most important to shippers, carriers, and residents of Washington. These goals will track the performance of the State’s truck freight economic corridors.
WSDOT worked with MPOs, the technical teams, and its regional transportation planning organization to develop the truck performance measures and to develop criteria used to define State truck, rail, and waterway freight economic corridors. These criteria will be used to evaluate State truck freight economic corridors, such as slow speeds, resiliency, bottlenecks, truck collisions, and locations with poor state of freight repair.
I-95 Corridor Coalition
I-95 spans 1,917 miles along the eastern seaboard and carries an average of over 10,000 trucks per day, with peak daily truck traffic of over 31,000. I-95 carries approximately 35 percent of the Nation’s vehicle miles traveled and carries over 5.3 billion tons of freight each year. The I-95 Corridor Coalition (I-95 CC) was formed in the early 1990s as a partnership of transportation agencies, toll authorities, public safety, and related organizations spanning the

59
Freight Performance Measure Primer
entire east coast from Maine to Florida. The purpose of the I-95CC is to provide a forum for decision-makers to address transportation and operations issues. The I-95CC focuses its efforts on the long-distance movement of freight, passengers, and travel that stretches through multiple jurisdictions and often across multiple modes.
The I-95 CC understands that with the volumes of traffic and the amount of freight being moved along I-95, multi-modal and multi-State performance measures are essential to promoting a safer and more efficient movement of goods and people. In 2016, the Coalition, in conjunction with FHWA, completed a study that evaluated the development of freight performance measures across multi-State supply chains. The study produced a framework for measuring performance, data and measurement techniques, identification of short-term solutions for defining critical trade lanes, and longer-term solutions for improved data and multi-modal approaches.
U.S. Department of Transportation, Federal Highway Administration
The FHWA is leading efforts in the United States to implement a Freight Fluidity System of performance measures and analysis. The Freight Fluidity System (USDOT 2015) spans across the freight modes and incorporates multi-modal freight movement data on key freight corridors and infrastructure to reveal congestion points and trends. This information has been used to identify where operational investments are most needed to improve the system and can help to realize economic and environmental improvement opportunities. State and local DOTs and MPOs can apply this tool both broadly at the total system level and specifically on congestion points.
RECOMMENDATIONS FOR A COMPREHENSIVE FREIGHT PERFORMANCE MEASUREMENT PROGRAM
Many options can be considered when investigating the development of performance measures. Statewide, system-wide, corridor-wide, or individual routes are just a few of the possibilities. The development of a Freight Advisory Committee (FAC) is recommended. Freight advisory groups can play a key role in selecting the most appropriate freight performance measures. These committees can be made up of any number of public and private freight stakeholders. A FAC should consist of stakeholders from State DOTs, motor truck associations, railroads, ports, air freight, economic development organizations, freight shippers and receivers, logistics companies, agricultural industry, and other relevant freight stakeholders as deemed necessary.
The Oregon DOT “Freight Performance Measures: Approach Analysis” report researched each State DOT’s long-range plans. Table 7 shows the most-cited goals and the number of States reporting those goals.

60
Freight Performance Measure Primer
The aim of most DOTs and MPOs is to increase infrastructure efficiency through focused investments. Therefore, measures need to be developed that predict the impact of investment on transportation flows through the entire State and to project potential modal shifts. This, however, will likely require performance measures for multiple modes. To better evaluate the performance of the freight transportation system, data relating each of the major policy goals for freight by mode is required. Obtaining this data is a first step in developing metrics that are useful to decision-makers for policy analysis.
Most safety-related freight performance measures include the number of accidents or fatalities from incidents involving freight vehicles on a segment of roadway. Safety measures would quantify the amount of loss and damage because of the accident or fatality, or the total cost of freight loss and damage from crashes divided by the total freight vehicle miles traveled. This measure could also be considered as a system performance measure.
Table 8 below presents performance measures that States and MPOs could include in their freight planning efforts. Some of these performance measures will be identified by FHWA as the proposed rule making process is finalized. Other measures were derived from a research of States and MPOs currently measuring freight performance.
Major Policy Goal # States Citing as a Goal
Safety 42Environmental Stewardship / Quality of Life 32Protection / Maintenance of Transportation Investment 29Mobility of People and/or Goods (Only 11 Cited Freight Specifically) 28Accessibility 21System Efficiency 18Promotion of Interconnectedness / Multi-Modal Systems 16Security 15Economic Vitality 15Economic Development 13Revenue Enhancement 12Congestion Management 8
Table 7. Stated goals for transportation policy.

61
Freight Performance Measure Primer
Category Measure
Obs
erve
d
Est
imat
ed
Dat
a Av
aila
ble1
Safety
Highway
Motor carrier crash rate X aMotor carrier truck at-fault rate X aNumber of heavy truck-related fatalities X aCapacity of weigh stations (number of trucks processed per hour) X a
National Highway System (NHS) pavement conditions X bNHS bridge conditions X bNHS intermodal connector condition X cTotal cost of freight loss and damage from accidents per Vehicle Miles Traveled (VMT) X b
Railway
Total loss and damage from accidents per route-mile X aTotal loss and damage from accidents per tons moved X aNumber of at-grade railroad crossings along freight-significant corridors such as freeways and interregional corridors X a
Number of rail fatalities X aTrain derailments per ton moved X b
Water
Value of cargo lost or damaged per tons or value of cargo moved X d
Containers damaged or lost per containers handled/total containers X d
Air
Total loss and damage from accidents divided by value of freight X dPercent of study airports meeting Traffic Safety Administration (TSA) guidelines for general aviation security X a
Incidents per 1,000 operations at freight-significant airports X aMaintenance and Preservation
Highway
Percent of pavement in good condition on freight-significant highways X b
Number of weight-restricted bridges per total number of bridges X aPercent of bridges that meet good and poor structural condition thresholds X a
Service life remaining on highway pavement X b
Table 8. Recommended performance measures.
1 a) Data available. No manipulation needed. b) Data available. Manipulation or analysis needed. c) Data could be generated from simulation or model. d) Data not readily available.

62
Freight Performance Measure Primer
Category Measure
Obs
erve
d
Est
imat
ed
Dat
a Av
aila
ble2
Highway Benefit of truck weight enforcement on pavement service life X c
Railway
Miles of track in expected or Federal Railroad Administration (FRA) Class I divided by total miles of Class I track X a
Number of double-stack tunnel restrictions per number of tunnels X a
Water
Percent of tons of freight moving though constrained locks X bUnscheduled lock closure time (hours) Channel depths at the port divided by depths at competitive ports X b
Air Percent of pavement in fair or poor condition at freight-significant airports X a
Mobility, Reliability, and Congestion
Highway
Percent of interstate providing reliable travel times* X aPercent of interstate where peak hour travel times meet expectations* X a
Percent of non-interstate NHS providing reliable travel times* X bPercent of non-interstate NHS where peak hour travel times meet expectations* X b
Annual hours of excessive delay per capita* X X bUrban: Average hours of delay per day for freight vehicles on freight-significant links X X b
Urban: Travel Time Index (TTI) on freight-significant links (ratio of the peak travel time to free-flow travel time) X b
Percent of interstate mileage allowing reliable truck travel times* X a
Percent of interstate mileage that is uncongested* X X aClearance time for incidents, crashes, or hazardous materials X bNumber of intersections and ramps with inadequate turning radii for large trailers on freight-significant corridors X X c
Table 8. Recommended performance measures (continuation).
* Performance measures to be determined in MAP-21 proposed rulemaking Source: Minnesota Department of Transportation, Measurement sources for freight performance measures and indicators, Oregon Department of Transportation, Freight Performance Measures: Approach Analysis.
2 a) Data available. No manipulation needed. b) Data available. Manipulation or analysis needed. c) Data could be generated from simulation or model. d) Data not readily available.

63
Freight Performance Measure Primer
Category Measure
Obs
erve
d
Est
imat
ed
Dat
a Av
aila
ble3
Highway
Urban: Buffer index on freight-significant links (ratio of the 95th percentile travel time, the average travel time to average travel time)
X X b
Rural: Average hours of delay per day for freight vehicles on freight-significant links X X b
Number of truck rest areas and their capacities X aRural: Average travel time on freight-significant links X c
Railway
Tons or ton-miles of freight over relevant period X bAverage terminal dwell time train-hours of delay X cPercent of rail track-miles with 286,000-pound railcar capacity rating X a
Railroad corridor level of service X c
Water
Tons of traffic arriving at a port X aTwenty-Foot Equivalent Units (TEUs) passing through port (port throughput) X a
Gate reliability or truck turn time X bShip unload rate (time per container) X dShip load rate (time per container) X dAverage delay per barge tow on river X a
Air
Flight frequency by airlines with cargo capacity (number per day) X b
Average time between flights by airlines with cargo capacity (minutes) X b
Percent of on-time departures at freight-significant airports X aPercent of on-time arrivals at freight-significant airports X a
Accessibility and Connectivity
Highway
Triple trailer VMT as a percent of total freight VMT X X aPercent of major generators with appropriate roadway access to interregional corridors and major highways X a
Percent of shippers with access to triple network X c
Railway Class I: Ratio of unit train carloads (or tons) per total carloads (or tons) X d
Table 8. Recommended performance measures (continuation).
3 a) Data available. No manipulation needed. b) Data available. Manipulation or analysis needed. c) Data could be generated from simulation or model. d) Data not readily available.

64
Freight Performance Measure Primer
Category Measure
Obs
erve
d
Est
imat
ed
Dat
a Av
aila
ble4
Railway
Percent of shippers within 50 miles of intermodal trailer-on-freight-car (TOFC) facility X b
Percent of major freight generators with appropriate rail access X aNumber or capacity of intermodal facilities X a
WaterShippers within 50 miles of river port (for barge accessibility) X dAvailability of container-handling capability and/or bulk transfer capability X b
Air
Flight frequency by airlines with cargo capacity (number per day) X b
Average time between flights by airlines with cargo capacity (minutes) X b
Average travel time delay for trucks on airport access roads X bNumber of docks or acres of cargo-handling facilities X a
Environmental
AllTotal tons of emissions reduced from Congestion Mitigation and Air Quality Improvement Program (CMAQ) projects for applicable criteria pollutants and precursors*
X d
All Pounds of greenhouse gas emissions X d
All Increase in energy consumed or costs related to energy consumption X d
All Increase in air pollution impacts/costs X d
Table 8. Recommended performance measures (continuation).
* Performance measures to be determined in MAP-21 proposed rulemaking Source: Minnesota Department of Transportation, Measurement sources for freight performance measures and indicators, Oregon Department of Transportation, Freight Performance Measures: Approach Analysis.
4 a) Data available. No manipulation needed. b) Data available. Manipulation or analysis needed. c) Data could be generated from simulation or model. d) Data not readily available.

65
Freight Performance Measure Primer
REFERENCES
AASHTO (American Association of State Highway and Transportation Officials).—2012. “Summary of the Fixing America’s Surface Transportation Act,” 2012, Available at http://fast.transportation.org/Pages/default.aspx, As of December 16, 2015.
Association of American Railroads.—2015. Website, https://www.aar.org/.
ATRI (American Transportation Research Institute).—2016. Website, http://atri-online.org/.—2016. Cost of Congestion to the Trucking Industry. Arlington, VA: ATRI. April.—2015. An Analysis of the Operational Costs of Trucking: 2015 Update. Arlington, VA: ATRI. September.
Cambridge Systematics, Inc. and SRF Consulting Group, Inc.—2005. Minnesota Statewide Freight Plan. Minnesota Department of Transportation. Coalition for America’s Gateways and Trade Corridors.—2015. Summary of freight provisions in FAST Act, December, 2015.
Drucker, P. —1995. “The information executives truly need,” Harvard Business Review, Jan./Feb. 1995. In Harvard Business Review on Measuring Corporate Performance Boston, MA: Harvard Business School Press, 1998. (pp. 1-24).
Eccles, R.—1991. “The performance measurement manifesto,” Harvard Business Review, Jan./Feb. 1991. In Harvard Business Review on Measuring Corporate Performance Boston, MA: Harvard Business School Press, 1998. (pp. 25-45).
FDOT (Florida Department of Transportation).—2014. “Freight System Performance Measures for the Tampa Bay Region,” Tampa Bay Regional Goods Movement Study. Florida Department of Transportation, District 7. June.
Frigo, M. —2002. Strategy-Focused Performance Measures, Strategic Finance, September.
Geurs, K. & van Wee, B.—2004. “Accessibility evaluation of land-use and transport strategies: review and research directions,” Journal of Transport Geography 12. (pp. 127-140).
ICF & Leidos. —2015. Measuring the Impacts of Freight Transportation Improvements on the Economy and Competitiveness. Washington, D.C.: Federal Highway Administration (FHWA).

66
Freight Performance Measure Primer
Kaplan, R. & Norton D. —1998. The Balanced Scorecard—Measures That Drive Performance, Harvard Business Review, Feb. 1992. In Harvard Business Review on Measuring Corporate Performance, Boston, MA: Harvard Business School Press, 1998.
Katsikides, N. —2015. FHWA’s Freight fluidity Program (presentation). Federal Highway Administration, Office of Freight Management and Operations. Washington, D.C., June 22.
McMullen. B., Monsere, C., Knudson, R., Fobi, L., & Eckstein, N.—2010. Freight Performance Measures: Approach and Analysis. Portland, OR: Oregon Department of Transportation & Oregon Transportation Research and Education Consortium. May.
Michael Baker Inc., CDM Smith, Inc., & Renaissance Planning Group.—2012. OIPI Multimodal Technical Assistance: Applying Accessibility Measures; Task 1 Technical Memorandum Measuring Accessibility of Intermodal Centers. Virginia Office of Intermodal Planning and Investment.
Parsons Brinckerhoff.—2013. Ohio Statewide Freight Study. Ohio Department of Transportation.
Supply Chain Quarterly—2014 Special Edition. John Boyd, Jr.
Transport Canada. —2014. “Gateways and Corridors: Fluidity Indicator.” Presentation available athttps://www.tc.gc.ca/eng/policy/anre-menu-3023.htm. May.
TRB (Transportation Research Board).—2014. Development of Tools for Assessing Wider Economic Benefits of Transportation. Washington, D.C.: Transportation Research Board.
—2013. SHRP2 Project C11: Reliability Analysis Tool: Technical Documentation and User’s Guide, Washington, D.C.: Transportation Research Board, July.
—2013. Freight Demand Modeling and Data Improvement Strategic Plan, Strategic Highway Research Program. Washington, D.C.: Transportation Research Board.
—2011. NCFRP Report 10 – Performance Measures for Freight Transportation. Washington, D.C.: Transportation Research Board.
—2011. NCHRP Report 708, A Guidebook for Sustainability Performance Measurement for Transportation Agencies. Washington, D.C.: Transportation Research Board.

67
Freight Performance Measure Primer
U.S. Army Corps of Engineers.—2016. Website, http://www.usace.army.mil/.
U.S. Department of Labor, Bureau of Labor Statistics.—2015. Website, http://www.bls.gov/.
U.S. Department of Transportation, Federal Highway Administration. —2016. “The Economic Costs of Freight Transportation.” Available athttp://www.ops.fhwa.dot.gov/freight/freight_analysis/freight_story/costs.htm#content as of May 4, 2016.
—2015. “Transportation Equity Act for the 21st Century – A summary,” November 4, 2015. Available at https://www.fhwa.dot.gov/tea21/sumtoc.htm, as of May 9, 2016.
—2014. “MAP-21 – Moving Ahead for Progress in the 21st Century. Section 1116: Prioritization of Projects to Improve Freight Movement Questions & Answers.”http://www.fhwa.dot.gov/map21/qandas/qasec1116.cfm. Available as of May 5, 2016.
—2013. Introduction to the National Performance Management Research Data Set (NPMRDS), FHWA Office of Operations Webinar Series, Washington, D.C.: U.S. Department of Transportation. August 8.
—2013. Legislation, Regulation, and Guidance. Washington, D.C.: U.S. Department of Transportation. May 16.
—2012. A Summary of Highway Provisions in MAP-21. Washington, D.C.: U.S. Department of Transportation. July 17.
—2011. “Freight Facts and Figures 2011.” Available athttp://www.ops.fhwa.dot.gov/freight/freight_analysis/nat_freight_stats/docs/11factsfigures/figure3_17.htm as of May 4, 2016.
—2005. A Summary of Highway Provisions in SAFETEA-LU. Washington, D.C.: U.S. Department of Transportation. August 25.
—1886. A Method for Estimating Posterior BAC Distributions for Persons Involved in Fatal Traffic Accidents, Washington, D.C.: U.S. Department of Transportation (USDOT), National Highway Traffic Safety Administration (NHTSA). July 1886.
U.S. Department of Transportation, Federal Railroad Administration.—2016. Website, www.fra.dot.gov/.
U.S. Energy Information Administration.—2015. Independent Statistics and Analysis.


69
Freight Performance Measure Primer
APPENDIX A. HISTORY OF FEDERAL AUTHORIZATION AND ITS RELATIONSHIP TO FREIGHT PERFORMANCE MEASURES
FEDERAL AUTHORIZATIONS
Intermodal Surface Transportation Efficiency Act
In 1991, President George H.W. Bush signed the $155 billion Intermodal Surface Transportation Efficiency Act, or ISTEA, which set the tone for many highway, transit, bicycle, and pedestrian policies. The goal of the legislation was to develop a national intermodal transportation system that was economically efficient, environmentally sound, and provide the foundation for the Nation to compete in the global economy and move people and goods in an energy-efficient manner (U.S. Department of Transportation [USDOT] May 2013).
Transportation Equity Act for the 21st Century
The Transportation Equity Act for the 21st Century (TEA-21) was enacted June 9, 1998 as Public Law 105-178. TEA-21 authorized the Federal surface transportation programs for highways, highway safety, and transit for the six-year period from 1998 to 2003. TEA-21 was built on the initiatives established in ISTEA with the intention of improving safety as highway traffic continued to increase. Other important features of TEA-21 included protecting and enhancing communities and the natural environment and advancing America’s economic growth and competitiveness domestically and internationally through efficient and flexible transportation. TEA-21 expanded the role of the Bureau of Transportation Statistics (BTS) and opened the door for the development of a Transportation Database, a National Transportation Library, and a National Transportation Atlas Database (USDOT November 2015).
Major focus areas of TEA-21 included infrastructure and motor carrier safety. This included provisions for off-road and bicycle safety improvements. TEA-21 also provided grant funding to encourage States to improve upon their highway safety data collection, including timeliness, accuracy, completeness, uniformity, and accessibility. The National Motor Carrier Safety Assistance Program was restructured to promote performance-based activities intended to reduce crashes and develop innovative approaches to improving motor carrier compliance. Additionally, funding was increased to eliminate railway-highway crossings, railroad trespassing accidents, and railway fatalities and injuries.
TEA-21 also featured heavy investment in research to maximize the performance of the transportation system. Intelligent Transportation Systems was a focal point in an effort to improve operations and management of the transportation system and improve vehicle safety.
Safe, Accountable, Flexible, Efficient Transportation Equity Act: A Legacy for Users
On August 10, 2005, President George W. Bush signed the $244.1 billion Safe, Accountable, Flexible, Efficient Transportation Equity Act: A Legacy for Users (SAFETEA-LU) into law. Inasmuch as ISTEA and TEA-21 began shaping the highway program to meet evolving
70
Freight Performance Measure Primer
transportation needs, SAFETEA-LU continued to build on their principles through the largest surface transportation bill in history and continued investments in our transportation infrastructure.
SAFETEA-LU addressed many infrastructure challenges, such as safety, congestion, intermodal connectivity, protecting the environment, and the efficient movement of freight. SAFETEA-LU also established the Highway Safety Improvement Program, which allowed States to target funds for their most critical safety needs, including increased funding for the Railway-Highway Crossing Program. For the first time ever, States were required to develop and implement a strategic highway safety plan and include annual reports containing a list of highway safety improvement projects, implementation strategies, and their effectiveness in decreasing the number of injuries and fatalities. (USDOT August 2005)
Moving Ahead for Progress in the 21st Century Act
In July 2012, President Barack Obama signed into law Public Law 112-141, the Moving Ahead for Progress in the 21st Century Act (MAP-21). This Surface Transportation Program represented the first long-term transportation bill since SAFETEA-LU in 2005 and provided funding, policy guidance, and a programmatic framework for investments that will guide the growth and development of the Nation’s transportation infrastructure. MAP-21 builds on many of the policies established under ISTEA, TEA-21, and SAFETEA-LU and directs the Federal Highway Administration (FHWA) to work closely with stakeholders to ensure that local communities are able to build multi-modal and sustainable projects (USDOT July 2012).
MAP-21 is a multi-modal program intended to address the multitude of challenges facing an aging and deteriorating transportation network. MAP-21 focused on improving safety, maintaining infrastructure conditions, reducing traffic congestion, improving the efficiency of the system and freight movement, protecting the environment, and reducing delays in project delivery. (USDOT November 2015)
Some of the key freight-related highlights of MAP-21 include the expansion of the National Highway System (NHS). The expansion will incorporate many principal arterial highways currently not on the NHS network. MAP-21 establishes a performance-based program that will allow more efficient investment of Federal transportation funds by focusing on national transportation goals, increasing the accountability and transparency of the Federal highway programs. (USDOT 2012)
MAP-21 authorized Federal funding for roads, bridges, bicycling, and walking improvements. Additionally, MAP-21 enhances innovative financing and encourages private sector investment through a substantial increase in funding for the Transportation Infrastructure Finance and Innovation Act (TIFIA) program. It also includes a number of provisions designed to improve freight movement in support of national goals.
Federal funding for the Highway Safety Improvement Program has doubled under MAP-21. This program is aimed at reducing highway fatalities, and in particular the FHWA’s efforts to

71
Freight Performance Measure Primer
eliminate distracted driving. This program also pushes to improve transit and motor carrier safety.
In addition, due to the critical focus on infrastructure conditions, MAP-21 requires that each State maintain minimum standards for interstate pavement and National Highway System (NHS) bridge conditions. If a State falls below either standard, that State must spend a specified portion of its funds for that purpose until the minimum standard is exceeded (USDOT 2014).
Fixing America’s Surface Transportation Act
President Obama signed the Fixing America’s Surface Transportation (FAST) Act into law on December 4, 2015. The FAST Act is a five-year Federal authorization for Federal fiscal years 2016 through 2020 and authorizes $305 billion from the Highway Trust Fund and the General Fund over the life of the legislation. The FAST Act created a new National Highway Freight Program (NHFP), a formula-based program that distributes roughly $1.2 billion per year for States to invest in freight projects on the National Highway Freight Network (NHFN). Up to 10 percent of these funds may be used for intermodal projects (American Association of State Highway Transportation Officials [AASHTO] 2015).
The FAST Act also creates a new discretionary program: the Nationally Significant Freight and Highway Projects program. This program is funded at an average of $900 million per year. In addition, the FAST Act provides funding for Federal transit programs, as well as funding for the National Highway Traffic Safety Administration (NHTSA) and Federal Motor Carrier Safety Administration (FMCSA). Furthermore, this act provides funding over the five-year lifespan of the legislation for the Federal Railroad Administration (FRA) and Amtrak.
The FAST Act created a national multimodal freight network that includes the NHFN established under MAP-21(consisting of all interstate highways, 41,518 miles of primary highway freight network, critical rural freight corridors, and critical urban freight corridors), NHFN, Class I railroads, ports with annual foreign and domestic trade of at least two million short tons, inland and intra-coastal waterways, the Great Lakes and St. Lawrence Seaway, Maritime Administration marine highways, the 50 U.S. airports with the highest annual landed weight, and other assets as identified by the Undersecretary of Policy (i.e., short line railroads). States may seek additional assets on the NHFN with the input of freight stakeholders, including critical rural freight assets (Coalition for America’s Gateways and Trade Corridors 2015).
The FAST Act also requires all States using formula dollars to complete a State Freight Plan. While developing a State Freight Plan was optional as outlined in MAP-21, the FAST Act mandates the creation within two-years of the enactment of legislation and requires plan updates a minimum of every five-years. State Freight Plans may be independent of or included with the State’s long-range transportation plan. States are still encouraged to form a State Freight Advisory Committee as was the case under MAP-21 (Coalition for America’s Gateways and Trade Corridors 2015). Features of the NHFP include:

72
Freight Performance Measure Primer
• Highway freight projects must be on the NHFN or a highway or bridge project on the NHS, including adding interstate capacity.
• Other freight projects may also include rail, intermodal facilities, projects in scenic areas, and highway-rail grade separation; however, non-highway projects are limited to $500 million over five-years, must improve freight on the NHFN, and must provide public benefits.
• Eligible projects and project costs must be equal to or exceed the lesser of $100 million, 30 percent of a State’s apportionment if the project is in one State, or 50 percent of the largest State’s apportionment in a multi-State project.
• Ten percent of the program must be set aside annually for Small Projects (grants that are still at a minimum $5 million).
• Twenty five percent of annual eligible funding will be set aside for projects in rural areas (areas outside urbanized areas with populations over 200,000).
• Federal project shares may not exceed 60 percent, or 80 percent if other Federal resources are used to satisfy the State share.
• Freight projects will be treated as if they occur on a Federal-Aid Highway.• Congress may disapprove funding for a project within 60 days of USDOT’s selection.
The FAST Act established the NHFP. This program is formula-based and authorizes $6.2 billion over the five-year legislation. State shares are based on the State’s overall share of the highway program apportionments. Formula funds may be used on the following activities and projects:
• Project development.• Construction, reconstruction rehabilitation, and land acquisition.• Intelligent Transportation System projects (including intermodal facilities and border
crossings).• Rail-highway grade separation.• Geometric design improvements.• Truck-only lanes.• Truck climbing lanes.• Runaway truck lanes.• Shoulder widening.• Truck parking.• Electronic screening/credentialing.• Real-time information systems.• Traffic signals.• Ramp metering.• Work zone management.• Capacity improvements for freight bottlenecks.• Data collection and analysis.• Performance target development.
The FAST Act established the Nationally Significant Freight and Highway Projects (NSFHP) program to provide financial assistance—competitive grants, known as FASTLANE grants, or credit assistance to nationally and regionally significant freight and highway projects that align

73
Freight Performance Measure Primer
with the program goals. The following are project requirements for FASTLANE grants:
• Highway or freight projects carried out on the NHFN.• Highway or bridge projects carried out on the NHS including those that add capacity on
the interstate system that improve mobility or projects in a national scenic area.• Railway-highway grade crossing or grade separation projects.• Freight projects that are:
o Intermodal or rail projects.o Within the boundaries of a public or private freight rail, water, or intermodal facility; is
a surface transportation infrastructure project necessary to facilitate direct intermodal interchange, transfer, or access into or out of the facility; and will significantly improve freight movement on the NHFN.
The FAST Act legislation includes a number of additional freight provisions:
• Considers trucks carrying fluid milk products on the interstates’ as non-divisible loads.• Allows interstate weight waivers for covered, heavy-duty tow and recovery vehicles.• Allows up to 86,000 pounds of gross vehicle weight on interstates for emergency vehicles.• Allows vehicle weight attributable to natural gas propulsion system to be exempt from
total vehicle weight calculations.• Provides specific interstate highway weight waivers in certain States.• Sets aside $1.2 billion of Highway Safety Improvement Program funds over five-years for
the Section 130 highway-rail grade crossing program.• Includes ferries/terminals, truck parking facilities, rail-grade crossings, and intermodal
transfers in ports as eligible projects in the new Surface Transportation Block Grant (STBG) program. The STBG provides flexible funding that may be used by States and localities for projects to preserve and improve the conditions and performance on any Federal-aid highway, bridge and tunnel projects on any public road, pedestrian and bicycle infrastructure, and transit capital projects, including intercity bus terminals.
• Calls for a report on delays in goods movement.• Establishes a working group to expedite State approval for emergency routes for
commercial vehicles, including examination of potential pre-approved routes.• Creates a new port performance statistics program.• Provides community safety grants for crude-by-rail.• Creates a framework for emergency planning and response for crude-by-rail derailments.

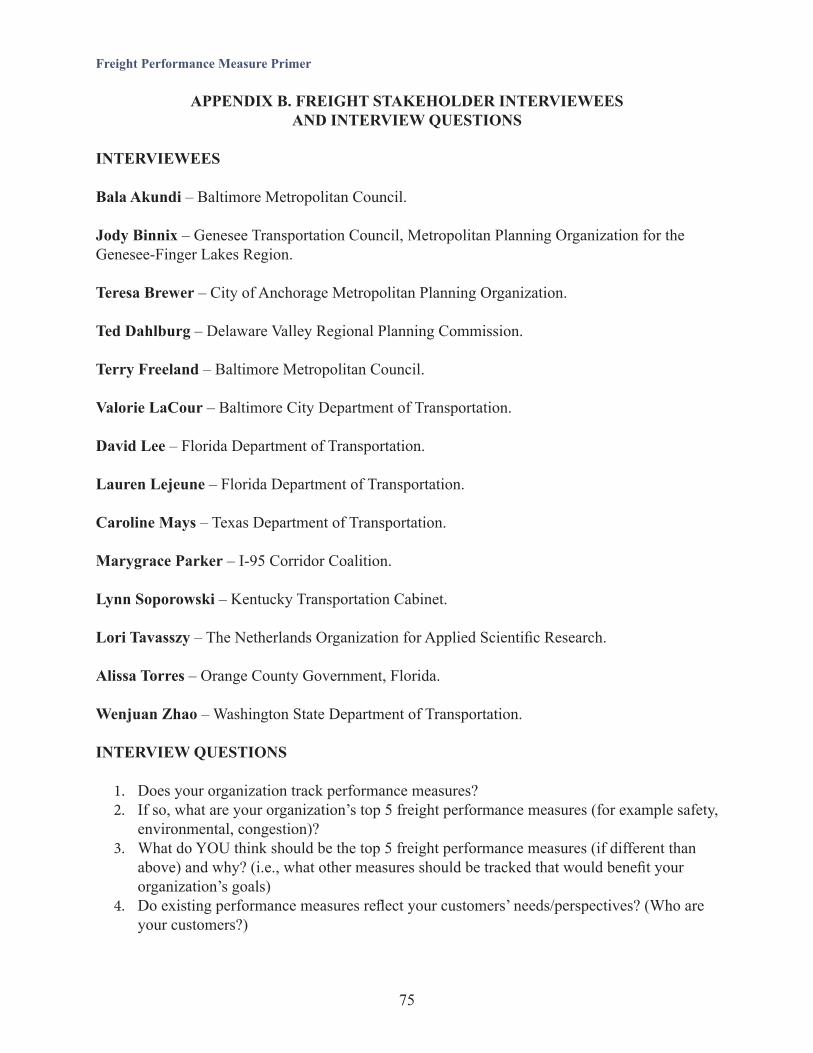
75
Freight Performance Measure Primer
APPENDIX B. FREIGHT STAKEHOLDER INTERVIEWEES AND INTERVIEW QUESTIONS
INTERVIEWEES
Bala Akundi – Baltimore Metropolitan Council.
Jody Binnix – Genesee Transportation Council, Metropolitan Planning Organization for the Genesee-Finger Lakes Region.
Teresa Brewer – City of Anchorage Metropolitan Planning Organization.
Ted Dahlburg – Delaware Valley Regional Planning Commission.
Terry Freeland – Baltimore Metropolitan Council.
Valorie LaCour – Baltimore City Department of Transportation.
David Lee – Florida Department of Transportation.
Lauren Lejeune – Florida Department of Transportation.
Caroline Mays – Texas Department of Transportation.
Marygrace Parker – I-95 Corridor Coalition.
Lynn Soporowski – Kentucky Transportation Cabinet.
Lori Tavasszy – The Netherlands Organization for Applied Scientific Research.
Alissa Torres – Orange County Government, Florida.
Wenjuan Zhao – Washington State Department of Transportation.
INTERVIEW QUESTIONS
1. Does your organization track performance measures?2. If so, what are your organization’s top 5 freight performance measures (for example safety,
environmental, congestion)?3. What do YOU think should be the top 5 freight performance measures (if different than
above) and why? (i.e., what other measures should be tracked that would benefit your organization’s goals)
4. Do existing performance measures reflect your customers’ needs/perspectives? (Who are your customers?)
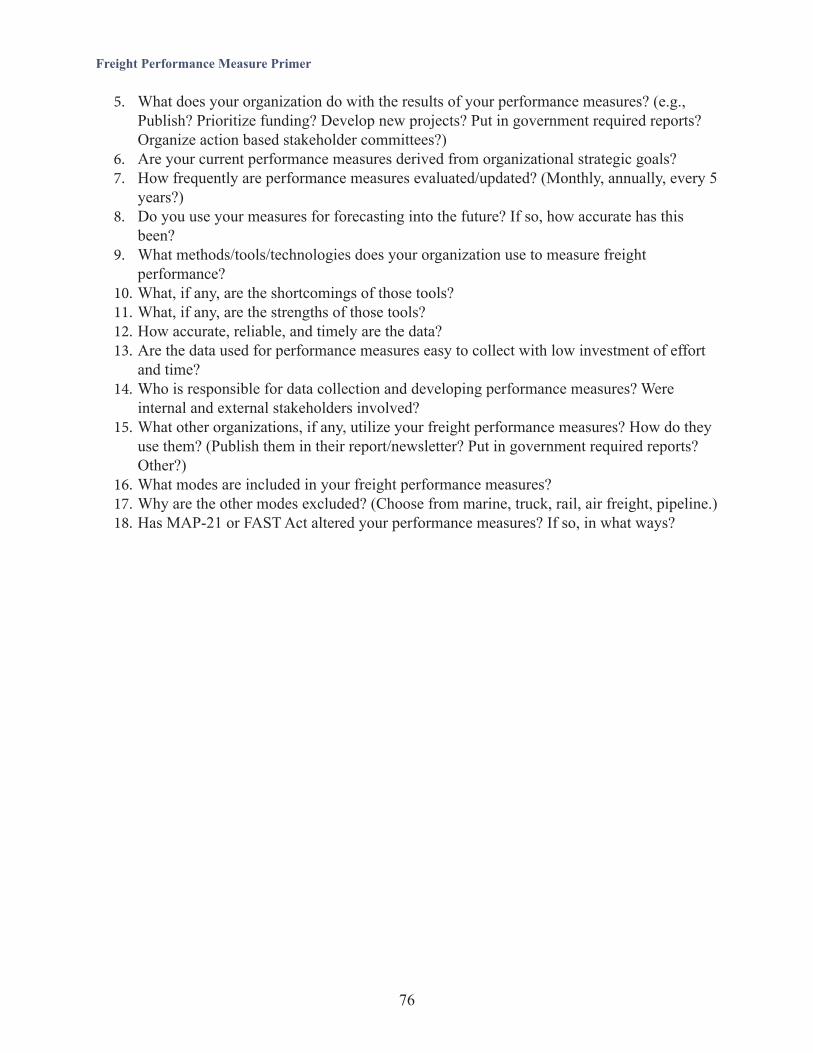
76
Freight Performance Measure Primer
5. What does your organization do with the results of your performance measures? (e.g., Publish? Prioritize funding? Develop new projects? Put in government required reports? Organize action based stakeholder committees?)
6. Are your current performance measures derived from organizational strategic goals?7. How frequently are performance measures evaluated/updated? (Monthly, annually, every 5
years?)8. Do you use your measures for forecasting into the future? If so, how accurate has this
been?9. What methods/tools/technologies does your organization use to measure freight
performance?10. What, if any, are the shortcomings of those tools?11. What, if any, are the strengths of those tools?12. How accurate, reliable, and timely are the data?13. Are the data used for performance measures easy to collect with low investment of effort
and time?14. Who is responsible for data collection and developing performance measures? Were
internal and external stakeholders involved?15. What other organizations, if any, utilize your freight performance measures? How do they
use them? (Publish them in their report/newsletter? Put in government required reports? Other?)
16. What modes are included in your freight performance measures?17. Why are the other modes excluded? (Choose from marine, truck, rail, air freight, pipeline.)18. Has MAP-21 or FAST Act altered your performance measures? If so, in what ways?
77
Freight Performance Measure Primer
APPENDIX C. FREQUENTLY USED FREIGHT DATA
TRUCK PROBE DATA
The Federal Highway Administration (FHWA) has been a leader in developing freight data and performance metrics. Since 2002, FHWA has worked with private sector trucking operations to collect data through a trusted third party, the American Transportation Research Institute (ATRI.) What began as the collection and analysis of Global Positioning System (GPS) signals or probes for a limited set of trucks on only a few highways has become a robust data source of probes collected from over 600,000 trucks all across the United States. This information has been used since its inception to form the FHWA Freight Performance Measurement program (FPM). Analysis of probes has been used to understand speeds and reliability on the Nation’s highways, to identify bottlenecks, and to support State- and regional-level analyses of truck movements with the goal of improving freight performance. FHWA has learned a great deal from evaluating the probes and is continuously finding new ways to develop the data and use it in innovative analytical methods. Use of these data has produced many successful analyses of freight movement, both in continuous monitoring and in incident analysis. The information revealed by the data has helped numerous decision-makers determine both operation and capital improvements for truck movements. FPM gathers information only on truck movements at this time. FHWA is working with other modal operating administrations to attempt to build probes for other modes and to evaluate freight movement from a multi-modal perspective.
While FHWA’s FPM probe data are available to FHWA, FHWA will provide access to the data to support innovative research conducted by States, Metropolitan Planning Organizations (MPOs), regional authorities, and academics. States and MPOs may also acquire the data directly for their own needs from the data provider. Additionally, it is important to note that these data provides unique identifiers only for the truck probe, latitude, longitude, speed, and heading. There is no information about the truck type, truck owner, fleet size, commodities, or other characteristics. FHWA is not aware of any data source that currently provides truck probes and commodity information at this time, and is working with public and private stakeholders to improve on the data to obtain more detail in the future that could support freight analysis. Analyses using the FHWA FPM probe data are publicly available on FHWA’s website. FHWA uses the probe data to routinely measure the following:
• Speed and reliability of the top 25 domestic freight corridors.• Freight Efficiency Index, which consists of the following components:
o Measures of known bottlenecks.o Metropolitan area speeds.o Intermodal and port locations.o Border crossings.
In addition to the routine measures, FHWA has supported a number of freight analyses with the probe data that are published on the FHWA website. Most of the resources are located athttp://ops.fhwa.dot.gov/Freight/freight_analysis/perform_meas/index.htm.
78
Freight Performance Measure Primer
NATIONAL PERFORMANCE MANAGEMENT RESEARCH DATA SET
Though FHWA does not provide external entities with access to this truck probe data, FHWA does make available a derivative of the data in the form of travel times to States and MPOs for free. The National Performance Management Research Data Set (NPMRDS), or vehicle probe data, is a historical archive of average travel times measured in five-minute increments. This data set covers the entire National Highway System (NHS) and is available on a monthly basis, with each month’s data usually available by the middle of the following month. NPMRDS data covers all 50 States, Washington, D.C., and Puerto Rico. It also covers crossings into both Canada and Mexico. The data set contains three distinct travel times: freight, passenger, and a combination of all traffic. NPMRDS data are divided into States and regions, making it easy for States to conduct corridor analyses.
There are a number of potential uses for the NPMRDS. States and MPOs are encouraged to use the NPMRDS data to produce system performance measures that cover operational and freight management strategies. NPMRDS can also be used to produce performance measures that will allow a more efficient highway system to improve the movement of freight. NPMRDS can be used to produce measures that will better inform States of where congestion is regularly occurring or how congestion occurs when there is an incident or work zone operation. This information helps them to identify where operational improvements or long-term investments can be made.
FHWA makes the NPMRDS available to State departments of transportation (DOTs), MPOs, and Federal agencies. States and MPOs are required to sign a licensing agreement with the NPMRDS data provider. More information on the NPMRDS, including webinars and reference documents, is located on FHWA’s website under the vehicle probe data section athttp://www.ops.fhwa.dot.gov/freight/freight_analysis/perform_meas/index.htm.
COMMODITY FLOW SURVEY
The Commodity Flow Survey (CFS) is the primary source of national and State-level data on domestic freight shipments by American establishments in mining, manufacturing, wholesale, auxiliaries, and selected retail and services trade industries. Data are provided on the types, origins and destinations, values, weights, modes of transport, distance shipped, and ton-miles of commodities shipped. The CFS is a shipper-based survey and is conducted every five-years as part of the economic census. It provides a modal picture of national freight flows and is the only publicly available source of commodity flow data for the highway mode. The CFS was conducted in 1993, 1997, 2002, 2007, and most recently in 2012.
FREIGHT ANALYSIS FRAMEWORK
The Freight Analysis Framework (FAF), produced through a partnership between the Bureau of Transportation Statistics (BTS) and FHWA, integrates data from a variety of sources to create a comprehensive picture of freight movement among States and major metropolitan areas by all modes of transportation. Starting with data from the 2012 CFS and international trade data from
79
Freight Performance Measure Primer
the Census Bureau, FAF incorporates data from agriculture, extraction, utility, construction, service, and other sectors. The FAF version 4 (FAF4) baseline edition provides estimates for tonnage and value by regions of origin and destination, commodity type, and mode for 2012, the most recent CFS year. Data are available through the Data Extraction Tool, for download as a complete database, as well as summary files. Throughout 2016, releases of additional FAF4 products have provided forecasts through 2045; State-to-State flows for 1997, 2002, and 2007; truck flows assigned to the highway network for 2012 and 2045; and domestic ton-miles and distance bands.
This compilation of data creates a comprehensive picture of freight flows, trends, and a baseline forecast to support analysis and performance for all modes of transportation among States and major metropolitan areas. FAF forecasts are a reasonable estimation of current trends; however, they do not reflect major shifts in the national economy, future capacity limitations, or changes in transportation costs or technology. FAF data would need to be supplemented with additional models to identify such trends.
FHWA has an online tabulation tool that is useful for States and MPOs who want to understand what freight, how much, and by what mode is occurring in their area. The tool is available at http://faf.ornl.gov/fafweb/Extraction0.aspx.
COMMODITY FLOW SURVEY MICRODATA
The first generation 2012 Commodity Flow Survey (CFS) Public Use Microdata (PUM) file is now available. This new, experimental data product contains information for approximately 4.5 million shipments obtained from businesses included in the 2012 CFS. The PUM file provides access to shipment-level characteristics while continuing to protect the confidentiality of individual business information. PUM file users can create customized tables and build models to track and analyze the movement of commodities. (http://www.rita.dot.gov/bts/sites/rita.dot.gov.bts/files/publications/commodity_flow_survey/index.html)
HIGHWAY PERFORMANCE MONITORING SYSTEM (HPMS)
The Highway Performance Monitoring System (HPMS) is a national level highway information system provided to FHWA by State DOTs. The HPMS data are used extensively in the analysis of highway system conditions, performance, and investment needs that make up the biennial Condition and Performance Reports to Congress. The HPMS contains administrative and system information on all public roads. Extensive data are available for interstates and principal arterials, while a mix of sample data is reported for minor arterial and collector functional systems. Limited information on travel and paved miles is included in summary form for the local functional systems.
The HPMS was developed in 1978 as a continuing database and has been modified several times since its inception. The system has been altered to reflect changes in the highway systems, legislation, national priorities, and new technology, and to consolidate or streamline reporting requirements.
80
Freight Performance Measure Primer
For freight, States and MPOs often use HPMS data to derive Annual Average Daily Truck Traffic (AADTT) counts, Percent Peak Combination Trucks, or other truck count information for roads included in the HPMS data. FAF uses HPMS in its network assignments for freight flows. (https://www.fhwa.dot.gov/policyinformation/hpms.cfm)
HIGHWAY STATISTICS
FHWA’s Highway Statistics Series consists of annual reports containing analyzed statistical information on motor fuel, motor vehicle registrations, driver licenses, highway user taxation, highway mileage, travel, and highway finance. This information is presented in tables and charts and has been published annually since 1945. Most highway data are submitted by the States directly to FHWA. Each State’s data are analyzed for completeness, reasonableness, consistency, and compliance with data reporting instructions contained in “A Guide to Reporting Highway Statistics.” While the FHWA Office of Highway Policy Information is responsible for preparing this publication, a number of the statistical summaries are prepared by other units within the FHWA. More information is available athttp://www.fhwa.dot.gov/policyinformation/statistics.cfm.
MARITIME DATA
The U.S. Maritime Administration (MARAD) provides a number of data resources through the MARAD Open Data Portal and link to Maritime Data and Statistics. Below is a list of the available resources.
Reports
• 2013 Vessel Calls in U.S. Ports and Terminals (Uploaded 6/17/2015).• 2012 Vessel Calls in U.S. Ports, Terminals and Lightering Areas Report (Released
10/8/2014).• 2002–2012 Vessel Calls in U.S. Ports, Terminals, and Lightering Areas Report (Released
10/8/2014).• 2011 Coastal Tank Vessel Market Snapshot.• 2011 U.S. Water Transportation Statistical Snapshot.• 2011 Vessel Calls at U.S. Ports Snapshot.• Guide Market Research for Marine Transportation Services.
Fleet Statistics
• U.S.-Flag Privately Owned Fleet (As of 4/1/2016).• U.S.-Flag Integrated and Articulated Tug-Barge Units.• Merchant Fleets of the World Report for 2015 (As of January 2015).• Top 25 Flags of Registry.• 2000–2014 U.S.-Flag Privately Owned Fleet Summary.• 1946–2014 U.S.-Flag Privately Owned Fleet.

81
Freight Performance Measure Primer
MARAD U.S.-Flag Fleet Lists
• Listing of U.S.-Flag Carriers.• Maritime Security Program List.• Agricultural Preference Trade Fleet List.
Historic Fleet Reports and Fleet Lists
MARAD has electronically imaged some historic Vessel Inventory Reports on the U.S.-Flag Fleet. The Vessel Inventory Reports from July 1990 to January 2016 are available for research purposes.
Trade Statistics
• U.S. Waterborne Foreign Trade by U.S. Customs Ports 2000–2015.• U.S. Waterborne Foreign Trade by U.S. Customs Ports 1997–1999.• U.S. Waterborne Foreign Trade by U.S. Custom Districts.• U.S. Waterborne Foreign Trade by Trading Partners.• U.S. Waterborne Foreign Container Trade by U.S. Customs Ports 1997–2014 Report.• U.S. Waterborne Foreign Container Trade by Trading Partners.
Historical Trade Statistics
• Containerized Cargo on Selected Trade Routes CY 1970.• Containerized Cargo Statistics CY 1971 (unavailable).• Containerized Cargo Statistics CY 1972–1983.
OPA-90 Related Statistics
• Coastal Tank Vessel Market Snapshot.• Tanker Calls at U.S. Ports.• U.S.-Flag Oil Pollution Act of 1990 (OPA-90) Phase-Out.• U.S.-Flag Tank Vessels Removed.• U.S. Tank Vessel Trades.
Survey Series
• Mainstream Container Services.• Coastal Tank Barges.• Deck Barges.• Inland Tank Barges.
MARINE TRANSPORTATION SYSTEM DATA INVENTORY
• Marine Transportation System (MTS) Data Portal. (http://www.marad.dot.gov/resources/data-statistics/)

82
Freight Performance Measure Primer
U.S. ARMY CORPS OF ENGINEERS NAVIGATION DATA CENTER
The U.S. Waterway Data is a collection related to the navigable waters in the United States, including inland waterways, off-shore waters, the Great Lakes, and the Saint Lawrence Seaway. Data on commerce, facilities, locks, dredging, imports and exports, and accidents are included, along with the geographic waterway network. The data were compiled by several agencies, including the U.S. Army Corps of Engineers Navigation Data Center, the U.S. Bureau of the Census, the U.S. Coast Guard, Oak Ridge National Laboratory, and Vanderbilt University. One of the objectives of this coordinated effort is to make waterway data more widely available and easily accessible. The data included are in standard file formats that can be easily imported into other software tools such as spreadsheets, databases, and Geographic Information Systems (GIS).
The Navigation Data Center had several objectives in developing the U.S. Waterway Data. These objectives support the concept of a National Spatial Data Infrastructure and will include:
• Providing public access to national waterway data.• Fostering interagency and intra-agency cooperation through data sharing.• Providing a mechanism to integrate waterway data (U.S. Army Corps of Engineers Port/
Facility and U.S. Coast Guard Accident Data, for example).• Establishing a basis for intermodal analysis.• Assisting standardization of waterway entity definitions (ports/facilities, locks).• Supplying public access to the National Waterway Network, which can be used as a base
map to support graphical overlays and analysis with other spatial data (waterway and modal network/facility databases, for example).
• Making available reliable data to support future waterway and intermodal applications (http://www.navigationdatacenter.us/data/data1.htm)
PIPELINE DATA
Oil Pipeline Statistics
The U.S. Energy Information Administration (EIA) publishes statistics on crude oil, gasoline, diesel, propane, jet fuel, ethanol, and other liquid fuels. Information collected includes petroleum prices, crude reserves and production, refining and processing, imports/exports, stocks, and consumption/sales. (http://www.eia.gov/dnav/pet/pet_move_pipe_dc_R20-R10_mbbl_m.htm)
Pipeline Safety Statistics
The Pipeline and Hazardous Materials Safety Administration’s (PHMSA’s) Office of Pipeline Safety provides a variety of data about federally regulated and State-regulated natural gas pipelines, hazardous liquid pipelines, and liquefied natural gas plants. The operators of these pipeline facilities report this data in accordance with Part 191 and Part 195 of PHMSA’s pipeline safety regulations. PHMSA provides downloads of the raw data, yearly summaries, multi-year trends of safety performance metrics, and inventories tracking the removal of aging and other higher-risk infrastructures. (http://www.phmsa.dot.gov/pipeline/library/data-stats)
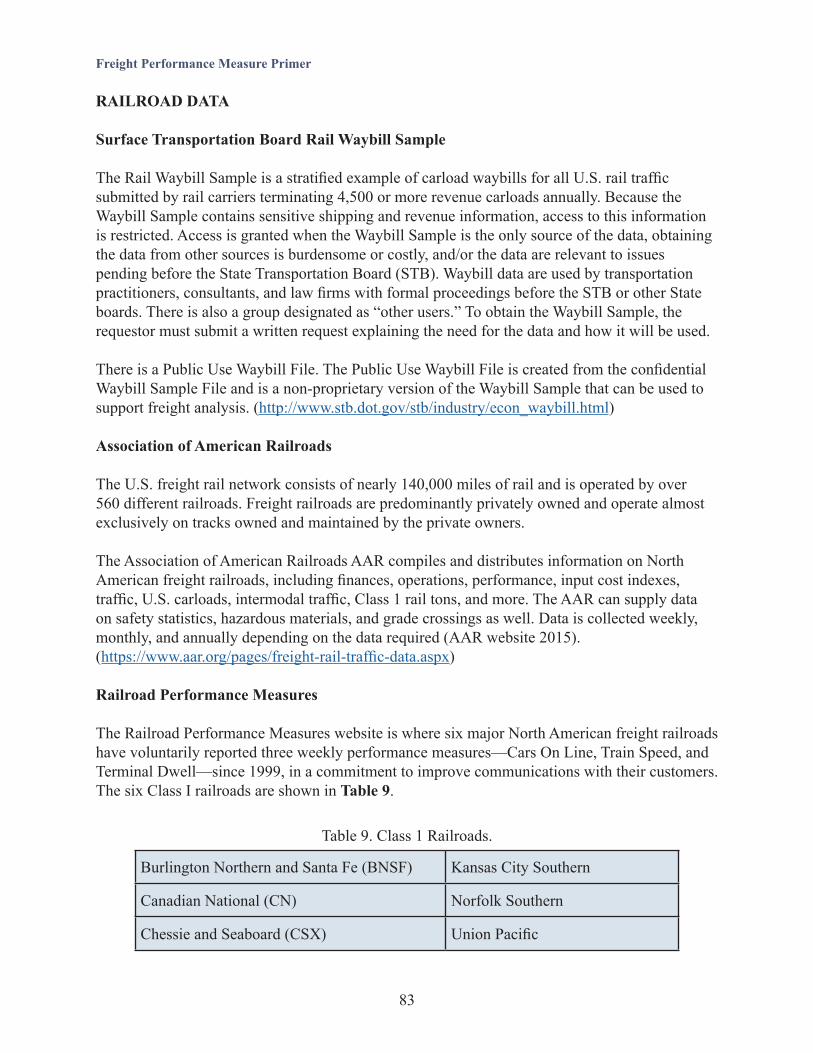
83
Freight Performance Measure Primer
RAILROAD DATA
Surface Transportation Board Rail Waybill Sample
The Rail Waybill Sample is a stratified example of carload waybills for all U.S. rail traffic submitted by rail carriers terminating 4,500 or more revenue carloads annually. Because the Waybill Sample contains sensitive shipping and revenue information, access to this information is restricted. Access is granted when the Waybill Sample is the only source of the data, obtaining the data from other sources is burdensome or costly, and/or the data are relevant to issues pending before the State Transportation Board (STB). Waybill data are used by transportation practitioners, consultants, and law firms with formal proceedings before the STB or other State boards. There is also a group designated as “other users.” To obtain the Waybill Sample, the requestor must submit a written request explaining the need for the data and how it will be used.
There is a Public Use Waybill File. The Public Use Waybill File is created from the confidential Waybill Sample File and is a non-proprietary version of the Waybill Sample that can be used to support freight analysis. (http://www.stb.dot.gov/stb/industry/econ_waybill.html)
Association of American Railroads
The U.S. freight rail network consists of nearly 140,000 miles of rail and is operated by over 560 different railroads. Freight railroads are predominantly privately owned and operate almost exclusively on tracks owned and maintained by the private owners.
The Association of American Railroads AAR compiles and distributes information on North American freight railroads, including finances, operations, performance, input cost indexes, traffic, U.S. carloads, intermodal traffic, Class 1 rail tons, and more. The AAR can supply data on safety statistics, hazardous materials, and grade crossings as well. Data is collected weekly, monthly, and annually depending on the data required (AAR website 2015). (https://www.aar.org/pages/freight-rail-traffic-data.aspx)
Railroad Performance Measures
The Railroad Performance Measures website is where six major North American freight railroads have voluntarily reported three weekly performance measures—Cars On Line, Train Speed, and Terminal Dwell—since 1999, in a commitment to improve communications with their customers. The six Class I railroads are shown in Table 9.
Burlington Northern and Santa Fe (BNSF) Kansas City Southern
Canadian National (CN) Norfolk Southern
Chessie and Seaboard (CSX) Union Pacific
Table 9. Class 1 Railroads.

84
Freight Performance Measure Primer
All six railroads use the same definitions to calculate their performance data; however, because the level of one railroad’s performance relative to another’s may differ sharply because each railroad is unique, these measures are most useful for examining trends and relative changes, and least useful as absolutes. Differences between railroads include terrain, physical routes and network design, traffic mix and volume, the extent of passenger operations, and operational practices. External factors such as weather and port operations can also cause variations between railroads over time. In addition, individual differences in the collection and reporting of operational data may affect the absolute level of the measures to some degree. (http://www.railroadpm.org/)
AVIATION DATA
Air Cargo Summary Data
This monthly freight summary includes both freight and mail carried by U.S. airlines in all service classes (scheduled and non-scheduled). Data in this report goes back to October 2002, when a change in reporting requirements increased the number of reporting carriers and collection of monthly all-cargo service data started. (http://www.transtats.bts.gov/freight.asp)
Landing Weights
The Bureau of Transportation Statistics provides information on landing weights for cargo-bearing airports throughout the United States. Data is available through the BTS Summary data. (http://www.rita.dot.gov/bts/sites/rita.dot.gov.bts/files/publications/state_transportation_statistics/summary/index.html)
BORDER CROSSING DATA
Transborder Freight Data
The North American Transborder Freight Database, available since April 1993, contains freight flow data by commodity type and by mode of transportation (rail, truck, pipeline, air, vessel, and other) for U.S. exports to, and imports from, Canada and Mexico. The database includes two sets of tables; one is commodity-based while the other provides geographic detail. The purpose of the database is to provide transportation information on North American trade flows. This type of information is being used to monitor freight flows and changes to these since the signing of the North American Free Trade Agreement (NAFTA) by the United States, Canada, and Mexico in December 1992, and its entry into force on January 1, 1994. The database is also being used for trade corridor studies, transportation infrastructure planning, marketing and logistics plans, and other purposes. It allows users to analyze movement of merchandise by all land modes, waterborne vessels, and by air carriers. (http://transborder.bts.gov/programs/international/transborder/)

85
Freight Performance Measure Primer
Freight Performance Measurement Border Data
As previously mentioned, the Freight Performance Measurement (FPM) program collects information on select border crossings for North America using truck probes. The probe data, collected by FPM and the NPMRDS, can be used to analyze truck movements and travel times, respectively, for border crossings. The NPMRDS extends into the five-mile radius of arterials in Canada and Mexico.
Travel Time Index Border Data
The Texas A&M Transportation Institute maintains the Border Crossing Information System, which computes average travel times of U.S.-bound commercial vehicles for the selected segment over the selected time period, calculated at 10-minute intervals. (http://bcis.tamu.edu/Commercial/en-US/queryArchivedData.aspx)
GENERAL AND ECONOMIC FREIGHT DATA RESOURCES
The following freight data resource links are provided as additional resources that can be consulted for freight data and analysis. While most analysts use the above data sources for freight performance measures and the Commodity Flow Survey or FAF for economic information, the following could supplement analysis, depending on the objective. Although not detailed in this primer, the interested reader may wish to consult these sources:
• Agricultural Trade (www.fas.usda.gov/data).• Fedstats: Gateways to Federal Statistics and Statistical Agencies
(http://fedstats.sites.usa.gov/).• National Transportation Statistics
(http://www.rita.dot.gov/bts/sites/rita.dot.gov.bts/files/publications/national_transportation_statistics/index.html).
• Statistical Abstract of the United States (http://www.census.gov/library/publications/2011/compendia/statab/131ed.html).
• Transportation Energy Data Book (http://cta.ornl.gov/data/index.shtml).• U.S. International Trade (http://www.rita.dot.gov/bts/sites/rita.dot.gov.bts/files/
publications/us_international_trade_and_freight_transportation_trends/2003/index.html).
Economics:
• County Business Patterns (http://www.census.gov/programs-surveys/cbp.html).• Employment Statistics (http://www.bls.gov/bls/employment.htm).• Industry Economic Accounts (http://www.bea.gov/Industry/Index.htm).• Pay and Benefits (http://www.bls.gov/bls/wages.htm).• Producer Price Index (http://www.bls.gov/pPI/).• Productivity Statistics (http://www.bls.gov/bls/productivity.htm).• Regional Economic Accounts (http://www.bea.gov/regional/index.htm).

86
Freight Performance Measure Primer
• Surface Transportation Board Economic Data (http://www.stb.dot.gov/stb/industry/econ_reports.html).
• Transportation Satellite Account (http://www.rita.dot.gov/bts/sites/rita.dot.gov.bts/files/publications/transportation_satellite_accounts/index.html).
• U.S. Department of Commerce Data Hub (https://data.commerce.gov/).
Classification Systems Used for Freight Data:
• Harmonized System (https://usatrade.census.gov/).• North American Industrial Classification System
(http://www.census.gov/eos/www/naics/).• North American Product Classification System
(http://www.census.gov/eos/www/napcs/index.html).• Standard Occupational Classification System (http://www.bls.gov/soc/).

87
Freight Performance Measure Primer
APPENDIX D. ADDITIONAL AVAILABLE HIGHWAY DATA
MOTOR CARRIER FINANCIAL AND OPERATING STATISTICS
The collection of for-hire trucking company financial and operating statistics (F&OS) data is mandatory (Code of Federal Regulations Title 49 Part 369). The collection is managed by the Federal Motor Carrier Safety Administration (FMCSA) Motor Carrier F&OS Program. F&OS data can be downloaded by row (trucking company), groups of rows (e.g., segment of the industry), or as a whole, with each column of data representing F&OS characteristics of the trucking companies taken from the line items and schedules on the 1999 Form M or Form QFR (annual reports, depending on revenue). Consult the FMCSA website for more information and copies of Form M and Form QFR. (http://www.transtats.bts.gov/DatabaseInfo.asp?DB_ID=170&Link=0)
VEHICLE INVENTORY AND USE SURVEY
The Vehicle Inventory and Use Survey (VIUS) provides data on the physical and operational characteristics of the Nation’s private and commercial truck population. Its primary goal is to produce national and State-level estimates of the total number of trucks. This survey was conducted every five-years, until 2002, as part of the economic census. (http://www.census.gov/svsd/www/vius/products.html)
MOTOR FUEL TAX DATA
Receipts into the Federal Highway Trust Fund come from a variety of taxes on highway fuel, tires, heavy vehicle use tax, and truck/trailer sales taxes. The motor fuel excise tax, currently 18.4 cents per gallon for gasoline/gasohol and 24.4 cents for special fuel (primarily diesel), raises the majority of the revenue. This revenue is then placed into the Highway Trust Fund by the U.S. Treasury Department, after collection by the Internal Revenue Service. These funds are then distributed to the States based on formulas provided in Federal legislation.
On a monthly basis, each State is required to report to the Federal Highway Administration (FHWA) the number of gallons taxed by that State. These data are analyzed and compiled by FHWA staff. The data on the amount of on-highway fuel use for each State is then used to attribute Federal revenue to each State. Every year, the FHWA Office of Policy provides data from the previous year for use in the attribution process. The previous year’s data are provided to States to review, allowing them to verify that the data report is correct and ready to be used in attribution. (https://www.fhwa.dot.gov/policyinformation/motorfueldata.cfm)
HIGHWAY FINANCE DATA COLLECTION
The FHWA’s comprehensive highway finance information collection effort involves extensive input on Federal, State, and local government financing of highways. The U.S. Congress recognized the need for highway finance information to support highway policy development, and as early as 1904, the Federal Government began inquiring about highway taxation, sources
88
Freight Performance Measure Primer
of revenue for highways, and highway expenditures. The role of the Federal Government in highway transportation has changed greatly, but its role in assembling highway finance and related data has continued. As highway agencies and highway programs change and evolve, FHWA continues to revise and enhance its data collection program.
Highway finance information is used by FHWA in its analysis to support the Federal-Aid Highway Program’s reauthorization. It is also used in the development of the proposed legislation and reports to Congress; evaluating the extent, performance, condition, and use of the Nation’s transportation systems; analyzing existing and proposed Federal-aid funding methods and levels; assigning user-cost responsibility; and evaluating Federal, State, and local highway programs. (https://www.fhwa.dot.gov/policyinformation/hwyfinancedata.cfm)
NATIONAL HOUSEHOLD TRAVEL SURVEY
The National Household Travel Survey (NHTS) is a periodic national survey, to assist transportation planners and policy makers who need comprehensive data on travel and transportation patterns in the United States. The 2009 survey is the latest collected by FHWA, in coordination with a private firm who conducted the survey around the country.
Previous surveys included the 2001 NHTS, and the former Nationwide Personal Transportation Surveys (NPTS) of 1969, 1977, 1983, 1990, and 1995.
The NHTS/NPTS serves as the Nation’s inventory of daily travel. Data is collected on daily trips taken by households and individuals in those households over a 24-hour period, and includes:
• Purpose of the trip (work, shopping, social).• Means of transportation (car, walk, bus, subway).• Travel time of trip.• Time of day/day of week.
These data are collected for all trips, modes, purposes, trip lengths, and all areas of the country, urban and rural.
Uses of Surveys:
• Quantify travel behavior.• Analyze changes in travel characteristics over time.• Related travel behavior to the demographics of the travel.• Study the relationship of demographics and travel over time.
(http://nhts.ornl.gov/introduction.shtml)
HIGHWAY SAFETY DATA
Highway fatality data can be extracted from the Fatality Analysis Reporting System (FARS), which is compiled by the U.S. Department of Transportation (USDOT), National Highway

89
Freight Performance Measure Primer
Traffic Safety Administration (NHTSA). Data are gathered from a census of police accident reports (PARs), State vehicle registration files, State drivers licensing files, State highway department data, vital statistics, death certificates, coroner/medical examiner reports, hospital medical reports, and emergency medical service reports. A separate form is completed for each fatal crash. Blood alcohol concentration (BAC) is estimated when not known. Statistical procedures used for unknown data in FARS can be found in the NHTSA report A Method for Estimating Posterior BAC Distributions for Persons Involved in Fatal Traffic Accidents, DOT HS 807 094 (Washington, D.C.: July 1986).
Data are collected from relevant State agencies and electronically submitted for inclusion in the FARS database on a continuous basis. Cross-verification of PARs with death certificates helps prevent undercounting. Moreover, when data are entered, they are checked automatically for acceptable range values and consistency, enabling quick corrections when necessary. Several programs continually monitor the data for completeness and accuracy. Periodically, sample cases are analyzed for accuracy and consistency. FARS data do not include motor vehicle fatalities on nonpublic roads, which account for about two percent or fewer of the total motor vehicle fatalities per year.
NHTSA’s General Estimates System (GES) data is a nationally representative sample of police-reported crashes that contributed to an injury or fatality or resulted in property damage, and involved at least one motor vehicle traveling on a roadway. GES data collectors randomly sample PARs and forward copies to a central contractor for coding into a standard GES system format. Documents such as police diagrams or supporting text provided by the officers might be further reviewed to complete a data entry (http://www.nhtsa.gov/NCSA).
NATIONAL BRIDGE DATA
The National Bridge Inventory contains detailed technical and engineering information about hundreds of thousands of bridges in the United States, including year built, bridge design, condition, and many other fields. Nationalbridges.com is the website that makes this information available to the public. The National Bridge Inventory is a compilation of data supplied to FHWA from States for bridges located on public roads. Significant freight-related data such as Average Daily Truck Traffic, if the bridge is on a Strategic Highway Network route, clearance heights, and design loads are also available from the National Bridge Inventory. (https://www.fhwa.dot.gov/bridge/britab.cfm)
PAVEMENT DATA
FHWA maintains highway pavement condition data. The Long-Term Pavement Performance (LTPP) program was established to collect pavement performance data as one of the major research areas of the Strategic Highway Research Program (SHRP). The first five-years of the LTPP program were funded and directed by the SHRP. Since 1991, FHWA has continued the management and funding of the program. The LTPP program is managed by the Long-Term Pavement Performance Team under the Office of Infrastructure Research and Development.

90
Freight Performance Measure Primer
The LTPP program is a large research project that includes two fundamental classes of studies and several smaller studies to investigate specific pavement-related details that are critical to pavement performance. The fundamental classes of study are the General Pavement Study (GPS) and the Specific Pavement Studies (SPS). The combined GPS and SPS programs consist of over 2,500 test sections located on in-service highways throughout North America. The LTPP program will monitor and collect pavement performance data on all active sites. The collected data include information on seven modules: Inventory, Maintenance, Monitoring (Deflection, Distress, and Profile), Rehabilitation, Materials Testing, Traffic, and Climatic.
The LTPP Information Management System was established in 1988 and is the central database where all data collected under the LTPP program are stored. This database is continuously being developed as more data are collected and processed. Four regional offices are established under the LTPP program to coordinate and communicate LTPP-related activities throughout the United States and Canada. (http://www.fhwa.dot.gov/research/tfhrc/programs/infrastructure/pavements/ltpp/)

91
Freight Performance Measure Primer
APPENDIX E. TERMS AND DEFINITIONS
American Transportation Research Institute (ATRI) – Not-for-profit research organization that is a part of the American Trucking Associations Federation aimed at conducting transportation research with an emphasis on the trucking industry’s essential role in a safe, efficient, and viable transportation system.
Automobile – a travel mode that includes all motor vehicle traffic using a roadway except transit buses (includes such vehicles as trucks, recreational vehicles, motorcycles, and tour buses).
Average Annual Daily Truck Traffic (AADTT) – The total volume of truck traffic on a highway segment for one year, divided by the number of days in the year.
Bottleneck – A section of a highway network that experiences operational problems such as oversaturated congestion. Bottlenecks may result from factors such as reduced roadway width or steep freeway grades that can slow trucks.
Capacity – The maximum number of vehicles that can reasonably be expected to traverse a point or a uniform section of roadway during a given time period under prevailing conditions.
Commodity – An item that is traded in commerce. The term usually implies an undifferentiated product competing primarily on price and availability.
Container – A large, standard sized metal box into which cargo is packed for shipment.
Corridor – (1) A set of essentially interrelated, parallel transportation facilities for moving people and goods between two points; (2) a geographic area used for the movement of people and goods.
Delay – Additional travel time beyond some norm experienced by a traveler.
Demand – The number of persons or vehicles desiring to use a mode or facility.
Facility – A length of roadway composed of points and segments.
Fixing America’s Surface Transportation (FAST) Act – Fixing America’s Surface Transportation Act signed into law on December 4, 2015. The FAST Act is a five-year Federal authorization for Federal fiscal years 2016 through 2020 and authorizes $305 billion for freight projects.
Fluidity – Tracking a commodity across multiple modes or regions; measuring end-to-end travel times of key commodities.
Freight – Any commodity being transported.
92
Freight Performance Measure Primer
Freight Analysis Framework (FAF) – Integrates data from a variety of sources to create a comprehensive picture of freight movement among States and major metropolitan areas by all modes of transportation.
Freight Coalition – A regional organization that cooperates in the planning, operation, preservation, and improvement of freight transportation infrastructure and networks.
Freight Performance Measures – Freight-specific performance measures help to identify needed transportation improvements and monitor their effectiveness. They also serve as indicators of economic health and traffic congestion.
Governing data – More freight data are available each year. Recently, truck Global Positioning System (GPS) data have become available to planners. While the additional data create opportunities, they also create new challenges to managing and processing them. Additionally, the private sector controls a lot of valuable data. Establishing relationships and contractual arrangements for sharing these data are also obstacles.
Heavy congestion – A situation in which traffic demand is sufficient to cause the level of service to be below a specified Level of Service standard.
Heavy vehicle – A vehicle with more than four wheels touching the pavement during normal operation.
Highway – A general term for denoting a public way for purposes of vehicular, bicycle, and pedestrian travel, including the right-of-way.
Highway modes – Automobile, bicycle, bus, pedestrian.
Indicator – A mobility performance measure which primarily shows a trend over time and is not used to achieve a goal or objective nor is it used in a decision-making process.
Intermodal – Related to the connection between two or more modes of transportation.
Level of Service (LOS) – A qualitative assessment of a road’s operating conditions. For local government comprehensive planning purposes, LOS is an indicator of the extent or degree of service provided by, or proposed to be provided by, a facility based on the operational characteristics of the facility. LOS indicates the capacity per unit of demand for each public facility.
Logistics – All activities involved in the management of product movement; delivering the right product from the right origin to the right destination, with the right quality and quantity, at the right schedule and price.
Merging data – It is often necessary to combine data from different sources. This can be difficult because different agencies or local governments may use different definitions, data may
93
Freight Performance Measure Primer
have been collected at different times of the year, and the technology for collection may differ. For example, the different technology used to count vehicles may use different classification schemes for trucks.
Metropolitan Planning Organization (MPO) – A federally funded and mandated organization, composed of representatives from local government and transportation authorities, charged with establishing transportation policy and decision-making for a metropolitan area.
Mobility – The movement of people and goods.
Mobility performance measure – (1) A metric that quantitatively tells us something about mobility; (2) a mobility metric directly tied to achieving a goal or objective or used in a decision-making process.
Mode – A means of moving people or goods.
Motor carrier – A firm engaged in providing commercial motor freight or long-distance trucking.
Moving Ahead for Progress in the 21st Century (MAP-21) Act – Moving Ahead for Progress in the 21st Century Act is the federally authorized surface transportation act signed into law on July 6, 2012. MAP-21 created a streamlined, performance-based, and multi-modal program to meet the many challenges facing the U.S. transportation system.
Multi-modal – More than one travel mode potentially including the four highway modes (auto, bicycle, bus, pedestrian), aviation, rail, seaports, and transit.
Non-recurring events – As it pertains to traffic, a delay caused by an unforeseen event; usually a traffic incident, the weather, a vehicle breakdown, a work zone, or other atypical event. Even if planned in many cases, like work zones and special events, they are irregular and not predictable in location and duration.
Passengers (aviation, rail, seaport) – People in a vehicle making use of a mode.
Performance measure – A metric composed of a number and a unit of measure.
Quality of freight-related data - The National Cooperative Freight Research Program’s 2011 report on performance measures included this statement: “A primary finding is that freight performance measurement is challenged both by an abundance of data and by a lack of complete data for many important freight system performance functions.” While the amount of available data continues to grow, significant gaps remain, such as sufficient origin/destination data, estimates of value of cargo shipped, and network coverage. The quality of data is also affected by its age and how well it has been maintained. Data are ideally collected in a consistent manner year after year.
94
Freight Performance Measure Primer
Quantity of freight-related data – While there continues to be gaps in the available freight data, the quantity of data is growing. GPS data provided through a partnership of the Federal Highway Administration (FHWA) and ATRI create several new possibilities, particularly with regard to truck travel speed and reliability, but they also create new challenges for management and processing.
Recurring event – As it pertains to traffic, a recurring event is a traffic condition (i.e., a bottleneck or backup) that occurs in the same location and at the same time daily, albeit for weekday or weekend conditions. Examples would be peak hour slowdowns at junction points, intersections, and ramps. Drivers can plan for these events because they know by routine that such events will occur time and again in the same manner and place.
Reliability – The degree of certainty and predictability in travel times on the transportation system. Reliable transportation systems offer some assurance of attaining a given destination within a reasonable range of an expected time. An unreliable transportation system is subject to unexpected delays, increasing costs for system users.
Stakeholders – Public-sector agencies, community groups, and private-sector businesses that have a direct role in, or are affected by, transportation and land use planning and decision-making processes.
Supply Chain – Starts with unprocessed raw materials and ends with the final customer using the finished goods.
Sustainability – An objective calling for policies and strategies that meet society’s present needs without compromising the ability of future generations to meet their own needs.
System – A combination of facilities or services forming a network or being selected for analysis.
Throughput – The maximum number of people or vehicles that can reasonably be expected to traverse a point or a uniform transportation facility section during a given time period under prevailing conditions.
Transit – A travel mode in which vehicles (including buses, streetcars, and street-running light rail) stop at regular intervals along the roadway to pick up and drop off passengers.
Travel time – The total time spent getting from one point to another.
Travel time reliability – The consistency or dependability in travel times, as measured from day-to-day and/or across different times of the day.
Truck – A heavy vehicle engaged primarily in the transport of goods and materials.
Truck probe data – Data collected by commercial GPS fleet management devices mounted on

95
Freight Performance Measure Primer
trucks. These data are processed in a Geographic Information System (GIS) and assigned to a roadway network to provide performance measures for individual segments.
Twenty-Foot Equivalent Unit (TEU) – The eight-foot by eight-foot by 20-foot intermodal container used as a basic measure used for container cargo.
Vehicle – A motorized mode of transportation.
Vehicle miles traveled (auto) – The total number of miles traveled by vehicles using a highway system.
Volume to capacity ratio – The ratio of demand to capacity.


97
Freight Performance Measure Primer
APPENDIX F. TRUCK PARKING METRICS
Table 10. Tier I truck parking metrics.
Table 11. Tier II truck parking metrics.
Category Metric Data Resources Readiness ScaleDemand Truck Travel on NHS HPMS, FAF Current Corridor
Supply
Number of Spaces, Public and Private
State inventories of public spaces and use of private truck stop resource for private data
Current; requires State data input and purchase of private data
Corridorand Facility
Number of Spaces in Relation to NHS Mileage
HPMS mileage for the NHS Current Corridor
Number of Spaces in Relation to VMT HPMS VMT Current Corridor
Number of Spaces in Relation to GDP by State
Bureau of Economic Analysis GDP Data
Current Corridor
Category Metric Data Resources Readiness Scale
Demand, Driver Demographics and Needs
Utilization for Public and Private Facilities (hourly, weekly and monthly)
State DOT inventories and surveys; truck stop owner and operators
Data Collection Required Facility
Parking Needs by Driver Type Driver Surveys Anecdotal Facility
Parking Needs by Industry Represented Driver Surveys Anecdotal Facility
Demand, Economic
Origin and Destination Information
FAF/CFS/Use of Vehicle Probe Data
Current for FAF and CFS, use of FPM requires additional analysis
Corridor and Facility
Demand, Safety Inventory of Problem Locations
Interviews with State motor carrier safety staff
CurrentCorridor and Facility
FAF = Freight Analysis Framework • GDP = Gross Domestic Product • HPMS = Highway Performance Monitoring System • NHS = National Highway System • VMT = vehicle miles traveled
CFS = Commodity Flow Survey • DOT = Department of Transportation • FAF = Freight Analysis FrameworkFPM = Freight Performance Measures

98
Freight Performance Measure Primer
Table 11. Tier II truck parking metrics (continuation).
Table 12. Tier III truck parking metrics.
Category Metric Data Resources Readiness ScaleEconomic Valuation, Demand, Supply, Development
Proximity to Industry and Highway Facilities
GIS shape files for parking locations; industrial locations; travel time data
Current and Data Collection Required
Corridor and Facility
Safety
Hours of Service Violations
State DOT and Police Records Current
Corridor and Facility
Fatigue-Related Crashes
State DOT and Police Records Current Corridor
Supply
Amenities at Parking Facilities
State DOT and Truck Stop Owners and Operators Survey Data
Current and Data Collection Required Facility
Inventory of Driver Perceived Shortages, Parking Challenges
Driver Surveys AnecdotalCorridor and Facility
Category Metric Data Resources Readiness Scale
Demand
Impact of Congestion on Travel Time and Resulting Driving Distance, Need for Parking
Corridor and congestion studies; traffic monitoring sites
Current and Data Collection Required; Metric Approach Needed
Corridor and Facility
Driver Demographics and Needs, Demand
Average Haul Length/ Multi-Day versus Single-Day
Freight data summaries prepared by professional organizations
AnecdotalCorridor and Facility
Use of Technology to Determine Parking Availability
Survey of truck stop operators Anecdotal
Corridor and Facility
CFS = Commodity Flow Survey • DOT = Department of Transportation • FAF = Freight Analysis FrameworkGIS = Geographic Information System • FPM = Freight Performance Measures
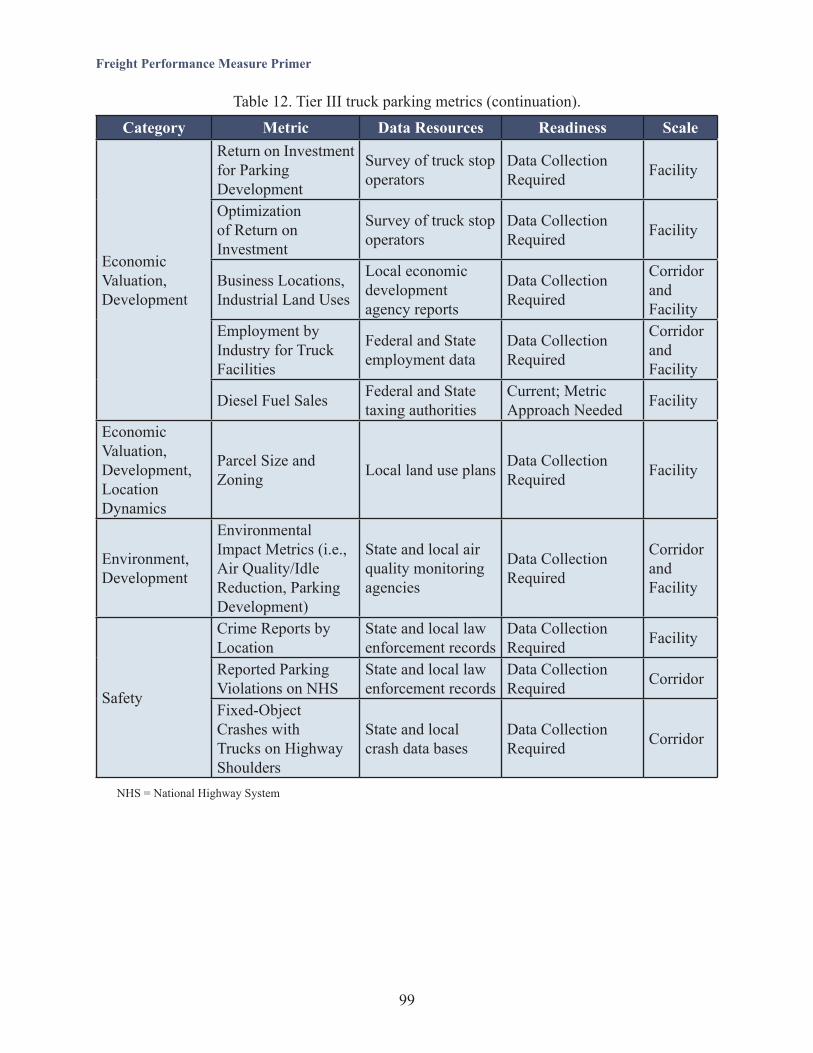
99
Freight Performance Measure Primer
NHS = National Highway System
Table 12. Tier III truck parking metrics (continuation).
Category Metric Data Resources Readiness Scale
Economic Valuation, Development
Return on Investment for Parking Development
Survey of truck stop operators
Data Collection Required Facility
Optimization of Return on Investment
Survey of truck stop operators
Data Collection Required Facility
Business Locations, Industrial Land Uses
Local economic development agency reports
Data Collection Required
Corridor and Facility
Employment by Industry for Truck Facilities
Federal and State employment data
Data Collection Required
Corridor and Facility
Diesel Fuel Sales Federal and State taxing authorities
Current; Metric Approach Needed Facility
Economic Valuation, Development, Location Dynamics
Parcel Size and Zoning Local land use plans Data Collection
Required Facility
Environment, Development
Environmental Impact Metrics (i.e., Air Quality/Idle Reduction, Parking Development)
State and local air quality monitoring agencies
Data Collection Required
Corridor and Facility
Safety
Crime Reports by Location
State and local law enforcement records
Data Collection Required Facility
Reported Parking Violations on NHS
State and local law enforcement records
Data Collection Required Corridor
Fixed-Object Crashes with Trucks on Highway Shoulders
State and local crash data bases
Data Collection Required Corridor


101
Freight Performance Measure Primer
APPENDIX G. INNOVATIVE RESEARCH: USING FUEL TAXES TO TRACK TRUCK MOVEMENT
INTRODUCTION
The Moving Ahead for Progress in the 21st Century (MAP-21) legislation and the subsequent Fixing America’s Surface Transportation (FAST) Act legislation require the U.S. Department of Transportation (USDOT) to develop new tools and/or improve existing tools to support an outcome-oriented, performance-based approach to evaluating proposed freight-related and non-freight-related transportation projects. These tools must include developing methodologies for analyzing benefits and costs of transportation projects and ensure that projects consider safety, economic competitiveness, environmental sustainability, and system condition.
ISSUE
USDOT utilizes a variety of resources to collect freight related data including Freight Analysis Framework (FAF), Commodity Flow Surveys (CFS), and vehicle probe data. But this data does not show the complete picture of how freight moves within the United States. Many data gaps still exist, such as the lack of local commodity flow data, origin/destination data, zip code data, trip frequency data, routing information, and better accident or crash data that will require additional multi-modal research and development.
POTENTIAL SOLUTIONS
The method of using fuel tax documentation to approximate truck movement across the United States is based on the concept that truck movements can be observed as a series of trips with each trip beginning at a fuel station. Each truck travels a limited distance until it runs out of fuel. Its next trip begins after refueling. This method collects the known location information of the origins of all truck trips: the addresses of the fueling stations that are reported on the monthly fuel tax reports. All trucks refueling at a given station can only travel within an area bounded by the distance they can travel after refueling. This results in a known area where truck travel associated with each fueling station occurred. The center of that area is the fuel station address. Regardless of whether a truck returns to the same station or travels to another fuel station, its miles traveled can always be associated with the station where it began its trip.
Using geospatial software, fuel consumption areas are mapped, yielding information such as:
• Macroscopic level: Plot the fuel consumption at all distributor addresses graphically to present the variations in density of travel across the United States. In addition, comparing the results across multiple timeframes and only displaying where changes occurred would result in trend maps that emphasize where change is happening.
• Microscopic level: Assign all truck mileage associated with each distributor’s area to specific truck route segments in that area. The truck mileage could be assigned in a logical manner such as using weighted average daily traffic (ADT) values. The geospatial

102
Freight Performance Measure Primer
database could sum the segment mile totals from all overlapping fuel distributor areas to give a total of all truck traffic for each segment. The resulting map would then display truck travel densities per roadway segment. In addition, trend maps can be produced, comparing maps across multiple timeframes, displaying only the changes.
METHODOLOGY
Step 1 - Create a template for each fuel vendor (refer to Figure 12):
• The center represents the address of a fuel vendor such as a truck stop.• The radius represents the maximum travel distance a typical truck can drive between a
typical fill-up (calculation based on average fuel consumption rates and typical fill-up quantities).
• This template represents the territory where that fuel will be spent, which also equals the territory where all truck miles associated with that vendor will travel.
Step 2 - Place vendor template on a GIS map of truck routes (refer to Figure 13):
• The center of the template is placed at the address of the fuel vendor on the GIS map.• The truck routes within the circle represent all possible routes for trucks to use in that area
as they consume the fuel.• The ADT (acquired from State GIS databases) is then captured for each roadway segment
that falls within the circle.• Each segment’s centerline mileage is multiplied times its ADT value to produce a vehicle
miles traveled value for that segment. If a State distinguishes ADTs by vehicle type, that would be a more precise method.
• All segment vehicle miles traveled are then totaled to produce a grand total for the vendor area.
Source: AECOM.
Figure 12. Diagram. Fuel vendor location and average distance of truck travel.
Fuel Vendor Address
Avg. Miles per Fill-up Distance
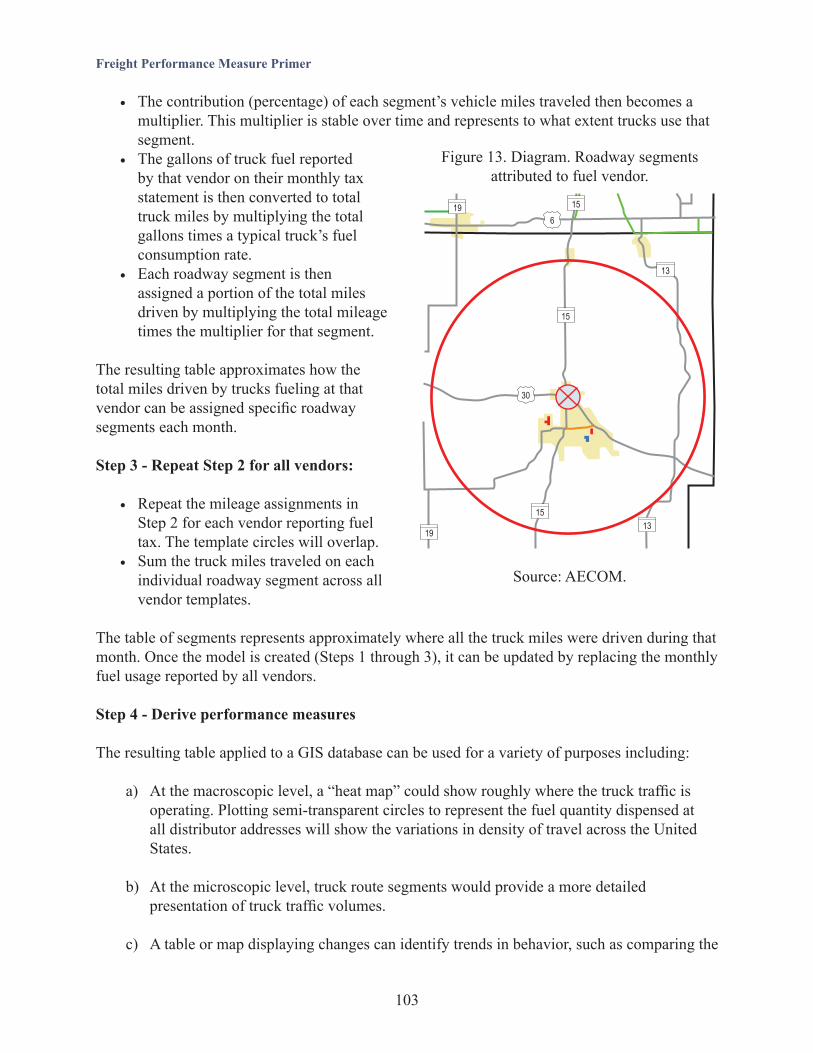
103
Freight Performance Measure Primer
• The contribution (percentage) of each segment’s vehicle miles traveled then becomes a multiplier. This multiplier is stable over time and represents to what extent trucks use that segment.
• The gallons of truck fuel reported by that vendor on their monthly tax statement is then converted to total truck miles by multiplying the total gallons times a typical truck’s fuel consumption rate.
• Each roadway segment is then assigned a portion of the total miles driven by multiplying the total mileage times the multiplier for that segment.
The resulting table approximates how the total miles driven by trucks fueling at that vendor can be assigned specific roadway segments each month.
Step 3 - Repeat Step 2 for all vendors:
• Repeat the mileage assignments in Step 2 for each vendor reporting fuel tax. The template circles will overlap.
• Sum the truck miles traveled on each individual roadway segment across all vendor templates.
The table of segments represents approximately where all the truck miles were driven during that month. Once the model is created (Steps 1 through 3), it can be updated by replacing the monthly fuel usage reported by all vendors.
Step 4 - Derive performance measures
The resulting table applied to a GIS database can be used for a variety of purposes including:
a) At the macroscopic level, a “heat map” could show roughly where the truck traffic is operating. Plotting semi-transparent circles to represent the fuel quantity dispensed at all distributor addresses will show the variations in density of travel across the United States.
b) At the microscopic level, truck route segments would provide a more detailed presentation of truck traffic volumes.
c) A table or map displaying changes can identify trends in behavior, such as comparing the
15
15
19 15
13
1319
30
6
Source: AECOM.
Figure 13. Diagram. Roadway segments attributed to fuel vendor.

104
Freight Performance Measure Primer
vendor node values or segment values across multiple timeframes. These changes could result from a number of causes such as seasonal, weather impacts, economic downturns, or commodity usage trends.
d) Historical fuel tax reports could be used in analysis. Any time range could be used, but the smallest unit would be in months (the typical vendor fuel tax reporting frequency).
ADVANTAGES
There are many advantages to this tool. One advantage is the ease of data acquisition. Data would be available for any area, and there are no privacy issues related to acquiring vehicle miles traveled minimizing trucking industry concerns.
This tool can also be used to:
• Enable the use of historical data to produce truck traffic volumes.• Monitor freight movement trends over different time frames.• Monitor when shipping contracts and manufacturing rates change because of economic
trends.• Enable methods for assessing changes in truck movements at different levels over different
periods of time:
o Macroscopic: changes in regional wholesale fuel distribution would indicate changes in regional truck miles driven.
o Microscopic: changes in truck miles driven by route could be estimated.
The results of this tool can be used to:
• Identify trends in freight movements at local and regional levels beyond commodity analysis
• Study locations for new commercial/industrial facilities that have high freight movement activity in their operations.
• Recommend highway capacity improvements where roadway capacity is being challenged due to increasing truck volumes.
• Focus truck motor carrier inspection resources by knowing where the truck movement trends are occurring.
• Adjust pavement life cycle maintenance per trending behavior • Determine if hydrocarbon emission measuring sites are reporting the same trends in
pollution as the trends in vehicle miles traveled. • Overlay truck crash heat maps with truck traffic maps to identify the correlation between
truck volumes and crashes involving trucks. This could then lead to targeted enforcement campaigns and prioritized highway safety improvement plans for routes that have excessive crashes per truck mile rates.
105
Freight Performance Measure Primer
CONSIDERATIONS
• There is error inherent in the mileage assignment system. However, this method leverages the knowledge of where trucks fueled. All travels emanated from these points of origin, enabling approximations of truck operations and distances.
• Updates to the model could be accomplished by replacing the fuel quantities sub-table of the GIS database with fresh values reported by each vendor each month.
• Periodic updates to the list of vendors and updates to the ADT values would be necessary to recalibrate the model.
• The radius of each template is critical to this system, and calculations would have to be identified. Factors to consider include:
o A typical 18-wheeler has two 100 to 150 gallon tanks, and average about seven miles per gallon, so the truck has a long travel range between fill-ups. There are a number of factors influencing when a driver chooses to refuel. For example, drivers have hours of service limits, and 700 miles (the approximate range for one typical saddle tank) is roughly the miles they could drive during their allowable hours of service. It seems reasonable to assume that long-distance drivers would tend to refuel during their rest break time.
o Local and intrastate trips would be shorter, but would likely occur entirely within a smaller template area than the long-distance drivers. This would suggest a smaller radius for the vendor template for these types of vehicles.
o The typical mileage driven between refueling is also critical to the accuracy of the system. One way to get a realistic mileage per tank would be to conduct a statistical analysis of the number of gallons per fill-up using a sampling of vendors to get a realistic typical value for all trucks using these facilities. This could be derived from their fuel purchase receipts.
• States tax fuel in several ways, including:
o Wholesale level: Where the tanker trucks fill up o Retail level: Where the trucks refuel o State fuel sales tax o Weight-mile tax along with a fuel tax. (Only Oregon has a weight mile tax)
It would be necessary to develop State-specific processes for capturing the monthly gallons of fuel (or miles driven in some cases) reported by each fueling station.
• Validation of the model can occur using actual carrier data. For fuel tax apportionment purposes, motor carriers are required to keep detailed records for each trip, including fuel consumption and routes driven through each jurisdiction, as well as fuel purchase receipts. This information is then summarized and used to report to the International Fuel Tax

106
Freight Performance Measure Primer
Association (IFTA) where their fuel was consumed.
Summaries are submitted when carriers report their taxes. The IFTA requires that detailed trip records be retained for four-years for auditing purposes. Many of the carriers contract this tax reporting process out to specialized freight accounting services. It may be possible to contract these accounting services to anonymize clients’ trip data of any carrier-specific information and provide route-specific reports of actual trip mileage.
A sampling process can validate the computer model results. This approach uses reports of actual routes and miles driven per carrier. It can provide more accuracy than calculating mileage from fuel consumed. However, acquisition of this detailed data from carriers would be difficult. However, a sampling of the accounting services could be used for validation purposes in a few specific sampling areas.
CONCLUSION
There are several benefits to using fuel taxes to track truck movement. This method can help identify freight trends at the local and regional levels beyond the typical commodity flow analysis. The results can also help identify land use trends. Finally, enforcement agencies could use the data to properly locate inspection facilities and resources and State DOTs would be able to use this data in determining pavement wear and life cycles.


U.S. Department of TransportationFederal Highway AdministrationOffice of Operations1200 New Jersey Avenue, SEWashington, D.C. 20590
ops.fhwa.dot.gov
October 2017FHWA-HOP-16-089