french airborne lidar measurements for eyjafjallajokull ... · ... 28 january 2012 – published in...
TRANSCRIPT

Atmos. Chem. Phys., 12, 7059–7072, 2012www.atmos-chem-phys.net/12/7059/2012/doi:10.5194/acp-12-7059-2012© Author(s) 2012. CC Attribution 3.0 License.
AtmosphericChemistry
and Physics
French airborne lidar measurements for Eyjafjallaj okullash plume survey
P. Chazette1, A. Dabas2, J. Sanak1, M. Lardier 3, and P. Royer1,3
1Laboratoire des Sciences du Climat et de l’Environnement (LSCE), UMR8212, Laboratoire mixte CEA-CNRS-UVSQ,CEA Saclay, 91191 Gif-sur-Yvette, France2Groupe d’Etude de l’Atmosphere Meteorologique, URA Meteo-France/CNRS, 42 avenue Coriolis, 31100 Toulouse, France3LEOSPHERE, 76 rue de Monceau, 75008 Paris, France
Correspondence to:P. Chazette ([email protected])
Received: 28 January 2012 – Published in Atmos. Chem. Phys. Discuss.: 2 March 2012Revised: 11 July 2012 – Accepted: 12 July 2012 – Published: 6 August 2012
Abstract. An Ultra-Violet Rayleigh-Mie lidar has been in-tegrated aboard the French research aircraft Falcon20 in or-der to monitor the ash plume emitted by the Eyjafjallajokulvolcano in April–May 2010. Three operational flights werecarried out on 21 April, 12 and 16 May 2010 inside French,Spanish and British air spaces, respectively. The original pur-pose of the flights was to provide the French civil aviationauthorities with objective information on the presence andlocation of the ash plume. The present paper presents the re-sults of detailed analyses elaborated after the volcano crisis.They bear on the structure of the ash clouds and their op-tical properties such as the extinction coefficient and the li-dar ratio. Lidar ratios were measured in the range of 43 to50 sr, in good agreement with the ratios derived from ground-based lidar near Paris (France) in April 2010 (∼ 48 sr). Theash signature in terms of particulate depolarization was con-sistent during all flights (between 34± 3 % and 38± 3 %).Such a value seems to be a good identification parameter forvolcanic ash. Using specific cross-sections between 0.19 and1.1 m2 g−1, the minimum (maximal) mass concentrations inthe ash plumes derived for the flights on 12 and 16 May were140 (2300) and 250 (1500) µg m−3, respectively. It may berather less than, or of the order of the critical level of dam-age (2 mg m−3) for the aircraft engines, but well above the200 µg m−3 warning level.
1 Introduction
Due to the winds prevailing in Northern Europe at the time,the ash plume emitted by the Icelandic volcano Eyjafjal-lajokull (e.g. Sigmundsson et al., 2010) that erupted in April–May 2010 was advected from Iceland to the south-east. Forseveral days, it “contaminated” the airspace of Western Eu-rope and lead to a major air traffic disruption (Gertisser,2010). In France, the “Direction Generale de l’AviationCivile” (DGAC) and the government authorities closed theairspace entirely from 16 to 21 April 2010, and partially(south-western part of France) from 12 to 16 May 2010.
During these two periods several lidars were operated byvarious groups throughout Europe with the purpose of in-creasing knowledge on ash properties and assess their po-tential danger to aviation. Ansmann et al. (2011) proposedan original approach coupling lidar and sunphotometer to re-trieve the content of ash over central Europe using the ex-istent networks AERONET and EARLINET. The couplingbetween ground-based remote sensors including lidar wasalso proposed by Gasteiger et al. (2011) to constrain theash size distribution. Another original work was conductedby Chazette et al. (2012) using the coupling between li-dar (ground-based and spaceborne systems), sunphotome-ter and numerical model to retrieve the ash optical proper-ties over the Paris area and the assessment of the ash massconcentration. The ash plume was also analyzed with ac-tive (e.g. Chazette et al., 2012) and passive (e.g. Milling-ton et al., 2012) spaceborne sensors. This last approachfollowed the work of Prata et al. (2010) and Thomas and
Published by Copernicus Publications on behalf of the European Geosciences Union.

7060 P. Chazette et al.: French airborne lidar measurements for Eyjafjallajokull ash plume survey
Watson (2010) by using multispectral remote-sensing obser-vations from satellites to characterize volcanic emission fromspace. During the Eyjafjallajokull crisis, airborne measure-ments also played a major role for the retrieval of microphys-ical ash properties by analyzing air samples captured dur-ing the flights (Schumann et al., 2011; Johnson et al., 2011;Bukowiecki et al., 2011) and using lidar measurements (e.g.Marenco et al., 2011).
The use of lidar measurements to characterize volcanicaerosols is not new. Following the major eruptions of ElChichon in 1982 and Mount Pinatubo in 1991, volcanicplumes were extensively studied in the stratosphere by bothground-based and airborne lidars. For instance, Jager (1992)used a lidar at Garmisch-Partenkirchen (Germany) to in-vestigate the volcanic aerosol in the stratosphere followingthe Mount Pinatubo eruption. Simultaneously, lidar measure-ments were performed at Hampton (Virginia, USA) by Os-born et al. (1995). In France, Chazette et al. (1995) used li-dar observations from the “Observatoire de Haute Provence”(OHP) to characterize the aerosol plume in the stratospherefollowing the eruptions of El Chichon and Mount Pinatubo.The residence time of volcanic aerosols was thus assessed.The ash plume of Mount Pinatubo was also investigated withan airborne lidar by Winker et al. (1992). The chemical na-ture of volcanic aerosol is likely to be different in the tropo-sphere than in the stratosphere. Following a major eruption,the precursor of the aerosols in the stratosphere is the diox-ide sulfide (SO2) leading to the creation of sulfuric acid inaqueous solution (Rosen and Hofmann, 1986) whereas it isa mixing of ash and sulfate in the troposphere (Schumannet al., 2011). In the recent past, some authors used lidarsfrom ground to characterize the volcanic aerosol followingthe eruptions of Etna (Pappalardo et al., 2004; Wang et al.,2008) or Augustine in 2006 (Sassen et al., 2007), and thecontribution to the troposphere of different volcanoes overEurope (Mattis et al., 2010).
In this paper we present the contribution of the sole Frenchairborne lidar (AL) that flew during the international air-line crisis caused by the Eyjafjallajokul eruption. The ALwas built from an ALS450 manufactured by the LeosphereCompagny and was initially developed at the “Laboratoiredes Sciences du Climat et de l’Environnement” (LSCE). Asimilar system has already flown aboard an ultra-light air-craft during the African Monsoon Multidisciplinary Analy-ses (AMMA) (e.g. Chazette et al., 2007), as well as aboardthe FAAM BAe-146 research aircraft (www.faam.ac.uk)(e.g. Marenco et al., 2011). The lidar is briefly presented inSect. 2 where we also remind how aerosol optical propertiescan be derived from the co-polar and cross-polar channelsof a lidar. The flight plans are presented in Sect. 3 with theidentification of the ash plume from the cross-polar channel.In Sect. 4, the ash plume optical properties retrieved fromthe lidar profiles are presented with their uncertainties andwe propose an estimation of the ash mass concentration us-
Table 1.Main characteristic of the airborne lidar system.
Characteristics Details
Lidar head size ∼ 65× 35× 18 cmLidar head and electronic weight ∼ 40 kgLaser type Nd:YAG 20Hz 16 mJ @355 nmLaser pulse length ∼ 5–7 nsLaser divergence 0.1 mradReception channels Elastic 355 nm // et⊥
Reception diameter 150 mmField of view ∼ 2.3 mradFull-overlap 200 mDetector Photomultiplier (analog mode)Filter bandwidth 0.3 nmElectronic system PXI 100 MHzVertical sampling (resolution) 1.5 m (15 m)
ing the previous results published in the scientific literature.Section 5 summarizes the findings.
2 The airborne lidar
The AL was flown aboard the Falcon 20 (F-20) of the “Ser-vice des Avions Francais Instrumentes pour la Recherche enEnvironnement” (SAFIRE, seewww.safire.fr) which oper-ates several aircrafts for research purposes in the environ-ment domain. SAFIRE Falcon 20 is an original Dassault Fal-con 20 GF specially modified for scientific uses. Its usualcruising speed is 150 m s−1 and its endurance is close to 5 h(maximal flight range∼ 4100 km) depending on the scien-tific payload (usually∼ 1200 kg). Its maximum flight ceilingis ∼ 42 000 ft (12 000 m).
2.1 Technical characteristics of the AL
The AL has been built at LSCE following the precursorinstrument LAUVA (Lidar Aerosol UltraViolet Aeroporte,Chazette et al., 2007; Raut and Chazette, 2009). It couldbe considered as a home-made alternative version of theALS450 manufactured by the LEOSPHERE compagny(www.leosphere.com). It emits in the ultraviolet (355 nm),and is based on a 20 Hz pulsed Nd:YAG laser (ULTRA) man-ufactured by QUANTEL (www.quantel.com). The acquisi-tion system is based on a PXI (PCI eXtensions for Instrumen-tation) technology. Its main characteristics are summarized inTable 1. The UV pulse energy is 16 mJ and the pulse repeti-tion rate is 20 Hz. The receiver implements two channels forthe detection of the elastic backscatter from the atmospherein the parallel and perpendicular polarization planes relativeto the linear polarization of the emitted radiation. It was de-signed to monitor the aerosol distribution and dispersion inthe low and middle troposphere. It enables the retrieval ofaerosol optical properties (extinction, backscatter coefficientand depolarization ratio) and atmospheric structures like theplanetary boundary layer (PBL), aerosol layers and clouds,
Atmos. Chem. Phys., 12, 7059–7072, 2012 www.atmos-chem-phys.net/12/7059/2012/

P. Chazette et al.: French airborne lidar measurements for Eyjafjallajokull ash plume survey 7061
with a line of sight resolution close to 15 m. With a 15 cm di-ameter telescope, the lidar is compact (∼ 70×45×18 cm) andlightweight (< 50 kg for both optics and electronics) and canthus be easily mounted aboard an aircraft. The wide field-of-view (FOV)∼ 2.3 mrad ensures a full-overlap of the transmitand receive paths beyond∼ 200 m.
2.2 The lidar signal
Assuming a perfect separation of the 2 polarizations, therange corrected lidar signalsS1(2) at the emitted wavelengthλ for both the co-polarization (//, channel 1) and the cross-polarization (⊥, channel 2) channels is given as a function ofranger by (Measures, 1984)
S1(2)(r) = C1(2)·
(β1(2)
m (r) + β1(2)a (r)
)·exp
−2 ·
r∫0
(αm(r ′) + αa(r
′))· dr ′
(1)
The molecular (resp. aerosol) contribution is characterizedby both the extinctionαm (resp.αa) and the backscatter co-efficientsβ
1(2)m (resp.β1(2)
a ). The molecular extinction andbackscatter coefficients are known functions of the air den-sity and can thus be predicted with a good accuracy from ei-ther a climatological profile of air density, or more preciselyfrom a weather analysis or a radio-sounding by a polynomialapproximation as proposed by Nicolet (1984).C1(2)are theinstrumental constants for each channel.
Taking into account that the two Brewster plates usedfor the separation of the two polarizations are not perfect(Fig. 1), the total elastic lidar signal must be computed fromthe two polarized signals by using the equation
S(r) =S1(r) · (1+ VDR(r))
C1 ·
(T
//
1 + T ⊥
1 · VDR(r)) (2)
where VDR is the volume depolarization ratio
VDR(r) =
Rc ·
(1− T
//
1
)·
(1− T
//
2
)· S1(r) − T
//
1 · S2(r)
T ⊥
1 · S2(r) − Rc ·(1− T ⊥
1
)·(1− T ⊥
2
)· S1(r)
. (3)
T//i andT ⊥
i are the transmissions of the co-polarization andcross-polarization contributions of the Brewster platei, re-
spectively. The cross-calibration coefficientRc = C2/C1 can
be assessed by normalizing at the lidar signals obtained in a“clean” atmospheric volume with negligible aerosol content:
Rc=
S2(rm)·(T
//
1 +VDRm·T ⊥
1
)S1(rm)
[(1−T
//
1
)·
(1−T
//
2
)+VDRm·
(1− T ⊥
1
)·(1− T ⊥
2
)](4)
where the molecular volume depolarization ratio (VDRm)
was taken equal to 0.3945 % at 355 nm following Collisand Russel (1976). There, the lidar signal is due solely to
Page 29 sur 38
570
Figure 1: Schematic representation of the co-polar and cross-polar channels. 571
572
573
Fig. 1. Schematic representation of the co-polar and cross-polarchannels.
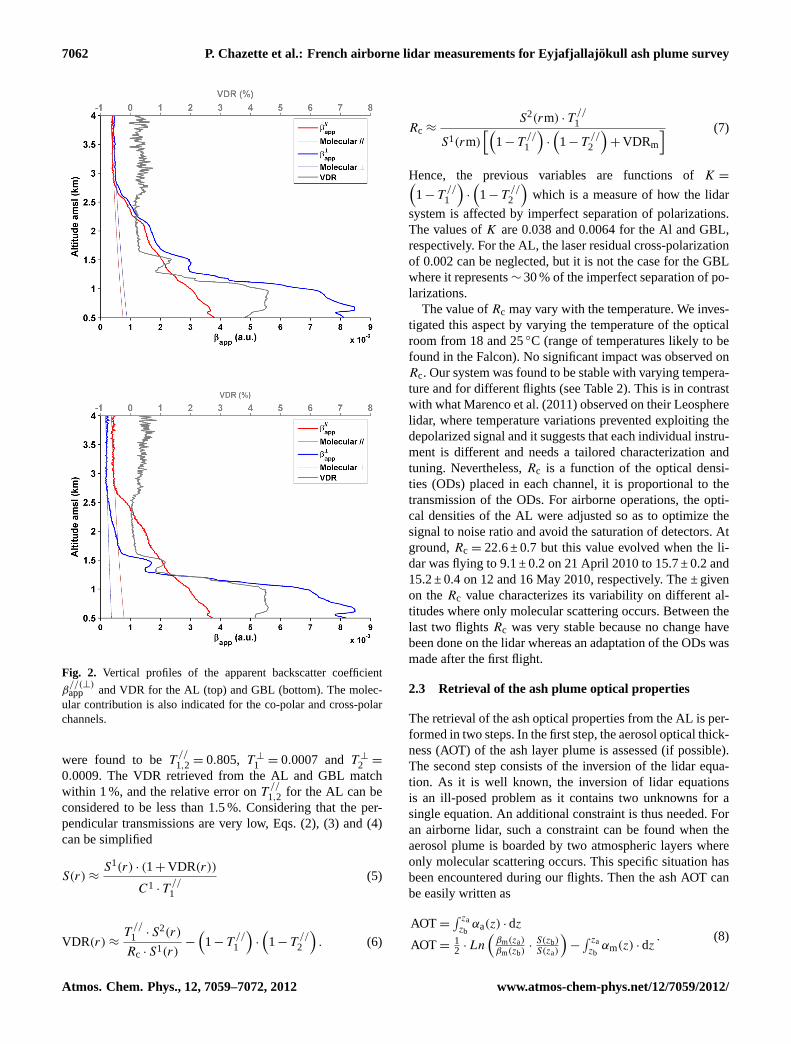
the known molecular backscatter for the altitudezm (zm =
zf − rm, wherezf is the flight altitude) between 6 and 7 kmabove the mean sea level (a.m.s.l.). Note that because ofthe narrow width of the interferential filter (0.3 nm) of thereceiver, only Cabannes scattering is observed by the lidar.The mean relative uncertainty on the cross-calibration coef-ficient was assessed before the flights over the Paris area andcompared to the one of another ground-based lidar (GBL)used to follow the ash plume (Chazette et al., 2012). Thesemeasurements performed from ground for the two lidars dur-ing the night of 19 April 2010 (23:00 LT) are shown inFig. 2. The vertical profiles of apparent backscatter coef-ficient β
//(⊥)app (S1(2)corrected from the molecular transmis-
sion) derived from the two lidars are in very good agreement.
The previous equations assume that the laser is fully po-larized at the emission and no rotation exists between thepolarization planes of the emission and reception. The laserresidual perpendicular polarization has been assessed on anoptical bench in the laboratory. It was found to be close to2.0 ‰ (2 per mil). Moreover, we performed measurementswith and without a Glan-prism placed at the exit of the laserand we have not observed significant differences on the depo-larization ratio. The emission and reception paths are on thesame integration plate to ensure that emission and receptionoptical axes are parallel. The orientations of the two Brew-ster plates are adjusted so as to maximize the backscatter sig-nal on each channel. Moreover, the supports of the Brewsterplates are machined at 56 ± 2◦, the residual tolerance is foradjustment in the laboratory. To evaluate the uncertainty onthe Brewster angular position we have repeated the measure-ment 4 times on an optical bench. The standard deviation hasbeen assessed to be 0.3 ‰. Hence, the dominant error sourceis indeed the characterization of the plate transmission.
The Brewster plates of the GBL were characterized at theLSCE on an optical bench. We foundT //
1,2 = 0.92, T ⊥
1 =
0.0012 andT ⊥
2 = 0.0009 with a relative uncertainty of 1 %and 35 % for the parallel and perpendicular channels, respec-tively. The polarization of the AL has been calibrated bycomparison to the GBL and its Brewster plate transmissions
www.atmos-chem-phys.net/12/7059/2012/ Atmos. Chem. Phys., 12, 7059–7072, 2012
7062 P. Chazette et al.: French airborne lidar measurements for Eyjafjallajokull ash plume survey
Page 30 sur 38
574
575
Figure 2: Vertical profiles of the apparent backscatter coefficient )//(
app and VDR for the 576
AL (top) and GBL (bottom). The molecular contribution is also indicated for the co-polar 577
and cross-polar channels. 578
579
Fig. 2. Vertical profiles of the apparent backscatter coefficient
β//(⊥)app and VDR for the AL (top) and GBL (bottom). The molec-
ular contribution is also indicated for the co-polar and cross-polarchannels.
were found to beT //
1,2 = 0.805, T ⊥
1 = 0.0007 andT ⊥
2 =
0.0009. The VDR retrieved from the AL and GBL matchwithin 1 %, and the relative error onT //
1,2 for the AL can beconsidered to be less than 1.5 %. Considering that the per-pendicular transmissions are very low, Eqs. (2), (3) and (4)can be simplified
S(r) ≈S1(r) · (1+ VDR(r))
C1 · T//
1
(5)
VDR(r) ≈T
//
1 · S2(r)
Rc · S1(r)−
(1− T
//
1
)·
(1− T
//
2
). (6)
Rc ≈S2(rm) · T
//
1
S1(rm)[(
1− T//
1
)·
(1− T
//
2
)+ VDRm
] (7)
Hence, the previous variables are functions ofK =(1− T
//
1
)·
(1− T
//
2
)which is a measure of how the lidar
system is affected by imperfect separation of polarizations.The values ofK are 0.038 and 0.0064 for the Al and GBL,respectively. For the AL, the laser residual cross-polarizationof 0.002 can be neglected, but it is not the case for the GBLwhere it represents∼ 30 % of the imperfect separation of po-larizations.
The value ofRc may vary with the temperature. We inves-tigated this aspect by varying the temperature of the opticalroom from 18 and 25◦C (range of temperatures likely to befound in the Falcon). No significant impact was observed onRc. Our system was found to be stable with varying tempera-ture and for different flights (see Table 2). This is in contrastwith what Marenco et al. (2011) observed on their Leospherelidar, where temperature variations prevented exploiting thedepolarized signal and it suggests that each individual instru-ment is different and needs a tailored characterization andtuning. Nevertheless,Rc is a function of the optical densi-ties (ODs) placed in each channel, it is proportional to thetransmission of the ODs. For airborne operations, the opti-cal densities of the AL were adjusted so as to optimize thesignal to noise ratio and avoid the saturation of detectors. Atground,Rc = 22.6 ± 0.7 but this value evolved when the li-dar was flying to 9.1 ± 0.2 on 21 April 2010 to 15.7 ± 0.2 and15.2 ± 0.4 on 12 and 16 May 2010, respectively. The ± givenon theRc value characterizes its variability on different al-titudes where only molecular scattering occurs. Between thelast two flightsRc was very stable because no change havebeen done on the lidar whereas an adaptation of the ODs wasmade after the first flight.
2.3 Retrieval of the ash plume optical properties
The retrieval of the ash optical properties from the AL is per-formed in two steps. In the first step, the aerosol optical thick-ness (AOT) of the ash layer plume is assessed (if possible).The second step consists of the inversion of the lidar equa-tion. As it is well known, the inversion of lidar equationsis an ill-posed problem as it contains two unknowns for asingle equation. An additional constraint is thus needed. Foran airborne lidar, such a constraint can be found when theaerosol plume is boarded by two atmospheric layers whereonly molecular scattering occurs. This specific situation hasbeen encountered during our flights. Then the ash AOT canbe easily written as
AOT =∫ zazb
αa(z) · dz
AOT =12 · Ln
(βm(za)βm(zb)
·S(zb)S(za)
)−∫ zazb
αm(z) · dz. (8)
Atmos. Chem. Phys., 12, 7059–7072, 2012 www.atmos-chem-phys.net/12/7059/2012/
P. Chazette et al.: French airborne lidar measurements for Eyjafjallajokull ash plume survey 7063
Table 2. Optical properties of the ash plumes. The relative statistic uncertainties (εx) are given for each propertyx and plume type. They
have been calculated for the main sources of standard deviation: the signal noise and the Brewster plate transmissions (T//1,2).
16/05 12/05 Plume 12/05 Plume-crown 12/05 Filament
Uncertainties linked to the shot noise
SNRb 12 12 19 14SNRa 35 28 56 27Rc 15.2 ± 0.4 15.7 ± 0.2 15.7 ± 0.2 15.7 ± 0.2VDR 0.12 ± 0.04 0.11 ± 0.01 0.09 ± 0.01 0.16 ± 0.06AOT 0.34 0.19 0.08 0.17BER 0.021 sr−1 0.023 sr−1 0.020 sr−1 0.027 sr−1
R(za) = 1 PDR 0.38 ± 0.03 0.38 ± 0.04 0.34 ± 0.03 0.36 ± 0.04R(zb) = 1 max(αa) 0.28 km−1 0.41 km−1 0.15 km−1 0.44 km−1
εVDR 1 % 1 % 1 % 1 %εAOT 2 % 2 % 4 % 2 %εBER 2 % 2 % 5 % 2 %εPDR 1 % 1 % 1 % 2 %εα 3 % 2 % 6 % 2 %
Uncertainties linked to the Brewster plate transmissions
εRc 9 % 6 % 12 % 9 %εVDR 8 % 6 % 10 % 9 %
σT
//1,2
T//
1,2
≈ 1.5 % εAOT 0.1 % 0.1 % 0.3 % 0.3 %
εBER 2 % 2 % 3 % 2 %εPDR 9 % 10 % 24 % 12 %εα 0.2 % 0.2 % 0.3 % 0.2 %
wherez is the altitude amsl(z = zf − r cos (θ) with zf the air-craft altitude andθ the pointing angle relative to nadir);zbandza are the altitudes within the molecular layers beneathand above the ash plume, respectively. Using the backscat-ter to extinction ratio (BER, inverse of the lidar ratio LR),the elastic Eq. (1) becomes a differential equation of typeBernoulli first order and can be mathematically inverted(Klett, 1985)
αa(z) = BER−1 (9)(S (z) Q(z)
S(za)(βm(za)+βa(za))
− 2 · BER−1∫ zaz
S(z′) Q(z′) dz′− βm (z)
)︸ ︷︷ ︸
βa(z)
Here, Q is the correction factor related to the differentialmolecular optical thickness calculated from the vertical pro-file of the molecular scattering coefficient as
Q(z) = exp
2
[1− kf
3
8π · BER
] za∫z
αm(z′)
dz′
(10)
wherekf is the King factor of air (King, 1923). Consider-ing kf = 1 leads to an overestimation on the molecular vol-ume backscatter coefficient of only 1.5 % at 355 nm (Collisand Russel, 1976). BER is assessed using the AOT as a con-straint in Eq. (9) via a dichotomy approach as described by
Chazette (2003) or Royer et al. (2011). As shown in Berthieret al. (2006), the BER is overestimated when multiple scat-tering occurs. With a field of view of 2.3 mrad and a flightat 10 km a.m.s.l., we have assessed a relative uncertainty of1 % on the BER, which has been hereafter neglected in com-parison to the other sources of uncertainty. The value henceretrieved is constant for the entire ash layer. This assumesthat the ash are distributed homogeneously across the plume.
The uncertainties in the determination of AOT,αa andBER can be related to three main sources: (i) the detectionnoise (shot noise, electronic noise...), (ii) the presence ofresidual aerosols in the altitude ranges used for lidar cali-bration, (iii) the uncertainty on the a priori knowledge of thevertical profile of the Rayleigh backscatter coefficient as de-termined from ancillary measurements. This last uncertaintyis negligible (< 2 % on αa or BER) compared to the oth-ers. The statistical uncertainties on the ash optical parame-ters have been calculated (see Sect. 4.1) using a Monte Carloapproach as in Chazette (2003).
The higher contribution of the molecular scattering at355 nm leads to prefer the particulate depolarization ra-tio (PDR) to characterize the ash depolarization propertieslinked to their non-sphericity. The PDR is given by (Chazetteet al., 2012)
www.atmos-chem-phys.net/12/7059/2012/ Atmos. Chem. Phys., 12, 7059–7072, 2012

7064 P. Chazette et al.: French airborne lidar measurements for Eyjafjallajokull ash plume survey
PDR(z) = (11)βm(z)·(VDRm−VDR(z))−βa(z)·VDR(z)·(1+VDRm)
βm(z)·(VDR(z)−VDRm) − βa(z) · (1+ VDRm),
The PDR is generally very noisy because it is the ratio of twonoisy functions ofβa. Hence, its assessment is restricted tohigh values of aerosol extinction coefficient (> 0.1 km−1 forour AL).
3 Flights plans and ash plume identification
Probable presence of volcanic ash was detected during threeflights of the F-20. These flights were carried out on 21 April,12 and 16 May 2010, inside the French, Spanish and Britishair spaces, respectively. The aircraft took off from the mil-itary airport of Toulouse-Francazal for each of them, andlanded on the same airport. The volcanic ash plume has beenmainly identified using the perpendicular channel of the air-borne lidar, in terms ofβ⊥
app.On 21 April 2010, while air traffic was resuming over
France, a thin volcanic aerosol layer was measured in theNorthern part of France above a cloud layer between Stras-bourg and Dieppe (Fig. 3). The AOT of the ash plume waslower than 0.03 at 355 nm (retrieved from ground-based li-dar, not shown). It is thus very difficult to retrieve the ash op-tical properties from an airborne lidar. Moreover, there is nomolecular layer beneath the ash plume. Hereafter, we do notconsider these lidar measurements for a quantitative study.Note that the PBL signature on Fig. 3 appears similar to theone of the ash plume but is mainly due to dust-like trappedin the thermal convection.
The second flight occurring on 12 May was over the At-lantic Ocean, off the Spanish coast (La Coruna), towards theWest as shown Fig. 4. A filament (∼ 500 m deep) with ahigh lidar signal was first observed by the AL (located be-tween−9.82 and−12.06◦ in longitude and at∼ 5 km a.m.s.l.in Fig. 4). But the main body of the volcanic plume wasfound further west at about the limit of range of the aircraft(∼ 1200 km off La Coruna). Therefore only the edge of theplume could be observed by the AL. It extends verticallyfrom 2 to∼ 7 km a.m.s.l. Lidar signals are reported in Fig. 4.The figure is nearly symmetrical as the aircraft flew a returnflight along almost the same route. The backtrajectories com-puted with the HYSPLIT (Hybrid Single Particle LagrangianIntegrated Trajectory Model) model (courtesy of NOAA AirResources Laboratory;http://www.arl.noaa.gov) are shownin Fig. 5. The ash that were present within the filament andthe plume were not emitted on the same day (10 May for thefilament and 11 May for the plume) neither advected with thesame efficiency. For the filament, the main contribution to thelidar signal came from an altitude of∼ 2 km a.m.s.l., whereasit came between 4 and 5 km a.m.s.l. for the main plume.
Page 31 sur 38
580
581
Figure 3: Flight for 21 April 2010. Top panel shows the flight plane above France where the 582
main crossed cities are given. Bottom panel shows the temporal evolution of app. The 583
shallow ash plume is circled in red. 584
585
Fig. 3. Flight for 21 April 2010. Top panel shows the flight planeabove France where the main crossed cities are given. Bottom panelshows the temporal evolution ofβ⊥
app. The shallow ash plume iscircled in red.
On 16 May, the British air space was closed. Volcanic ashwere expected and encountered in the North of England. Theash plume is well located by the AL measurements as shownFig. 6. It lies between∼ 3 and 6 km a.m.s.l. Backtrajectoriesfrom different end-points within the ash plume are displayedin Fig. 7. They confirm the source of the ash plume as beingthe Eyjafjallajokull volcano.
Note that the ubiquitous cloud cover during the flightsmakes it difficult to identify ash plumes from space. Fewcloud-free pixels are available on SEVERI or MODIS (notshown) and backtrajectories appear as the most relevantmeans to identify the origin of the ash layers detected fromthe AL.
Atmos. Chem. Phys., 12, 7059–7072, 2012 www.atmos-chem-phys.net/12/7059/2012/

P. Chazette et al.: French airborne lidar measurements for Eyjafjallajokull ash plume survey 7065
Page 32 sur 38
586
587
Figure 4: The same as Figure 3 for 12 May 2010, off La Coruna. The areas where the mean 588
lidar profiles have been studied are highlighted by purple rectangles. 589 Fig. 4.The same as Fig. 3 for 12 May 2010, off La Coruna. The ar-eas where the mean lidar profiles have been studied are highlightedby purple rectangles.
4 Optical properties and mean ash mass concentration
The calculations were performed on mean profiles measuredin the ash plumes for which we have two molecular nor-malization points, above and beneath the plume (za andzb,respectively). The locations of the mean profiles are high-lighted on Figs. 4 and 6 for 12 and 16 May, respectively.The averaging of lidar signals was done in order to improvethe signal to noise ratio (SNR) in the molecular zones sothat it exceeds 10 needed for an accurate inversion (Table 2).The assessment of the ash optical properties does not requireassumptions about the chemical nature and morphologicalproperties of the ash. This is not the case for the assessmentof the ash mass concentrations (e.g. Gasteiger et al., 2011;Chazette et al., 2012).
Page 33 sur 38
590
Figure 5: Backtrajectories on 12 May 2010 computed using the Hysplit model (courtesy of 591
NOAA Air Resources Laboratory; http://www.arl.noaa.gov). The wind fields are from GDAS 592
(Global Data Assimilation System, http://www.ncep.noaa.gov/) at the horizontal resolution of 593
1°. Two terminal locations of the air masses are considered: one in the ash plume and the 594
other one in the filament. All the lidar observations in the ash structures are considered as the 595
individual final location of the air masses. 596
597
Fig. 5. Backtrajectories on 12 May 2010 computed using the Hys-plit model (courtesy of NOAA Air Resources Laboratory;http://www.arl.noaa.gov). The wind fields are from GDAS (Global DataAssimilation System,http://www.ncep.noaa.gov/) at the horizontalresolution of 1◦ . Two terminal locations of the air masses are con-sidered: one in the ash plume and the other one in the filament. Allthe lidar observations in the ash structures are considered as the in-dividual final location of the air masses.
4.1 Optical parameters
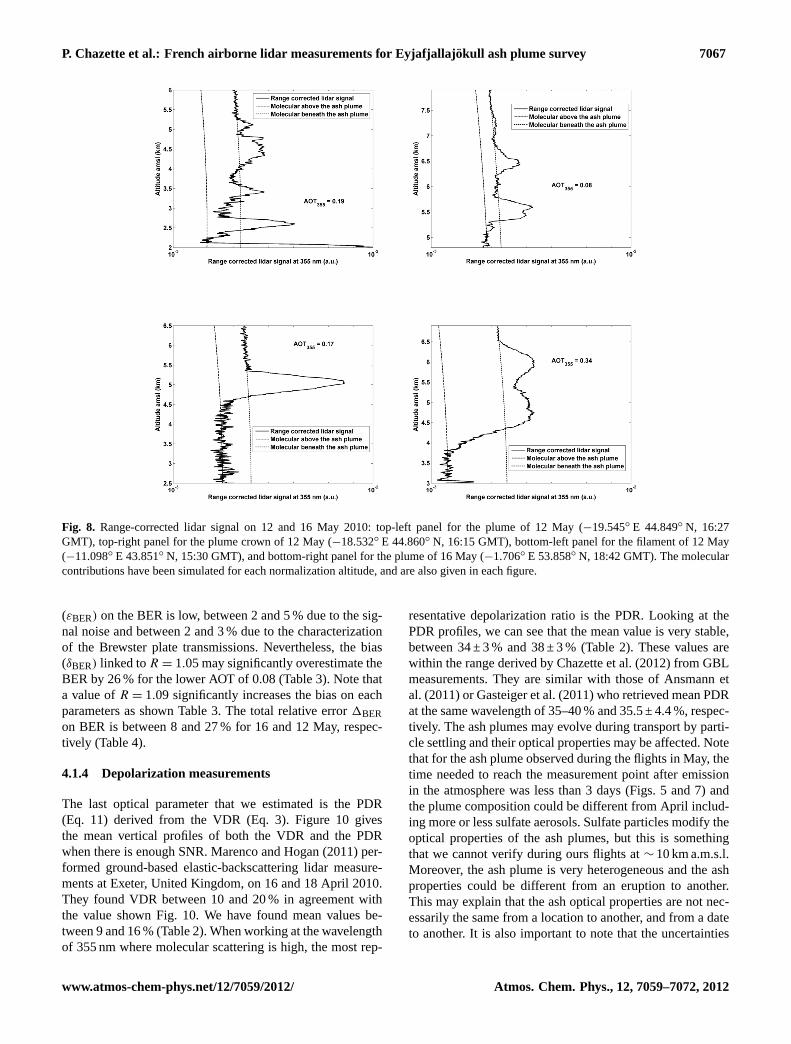
The range-corrected mean lidar signal is given in Fig. 8 for12 and 16 May 2010. For 12 May, we have firstly distin-guished the plume from the filament, and secondly we haveconsidered separately the plume-crown, located between∼ 5and 7 km a.m.s.l., from the plume itself, which is located be-low, between∼ 2 and 5 km a.m.s.l. (Fig. 5). Note that thelower molecular reference altitude is above a cloud layer.Moreover, the higher and lower molecular referencesza andzb are very likely to be contaminated by residual aerosolcontribution and the AOTs are likely biased. It is unclearwhether aerosols are a priori present at the molecular ref-erence level. Hence, the potential bias on the optical param-eters was assessed using one (two) scattering coefficient(s)(R = 1+ βa
/βm
) at the higher (lower) molecular referencealtitude(s). At the molecular referencezb, R = 1.05 (1.09)leads to a bias on the lidar signal at least equal to the (twice)signal noise level. Such a deviation is assumed to be ob-servable on the profiles of Fig. 8. The uncertainties linkedto the Brewster plate transmission have been also assessedon each optical parameter using a Monte Carlo approach(Chazette et al., 2001). The results are summarized in Ta-bles 2, 3 and 4. For the total error budget given in Table 4,we have considered that a deviation from molecular scatter-ing with R = 1.02 (1.05) is identifiable at the higher (lower)molecular reference altitude(s), except for the plume of 12May where the lower molecular reference zone is very small
www.atmos-chem-phys.net/12/7059/2012/ Atmos. Chem. Phys., 12, 7059–7072, 2012

7066 P. Chazette et al.: French airborne lidar measurements for Eyjafjallajokull ash plume survey
Page 34 sur 38
598
599
Figure 6: The same as Figure 4 for 16 May 2010, above UK. 600
601
Fig. 6.The same as Fig. 4 for 16 May 2010, above UK.
(∼ 150 m) and for which the gap can be more important(R = 1.09).
4.1.1 Aerosol optical thickness in the plume
The AOTs at 355 nm retrieved from Eq. (8) for each caseare given in Table 2. The calculation has been made betweenzb and za. The event on 16 May is the most intense withAOT = 0.34 compared with the ash plumes observed on 12May with AOT of 0.19, 0.08 and 0.17 for the plume, plume-crown and filament, respectively.
For R = 1.05, the bias (δAOT ∼ −0.02) on the AOT is thesame whatever the AOT values. The bias is more than twiceas important as forR = 1.09 (between 0.04 and 0.05). Thestatistical uncertainty (εAOT) linked to the signal noise is low(less than 4 %, Table 2). The error budget on the AOT leadsto an absolute error1AOT between 0.02 and 0.04 (Table 4).
Page 35 sur 38
602
Figure 7: The same as Figure 6 for 16 May 2010. 603
604
Fig. 7.The same as Fig. 6 for 16 May 2010.
4.1.2 Aerosol extinction coefficient profiles
Given the AOT of the ash plumes, the AL measurements on12 and 16 May were converted into extinction coefficientsusing both the Klett (1985) backward algorithm and the di-chotomy approach presented in Chazette (2003) or Royer etal. (2010). The mean vertical profiles of aerosol extinctioncoefficient are given in Fig. 9. The vertical structure can becomplex as on 12 May with several maxima above 0.1 km−1.The maximum extinction coefficient in the vertical profile isgiven in Table 2 for each mean profile. The values are be-tween 0.15 and 0.44 km−1 for the plume-crown and the fila-ment of 12 May, respectively. The ash plume of 16 May has amaximumαa of 0.28 km−1. The statistic uncertaintyεα andthe absolute value of the biasδα (R = 1.05) are lower than6 and 24 %, respectively (Tables 2 and 3). The relative error1α is 7 % for the 16 May and between 10 and 25 % for the12 May (Table 4).
4.1.3 Backscatter-to-Extinction Ratio in the plume
The BER retrieved from AL measurements are also given inTable 2. It has been assumed to be constant in the ash layerfor each mean vertical profile. The values between 0.020 and0.023 sr−1 (LR between 43 and 50 sr) are very close to thosemeasured with ground-based Raman lidar near Paris with0.021 sr−1 (LR ∼ 48 sr, Royer et al., 2010) except for the fil-ament (BER= 0.027 sr−1 or LR= 37 sr). This may be due tothe presence of ice-nuclei within the ash filament as observedfrom airborne in situ measurements over UK by Schumann etal. (2011). Unfortunately, this last point is difficult to verifyduring our flights.
The LR in the ash plume retrieved in this study is close tothe LR values of 50 ± 5 assessed by Ansmann et al. (2010)for Munich. The same authors measured LR= 60 ± 5 sr atLeipzig, which is larger than our values. The statistic error
Atmos. Chem. Phys., 12, 7059–7072, 2012 www.atmos-chem-phys.net/12/7059/2012/
P. Chazette et al.: French airborne lidar measurements for Eyjafjallajokull ash plume survey 7067
Page 36 sur 38
605
606
607
608
Figure 8: Range-corrected lidar signal on 12 and 16 May 2010: top-left panel for the plume of 609
12 May (19.545°O 44.849 N, 16:27 GMT), top-right panel for the plume crown of 12 May 610
(18.532°O 44.860 N, 16:15 GMT), bottom-left panel for the filament of 12 May (11.098°O 611
43.851 N, 15:30 GMT), and bottom-right panel for the plume of 16 May (1.706°O 53.858 N, 612
18:42 GMT). The molecular contributions have been simulated for each normalization 613
altitude, and are also given in each figure. 614
615
616
Fig. 8. Range-corrected lidar signal on 12 and 16 May 2010: top-left panel for the plume of 12 May (−19.545◦ E 44.849◦ N, 16:27GMT), top-right panel for the plume crown of 12 May (−18.532◦ E 44.860◦ N, 16:15 GMT), bottom-left panel for the filament of 12 May(−11.098◦ E 43.851◦ N, 15:30 GMT), and bottom-right panel for the plume of 16 May (−1.706◦ E 53.858◦ N, 18:42 GMT). The molecularcontributions have been simulated for each normalization altitude, and are also given in each figure.
(εBER) on the BER is low, between 2 and 5 % due to the sig-nal noise and between 2 and 3 % due to the characterizationof the Brewster plate transmissions. Nevertheless, the bias(δBER) linked toR = 1.05 may significantly overestimate theBER by 26 % for the lower AOT of 0.08 (Table 3). Note thata value ofR = 1.09 significantly increases the bias on eachparameters as shown Table 3. The total relative error1BERon BER is between 8 and 27 % for 16 and 12 May, respec-tively (Table 4).
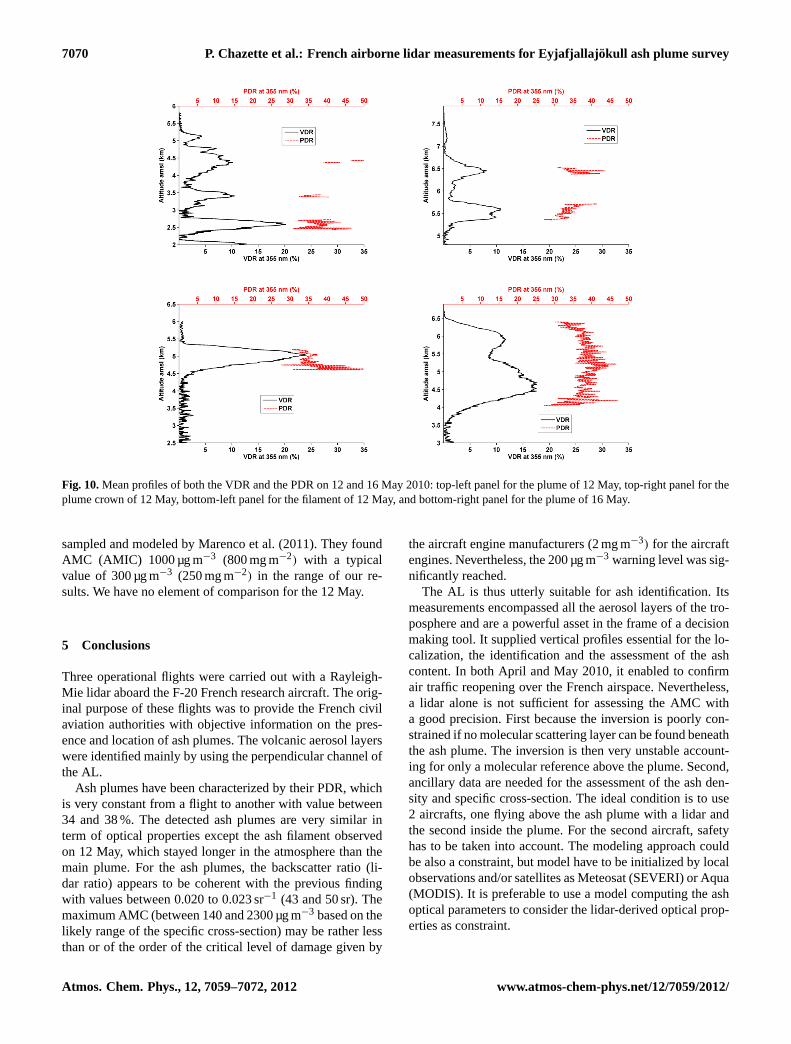
4.1.4 Depolarization measurements
The last optical parameter that we estimated is the PDR(Eq. 11) derived from the VDR (Eq. 3). Figure 10 givesthe mean vertical profiles of both the VDR and the PDRwhen there is enough SNR. Marenco and Hogan (2011) per-formed ground-based elastic-backscattering lidar measure-ments at Exeter, United Kingdom, on 16 and 18 April 2010.They found VDR between 10 and 20 % in agreement withthe value shown Fig. 10. We have found mean values be-tween 9 and 16 % (Table 2). When working at the wavelengthof 355 nm where molecular scattering is high, the most rep-
resentative depolarization ratio is the PDR. Looking at thePDR profiles, we can see that the mean value is very stable,between 34 ± 3 % and 38 ± 3 % (Table 2). These values arewithin the range derived by Chazette et al. (2012) from GBLmeasurements. They are similar with those of Ansmann etal. (2011) or Gasteiger et al. (2011) who retrieved mean PDRat the same wavelength of 35–40 % and 35.5 ± 4.4 %, respec-tively. The ash plumes may evolve during transport by parti-cle settling and their optical properties may be affected. Notethat for the ash plume observed during the flights in May, thetime needed to reach the measurement point after emissionin the atmosphere was less than 3 days (Figs. 5 and 7) andthe plume composition could be different from April includ-ing more or less sulfate aerosols. Sulfate particles modify theoptical properties of the ash plumes, but this is somethingthat we cannot verify during ours flights at∼ 10 km a.m.s.l.Moreover, the ash plume is very heterogeneous and the ashproperties could be different from an eruption to another.This may explain that the ash optical properties are not nec-essarily the same from a location to another, and from a dateto another. It is also important to note that the uncertainties
www.atmos-chem-phys.net/12/7059/2012/ Atmos. Chem. Phys., 12, 7059–7072, 2012

7068 P. Chazette et al.: French airborne lidar measurements for Eyjafjallajokull ash plume survey
Table 3.Relative bias (δx) linked to the presence of aerosol at the two altitudes of normalizationza andzb. When aerosols are present, thescattering ratioR is higher than 1. The gray areas are for assessments withR(zb) = 1.09, which are not took into account in the error budget.The values in bold are those considered in the global error budget.
16/05 12/05 Plume 12/05 Plume-crown 12/05 Filament
δAOT 7 % 13 % 31 % 15 %R(za) = 1 δBER −2 % −5 % −26 % −10 %R(zb) = 1.05 δPDR −3 % −5 % −4 % −10 %
δα 6 % 9 % 24 % −10 %
δAOT 12 % 22 % 53 % 26 %R(za) = 1 δBER −4 % −10 % −66 % −20 %R(zb) = 1.09 δPDR −5 % −10 % −9 % −33 %
δα 10 % 17 % 45 % 20 %
δAOT −3 % −4 % −12 % −5 %R(za) = 1.02 δBER 7 % 19 % 17 % 8 %R(zb) = 1 δPDR −5 % −5 % −3 % −1 %
δα −6 % −18 % −18 % −7 %
δAOT 4 % 8 % 16 % 9 %R(za) = 1.02 δBER 5 % 15 % 2 % 1 %R(zb) = 1.05 δPDR −8 % −10 % −9 % −10 %
δα 1 % −9 % 5 % 3 %
δAOT 9 % 17 % 39 % 20 %R(za) = 1.02 δBER 3 % 12 % −21 % −8 %R(zb) = 1.09 δPDR −10 % −15 % −15 % −29 %
δα 5 % −1 % 27 % 12 %
Table 4.Total relative error on the ash optical parameters. The uncertainties have been considered to be independent. The ranges of the ashmass concentration (AMC) and ash mass integrated concentration (AMIC) are also given accounting for the previous errors. The relativeuncertainties on AMC and AMIC are the same as max(αa) and AOT, respectively.
16/05 12/05 Plume 12/05 Plume-crown 12/05 Filament
Total relative error
1Rc 9 % 6 % 12 % 9 %1VDR 8 % 6 % 10 % 9 %1AOT 7 % 22 % 31 % 15 %1BER 8 % 19 % 27 % 10 %1PDR 12 % 18 % 26 % 16 %1α 7 % 18 % 25 % 10 %
Range of AMC (µg m−3) From max(αa) 250 to 1500 370 to 2160 140 to 790 400 to 2300
Range of AMIC (mg m−2) From AOT 310 to 1800 170 to 1000 70 to 420 145 to 840
onT//
1,2 may significantly affect VDR (6 to 10 %) and PDR (9to 24 %) as shown Table 2. The molecular scattering assump-tion in the reference altitudesza andzb is also important andmay lead to an underestimation of PDR by 15 % (Table 3).Hence, the relative error1PDR on PDR is between∼ 12 (16May) and∼ 26 %.
4.2 Ash mass concentration
A mass concentration estimate is a major requirement foraviation and for modeling purposes (e.g. Stohl et al., 2011).Nevertheless, no measurement of the ash microphysical
properties was performed by the F-20 because the flightswere dedicated to the ash plume tracking by the AL. There-fore we use the specific cross section (σs) of ash assessedfrom the previous literature on the Eyjafjallajokull volcano.Table 5 summarizes these values, which are widely dis-persed, between 0.19 and 1.5 m2 g−1. The higher values arefrom Hogan et al. (2012), Gasteiger et al. (2011) and John-son et al. (2011), and are between 1 and 1.5 m2 g−1, 0.43 and1.15 m2 g−1, and 0.45 and 1.06 m2 g−1, respectively. Notethat σs is close to 1.1 m2 g−1 for dust particles originatingfrom Sahara (e.g. Raut and Chazette, 2009), henceσs for
Atmos. Chem. Phys., 12, 7059–7072, 2012 www.atmos-chem-phys.net/12/7059/2012/

P. Chazette et al.: French airborne lidar measurements for Eyjafjallajokull ash plume survey 7069
Table 5.Specific cross-section (σs) given in the literature.
Reference σs (m2 g−1) Wavelength (nm) Location and period of measurements
Ansmann et al. (2010) 0.43 355 and 532 Leipzig and Munich, Germany April 2010Gasteiger et al. (2011) 0.43–1.15 532 Munich, Germany April 2010Ansmann et al. (2011) 0.66 532 Central Europe April and May 2010Hogan et al. (2012) 1.25 ± 0.25 340, 355, 1020 and 1500 UK April 2010Johnson et al. (2011) 0.45–1.06 355–680 UK April and May 2010Chazette et al. (2011) 0.19 ± 0.03–0.29 ± 0.04 355 Paris, France April 2010
Page 37 sur 38
617
618
Figure 9: Mean profiles of the aerosol extinction coefficient on 12 and 16 May 2010: top-left 619
panel for the plume of 12 May, top-right panel for the plume crown of 12 May, bottom-left 620
panel for the filament of 12 May, and bottom-right panel for the plume of 16 May. The 621
standard deviation (rms) linked to the retrieval uncertainty is also given by the turquoise-blue 622
area. The BER used for the inversion are also indicated. Note that the dynamics of figures are 623
different. 624
625
Fig. 9. Mean profiles of the aerosol extinction coefficient on 12 and 16 May 2010: top-left panel for the plume of 12 May, top-right panelfor the plume crown of 12 May, bottom-left panel for the filament of 12 May, and bottom-right panel for the plume of 16 May. The standarddeviation (rms) linked to the retrieval uncertainty is also given by the turquoise-blue area. The BER used for the inversion are also indicated.Note that the dynamics of figures are different.
dust aerosol can be considered as the upper boundary forash. The lower value is given by Chazette et al. (2012) forash plume over the Paris area withσs = 0.19–0.29 m2 g−1.As shown by the previous authors, these values leads to co-herent comparison with the Eulerian model Polair3D trans-port model. Intermediate values are given by Ansmann etal. (2010) withσs∼ 0.43 m2 g−1, and Ansmann et al. (2011)with σs∼ 0.66 m2 g−1 from the coupling between sunpho-tometer and a GBL.
Using the specific cross-sections between 0.19 and1.1 m2 g−1 in the equation
AMC =max(αa)
σsand AMIC=
AOT
σs, (12)
we assessed both the ash mass concentrations (AMC) cor-responding to the maximum ofαa and the ash mass inte-grated concentration (AMIC) across the plumes. The valuesare reported in Table 4. For each boundary of the AMC andAMIC, the relative uncertainties are the same as max(αa) andAOT, respectively. For 12 May, the AMC (AMIC) is esti-mated between 140 and 2160 µg m−3 (70 and 1000 mg m−2)
in the plume, and between 400 and 2300 µg m−3 (145 and840 mg m−2) in the filament. Similar values are retrieved for16 May with an AMC between 250 and 1500 µg m−3, and anAMIC between 310 and 1800 mg m−2.
For 16 May, the ash were injected in the troposphere be-tween the 13 and 14 May (Fig. 7) and this plume has been
www.atmos-chem-phys.net/12/7059/2012/ Atmos. Chem. Phys., 12, 7059–7072, 2012
7070 P. Chazette et al.: French airborne lidar measurements for Eyjafjallajokull ash plume survey
Page 38 sur 38
626
627
628
Figure 10: Mean profiles of both the VDR and the PDR on 12 and 16 May 2010: top-left 629
panel for the plume of 12 May, top-right panel for the plume crown of 12 May, bottom-left 630
panel for the filament of 12 May, and bottom-right panel for the plume of 16 May. 631
632
Fig. 10.Mean profiles of both the VDR and the PDR on 12 and 16 May 2010: top-left panel for the plume of 12 May, top-right panel for theplume crown of 12 May, bottom-left panel for the filament of 12 May, and bottom-right panel for the plume of 16 May.
sampled and modeled by Marenco et al. (2011). They foundAMC (AMIC) 1000 µg m−3 (800 mg m−2) with a typicalvalue of 300 µg m−3 (250 mg m−2) in the range of our re-sults. We have no element of comparison for the 12 May.
5 Conclusions
Three operational flights were carried out with a Rayleigh-Mie lidar aboard the F-20 French research aircraft. The orig-inal purpose of these flights was to provide the French civilaviation authorities with objective information on the pres-ence and location of ash plumes. The volcanic aerosol layerswere identified mainly by using the perpendicular channel ofthe AL.
Ash plumes have been characterized by their PDR, whichis very constant from a flight to another with value between34 and 38 %. The detected ash plumes are very similar interm of optical properties except the ash filament observedon 12 May, which stayed longer in the atmosphere than themain plume. For the ash plumes, the backscatter ratio (li-dar ratio) appears to be coherent with the previous findingwith values between 0.020 to 0.023 sr−1 (43 and 50 sr). Themaximum AMC (between 140 and 2300 µg m−3 based on thelikely range of the specific cross-section) may be rather lessthan or of the order of the critical level of damage given by
the aircraft engine manufacturers (2 mg m−3) for the aircraftengines. Nevertheless, the 200 µg m−3 warning level was sig-nificantly reached.
The AL is thus utterly suitable for ash identification. Itsmeasurements encompassed all the aerosol layers of the tro-posphere and are a powerful asset in the frame of a decisionmaking tool. It supplied vertical profiles essential for the lo-calization, the identification and the assessment of the ashcontent. In both April and May 2010, it enabled to confirmair traffic reopening over the French airspace. Nevertheless,a lidar alone is not sufficient for assessing the AMC witha good precision. First because the inversion is poorly con-strained if no molecular scattering layer can be found beneaththe ash plume. The inversion is then very unstable account-ing for only a molecular reference above the plume. Second,ancillary data are needed for the assessment of the ash den-sity and specific cross-section. The ideal condition is to use2 aircrafts, one flying above the ash plume with a lidar andthe second inside the plume. For the second aircraft, safetyhas to be taken into account. The modeling approach couldbe also a constraint, but model have to be initialized by localobservations and/or satellites as Meteosat (SEVERI) or Aqua(MODIS). It is preferable to use a model computing the ashoptical parameters to consider the lidar-derived optical prop-erties as constraint.
Atmos. Chem. Phys., 12, 7059–7072, 2012 www.atmos-chem-phys.net/12/7059/2012/
P. Chazette et al.: French airborne lidar measurements for Eyjafjallajokull ash plume survey 7071
Acknowledgements.The SAFIRE team is greatly acknowledgedfor its effectiveness in the implementation of research aircraft andits support for the integration of lidar and its participation in thedifferent flights. Xiao-Xia Shang, Fabien Marnas and Julien Totemsare also greatly acknowledged for their help for characterizingthe Brewster plates in laboratory. This work was supported by theCommissariata l’Energie Atomique (CEA). The “Centre Nationald’Etudes Spatiales” (CNES), Meteo-France and the “Institut desSciences de l’Univers” (INSU) supported the achievement of theairborne experience.
Edited by: G. Pappalardo
The publication of this article is financed by CNRS-INSU.
References
Ansmann, A., Tesche, M., Gross, S., Freudenthaler, V., Seifert, P.,Hiebsch, A., Schmidt, J., Wandinger, U., Mattis, I., Muller, D.,and Wiegner, M.: The 16 April 2010 major volcanic ash plumeover central Europe: EARLINET lidar and AERONET photome-ter observations at Leipzig and Munich, Germany, Geophys. Res.Lett., 37, L13810,doi:10.1029/2010GL043809, 2010.
Ansmann, A., Tesche, M., Seifert, P., Groß, S., Freudenthaler, V.,Apituley, A., Wilson, K. M., Serikov, I., Linne, H., Heinold, B.,Hiebsch, A., Schnell, F., Schmidt, J., Mattis, I., Wandinger, U.,and Wiegner, M.: Ash and fine-mode particle mass profiles fromEARLINET- AERONET observations over central Europe afterthe eruptions of the Eyjafjallajokull volcano in 2010, J. Geophys.Res., 116, D00U02,doi:10.1029/2010JD015567, 2011.
Berthier, S., Chazette, P., Couvert, P., Pelon, J., Dulac,F., Thieuleux, F., Moulin, C., and Pain T.: Desert dustaerosol columnar properties over ocean and continentalAfrica from Lidar in-Space Technology Experiment (LITE)and Meteosat synergy, J. Geophys. Res., 111, D21202,doi:10.1029/2005JD006999, 2006.
Bukowiecki, N., Zieger, P., Weingartner, E., Juranyi, Z., Gysel, M.,Neininger, B., Schneider, B., Hueglin, C., Ulrich, A., Wichser,A., Henne, S., Brunner, D., Kaegi, R., Schwikowski, M., To-bler, L., Wienhold, F. G., Engel, I., Buchmann, B., Peter, T., andBaltensperger, U.: Ground-based and airborne in-situ measure-ments of the Eyjafjallajokull volcanic aerosol plume in Switzer-land in spring 2010, Atmos. Chem. Phys., 11, 10011–10030,doi:10.5194/acp-11-10011-2011, 2011.
Collis, R. T. H. and Russell, P. B.: Lidar measurement of particlesand gases by elastic backscattering and differential absorption inLaser Monitoring of the Atmosphere, edited by: Hinkley, E. D.,71–152, Springer-Verlag, New York, 1976.
Chazette, P.: The monsoon aerosol extinction properties at Goa dur-ing INDOEX as measure with lidar, J. Geophys. Res., 108, 4187,doi:10.1029/2002JD002074, 2003.
Chazette, P., David, C., Lefrere, J., Godin, S., Pelon, J., and Megie,G.: Comparative lidar study of the optical, geometrical, and dy-namical properties of stratospheric post-volcanic aerosols, fol-lowing the eruption of El Chichon and Mount Pinatubo, J. Geo-phys. Res., 100, 23195–23207, 1995.
Chazette P., Pelon, J., and Megie, G.: Determination of structuralparameters of atmospheric scattering layer using spacebornebackscatter lidar, Appl. Opt., 40, 3428–3440, 2001.
Chazette, P., Sanak., J., and Dulac, F.: New Approach for AerosolProfiling with a Lidar Onboard an Ultralight Aircraft: Applica-tion to the African Monsoon Multidisciplinary Analysis, Envi-ron. Sci. Technol., 41, 8335–8341, 2007.
Chazette, P., Bocquet, M., Royer, P., Winiarek, V., Raut, J.-C.,Labazuy, P., Gouhier, M., Lardier, M., and Cariou, J.-P.: Eyjafjal-lajokull ash concentrations derived from both lidar and modeling,J. Geophys. Res., 117, D00U14,doi:10.1029/2011JD015755,2012.
Collis, R. T. H. and Russell, P. B.: Lidar measurement of particlesand gases by elastic backscattering and differential absorption inLaser Monitoring of the Atmosphere, edited by: Hinkley, E. D.,71–152, Springer-Verlag, New York, 1976.
Gasteiger, J., Groß, S., Freudenthaler, V., and Wiegner, M.: Vol-canic ash from Iceland over Munich: mass concentration re-trieved from ground-based remote sensing measurements, At-mos. Chem. Phys., 11, 2209–2223,doi:10.5194/acp-11-2209-2011, 2011.
Gertisser, R.: Eyjafjallajokull volcano causes widespread disruptionto European air traffic, Geol. Today, 26, 94–95, 2010.
Hogan, R. J., Haywood, J. M., Westbrook, C. D., Dacre, H. F.,Marenco, F., O’Connor, E. J., Johnson, B. T., Wrench, C. L., andBelcher, S. E.: Combined lidar and sunphotometer retrievals ofash particle size and mass concentration from the Eyjafjallajokullvolcano, J. Geophys. Res., in press, 2012.
Jager, H.: The Pinatubo eruption cloud observed by lidar atGarmisch-Partenkirchen, Geophys. Res. Lett., 19, 191–194,1992.
Johnson, B., Turnbull, K., Dorsey, J., Baran, A. J., Ulanowski, Z.,Hesse, E., Cotton, R., Brown, P. R. A., Burgess, R., Capes, G.,Webster, H., Woolley, A., Rosenberg, P., and Haywood, J. M.: Insitu observations of volcanic ash clouds from the FAAM aircraftduring the eruption of Eyjafjallajokull in 2010, J. Geophys. Res.,117, D00U24,doi:10.1029/2011JD016760, 2011.
King, L. V.: On the complex anisotropic molecule in relation to thedispersion and scattering of light, Proceedings of the Royal So-ciety of London, Series 1, 104, 333–357, 1923.
Klett, J. D.: Lidar inversion with variable backscatter/extinction ra-tios, Appl. Optics, 24, 1638–1643, 1985.
Marenco, F. and Hogan, R.: Determining the contribution of vol-canic ash and boundary-layer aerosol in backscatter lidar returns:A three-component atmosphere approach, J. Geophys. Res., 116,D00U06,doi:10.1029/2010JD015415, 2011.
Marenco, F., Johnson, B., Turnbull, K., Newman, S., Haywood, J.,Webster, H., and Ricketts, H.: Airborne lidar observations of the2010 Eyjafjallajokull volcanic ash plume, J. Geophys. Res., 116,D00U05,doi:10.1029/2011JD016396, 2011.
Mattis, I., Siefert, P., Muller, D., Tesche, M., Hiebsch, A., Kanitz,T., Schmidt, J., Finger, F., Wandinger, U., and Ansmann, A.: Vol-canic aerosol layers observed with multiwavelength Raman li-dar over central Europe in 2008–2009, J. Geophys. Res., 115,
www.atmos-chem-phys.net/12/7059/2012/ Atmos. Chem. Phys., 12, 7059–7072, 2012

7072 P. Chazette et al.: French airborne lidar measurements for Eyjafjallajokull ash plume survey
D00L04,doi:10.1029/2009JD013472, 2010.Measures, R. M.: Laser remote sensing: Fundamentals and Appli-
cations, Wiley & Sons, New York, 1994.Millington, S. C., Saunders, R., Francis, P., and Webster, H. N.:
Simulated volcanic ash imagery: A method to compare NAMEash concentration forecasts with SEVIRI imagery for the Ey-jafjallajokull eruption in 2010, J. Geophys. Res., 117, D00U17,doi:10.1029/2011JD016770, 2012.
Nicolet, M.: On the molecular scattering in the terrestrial atmo-sphere, Planet. Space Sci., 32, 1467–1468,doi:10.1016/0032-0633(84)90089-8, 1984.
Osborn, M. T., Winker, D. M., Woods, D. C., DeCoursey, R. J.,and Trepte, C. R.: Evolution of the Pinatubo volcanic cloud overHampton, Virginia, Geophys. Res. Lett., 22, 1101–1104, 1995.
Pappalardo, G., Amodeo, A., Mona, L., Pandolfi, M., Pergola, N.,and Cuomo, V.: Raman lidar observation of aerosol emitted dur-ing the 2002 Etna eruption, Geophys. Res. Lett., 31, L05120,doi:10.1029/2003GL019073, 2004.
Prata, A. J., Gangale, G., Clarisse, L., and Karagulian, F.: Ash andsulfur dioxide in the 2008 eruptions of Okmok and Kasatochi:Insights from high spectral resolution satellite measurements,J. Geophys. Res., 115, D00L18,doi:10.1029/2009JD013556,2010.
Raut, J.-C. and Chazette, P.: Assessment of vertically-resolvedPM10 from mobile lidar observations, Atmos. Chem. Phys., 9,8617–8638,doi:10.5194/acp-9-8617-2009, 2009.
Rosen, J. M. and Hofmann, D. J.: Optical modeling of stratosphericaerosols: present status, Appl. Opt., 25, 410–419, 1986.
Royer, P., Chazette, P., Lardier, M., and Sauvage, L.: Aerosol con-tent survey by mini-N2-Raman lidar: Application to local andlong-range transport aerosols, Atmos. Environ., 45, 7487–7495,doi:10.1016/j.atmosenv.2010.11.001, 2011.
Sassen, K., Zhu, J., Webley, P., Dean, K., and Cobb, P.: Vol-canic ash plume identification using polarization lidar: Au-gustine eruption, Alaska, Geophys. Res. Lett., 34, L08803,doi:10.1029/2006GL027237, 2007.
Schumann, U., Weinzierl, B., Reitebuch, O., Schlager, H., Minikin,A., Forster, C., Baumann, R., Sailer, T., Graf, K., Mannstein, H.,Voigt, C., Rahm, S., Simmet, R., Scheibe, M., Lichtenstern, M.,Stock, P., Ruba, H., Schauble, D., Tafferner, A., Rautenhaus, M.,Gerz, T., Ziereis, H., Krautstrunk, M., Mallaun, C., Gayet, J.-F., Lieke, K., Kandler, K., Ebert, M., Weinbruch, S., Stohl, A.,Gasteiger, J., Groß, S., Freudenthaler, V., Wiegner, M., Ansmann,A., Tesche, M., Olafsson, H., and Sturm, K.: Airborne observa-tions of the Eyjafjalla volcano ash cloud over Europe during airspace closure in April and May 2010, Atmos. Chem. Phys., 11,2245–2279,doi:10.5194/acp-11-2245-2011, 2011.
Sigmundsson, F., Hreinsdottir, S., Hooper, A., Arnadottir, T., Ped-ersen, R., Roberts, M. J., Oskarsson, N., Auriac, A., Decriem,J., Einarsson, P., Geirsson, H., Hensch, M., Ofeigsson, B. G.,Sturkell, E., Sveinbjornsson, H., and Feigl, K. L.: Intrusion trig-gering of the 2010 Eyjafjallajokull explosive eruption, Nature,468, 426–430, 2000.
Stohl, A., Prata, A. J., Eckhardt, S., Clarisse, L., Durant, A., Henne,S., Kristiansen, N. I., Minikin, A., Schumann, U., Seibert, P.,Stebel, K., Thomas, H. E., Thorsteinsson, T., Tørseth, K., andWeinzierl, B.: Determination of time- and height-resolved vol-canic ash emissions and their use for quantitative ash disper-sion modeling: the 2010 Eyjafjallajokull eruption, Atmos. Chem.Phys., 11, 4333–4351,doi:10.5194/acp-11-4333-2011, 2011.
Thomas, H. E. and Watson, I. M.: Observations of volcanic emis-sions from space: Current and future perspectives, Nat. Hazards,54, 323–354, 2010.
Wang, X., Boselli, A., D’Avino, L., Pisani, G., Spinelli, N.,Amodeo, A., Chaikovsky, A., Wiegner, M., Nickovic, S., Pa-payannis, A., Perrone, M. R., Rizi, V., Sauvage, L., and Stohl,A.: Volcanic dust characterization by EARLINET during Etna’seruptions in 2001–2002, Atmos. Environ., 42, 893–905, 2008.
Winker, D. M. and Osborn, M. T.: Airborne Lidar Observations ofthe Pinatubo Volcanic Plume, Geophys. Res. Lett., 19, 167–170,1992.
Atmos. Chem. Phys., 12, 7059–7072, 2012 www.atmos-chem-phys.net/12/7059/2012/