frequency response standard background document response project 200712...characteristic survey...
TRANSCRIPT
3353 Peachtree Road NE
Suite 600, North Tower Atlanta, GA 30326
404-446-2560 | www.nerc.com
Frequency Response Standard Background Document January, 2012
1 Frequency Response Standard Background Document – January 2012
Table of Contents
Table of Contents ............................................................................................................................ 1
Introduction .................................................................................................................................... 2
Background ..................................................................................................................................... 2
Rationale by Requirement .............................................................................................................. 8
Requirement 1 ........................................................................................................................ 8
Background and Rationale ...................................................................................................... 8
Requirement 2 ...................................................................................................................... 14
Background and Rationale .................................................................................................... 14
Requirement 3 ...................................................................................................................... 16
Requirement 4 ...................................................................................................................... 16
Background and Rationale .................................................................................................... 17
Requirement 5 ...................................................................................................................... 17
Background and Rationale ....................................................... Error! Bookmark not defined. How this Standard Meets the FERC Order 693 Directives ............................................................ 18
FERC Directive ........................................................................................................................... 18
1. Levels of Non-Compliance ................................................................................................. 18
2. Determine the appropriate periodicity of frequency response surveys necessary to ensure that Requirement R2 and other Requirements of the Reliability Standard are met ... 18
3. Define the necessary amount of Frequency Response needed for Reliable Operation for each Balancing Authority with methods of obtaining and measuring that the frequency response is achieved ................................................................................................................. 18
Necessary Amount of Frequency Response ......................................................................... 18
Methods of Obtaining Frequency Response ........................................................................ 19
Measuring that the Frequency Response is Achieved .......................................................... 19
Going Beyond the Directive ...................................................................................................... 20
Future Work .............................................................................................................................. 20
Good Practices and Tools .............................................................................................................. 21
Background ............................................................................................................................... 21
Identifying and Estimating Frequency Responsive Reserves ................................................... 21
Using FRS Form 1 Data .............................................................................................................. 22
Tools .......................................................................................................................................... 22
Field Trial ....................................................................................................................................... 23

2 Frequency Response Standard Background Document – January 2012
Introduction This document provides background on the development, testing and implementation of BAL-003-1 - Frequency Response Standard (FRS). The intent is to explain the rationale and considerations for the Requirements and their associated compliance information. The document also provides good practices and tips for Balancing Authorities with regard to Frequency Response.
In Order No. 693, the FERC directed additional changes to BAL-003-0.1b. This document explains how those directives are met by BAL-003-1.
The original Standards Authorization Request (SAR), finalized on June 30, 2007, assumed there was adequate Frequency Response in all the North American Interconnections. The goal of the SAR was to update the Standard to make the measurement process more objective and to provide this objective data to Planners and Operators for improved modeling. The improved models will improve understanding of the trends in Frequency Response to determine if reliability limits were being approached. The Standard would also lay the process groundwork for a transition to a performance-based Standard if reliability limits were approached.
This document will be periodically updated by the FRS Drafting Team until the Standard is approved (expected to occur during Spring of 2012). Once approved, this document will then be maintained and updated by the ERO and the NERC Resources Subcommittee to be used as a reference and training resource.
Background Most system operators have a good general understanding of frequency control and Bias Setting as outlined in the balancing standards and the references in the NERC Operating Manual. This section discusses the different components of frequency control. Frequency control can be divided into four overlapping windows of time as outlined below.
Primary Frequency Control (Frequency Response) – Actions provided by the Interconnection to arrest and stabilize frequency in response to frequency deviations. Primary Control comes from automatic generator governor response, load response (typically from motors), and other devices that provide an immediate response based on local (device-level) control systems.
Secondary Frequency Control – Actions provided by an individual BA or its Reserve Sharing Group to correct the resource – load unbalance that created the original frequency deviation, which will restore both Scheduled Frequency and Primary Frequency Response. Secondary Control comes from either manual or automated dispatch from a centralized control system.
Tertiary Frequency Control – Actions provided by Balancing Authorities on a balanced basis that are coordinated so there is a net zero effect on ACE. Examples of Tertiary Control

3 Frequency Response Standard Background Document – January 2012
include dispatching generation to serve native load; economic dispatch; dispatching generation to affect Interchange; and re-dispatching generation. Tertiary Control actions are intended to replace Secondary Control Response by reconfiguring reserves.
Time Control includes small offsets to scheduled frequency to keep long term average frequency at 60 Hz.
Primary Frequency Response is the first stage of overall frequency control and is the response of resources and load to a locally sensed change in frequency to arrest that change in frequency. Primary Frequency Response is automatic and is not driven by any centralized system and begins within seconds rather than minutes. Different resources, loads, and systems provide Primary Frequency Response with different response times, based on current system conditions such as total resource/load and their respective mix.
The NERC Glossary of Terms defines Frequency Response as:
(Equipment) The ability of a system or elements of the system to react or respond to a change in system frequency.
(System) The sum of the change in demand, plus the change in generation, divided by the change in frequency, expressed in megawatts per 0.1 Hertz (MW/0.1 Hz).
As noted above, Frequency Response is the characteristic of load and generation within Balancing Authorities and Interconnections that reacts or responds to changes in load-resource balance. Because the loss of a large generator is much more likely than a sudden loss of an equivalent amount of load, Frequency Response is typically discussed in the context of a loss of a large generator.
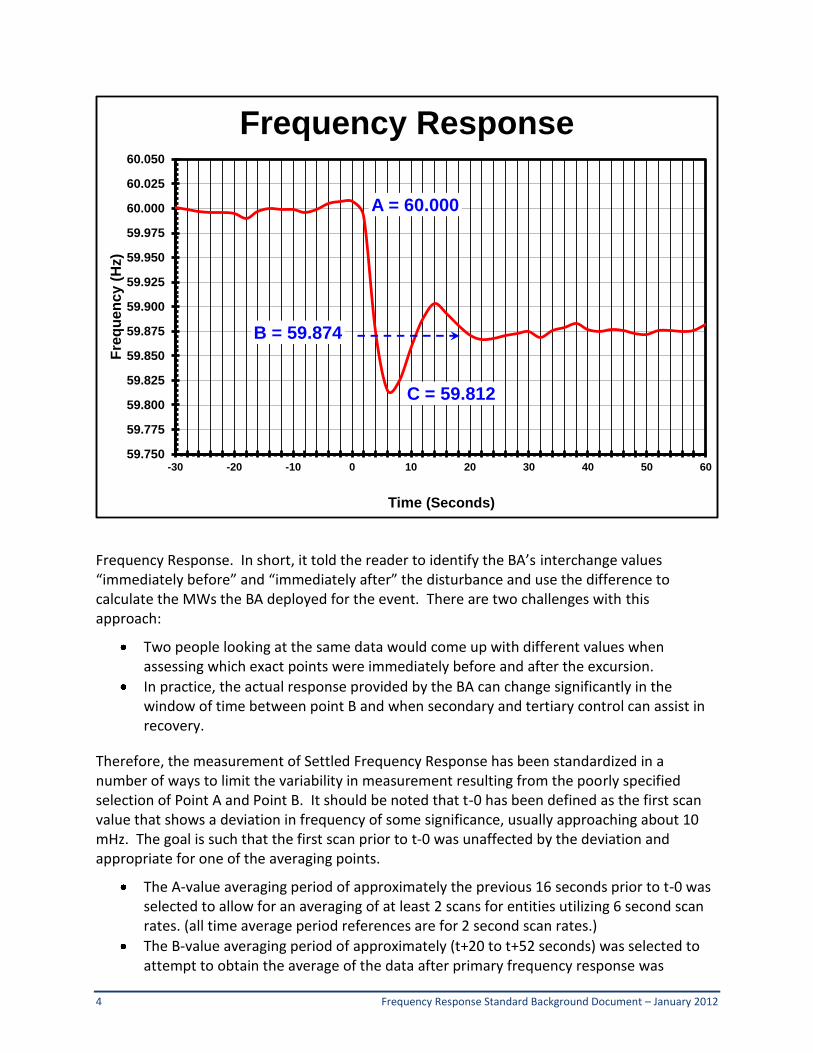
The classic Frequency Response points A, C, and B, shown in Fig. 1 Frequency Response Characteristic, are used for this measurement as found in the Frequency Response Characteristic Survey Training Document within the NERC operating manual, whose most recent copy can be found at http://www.nerc.com/files/opman_7-1-11.pdf. This traditional Frequency Response measure has recently been more specifically named Settled Frequency Response. Settled Frequency Response has been used because it provides the best Frequency Response measure to estimate the Frequency Bias Setting in Tie-line Bias Control based Automatic Generation Control Systems. However, the industry has recognized that there is considerable variability in measurement resulting from the selection of Point A and Point B in the traditional measure making the traditional measurement method unsuitable as the basis for an enforceable reliability standard in the real world setting of multiple Balancing Authority interconnections.
Measuring an Interconnection’s Frequency Response is straightforward and fairly accurate. All that’s needed to make the calculation is to know the size of a given contingency (MW), divide this value by the change in frequency and multiply the results by 10 since frequency response is expressed in MW/0.1Hz.
Measuring a BA’s frequency response is more challenging. Prior to BAL-003-1, NERC’s Frequency Response Characteristic Survey Training Document provided guidance to calculate
4 Frequency Response Standard Background Document – January 2012
Frequency Response. In short, it told the reader to identify the BA’s interchange values “immediately before” and “immediately after” the disturbance and use the difference to calculate the MWs the BA deployed for the event. There are two challenges with this approach:
Two people looking at the same data would come up with different values when assessing which exact points were immediately before and after the excursion.
In practice, the actual response provided by the BA can change significantly in the window of time between point B and when secondary and tertiary control can assist in recovery.
Therefore, the measurement of Settled Frequency Response has been standardized in a number of ways to limit the variability in measurement resulting from the poorly specified selection of Point A and Point B. It should be noted that t-0 has been defined as the first scan value that shows a deviation in frequency of some significance, usually approaching about 10 mHz. The goal is such that the first scan prior to t-0 was unaffected by the deviation and appropriate for one of the averaging points.
The A-value averaging period of approximately the previous 16 seconds prior to t-0 was selected to allow for an averaging of at least 2 scans for entities utilizing 6 second scan rates. (all time average period references are for 2 second scan rates.)
The B-value averaging period of approximately (t+20 to t+52 seconds) was selected to attempt to obtain the average of the data after primary frequency response was
A = 60.000
C = 59.812
B = 59.874
59.750
59.775
59.800
59.825
59.850
59.875
59.900
59.925
59.950
59.975
60.000
60.025
60.050
-30 -20 -10 0 10 20 30 40 50 60
Fre
qu
en
cy (
Hz)
Time (Seconds)
Frequency Response
5 Frequency Response Standard Background Document – January 2012
deployed and the transient completed(settled), but before significance influence of secondary control. Multiple periods were considered for averaging the B-value:
o 12 to 24 sec o 18 to 30 sec o 20 to 40 sec o 18 to 52 sec o 20 to 52 sec
It is necessary for all BAs from an interconnection to use the same averaging periods to provide consistent results. In addition, the SDT decided that until more experience is gained, it is also desirable for all interconnections to use the same averaging periods to allow comparison between interconnections.
The methods presented in this document only address the values required to calculate the frequency response associated with the frequency change between the initial frequency, A-Value, and the settling frequency, B-Value. No reasonable or consistent calculations can be made related to the arresting frequency, C-Value, using EMS scan rate data as long as 6-seconds or tie-line flow values associated with the minimum value of the frequency response characteristic (C-value) as measured at the BA level.
Both the calculation of the Frequency at Point A and the Frequency at Point B began with the assumption that a 6-second scan rate was the source of the data. Once the averaging periods for a 6-second scan rate were selected, the averaging periods for the other scan rates were selected to provide as much consistency as possible between BAs with different scan rates.
The Frequency at Point A was initially defined as the average of the two scans immediately prior to the frequency event. All other averaging periods were selected to be as consistent as possible with this 12 second average scan from the 6-second scan rate method. In addition, the Actual Net Interchange Immediately Before Disturbance is defined as the average of the same scans as used for the Point A frequency average.
The Frequency at Point B was then selected to be an average as long as the average of 6-second scan data as possible that would not begin until most of the hydro governor response had been delivered and would end before significant AGC recovery response had been initiated as indicated by a consistent frequency restoration slope. The Actual Net Interchange Immediately After Disturbance is defined as the average of the same scans as used for the Point B frequency average.
B Averaging Period Selection:
Experience from ERCOT and the field trail on other interconnections indicated that the 12 to 24 second and 18 to 30 second averaging periods were not suitable because they did not provide the consistency in results that the other averaging periods provided, and that the remaining measuring periods do not provide significantly different results from each other. The team believed that this was observed because the transients were not complete in all of the samples using these averaging periods.
6 Frequency Response Standard Background Document – January 2012
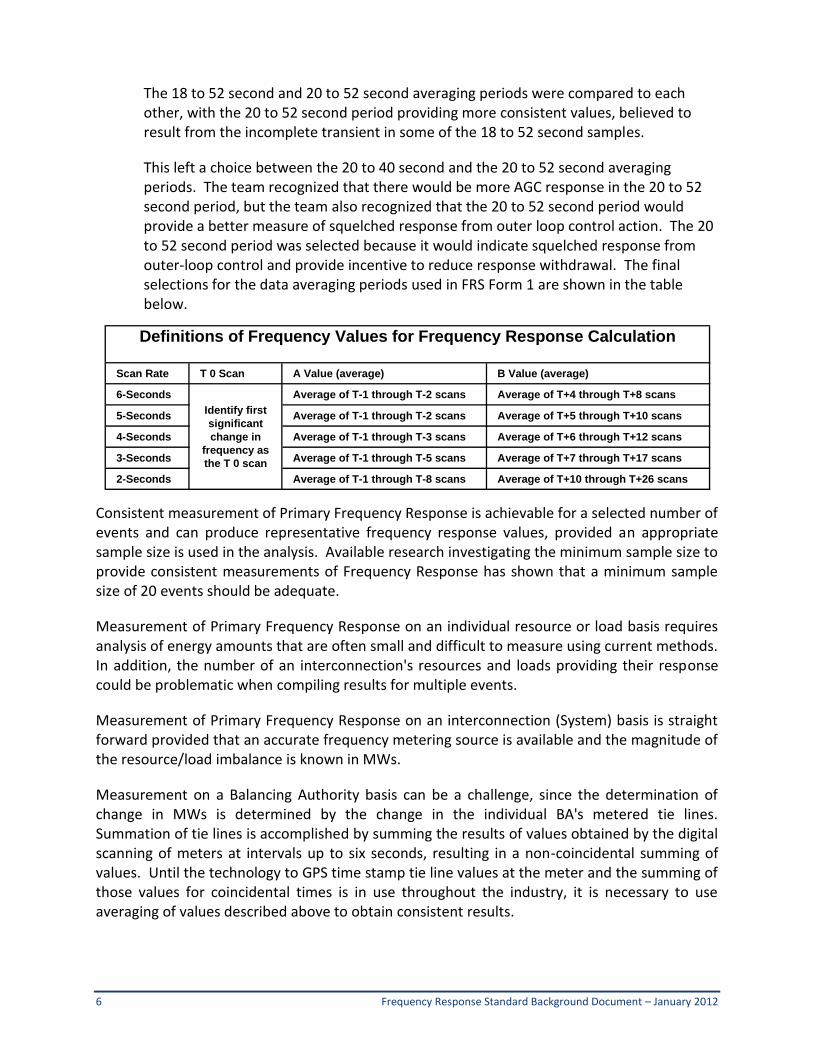
The 18 to 52 second and 20 to 52 second averaging periods were compared to each other, with the 20 to 52 second period providing more consistent values, believed to result from the incomplete transient in some of the 18 to 52 second samples.
This left a choice between the 20 to 40 second and the 20 to 52 second averaging periods. The team recognized that there would be more AGC response in the 20 to 52 second period, but the team also recognized that the 20 to 52 second period would provide a better measure of squelched response from outer loop control action. The 20 to 52 second period was selected because it would indicate squelched response from outer-loop control and provide incentive to reduce response withdrawal. The final selections for the data averaging periods used in FRS Form 1 are shown in the table below.
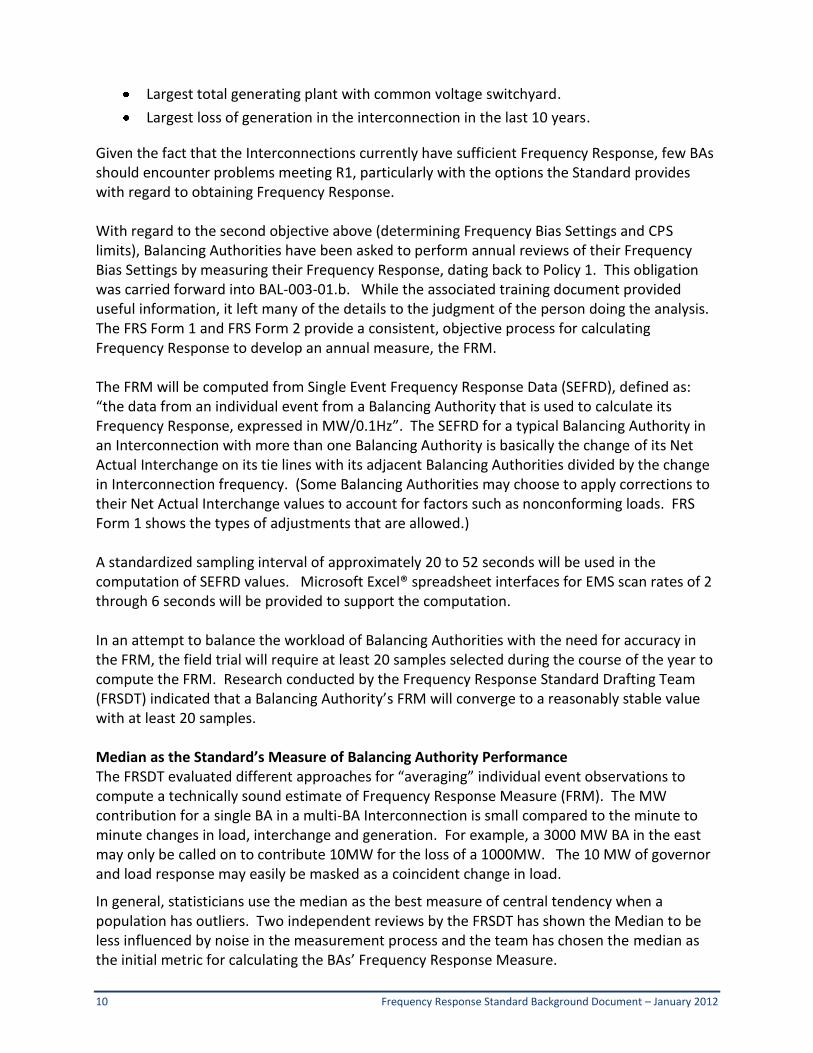
Consistent measurement of Primary Frequency Response is achievable for a selected number of events and can produce representative frequency response values, provided an appropriate sample size is used in the analysis. Available research investigating the minimum sample size to provide consistent measurements of Frequency Response has shown that a minimum sample size of 20 events should be adequate.
Measurement of Primary Frequency Response on an individual resource or load basis requires analysis of energy amounts that are often small and difficult to measure using current methods. In addition, the number of an interconnection's resources and loads providing their response could be problematic when compiling results for multiple events.
Measurement of Primary Frequency Response on an interconnection (System) basis is straight forward provided that an accurate frequency metering source is available and the magnitude of the resource/load imbalance is known in MWs.
Measurement on a Balancing Authority basis can be a challenge, since the determination of change in MWs is determined by the change in the individual BA's metered tie lines. Summation of tie lines is accomplished by summing the results of values obtained by the digital scanning of meters at intervals up to six seconds, resulting in a non-coincidental summing of values. Until the technology to GPS time stamp tie line values at the meter and the summing of those values for coincidental times is in use throughout the industry, it is necessary to use averaging of values described above to obtain consistent results.
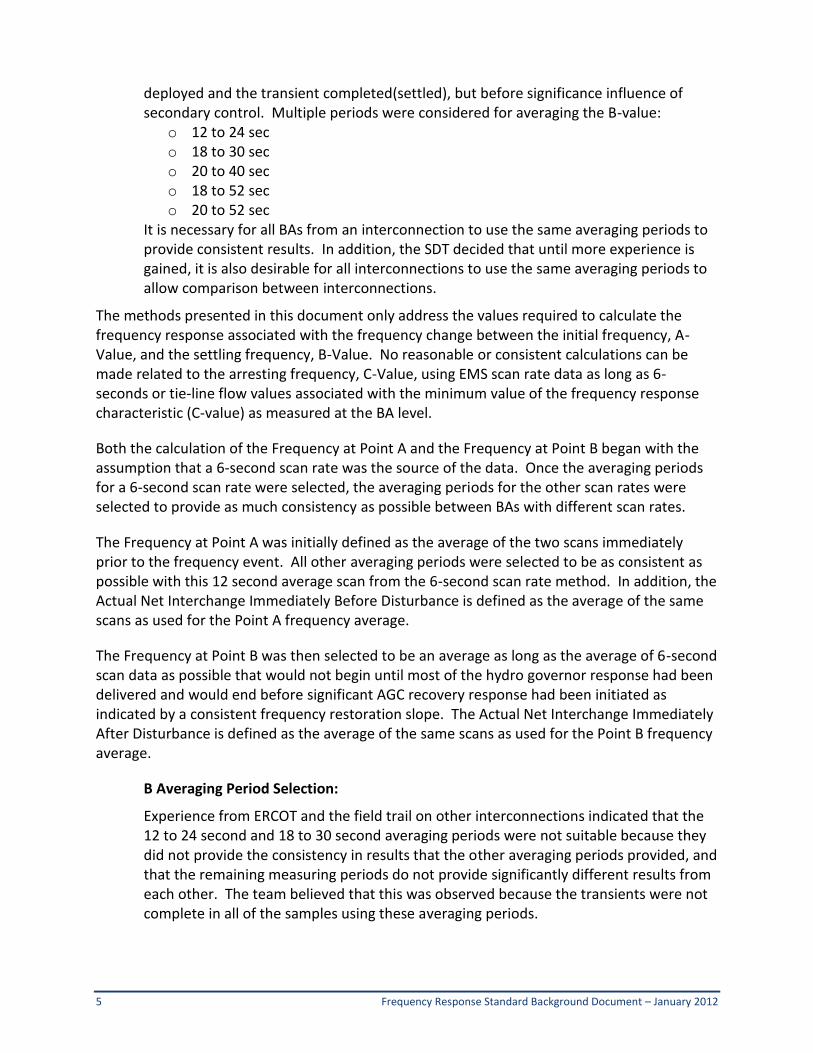
B Value (average)
5-Seconds
4-Seconds
3-Seconds
2-Seconds Average of T+10 through T+26 scans
Definitions of Frequency Values for Frequency Response Calculation
Average of T+7 through T+17 scans
Average of T+6 through T+12 scans
Average of T+5 through T+10 scans
Average of T+4 through T+8 scans
Average of T-1 through T-3 scans
Average of T-1 through T-5 scans
Average of T-1 through T-8 scans
Scan Rate
6-Seconds
T 0 Scan A Value (average)
Average of T-1 through T-2 scans
Average of T-1 through T-2 scansIdentify first
significant
change in
frequency as
the T 0 scan
7 Frequency Response Standard Background Document – January 2012
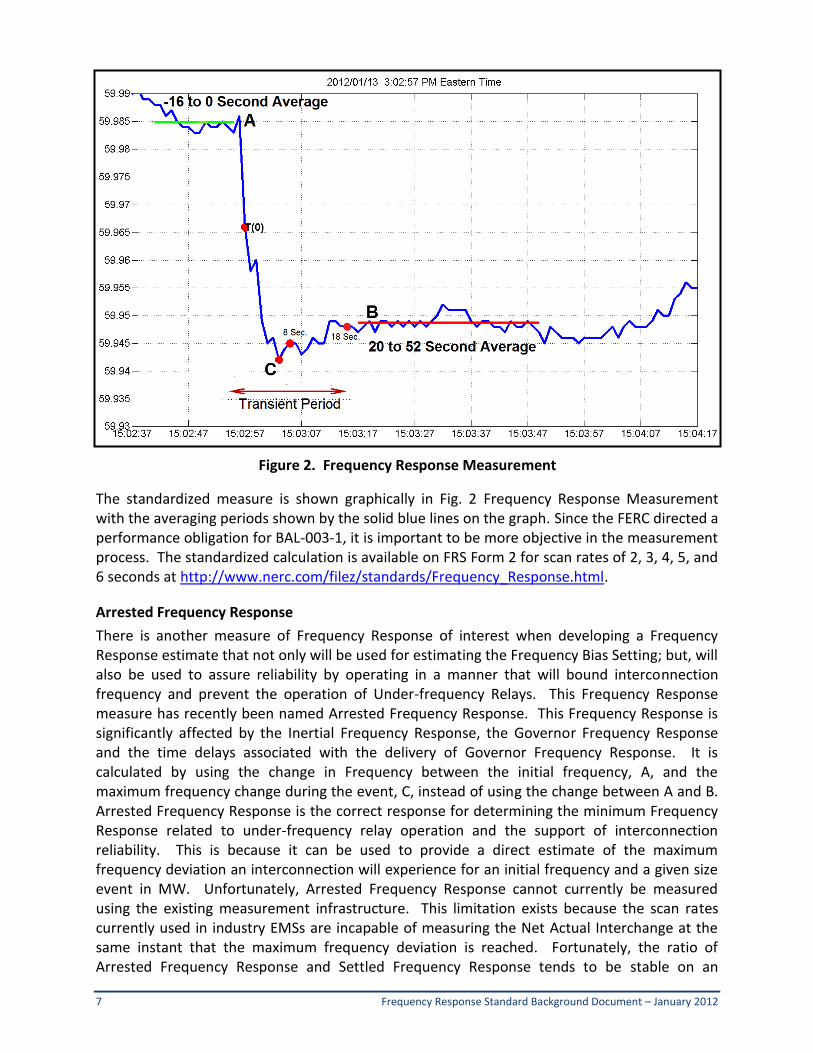
The standardized measure is shown graphically in Fig. 2 Frequency Response Measurement with the averaging periods shown by the solid blue lines on the graph. Since the FERC directed a performance obligation for BAL-003-1, it is important to be more objective in the measurement process. The standardized calculation is available on FRS Form 2 for scan rates of 2, 3, 4, 5, and 6 seconds at http://www.nerc.com/filez/standards/Frequency_Response.html.
Arrested Frequency Response
There is another measure of Frequency Response of interest when developing a Frequency Response estimate that not only will be used for estimating the Frequency Bias Setting; but, will also be used to assure reliability by operating in a manner that will bound interconnection frequency and prevent the operation of Under-frequency Relays. This Frequency Response measure has recently been named Arrested Frequency Response. This Frequency Response is significantly affected by the Inertial Frequency Response, the Governor Frequency Response and the time delays associated with the delivery of Governor Frequency Response. It is calculated by using the change in Frequency between the initial frequency, A, and the maximum frequency change during the event, C, instead of using the change between A and B. Arrested Frequency Response is the correct response for determining the minimum Frequency Response related to under-frequency relay operation and the support of interconnection reliability. This is because it can be used to provide a direct estimate of the maximum frequency deviation an interconnection will experience for an initial frequency and a given size event in MW. Unfortunately, Arrested Frequency Response cannot currently be measured using the existing measurement infrastructure. This limitation exists because the scan rates currently used in industry EMSs are incapable of measuring the Net Actual Interchange at the same instant that the maximum frequency deviation is reached. Fortunately, the ratio of Arrested Frequency Response and Settled Frequency Response tends to be stable on an
Figure 2. Frequency Response Measurement

8 Frequency Response Standard Background Document – January 2012
interconnection. This allows the Settled Frequency Response value to be used as a surrogate for the Arrested Frequency Response and implement a reasonable measure upon which to base a standard. One consequence of using the Settled Frequency Response as a surrogate for the Arrested Frequency Response is the inclusion of a large Reliability Margin in Interconnection Frequency Response Obligation to allow for the difference between the Settled Frequency Response as measured and the Arrested Frequency Response that indicates reliability.
As measurement infrastructure improves one might expect the Frequency Response Obligation to transition to a measurement based directly on the Arrested Frequency Response while the Frequency Bias Setting will continue to be based on the Settled Frequency Response. However, at this time, the measurement devices and methods in use do not support the necessary level of accuracy to estimate Arrested Frequency Response contribution for an individual Balancing Authority.
Rationale by Requirement
Requirement 1 R1. Each Balancing Authority or Frequency Response Sharing Group (FRSG) shall achieve an annual Frequency Response Measure (FRM) (as calculated and reported in accordance with Attachment A) that is equal to or more negative than its Frequency Response Obligation (FRO) to ensure that sufficient Frequency Response is provided by each Balancing Authority or FRSG to maintain an adequate level of Frequency Response in the Interconnection. Background and Rationale R1 is intended to meet the following primary objectives:
• Determine whether a Balancing Authority (BA) has sufficient Frequency Response for reliable operations. • Provide the feeder information needed to calculate CPS limits and Frequency Bias Settings.
Primary Objective With regard to the first objective, FRS Form 1 and the process in Attachment A provide the method for determining the Interconnections’ necessary amount of Frequency Response and allocating it to the Balancing Authorities. The field trial for BAL-003-1 is testing an allocation methodology based on the amount of load and generation in the BA. This is to accommodate the wide spectrum of BAs from generation-only all the way to load-only. Frequency Response Sharing Groups (FRSGs) This standard proposes an entity called FRSG, which is defined as:
A group of two or more Balancing Authorities, that collectively maintain,
allocate, and supply operating resources required to jointly meet the
Frequency Response Standard.
9 Frequency Response Standard Background Document – January 2012
This standard allows Balancing Authorities to cooperatively form FRSGs as a means to jointly meet the FRS. There is no obligation to form or be a part of FRSGs. The members of the FRSG would determine how to allocate sanctions among its members. This standard does not mandate the formation of FRSGs, but allows them as a means to meet one of the FERC’s Order No. 693 directives.
FRSG performance may be calculated one of two ways:
Calculate a group NIA and measure the group response to all events in the reporting
year on a single FRS Form 1, or
Jointly submit the individual BAs’ Form 1s, with a summary spreadsheet that sums each
participant’s individual event performance.
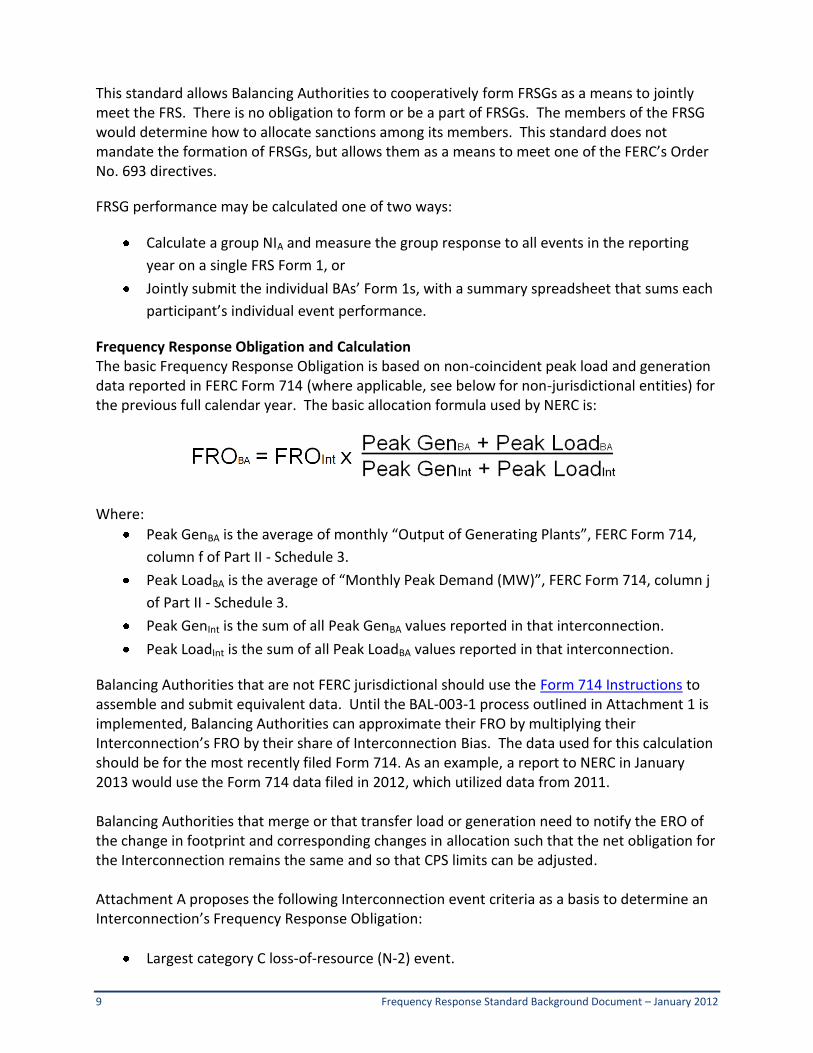
Frequency Response Obligation and Calculation The basic Frequency Response Obligation is based on non-coincident peak load and generation data reported in FERC Form 714 (where applicable, see below for non-jurisdictional entities) for the previous full calendar year. The basic allocation formula used by NERC is:
Where:
Peak GenBA is the average of monthly “Output of Generating Plants”, FERC Form 714,
column f of Part II - Schedule 3.
Peak LoadBA is the average of “Monthly Peak Demand (MW)”, FERC Form 714, column j
of Part II - Schedule 3.
Peak GenInt is the sum of all Peak GenBA values reported in that interconnection.
Peak LoadInt is the sum of all Peak LoadBA values reported in that interconnection.
Balancing Authorities that are not FERC jurisdictional should use the Form 714 Instructions to assemble and submit equivalent data. Until the BAL-003-1 process outlined in Attachment 1 is implemented, Balancing Authorities can approximate their FRO by multiplying their Interconnection’s FRO by their share of Interconnection Bias. The data used for this calculation should be for the most recently filed Form 714. As an example, a report to NERC in January 2013 would use the Form 714 data filed in 2012, which utilized data from 2011. Balancing Authorities that merge or that transfer load or generation need to notify the ERO of the change in footprint and corresponding changes in allocation such that the net obligation for the Interconnection remains the same and so that CPS limits can be adjusted. Attachment A proposes the following Interconnection event criteria as a basis to determine an Interconnection’s Frequency Response Obligation:
Largest category C loss-of-resource (N-2) event.
10 Frequency Response Standard Background Document – January 2012
Largest total generating plant with common voltage switchyard.
Largest loss of generation in the interconnection in the last 10 years.
Given the fact that the Interconnections currently have sufficient Frequency Response, few BAs should encounter problems meeting R1, particularly with the options the Standard provides with regard to obtaining Frequency Response. With regard to the second objective above (determining Frequency Bias Settings and CPS limits), Balancing Authorities have been asked to perform annual reviews of their Frequency Bias Settings by measuring their Frequency Response, dating back to Policy 1. This obligation was carried forward into BAL-003-01.b. While the associated training document provided useful information, it left many of the details to the judgment of the person doing the analysis. The FRS Form 1 and FRS Form 2 provide a consistent, objective process for calculating Frequency Response to develop an annual measure, the FRM. The FRM will be computed from Single Event Frequency Response Data (SEFRD), defined as: “the data from an individual event from a Balancing Authority that is used to calculate its Frequency Response, expressed in MW/0.1Hz”. The SEFRD for a typical Balancing Authority in an Interconnection with more than one Balancing Authority is basically the change of its Net Actual Interchange on its tie lines with its adjacent Balancing Authorities divided by the change in Interconnection frequency. (Some Balancing Authorities may choose to apply corrections to their Net Actual Interchange values to account for factors such as nonconforming loads. FRS Form 1 shows the types of adjustments that are allowed.) A standardized sampling interval of approximately 20 to 52 seconds will be used in the computation of SEFRD values. Microsoft Excel® spreadsheet interfaces for EMS scan rates of 2 through 6 seconds will be provided to support the computation. In an attempt to balance the workload of Balancing Authorities with the need for accuracy in the FRM, the field trial will require at least 20 samples selected during the course of the year to compute the FRM. Research conducted by the Frequency Response Standard Drafting Team (FRSDT) indicated that a Balancing Authority’s FRM will converge to a reasonably stable value with at least 20 samples. Median as the Standard’s Measure of Balancing Authority Performance The FRSDT evaluated different approaches for “averaging” individual event observations to compute a technically sound estimate of Frequency Response Measure (FRM). The MW contribution for a single BA in a multi-BA Interconnection is small compared to the minute to minute changes in load, interchange and generation. For example, a 3000 MW BA in the east may only be called on to contribute 10MW for the loss of a 1000MW. The 10 MW of governor and load response may easily be masked as a coincident change in load.
In general, statisticians use the median as the best measure of central tendency when a population has outliers. Two independent reviews by the FRSDT has shown the Median to be less influenced by noise in the measurement process and the team has chosen the median as the initial metric for calculating the BAs’ Frequency Response Measure.
11 Frequency Response Standard Background Document – January 2012
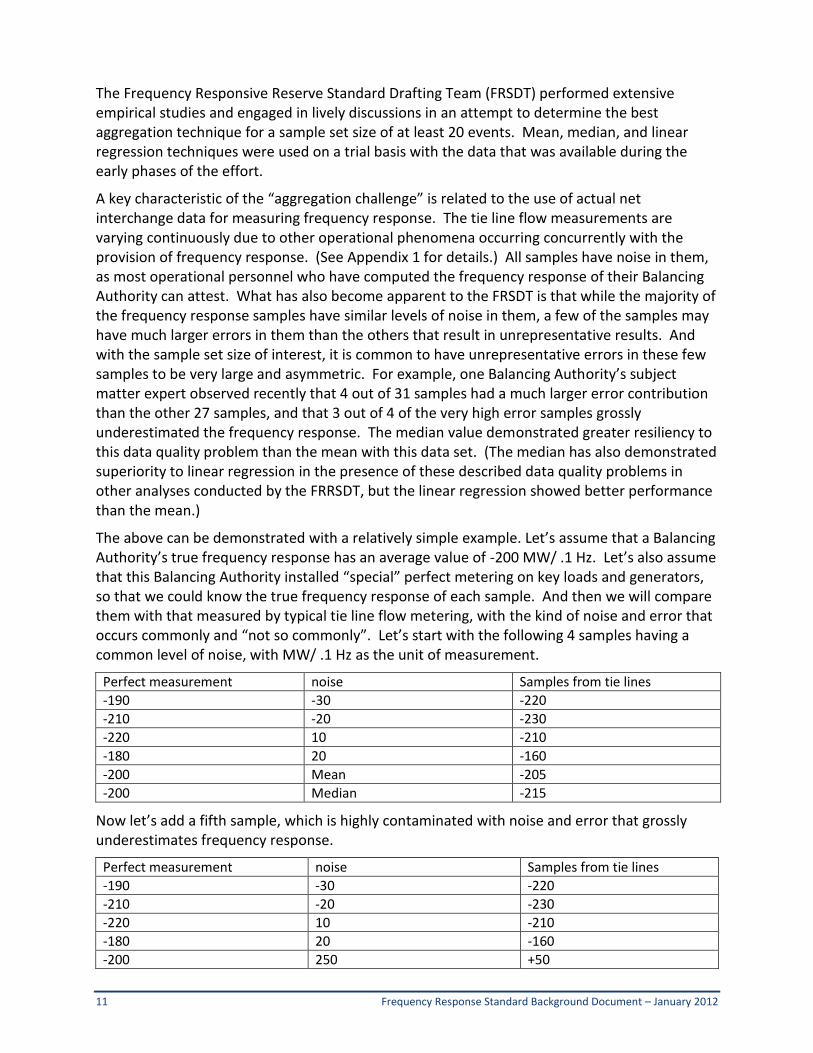
The Frequency Responsive Reserve Standard Drafting Team (FRSDT) performed extensive empirical studies and engaged in lively discussions in an attempt to determine the best aggregation technique for a sample set size of at least 20 events. Mean, median, and linear regression techniques were used on a trial basis with the data that was available during the early phases of the effort.
A key characteristic of the “aggregation challenge” is related to the use of actual net interchange data for measuring frequency response. The tie line flow measurements are varying continuously due to other operational phenomena occurring concurrently with the provision of frequency response. (See Appendix 1 for details.) All samples have noise in them, as most operational personnel who have computed the frequency response of their Balancing Authority can attest. What has also become apparent to the FRSDT is that while the majority of the frequency response samples have similar levels of noise in them, a few of the samples may have much larger errors in them than the others that result in unrepresentative results. And with the sample set size of interest, it is common to have unrepresentative errors in these few samples to be very large and asymmetric. For example, one Balancing Authority’s subject matter expert observed recently that 4 out of 31 samples had a much larger error contribution than the other 27 samples, and that 3 out of 4 of the very high error samples grossly underestimated the frequency response. The median value demonstrated greater resiliency to this data quality problem than the mean with this data set. (The median has also demonstrated superiority to linear regression in the presence of these described data quality problems in other analyses conducted by the FRRSDT, but the linear regression showed better performance than the mean.)
The above can be demonstrated with a relatively simple example. Let’s assume that a Balancing Authority’s true frequency response has an average value of -200 MW/ .1 Hz. Let’s also assume that this Balancing Authority installed “special” perfect metering on key loads and generators, so that we could know the true frequency response of each sample. And then we will compare them with that measured by typical tie line flow metering, with the kind of noise and error that occurs commonly and “not so commonly”. Let’s start with the following 4 samples having a common level of noise, with MW/ .1 Hz as the unit of measurement.
Perfect measurement noise Samples from tie lines
-190 -30 -220
-210 -20 -230
-220 10 -210
-180 20 -160
-200 Mean -205
-200 Median -215
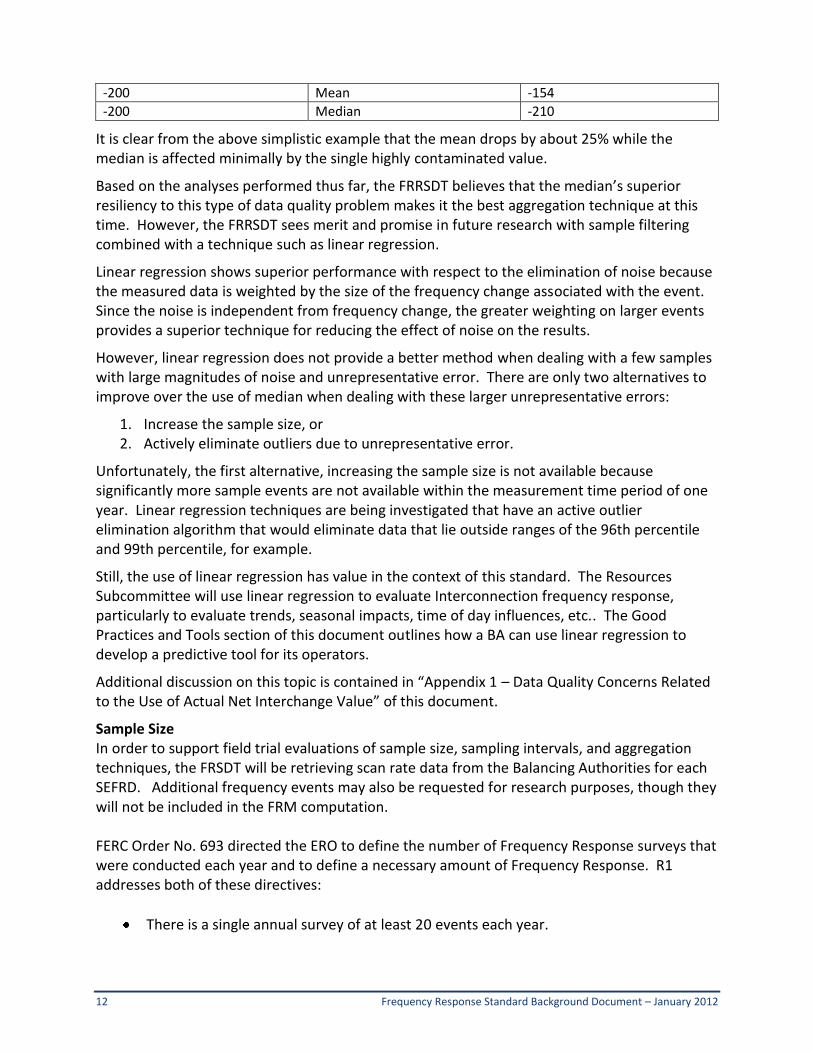
Now let’s add a fifth sample, which is highly contaminated with noise and error that grossly underestimates frequency response.
Perfect measurement noise Samples from tie lines
-190 -30 -220
-210 -20 -230
-220 10 -210
-180 20 -160
-200 250 +50
12 Frequency Response Standard Background Document – January 2012
-200 Mean -154
-200 Median -210
It is clear from the above simplistic example that the mean drops by about 25% while the median is affected minimally by the single highly contaminated value.
Based on the analyses performed thus far, the FRRSDT believes that the median’s superior resiliency to this type of data quality problem makes it the best aggregation technique at this time. However, the FRRSDT sees merit and promise in future research with sample filtering combined with a technique such as linear regression.
Linear regression shows superior performance with respect to the elimination of noise because the measured data is weighted by the size of the frequency change associated with the event. Since the noise is independent from frequency change, the greater weighting on larger events provides a superior technique for reducing the effect of noise on the results.
However, linear regression does not provide a better method when dealing with a few samples with large magnitudes of noise and unrepresentative error. There are only two alternatives to improve over the use of median when dealing with these larger unrepresentative errors:
1. Increase the sample size, or 2. Actively eliminate outliers due to unrepresentative error.
Unfortunately, the first alternative, increasing the sample size is not available because significantly more sample events are not available within the measurement time period of one year. Linear regression techniques are being investigated that have an active outlier elimination algorithm that would eliminate data that lie outside ranges of the 96th percentile and 99th percentile, for example.
Still, the use of linear regression has value in the context of this standard. The Resources Subcommittee will use linear regression to evaluate Interconnection frequency response, particularly to evaluate trends, seasonal impacts, time of day influences, etc.. The Good Practices and Tools section of this document outlines how a BA can use linear regression to develop a predictive tool for its operators.
Additional discussion on this topic is contained in “Appendix 1 – Data Quality Concerns Related to the Use of Actual Net Interchange Value” of this document.
Sample Size In order to support field trial evaluations of sample size, sampling intervals, and aggregation techniques, the FRSDT will be retrieving scan rate data from the Balancing Authorities for each SEFRD. Additional frequency events may also be requested for research purposes, though they will not be included in the FRM computation. FERC Order No. 693 directed the ERO to define the number of Frequency Response surveys that were conducted each year and to define a necessary amount of Frequency Response. R1 addresses both of these directives:
There is a single annual survey of at least 20 events each year.
13 Frequency Response Standard Background Document – January 2012
The FRM calculated on FRS Form 1 is compared by the ERO against the FRO determined
12 months earlier (when the last FRS Form 1 was submitted) to verify the Balancing
Authority provided its share of Interconnection Frequency Response.
FERC Order No. 693 also directed the Standard should identify methods for Balancing Authorities to obtain Frequency Response. Requirement R1 allows Balancing Authorities to participate in Frequency Response Sharing Groups (FRSGs) to provide or obtain Frequency Response. These may be the same FRSGs that cooperate for BAL-002-0 or may be FRSGs that form for the purposes of BAL-003-1. If BAs participate as an FRSG for BAL-003-1, compliance is based on the sum of the participants’ performance. Two other ways that BAs could obtain Frequency Response are through Supplemental Service or Overlap Regulation Service:
No special action is needed if a BA provides or receives supplemental regulation. If the
regulation occurs via Pseudo Tie, the transfer occurs automatically as part of Net Actual
Interchange (NIA) and in response to information transferred from recipient to
provider.
If a BA provides overlap regulation, its FRS Form 1 will include the Frequency Bias
setting as well as peak load and generation of the combined Balancing Authority Areas.
The FRM event data will be calculated on the sum of the provider’s and recipient’s
performance.
In the Violation Severity Levels for Requirement R1, the impact of a BA not having enough frequency response depends on two factors:
Does the Interconnection have sufficient response?
How short is the BA in providing its FRO?
The VSL takes these factors into account. While the VSLs look different than some other standards, an explanation would be helpful. VSLs are a starting point for the enforcement process. The combination of the VSL and VRF is intended to measure a violation’s impact on reliability and thus levy an appropriate sanction. Frequency Response is an interconnection-wide resource. The proposed VSLs are intended to put multi-BA Interconnections on the same plain as single-BA Interconnections.
Consider a small BA that whose performance is 70% of its FRO. If all other BAs in the Interconnection are compliant, the small BA’s performance has negligible impact on reliability, yet would be sanctioned at the same level as a BA who was responsible for its entire Interconnection. It is not rational to sanction this BA the same as a single BA Interconnection that had insufficient Frequency Response. To do otherwise would treat multi-BA Interconnections tens of times more harshly than single BA Interconnections.
14 Frequency Response Standard Background Document – January 2012
The “Lower” and “Medium” VSLs say that the Interconnection has sufficient Frequency Response but individual BAs are deficient by small or larger amounts respectively. The High and Severe VSLs say the Interconnection does not meet the FRO and assesses sanctions based on whether the BA is deficient by a small or larger amount respectively.
Requirement 2 R2. Each Balancing Authority that is a member of a multiple Balancing Authority interconnection and is not receiving Overlap Regulation Service and uses a fixed Frequency Bias Setting shall implement the Frequency Bias Setting determined subject to Attachment A, as validated by the ERO, into its Area Control Error (ACE) calculation during the implementation period specified by the ERO and shall use this Frequency Bias Settinguntil directed to change by the ERO to ensure effectively coordinated Tie Line Bias control.
Background and Rationale Attachment A of the Standard discusses the process the ERO will follow to validate the BA’s FRS Form 1 data and publish the official Frequency Bias Settings. Historically, it has taken multiple rounds of validation and outreach to confirm each BA’s data due to transcription errors, misunderstanding of instructions, and other issues. While BAs historically submit Bias Setting data by January 1, it often takes one or more months to complete the process.
The target is to have BAs submit their data by January 10. The BAs are given 30 days to assemble their data since the BAs are dependent on the ERO to provide them with FRS Form 1, and there may be process delays in distributing the forms since they rely on identification of frequency events through November 30 of the preceding year.
Frequency Bias Settings generally change little from year to year. Given the fact that BAs can encounter staffing or EMS change issues coincident with the date the ERO sets for new Frequency Bias Setting implementation, the standard provides a 24 hour window on each side of the target date.
To recap the annual process:
1. The ERO posts the official list of frequency events to be used for this Standard in early
December. The FRS Form 1 for each Interconnection will be posted shortly thereafter.
2. The Balancing Authority submits its revised annual Frequency Bias Setting value to
NERC by January 10.
3. The ERO and the Resources Subcommittee validate Frequency Bias Setting values,
perform error checking, and calculate, validate, and update CPS2 L10 values. This data
collection and validation process can take as long as two months.
4. Once the L10 and Frequency Bias Setting values are validated, The ERO posts the values
for the upcoming year and also informs the Balancing Authorities of the date on which
to implement revised Frequency Bias Setting values. Implementation typically would be
on or about March 1st of each year.
15 Frequency Response Standard Background Document – January 2012
BAL-003-0.1b standard requires a minimum Frequency Bias Setting equal in absolute value to
one percent of the Balancing Authority’s estimated yearly peak demand (or maximum
generation level if native load is not served). For most Balancing Authorities this calculated
amount of Frequency Bias is significantly greater in absolute value than their actual Frequency
Response characteristic (which represents an over-bias condition) resulting in over-control
since a larger magnitude response is realized. This is especially true in the Eastern
Interconnection where this condition requires excessive secondary frequency control response
which degrades overall system performance and increases operating cost as compared to
requiring an appropriate balance of primary and secondary frequency control response.
Balancing Authorities were given a minimum Frequency Bias Setting obligation because there
had never been a mandatory Frequency Response Obligation. This historic “one percent of
peak per 0.1Hz” obligation, dating back to NERC’s predecessor, NAPSIC, was intended to ensure
all BAs provide some support to Interconnection frequency.
The ideal system control state exists when the Frequency Bias Setting of the Balancing
Authority exactly matches the actual Frequency Response characteristic of the Balancing
Authority. If this is not achievable, over-bias is significantly better from a control perspective
than under-bias with the caveat that Frequency Bias is set relatively close in magnitude to the
Balancing Authority actual Frequency Response characteristic. Setting the Frequency Bias to
better approximate the Balancing Authority natural Frequency Response characteristic will
improve the quality and accuracy of ACE control, CPS & DCS and general AGC System control
response. This is the technical basis for recommending an adjustment to the long standing “1%
of peak/0.1Hz” Frequency Bias Setting. Attachment B is intended to bring the Balancing
Authorities’ Frequency Bias Setting closer to their natural Frequency Response. Attachment B
balances the following objectives:
• Bring the Frequency Bias Setting and Frequency Response closer together.
• Allow time to analyze impact on other Standards (CPS, BAAL and to a lesser
extent DCS) by adjustments in the minimum Frequency Bias Setting, by accommodating
only minor adjustments.
• Do not allow the Frequency Bias Setting minimum to drop below natural
Frequency Response, because under-biasing could affect an Interconnection adversely.
Additional flexibility has been added to the Frequency Bias Setting based on the actual
Frequency Response (FRM) by allowing the Frequency Bias Setting to have a value in the range
from 100% of FRM to 125% of FRM. This change has been included for the following reasons:
• When the new standardized measurement method is applied to BAs with a
Frequency Response close to the interconnection minimum response, the requirement
to use FRM is as likely to result in a Frequency Bias Setting below the actual response as

16 Frequency Response Standard Background Document – January 2012
it is to result in a response above the actual response. From a reliability perspective, it is
always better to have a Frequency Bias Setting slightly above the actual Frequency
Response.
• As with single BA interconnections, the tuning of the control system may require
that the BA implement a Frequency Response Setting slightly greater in absolute terms
than its actual Frequency Response to get the best performance.
• The new standardized measurement method for determining FRM in some cases
results in a measured Frequency Response significantly lower than the previous
methods used by some BAs. It is desirable to not require significant change in the
Frequency Bias Setting for these BAs that experience a reduction in their measured
Frequency Response.
Requirement 3 R3. Each Balancing Authority that is a member of a multiple Balancing authority interconnection and is not receiving Overlap Regulation Service and uses a variable Frequency Bias Setting shall have an absolute average Frequency Bias Setting, computed from clock minute samples of its Frequency Bias Setting when the clock minute samples of its Interconnection’s frequency is greater than 60.036 Hz or less than 59.964 Hz, that equals or exceeds the greater of the absolute values of its Frequency Response Measure from the previous evaluation period and its Interconnection’s minimum as specified in Attachment A.
Background and Rationale In multi-Balancing Authority interconnections, the Frequency Bias Setting should be coordinated among all BAs on the interconnection. When there is a minimum Frequency Bias Setting requirement, it should apply for all BAs. However, BAs using a variable Frequency Bias Setting may have non-linearity in their actual response for a number of reasons including the dead-bands implemented on their generator governors. The measurement to ensure that these BAs are conforming to the interconnection minimum is adjusted to remove the dead-band range from the calculated average Frequency Bias Setting actually used. For BAs using variable bias, FRS Form 1 has a data entry location for the previous year’s average monthly Bias. The Balancing Authority and the ERO can compare this value to the previous year’s Frequency Bias Setting minimum to ensure R3 has been met.
On single BA interconnections, there is no need to coordinate the Frequency Bias Setting with other BAs. This eliminates the need to maintain a minimum Frequency Bias Setting for any reason other than meeting the reliability requirement as specified by the Frequency Response Obligation.
Requirement 4 R4. Each Balancing Authority that is performing Overlap Regulation Service shall modify its Frequency Bias Setting in its ACE calculation, in order to represent the Frequency Bias Setting for the combined Balancing Authority Area, to be equivalent to either:
17 Frequency Response Standard Background Document – January 2012
• The sum of the Frequency Bias Settings as shown on FRS Form 1 and FRS Form 2 for the participating Balancing Authorities as validated by the ERO, or
• The Frequency Bias Setting as shown on FRS Form 1 and FRS Form 2 for the entirety of the participating Balancing Authorities’ Areas.
Background and Rationale This requirement reflects the operating principles first established by NERC Policy 1 and is similar to Requirement R6 of the approved BAL-003-0.1b standard. Overlap Regulation Service is a method of providing regulation service in which the Balancing Authority providing the regulation service incorporates another Balancing Authority’s actual interchange, frequency response, and schedules into the providing Balancing Authority’s AGC/ACE equation.
As noted earlier, a BA that is providing Overlap Regulation will report the sum of the Bias Settings in its FRS Form 1. Balancing Authorities receiving Overlap Regulation Service have an ACE and Frequency Bias Setting equal to zero (0).

18 Frequency Response Standard Background Document – January 2012
How this Standard Meets the FERC Order 693 Directives
FERC Directive
The following is the relevant paragraph of Order No. 693.
Accordingly, the Commission approves Reliability Standard BAL-003-0 as mandatory and enforceable. In addition, the Commission directs the ERO to develop a modification to BAL-003-0 through the Reliability Standards development process that: (1) includes Levels of Non-Compliance; (2) determines the appropriate periodicity of frequency response surveys necessary to ensure that Requirement R2 and other requirements of the Reliability Standard are being met, and to modify Measure M1 based on that determination and (3) defines the necessary amount of Frequency Response needed for Reliable Operation for each balancing authority with methods of obtaining and measuring that the frequency response is achieved.
1. Levels of Non-Compliance
VRFs and VSLs are an equally effective way of assigning compliance elements to the standard.
2. Determine the appropriate periodicity of frequency response surveys necessary to ensure that Requirement R2 and other Requirements of the Reliability Standard are met
BAL-003 V0 R2 (the basis of Order No. 693) deals with the calculation of Frequency Bias Setting such that it reflects natural Frequency Response.
The drafting team has determined that a sample size on the order of at least 20 events is necessary to have a high confidence in the estimate of a BA’s Frequency Response. Selection of the frequency excursion events used for analysis will be done via a method outlined in Attachment A to the Standard.
On average, these events will represent the largest 2-3 “clean” frequency excursions occurring each month.
Since Frequency Bias Setting is an annual obligation, the survey of the at least 20 frequency excursion events will occur once each year.
3. Define the necessary amount of Frequency Response needed for Reliable Operation for each Balancing Authority with methods of obtaining and measuring that the frequency response is achieved
Necessary Amount of Frequency Response
The drafting team has proposed the following approach to defining the necessary amount of frequency response. In general, the goal is to avoid triggering the first step of under-frequency load shedding (UFLS) in the given Interconnection for reasonable contingencies expected. The
19 Frequency Response Standard Background Document – January 2012
methodology for determining each Interconnection’s and Balancing Authority’s obligation is outlined in Attachment A to the Standard.
It should be noted the standard cannot guarantee there will never be a triggering of UFLS as the magnitude of “point C” differs throughout an interconnection during a disturbance and there are local areas that see much wider swings in frequency.
The contingency protection criterion is the largest reasonably expected contingency in the Interconnection. This can be based on the largest observed credible contingency in the previous 10 years or the largest Category C event for the Interconnection.
Attachment A to the standard presents the base obligation by Interconnection and adds a Reliability Margin. The Reliability Margin included addresses the difference between Points B and C and accounts for variables.
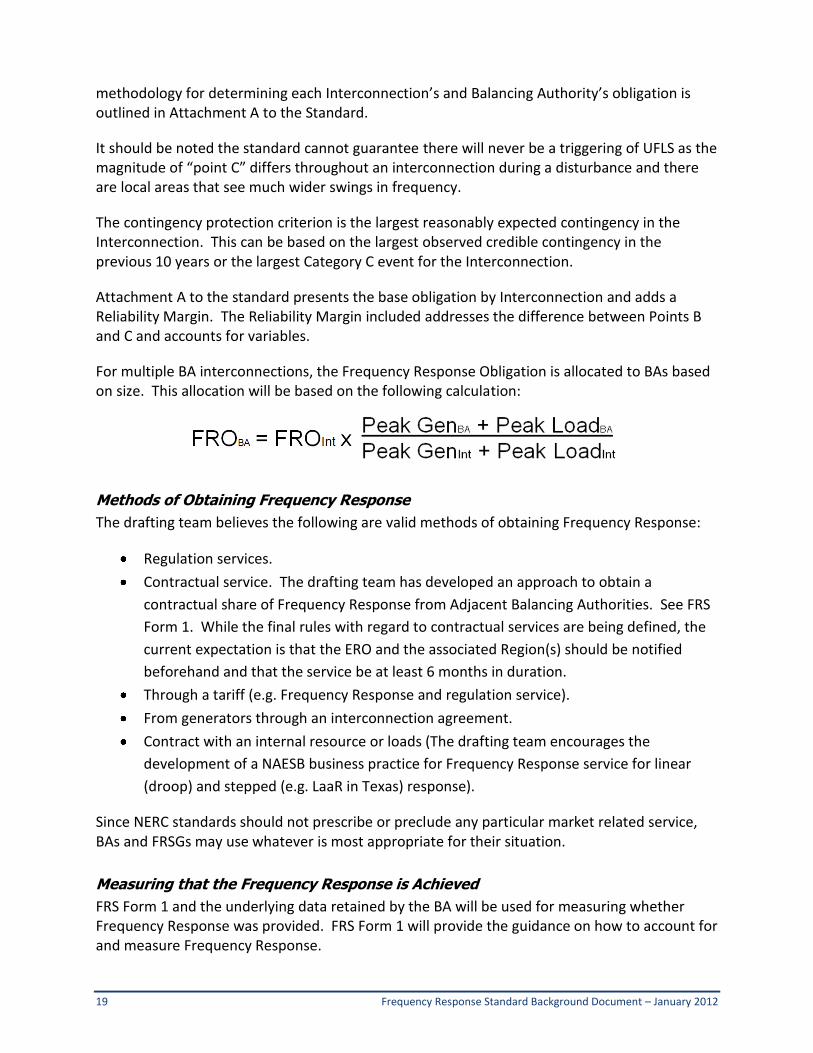
For multiple BA interconnections, the Frequency Response Obligation is allocated to BAs based on size. This allocation will be based on the following calculation:
Methods of Obtaining Frequency Response
The drafting team believes the following are valid methods of obtaining Frequency Response:
Regulation services.
Contractual service. The drafting team has developed an approach to obtain a
contractual share of Frequency Response from Adjacent Balancing Authorities. See FRS
Form 1. While the final rules with regard to contractual services are being defined, the
current expectation is that the ERO and the associated Region(s) should be notified
beforehand and that the service be at least 6 months in duration.
Through a tariff (e.g. Frequency Response and regulation service).
From generators through an interconnection agreement.
Contract with an internal resource or loads (The drafting team encourages the
development of a NAESB business practice for Frequency Response service for linear
(droop) and stepped (e.g. LaaR in Texas) response).
Since NERC standards should not prescribe or preclude any particular market related service, BAs and FRSGs may use whatever is most appropriate for their situation.
Measuring that the Frequency Response is Achieved
FRS Form 1 and the underlying data retained by the BA will be used for measuring whether Frequency Response was provided. FRS Form 1 will provide the guidance on how to account for and measure Frequency Response.

20 Frequency Response Standard Background Document – January 2012
Going Beyond the Directive
Based on the combined operating experience of the SDT, the drafting team believes each Interconnection has sufficient Frequency Response. If margins decline, there may be a need for additional standards or tools. The drafting team and the Resources Subcommittee are working with the ERO on its Frequency Response Initiative to develop processes and good practices so the Interconnections are prepared. These good practices and tools are described in the following section.
The drafting team is also evaluating a risk-based approach for basing the Interconnection Frequency Response Obligation on an historic probability density of frequency error, and for allocating the obligation on the basis of the Balancing Authority’s average annual ACE share of frequency error. This allocation method uses the inverse of the rationale for allocating the CPS1 epsilon requirement by Bias share.
Future Work The drafting team evaluated a proposal on a risk-based approach for basing the Interconnection Frequency Response Obligation on an historic probability density of frequency error, and for allocating the obligation on the basis of the Balancing Authority’s average annual ACE share of frequency error. Full evaluation could not be completed in time to support version 1 of BAL-003. Initial information on this approach is posted on the Resources Subcommittee website. Further research on this approach is encouraged.

21 Frequency Response Standard Background Document – January 2012
Good Practices and Tools
Background
This section outlines tips and tools for Balancing Authorities to help them meet the Frequency Response Standard or to operate more reliability. If you have suggested additions, send them to [email protected].
Identifying and Estimating Frequency Responsive Reserves
Knowing the quantity and depth of frequency responsive reserves in real time is a possible next step to being better prepared for the next event. The challenge in achieving this is having the knowledge of the capabilities of all sources of frequency response. Presently the primary source of frequency response remains with the generation resources in our fleets.
Understanding how each of these sources performs to changes in system frequency and knowing their limitations would improve the BA’s ability to measure frequency responsive reserves. Presently there are only guidelines, criteria and protocols in some regions of the industry that identify specific settings and performance expectations of primary frequency response of resources.
One method of gaining better understanding of performance is to measure performance during actual events that occur on the system. Measuring performance during actual events would only provide feedback for performance during that specific event and would not provide insight into depth of response or other limitations.
Repeated measurements will increase confidence in expected performance. NERC modeling standards are in process to be revised that will improve the BA’s insight into predicting available frequency responsive reserves. However, knowing how resources are operated, what modes of operation provide sustained primary frequency response and knowing the operating range of this response would give the BA the knowledge to accurately predict frequency response and the amount of frequency responsive reserves available in real time.
Some benefits have been realized by communicating to generation resources (GO) the importance of operating in modes that allow primary frequency response to be sustained by the control systems of the resource. Other improvements in implementation of primary frequency response have been achieved through improved settings on turbine governors through the elimination of “step” frequency response with the simultaneous reduction in governor dead-band settings.
Improvements in the full AGC control loop of the generating resource, which accounts for the expected primary frequency response, have improved the delivery of quality primary frequency response while minimizing secondary control actions of generators. Some of these actions can provide quick improvement in delivery of primary frequency response.
22 Frequency Response Standard Background Document – January 2012
Once primary frequency response sources are known the BA could calculate available reserves that are frequency responsive. Planning for these reserves during normal and emergency operations could be developed and added to the normal planning process.
Using FRS Form 1 Data
The information collected for this standard can be supplemented by a few data points to provide the Balancing Authority useful tools and information. The BA could do a regression analysis of its frequency response against the following values:
Load (value A).
Interchange (Value A).
Total generation.
Spinning reserve.
While the last two values above are not part of Form 1, they should be readily available. Small BAs might even include headroom on its larger generators as part of the regression.
The regression would provide a formula the BA could program in its EMS to present the operator a real time estimate of the BA’s Frequency Response.
Statistical outliers in the regression would point to cases meriting further inspection to find causes of low Frequency Response or opportunities for improvement.
Tools
Single generating resource performance evaluation tools for steam turbine, combustion turbine
(simple cycle or combined cycle) and for intermittent resources are available at the following
link. http://texasre.org/standards_rules/standardsdev/rsc/sar003/Pages/Default.aspx.
These tools and the regional standard associated with them are in their final stages of development in the Texas region.
These tools will be posted on the NERC website.

23 Frequency Response Standard Background Document – January 2012
Field Trial
This section is a summary of the Field Trial activities that have been or will be conducted by the ERO, the Resources Subcommittee and the FRS Drafting Team.
1. The NERC BA recommendation (alert) and observations.√ 2. The NERC governor recommendation (alert) and observations.√ 3. The 2011 bias calculation √
1. Evaluate measurement methodology√ 2. Serve as initial training for BAs√ 3. Evaluate median, mean, regression and possibly other measures√ 4. Evaluate sample size (to address the directive of frequency of surveys) √ 5. Evaluate impact of inclusion/exclusion of internal contingencies √ 6. Improve FRS Form 1√
4. Create supporting process for FRS Form 1 √ 1. For Interconnection benchmarking (proving adequacy of frequency response) 2. Evaluating trend 3. Test process for developing candidate list for FRS Form 1
5. 2012 bias calculation √ 1. Further refinement of items in 2011 bias calculation 2. Test the FRO allocation methodology 3. Test approach for handling variable bias 4. Evaluate 12 month vs. 24 month rolling average approach to performance
6. Evaluate reduction in bias setting floor below 1% (initially 0.8% in 2013) to evaluate impact on frequency and calculated CPS and BAAL performance.
7. Evaluate effectiveness of administrative process to support the standard. 8. Evaluate a risk-based approach for basing the Interconnection Frequency Response
Obligation on an historic probability density of frequency error, and for allocating the obligation on the basis of the Balancing Authority’s average annual ACE share of frequency error.
24 Frequency Response Standard Background Document – January 2012
References
NERC Frequency Response Characteristic Survey Training Document (Found in the NERC Operating Manual) NERC Resources Subcommittee Position Paper on Frequency Response
NERC TIS Report Interconnection Criteria for Frequency Response Requirements (for the Determination Interconnection Frequency Response Obligations (IFRO)
25 Frequency Response Standard Background Document – January 2012
Appendix 1 - Data Quality Concerns Related To The Use Of The Actual Net Interchange Value
Actual net interchange for a typical Balancing Authority (BA) is the summation of its tie lines to other BAs. In some cases, there are pseudo-ties in it which reflect the effective removal or addition of load and/or generation from another BA, or it could include supplemental regulation as well. But in the typical scenario, actual net interchange values that are extracted from EMS data archiving can be influenced by data latency times in the data acquisition process, and also any timestamp skewing in the archival process.
Of greater concern, however, are the inevitable variations of other operating phenomena occurring concurrently with a frequency event. The impacts of these phenomena are superimposed on actual net interchange values along with the frequency response that we wish to measure through the use of the actual net interchange value.
To explore this issue further, let’s begin with the idealized condition:
frequency is fairly stable at some value near or a little below 60 Hz
ACE of the non-contingent BA of interest is 0 and has been 0 for an extended period,
and AGC control signals have not been issued recently
Actual net interchange is “on schedule”, and there are no schedule changes in the
immediate future
BA load is flat
All generators not providing AGC are at their targets
Variable generation such as wind and solar are not varying
Operators have not directed any manual movements of generation recently
And when the contingency occurs in this idealized state, the change in actual net interchange will be measuring only the decline in load due to lesser frequency and generator governor response, and, none of the contaminating influences. While the ACE may become negative due to the actual frequency response being less than that called for by the frequency bias setting within the BA’s AGC system, this contaminating influence on measuring frequency response will not appear in the actual net interchange value if the measurement interval ends before the generation on AGC responds.
Now let’s explore the sensitivity of the resultant frequency response sampling to the relaxation of these idealized circumstances.
1. The “60 Hz load” increases moderately due to time of day concurrent with the
frequency event. If the frequency event happens before AGC or operator-directed
manual load adjustments occur, then the actual net interchange will be reduced by the
moderate increase in load and the frequency response will be underestimated. But if
the frequency event happens while AGC response and/or manual adjustments occur,
then the actual net interchange will be increased by the AGC response (and/or manual
adjustments) and the frequency response will be overestimated.
26 Frequency Response Standard Background Document – January 2012
2. The “60 Hz load” decreases moderately due to time of day concurrent with the
frequency event. If the frequency event happens before AGC or operator-directed
manual load adjustments occur, then the actual net interchange will be increased by the
moderate reduction in load and the frequency response will be overestimated. But if
the frequency event happens while AGC response and/or manual adjustments occur,
then the actual net interchange will be decreased by the AGC response (and/or manual
adjustments) and the frequency response will be underestimated.
3. In anticipation of increasing load during the next hour, the operator increases manual
generation before the load actually appears. If the frequency event happens while the
generation “leading” the load is increasing, then the actual net interchange will be
increased by the increase in manual generation and the frequency response will be
overestimated. But if the frequency event occurs when the result of AGC signals sent to
offset the operator’s leading actions take effect, then the actual net interchange will be
decreased and the frequency response is underestimated.
4. In anticipation of decreasing load during the next hour, the operator decreases manual
generation before the load actually declines. If the frequency event happens while the
generation “leading” the load downward is decreasing, then the actual net interchange
will be decreased by the reduction in manual generation and the frequency response
will be underestimated. But if the frequency event occurs when the result of AGC
signals sent to offset the operator’s leading actions take effect, then the actual net
interchange will be increased and the frequency response is overestimated.
5. A schedule change to export more energy is made at 5 minutes before the top of the
hour. The BA’s “60 Hz load” is not changing. The schedule change is small enough that
the operator is relying on upward movement of generators on AGC to provide the
additional energy to be exported. The time at which the AGC generators actually begin
to provide the additional energy is dependent on how much time passes before the AGC
algorithm gets out of its deadbands, the individual generator control errors get large
enough for sending out the control signal, and maybe 20 seconds to 3 minutes for the
response to be effected. The key point here is that it is not clear when the effects of a
schedule change, as manifested in a change in generation and then ultimately a change
in actual net interchange, will occur.
6. With the expected penetration of wind in the near future, unanticipated changes in
their output will tend to affect actual net interchange and add noise to the frequency
response observation process.
To a greater or lesser extent, 1 through 4 above are happening continuously for the most part with most BAs in the Eastern and Western Interconnections. The frequency response is buried within the typical hour to hour operational cacophony superimposed on actual net interchange values. The choice of metrics will be important to artfully extract frequency response from the noise and other unrepresentative error.