frequency stability evaluation criteria for the ... documents/rgce_spd... · frequency stability...
TRANSCRIPT
Frequency Stability Evaluation Criteria for the Synchronous Zone of Continental Europe
– Requirements and impacting factors –
RG-CE System Protection & Dynamics Sub Group
March 2016
This report was prepared by a task force with members from REE, Terna, TransnetBW, 50HertzTransmission, RTE, Swissgrid and Energinet.dk.
2
Content
1. Executive Summary .............................................................................................................3
2. Introduction ..........................................................................................................................3
3. Evaluation Criteria................................................................................................................4
4. Normative Incidents .............................................................................................................6
5. System Modelling Approach.................................................................................................8
6. Boundary Conditions and Impacting Factors ......................................................................10
7. Frequency Stability Evaluation ...........................................................................................12
8. Conclusion and Recommendations....................................................................................21
9. Outlook ..............................................................................................................................23
10. References.........................................................................................................................25
3
1. Executive Summary
The main focus of this report is to analyse the impact of reduced system inertia on system operation. This decreased overall system inertia is caused by a shift of generation from classical synchronous generation to power electronic-based non-synchronous generation.
The conclusions of this report are based on dynamic model calculations performed with a commonly agreed simple dynamic model already used for previous studies such as distributed generation impact /6/ or underfrequency load shedding /5/. The model chosen is also justified from a technical point of view by the selected typology of the transient that has been investigated, namely “mean frequency transient”.
Decreased system inertia will have a significant impact if the Continental European power system faces a system split similar to the November 4th 2006 event. As long as the system remains interconnected lower system inertia is not considered to be critical for the normative 3000 MW incident.
As underfrequency issues have been already discussed and analysed within the CE underfrequency report /5/, this report focuses on the overfrequency system response.
The main parameter to be considered is the admissible rate of change of system frequency (RoCoF). By analysing all of the latest serious events within the Continental European System we can state that ranges of 500 mHz/s up to 1 Hz/s correspond to a system imbalance ratio of 20%. With the current power plant capabilities and system protection devices this is the maximum range that can be operated successfully. However, market simulations for the future ask for a capability to handle a frequency gradient of 2 Hz/s and an imbalance ratio of 40%. Therefore, future improvements with respect to generation performance and load shedding are required.
With the help of a parametric study this report provides an answer to the issue of the required Limited Frequency System Mode response for Overfrequency (LFSM-O). The relation between system inertia, admissible delay time, and controller settings are described.
2. Introduction
The aim of this work is to analyse the effects of inertia changes in the Continental European (CE)electricity power system, caused by an increased amount of non-synchronous generation. It iswell-known that during the last ten years a dramatic increase in PV panels and inverter-basedelectrical applications has substantially influenced the technical rules and requirements /6/, asking for a re-design of the pan European defence systems /3/.
The inertia parameter and the increasing Continental European power flows directly influence the dynamic behaviour of the system. The functional point of view can be summarized in the following main concepts:
· Inertia is the parameter that represents the capability of rotating machines (including loads, when applicable) to store and inject their kinetic energy to the system. The level of inertia influences the frequency gradient (rate of change of frequency = RoCoF) and transient frequency values during a system incident. The transient value of the system frequency is important, because an increase of transient deviation of frequency caused by

4
an inertia decrease can raise the risk of reaching values which are dangerous for the system stability (generators trip, load shedding intervention, etc.).
· The frequency gradient, as it will be demonstrated, is a clear measure of the power system weakness with respect to withstanding sudden system imbalances after forced outages or system separations.
· Due to the fact that the power increase or decrease from all types of generation (including non-synchronous generation) can only be ensured with a physically based delay, we can conclude that the higher the frequency gradient is, the less stable the power system is. Operational experience demonstrates that it is possible to define an over-frequency gradient threshold that, if exceeded, is a sort of no-return point, because the available countermeasures are not capable to react on time and the system is randomly split with little chance to survive.
· During severe frequency gradients conventional protection devices might experience conditions where a reliable operation is difficult.
· More severe frequency transients can create stress to the prime movers of power plantsthat increase the probability of generation cascading trips.
· High RoCoF level means large transient displacements of voltage angles in different zones of the grid that induce pole slipping on synchronous machines and network splitting, possibly causing distance protection tripping.
This report is based on the previous work of the subgroup System Protection and Dynamics and aims at further investigating the system aspects related to inertia and frequency control.
The main requirement for measuring the frequency correctly is the insensitivity to rapid local changes of voltage angles due to short-circuit faults or other severe transients. It is worth notingthat frequency and RoCoF must be calculated over a filtered frequency, in order to eliminate electromechanical oscillations and thus determine the mean system frequency in the domain of primary frequency regulation /13/. Consequently, the model adopted in the study tries to emulate the effect of filtering and delays in the controllers similar to their way of operation.
3. Evaluation Criteria
As an immediate result of an imbalance between generation and load the system frequency starts deviating from its rated value. The gradient of the frequency (RoCoF) is inversely proportional to the overall system inertia.
The frequency deviation is stabilized by the available primary control reserves. In Continental Europe, these reserves are designed in such a way that the system frequency deviation remains within the range of 49.8 Hz and 50.2 Hz for both ordinary1 and exceptional2 contingencies. This
1 ‘ordinary contingency’ means a single contingency from a contingency list;2 ‘exceptional contingency’ means the simultaneous occurrence of multiple contingencies with a common cause;

5
frequency range corresponds to the ordinary operation range. After power plant outages of 1 GW and depending on the system load frequency gradients of 5-10 mHz/s are presently observed in the CE power system /11/.
If, following an out-of-range3 contingency, the primary control reserves are exhausted or the resulting imbalance exceeds the reference incident of 3 GW, the system frequency as well as the frequency gradient reach exceptional values and the system state is called alert /3/. When the global security of the system is endangered or/and under frequency load shedding is activated the system is in the emergency state.
If the frequency exceeds the range of 47.5 Hz or 51.5 Hz, a system blackout can hardly be avoided. Consequently the system will reach the so-called blackout state and will have to be restored.
Current and future challenges
It is important to distinguish clearly between the current ability of the power system to withstand extreme frequency gradients and the desired frequency gradients derived from future system expansion and enforcement plans or changes with respect to power generation sources and technology.
Current transient response capability of the CE power system
Within the last 15 years the Continental European power system has experienced three serious disturbances /8-10/. Frequency gradients in a range between 100 mHz/s up to 1 Hz/s have beenrecorded.
Based on the experience of dynamical phenomena across the power system of Continental Europe, it is possible to state that transients triggered by 20% of imbalance with a RoCoF greater than 1 Hz/s are critical and, in some cases, a chain reaction of adverse events (loss of generating units, untimely trips,…) can drive the system to unpredictable system states. The ENTSO-ERegional Group Continental Europe, subgroup System Protection and Dynamics has elaboratedconclusions of the studies performed and recommendations with respect to dispersed generation and load shedding criteria that can significantly reduce the risk of loss of control over the system/5,6/.
Required transient response capability for future system design
The interconnected power system of CE faces a rapid change in the structure and geographic distribution of generation. Due to an increasing share of non-synchronous generation and a decreasing share of synchronous generation (the latter provides the main part of the system inertia today) the locally available system inertia decreases. In addition, increasing transmission capacities enable higher amounts of power transfers between different parts of the system and
3 ‘out-of-range contingency’ means the simultaneous occurrence of multiple contingencies without a common cause, or a loss of power generating modules with a total lost capacity exceeding the reference incident (which equals to 3000 MW in Continental Europe);

6
thus lead to increasing the amount of possible imbalances in case of a system split, which directly affects frequency stability as shown in the following chapters.The future challenge regarding frequency stability will differ across Continental Europe. There are regions in Continental Europe where the amount of possible imbalances is capped by limited transmission capacities between those regions and other parts of the system, e.g. the Iberian Peninsula. On the other hand, there are other regions where, based on current and future expected transmission needs (e.g. in Germany), the transmission capacities are continuously increasing.
Therefore, the reference scenario for the future indicates that the system must be able to resist, under split scenarios, conditions dividing the Continental European power system according to /7/, with imbalances greater than 40%. This may lead to Rate of Change of Frequency (RoCoF) higher than 2 Hz/s.
4. Normative Incidents
The magnitude of possible imbalances differs significantly between scenarios of interconnected operation and system split scenarios. This results in different amounts of generation which needto be adapted to the load (or, vice versa, load to generation), and different requested speeds to accomplish this process. Therefore, two normative incidents need to be defined, one for interconnected operation and one for system split. However, it should be noted that for power system restoration after a serious event it is of crucial importance to know if stable and powerfulneighbouring systems are available which via their interconnections can ease the restoration and stabilisation of the disturbed power system area.
Interconnected operation (normative contingency)
The normative contingency (reference incident) for interconnected operation in Continental Europe is the tripping of two of the largest generating facilities connected to the same busbar. This results in the well-known reference incident which defines the required primary reserves in the system. It is 3000 MW, see Figure 1. Many years of interconnected operation show that this normative contingency is well suited. No load shedding is allowed during the normal system operation.

7
Figure 1: System response after the normative contingency (reference incident) in interconnected operation /4/.
System split (out of range contingency)
In case of a system split, exports and imports before the occurrence of the split turn into imbalances of the islands after the split. The larger the export or import of the island before the split, the higher the imbalance after the split, and therefore the higher the amount of generation which needs to be adapted to the load (or, vice versa, the amount of load to be adapted to the generation), and the higher the requested speed of accomplishing this process.
The frequency gradient of the resulting islands is in the range of hundreds of mHz/s. In such cases the frequency drop in the underfrequency island is stabilised by the activation of system protection below 49 Hz (automatic underfrequency load shedding) and in overfrequency island by the corresponding power reduction of the generation units.
A normative incident for system split needs to be defined, in order to dimension the correspondingamount and speed of the load /generation adaption (including under-frequency load shedding andLFSM-U/O - limited frequency sensitive mode - under/over-frequency), and based on this to determine the minimum inertia.
The definition of a normative incident for system split shall consist of:
· the maximum imbalance and
· the maximum admissible Rate of Change of Frequency (RoCoF) or minimum required inertia
for which the possible island is supposed not to black out for frequency stability reasons.
Frequency nadir
8
Because it is impossible to predict where system splits occur, a generalised approach coveringany split scenario has to be used. Therefore, the maximum imbalance shall be expressed as a percentage of the load in a region (a possible island).
Normative incident for Continental Europe
As previously stated, the current power system cannot withstand imbalances greater than 20% and rate of change of frequency exceeding a few hundreds of mHz/s. Even a less critical case might lead to a partial blackout.However, target values for future system enforcements and related market simulations with higher power exchanges and deployment of future generation technologies are in the range of 40% for maximum imbalance, with maximum frequency gradient of 2 Hz/s. This numbers are based on corresponding system development plans accompanied by related dynamic system studies and confirmed by latest events such as the Turkey blackout of year 2015.
5. System Modelling Approach
For analysing frequency stability issues for the synchronous zone of Continental Europe a simplified approach using a balancing model is chosen. /1, 5, 6, 7/.
The structure of the model used is shown in Figure 2. During undisturbed operation the load PLoad
and generation PGeneration is balanced. In case of a disturbance, e.g. tripping of a generating unit, an imbalance DPImbalance leading to frequency deviations occurs. As a consequence, intrinsic mechanisms and control reactions are activated, stabilising the system frequency.

9
Figure 2: General block diagram of the balancing model4. PRC: Primary Reserve Control, SCR: Secondary Reserve Control, LFSM-O.
Intrinsic mechanisms
Intrinsic mechanisms, such as inertia and the self-regulating effect of loads, are considered in the model as marked in Figure 2. If in a first step control reactions are neglected, the imbalance between generation and load is balanced by accelerating/decelerating the rotating masses of the system (inertia), particularly those of synchronous generators. In addition, the load, especially induction motors, provides inertia to the system, but its contribution is comparatively low and is therefore neglected /12/.
The second intrinsic mechanism is the so-called self-regulating effect of the load that in analogy with synchronous machines represents the energy that the load can exchange with the system due to frequency deviation. A change in frequency leads to a proportional change in power consumption of the load which stabilises the system frequency.
4 This model represents the whole system with only one simplified rotating machine. It will therefore not represent local oscillations that could trigger some frequency sensitive relays. As this phenomenon will be located only in some parts of the grid, we consider it negligible.
Control reactions
Intrinsic mechanisms
PRC
SRC
LFSMO
Synthetic Inertia
etc.
Selfregulating effect of Loads
Load shedding
fPImbalance
PGrid
PGeneration
PImport/Export
PLoad+
+
+
+
+
+
+
+
+
+
+
TN

10
Control reactions
In addition, control reactions are designed to maintain the system frequency. Primary and secondary control (PRC and SRC) are part of the model. PRC is designed for the normative incident in interconnected operation (see chapter 4). Further control reactions are designed for the defence plan, e.g. load-shedding and over-frequency infeed reduction. These control reactions are also included in the model, as marked in Figure 2. Other control reactions such as synthetic inertia can also be included in the model.
Inertia based on synchronous and non-synchronous share of generation
The generation in the model is divided into synchronous and non-synchronous share. Only synchronous generators contribute to system inertia. The system inertia in the model is defined by the acceleration time constant of the network TN:
�� = � ��,��,�∗����,��,���
����� (1)
TA,SG,n is the acceleration time constant and PNom,SG,n the nominal power of each synchronous generator in operation. The acceleration time constant of each power plant TA,SG,n is calculated with the moment of inertia J and the nominal angular velocity WN:
��,��,� = �∗W������,��,� (2)
If, for example, the system load PLoad is 100 GW and the nominal power of the synchronous generation is 50 GW (which means that the other 50 MW are produced by non-synchronousgeneration) with an acceleration time constant TNom,SG,n = 10 s of every single synchronous generator, this results in an acceleration time constant of the network TN = 5 s. On the other hand, if there is no non-synchronous generation in the system, the time constant of the network will amount to TN = 10 s.
The power-frequency behaviour based on such a model is shown in /1, 6, 7/.
6. Boundary Conditions and Impacting Factors
The boundary conditions for frequency stability analysis are the steady-state frequency range, the frequency nadir, and the maximum rate of change of frequency (the latter defined in chapter 3). The main impacting factors within the scope of the frequency stability analysis can be captured with the definition of the maximum Rate of Change of Frequency (RoCoF) which occurs during the first instants after an incident:
RoCoF��� = ������� = ∆����������
����� ∗ ���� (3)
The maximum RoCoF is defined by the acceleration time constant of the network TN (inertia) and the imbalance ∆PImbalance related to the system load PLoad (imbalance ∆pImbalance in per unit). If theinertia and the maximum imbalance are identified, the maximum RoCoF results from this equation. The self-regulating effect of loads and control reactions like primary control reduce the RoCoF.
A future possible application is controlling the converters of static generators, in order to introduce synthetic inertia in the system. Thanks to these control techniques the increase of the static generation may counteract a reduction of the system inertia, with a consequent improvement of the dynamic behaviour of the system in response to a fault. However, depending on the sources behind the converters the impact will have to be analysed in detail as the corresponding activation time and capacity have restrictions.
11
In case of interconnected operation (see chapter 4), it has to be analysed if the system behaviour for future scenarios still complies with today’s requirements.
In case of system splits (see chapter 4), the defence plan comes into effect. For under-frequency events, LFSM-U as well as under-frequency load shedding take effect. However, the impact of the rate of change of frequency on the correct activation of under-frequency load shedding (UFLS) needs to be taken into account as well. For the UFLS design study performed in 2014-2015, different scenarios with different amounts of system inertia were considered, but the range of variation was not as wide as the one used for the present study. It means that a minimum inertia of the system must be ensured in order to allow the UFLS to properly stabilize the frequency in some extreme circumstances. For over-frequency events, the over-frequency infeed reduction (LFSM-O) takes effect. In case of scenarios with low system inertia combined with high imbalances, the efficacy of today’s defence plan has to be verified and further measures have to be analysed.
Interconnected operation
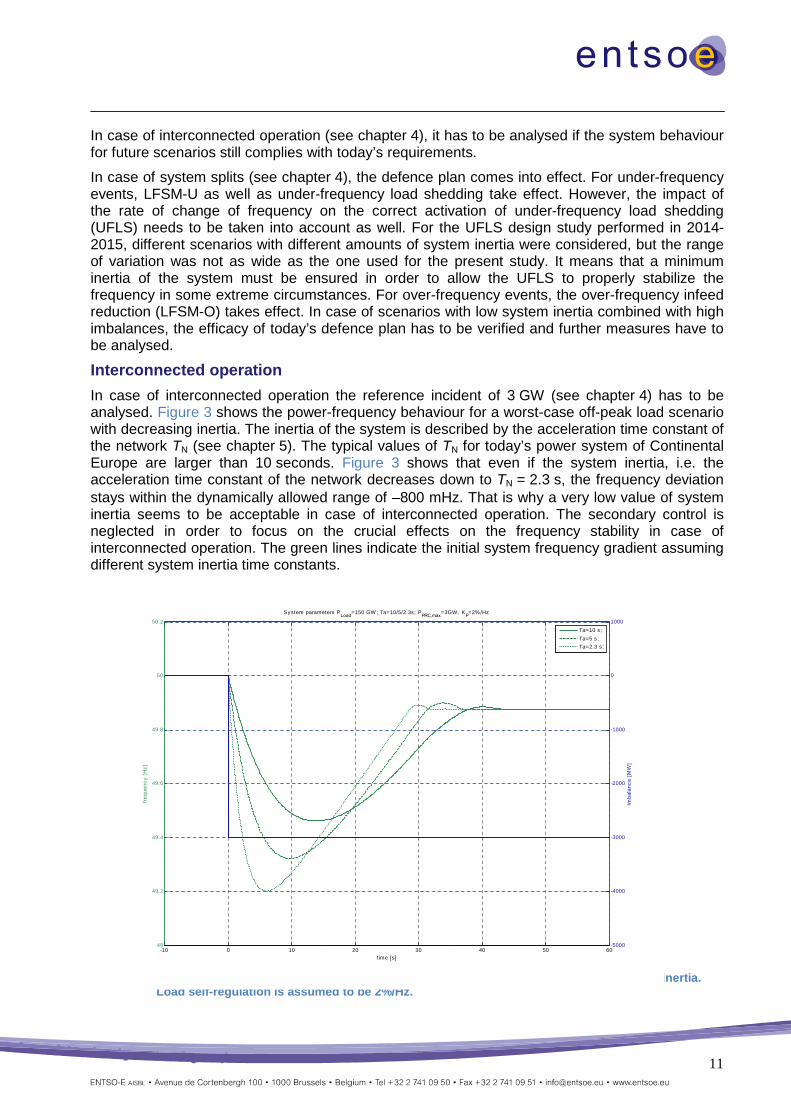
In case of interconnected operation the reference incident of 3 GW (see chapter 4) has to be analysed. Figure 3 shows the power-frequency behaviour for a worst-case off-peak load scenario with decreasing inertia. The inertia of the system is described by the acceleration time constant of the network TN (see chapter 5). The typical values of TN for today’s power system of Continental Europe are larger than 10 seconds. Figure 3 shows that even if the system inertia, i.e. theacceleration time constant of the network decreases down to TN = 2.3 s, the frequency deviation stays within the dynamically allowed range of ±800 mHz. That is why a very low value of system inertia seems to be acceptable in case of interconnected operation. The secondary control is neglected in order to focus on the crucial effects on the frequency stability in case of interconnected operation. The green lines indicate the initial system frequency gradient assuming different system inertia time constants.
Figure 3: Example of load-frequency behaviour for the normative incident with decreasing system inertia. Load self-regulation is assumed to be 2%/Hz.
-10 0 10 20 30 40 50 6049
49.2
49.4
49.6
49.8
50
50.2
System parameters PLoad
=150 GW ; Ta=10/5/2.3s; PPRC,max
=3GW , KP=2%/Hz
time [s]
fre
qu
en
cy
[H
z]
-5000
-4000
-3000
-2000
-1000
0
1000Im
ba
lan
ce
[M
W]
Ta=10 s;
Ta=5 s;
Ta=2.3 s;
12
System split
Compared to the reference incident during interconnected operation, much higher imbalancesmay occur in case of a system split. If the imbalance increases and the load of the remaining islands after a system split is smaller (compared to the load of the whole interconnected system), the RoCoF increases according to equation 3. The RoCoF increases additionally if the system inertia (measured by the acceleration time constant TN) of the remaining island after the system split is lower than the system inertia of the whole interconnected system.
Transmission capacities between parts of the Continental European power system haveincreased considerably. Furthermore, the infeed of converter based generation, not contributing to system inertia, is growing rapidly. Due to the fact that the transmission of active power before a system split defines the imbalance after the system split, the increase of transmission capacities and local decrease of system inertia have an impact on frequency stability. Therefore, the impact on frequency stability needs to be analysed for potential system split scenarios.
Note concerning model validity: the model is based on an equation with a single mass and,therefore, does not represent the transient that happens between different synchronous machines of the split area. At this point it will be assumed that a transient having a local effect has a negligible impact on LFSM-O and under frequency load shedding.
7. Frequency Stability Evaluation
As described in chapter 6, the frequency stability is not endangered during interconnected operation even if the penetration of non-synchronous generation is very high, whereas system splits may be very critical. As a consequence, the evaluation within Continental Europe has to focus on system split scenarios. Therefore, only system split scenarios are considered for the frequency stability evaluation in this chapter.
The chapter is divided into two main parts. The first part describes the general procedure to evaluate the frequency stability with the aim of defining the minimum inertia, which is of principal interest in under-frequency regime. The second part evaluates the maximum response time in over-frequency regime to maintain the frequency stability.
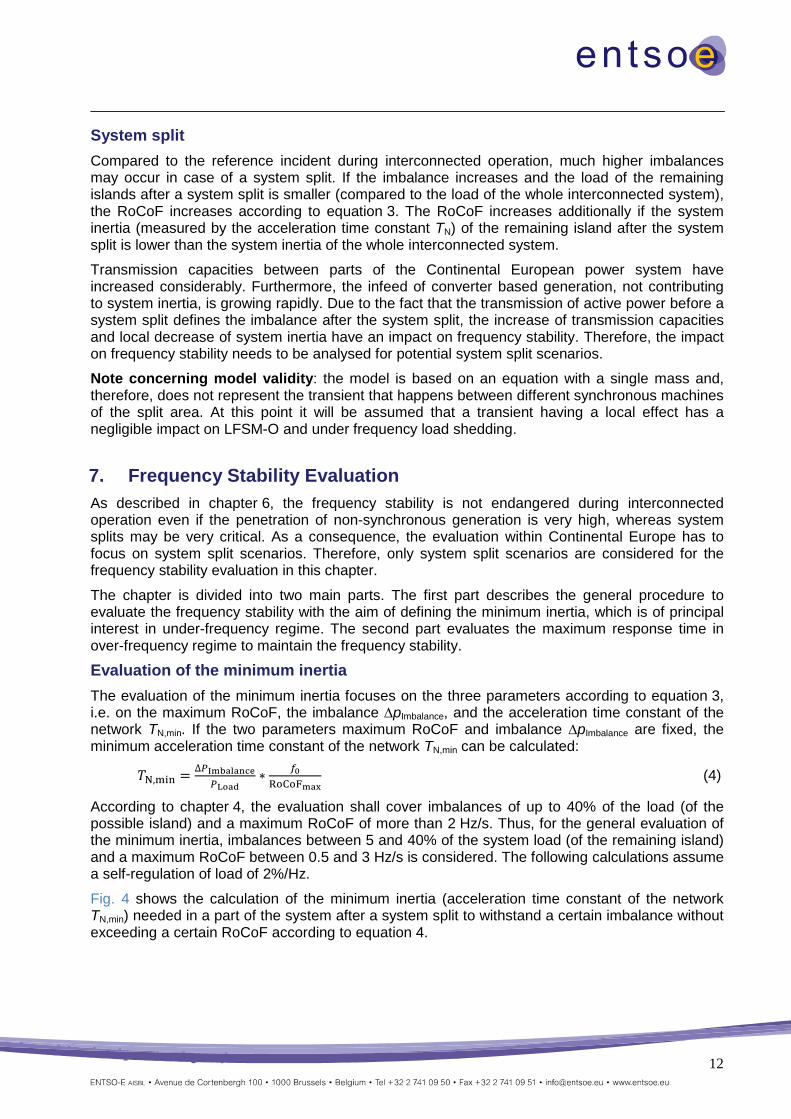
Evaluation of the minimum inertia
The evaluation of the minimum inertia focuses on the three parameters according to equation 3, i.e. on the maximum RoCoF, the imbalance ∆pImbalance, and the acceleration time constant of the network TN,min. If the two parameters maximum RoCoF and imbalance ∆pImbalance are fixed, the minimum acceleration time constant of the network TN,min can be calculated:
��,��� = ∆��������������� ∗ ��
�������� (4)
According to chapter 4, the evaluation shall cover imbalances of up to 40% of the load (of the possible island) and a maximum RoCoF of more than 2 Hz/s. Thus, for the general evaluation of the minimum inertia, imbalances between 5 and 40% of the system load (of the remaining island) and a maximum RoCoF between 0.5 and 3 Hz/s is considered. The following calculations assume a self-regulation of load of 2%/Hz.
Fig. 4 shows the calculation of the minimum inertia (acceleration time constant of the network TN,min) needed in a part of the system after a system split to withstand a certain imbalance without exceeding a certain RoCoF according to equation 4.

13
Figure 4: System inertia correlated to RoCoF and maximum system imbalance acc. to equation 4
Table 1 contains some examples for this calculation
Table 1: Calculation of the minimum inertia (acceleration time constant of the network TN,min). TN,min is calculated from equation 4.
p Imb alance [%] RoCoFmax [Hz/s] T N ,min [s]
5 0.5 5.05 1 2.55 2 1.35 3 0.8
10 0.5 10.010 1 5.010 2 2.510 3 1.715 0.5 15.015 1 7.515 2 3.815 3 2.520 0.5 20.020 1 10.020 2 5.020 3 3.330 0.5 30.030 1 15.030 2 7.530 3 5.040 0.5 40.040 1 20.040 2 10.040 3 6.7

14
If, for example, a region of the Continental European power system after a system split defines that its maximum imbalance is 15% and its maximum RoCoF is 2 Hz/s, the minimum inertia of this region accounts for an acceleration time constant of the network of TN,min = 3.8 s.
Taking into account that the current acceleration time constant of the network TN is between 12 s and 15 s, it is not to be expected that regions after a system split may have an acceleration time constant of the network TN,min greater than 15…20 s.
In general, it can be stated that sets of parameters (RoCoF + imbalance) leading to minimumneeded system inertia (TN) higher than 10 s or 12 s are not feasible.
This means that, as (in general) non-synchronous generation does not provide system inertia, the penetration of non-synchronous generation has to be restricted in scenarios with the needed minimum inertia higher than 12 s.
Figure 5 shows the maximum penetration of non-synchronous generation depending on RoCoFand imbalance considering that synchronous generators provide a system inertia of (e.g.) 10 seconds. The three different surfaces in the diagram show the change of the results considering different operating points of all synchronous generators (0.5, 0.75 and 1 pu), which means that, in order to cover the same load, more synchronous generators must be connected to the grid if their operating point is 0.5 than if it is 1 (consequently, more generators on the grid provide more inertia); see also Figure 6, 7, and 8 for a few exemplary settings.
The lower the operating point of the synchronous generation is, the higher the non-synchronous share can be.
Figure 5: Maximum system penetration with reference to RoCoF and system imbalance for the synchronous generation operating at 50%, 75% and 100% of rated output.
15
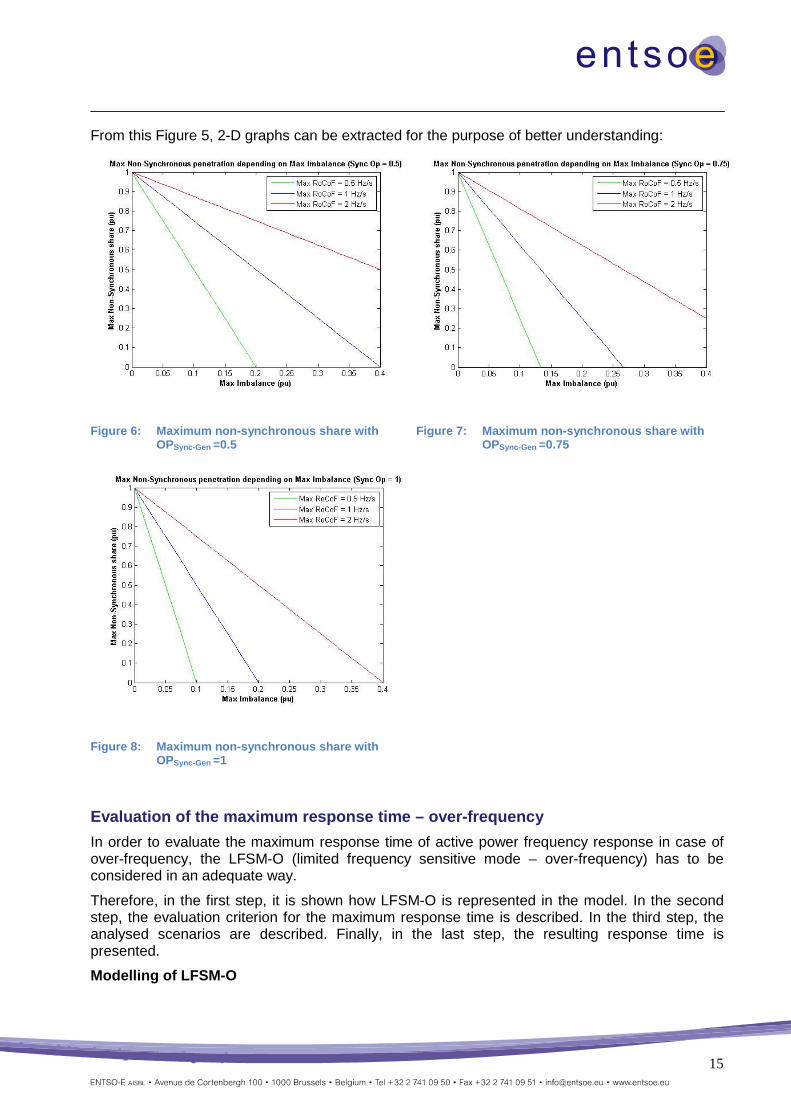
From this Figure 5, 2-D graphs can be extracted for the purpose of better understanding:
Figure 6: Maximum non-synchronous share with OPSync-Gen =0.5
Figure 7: Maximum non-synchronous share with OPSync-Gen =0.75
Figure 8: Maximum non-synchronous share with OPSync-Gen =1
Evaluation of the maximum response time – over-frequency
In order to evaluate the maximum response time of active power frequency response in case of over-frequency, the LFSM-O (limited frequency sensitive mode – over-frequency) has to be considered in an adequate way.
Therefore, in the first step, it is shown how LFSM-O is represented in the model. In the second step, the evaluation criterion for the maximum response time is described. In the third step, the analysed scenarios are described. Finally, in the last step, the resulting response time is presented.
Modelling of LFSM-O

16
According to /2/, a power generating module shall be capable of activating the provision of active power frequency response (i.e. the reduction of power output) according to Figure 9 at a frequency threshold between 50.2 Hz and 50.5 Hz with a droop s in a range of 2 – 12%.
In the current model, it is assumed that all non-synchronous generation units have such a response in over-frequency. For the following analysis the threshold is studied according to the ranges described in /7/. In addition, if required, the TSOs must comply with internal system defence plans. In the model, a high share of non-synchronous generation (corresponding to the minimum amount of system inertia according to Table 1 in chapter 7) regulating in over-frequency at different frequency thresholds (50.2 Hz, 50.3 Hz, 50.4 and 50.5 Hz) is assumed.
Regarding the modelling of the LFSM-O for the synchronous generation, it is important to stress that the present study is focussed on the first seconds after the event (and therefore on the significant contribution of the non-synchronous generation) when the RoCoF is the highest andthe contribution of synchronous machines is limited to inertia due to the fact that their governor response (comprising also the primary regulation) to LFSM-O is negligible, i.e. it does not act until seconds after an incident. However, after this time delay the role of the LFSM-O of synchronous machines is essential in the Over Frequency Control Scheme (OFCS) as they also contribute to restoring the equilibrium between generation and load.
Figure 9: Active Power Frequency Response capability of Power Generating Modules in LFSM-O, according to RfG /2/
The described droop characteristic defines how a power generating module shall respond to a given frequency deviation. However, the active power frequency response time of the power generating module is of utmost importance.
In order to have generally valid results, a generic approach is chosen. The active power frequency response time of the power generating modules is represented in a simplified way, taking into account the measurement delay and the transport delay, and taking into account the delays of active power activation by using a first-order delay (lead/lag).
Evaluation criterion for the maximum response timeTo evaluate the maximum response time an evaluation criterion has to be defined. Figure 10shows the step response DPmax (active power frequency response) for a defined step in Dfmax. This step is a per unit value defined as Dfmax = (fmax - fthreshold )/fnominal, whereas fmax = 51.5 Hz and fnominal = 50 Hz. The frequency threshold fthreshold includes values between 50.2 Hz and 50.5 Hz.

17
The evaluation criterion is defined as follows: For a defined measurement delay tmeasure the time t95% until 95% of full activation of maximum achievable active power frequency response (defined as step response DPmax) has to be so short that the frequency limit fmax of 51.5 Hz is not exceeded. The time t95% is related to the defined step in Dfmax and step response DPmax. Analysing different droops s (2 – 12%) and and steps in Dfmax (i.e. different frequency thresholds) results in different values of step response DPmax. This is also a per unit value representing the reduction of the power output of non-synchronous generation. It is calculated using the formula: DPmax = 100 / s * Dfmax.
To assess the maximum response time of the system according to the above criterion certainother system parameters like system load, RoCoF, imbalance, and synchronous operation pointneed to be varied. This was done combining the parameters in scenarios.
Figure 10: Evaluating the required time behaviour of LFSM-O.
ScenariosThe simulations done cover all the combinations of the following parameters:
· System Load: 220 GW and 440 GW
· Frequency threshold (Hz): 50.2, 50.3, 50.4 and 50.5
· Droop (pu): 0.02, 0.05, 0.10 and 0.12 (or in %: 2, 5, 10 and 12%)
· RoCoF (Hz/s): 0.5, 1, 2 and 3
· Imbalance (%): 5, 10, 15, 20, 30 and 40
· Synchronous operation point (%): 50, 75 and 100%
Step
resp
onse
DP
(for
DP m
ax=1
00/s
*Df m
ax)
Time tSt
ep D
f(f
or D
f max
=(f m
ax -
f thre
shol
d)/
f nom
inal
)
95%
t95%
tmeasure
18
For each of these simulations (2304) the maximum t95% for the activation of the LFSM-O wascalculated (as explained later in this chapter).
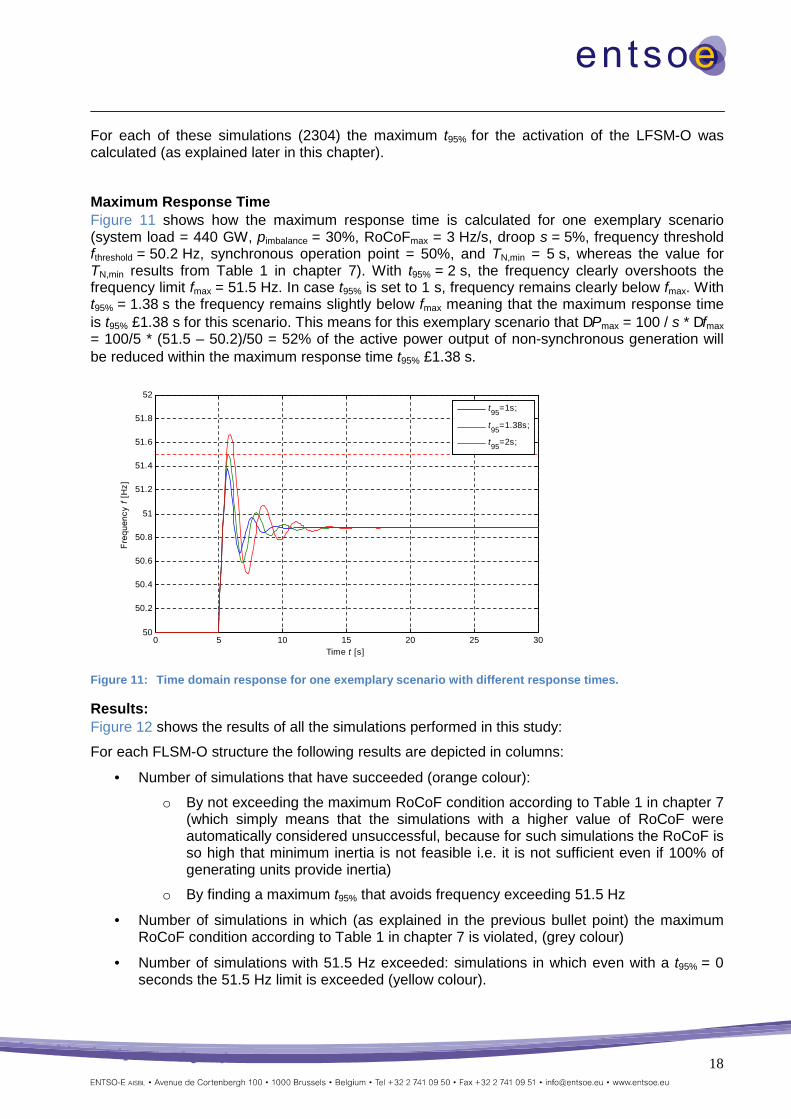
Maximum Response TimeFigure 11 shows how the maximum response time is calculated for one exemplary scenario(system load = 440 GW, pimbalance = 30%, RoCoFmax = 3 Hz/s, droop s = 5%, frequency threshold fthreshold = 50.2 Hz, synchronous operation point = 50%, and TN,min = 5 s, whereas the value for TN,min results from Table 1 in chapter 7). With t95% = 2 s, the frequency clearly overshoots the frequency limit fmax = 51.5 Hz. In case t95% is set to 1 s, frequency remains clearly below fmax. With t95% = 1.38 s the frequency remains slightly below fmax meaning that the maximum response timeis t95% £1.38 s for this scenario. This means for this exemplary scenario that DPmax = 100 / s * Dfmax
= 100/5 * (51.5 – 50.2)/50 = 52% of the active power output of non-synchronous generation willbe reduced within the maximum response time t95% £1.38 s.
Figure 11: Time domain response for one exemplary scenario with different response times.
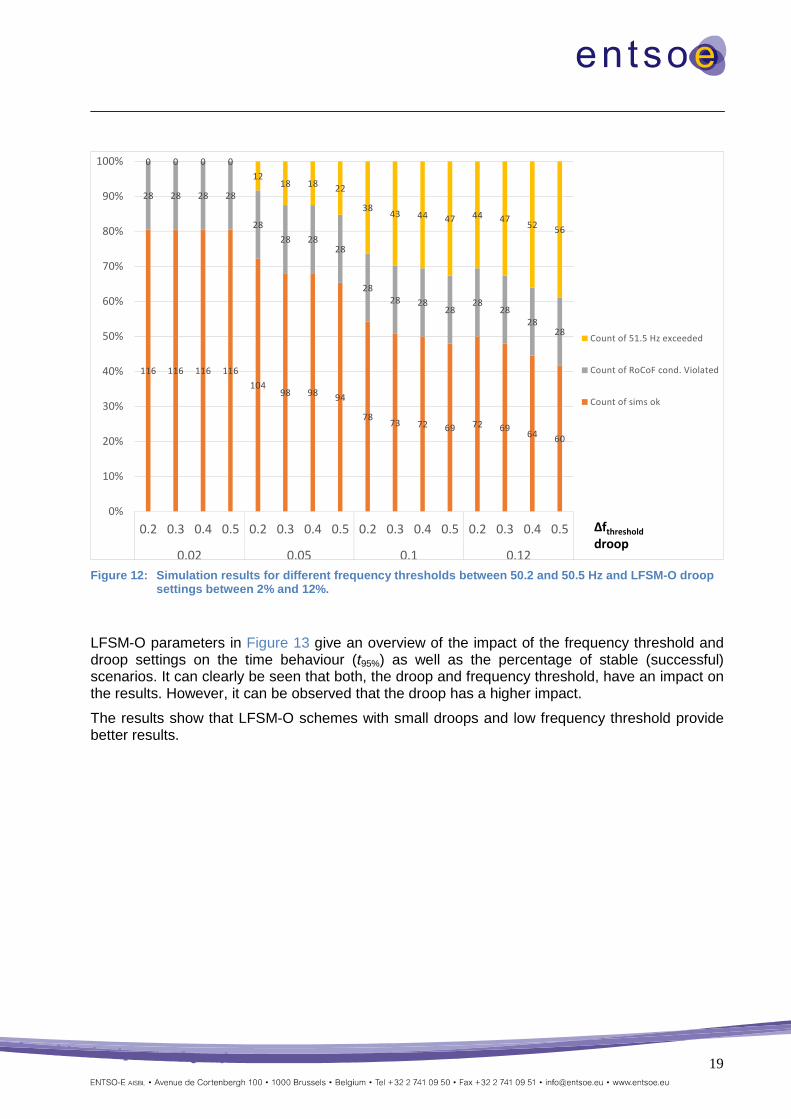
Results:Figure 12 shows the results of all the simulations performed in this study:
For each FLSM-O structure the following results are depicted in columns:
· Number of simulations that have succeeded (orange colour):
o By not exceeding the maximum RoCoF condition according to Table 1 in chapter 7(which simply means that the simulations with a higher value of RoCoF were automatically considered unsuccessful, because for such simulations the RoCoF is so high that minimum inertia is not feasible i.e. it is not sufficient even if 100% of generating units provide inertia)
o By finding a maximum t95% that avoids frequency exceeding 51.5 Hz
· Number of simulations in which (as explained in the previous bullet point) the maximum RoCoF condition according to Table 1 in chapter 7 is violated, (grey colour)
· Number of simulations with 51.5 Hz exceeded: simulations in which even with a t95% = 0 seconds the 51.5 Hz limit is exceeded (yellow colour).
0 5 10 15 20 25 3050
50.2
50.4
50.6
50.8
51
51.2
51.4
51.6
51.8
52
Time t [s]
Fre
qu
en
cy
f [
Hz
]
t95
=1s;
t95
=1.38s;
t95
=2s;
19
Figure 12: Simulation results for different frequency thresholds between 50.2 and 50.5 Hz and LFSM-O droopsettings between 2% and 12%.
LFSM-O parameters in Figure 13 give an overview of the impact of the frequency threshold and droop settings on the time behaviour (t95%) as well as the percentage of stable (successful) scenarios. It can clearly be seen that both, the droop and frequency threshold, have an impact on the results. However, it can be observed that the droop has a higher impact.
The results show that LFSM-O schemes with small droops and low frequency threshold provide better results.
116 116 116 116104
98 98 94
78 73 72 69 72 69 64 60
28 28 28 28
2828 28
28
2828 28
2828
2828
28
0 0 0 012
18 18 22
38 43 44 47 44 47 52 56
0%
10%
20%
30%
40%
50%
60%
70%
80%
90%
100%
0.2 0.3 0.4 0.5 0.2 0.3 0.4 0.5 0.2 0.3 0.4 0.5 0.2 0.3 0.4 0.5
0.02 0.05 0.1 0.12
Count of 51.5 Hz exceeded
Count of RoCoF cond. Violated
Count of sims ok
Δfthresholddroop

20
Figure 13: Percentage of stable scenarios depending on responds time and LFSM-O parameters
Figure 13 is a good tool for taking the decision on the maximum acceptable value of t95%; based on a compromise between the best results (t95% close to 0s) and the different technology opportunities, manly expressed by different combination of the key parameters.
Taking all that into consideration, a value of t95% < 1s seems to be suitable with regard to withstanding a significant number of system split scenarios.
In addition, Figure 14 shows the impact of the synchronous operating point.

21
Figure 14: Simulation results for the operating point of the synchronous generators.
8. Conclusion and Recommendations
At least for Continental Europe, but possibly also for smaller systems, system split scenarios have been identified as the most severe ones; compared to tripping of loads, HVDC-links, and generation during interconnected operation. Therefore, the present report concentrates on requirements and possibilities to withstand system split scenarios.
As a result of a system split an overfrequency island and an underfrequency island will be formed.
Underfrequency regime
In the underfrequency island, load shedding is used for restoring the balance between load and generation. Load shedding requires a time delay in order to measure and detect the underfrequency and to open circuit breakers. Therefore, the success of load shedding depends on the rate of change of frequency in combination with the time delay of load shedding.
Overfrequency regime
In the present report, for the overfrequency island the characteristics of the LFSM-O function of non-synchronous generating facilities play a crucial role. Three parameters are of particular interest: Steepness of the frequency change (rate of change of frequency = RoCoF); starting frequency point (delay) of the LFSM-O (e.g. 50.2 Hz or higher), and the speed of the power reduction (droop).
In the overfrequency regime, the sensitivity analysis is based on the principle of sharing the tasks between synchronous generation and non-synchronous generation according to the intrinsic strengths of each technology. Conventional power plants are able to provide inertia, but have problems with a very fast adaption of power output. Non-synchronous generation has no inherent inertial response, but it is able to swiftly adapt its power output. Within the scope of this study
768
768
768
539
466
410
64
192
192
165
110
166
0
100
200
300
400
500
600
700
800
900
0.5 0.75 1
# simulations
# sim ok
# RoCoF cond. Violated
# 51.5 Hz exceeded
SyncOpPoint
22
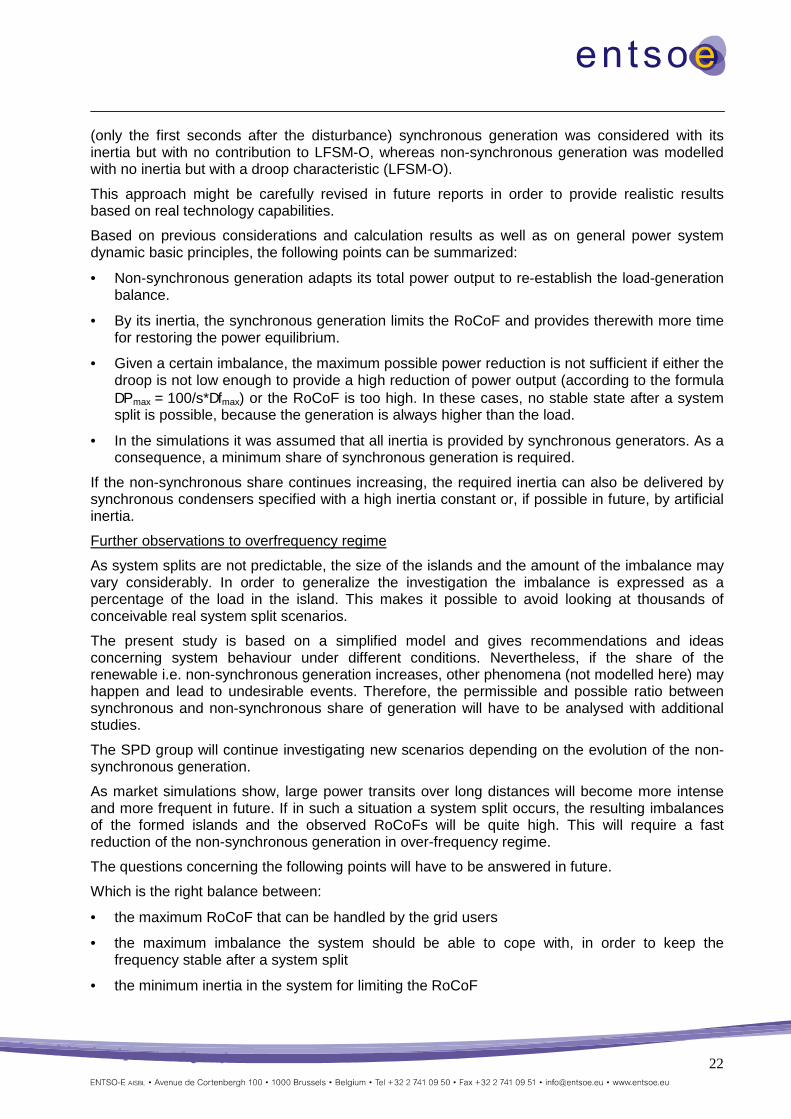
(only the first seconds after the disturbance) synchronous generation was considered with itsinertia but with no contribution to LFSM-O, whereas non-synchronous generation was modelled with no inertia but with a droop characteristic (LFSM-O).
This approach might be carefully revised in future reports in order to provide realistic resultsbased on real technology capabilities.
Based on previous considerations and calculation results as well as on general power system dynamic basic principles, the following points can be summarized:
· Non-synchronous generation adapts its total power output to re-establish the load-generation balance.
· By its inertia, the synchronous generation limits the RoCoF and provides therewith more time for restoring the power equilibrium.
· Given a certain imbalance, the maximum possible power reduction is not sufficient if either the droop is not low enough to provide a high reduction of power output (according to the formula DPmax = 100/s*Dfmax) or the RoCoF is too high. In these cases, no stable state after a system split is possible, because the generation is always higher than the load.
· In the simulations it was assumed that all inertia is provided by synchronous generators. As a consequence, a minimum share of synchronous generation is required.
If the non-synchronous share continues increasing, the required inertia can also be delivered by synchronous condensers specified with a high inertia constant or, if possible in future, by artificial inertia.
Further observations to overfrequency regime
As system splits are not predictable, the size of the islands and the amount of the imbalance may vary considerably. In order to generalize the investigation the imbalance is expressed as a percentage of the load in the island. This makes it possible to avoid looking at thousands of conceivable real system split scenarios.
The present study is based on a simplified model and gives recommendations and ideas concerning system behaviour under different conditions. Nevertheless, if the share of the renewable i.e. non-synchronous generation increases, other phenomena (not modelled here) may happen and lead to undesirable events. Therefore, the permissible and possible ratio between synchronous and non-synchronous share of generation will have to be analysed with additional studies.
The SPD group will continue investigating new scenarios depending on the evolution of the non-synchronous generation.
As market simulations show, large power transits over long distances will become more intenseand more frequent in future. If in such a situation a system split occurs, the resulting imbalances of the formed islands and the observed RoCoFs will be quite high. This will require a fast reduction of the non-synchronous generation in over-frequency regime.
The questions concerning the following points will have to be answered in future.
Which is the right balance between:
· the maximum RoCoF that can be handled by the grid users
· the maximum imbalance the system should be able to cope with, in order to keep the frequency stable after a system split
· the minimum inertia in the system for limiting the RoCoF
23
· the minimum performance (frequency threshold and minimum steepness of the droop characteristic and minimum measurement delay) of the non-synchronous generation within the scope of LFSM-O
For finding the answer, a lot of sensitivity analyses have been performed in the present report.
· The study hypothesis, based on operational experience and technology capabilities is the following: grid users shall be able to withstand a RoCoF of at least 2 Hz/s.
· The system shall be designed for maintaining stable frequency after a system split with an imbalance of at least 40 % between the generation and the load. This seems to be necessary if market-driven power transits further evolve.
The parameters of LFSM-O and the maximum RoCoF to be handled by generating facilitiesincluding their auxiliary equipment shall define the following parameters for each synchronous zone in the context of the national implementation process of NC RfG /2/, which is monitored by ENTSOE network code implementation WGs:
o Maximum RoCoF that can be handled by the grid users (generators & underfrequency load shedding schemes).
o The starting point of the LFSM-O droop (Dfthreshold)
o Droop of the LFSM-O
o The required time t95% until 95% of the full amount of active power frequency response within the scope of LFSM-O is deployed
Conclusion:
· By requiring these key parameters in the context of the implementation process of NC RfG, the behaviour of non-synchronous generating facilities is defined.
· The proposed proceeding lays the ground for an easy determination of the minimum inertia for each TSO, mainly based on potential system split scenarios as well as overall system control capabilities.
In /13/ on-line and operational forecast systems for inertia are discussed. In order to assess the regional distribution of inertia in Continental Europe similar bottom-up methods could be relevant.
9. Outlook
This document deals with the inertia of the power system. The inertia is mainly linked to the synchronous machines connected to the grid. The synchronous machines inherently provide the electrical power that is required by the load. The mechanical power fed to the turbine tries to follow the electrical load. The regulation is done using the very convenient property of synchronous machines defined by the rotating mass equation:
�.���� = �� − ��This equation ensures that for constant frequency the mechanical torque is equal to the electrical torque. This equation also provides the value of the inertia for the defined rate of change of frequency and mismatch between the mechanical and electrical torque. The rate of change of
24
frequency is the consequence of the change of the load which provokes the aforementionedmismatch.
The inverters that are used today to connect most of the renewable production are fully controllable sources. There is no inherent behaviour of these sources and the control is what drives the inverter.
The inverters are controlled in a manner that is totally different from synchronous generation; they are controlled to provide the grid with the active power that is produced by the prime mover (this being a PV cell or a wind turbine), regardless of the grid condition. Therefore, when a load is connected to the grid or a generation disconnected, the inverter does not provide any additional power.
However, as these sources are fully controllable, a regulation can be added to the inverter to provide “synthetic inertia”. This can also be seen as a short term frequency support. On the other hand, these sources might be quite restricted with respect to the available capacity and possible activation time. The inverters have a very low overload capability compared to synchronous machines. Therefore, the inertia that can be provided by an inverter depends on its operating point. If it operates close to its maximum power output, a very low inertia in the upward direction can be provided, and vice versa for the minimum operating point. This kind of control measures the grid frequency and changes the active power output of the inverter depending on the grid condition. When the frequency decreases, the power output can be increased, but only for a short period of time as there is no excess of primary energy to supply. When the frequency increases, the output power can be reduced for unlimited time.
The time response of the inverter for this kind of control can be short, less than 1-2 seconds, and it should therefore be taken into account in the relevant studies (compared to the time needed to adapt the power output of synchronous machines which amounts to tens of seconds).
For this kind of control the lack of inertia of the inverter is a big advantage, as it allows the active power to change very rapidly. Having a faster primary frequency response will decrease the frequency nadir.
In addition to the “synthetic inertia”, the inverter can also be used to provide frequency control in the sense of primary and secondary regulation. It might be more expensive to provide under-frequency control, because it requires from the non-synchronous generation (which is typically driven by a renewable energy source) to produce more power which is not directly available.
Setting renewables power units to work in a “derated” operating point may sound odd in the actual political context, but when a situation occurs that the renewables generation provides most of the power, it will probably also have to provide ancillary services such as frequency control.
As demonstrated in the main part of the present document, primary regulation has a very smallimpact on the transient behaviour of a system split. Moreover, the amount of primary reserve (3 GW) is usually negligible compared to the amount of imbalance of the split areas.
For more detailed answers with respect to specific islands and the exact impact of individual power plant control capabilities additional studies with corresponding detailed dynamic models will have to be performed.
Future solutions:
In the more distant future, a new way of controlling the inverters of renewables units can be envisaged. This can be done by considering the best existing devices used in islanded micro-grids and by trying to imagine their application in transmission grids. Today, some applications of inverters in standalone-mode provide an effect which is similar to inertia. For example, UPS (uninterruptible power supply) provides constant voltage and constant frequency for the load supplied. Multiple inverters can be used for UPS application in a reduced size network. This can

25
be the first step to a grid with sufficient inertial response. Many questions will have to be addressed before TSOs are able to apply this control in the transmission grid. This could, however, be the solution for a grid mainly fed by inverters.
10. References[1] Power System Inertia - Future Challenges and Requirements, RG-CE System Protection & Dynamics Sub Group,
24 September 2014. Internal report140924_Inertia_TF_v7.docx
[2] Network Code on Requirements for Grid Connection Applicable to all Generators (RfG)https://www.entsoe.eu/Documents/Network%20codes%20documents/NC%20RfG/draft_ec_networkCodesJune.pdf
[3] ENTSO-E Continental Europe Operation Handbook, Policy 5: Emergency Operations, Appendixhttps://www.entsoe.eu/fileadmin/user_upload/_library/publications/entsoe/Operation_Handbook/Policy_5_Appendix_final.pdf
[4] ENTSO-E Continental Europe Operation Handbook Policy 1: Load-frequency control and performance, Appendix
[5] Requirements for UFLS settings v22, RG-CE System Protection & Dynamics Sub Group, 06 November 2014, ENTSO-E internal report
[6] Dispersed generation report impact on CE region security, 11 December 2014https://www.entsoe.eu/Documents/Publications/SOC/Continental_Europe/141113_Dispersed_Generation_Impact_on_Continental_Europe_Region_Security.pdf
[7] Auswirkungen reduzierter Schwungmasse auf einen stabilen Netzbetrieb, Report of the German TSOshttp://www.netzentwicklungsplan.de/auswirkungen-reduzierter-schwungmasse-auf-einen-stabilen-netzbetrieb-zu-kapitel-442
[8] Final Report System Disturbance on 4 November 2006, https://www.entsoe.eu/fileadmin/user_upload/_library/publications/ce/otherreports/Final-Report-20070130.pdf
[9] Italian 2003 Blackout Report, https://www.entsoe.eu/fileadmin/user_upload/_library/publications/ce/otherreports/20040427_UCTE_IC_Final_report.pdf
[10] Turkey 2015 Blackout Report, https://www.entsoe.eu/Documents/SOC%20documents/Regional_Groups_Continental_Europe/20150921_Black_Out_Report_v10_w.pdf
[11] Das kontinentaleuropäische Verbundnetz – Herausforderungen des heutigen Netzbetriebs, W. Sattinger, R. Notter, M. Zerva, VSE Bulletin, http://www.bulletin-online.ch/de/themen/energietechnik/artikel-detailansicht/news/10063-das-kontinentaleuropaeische-verbundnetz.html
[12] Modelling and Aggregation of Loads in Flexible Power Networks, CIGRE Brochure 566, Feb. 2014
[13] Nordic Future System Inertia, Nordic Analysis Group, Future System Inertia project, Internal report Nordic reportFuture System Inertia.pdf