fresh food & food deserts in christchurch · a feasibility study into potential market profits,...
TRANSCRIPT

0 | P a g e
2016
Andrew LaCock, Joel Harvey, Sam Davidson
University of Canterbury
09/06/2016
Fresh Food & Food Deserts in Christchurch
Contents Abstract: .................................................................................................................................................. 2
1. Introduction: ................................................................................................................................... 3
2. Methods: ......................................................................................................................................... 3
2.1. Food Desert Analysis – Buffer Zone Method: ......................................................................... 3
2.2. Data Acquisition: ..................................................................................................................... 3
2.3. Data Manipulation: ................................................................................................................. 4
2.4. Shopping Habits and Vendors: ................................................................................................ 5
2.5. Vendor Interest in Market Locality: ........................................................................................ 7
3. Using the NZ Deprivation index: ..................................................................................................... 7
4. Literature Review: ........................................................................................................................... 8
5. Market Habit Analysis: .................................................................................................................. 11
5.1. Shoppers Habits: ................................................................................................................... 11
5.2. Vendors and Markets ............................................................................................................ 12
6. Results and Recommendations:.................................................................................................... 14
7. Future Research: ........................................................................................................................... 14
8. Conclusions: .................................................................................................................................. 15
9. Appendix: ...................................................................................................................................... 16
10. References: ............................................................................................................................... 22

2 | P a g e
Abstract:
Food desert analysis was conducted in the central city and eastern suburbs of Christchurch city with
the task of identifying potential locations for a fresh food market to service communities in low socio-
economic locations. Using geo-spatial buffer zone, and service area analysis, the suburbs of Aranui,
Bromley and Woolston South were identified as the most suitable locations for a potential fresh food
market. Consumer shopping trends were conducted on 5 supermarket and fast food outlets around
the city centre. The results of this analysis identified early to mid-afternoons as the busiest period for
supermarkets and early mornings as the quietest. Interviews with market vendors at pre-existing
markets in Christchurch found that vendors were primarily interested in a markets popularity rather
than its location or layout. Vendors were also not immediately interested in a market open in the early
afternoon due to free time available after morning markets. A feasibility study into potential market
profits, and research into future food transport systems (such as refrigeration) is recommended to
identify possible market success rates and how the market can adapt to global issues such as climate
change and food miles etc.

3 | P a g e
1. Introduction:
Food desert analysis investigates how local communities access ‘healthy food’ groups. Through
identifying regions where access to good food is restricted can help ensure local community initiatives
such as food markets can best serve the community in the surrounding areas. Understanding how
shoppers and vendors use these local community markets can also be used as a means to studying
potential success and failure of a new market initiative.
This report aims to identify potential suburbs where a new fresh food market could be located to best
service populations with a lack of access to ‘healthy food’ types. This will be done through conducting
a food desert analysis study on Christchurch central city and its eastern suburbs, by investigating
shopper’s habits between fast food outlets and supermarkets, and through interviews with vendors
at pre-existing markets to identify any potential limitations to market implementation and
development. Analysis of literature will also be used to identify how populations may respond to a
local market development.
2. Methods:
2.1. Food Desert Analysis – Buffer Zone Method:
In order to best analyse the extents of food deserts and understand Christchurch's socio-economic
situation within the eastern suburbs buffer zones were used and generated in Quantum GIS (QGIS),
and a service area analysis was generated using ArcGIS. The methods involved in generating these
outputs are broken into data acquisition and data manipulation.
2.2. Data Acquisition:
The data acquisition part of this step was done using google maps, and a location search engine called
Zenbu. The data from each of these sources was then cross referenced to check accuracy, and google
searches of the possible food outlets were done in order to check against these search methods and
identify any possible missed locations. The categories which were identified as a part of this data
acquisition were, supermarkets, green grocers, butcheries and fast food outlets. Data on locations of
markets, food co-operatives and food banks was acquired from research done by Marney Ainsworth,
Simon Roper and Luo Hao as a part of research on the effects of urban markets on community
development.
After initial analysis was run on these categories, community gardens were added to the list from the
Canterbury Community Gardens Association website. Shapefile data was acquired from; Koordinates,
a website which has a database of shapefiles and other spatial data for use in GIS analysis, and the

4 | P a g e
University of Canterbury bulk drive. The shapefiles used to complete this analysis were: kx-nz-area-
units-2006-census-SHP (Census mesh block data), kx-nz-road-centrelines-topo-150k-SHP (LINZ
supplied roadways data), and CHCh_Bus_Routes_Pre_Sept2010_Quake, a shapefile of food supply
location points generated from x,y coordinates in csv form, and Christchurch road network data if a
service area analysis is being run. For the census area unit data to be useful we needed to have
deprivation census data to add to the layer, which was acquired from statistics New Zealand as a part
of the 2013 census. We had intended to use bus stop data rather than bus route data, however this
data was incorrectly geo-referenced and was therefore not able to be used.
2.3. Data Manipulation:
Once the necessary data sets were acquired the census deprivation data was added to the census area
unit shapefile as a separate attribute, this allowed the analysis to compare the levels of deprivation
between different census units, then compare that to the availability of food supply in each area unit.
In order to compare all of these different food supply types and compare them to the census units
using QGIS was used in order to create buffer zones. Decisions regarding the sizes of buffer zones were
based on readings on food desert analysis, various distances used based on travel times and access
are used such as, 1000 metres based on 15 minute walking time (D’Acosta, 2015), 4000m based on a
5 minute driving time (Luan, Law, & Quick, 2015). Each of these studies, uses different buffer zone
values based on differing criteria. Each of these are based on networks and travel time for the
communities using the food supply locations. These values show that the standard distances used are
between 1000 metres and 3 miles (4828.02 metres) depending on the population density. Analysed
urban areas tended to be studied using a 1 mile (1.6km) buffer, which is why 1500 metres was chosen
as the buffer zone around food supply locations.
In order to display the area which was within an easily accessible range of the location; buffer zones
were created around all fast food locations, and around all other food source locations which were
then classified as access to healthy food. Another layer was created with centroids for each of the
census area units and buffer zones created around each of these in order to calculate the number of
‘healthy food’ locations each area unit had access to. A comparison between supermarkets and other
‘healthy food’ options was also identified as; supermarkets are not always used for access to healthy
food due of the abundance of high energy foods which are also located in supermarkets, and the lack
of knowledge regarding shopping habits/behaviour.

5 | P a g e
After conducting these two buffer zone analysis to see areas of the highest concentration of various
food types, the census data was added in order to display areas of higher or lower concentrations of
differing food supply compared to the deprivation index score for each census mesh block. Using an
intersection analysis, census area units which intersected with the buffer zones of food supply
locations were identified. From this it is possible to compare numbers of healthy food alternatives
compared to fast food locations for each census buffer zone. This was used to identify areas in most
‘need’ of healthy food supply.
As a second comparison, ArcGIS was used in order to create a service area for ‘healthy food’ options
only. A service area is a distance analysis based on road networks. This analysis is more complex than
buffer zone analysis however, the analysis does not provide sufficient accuracy to justify the use of a
more complicated analysis method. Further analysis was conducted using bus routes and buffer zones
around these routes, rather than buffers around bus stops. As the sourced bus stop data was
incorrectly geo-referenced, this data was ignored however, this made very little difference to analysis
due to the relative close proximity of bus stops in Christchurch. The use of the various outputs from
these generated buffer zones allowed for a simplistic comparison of coverage of each food type.
2.4. Shopping Habits and Vendors:
In conducting the analysis on shopper’s habits, a comparison of open hours and busy vs. quiet periods
for two different types of food outlet was undertaken. Supermarkets and fast food outlets were
chosen for study as the results could be used in conjunction with the GIS analysis mentioned in Section
2.1. The data used in the analysis of shopping habits was sourced from Google searches of identified
locations. Based on location data supplied to Google through registered user sourced location data,
popularity graphs are derived for each day of the week (Google, 2016). These graphs are available on
the primary result page for a business or location of interest (Figure XXXX) that has sufficient data
available (Google, 2016).

6 | P a g e
Based on the relatively low coverage of popularity graphs available for fast food outlets across the
eastern portions of the research area, the supermarkets and fast food outlets surrounding the centre
city were chosen. The following localities were identified and used for analysis:
Supermarkets:
- New World South City
- Countdown Moorhouse Avenue
- Pak n Save Moorhouse Avenue
- Supervalue Stanmore Road
- New World Stanmore Road
Fast Food Outlets:
- Mc Donalds Moorhouse Avenue
- Burger King Moorhouse Avenue
- Burger King Bealey Avenue
- Burger King Linwood
- KFC Shirley
Population graphs for each site were then interpreted to identify the busiest 4hr period (on average)
and quietest 4hr periods for each day of the week at each site. These datasets were then complied
per group to constrain the average ‘busiest’ and ‘quietest’ periods during the weekdays (Monday –
Friday) and weekends (Saturday and Sunday).
Figure 1: Google search results for C4 Coffee House, Christchurch illustrating popularity (graph supplied by Google).

7 | P a g e
2.5. Vendor Interest in Market Locality:
Analysis was also undertaken to try and constrain how vendors viewed market places and what factors
may influence their decisions with regard to market location and to operation hours. Informal
interviews were held at the Riccarton Bush Market held every Saturday morning, and the Opawa Food
Market held every Sunday morning. The discussions with vendors was primarily around their
respective business and how they viewed their transport options to get to and from the market they
were at. The discussion was continued a few weeks later looking at how the vendor would feel about
markets which may have been open at a different time of day than the market they were currently at.
3. Using the NZ Deprivation index:
The New Zealand Deprivation index is calculated from census data using the average individual
response within each mesh block. A mesh block contains approximately 60 persons, providing
individual response anonymity. Deprivation is based on responses to nine questions, designed to show
personal vulnerability through finance and interconnectivity (Figure 10). Although several parameters
can be choice-based, ie. Choosing not to own a car or use the internet, these choices do make
individuals less self-reliant, and therefore more vulnerable. The census data used in modelling is based
on census Area Units, which are based on geographic areas and are made up of mesh blocks. Because
the data is averaged, mesh block heterogenity is often under-represented, with the danger of ignoring
severely deprived clusters (Figure 2). This should be kept in mind when examining any population
average result.
Figure 2: Mesh Block representation in an Area unit. The average deprivation value is 8.

8 | P a g e
4. Literature Review:
The types of food we consume has a huge impact on health. One of the major issues facing Western
culture is that of obesity. Fast food is becoming more incorporated into daily routines, with a recent
study showing Americans on average spend half of their food budget on eating outside of the home
environment. In addition to this, a lower proportion of income is spent on food. The sad fact is that
unhealthy food is more affordable (price per portion size) than healthy alternatives. Unhealthy food
is best identified as a source of high, dense energy, with a low water percentage. These foods are high
in sugars and fats. The link between poverty and obesity initially seems counterintuitive, however
individuals will sacrifice quality of food before going without (Drewnowski & Specter, 2004).
Food deserts are areas where there is little to no reasonable access to healthy food options, such as
fresh fruit and vegetables. The concept of food deserts became more mainstream after their use in
the 2009 US Department of Agriculture study, which found 23.5 million Americans do not have a
supermarket within a mile of their home. Supermarket and specialty food suppliers were much more
densely distributed in affluent areas, often tightly clustered. Low income areas were mainly serviced
by convenience stores. Food desert studies have identified patterns of clustering with ethnic groups
and low-income households. An Auckland study found a correlation between the NZ Deprivation Index
and the ratio of supermarkets (considered a supplier of all food types) to fast food outlets, where high
deprivation areas had less access to healthy food, and increased access to fast food sources. The
proliferation of unhealthy food supply in an area was coined as ‘Food Swamps’ (Woodham, 2009).
Many dispute the efficacy of food desert analysis, where evidence exists to support a lack of
correlation between proximity to food types and consumption (Franco, 2015). When a supermarket
was added to an area identified as a food desert, surveys indicated a very minor positive change to
dietary behaviour. However, evidence supports the addition of zoning restrictions for fast food outlets
around low-income areas (Janne Boone-Heinonen, et al., 2011). This indicates that while access and
distance are factors of diet, for positive dietary change to occur, complementary or alternative
solutions need to be used.

9 | P a g e
Poor dietary habits can be linked to education levels, one of the deprivation index classifiers. Those
with low education levels are also likely to be low wage earners. Obesity can be related to eating
behaviours such as sporadic eating, where meals change in quality and quantity in cycles
(famine/feast). This behaviour is prevalent in low-income earners and those reliant on government
support systems such as food stamps (Burns, 2004). Education also plays a role in understanding a
healthy diet. Prioritisation of diet according to taste preference and perceived value is a common
symptom of poor dietary skill. Traditional skills in both food preparation and agriculture are being lost
through urbanisation, to the point where many are unfamiliar with vegetables.
Food marketing is a form of information source. A pilot study found that for a 1km radius around
several NZ secondary schools, 60% of advertising was for food products, of which over 70% were
classified as being unhealthy (Maher, Wilson, & Signal, 2005). Food advertising in the face of an over-
consuming society promotes an obesogenic environment. Advertising unhealthy food has been
compared to tobacco marketing in terms of the social harm the products may be causing. While health
advertising is beneficial, the impact is minimal compared to the combined advertising budgets of
multinational corporations.
The role of the government in promoting healthy living has mainly focused on informed individual
choice, through health marketing. Each person is assumed to be able to choose to eat healthily.
Studies have shown that obesogenic environments such as food deserts create a situation where
people unable to remove themselves from their environment are unable to change. The onus is
therefore on society to modify the environment through health reform policies (Hoek & McLean,
2016). There exists a paradox in government where the government aims to reduce dietary
consumption and promote healthy eating, but government producer policies endorse food over-
production. This in turn leads to very cheap, unhealthy foods being available at high volumes. New
Zealand is known globally as a free business market, which does promote economic growth, but in the
case of diet is increasing national health costs. In vehicle-dominant societies, much of the
disadvantage exists around access to public transport. Welfare and social networks in NZ and Australia
provide transport support for the disabled and infirm, but not for the unemployed and working poor
(J Coveney, 2009)

10 | P a g e
Markets have positive benefits for the community other than towards health. Suppliers are able to
have higher margins, while consumers are often able to buy goods at lower prices than retail value.
The addition of more fruit and vegetable suppliers to an area promotes competition, creating a ‘halo
effect’ of lower prices in supermarkets (Pearson 2014). Figure 3 however shows that specialty farmers
markets on average do not provide cheaper fruit and vegetables than area supermarkets. Niche
markets therefore are not likely to be beneficial to low-income communities where price is the main
barrier to obtaining fresh produce.
Figure 3: Comparison of average fruit and vegetable prices in Christchurch and Wellington (Sloane, 2014)
11 | P a g e
5. Market Habit Analysis:
5.1. Shoppers Habits:
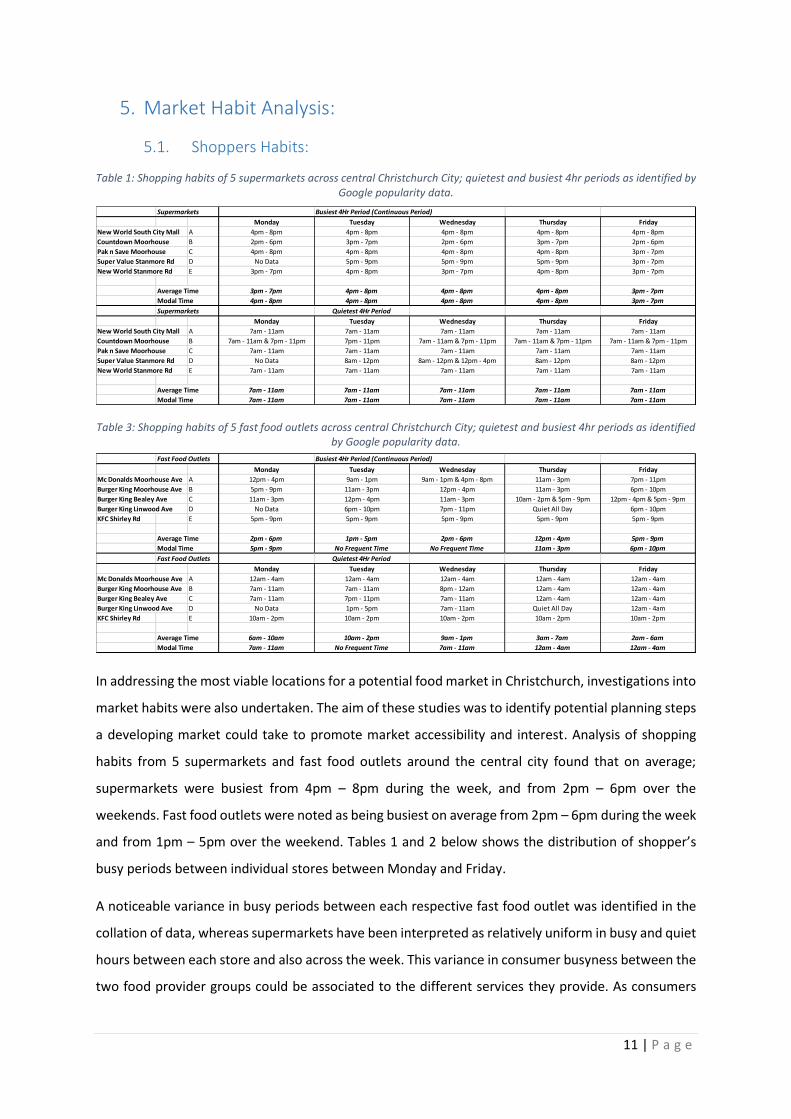
In addressing the most viable locations for a potential food market in Christchurch, investigations into
market habits were also undertaken. The aim of these studies was to identify potential planning steps
a developing market could take to promote market accessibility and interest. Analysis of shopping
habits from 5 supermarkets and fast food outlets around the central city found that on average;
supermarkets were busiest from 4pm – 8pm during the week, and from 2pm – 6pm over the
weekends. Fast food outlets were noted as being busiest on average from 2pm – 6pm during the week
and from 1pm – 5pm over the weekend. Tables 1 and 2 below shows the distribution of shopper’s
busy periods between individual stores between Monday and Friday.
A noticeable variance in busy periods between each respective fast food outlet was identified in the
collation of data, whereas supermarkets have been interpreted as relatively uniform in busy and quiet
hours between each store and also across the week. This variance in consumer busyness between the
two food provider groups could be associated to the different services they provide. As consumers
Supermarkets Busiest 4Hr Period (Continuous Period)
Monday Tuesday Wednesday Thursday Friday
New World South City Mall A 4pm - 8pm 4pm - 8pm 4pm - 8pm 4pm - 8pm 4pm - 8pm
Countdown Moorhouse B 2pm - 6pm 3pm - 7pm 2pm - 6pm 3pm - 7pm 2pm - 6pm
Pak n Save Moorhouse C 4pm - 8pm 4pm - 8pm 4pm - 8pm 4pm - 8pm 3pm - 7pm
Super Value Stanmore Rd D No Data 5pm - 9pm 5pm - 9pm 5pm - 9pm 3pm - 7pm
New World Stanmore Rd E 3pm - 7pm 4pm - 8pm 3pm - 7pm 4pm - 8pm 3pm - 7pm
Average Time 3pm - 7pm 4pm - 8pm 4pm - 8pm 4pm - 8pm 3pm - 7pm
Modal Time 4pm - 8pm 4pm - 8pm 4pm - 8pm 4pm - 8pm 3pm - 7pm
Supermarkets Quietest 4Hr Period
Monday Tuesday Wednesday Thursday Friday
New World South City Mall A 7am - 11am 7am - 11am 7am - 11am 7am - 11am 7am - 11am
Countdown Moorhouse B 7am - 11am & 7pm - 11pm 7pm - 11pm 7am - 11am & 7pm - 11pm 7am - 11am & 7pm - 11pm 7am - 11am & 7pm - 11pm
Pak n Save Moorhouse C 7am - 11am 7am - 11am 7am - 11am 7am - 11am 7am - 11am
Super Value Stanmore Rd D No Data 8am - 12pm 8am - 12pm & 12pm - 4pm 8am - 12pm 8am - 12pm
New World Stanmore Rd E 7am - 11am 7am - 11am 7am - 11am 7am - 11am 7am - 11am
Average Time 7am - 11am 7am - 11am 7am - 11am 7am - 11am 7am - 11am
Modal Time 7am - 11am 7am - 11am 7am - 11am 7am - 11am 7am - 11am
Table 1: Shopping habits of 5 supermarkets across central Christchurch City; quietest and busiest 4hr periods as identified by Google popularity data.
Table 3: Shopping habits of 5 fast food outlets across central Christchurch City; quietest and busiest 4hr periods as identified by Google popularity data.
Fast Food Outlets Busiest 4Hr Period (Continuous Period)
Monday Tuesday Wednesday Thursday Friday
Mc Donalds Moorhouse Ave A 12pm - 4pm 9am - 1pm 9am - 1pm & 4pm - 8pm 11am - 3pm 7pm - 11pm
Burger King Moorhouse Ave B 5pm - 9pm 11am - 3pm 12pm - 4pm 11am - 3pm 6pm - 10pm
Burger King Bealey Ave C 11am - 3pm 12pm - 4pm 11am - 3pm 10am - 2pm & 5pm - 9pm 12pm - 4pm & 5pm - 9pm
Burger King Linwood Ave D No Data 6pm - 10pm 7pm - 11pm Quiet All Day 6pm - 10pm
KFC Shirley Rd E 5pm - 9pm 5pm - 9pm 5pm - 9pm 5pm - 9pm 5pm - 9pm
Average Time 2pm - 6pm 1pm - 5pm 2pm - 6pm 12pm - 4pm 5pm - 9pm
Modal Time 5pm - 9pm No Frequent Time No Frequent Time 11am - 3pm 6pm - 10pm
Fast Food Outlets Quietest 4Hr Period
Monday Tuesday Wednesday Thursday Friday
Mc Donalds Moorhouse Ave A 12am - 4am 12am - 4am 12am - 4am 12am - 4am 12am - 4am
Burger King Moorhouse Ave B 7am - 11am 7am - 11am 8pm - 12am 12am - 4am 12am - 4am
Burger King Bealey Ave C 7am - 11am 7pm - 11pm 7am - 11am 12am - 4am 12am - 4am
Burger King Linwood Ave D No Data 1pm - 5pm 7am - 11am Quiet All Day 12am - 4am
KFC Shirley Rd E 10am - 2pm 10am - 2pm 10am - 2pm 10am - 2pm 10am - 2pm
Average Time 6am - 10am 10am - 2pm 9am - 1pm 3am - 7am 2am - 6am
Modal Time 7am - 11am No Frequent Time 7am - 11am 12am - 4am 12am - 4am

12 | P a g e
use fast food outlets when they are hungry, the
variance in busy hours could be interpreted as
‘lunch rush’ and ‘dinner rush’.
Supermarkets are relatively consistent in both
relative business and quietness across the
week. Table 1 shows each day of the week;
supermarkets are quietest between 7am - 11am
which are the initial opening hours for these
stores. Due to greater irregularity in open hours
for fast food outlets, there was more diversity
noted in quiet periods for these outlets. This can
be attributed to some fast food outlets opening
24hrs a day or becoming 24hrs later in the
week.
Tables 3a and 3b show busy and quiet shopping
periods for supermarkets (Table 3a) and fast
food outlets (Table 3b) between Saturday and
Sunday. Busy periods for fast food outlets are
again inconsistent between locations and days.
Supermarkets are again identified as being
consistently busiest in the afternoon and
quietest in the early opening hours.
5.2. Vendors and Markets
Vendors are an important aspect of any market, without any vendors a market does not exist. This
research also conducted informal interviews with some market vendors at the Riccarton Bush Market
and Opawa Food Market, held on Saturday and Sunday mornings respectively. The vendors
interviewed were asked about how they travelled to and from markets with produce and how the
hours of operation for markets worked for them. These questions aimed to assess if market location
and hours of operation were of primary concern to vendors.
Table 5a & 3b: Weekend shopping habits of 5 supermarket outlets (Left) fast food outlets (Right) across central
Christchurch City; quietest and busiest 4hr periods as identified by Google popularity data
Supermarkets Busiest 4Hr Period (Continuous Period)
Saturday Sunday
New World South City Mall A 4pm - 8pm 4pm - 8pm
Countdown Moorhouse B 1pm - 5pm 2pm - 6pm
Pak n Save Moorhouse C 1pm - 5pm 2pm - 6pm
Super Value Stanmore Rd D 2pm - 6pm 2pm - 6pm
New World Stanmore Rd E 2pm - 6pm 2pm - 6pm
Average Time 2pm - 6pm 2pm - 6pm
Modal Time 1pm - 5pm 2pm - 6pm
Supermarkets Quietest 4Hr Period
Saturday Sunday
New World South City Mall A 7am - 11am 7am - 11am
Countdown Moorhouse B 7am - 11am & 7pm - 11pm 7am - 11am & 7pm - 11pm
Pak n Save Moorhouse C 7am - 11am 7am - 11am
Super Value Stanmore Rd D 5pm - 9pm 8am - 12pm
New World Stanmore Rd E 7am - 11am 7am - 11am
Average Time 7am - 11am 7am - 11am
Modal Time 7am - 11am 7am - 11am
A
Fast Food Outlets Busiest 4Hr Period (Continuous Period)
Saturday Sunday
Mc Donalds Moorhouse Ave A 11am - 3pm & 8pm - 12am 11am - 3pm
Burger King Moorhouse Ave B 2pm - 6pm 5pm - 9pm
Burger King Bealey Ave C 11am - 3pm 11am - 3pm
Burger King Linwood Ave D 1pm - 5pm No Data
KFC Shirley Rd E 6pm - 10pm 2pm - 6pm
Average Time 1pm - 5pm 1pm - 5pm
Modal Time 11am - 3pm 11am - 3pm
Fast Food Outlets Quietest 4Hr Period
Saturday Sunday
Mc Donalds Moorhouse Ave A 3am - 7am 4am - 7am
Burger King Moorhouse Ave B 2am - 6am 7am - 11am
Burger King Bealey Ave C 3am - 7am 7am - 11am
Burger King Linwood Ave D 3am - 7am No Data
KFC Shirley Rd E 10am - 2pm 10am - 2pm
Average Time 4am - 8am 7am - 11am
Modal Time 3am - 7am 7am - 11am
B
13 | P a g e
After discussions with vendors at the fore-mentioned markets, all vendors interviewed did not seem
to hold market location as a primary concern with regard to travel times and logistics. Most vendors
were observed to arrive with their own methods of freight transport for product such as vans, ute’s,
and light commercial vehicles. The greatest influence to market choices vendors mentioned was the
overall popularity of the market. All vendors interviewed mentioned the popularity of the markets
they went to and why they chose to sell there. As for most vendors interviewed, the markets they sell
at were their primary income sources. Because of this they all had a strong focus on ensuring they
maximised sales at the markets they visited. One vendor interviewed mentioned they had stopped
travelling to one market which was closer to where they grew their produce in favour of committing
more time into another market which was more popular.
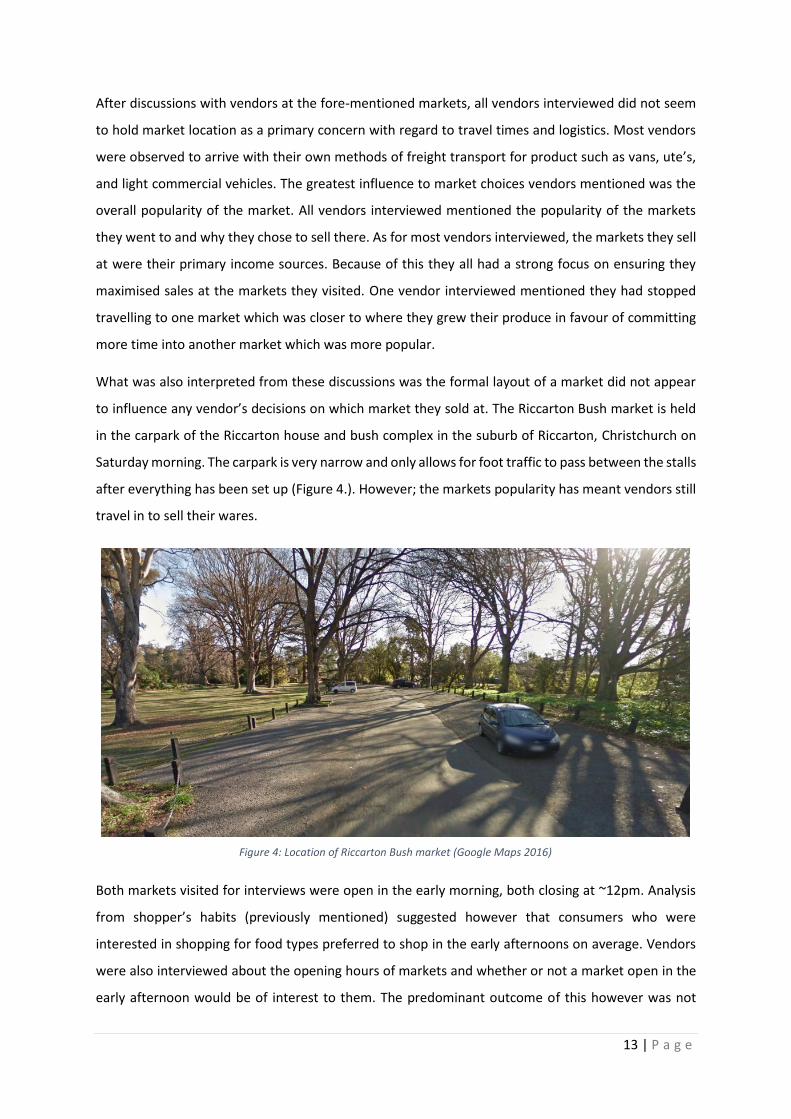
What was also interpreted from these discussions was the formal layout of a market did not appear
to influence any vendor’s decisions on which market they sold at. The Riccarton Bush market is held
in the carpark of the Riccarton house and bush complex in the suburb of Riccarton, Christchurch on
Saturday morning. The carpark is very narrow and only allows for foot traffic to pass between the stalls
after everything has been set up (Figure 4.). However; the markets popularity has meant vendors still
travel in to sell their wares.
Both markets visited for interviews were open in the early morning, both closing at ~12pm. Analysis
from shopper’s habits (previously mentioned) suggested however that consumers who were
interested in shopping for food types preferred to shop in the early afternoons on average. Vendors
were also interviewed about the opening hours of markets and whether or not a market open in the
early afternoon would be of interest to them. The predominant outcome of this however was not
Figure 4: Location of Riccarton Bush market (Google Maps 2016)

14 | P a g e
positive; the vendors interviewed had either not actively considered afternoon markets as an option
as they were not common in Christchurch, or they felt they would have to commit a full day to
preparation. One vendor mentioned they enjoyed having some time available in the afternoons after
everything from the morning market had been packed and sorted.
6. Results and Recommendations:
The buffer zones are best interpreted visually, whereas the intersection data is difficult to present in
map form. The easiest way to interpret these is via examination of the tables created by the
intersection analysis. From examination of the outputs created by the generated buffer zones it is
clear to see that there are areas of the eastern suburbs which area not serviced as well as the central
city. The main areas of deprivation can be seen from the tables to often be the main areas identified
as food deserts as well. As can be seen from the service area image the areas identified as food deserts
do not vary much from the areas identified as food deserts by the buffer zones.
Based on; literature studies, geo-spatial investigations of supermarket and fast food locations across
central and eastern Christchurch, and analysis of shopping habits of consumers at these localities and
interviews with market vendors, this report has found the following conclusions for market location
and operation:
Policy development is recommended to assist in education programmes and to promote
healthy eating habits in food deserts.
The market would best be situated the suburbs of Aranui, Bromley, or Woolston South
In order to service similar demographics as supermarkets, it should be open in the early
afternoons (between 2pm and 6pm)
Analysis of potential market popularity should be undertaken to identify possible revenue
streams for interested vendors.
7. Future Research:
There is substantial research which has been removed from this research as the scope was too great.
This however leads into significant future potential research as a result of the findings in this report.
The census area centroids used in the analysis for this report were geometric centroids based on the
shape of the census area units. If this were to be repeated an increase in accuracy may be seen from
using mean population weighted centroids, displaying the point which has the smallest possible
distance to all members of the area unit. In some areas this may have very little influence, however
areas with large green spaces or unoccupied spaces would see a larger difference.
15 | P a g e
Research into the potential feasibility of a future market in any of the research areas identified would
be an effective method of identifying how the market will be received in the community it would
reside. Further investigations into vendor requirements would also be advised. As society begins to
become more aware of issues such as climate change and food miles, an emphasis on food transport
may become more prevalent (Dabbene, Gay, & Sacco, 2008; Vanek & Sun, 2008). This point, coupled
with increasing improvements into refrigeration technology (Tassou, De-Lille, & Ge, 2009; Tassou,
Lewis, Ge, Hadawey, & Chaer, 2010) could be investigated in small scale markets to see how future
market developments could minimise impacts of greenhouse gas emissions as a result of food
transport.
8. Conclusions:
A food desert analysis was conducted in the central city and eastern suburbs of Christchurch city with
the aim of identifying potential locations for new food markets. These new food market(s) would be
tailored to service regions with identified food insecurities with healthier food groups. Results from
geospatial buffer zone and service analysis investigations identified the suburbs of Aranui, Bromley,
and Woolston South as the suburbs most likely to benefit from such a food market installation. Based
on literature reviews it was found however, that increased accessibility to healthier food groups did
not directly correlate to improved health in populations. Other factors such as government policies,
advertising, and public education are all important factors in promoting healthy food choices in
communities.
Interviews with vendors about food transport systems and market operation hours concluded that
vendors are sufficiently happy with their current self-driven transport systems and do not directly
weigh market location or layout as primary concerns when choosing potential sites to sell at. Vendors
were concerned with hours of market operation and popularity. Vendors interviewed were not
enthusiastic about opening stalls in the afternoons as the flexibility of morning markets allowed them
to have free time at the end of the day. Popularity was by the far the most important factor for vendors
when they chose what market to sell at. All vendors mentioned popularity in some context during
interviews.
Future research based on this report could focus on feasibility studies for each suburb identified to
begin to identify potential revenue streams. The results of these studies could be used in conjunction
with market vendors to determine market potential. Research into changing types of food
transportation systems with continuing developments in refrigeration systems and the food supply
sector to investigate how potential markets can adapt with modern consciousness regarding global
issues such as climate change.

16 | P a g e
9. Appendix:
This output displays buffer zones around the food sources classified as
healthy, sources classified as healthy food sources for the purpose of
this examination were supermarkets, community markets, food banks,
food co-ops, and community gardens.
Christchurch
Census Area
Unit
Deprivation
Index
Food Source
Buffer Zones
Christchurch
Road network
Low intensity
High intensity
Figure 5:Buffer zone map for all 'healthy food sources'

17 | P a g e
Christchurch
Census Area
Unit
Deprivation
Index
Food Source
Buffer Zones
Christchurch
Road network
Low intensity
High intensity
This image displays the buffer zones around fast food
sources and the intensity of their concentration.
Figure 6: Buffer zone map for fast food services

18 | P a g e
Christchurch
Census Area
Unit
Deprivation
Index
Food Source
Buffer Zones
Christchurch
Road network
Low intensity
High intensity
This image displays buffer zones around supermarkets and their
concentration
Figure 7: Buffer zone map for supermarkets

19 | P a g e
Christchurch
Census Area
Unit
Deprivation
Index
Food Source
Buffer Zones
Christchurch
Road network
Low intensity
High intensity
This image displays buffer zones around community initiatives and
their concentration. For the purpose of this display community
initiatives include community markets, food banks, food co-ops, and
community gardens.
Figure 8: Buffer zone map for community initiatives

20 | P a g e
Christchurch
Census Area
Unit
Deprivation
Index
Census Area
Unit Centroid
Buffer Zones
Centroid
Point
Christchurch
Road network
This image displays the centroid for each area unit as well as a
buffer zone around each of these centroids, an intersection was
run with these buffer zones and the food supply locations in
order to determine the number of healthy food options for
each census area unit.
Figure 9: Buffer zone map for census area centroids

21 | P a g e
Table 6: Access to number of stores classified as 'healthy' compared to deprivation for each census area unit
Suburb Healthy Food Access Deprivation
Aranui 4 10
Avon Loop 17 8
Avondale 4 5
Avonside 11 9
Bexley 4 9
Bromley 0 8
Burwood 2 5
Cathedral Square 8 7
Chisnall 5 8
Dallington 4 6
Edgeware 8 7
Ensors 4 8
Ferrymead 1 7
Hagley park 6 6
Linwood 13 9
Linwood East 4 9
Linwood North 8 8
Mairehau 3 4
Marshland 2 3
Mona Vale 0 1
Mt Pleasant 0 7
New Brighton 5 7
North Beach 0 6
Opawa 0 4
Phillipstown 9 9
Rawhiti 5 8
Richmond North 7 5
Richmond South 9 9
Rutland 2 2
Shirley East 3 8
Shirley West 3 8
St Albans East 7 7
St Martins 0 2
Sydenham 4 8
Travis 0 5
Waltham 5 9
Woolston South 0 9
Woolston West 6 9

22 | P a g e
10. References:
Burns, D. C. (2004). A review of the literature describing the link between poverty, food insecurity and
obesity, Australia. VicHealth.
Drewnowski, A., & Specter, S. (2004). Poverty and Obesity: the role of energy density and energy costs.
American Journal of Clinical Nutrition, 6-16.
Franco, A. (2015, June 8). Are 'Food Deserts a Myth or Simply Misidentified? Highbrow Magazine.
Hoek, J., & McLean, R. (2016). Ch 4: Changing Food Environment and Obesity. In K. Witten,
Geographies of Obesity: Environmental Understandings of the Obesity Epidemic. Routledge.
J Coveney, L. A. (2009). Effects of Mobility and location on food access. Health and Place, 45-55.
Janne Boone-Heinonen, P., Penny Gordon-Larsen, P., Catarina I. Kiefe, M. P., James M. Shikany, D.,
Cora E. Lewis, M., & Barry M. Popkin, P. (2011, July 11). Fast Food Restaurants and Food
Stores,Longitudinal Associations With Diet in Young to Middle-aged Adults: The CARDIA Study.
JAMA Internal Medicine, 1162-1170.
Luan, H., Law, J., & Quick, M. (2015). identifying Food Deserts and Swamps Based on Relative Healthy
Food Access: A Spatial-Temporal Bayseain Approach. International Journal of Health
Geography.
Figure 10: Census identification criteria of deprivation for respondents

23 | P a g e
Maher, A., Wilson, N., & Signal, L. (2005, July 15). Advertising and Availability of 'obesogenic' foods
around NZ secondary schools: a pilot study. New Zealand Medical Journal.
Sloane, K. (2014, March 25). Study of NZ fruit & vegetable prices suggests markets best value-for-
money. Retrieved from Public Health Expert (Otago University):
https://blogs.otago.ac.nz/pubhealthexpert/2014/03/25/study-of-nz-fruit-vegetable-prices-
suggests-markets-best-value-for-money/
Woodham, C. (2009). Food Desert or Food Swamp? an in depth exploration of neighbourhood food
environments. Dunedin: University of Otago.
Dabbene, F., Gay, P., & Sacco, N. (2008). Optimisation of fresh-food supply chains in uncertain
environments, Part I: Background and methodology. Biosystems Engineering, 99(3), 348–359.
http://doi.org/10.1016/j.biosystemseng.2007.11.011
Google. (2016). Popular Times. Retrieved June 8, 2016, from
https://support.google.com/business/answer/6263531?hl=en
Tassou, S. A., De-Lille, G., & Ge, Y. T. (2009). Food transport refrigeration - Approaches to reduce
energy consumption and environmental impacts of road transport. Applied Thermal Engineering,
29(8-9), 1467–1477. http://doi.org/10.1016/j.applthermaleng.2008.06.027
Tassou, S. A., Lewis, J. S., Ge, Y. T., Hadawey, A., & Chaer, I. (2010). A review of emerging technologies
for food refrigeration applications. Applied Thermal Engineering, 30(4), 263–276.
http://doi.org/10.1016/j.applthermaleng.2009.09.001
Vanek, F., & Sun, Y. (2008). Transportation versus perishability in life cycle energy consumption: A case
study of the temperature-controlled food product supply chain. Transportation Research Part D:
Transport and Environment, 13(6), 383–391. http://doi.org/10.1016/j.trd.2008.07.001
Burns, D. C. (2004). A review of the literature describing the link between poverty, food insecurity and
obesity, Australia. VicHealth.
Drewnowski, A., & Specter, S. (2004). Poverty and Obesity: the role of energy density and energy costs.
American Journal of Clinical Nutrition, 6-16.
Franco, A. (2015, June 8). Are 'Food Deserts a Myth or Simply Misidentified? Highbrow Magazine.
Hoek, J., & McLean, R. (2016). Ch 4: Changing Food Environment and Obesity. In K. Witten,
Geographies of Obesity: Environmental Understandings of the Obesity Epidemic. Routledge.
J Coveney, L. A. (2009). Effects of Mobility and location on food access. Health and Place, 45-55.

24 | P a g e
Janne Boone-Heinonen, P., Penny Gordon-Larsen, P., Catarina I. Kiefe, M. P., James M. Shikany, D.,
Cora E. Lewis, M., & Barry M. Popkin, P. (2011, July 11). Fast Food Restaurants and Food
Stores,Longitudinal Associations With Diet in Young to Middle-aged Adults: The CARDIA Study.
JAMA Internal Medicine, 1162-1170.
Luan, H., Law, J., & Quick, M. (2015). identifying Food Deserts and Swamps Based on Relative Healthy
Food Access: A Spatial-Temporal Bayseain Approach. International Journal of Health
Geography.
Maher, A., Wilson, N., & Signal, L. (2005, July 15). Advertising and Availability of 'obesogenic' foods
around NZ secondary schools: a pilot study. New Zealand Medical Journal.
Sloane, K. (2014, March 25). Study of NZ fruit & vegetable prices suggests markets best value-for-
money. Retrieved from Public Health Expert (Otago University):
https://blogs.otago.ac.nz/pubhealthexpert/2014/03/25/study-of-nz-fruit-vegetable-prices-
suggests-markets-best-value-for-money/
Woodham, C. (2009). Food Desert or Food Swamp? an in depth exploration of neighbourhood food
environments. Dunedin: University of Otago.
Total word count (Excluding Abstract and References: 4556 words