fresh water monitoring program annual...
TRANSCRIPT

FRESH WATER MONITORING PROGRAM
ANNUAL REPORT
WATER YEAR 2014
(October 1, 2013 through September 30, 2014)

TABLE OF CONTENTS EXECUTIVE SUMMARY pg. 1 INTRODUCTION - pg. 4 Information, explanations, and clarifications not presented elsewhere INTERVENTIONS - pg. 7 Procedural changes, natural phenomena, and mine operational changes that could affect data during Water Year. MID-YEAR MODIFICATIONS pg. 8 SAMPLE LOG pg. 10 SAMPLE SUITES pg. 11 PERSONNEL INVOLVED - pg. 12 A list of personnel involved with the FWMP during the Water Year. SITE COORDINATES pg. 13 PROPOSED PROGRAM MODIFICATIONS pg. 14 BIBLIOGRAPHY pg. 15 SITE 48 “UPPER GREENS CREEK” - pg. 16 Interpretive Report Table of Results Qualified Data by QA Reviewer Report X-Y Plots Seasonal Kendall trend Analysis SITE 6 “MIDDLE GREENS CREEK” - pg. 39 Interpretive Report Table of Results Qualified Data by QA Reviewer Report X-Y Plots Seasonal Kendall trend Analysis
Site 48 vs. Site 6 X-Y Plots Wilcoxon Signed-Ranks Tests
SITE 54 “LOWER GREENS CREEK” - pg. 73 Interpretive Report
Table of Results Qualified Data by QA Reviewer Report X-Y Plots Seasonal Kendall trend Analysis
Site 6 vs. Site 54 X-Y Plots Wilcoxon Signed-Ranks Tests

TABLE OF CONTENTS SITE 62 “GREENS CREEK BELOW SITE 54” - pg. 107 Interpretive Report
Table of Results Qualified Data by QA Reviewer Report X-Y Plots SITE 61 “GREENS CREEK FLOODPLAIN” - pg. 140 Interpretive Report
Table of Results Qualified Data by QA Reviewer Report X-Y Plots SITE 49 “UPPER BRUIN CREEK” - pg. 162 Interpretive Report
Table of Results Qualified Data by QA Reviewer Report X-Y Plots
Seasonal Kendall trend Analysis SITE 46 “LOWER BRUIN CREEK” - pg. 186 Interpretive Report
Table of Results Qualified Data by QA Reviewer Report X-Y Plots Seasonal Kendall trend Analysis SITE 57 “MONITORING WELL 23-00-03”- pg. 214 Interpretive Report
Table of Results Qualified Data by QA Reviewer Report X-Y Plots Seasonal Kendall trend Analysis SITE 13 “MINE ADIT DISCHARGE EAST” - pg. 238 Interpretive Report Table of Results Qualified Data by QA Reviewer Report X-Y Plots Seasonal Kendall trend Analysis SITE 27 “MONITORING WELL 2S” - pg. 261 Interpretive Report Table of Results Qualified Data by QA Reviewer Report X-Y Plots Seasonal Kendall trend analysis

TABLE OF CONTENTS SITE 29 “MONITORING WELL 3S” - pg. 286 Interpretive Report Table of Results Qualified Data by QA Reviewer Report X-Y Plots Seasonal Kendall trend analysis SITE 32 “MONITORING WELL 5S” - pg. 312 Interpretive Report Table of Results Qualified Data by QA Reviewer Report X-Y Plots Seasonal Kendall trend analysis SITE 9 “TRIBUTARY CREEK” - pg. 337 Interpretive Report Table of Results Qualified Data by QA Reviewer Report X-Y Plots SITE 60 “ALTHEA CREEK LOWER” - pg. 360 Interpretive Report Table of Results Qualified Data by QA Reviewer Report X-Y Plots SITE 609 “FURTHER CREEK” - pg. 384 Interpretive Report Table of Results Qualified Data by QA Reviewer Report X-Y Plots SITE 711 “GREENS CREEK ABOVE SITE E” - pg. 406 Interpretive Report Table of Results Qualified Data by QA Reviewer Report X-Y Plots SITE 712 “GREENS CREEK BELOW SITE E” - pg. 427 Interpretive Report Table of Results Qualified Data by QA Reviewer Report X-Y Plots APPENDIX A – Summary table of Alaska Water Quality Standards APPENDIX B – Map – 920 Area FWMP Sites Map – Tails Area FWMP Sites Map – Site 60, Lower Althea Creek

EXECUTIVE SUMMARY
This annual report has been prepared by Hecla Greens Creek Mining Company (HGCMC) in accordance with the Fresh Water Monitoring Program (FWMP) contained in the mine’s General Plan of Operations Appendix 1: Integrated Monitoring Plan (IMP). Monitoring data interpretative reports are presented for thirteen surface water and four groundwater monitoring sites.
Each site’s interpretative report summarizes the annual dataset with respect to several goals and objectives outlined in the FWMP. Each report contains a list of any exceptions, omissions or errors that occurred during data collection. The report lists a comparison of each site’s annual dataset to all appropriate applicable Alaska Water Quality Standards (AWQS). Finally, a series of summary tables and X-Y graphs have been generated to meet the specific statistical goals for each site.
This was the second full year of sampling under the recently approved FWMP sampling schedule. All required sampling, except for the December sampling of Site 62 was accomplished as specified in the monitoring schedule and for each site the specified analytic suite (P or Q) was performed on the collected samples. Applicable holding times were achieved for all analytes, except pH, which for three of the twelve sample events were not within the applicable hold time. Furthermore, no data points were qualified as outliers.
No exceedances of Alaska Water Quality Standards (AWQS) occurred along Greens Creek at the four monitoring points (Site 48, Site 6, Site 54, and Site 62) during Water Year 2014. Four exceedances (dissolved cadmium, dissolved mercury, dissolved selenium, and dissolved zinc) were recorded in May 2013 at the new surface water location Site 61, however the downgradient site (Site 62), which receives this drainage, during the same sample period was well within AWQS. To further investigate HGCMC switched the sampling frequency at Site 61 from quarterly to monthly during Water Year 2014. There were no exceedances measured at Site 61 since the four from May 2013, HGCMC plans to reduce the sampling frequency back to quarterly.
Site 13 was in exceedance twice for total sulfate, dissolved cadmium and dissolved zinc. HGCMC removed 11,200 bank cubic yards of material from the 1350 during the 2014 summer season. It is after this disturbance that these exceedances occurred. This has been seen before with other reclamation projects and with those the increased concentrations were short lived. It is HGCMC’s intention to remove a small amount of material, from the 1350, in the access to the raised bore ventilation shafts during the 2015 summer season.
Exceedances in the tailings area were noted for low pH, low alkalinity, and elevated levels of lead. The shallow wells (Site 27, Site 29, and Site 32) continued to express the natural condition of low pH and low alkalinity that characterize these sites located in organic rich peat sediments. Seven exceedances for dissolved lead occurred between two of the three down gradient shallow wells (Site 29 and Site 32). These exceedances continue the recent history of low to moderate levels of lead that may in part be due to minor amounts of tailings escaping the facility due to
1

fugitive dust or tracking. HGCMC has been and will continue to improve best management practices to minimize fugitive dust and tracking.
Site 60 had exceedances for low alkalinity, low pH, and elevated mercury. This site’s watershed was disturbed when the construction of Pond 7 began in 2004,resulting in a change from naturally acidic to alkaline conditions. HGCMC believes that the increase in pH and alkalinity increases the potential for adsorption of mercury on sediments and soil particles in the drainage. The pH of the Site 60 drainage now fluctuates seasonally and from year to year and may control the storage and release of mercury from the adsorbed fraction. Dissolution of tailings dust particles, which contain small amounts of mercury, and atmospheric deposition of mercury from natural (e.g. volcanoes) and anthropogenic sources (e.g. coal fired power plants in Asia) are potential sources of this metal in the drainage area. Two of the four samples collected during the current water year were within AWQS, the other two were only slightly above the AWQS (0.0174 µg/L and 0.0162 µg/L).Sampling in adjacent drainages during water year 2009 and water year 2013 showed that this issue was isolated to only the Site 60 watershed.
The final two sites in the tailings facility, Site 9 and Site 609, both had exceedances for low alkalinity. The low alkalinity values are expected given the naturally occurring acidic muskeg conditions in the headwaters near Site 27 and Site 29. Site 609 had an exceedance for total sulfate (252 mg/L), however this was only slightly above the AWQS and the other 5 samples taken at the site, over the past 2 years, have not been in exceedance.
Graphical and non-parametric analyses for trends in the data were performed for all sites when sufficient data was available. It takes six years of monitoring a new site (Site 609, Site 711, Site 712, Site 61, and 62) before the statistical analyses can be performed. Statistically significant trends were identified for eleven sites: Site 48, increasing trend in total alkalinity and pH; Site 6, upward trend in total alkalinity and pH; Site 54, upward trend in total alkalinity and pH; Site 57, increasing trends in pH and dissolved zinc, decreasing trend in conductivity; Site 60, upward trend in dissolved zinc; Site 27, decreasing trend in dissolved zinc and an upward trend in total alkalinity; Site 32, a downward trend in dissolved zinc and an increasing trend in total alkalinity; Site 13, decreasing trend in conductivity; Site 9, increasing trend in pH and decreasing trend in dissolved zinc; Site 46, increasing trend in pH; Site 49, increasing trend in pH and total alkalinity; e Site 48, Site 49, and Site 57 are considered up-gradient control sites and thus the trends are likely due to natural variation. Two of Greens Creek sites (Site 48, Site 6,.and Site 54) had similar low magnitude increasing trends in total alkalinity and pH. Though this is an increasing trend, Site 48 indicates that a portion of the increase is natural variation.
Downward trends in dissolved zinc at Site 27 and Site 32 may indicate a decrease in loading from fugitive dust. Also, the upward trends in total alkalinity at Site 27 and Site 32 are still within historical ranges.
A non-parametric comparison of medians was performed for all the appropriately paired surface sites (48-6, 6-54, 54-62). Significant differences were noted for the paired datasets from Greens Creek (48-6) for conductivity, total sulfate, and dissolved zinc. These differences have all been noted in previous annual reports and do not appear to be increasing in magnitude. There were
2

significant differences for the paired dataset (6-54) from Greens Creek for conductivity, but not for total sulfate, total alkalinity, or dissolved zinc data. Also, significant differences were noted between the paired Greens Creeks sites 54-62 for conductivity, pH, and total sulfate.
With the reduction in the sampling frequency for the Bruin Creek sites (49 and 46) a statistical analysis of median values cannot be calculated, instead the data from Site 46 is analyzed on a intra-site basis using the combined Shewhart-CUSUM control charts. An analysis using these charts reached the same conclusion as in previous reports that HGCMC is not having a measurable effect on Site 46.
With the removal of the Site 58 and Site 59 form the FWMP, it is not possible to perform inter-well comparison with the down gradient sites Site 27, Site 29, and Site 32. These sites are now also analyzed using the combined Shewhart-CUSUM control charts also. From this evaluation it is recognized that Site 27 has seen some recent changes. Primarily the specific conductance and total sulfate charts begin to go out of control early 2008. This is attributed to the building of the pad west of Pond 7. Both of these parameters are trending towards pre-pad disturbance levels. The other control chart for dissolved zinc first went out of control during water year 2007, a high fugitive dust year. Twice since zinc concentrations have been above the control limits, also associated with fugitive dust loading. However, after each of these events the values return to the historical range.
3

INTRODUCTION
This annual report for Water Year 2014 (October 1, 2013 through September 30, 2014) provides the information required by the Fresh Water Monitoring Program (FWMP). It is separated into several sections, the first of which provides general information applicable to the entire program, followed by a comprehensive analysis of the data for each specific site.
To avoid confusion data values reported by the laboratory as being below the Method Detection Limit (MDL) are assigned a value of zero for plotting purposes. This is done so that the values below MDL are visually distinct and thus can be properly interpreted. On several of the graphs presented, changes have occurred in MDL over the period shown. This leads to the visual impression that an upward trend exists when in fact the older analysis had MDL greater than ambient background levels. For the current Water Year’s data the actual MDLs for non-detect values are listed in each site’s table of results in the interpretative discussion of this report. For prior Water Year’s historic MDLs please refer to GPO Appendix 1, Table 8-2.
The monitoring schedule varies from site to site and different sites are monitored for different analytes on different months of the year. Occasionally, sites scheduled for sampling may not be available due to weather or more rarely operational reasons. A copy of the Water Year 2014 sampling log is included in this section and any variations from scheduled sampling events are noted on each site’s table of results presented in the interpretive section.
The following table outlines the Statistical Information Goals for each site sampled during the Water Year 2014.
Trend
Site AWQS
Comparison Visual Calc Median
Comparison Control Chart
48 x x x 6 x x x 6 vs 48
54 x x x 54 vs 6 62 x x x 62 vs 54 46 x x x x 49 x x x x 61 x x x 13 x x x 57 x x x x 27 x x x x 29 x x x x 32 x x x x
9 x x x 60 x x x
609 x x x 711 x x x 712 x x x
4

A comparison to Alaska Water Quality Standards (AWQS) is required for all sites. In Appendix A the specific water quality criteria used for each comparison are summarized. Trend analysis is carried out by two different methods. The first method is a visual trend analysis for each analyte. For each site sampled a series of time-concentration graphs are constructed for the previous five years of data collected. The second method is a non-parametric statistical method, Kendall seasonal trend analysis that is routinely done for conductivity, pH, alkalinity, and dissolved zinc. These are the key parameters along with sulfate that can be strongly affected by Acid Mine Drainage (AMD). Sulfate was added back into the required list of analytes in the 2002 Water Year. Median calculations are shown in the annual table of results for each site. Finally, for all down gradient sites that are paired with an upgradient reference site, which are monitored with a frequency greater than 4 times per year, a comparison of medians is presented for each specific site. These down gradient sites (upgradient site in parenthesis) include Site 6 (Site 48), Site 54 (Site 6), and Site 62 (Site 54). For each of these sites, a comparison of medians was performed for total alkalinity, pH, conductivity, total sulfate and dissolved zinc. The statistical test utilized is a non-parametric, Wilcoxon signed-rank test. A brief summary of the two main statistical procedures, the Wilcoxon-Mann-Whitney rank sum test and the Mann-Kendall seasonal trend are given below.
With the approved decrease in the sampling frequency at Site 46 and Site 49 the statistical procedures previously discussed are no longer useable. More recently the analysis of data for Site 46 has been conducted using intra-site methodologies instead of an inter-site comparison. In the interpretive section of Site 46 is a discussion of this new methodology. This technique was also applied to Site 57, Site 27, Site 29, and Site 32. Much of the development and understanding of the new technique used has come from Resource Conservation and Recovery Act (RCRA) documents concerning ground water monitoring at waste sites.
Statistical Tests The Mann-Kendall seasonal trend test is a non-parametric test for zero slope of a linear regression of time-ordered data verse time. Briefly the test consists of tabulating the Mann-Kendall statistic Sk (k=1 to 12, for each month) and its variance VAR(S) for data from each season (month). The Sk statistic is simply the sum of the number of positive differences minus the number of negative differences for time ordered data pairs. Any seasonal trend is removed by only considering data pairs taken within the same month. The individual monthly Mann-Kendall statistics (Sk) are tested for homogeneity of trend which is used to determine if it is reasonable to combine the monthly Sk statistics into an overall annual statistic (ΣSk). If the test for monthly homogeneity is rejected the annualize statistic is not meaningful. However, the individual monthly Mann-Kendall statistics can still be tested for trend and a Sen’s slope estimator can be calculated for each month (noted as Qm in the interpretive section) with a significant trend.
The advantages of the Seasonal Kendall trend test is that it is a rank-based procedure especially suitable for non-normally distributed data, censored data, data containing outliers and non-linear trends. The null hypothesis (H0) states that the data(x1, ., xn) are a sample of n independent and identically distributed random variables. The trend test statistic Z is used as a measure of trend magnitude, or of its significance. A positive Z value indicates an upward trend while a negative value indicates a downward trend. However, the Z statistic is not a direct quantification of trend magnitude. For trend of significant magnitude a separate statistic, Sen’s slope estimator, is
5

calculated by computing the seasonally adjusted (monthly) median value for the slope. For datasets which fail the homogeneity test, individual monthly Sk statistics are compared to a theoretical probability distribution of S derived by Mann and Kendall (Table A18 in Gilbert, 1987). Further guidance and background on these statistical methods can be found in Gilbert (1987) or Helsel and Hirsch (1992).
The Wilcoxon signed-rank test is used to determine if the median difference between paired data points is equal to zero. In general terms the signed-rank is used to determine if a set of paired data observations, x’s and y’s, come from the same population (i.e. have the same median) or as the alternative hypothesis differ only in the location of the central value (median). If the data are from the same population then the differences of the paired data should be equally distributed around 0, or about half the differences should be greater than 0 and half should be less than 0. Computationally the test is straight forward. First the differences Di=xi-yi ,i=1…N are computed for each pair. The absolute values of the differences |Di|, i=1…N are ranked from smallest to largest and data pairs that are tied, thus having differences of zero, are ignored. The ranks of the absolute differences are assigned the sign of the actual differences. For example, negative differences have negative-signed ranks and positive differences have positive-signed ranks thus the term “signed-rank” in the method name. The test statistic W+ is the sum of all positively signed ranks. The statistic W+ is then compared to tabled values that vary based on N. The one-tailed version of the signed-rank test has been applied to the key indicator analytes of conductivity, pH, total alkalinity, sulfate, and dissolved zinc as listed in the table below.
Analyte Rationale median |D| Tail Reject H0 if:
Specific Conductance
Conductivity, as a proxy for total dissolved solids, increases due to sulfide oxidation. <0 X's < Y's W+(calc)<W(table)α,n
Lab-pH pH decreases though the addition of H+ generated by pyrite oxidation. >0 X's > Y's W+(calc)>W(table)α,n
Total Alkalinity
Total alkalinity decreases by consumption of buffing capacity due to H+ produced by pyrite oxidation, associated with waste rock.
>0 X's > Y's W+(calc)>W(table)α,n
Total Alkalinity
Total alkalinity increase by the weathering of carbonate mineralogy, associated with tailings <0 X's < Y's W+(calc)<W(table)α,n
Total Sulfate Total sulfate increases due to oxidation of sulfides <0 X's < Y's W+(calc)<W(table)α,n
Dissolved Zinc
Dissolved zinc increases due to sulfide oxidation and is more readily soluble at neutral pH than other metals. <0 X's < Y's W+(calc)<W(table)α,n
X: Upgradient Site Y: Downgradient Site
Further guidance and background on the statistical methods utilized in this report can be found in one of the following references: Helsel and Hirsch (1992), Gilbert (1987), or Section 3.3.3.1 of the EPA document “Guidance for Data Quality Assessment” EPA/600/R-96/084.
Qualified Data by QA Reviewer - QA reports provide a summary for each site section of data limitations found in the monthly QA reviews. They list all data for that site that was qualified by the QA Reviewer for Water Year 2014 along with the reason for qualification. These data are all included in the data analyses, unless also identified as an outlier in the Qualified Data Summary.
6

INTERVENTIONS
This section identifies any procedural changes, natural phenomena, mine operational changes, or other interventions that could have affected data during Water Year 2014. Results of any visual data analyses to detect effects of these interventions are also indicated.
Prior interventions (and negotiated mid-year program modifications such as changes to laboratories, methods, detection limits, and reporting limits), and anything else which may affect data comparability and quality which occurred during previous Water Years, are documented in the “General History” section of the FWMP and in previous annual reports.
7

MID-YEAR MODIFICATIONS
Sampling frequency at Site 61 was increased to monthly in June.
8

GENERAL HISTORY
There has been an error in the graphical labeling found in the 2004-2009 annual reports. It was noticed, a few years ago, that on most of the graphs, the line indicating the AWQS is labeled as ‘total’. Most of the analytes in this report are dissolved and HGCMC is held to the dissolved AWQS. All analyses have been dissolved during this timeframe, so the graphs were mislabeled and should read ‘dissolved’. After reviewing the yearly files it appears that HGCMC was using total standards prior to 2003 when the change was made to using the dissolved standards. This change resulted in modifying the limits and also the graph labels, both of which were correctly done in 2003. Unfortunately, in 2004-2009 both of these modifications were not carried forward. This error in labeling was first corrected in the 2010 FWMP Report.
It was noted, during the annual meeting in 2012, that the units on the conductivity graphs were expressed as ‘NTU’ and not ‘µS/cm’. This error was corrected in the 2012 FWMP Report.
For several years the graphing and statistical analysis has been carried out in several Excel spreadsheets. The 2012 FWMP report broke from using Excel with the majority of the graphing and the statistical analysis being carried out in an R system. R is a system for statistical computation and graphics. It provides, among other things, a programming language, high level graphics, interfaces to other languages and debugging facilities.
All of the statistical analysis was also carried out in the Excel files and a comparison was made with the new system (‘R’), to ensure that there was continuity in the calculations. Both of the systems were in agreement with the statistical analysis. Also, the layout of the x-y plots has changed. Most of the plots are now composed of two graphs: the top smaller graph has y axis limits that encompass the whole data range, whereas the larger bottom graph has fixed limits that allow for comparison between sites. Also, note that the limits are not always shown if in doing so improves the visual interpretation of the graph.
A number of modifications were made to the FWMP with regards to sample sites and frequency. These modifications were discussed during the 2012 annual meeting and the discussion was followed up with two formal request letters in January 2013 and October 2013. Approval for these changes was granted in late October 2013. See the 2013 FWMP report for a thorough analysis of these changes.
9

Site Number Sample Identifier Site Name Oct Nov Dec Jan Feb Mar Apr May Jun Jul Aug Sep
6 006FMS Middle Greens Creek P P Q P Q P P P P P P P
9 009FMS Tributary Creek-Lower Q Q Q Q
13 013FMS Mine Adit Discharge East Q Q Q
27 027FMG Monitoring Well 2S Q Q Q Q
29 029FMG Monitoring Well 3S Q Q Q Q
32 032FMG Monitoring Well 5S Q Q Q Q
46 046FMS Lower Bruin Creek Q Q P P
48 048FMS Upper Greens Creek P P Q P Q P P P P P P P
49 049FMS Control Site Upper Bruin Creek Q Q P P
54 054FMS Greens Creek below D-Pond P P Q P Q P P P P P P P
57 057FMG Monitoring Well-23-00-03 Q Q Q Q
60 060FMS Althea Creek - Lower Q Q Q Q
61 061FMS Greens CreekFloodplain Q Q Q Q Q Q Q Q
62 062FMS Greens CreekLower Than 54 P P Q P Q P P P P P P P
609 609FMS Further CreekLower Q Q Q Q
711 711FMS Greens Creek Above Site E Q P
712 712FMS Greens Creek Below Site E Q P
1067 1067 TRIP BLANK Q Q
1068 1068 FIELD BLANK @ SITE 54 46 6 48 49 54 6 60 48 59 57 9
Sample not taken
Increased sample frequency
Regular sample
2014 Water Year October 2013 Through September 2014Annual Water Quality Monitoring Schedule-Laboratory Samples
FWMP SAMPLE LOG
10

SAMPLE SUITES
Suite P (Surface water only)
Conductivity pH Temperature Hardness Sulfate Total Alkalinity Dissolved Arsenic Dissolved Cadmium Dissolved Copper Dissolved Lead Dissolved Mercury Dissolved Zinc
Suite Q (Groundwater and surface water)
Conductivity pH Temperature Hardness Sulfate Total Alkalinity Dissolved Arsenic Dissolved Barium Dissolved Cadmium Dissolved Chromium Dissolved Copper Dissolved Lead Dissolved Mercury Dissolved Nickel
Dissolved Selenium Dissolved Silver Dissolved Zinc
11

PERSONNEL INVOLVED
USFS HGCMC Chad Van Ormer Monument Manager
Scott Hartman, General Manager
Sarah Samuelson Christopher Wallace, Environmental Manager Matt Reece Mitch Brooks, Environmental Engineer Curtis Caton David Landes, Environmental Engineer
Ted Morales, Environmental Technician Biomonitoring (Fish and Game) Gunnar Fredheim, Environmental Technician Kate Kanouse Cameron Sell, Environmental Technician Jackie Timothy Ben Brewster
Consultants Data Review Pete Condon, Petros GeoConsulting, Geochemist
Suzan Huges, Project Coordinator Environmental Synectics, Inc. Evin McKinney , Senior Scientist Environmental Synectics, Inc.
Laboratory Analysis Leticia Sangalang, Senior Scientist Environmental Synectics, Inc.
Brenda Lasorsa, Project Coordinator Battelle Marine Sciences Laboratory
Sue Weber, Project Manager ACZ
David Wetzel, Project Manager Admiralty Environmental
12

SITE COORDINATES
Site Site Name Latitude Longitude 6 Greens Creek – Middle 58°04’47.424” N 134°38’25.849” W
9 Tributary Creek - Lower 58°06’22.040” N 134°44’44.100” W
13 East Mine Drainage Upper 58°04’47.685” N 134°37’39.951” W
27 Monitoring Well-2S 58°06’48.546” N 134°44’38.365” W
29 Monitoring Well-3S 58°06’59.860” N 134°44’51.821” W
32 Monitoring Well-5S 58°06’57.732” N 134°44’51.225’ W
46 Bruin Creek – Lower 58°04’46.450” N 134°38’32.580” W
48 Greens Creek – Upper 58°05’01.350” N 134°37’33.590” W
49 Bruin Creek – Upper 58°05’04.070” N 134°38’30.410” W
54 Greens Creek - Lower 58°04’41.681” N 134°38’46.529” W
57 Monitoring Well-23-00-03 58°04’59.933” N 134°38’39.881” W
60 Althea Creek - Lower 58°04’41.770” N 134°45’08.432” W
609 Further Creek – Lower 58°07’05.707” N 134°45’06.332” W
61 Greens Creek Floodplain 58°04’43.480” N 134°38’52.910” W
62 Greens Creek Lower Than 54 58°04’38.650” N 134°39’06.000” W
711 Greens Creek Above Site E 58°04’08.425” N 134°43’27.181” W
712 Greens Creek Below Site E 58°04’13.858” N 134°43’42.438” W
13

PROPOSED PROGRAM MODIFICATIONS
HGCMC is not proposing changes to the FWMP during the 2015 Water Year.
14

BIBLIOGRAPHY
Environmental Protection Agency (1998). EPA Guidance for Data Quality Assessment. EPA QA/G-9, EPA/600-R-96/084. U.S. Environmental Protection Agency, Office of Research and Development, Washington, D.C. 219 pp.
Gilbert, Richard O. (1987). Statistical Methods for Environmental Pollution Monitoring. Van Nostrand Reinhold, New York. 320 pp.
Helsel, D.R., and Hirsch, R.M. (1992). Statistical methods in water resource. Elsevier Publishers, Amsterdam. 510 pp.
15

INTERPRETIVE REPORT SITE 48
The data collected during the current water year are listed in the following “Table of Results for Water Year 2014” report. The table includes all the required FWMP analyte data (field and laboratory) collected for the current water year and a series of flags keyed to the summary report “Qualified Data by QA Reviewer”. The QA report lists any associated data limitations found during the monthly QA reviews of laboratory data for this site. Median values for all analytes have been calculated and are shown in the right-most column of the table of results. Any value reported as less than MDL has been replaced with a value of ½ MDL for the purpose of median calculation.
All data collected at this site for the past six years are included in the data analyses with the exception of the outliers shown in the table below. During the current year no new data points were flagged as outliers, after review by HGCMC.
Sample Date Parameter Value Qualifier Notes 01/13/2009 Conductivity Field, µmho 52.00 Field and laboratory values not comparable 01/13/2009 Total Alkalinity, mg/L 16.2 Suspected sample contamination
The data for Water Year 2014 have been compared to the strictest fresh water quality criterion for each applicable analyte. One result exceeded these criteria.
X-Y plots have been generated to graphically present the data for each of the analytes requested in the Statistical Information Goals for this site. These plots have been visually analyzed for the appearance of trends in concentration. The only obvious visual trend is in field pH that has had a gradual upward trend of the past 5 years.
A non-parametric statistical analysis for trend was performed for specific conductivity, field pH, total alkalinity, total sulfate, and dissolved zinc. Calculation details of the Seasonal Kendall analyses are presented in detail on the pages following this interpretive section. The following table summarizes the results on the data collected between Oct-08 and Sep-14(WY2009-WY2014).
Lower Upper
14-Jan-14 Alkalinity 16 mg/L 20 0
Table of Exceedance for Water Year 2014
Sample Date Parameter Value
LimitsHardness
16

For datasets with a statistically significant trend (α/2=2.5%) a Seasonal-Sen’s Slope estimate statistic has also been calculated. For the current water year (2014), total alkalinity has a slope estimate of 1.025 mg/L/yr and field pH has a slope estimate of 0.112 su/yr.
Mann-Kendall test statistics Sen's slope estimaten* p** Trend Q Q(%)
Conductivity Field 6 0.05pH Field 6 <0.01 + 0.112 1.453Alkalinity, Total 6 <0.01 + 1.025 2.389Sulfate, Total 6 0.22Zinc, Dissolved 6 0.04* Number of Years ** Significance level
Parameter
Table of Summary Statistics for Trend Analysis
17

Sample Date/Parameter Oct 2013 Nov 2013 Dec 2013 Jan 2014 Feb 2014 Mar 2014 Apr 2014 May 2014 Jun 2014 Jul 2014 Aug 2014 Sep 2014 MedianWater Temp (°C) 5.4 0.96 1.18 0.13 0.03 0.73 0.93 3.48 4.32 9.54 9.35 8.7 2.33Conductivity-Field(µmho) 106 139 144 44 151 147 180 95 94 111 117 131.2 124.1Conductivity-Lab (µmho) 93 106 142 44 141 136 165 95 95 110 112 131 111pH Lab (standard units) 7.73 7.68 7.79 7.25 7.56 7.68 7.54 7.4 7.87 7.78 7.69 7.77 7.69pH Field (standard units) 7.87 7.91 7.85 7.31 7.66 7.82 7.82 7.7 7.75 7.85 7.9 8.12 7.84Total Alkalinity (mg/L) 39.4 49.5 51.2 16 51.1 50 56.1 34.4 35.9 39.9 42.9 49.5 46.2Total Sulfate (mg/L) 9.5 16.3 17.6 3.4 18.9 19.7 22 8.7 8.9 11.1 10.7 14.6 12.9Hardness (mg/L) 48.3 65 67.2 18.4 66.2 67.8 77.1 43.1 42.4 49.6 53.8 65 59.4Dissolved As (ug/L) 0.203 0.18 0.201 0.194 0.173 0.202 0.167 0.177 0.187 0.238 0.241 0.256 0.198Dissolved Ba (ug/L) 31.2 31.9 31.6Dissolved Cd (ug/L) 0.0352 0.0383 0.0349 0.0741 0.0404 0.0379 0.0346 0.0245 0.0259 0.0316 0.035 0.0411 0.0351Dissolved Cr (ug/L) 0.575 0.664 0.620Dissolved Cu (ug/L) 0.51 0.286 0.35 1.23 0.332 0.436 0.256 0.469 0.253 0.294 0.403 0.752 0.377Dissolved Pb (ug/L) 0.0069 0.0015 0.0051 0.19 0.0015 0.0114 0.004 0.0067 0.0059 0.0015 0.0015 0.0015 0.0046Dissolved Ni (ug/L) 0.562 0.633 0.598Dissolved Ag (ug/L) 0.002 0.002 0.002Dissolved Zn (ug/L) 2.9 4.18 3.53 9.27 3.92 4.5 2.97 2.39 2.46 2.06 2.73 3 2.99Dissolved Se (ug/L) 0.953 1.11 1.032Dissolved Hg (ug/L) 0.00101 0.000493 0.000431 0.00369 0.000455 0.000804 0.000443 0.00798 0.000642 0.000409 0.000715 0.000619 0.000631
For individual sample/analyte qualifier descriptions see "Qualified Data by QA Reviewer" table.Values reported as less than MDL are replaced by 1/2 MDL for median calculation purposes.Shaded data has been qualified as an outlier by HGCMC and removed from any further analysis and is not included into the calculation of the median
Table of Results for Water Year 2014
Site 048FMS - 'Upper Greens Creek'
18

Date Range: 10/01/2013 to 09/30/2014
Site No. Sample Date Sample Time Parameter Value Qualifier Reason for Qualifier
Qualified Data by QA Reviewer
048FMS 10/15/2013 12:00 PM Diss. Pb-ICP/MS 0.00693 J Below Quantitative Range
048FMS 11/11/2013 12:00 PM pH 7.68 J Hold Time Violation
048FMS 12/9/2013 12:00 PM Diss. Cu-ICP/MS 0.35 U Field Blank Contamination
Diss. Ni-ICP/MS 0.56 U Field Blank Contamination
Diss. Pb-ICP/MS 0.00508 U Field Blank Contamination
Diss. Zn-ICP/MS 3.53 U Field Blank Contamination
048FMS 1/14/2014 12:00 PM pH 7.25 J Hold Time Violation
048FMS 2/12/2014 12:00 PM Diss. Cu-ICP/MS 0.33 J LCS Recovery
Sulfate 18.9 J Sample Receipt Temperature
048FMS 4/2/2014 12:00 PM Diss. Pb-ICP/MS 0.00398 J Below Quantitative Range
pH 7.54 J Hold Time Violation
048FMS 5/5/2014 12:00 PM Diss. Pb-ICP/MS 0.00667 J Below Quantitative Range
048FMS 6/3/2014 12:00 PM Diss. Pb-ICP/MS 0.00593 J Below Quantitative Range
Diss. Zn-ICP/MS 2.46 U Field Blank Contamination
048FMS 7/7/2014 12:00 PM Sulfate 11.1 J Sample Receipt Temperature
19

●
●●●
●●●
●●
●
●
●
●●
●●●●
●●
●
●
●●
●
●● ●●●
●●
●
●
●●
●
●●●
●●
●●
●
●●
●
●
●●●●
●●
●●
● ●●
04
812
Site 48 − Water Temperature°C
2009
2010
2011
2012
2013
●
●
●●
●
●●
●●
●
●
●
●
●
●●●●
●
●
●
●
●●
●
●● ●
●●
●
●
●
●
●
●
●
●
●●
●
●
●●
●
●
●
●
●
●●
●●
●●
●
●
● ●
●
05
1015
20
°C
Oct
200
9
Oct
201
0
Oct
201
1
Oct
201
2
Oct
201
3
Water Temperature Upper Limit Lower Limit
Note: the AWQS may not be shown in order to allow greater visual detail of measured values for trend analysis
20

●●●
●●
●●
●●
●●
●
●●
●●
●
●●
●●
●
●●●
●
●
●
●●
●●
●●●●●
●
●●
●
●●
●●
●
●
●●●
●
●
●●
●
●●● ●
●
050
150
Site 48 − Conductivity LaboratoryµS
/cm
2009
2010
2011
2012
2013
●●
●
●
●
●●
●
●●●
●
●●
●●
●
●●
●●
●
●●
●
●
●
●
●●
●●
●●●●
●
●
●
●
●
●
●
●
●
●
●
●●
●
●
●
●●
●
●●
● ●
●
050
100
150
200
250
300
350
µS/c
m
Oct
200
9
Oct
201
0
Oct
201
1
Oct
201
2
Oct
201
3
Conductivity Laboratory Upper Limit Lower Limit
Note: the AWQS may not be shown in order to allow greater visual detail of measured values for trend analysis
21

●●
●
●
●●●
●
●●●
●
●●
●●●
●
●●●●
●●●
●
● ●
●
●
●●●●● ●
●
●●
●
●
●
●
●●
●
●●
●
●●
●
●●
●
●●● ●
●
050
150
Site 48 − Conductivity FieldµS
/cm
2009
2010
2011
2012
2013
●
●
●
●
●
●
●
●
●●●
●
●
●
●●
●
●
●
●●●
●
●●
●
● ●
●
●
●●
●●● ●
●
●
●
●
●
●
●
●
●
●
●
●
●
●●
●
●●
●
●●
●●
●
050
100
150
200
250
300
350
µS/c
m
Oct
200
9
Oct
201
0
Oct
201
1
Oct
201
2
Oct
201
3
Conductivity Field Upper Limit Lower Limit
Note: the AWQS may not be shown in order to allow greater visual detail of measured values for trend analysis
22

●
●●●
●
●
●
●
●
●
●
●●
● ●
●●●●
●●
●
●●●●
● ●
●
●●
●●●
●
●●
●●
●●●●
●
●●●
●●●
●
●
●●●
●
●● ●●
6.0
7.0
8.0
Site 48 − pH Laboratorysu
2009
2010
2011
2012
2013
●
●●
●
●
●
●
●
●
●
●
●
●
● ●
●●●
●
●●
●
●●●●
● ●
●
●●
●●
●
●
●
●
●●
●
●●●
●
●●
●
●
●●●
●
●●●
●
●●
●●
56
78
910
su
Oct
200
9
Oct
201
0
Oct
201
1
Oct
201
2
Oct
201
3
pH Laboratory Upper Limit Lower Limit
Note: the AWQS may not be shown in order to allow greater visual detail of measured values for trend analysis
23

●●●
●
●●●
●
●●●
●●
●●
●
●
●●●
●
●
●●
●●●
●
●●●●●
●● ●●●●
●●●●● ●
●●●●●●
●
●●●●●● ●
●5.
56.
57.
58.
5
Site 48 − pH Fieldsu
2009
2010
2011
2012
2013
●
●●
●
●●
●
●
●●●
●
●
●
●
●
●
●
●●
●
●
●
●
●●●
●
●●●
●
●
●● ●
●●●
●
●●●
●●
●●
●●●●
●
●
●●●●
● ●
●
56
78
910
su
Oct
200
9
Oct
201
0
Oct
201
1
Oct
201
2
Oct
201
3
pH Field Upper Limit Lower Limit
Note: the AWQS may not be shown in order to allow greater visual detail of measured values for trend analysis
24

●●●
●●●●
●●●
●
●
●●
●
●
●●●
●●
●
●●●
●
●
●●●
●●●●
●
●
●
●
●
●
●
●
●
●●
●
●●
●
●●
●
●●
●
●●●
●
●
2040
60
Site 48 − Alkalinitym
g/L
2009
2010
2011
2012
2013
●●●
●●
●●
●
●●
●
●
●●
●
●
●●●
●●
●
●●●
●
●
●●●
●●
●●●
●
●
●
●
●
●
●
●
●●
●
●●
●
●●
●
●●
●
●●
●●
●
020
4060
8010
012
014
0
mg/
L
Oct
200
9
Oct
201
0
Oct
201
1
Oct
201
2
Oct
201
3
Alkalinity Upper Limit Lower Limit
Note: the AWQS may not be shown in order to allow greater visual detail of measured values for trend analysis
25

●●●
●●●●
●●●
●
●
●●
●●
●
●●
●●●
●●●
●
●
●●●
●●
●●● ●●
●
●
●
●
●
●
●●
●
●
●
●●
●
●●●
●●● ●
●
05
15
Site 48 − Sulfate Totalm
g/L
2009
2010
2011
2012
2013
●
●●
●●
●●
●●●
●
●
●
●
●●
●
●
●
●
●●
●●
●
●
●
●●
●
●●
●●● ●
●
●
●
●
●
●
●
●●
●
●
●
●●
●
●●
●
●●
● ●
●
010
2030
4050
mg/
L
Oct
200
9
Oct
201
0
Oct
201
1
Oct
201
2
Oct
201
3
Sulfate Total Upper Limit Lower Limit
Note: the AWQS may not be shown in order to allow greater visual detail of measured values for trend analysis
26

●●●
●●
●●
●●
●●
●
●●
●●
●
●●
●●●
●●
●●
●
●●●
●●
●●●●
●
●
●
●
●
●
●
●●
●
●●
●
●●
●
●●
●
●●●
●
●0
2060
Site 48 − Hardnessm
g/L
2009
2010
2011
2012
2013
●●
●
●
●
●●
●
●
●
●
●
●
●
●●
●
●
●
●●
●
●
●
●
●
●
●●
●
●
●
●●●
●
●
●
●
●
●
●
●
●
●
●
●
●
●
●●
●
●●
●
●●
●
●
●
020
4060
8010
012
014
0
mg/
L
Oct
200
9
Oct
201
0
Oct
201
1
Oct
201
2
Oct
201
3
Hardness Upper Limit Lower Limit
Note: the AWQS may not be shown in order to allow greater visual detail of measured values for trend analysis
27

●
●●●●
●
●●●
●●
●●● ●
●
●●
●●●●
●●●
●●
●
●●
●●
●●●
●●●
●●●
●●● ●
●●●
●●
●●●
●
●●●
● ●●
0.00
0.15
Site 48 − Arsenic Dissolvedµg
/L
2009
2010
2011
2012
2013
●●●●●●●●●●● ●●● ●●●●●●●●●●●●● ●●●●●●●● ●●●●●●●●● ●
●●●●●●●●●●●●● ●●
01
23
45
µg/L
Oct
200
9
Oct
201
0
Oct
201
1
Oct
201
2
Oct
201
3
Arsenic Dissolved Upper Limit Lower Limit
Note: the AWQS may not be shown in order to allow greater visual detail of measured values for trend analysis
28

●
●●
●●
●
●
●
●
●
● ●0
1020
30
Site 48 − Barium Dissolvedµg
/L
2009
2010
2011
2012
2013
●
●
●
●
●●
●
●
●
●
● ●
010
2030
4050
6070
µg/L
Oct
200
9
Oct
201
0
Oct
201
1
Oct
201
2
Oct
201
3
Barium Dissolved Upper Limit Lower Limit
Note: the AWQS may not be shown in order to allow greater visual detail of measured values for trend analysis
29

●●●●●●●
●●●●●●● ●
●
●●●
●●●
●●●
●
●
●
●●
●●●●
● ●●●●●●●●●
●
●●
●●●●
●
●●●
●●● ●
●
0.00
0.04
0.08
Site 48 − Cadmium Dissolvedµg
/L
2009
2010
2011
2012
2013
●●●●●
●●●●●●
●●●
●●
●●●
●●
●
●●●
●
●
●
●
●
●
●●●
● ●●●●●
●●●●
●
●●
●●●
●
●
●●●
●●●
●●
0.00
0.05
0.10
0.15
0.20
0.25
µg/L
Oct
200
9
Oct
201
0
Oct
201
1
Oct
201
2
Oct
201
3
Cadmium Dissolved Upper Limit Lower Limit
Note: the AWQS may not be shown in order to allow greater visual detail of measured values for trend analysis
30

●●
●
●
●
●
●
●
●
●● ●
0.0
1.0
2.0
Site 48 − Chromium Dissolvedµg
/L
2009
2010
2011
2012
2013
●●
●
●
●
●
●
●
●
●
●●
01
23
45
µg/L
Oct
200
9
Oct
201
0
Oct
201
1
Oct
201
2
Oct
201
3
Chromium Dissolved Upper Limit Lower Limit
Note: the AWQS may not be shown in order to allow greater visual detail of measured values for trend analysis
31

●●●●
●●●
●●
●● ●
●
●
●●
●
●●
●
●●
●●●●
●
●●●
●●
●●●
●
●
●●
●
●●●●
●●●
●●
●●
●
●●
●
●
●●●
●
0.0
0.6
1.2
Site 48 − Copper Dissolvedµg
/L
2009
2010
2011
2012
2013
●●●●
●●●
●●●● ●
●●
●●●
●●●
●●
●●●●
●
●●●
●●
●●●
●
●●●
●
●●●●
●●●●●
●●
●
●●●
●
●●●
●
01
23
45
67
µg/L
Oct
200
9
Oct
201
0
Oct
201
1
Oct
201
2
Oct
201
3
Copper Dissolved Upper Limit Lower Limit
Note: the AWQS may not be shown in order to allow greater visual detail of measured values for trend analysis
32

●●●●●●●●●●●
●
●●
●●●●●●●●●●●●
●
●
●●●●●●●●
●●●
●
●●●● ●●●●●●●
●
●●●●●● ●●
0.00
0.10
Site 48 − Lead Dissolvedµg
/L
2009
2010
2011
2012
2013
●●●●●●●●●●● ●●●
●●●●●●●●●●●●
●
●
●●●●●●● ●●●●●
●●●● ●●●●●●●
●
●●●●●● ●●0.0
0.5
1.0
1.5
2.0
µg/L
Oct
200
9
Oct
201
0
Oct
201
1
Oct
201
2
Oct
201
3
Lead Dissolved Upper Limit Lower Limit
Note: the AWQS may not be shown in order to allow greater visual detail of measured values for trend analysis
33

●
●
●●
●
●
●● ●
●
●●
0.0
1.0
Site 48 − Nickel Dissolvedµg
/L
2009
2010
2011
2012
2013
●●
● ●●
●● ● ● ●
● ●
02
46
810
1214
µg/L
Oct
200
9
Oct
201
0
Oct
201
1
Oct
201
2
Oct
201
3
Nickel Dissolved Upper Limit Lower Limit
Note: the AWQS may not be shown in order to allow greater visual detail of measured values for trend analysis
34

●●● ● ● ● ● ● ● ● ● ●
−1.0
0.0
1.0
Site 48 − Silver Dissolvedµg
/L
2009
2010
2011
2012
2013
●●● ● ● ● ● ● ● ● ● ●0.0
0.5
1.0
1.5
2.0
2.5
3.0
µg/L
Oct
200
9
Oct
201
0
Oct
201
1
Oct
201
2
Oct
201
3
Silver Dissolved Upper Limit Lower Limit
Note: the AWQS may not be shown in order to allow greater visual detail of measured values for trend analysis
35

●●●●●●●●●●● ●
●● ●●●●●●●●●
●●
●
●
●●●●
●●
●●●●●
●●●●●●
●●
●
●●●
●
●
●●
●●●●
●●
04
812
Site 48 − Zinc Dissolvedµg
/L
2009
2010
2011
2012
2013
●●●●●●●●●●● ●●● ●●●●●●●●●●●
●
●
●●●●●●●● ●●●
●●●●●●●●
●
●●●●
●
●●●●●● ●●
020
4060
80
µg/L
Oct
200
9
Oct
201
0
Oct
201
1
Oct
201
2
Oct
201
3
Zinc Dissolved Upper Limit Lower Limit
Note: the AWQS may not be shown in order to allow greater visual detail of measured values for trend analysis
36

●
●●
●●
●
●
● ●●
●●
0.0
0.6
1.2
Site 48 − Selenium Dissolvedµg
/L
2009
2010
2011
2012
2013
●
●●
●
●
●
●
● ●●
●
●
01
23
45
µg/L
Oct
200
9
Oct
201
0
Oct
201
1
Oct
201
2
Oct
201
3
Selenium Dissolved Upper Limit Lower Limit
Note: the AWQS may not be shown in order to allow greater visual detail of measured values for trend analysis
37

●●●●●●●
●●
●● ●
●●
●●●●●●
●●●●●●
●
●
●
●
●●
●●●
●
●●●
●
●●●
●
●●●●●
●●
●
●●●
●
●● ●●
0.00
00.
004
0.00
8 Site 48 − Mercury Dissolvedµg
/L
2009
2010
2011
2012
2013
●●●
●●●●
●
●
●● ●
●
●
●●
●●●
●
●●●●●●
●
●
●
●
●●
●●
●
●
●
●●
●
●
●●
●
●●●
●●
●●
●
●●●
●
●●
●●
0.00
00.
002
0.00
40.
006
0.00
80.
010
0.01
2
µg/L
Oct
200
9
Oct
201
0
Oct
201
1
Oct
201
2
Oct
201
3
Mercury Dissolved Upper Limit Lower Limit
Note: the AWQS may not be shown in order to allow greater visual detail of measured values for trend analysis
38

INTERPRETIVE REPORT SITE 6 The data collected during the current water year are listed in the following “Table of Results for Water Year 2014” report. The table includes all the required FWMP analyte data (field and laboratory) collected for the current water year and a series of flags keyed to the summary report “Qualified Data by QA Reviewer”. The QA report lists any associated data limitations found during the monthly QA reviews of laboratory data for this site. Median values for all analytes have been calculated and are shown in the right-most column of the table of results. Any value reported as less than MDL has been replaced with a value of ½ MDL for the purpose of median calculation. All data collected at this site for the past six years are included in the data analyses with the exception of the outliers shown in the table below. During the current year no new data points were flagged as outliers after review by HGCMC.
Sample Date Parameter Value Qualifier Notes No outliers have been identified by HGCMC for the period of October 2009 through September 2014.
The data for Water Year 2014 have been compared to the strictest fresh water quality criterion for each applicable analyte. One result, total alkalinity, exceeded these criteria, however the measured value is similar to the upgradient background site (Site 48) that was also in exceedance, and thus is considered natural variation.
X-Y plots have been generated to graphically present the data for each of the analytes requested in the Statistical Information Goals for this site. These plots have been visually analyzed for the appearance of any trend in concentration. The only obvious visual trend is in field pH that has had a gradual upward trend for the past 5 years. A non-parametric statistical analysis for trend was performed for specific conductivity, field pH, total alkalinity, total sulfate, and dissolved zinc. Calculation details of the Seasonal Kendall analyses are presented in detail on the pages following this interpretive section. The following table summarizes the results of the data collected between Oct-08 and Sep-14 (WY2009-WY2014).
Lower Upper
14-Jan-14 Alkalinity 18.5 mg/L 20 0
Table of Exceedance for Water Year 2014
Sample Date Parameter Value
LimitsHardness
39

Total alkalinity, pH field, and conductivity field all have statistically significant positive slopes of 2.55 µS/cm/yr, 0.09 su/yr, and 1.08 mg/L/yr respectively. The pH field and total alkalinity are similar to the values for Site 48. Currently, HGCMC does not feel that this increasing trend is a significant indication of changes in water chemistry. A comparison of median values for alkalinity, laboratory pH, lab conductivity, total sulfate, and dissolved zinc between Site 6 and Site 48 has been conducted as specified in the Statistical Information Goals for Site 6. Additionally, X-Y plots have been generated for total alkalinity, field pH, specific conductance, total sulfate, and dissolved zinc that co-plot data from Site 6 and Site 48, the upstream control site, to aid in the comparison between those sites. Calculation details of the non-parametric signed-rank tests are presented in detail on the pages following this interpretive section. The table below summarizes the results of the signed-rank test as performed on the Water Year 2014 dataset.
Field pH does not have a statistically significant difference between measured median values at a significance level of α=0.05 for a one-tailed test. The median values for field pH for Site 48 and Site 6 are 7.84 mg/L and 7.85 mg/L respectively and the median of differences, Site 48 minus Site 6, is -0.01 mg/L. The median values for field conductivity for Site 48 and Site 6 are 124.1 µS/cm and 128.1 µS/cm respectively. Median values for total alkalinity for Site 48 and Site 6 are 46.2 mg/L su and 46.7
Mann-Kendall test statistics Sen's slope estimaten* p** Trend Q Q(%)
Conductivity Field 6 0.02 + 2.55 2.151pH Field 6 <0.01 + 0.09 1.2Alkalinity, Total 6 <0.01 + 1.08 2.5Sulfate, Total 6 0.25Zinc, Dissolved 6 0.46* Number of Years ** Significance level
Table of Summary Statistics for Trend Analysis
Parameter
Site 48 Site 6 Medianmedian median Differences
Conductivity Field 124.1 128.1 -5pH Field 7.84 7.85 -0.01Alkalinity, Total 46.2 46.7 -0.6Sulfate, Total 12.9 14.10 -1.60Zinc, Dissolved 2.99 6.79 2.71
<0.010.449<0.01<0.01<0.01
Table of Summary Statistics for Median Analysis
Site 6 vs Site 48
Signed RanksParameter p-value
40

mg/L respectively. The median values for total sulfate for Site 48 and Site 6 are 14.6 mg/L and 15.90 mg/L respectively. Dissolved zinc results follow along in a similar manner where the median values for Site 48 and Site 6 are 2.99 µg/L and 6.79 µg/L respectively. Signed-rank test results for prior datasets for Water Years 2000 – 2013 show similar statistically significant differences with a median difference ranging from -1.7 µg/L to -4.77 µg/L dissolved zinc. The magnitudes of these differences appear to have been relatively consistent over the past several years and do not appear to be increasing. Also, the magnitude of the relative differences is small with respect to field conductivity and well below the applicable AWQS in the case of total sulfate and dissolved zinc. Taking into consideration the small magnitude of the differences that are measurable between the two sites, the current FWMP program is sufficient to monitor future increases at Site 6. Thus, if an upward trend in total sulfate, or dissolved zinc at Site 6 is occurring, the current program is sufficient for identifying the change before any water quality values are impaired.
41

Sample Date/Parameter Oct 2013 Nov 2013 Dec 2013 Jan 2014 Feb 2014 Mar 2014 Apr 2014 May 2014 Jun 2014 Jul 2014 Aug 2014 Sep 2014 MedianWater Temp (°C) 5.4 1 1.1 0.2 0.0 0.9 0.9 2.9 4.4 9.4 8.4 8.7 2.0Conductivity-Field(µmho) 110 146 150 52 157 159 189 98 97 115 121 135.2 128.1Conductivity-Lab (µmho) 94 116 148 53 150 145 173 97 98 114 113 136 115pH Lab (standard units) 7.78 7.78 7.79 7.16 7.38 7.58 7.69 7.24 7.81 7.74 7.5 7.78 7.72pH Field (standard units) 7.84 7.88 7.88 7.34 7.68 7.81 7.85 7.59 7.77 7.85 7.87 8.13 7.85Total Alkalinity (mg/L) 39.6 50.1 52 18.5 52.6 51.6 55.7 34.7 36.1 40.4 43.3 50.2 46.7Total Sulfate (mg/L) 10.7 17.9 20.2 5.2 21.7 23.1 25.6 9.3 9.5 12.1 12.3 15.9 14.1Hardness (mg/L) 50.4 67.4 69.3 21.9 69.5 72.1 80.8 43.8 43.2 51.3 55.1 66.1 60.6Dissolved As (ug/L) 0.22 0.189 0.195 0.242 0.174 0.183 0.171 0.195 0.198 0.23 0.221 0.247 0.197Dissolved Ba (ug/L) 30.5 32.7 32.1 32.1Dissolved Cd (ug/L) 0.0512 0.0504 0.0479 0.0828 0.0621 0.0523 0.0471 0.0342 0.0316 0.0372 0.043 0.047 0.0475Dissolved Cr (ug/L) 0.248 1.11 0.218 0.248Dissolved Cu (ug/L) 0.652 0.34 0.399 1.67 0.411 0.517 0.311 0.51 0.267 0.302 0.493 0.397 0.405Dissolved Pb (ug/L) 0.0172 0.0066 0.0054 0.406 0.0175 0.0397 0.0073 0.0092 0.0145 0.0056 0.0093 0.006 0.0093Dissolved Ni (ug/L) 0.625 0.719 0.663 0.663Dissolved Ag (ug/L) 0.002 0.002 0.002 0.002Dissolved Zn (ug/L) 6.53 7.05 7.12 11.4 9.78 9.69 7.61 4.77 3.3 3.38 5.13 5.54 6.79Dissolved Se (ug/L) 1.08 1.48 1.46 1.460Dissolved Hg (ug/L) 0.00129 0.000522 0.000475 0.00442 0.000506 0.000768 0.000605 0.00782 0.00055 0.000462 0.000819 0.000667 0.000636
For individual sample/analyte qualifier descriptions see "Qualified Data by QA Reviewer" table.Values reported as less than MDL are replaced by 1/2 MDL for median calculation purposes.Shaded data has been qualified as an outlier by HGCMC and removed from any further analysis and is not included into the calculation of the median
Table of Results for Water Year 2014
Site 006FMS - 'Greens Creek Middle'
42

Date Range: 10/01/2013 to 09/30/2014
Site No. Sample Date Sample Time Parameter Value Qualifier Reason for Qualifier
006FMS 11/11/2013 12:00 PM Diss. Pb-ICP/MS 0.00655 J Below Quantitative Range
pH 7.78 J Hold Time Violation
006FMS 12/9/2013 12:00 PM Diss. Ni-ICP/MS 0.62 U Field Blank ContaminationDiss. Pb-ICP/MS 0.00537 U Field Blank Contamination
006FMS 1/14/2014 12:00 PM pH 7.16 J Hold Time Violation
006FMS 2/12/2014 12:00 PM Diss. Cu-ICP/MS 0.41 J LCS Recovery
Sulfate 21.7 J Sample Receipt Temperature
006FMS 4/2/2014 12:00 PM Diss. Pb-ICP/MS 0.0073 J Below Quantitative Range
Diss. Se-ICP/MS 1.46 J Duplicate RPDpH 7.69 J Hold Time Violation
006FMS 6/3/2014 12:00 PM Diss. Zn-ICP/MS 3.3 U Field Blank Contamination
006FMS 7/7/2014 12:00 PM Diss. Pb-ICP/MS 0.00556 J Below Quantitative RangeSulfate 12.1 J Sample Receipt Temperature
006FMS 9/17/2014 12:00 PM Diss. Pb-ICP/MS 0.00597 J Below Quantitative Range
Qualified Data by QA Reviewer
43

●
●●●
●●●
●●
●
●
●
●●
●●
●
●●
●
●
●
●●
●
●● ●●
●●●
●
●
●●
●
●●
●● ●●
●
●●
●
●
●●●●
●●
●
●
●●●
04
8
Site 6 − Water Temperature°C
2009
2010
2011
2012
2013
●
●
●●
●
●●
●
●
●
●
●
●
●
●●
●
●
●
●
●
●
●
●
●
●● ●
●
●
●
●
●
●
●
●
●
●
●
●
●●●
●
●●
●
●
●●
●●
●●
●
●
●
●●
05
1015
20
°C
Oct
200
9
Oct
201
0
Oct
201
1
Oct
201
2
Oct
201
3
Water Temperature Upper Limit Lower Limit
Note: the AWQS may not be shown in order to allow greater visual detail of measured values for trend analysis
44

●●●
●●
●●
●●
●●
●
●●
●●
●
●●
●●
●
●●●●
●
●
●●
●●●●● ●●
●
●●
●
●●
●●
●
●
●●
●
●
●
●●
●
●●● ●
●
050
150
Site 6 − Conductivity LaboratoryµS
/cm
2009
2010
2011
2012
2013
●●
●
●
●
●●
●
●
●
●
●
●●
●●
●
●●
●
●
●
●●
●
●
●
●
●
●
●●
●●●●
●
●
●
●
●
●
●
●
●
●
●
●●
●
●
●
●●
●
●●
● ●
●
050
100
150
200
250
300
350
µS/c
m
Oct
200
9
Oct
201
0
Oct
201
1
Oct
201
2
Oct
201
3
Conductivity Laboratory Upper Limit Lower Limit
Note: the AWQS may not be shown in order to allow greater visual detail of measured values for trend analysis
45

●●
●
●
●●●
●
●●●
●
●●
●●●
●
●●●●
●
●●●
●
●●
●
●●●●● ●
●
●●
●
●
●●
●●
●
●
●●
●●
●
●●
●
●●● ●
●
050
150
Site 6 − Conductivity FieldµS
/cm
2009
2010
2011
2012
2013
●
●
●
●
●
●
●
●
●●●
●
●●
●●
●
●
●●
●●
●
●●
●
●
●●
●
●●
●●● ●
●
●
●
●
●
●
●
●
●
●
●
●
●
●●
●
●●
●
●●
●●
●
050
100
150
200
250
300
350
µS/c
m
Oct
200
9
Oct
201
0
Oct
201
1
Oct
201
2
Oct
201
3
Conductivity Field Upper Limit Lower Limit
Note: the AWQS may not be shown in order to allow greater visual detail of measured values for trend analysis
46

●●●●
●
●
●
●
●
●●
●●●
●
●●
●●
●●
●
●●
●●
● ●
●
●
●
●●●
●
●
●●●
●●
●●●
●●●
●
●●●
●●
●●
●
●●●
●
6.0
7.0
8.0
Site 6 − pH Laboratorysu
2009
2010
2011
2012
2013
●
●●●
●
●
●
●
●
●
●
●●
●●
●●
●●
●●
●
●●
●
●
● ●
●
●
●
●●
●
●
●
●
●●
●
●●●
●
●●●
●
●●●
●
●
●●
●
●●
●
●
56
78
910
su
Oct
200
9
Oct
201
0
Oct
201
1
Oct
201
2
Oct
201
3
pH Laboratory Upper Limit Lower Limit
Note: the AWQS may not be shown in order to allow greater visual detail of measured values for trend analysis
47

●
●
●
●
●●
●
●
●●●
●
●
●●
●●
●●●●
●●●
●
●●
●
●
●
●●
●●
● ●●●●
●●
●●●
●
●●●●●●
●
●●●
●●● ●
●6.
07.
08.
0
Site 6 − pH Fieldsu
2009
2010
2011
2012
2013
●
●
●
●
●●
●
●
●●●
●
●
●
●
●
●
●●
●
●
●
●●
●
●
●
●
●
●
●●
●●
●●●●
●
●●
●●
●
●
●●
●●●●
●
●●●
●
●● ●
●
56
78
910
su
Oct
200
9
Oct
201
0
Oct
201
1
Oct
201
2
Oct
201
3
pH Field Upper Limit Lower Limit
Note: the AWQS may not be shown in order to allow greater visual detail of measured values for trend analysis
48

●●
●
●
●●●
●●
●
●
●
●●
●●
●
●●
●●●
●●
●
●
●
●●
●
●●●●●
●
●
●●
●
●
●
●
●●
●
●
●●
●●
●
●●●
●●●
●
●
2040
60
Site 6 − Alkalinitym
g/L
2009
2010
2011
2012
2013
●●
●
●
●●●
●●
●
●
●
●●
●
●
●
●●
●●●
●●
●
●
●
●●
●
●●●●
●
●
●
●●
●
●
●
●
●
●
●
●
●
●
●●
●
●●
●
●●
●●
●
020
4060
8010
012
014
0
mg/
L
Oct
200
9
Oct
201
0
Oct
201
1
Oct
201
2
Oct
201
3
Alkalinity Upper Limit Lower Limit
Note: the AWQS may not be shown in order to allow greater visual detail of measured values for trend analysis
49

●
●●
●●
●●
●●●
●
●
●●
●●●
●●
●●●
●●●●
●
●●
●
●●
●●● ●●
●
●
●
●
●●
●●
●
●
●
●●
●
●●●
●●● ●
●
010
20
Site 6 − Sulfate Totalm
g/L
2009
2010
2011
2012
2013
●
●●
●●
●●
●●●
●
●
●●
●●
●
●●
●
●●
●●
●
●
●
●●
●
●●
●●● ●
●
●
●
●
●
●
●
●
●
●
●
●
●
●
●
●●
●
●●
● ●
●
010
2030
4050
mg/
L
Oct
200
9
Oct
201
0
Oct
201
1
Oct
201
2
Oct
201
3
Sulfate Total Upper Limit Lower Limit
Note: the AWQS may not be shown in order to allow greater visual detail of measured values for trend analysis
50

●●●
●
●●●
●●
●●
●
●●
●●●
●●
●●●
●●
●●
●
●●●
●●●●● ●
●
●
●
●
●
●●
●●
●
●
●●
●●
●
●●●
●●●
●
●
040
80
Site 6 − Hardnessm
g/L
2009
2010
2011
2012
2013
●●
●
●
●
●●
●
●
●●
●
●●
●●
●
●
●
●●
●
●
●
●
●
●
●●●
●●
●●●
●
●
●
●
●
●
●
●
●
●
●
●
●
●
●●
●
●●
●
●●
●●
●
020
4060
8010
012
014
0
mg/
L
Oct
200
9
Oct
201
0
Oct
201
1
Oct
201
2
Oct
201
3
Hardness Upper Limit Lower Limit
Note: the AWQS may not be shown in order to allow greater visual detail of measured values for trend analysis
51

●
●●●●
●●●
●●●
●●●
●
●●●●●●
●●●●
●
●
●
●
●●●●●
●
●●
●●
●
●●●● ●
●●●
●
●●
●
●●●
●●
● ●●
0.00
0.15
Site 6 − Arsenic Dissolvedµg
/L
2009
2010
2011
2012
2013
●●●●●●●●●●● ●●● ●●●●●●●●●●●●● ●
●●●●●●● ●●●●●●●●● ●●●●●●●●●●●●●● ●●
01
23
45
µg/L
Oct
200
9
Oct
201
0
Oct
201
1
Oct
201
2
Oct
201
3
Arsenic Dissolved Upper Limit Lower Limit
Note: the AWQS may not be shown in order to allow greater visual detail of measured values for trend analysis
52

●
●●
●●
●
●●
●●
● ●0
1020
30
Site 6 − Barium Dissolvedµg
/L
2009
2010
2011
2012
2013
●
●
●
●●
●
●
●
●
●
● ●
010
2030
4050
6070
µg/L
Oct
200
9
Oct
201
0
Oct
201
1
Oct
201
2
Oct
201
3
Barium Dissolved Upper Limit Lower Limit
Note: the AWQS may not be shown in order to allow greater visual detail of measured values for trend analysis
53

●
●●
●●●
●
●●●●●
●
●
●●●
●
●
●●●●
●
●●
●
●●●
●●
●●●
●●
●●
●●
●●●
●●●●●●●
●
●●●
●●●
●●
0.00
0.06
Site 6 − Cadmium Dissolvedµg
/L
2009
2010
2011
2012
2013
●
●
●
●
●●
●
●●●●
●●
●
●●
●
●
●
●●●
●
●
●
●
●
●●●
●●
●
●●●
●●
●
●
●●●
●
●
●●●●●●
●
●
●●
●●●
●●
0.00
0.05
0.10
0.15
0.20
0.25
µg/L
Oct
200
9
Oct
201
0
Oct
201
1
Oct
201
2
Oct
201
3
Cadmium Dissolved Upper Limit Lower Limit
Note: the AWQS may not be shown in order to allow greater visual detail of measured values for trend analysis
54

●
●●
●
●
●
●● ● ●
●
●
0.0
1.0
2.0
Site 6 − Chromium Dissolvedµg
/L
2009
2010
2011
2012
2013
●
●
●
●
●
●
●
●●
●
●
●
01
23
45
µg/L
Oct
200
9
Oct
201
0
Oct
201
1
Oct
201
2
Oct
201
3
Chromium Dissolved Upper Limit Lower Limit
Note: the AWQS may not be shown in order to allow greater visual detail of measured values for trend analysis
55

●●●
●●●●
●●●● ●
●
●
●●
●
●●●
●●●●●●
●
●●
●
●●
●●●
●
●●
●
●
●●●
●
●●●
●●
●●
●
●●
●
●
●●
●●
0.0
1.0
Site 6 − Copper Dissolvedµg
/L
2009
2010
2011
2012
2013
●●●●
●●●
●●●● ●
●
●
●●●
●●●
●●●●●●
●
●●
●
●●
●●●
●
●●
●
●
●●●
●
●●●
●●
●●
●
●●●
●
●●●
●
01
23
45
67
µg/L
Oct
200
9
Oct
201
0
Oct
201
1
Oct
201
2
Oct
201
3
Copper Dissolved Upper Limit Lower Limit
Note: the AWQS may not be shown in order to allow greater visual detail of measured values for trend analysis
56

●●●●●●●
●●●● ●
●●
●●●
●●●●●●
●●●
●
●●●
●●
●●●●
●●●
●
●●●● ●●●
●
●●●
●
●●●●●● ●●0.
00.
20.
4
Site 6 − Lead Dissolvedµg
/L
2009
2010
2011
2012
2013
●●●●●●●
●●●● ●
●●
●●●●
●●●●●●
●●
●
●●●
●●●●●
●●●●
●
●●●● ●●●
●
●●●
●
●●●●●● ●●0.
00.
51.
01.
52.
0
µg/L
Oct
200
9
Oct
201
0
Oct
201
1
Oct
201
2
Oct
201
3
Lead Dissolved Upper Limit Lower Limit
Note: the AWQS may not be shown in order to allow greater visual detail of measured values for trend analysis
57

●
●
●
● ●
●
● ●●
●● ●
0.0
1.0
Site 6 − Nickel Dissolvedµg
/L
2009
2010
2011
2012
2013
●●
●● ●
●● ●
●● ● ●
02
46
810
1214
µg/L
Oct
200
9
Oct
201
0
Oct
201
1
Oct
201
2
Oct
201
3
Nickel Dissolved Upper Limit Lower Limit
Note: the AWQS may not be shown in order to allow greater visual detail of measured values for trend analysis
58

●●● ● ● ● ● ● ● ● ● ●
−1.0
0.0
1.0
Site 6 − Silver Dissolvedµg
/L
2009
2010
2011
2012
2013
●●● ● ● ● ● ● ● ● ● ●0.0
0.5
1.0
1.5
2.0
2.5
3.0
µg/L
Oct
200
9
Oct
201
0
Oct
201
1
Oct
201
2
Oct
201
3
Silver Dissolved Upper Limit Lower Limit
Note: the AWQS may not be shown in order to allow greater visual detail of measured values for trend analysis
59

●
●●
●
●●
●
●●●●●
●
●
●●
●
●
●
●●●
●
●●
●
●
●
●●
●
●
●●●●●
●●
●●
●●●
●●
●●
●●●
●●●
●
●●●
●●
05
1015
Site 6 − Zinc Dissolvedµg
/L
2009
2010
2011
2012
2013
●
●●
●
●●
●
●●●●●
●
●
●●
●
●
●
●●●●
●●
●
●●
●●
●●
●●●●●●
●
●●
●●●
●●
●●●●●
●●●
●
●●●
●●
020
4060
80
µg/L
Oct
200
9
Oct
201
0
Oct
201
1
Oct
201
2
Oct
201
3
Zinc Dissolved Upper Limit Lower Limit
Note: the AWQS may not be shown in order to allow greater visual detail of measured values for trend analysis
60

●
●●
●
●
●
●●
●
●
● ●0.
00.
51.
01.
5
Site 6 − Selenium Dissolvedµg
/L
2009
2010
2011
2012
2013
●
●●
●
●
●
●●
●
●
● ●
01
23
45
µg/L
Oct
200
9
Oct
201
0
Oct
201
1
Oct
201
2
Oct
201
3
Selenium Dissolved Upper Limit Lower Limit
Note: the AWQS may not be shown in order to allow greater visual detail of measured values for trend analysis
61

●●●●●●●
●●
●● ●
●
●
●●
●●●●●●●●●●
●
●●●
●●
●●●
●
●●●
●
●●●
●
●●●●●
●●
●
●●●
●
●●●●
0.00
00.
004
0.00
8 Site 6 − Mercury Dissolvedµg
/L
2009
2010
2011
2012
2013
●●●
●●●●
●
●
●●●
●
●
●
●
●●
●●
●●●●
●●
●
●●
●
●●
●●●
●
●
●●
●
●
●●
●
●●●●
●
●●
●
●●●
●
●●●
●
0.00
00.
002
0.00
40.
006
0.00
80.
010
0.01
2
µg/L
Oct
200
9
Oct
201
0
Oct
201
1
Oct
201
2
Oct
201
3
Mercury Dissolved Upper Limit Lower Limit
Note: the AWQS may not be shown in order to allow greater visual detail of measured values for trend analysis
62

●
●
●
●
●●
●
●
●●
●
●
●
●
●
●
●
●
●
●
●
●
●
●
●
●
●
●
●
●
●
●●●
●
●
●
●
●●
●
●
●
●
●●● ●
●
●
●
●
●
●
●
●
●
●
●
●
6080
100
120
140
160
180
Site 48 vs. Site 6 − Conductiivty
Oct
200
8
Oct
200
9
Oct
201
0
Oct
201
1
Oct
201
2
● Upgradient Site 48 Downgradient Site 6
63

●●
●
●
●●
●
●
●
●
●
●
●
●●
●
●●
●
●
●
●
●
●
●
●
●
●
●
●
●
●
●
●
●
●
● ●●
●
●●
●●
●
●● ●
●●●
●
●● ●
●●
●●
●
5.5
6.0
6.5
7.0
7.5
8.0
8.5
Site 48 vs. Site 6 − pH
Oct
200
8
Oct
200
9
Oct
201
0
Oct
201
1
Oct
201
2
● Upgradient Site 48 Downgradient Site 6
64

●
●
●
●
●
●●
●
●
●
●●
●
●
●
● ●
●
●
●
●●
●
●
●
●
●
●
●
●●
●●
●
●
●●
●
●
●●
●
●●
●●
●
●
●
●
●
●
●
●
●
●
●
●
●
●
2030
4050
60
Site 48 vs. Site 6 − Alkalinity
Oct
200
8
Oct
200
9
Oct
201
0
Oct
201
1
Oct
201
2
● Upgradient Site 48 Downgradient Site 6
65

●
●
●
●
●
●
●
●
●
●
●
●
●
●
●
●●
●●
●
●●
●
●
●
●
●
●
●
●
●
●
●●
●
●
●
●
●
●●
●
●
●
●●●
●
●
●
●
●
●
●
●
●
●
●
●
●
510
1520
25
Site 48 vs. Site 6 − Sulfate
Oct
200
8
Oct
200
9
Oct
201
0
Oct
201
1
Oct
201
2
● Upgradient Site 48 Downgradient Site 6
66

●
●●
●
●●
●●
●●
● ●●
●●●
●●
●● ●●
●●
●● ●
●●●
●
●●●●
●●
●
●
●
●●●
●
●●●
●●●
●●
●●
●
●
●●
●
●
510
15
Site 48 vs. Site 6 − Zinc
Oct
200
8
Oct
200
9
Oct
201
0
Oct
201
1
Oct
201
2
● Upgradient Site 48 Downgradient Site 6
67

Variable:X Y
Site #48 #6Year WY2014 WY2014 D |D| Rank
Oct 106.0 110.0 -4.0 4.0 -4.5Nov 139.0 146.0 -7.0 7.0 -9Dec 144.0 150.0 -6.0 6.0 -7.5Jan 44.0 52.0 -8.0 8.0 -10Feb 151.0 157.0 -6.0 6.0 -7.5Mar 147.0 159.0 -12.0 12.0 -12Apr 180.0 189.0 -9.0 9.0 -11May 95.0 98.0 -3.0 3.0 -1.5Jun 94.0 97.0 -3.0 3.0 -1.5Jul 111.0 115.0 -4.0 4.0 -4.5Aug 117.0 121.0 -4.0 4.0 -4.5Sep 131.2 135.2 -4.0 4.0 -4.5
Median 124.1 128.1 -5.0 5.0
n m N= 1212 12 SR= -78
a W+=0.05 0
W'a,n p-test17 0.000
Wilcoxon-signed-ranks test
Exact Form
Differences
Specific Conductance, Field (µS/cm)
H0 median [D]=0 REJECT
H1 median [D]<0 ACCEPT
68

Variable:X Y
Site #48 #6Year WY2014 WY2014 D |D| Rank
Oct 7.87 7.84 0.03 0.03 6.5Nov 7.91 7.88 0.03 0.03 6.5Dec 7.85 7.88 -0.03 0.03 -9.5Jan 7.31 7.34 -0.03 0.03 -9.5Feb 7.66 7.68 -0.02 0.02 -3.5Mar 7.82 7.81 0.01 0.01 1Apr 7.82 7.85 -0.03 0.03 -6.5May 7.70 7.59 0.11 0.11 11Jun 7.75 7.77 -0.02 0.02 -3.5Jul 7.85 7.85 0.00Aug 7.90 7.87 0.03 0.03 6.5Sep 8.12 8.13 -0.01 0.01 -2
Median 7.84 7.85 -0.01 0.03
n m N= 1112 11 SR= -3
a W+=0.05 31.5
W'a,n p-test13 0.449
Wilcoxon-signed-ranks test
Exact Form
Differences
pH, Field, Standard Units
H0 median [D]=0 ACCEPTH1 median [D]>0
69

Variable:X Y
Site #48 #6Year WY2014 WY2014 D |D| Rank
Oct 39.4 39.6 -0.2 0.2 -1.5Nov 49.5 50.1 -0.6 0.6 -7Dec 51.2 52.0 -0.8 0.8 -9Jan 16.0 18.5 -2.5 2.5 -12Feb 51.1 52.6 -1.5 1.5 -10Mar 50.0 51.6 -1.6 1.6 -11Apr 56.1 55.7 0.4 0.4 4.00May 34.4 34.7 -0.3 0.3 -3Jun 35.9 36.1 -0.2 0.2 -1.5Jul 39.9 40.4 -0.5 0.5 -6Aug 42.9 43.3 -0.4 0.4 -5.00Sep 49.5 50.2 -0.7 0.7 -8
Median 46.2 46.7 -0.6 0.6
n m N= 1212 12 SR= -70
a W+=0.05 4.00
W'a,n p-test17 0.002
Wilcoxon-signed-ranks test
Exact Form
Differences
Total Alk, (mg/l)
H0 median [D]=0 REJECT
H1 median [D]>0 ACCEPT
70

Variable:X Y
Site #48 #6Year WY2014 WY2014 D |D| Rank
Oct 9.5 10.7 -1.2 1.2 -4Nov 16.3 17.9 -1.6 1.6 -6.5Dec 17.6 20.2 -2.6 2.6 -9Jan 3.4 5.2 -1.7 1.7 -8Feb 18.9 21.7 -2.8 2.8 -10Mar 19.7 23.1 -3.4 3.4 -11Apr 22.0 25.6 -3.6 3.6 -12May 8.7 9.3 -0.6 0.6 -2Jun 8.9 9.5 -0.6 0.6 -1Jul 11.1 12.1 -1.0 1.0 -3Aug 10.7 12.3 -1.6 1.6 -6.5Sep 14.6 15.9 -1.3 1.3 -5
Median 12.9 14.1 -1.6 1.6
n m N= 1212 12 SR= -78
a W+=0.05 0
W'a,n p-test17 0.000
H0 median [D]=0 REJECT
H1 median [D]<0 ACCEPT
Wilcoxon-signed-ranks test
Exact Form
Differences
Sulfate, Total (mg/l)
71

Variable:X Y
Site #48 #6Year WY2014 WY2014 D |D| Rank
Oct 2.90 6.53 -3.63 3.63 -9Nov 4.18 7.05 -2.87 2.87 -7Dec 3.53 7.12 -3.59 3.59 -8Jan 9.27 11.40 -2.13 2.13 -3Feb 3.92 9.78 -5.86 5.86 -12Mar 4.50 9.69 -5.19 5.19 -11Apr 2.97 7.61 -4.64 4.64 -10May 2.39 4.77 -2.38 2.38 -4Jun 2.46 3.30 -0.84 0.84 -1Jul 2.06 3.38 -1.32 1.32 -2Aug 2.73 5.13 -2.40 2.40 -5Sep 3.00 5.54 -2.54 2.54 -6
Median 2.99 6.79 -2.71 2.71
n m N= 1212 12 SR= -78
a W+=0.05 0
W'a,n p-test17 0.000
Wilcoxon-signed-ranks test
Exact Form
Differences
Zinc, Dissolved (ug/l)
H0 median [D]=0 REJECT
H1 median [D]<0 ACCEPT
72
INTERPRETIVE REPORT SITE 54 The data collected during the current water year are listed in the following “Table of Results for Water Year 2014” report. The table includes all the required FWMP analyte data (field and laboratory) collected for the current water year and a series of flags keyed to the summary report “Qualified Data by QA Reviewer”. The QA report lists any associated data limitations found during the monthly QA reviews of laboratory data for this site. Median values for all analytes have been calculated and are shown in the right-most column of the table of results. Any value reported as less than MDL has been replaced with a value of ½ MDL for the purpose of median calculation. All data collected at this site for the past six years are included in the data analyses with the exception of the outliers shown in the table below. During the current year no new data points were flagged as outliers after review by HGCMC.
Sample Date Parameter Value Qualifier Notes No outliers have been identified by HGCMC for the period of October 2008 through September 2014.
The data for Water Year 2014 have been compared to the strictest fresh water quality criterion for each applicable analyte. No results exceeded these criteria.
X-Y plots have been generated to graphically present the data for each of the analytes requested in the Statistical Information Goals for this site. These plots have been visually analyzed for the appearance of any trend in concentration. The only obvious visual trend is in field pH that has had a gradual upward trend for the past 5 years. A non-parametric statistical analysis for trend was performed for specific conductivity, field pH, total alkalinity, total sulfate, and dissolved zinc. Calculation details of the Seasonal Kendall analyses are presented in detail on the pages following this interpretive section. The following table summarizes the results on the data collected between Oct-08 and Sep-14 (WY2009-WY2014).
Lower Upper
No exceedances have been identified by HGCMC for the period of October 2013 through September 2014.
Table of Exceedance for Water Year 2014
Sample Date Parameter Value
LimitsHardness
73

Field pH had a statistically significant (p<0.01) trend with a slope estimate of 0.12 su/yr or 1.6% increase. Total alkalinity had a statistically significant (p<0.01) trend with a Sen’s slope estimate of 0.85 mg/L/yr. However given the low magnitude and similar trend noted at Site 6 and Site 48, HGCMC does not feel that these trends are a significant indication of changes in water chemistry at Site 54. A comparison of median values for total alkalinity, field pH, field conductivity, total sulfate, and dissolved zinc between Site 54 and Site 6 has been conducted as specified in the Statistical Information Goals for Site 54. Additionally, X-Y plots have been generated for total alkalinity, field pH, specific conductance, total sulfate, and dissolved zinc that co-plot data from Site 54 and Site 6, the upstream control site, to aid in the comparison between those sites. Calculation details of the non-parametric signed-rank tests are presented in detail on the pages following this interpretive section. The table below summarizes the results of the signed-rank test as performed on the Water Year 2014 dataset.
The median values for pH for Site 6 and Site 54 are 7.85 su and 7.73 su respectively and the median of differences, Site 6 minus Site 54, is 0.03 su. Site 54 has intermittently (8 out of 12) had statistically significantly lower pH readings for water years (WY2002 and WY2013). This difference may in part be due to inflow of Bruin Creek which typically has a slightly lower pH than Greens Creek.
Mann-Kendall test statistics Sen's slope estimaten* p** Trend Q Q(%)
Conductivity Field 6 0.05pH Field 6 <0.01 + 0.12 1.6Alkalinity, Total 6 <0.01 + 0.85 1.9Sulfate, Total 6 0.22Zinc, Dissolved 6 0.16* Number of Years ** Significance level
Table of Summary Statistics for Trend Analysis
Parameter
Site 6 Site 54 Medianmedian median Differences
Conductivity Field 128.1 128.9 -1.8pH Field 7.85 7.73 0.03Alkalinity, Total 46.7 47.7 -1.3Sulfate, Total 14.10 14.00 0.00Zinc, Dissolved 6.79 6.25 0.55
<0.01<0.01<0.010.285<0.01
Table of Summary Statistics for Median Analysis
Site 54 vs Site 6
Signed RanksParameter p-value
74

The median values for total alkalinity for Site 6 and Site 54 are 46.7 mg/L and 47.7 mg/L respectively. The median of the differences, Site 6 minus Site 54, is -1.3 mg/L total alkalinity. Again similar results are obtained using the signed-rank test on the WY2004 - WY2013 total alkalinity datasets. Along with the significant difference in total alkalinity there was a significant difference in field conductivity. Upgradient the median conductivity value was 128.1 µs/cm and the downgradient median value was 128.9 µs/cm, resulting in a -1.8 µs/cm median difference. Datasets from WY2002 – WY2013 yield similar significant results with similar magnitudes. In general, the trend in conductivity is similar to differences measured between Site 48 and Site 6, although of a smaller magnitude. HGCMC feels the current FWMP program is adequate to measure and quantify future changes that may occur between Site 6 and Site 54, given the small magnitude of the differences and the consistency of the variations over the past several years.
75

Sample Date/Parameter Oct 2013 Nov 2013 Dec 2013 Jan 2014 Feb 2014 Mar 2014 Apr 2014 May 2014 Jun 2014 Jul 2014 Aug 2014 Sep 2014 MedianWater Temp (°C) 5.4 1.1 1.1 0.2 0.0 0.8 0.8 2.7 4.4 9.3 8.3 8.7 1.9Conductivity-Field(µmho) 112 147 154 56 160 163 191 99 97 116 121 136.8 128.9Conductivity-Lab (µmho) 97 113 152 56 151 148 176 98 99 116 114 138 115pH Lab (standard units) 7.69 7.73 7.73 7.51 7.56 7.73 7.58 7.38 7.88 7.8 7.62 7.34 7.66pH Field (standard units) 7.79 7.85 7.8 7.38 7.66 7.61 7.66 7.6 7.66 7.88 7.84 8.14 7.73Total Alkalinity (mg/L) 40.4 51.5 53.6 21.7 53.1 53.7 58.1 36.5 36 41.6 44.5 50.9 47.7Total Sulfate (mg/L) 10.7 18.1 20.2 5.3 21.7 24.7 25.8 9.2 9.5 12.2 11.5 15.7 14.0Hardness (mg/L) 50.8 68.6 71.3 23.5 70.8 75.4 81.6 44.5 43.8 51.4 56.3 66.8 61.6Dissolved As (ug/L) 0.2 0.194 0.177 0.263 0.172 0.159 0.156 0.183 0.19 0.239 0.233 0.252 0.192Dissolved Ba (ug/L) 30.4 32.3 31.4Dissolved Cd (ug/L) 0.0441 0.0514 0.0489 0.0844 0.0553 0.0488 0.0483 0.0347 0.0337 0.0371 0.0456 0.0428 0.0470Dissolved Cr (ug/L) 0.66 1.12 0.890Dissolved Cu (ug/L) 0.632 0.349 0.401 1.76 0.418 0.496 0.316 0.525 0.314 0.452 0.489 0.397 0.435Dissolved Pb (ug/L) 0.0222 0.0122 0.0113 0.431 0.0145 0.0336 0.0056 0.0085 0.0055 0.0063 0.0084 0.0081 0.0099Dissolved Ni (ug/L) 0.617 0.736 0.677Dissolved Ag (ug/L) 0.002 0.002 0.002Dissolved Zn (ug/L) 5.92 7.12 6.58 10.2 8.68 8.77 6.73 4.62 3.25 3.45 4.86 4.99 6.25Dissolved Se (ug/L) 1.1 1.5 1.300Dissolved Hg (ug/L) 0.00125 0.00058 0.000479 0.00478 0.000505 0.000752 0.000528 0.000894 0.000542 0.000501 0.000863 0.000684 0.000632
For individual sample/analyte qualifier descriptions see "Qualified Data by QA Reviewer" table.Values reported as less than MDL are replaced by 1/2 MDL for median calculation purposes.Shaded data has been qualified as an outlier by HGCMC and removed from any further analysis and is not included into the calculation of the median
Table of Results for Water Year 2014
Site 054FMS - 'Greens Creek Below D-Pond'
76

Date Range: 10/01/2013 to 09/30/2014
Site No. Sample Date Sample Time Parameter Value Qualifier Reason for Qualifier
Qualified Data by QA Reviewer
054FMS 11/11/2013 12:00 PM pH 7.73 J Hold Time Violation
054FMS 12/9/2013 12:00 PM Diss. Ni-ICP/MS 0.61 U Field Blank Contamination
Diss. Pb-ICP/MS 0.01 U Field Blank Contamination
054FMS 1/14/2014 12:00 PM pH 7.51 J Hold Time Violation
054FMS 2/12/2014 12:00 PM Diss. Cu-ICP/MS 0.41 J LCS Recovery
Sulfate 21.7 J Sample Receipt Temperature
054FMS 4/2/2014 12:00 PM Diss. Pb-ICP/MS 0.00559 J Below Quantitative Range
pH 7.58 J Hold Time Violation
054FMS 5/5/2014 12:00 PM Diss. Pb-ICP/MS 0.0085 J Below Quantitative Range
054FMS 6/3/2014 12:00 PM Diss. Pb-ICP/MS 0.00549 J Below Quantitative Range
Diss. Zn-ICP/MS 3.25 U Field Blank Contamination
054FMS 7/7/2014 12:00 PM Diss. Pb-ICP/MS 0.00625 J Below Quantitative Range
Sulfate 12.2 J Sample Receipt Temperature
054FMS 8/20/2014 12:00 PM Diss. Pb-ICP/MS 0.00843 J Below Quantitative Range
054FMS 9/17/2014 12:00 PM Diss. Pb-ICP/MS 0.00812 J Below Quantitative Range
77

●
●●●
●●●
●●
●
●
●●
●●●●●
●
●
●
●●
●
●● ●●●
●●
●
●
●●
●
●●
●●
●
●●
●
●●
●
●
●●●●
●●
●
●
●●●
04
8
Site 54 − Water Temperature°C
2009
2010
2011
2012
2013
●
●
●●
●
●●
●
●
●
●
●
●
●●●●
●
●
●
●
●●
●
●●●
●●
●
●
●
●
●
●
●
●
●
●
●
●
●●
●
●●
●
●
●●
●●
●●
●
●
●
●●
05
1015
20
°C
Oct
200
9
Oct
201
0
Oct
201
1
Oct
201
2
Oct
201
3
Water Temperature Upper Limit Lower Limit
Note: the AWQS may not be shown in order to allow greater visual detail of measured values for trend analysis
78

●●●
●●
●●
●●
●●
●
●●
●●
●
●●
●●
●
●●●
●
●●
●●
●●
●●● ●●
●
●●
●
●●
●
●
●
●
●●●
●
●
●●
●
●●● ●
●
050
150
Site 54 − Conductivity LaboratoryµS
/cm
2009
2010
2011
2012
2013
●●
●
●
●
●●
●
●●
●
●
●
●
●
●
●
●●
●
●
●
●
●●
●
●
●
●●
●●
●●●●●
●
●
●
●
●●
●
●
●
●
●●
●
●
●
●●
●
●●
● ●
●
050
100
150
200
250
300
350
µS/c
m
Oct
200
9
Oct
201
0
Oct
201
1
Oct
201
2
Oct
201
3
Conductivity Laboratory Upper Limit Lower Limit
Note: the AWQS may not be shown in order to allow greater visual detail of measured values for trend analysis
79

●●
●
●
●●●
●
●●●
●
●●
●●●
●
●●●●
●●●
●
●
●●
●
●●●●● ●
●
●●
●
●
●●
●●
●
●
●●
●●
●
●●
●
●●● ●
●
050
150
Site 54 − Conductivity FieldµS
/cm
2009
2010
2011
2012
2013
●
●
●
●
●
●
●
●
●●●
●
●●
●●
●
●
●●
●●
●
●●
●
●
●●
●
●●
●●● ●
●
●
●
●
●
●
●
●
●
●
●
●
●
●●
●
●●
●
●●
●●
●
050
100
150
200
250
300
350
µS/c
m
Oct
200
9
Oct
201
0
Oct
201
1
Oct
201
2
Oct
201
3
Conductivity Field Upper Limit Lower Limit
Note: the AWQS may not be shown in order to allow greater visual detail of measured values for trend analysis
80

●●
●
●
●
●
●
●
●
●
●●
●
● ●
●
●●●
●●
●
●●●
●
●●
●●
●
●●●
●
●●
●●●
●●●●
●●●
●●●●
●●●●
●
●●●
●
5.5
7.0
Site 54 − pH Laboratorysu
2009
2010
2011
2012
2013
●●
●
●
●
●
●
●
●
●
●
●
●
●●
●
●
●●
●●
●
●●
●
●
●
●
●
●
●
●
●●
●
●
●
●●
●
●●●
●
●●
●
●
●●●
●●
●
●
●
●●
●
●
56
78
910
su
Oct
200
9
Oct
201
0
Oct
201
1
Oct
201
2
Oct
201
3
pH Laboratory Upper Limit Lower Limit
Note: the AWQS may not be shown in order to allow greater visual detail of measured values for trend analysis
81

●
●●
●
●
●
●
●
●●●
●
●
●●
●●
●●●
●
●
●
●
●
●●
●
●●
●●
●●
●●
●●
●●
●
●●●
●
●●●●●●
●
●●●●●● ●
●6.
07.
08.
0
Site 54 − pH Fieldsu
2009
2010
2011
2012
2013
●
●●
●
●
●
●
●
●●●
●
●
●●
●
●
●●●
●
●
●
●
●
●
●
●
●
●
●●
●●
●
●●
●
●●
●
●●
●
●
●●
●●
●●
●
●●●●
●
● ●
●
56
78
910
su
Oct
200
9
Oct
201
0
Oct
201
1
Oct
201
2
Oct
201
3
pH Field Upper Limit Lower Limit
Note: the AWQS may not be shown in order to allow greater visual detail of measured values for trend analysis
82
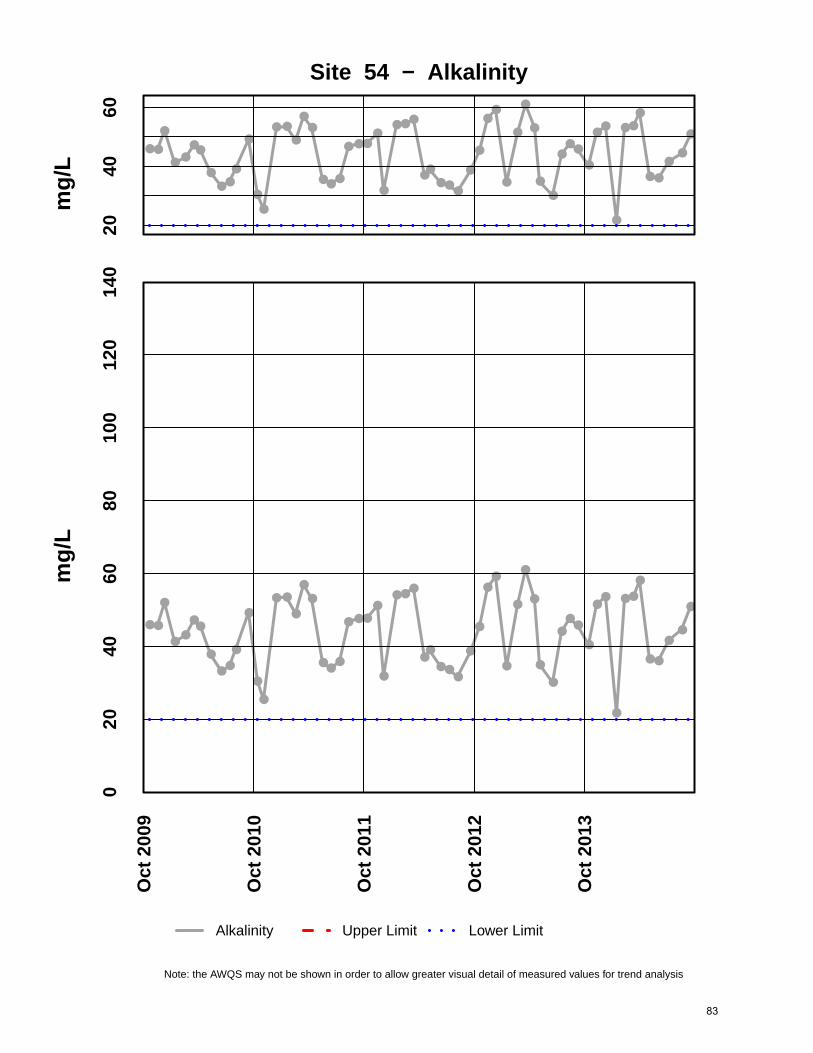
●●
●
●●●●
●●●
●
●
●
●
●●●
●●
●●●
●●●●
●
●●●
●●
●●●
●
●
●●
●
●
●
●
●●
●●●
●
●●
●
●●●
●●
●●
●
2040
60
Site 54 − Alkalinitym
g/L
2009
2010
2011
2012
2013
●●
●
●●
●●
●
●●
●
●
●
●
●●
●
●●
●●●
●●●●
●
●●●
●●
●●●
●
●
●●
●
●
●
●
●
●
●●
●
●
●●
●
●●
●
●●
●●
●
020
4060
8010
012
014
0
mg/
L
Oct
200
9
Oct
201
0
Oct
201
1
Oct
201
2
Oct
201
3
Alkalinity Upper Limit Lower Limit
Note: the AWQS may not be shown in order to allow greater visual detail of measured values for trend analysis
83

●
●●
●●
●●
●●●●
●
●●
●●●
●●
●●●
●●●●
●
●●●
●●
●●● ●●
●
●
●
●
●●
●●
●
●
●
●●
●
●●●
●●● ●
●
010
20
Site 54 − Sulfate Totalm
g/L
2009
2010
2011
2012
2013
●
●●
●●
●●
●●●
●
●
●●
●●
●
●●
●
●●
●●
●
●
●
●
●●
●●
●●● ●
●
●
●
●
●
●●
●
●
●
●
●
●
●
●
●
●●
●●
●●
●
010
2030
4050
mg/
L
Oct
200
9
Oct
201
0
Oct
201
1
Oct
201
2
Oct
201
3
Sulfate Total Upper Limit Lower Limit
Note: the AWQS may not be shown in order to allow greater visual detail of measured values for trend analysis
84

●●●
●●
●●
●●
●●
●
●●
●●●●●
●●●
●●
●●
●
●●●
●●
●●● ●●
●●
●
●
●●
●●
●
●
●●
●●
●
●●●
●●●
●
●
040
80
Site 54 − Hardnessm
g/L
2009
2010
2011
2012
2013
●●
●
●
●
●●
●
●
●
●
●
●●
●●●
●●
●●
●
●
●
●
●
●
●●
●
●
●
●●●
●
●
●
●
●
●
●
●
●
●
●
●
●
●
●●
●
●
●
●
●●
●
●
●
020
4060
8010
012
014
0
mg/
L
Oct
200
9
Oct
201
0
Oct
201
1
Oct
201
2
Oct
201
3
Hardness Upper Limit Lower Limit
Note: the AWQS may not be shown in order to allow greater visual detail of measured values for trend analysis
85

●
●●●
●●●
●●●
●●●
●
●
●●
●●●
●●●●
●●
●●●●
●
●
●●●
●●
●●
●
●
●
●●●
●●●
●●●
●
●●●
●●
● ●●
0.00
0.15
Site 54 − Arsenic Dissolvedµg
/L
2009
2010
2011
2012
2013
●●●●●●●●●●● ●●●●●●●●●●●●●●●● ●●●●●●●● ●●●●
●●●●● ●●●●●●●●
●●●●●● ●●
01
23
45
µg/L
Oct
200
9
Oct
201
0
Oct
201
1
Oct
201
2
Oct
201
3
Arsenic Dissolved Upper Limit Lower Limit
Note: the AWQS may not be shown in order to allow greater visual detail of measured values for trend analysis
86

●
●●
● ●
●
●●
●●
●0
1020
30
Site 54 − Barium Dissolvedµg
/L
2009
2010
2011
2012
2013
●
●
●
●●
●
●
●
●
●●
010
2030
4050
6070
µg/L
Oct
200
9
Oct
201
0
Oct
201
1
Oct
201
2
Oct
201
3
Barium Dissolved Upper Limit Lower Limit
Note: the AWQS may not be shown in order to allow greater visual detail of measured values for trend analysis
87

●●●
●●
●●
●●●●
●●
●
●●
●
●
●
●●
●
●
●●●
●
●●
●
●●
●●
●●
●●●
●
●●●
●
●
●●●●
●●
●
●●●
●●●●●
0.00
0.04
0.08
Site 54 − Cadmium Dissolvedµg
/L
2009
2010
2011
2012
2013
●●●
●●
●●
●●
●●
●●
●
●●
●
●
●
●●
●
●
●●●
●
●
●●
●●
●
●
●●
●●
●
●
●●●
●
●
●
●●●
●●
●
●●●
●●●
●●
0.00
0.05
0.10
0.15
0.20
0.25
µg/L
Oct
200
9
Oct
201
0
Oct
201
1
Oct
201
2
Oct
201
3
Cadmium Dissolved Upper Limit Lower Limit
Note: the AWQS may not be shown in order to allow greater visual detail of measured values for trend analysis
88

●
●
●
●● ●
●
● ●●
●
01
23
Site 54 − Chromium Dissolvedµg
/L
2009
2010
2011
2012
2013
●
●
●
●
● ●
●
● ●
●
●
01
23
45
µg/L
Oct
200
9
Oct
201
0
Oct
201
1
Oct
201
2
Oct
201
3
Chromium Dissolved Upper Limit Lower Limit
Note: the AWQS may not be shown in order to allow greater visual detail of measured values for trend analysis
89

●●●●
●●●
●●●● ●
●
●
●●●
●●●
●●
●●●●
●
●●●
●●
●●●
●
●
●●
●
●●●
●
●●●
●●
●●
●
●●●
●
●● ●
●
0.0
1.0
Site 54 − Copper Dissolvedµg
/L
2009
2010
2011
2012
2013
●●●●
●●●
●●●● ●
●
●
●●●
●●●
●●
●●●●
●
●●●
●●
●●●
●
●
●●
●
●●●
●
●●●
●●
●●
●
●●●
●●
● ●●
01
23
45
67
µg/L
Oct
200
9
Oct
201
0
Oct
201
1
Oct
201
2
Oct
201
3
Copper Dissolved Upper Limit Lower Limit
Note: the AWQS may not be shown in order to allow greater visual detail of measured values for trend analysis
90

●●●●●●●●●
●● ●
●●
●●●
●●●
●
●●●●●
●
●
●●●
●
●●●●
●●●
●
●●●● ●●●
●
●●●
●
●●●●●● ●●
0.0
0.2
0.4
Site 54 − Lead Dissolvedµg
/L
2009
2010
2011
2012
2013
●●●●●●●●●
●● ●
●●
●●●●
●●●
●●●●●
●
●
●●●
●
●●●●
●●●
●
●●●● ●●●
●
●●●
●
●●●●●● ●●0.
00.
51.
01.
52.
0
µg/L
Oct
200
9
Oct
201
0
Oct
201
1
Oct
201
2
Oct
201
3
Lead Dissolved Upper Limit Lower Limit
Note: the AWQS may not be shown in order to allow greater visual detail of measured values for trend analysis
91

●
●
●●
●
●● ● ●
●●
0.0
1.0
Site 54 − Nickel Dissolvedµg
/L
2009
2010
2011
2012
2013
●
●
●●
●●
● ● ●● ●
02
46
810
1214
µg/L
Oct
200
9
Oct
201
0
Oct
201
1
Oct
201
2
Oct
201
3
Nickel Dissolved Upper Limit Lower Limit
Note: the AWQS may not be shown in order to allow greater visual detail of measured values for trend analysis
92

●●● ● ● ● ● ● ● ● ●
−1.0
0.0
1.0
Site 54 − Silver Dissolvedµg
/L
2009
2010
2011
2012
2013
●●● ● ● ● ● ● ● ● ●0.0
0.5
1.0
1.5
2.0
2.5
3.0
µg/L
Oct
200
9
Oct
201
0
Oct
201
1
Oct
201
2
Oct
201
3
Silver Dissolved Upper Limit Lower Limit
Note: the AWQS may not be shown in order to allow greater visual detail of measured values for trend analysis
93

●
●●
●
●●
●
●●●●●
●
●
●●
●
●
●
●●●●
●●
●
●
●●
●
●●
●●●●●
●●
●
●●●●
●●
●●
●●●
●
●●
●
●●●
●●
04
812
Site 54 − Zinc Dissolvedµg
/L
2009
2010
2011
2012
2013
●
●●
●●●
●
●●●● ●
●
●
●●
●
●
●
●●●●
●●
●
●
●●
●
●●
●●●●●●●
●●●●
●
●●●
●●
●●
●●●
●●
●●●●
020
4060
80
µg/L
Oct
200
9
Oct
201
0
Oct
201
1
Oct
201
2
Oct
201
3
Zinc Dissolved Upper Limit Lower Limit
Note: the AWQS may not be shown in order to allow greater visual detail of measured values for trend analysis
94

●
●●
●●
●
●●
●
●
●0.
01.
0
Site 54 − Selenium Dissolvedµg
/L
2009
2010
2011
2012
2013
●
●●
●●
●
●●
●
●
●
01
23
45
µg/L
Oct
200
9
Oct
201
0
Oct
201
1
Oct
201
2
Oct
201
3
Selenium Dissolved Upper Limit Lower Limit
Note: the AWQS may not be shown in order to allow greater visual detail of measured values for trend analysis
95

●●●
●●●
●
●●●● ●
●
●
●●
●●
●●●
●●●●●
●
●●●
●●
●●●
●
●●●
●
●●
●
●
●●●●●
●●
●
●●●
●●●
●●
0.00
00.
003
Site 54 − Mercury Dissolvedµg
/L
2009
2010
2011
2012
2013
●●●
●●●
●
●●●●
●
●
●
●●
●●
●●●
●●●●●
●
●●●
●●
●●●
●
●
●●
●
●
●●
●
●
●●●●
●●
●
●●●
●●●
●●
0.00
00.
002
0.00
40.
006
0.00
80.
010
0.01
2
µg/L
Oct
200
9
Oct
201
0
Oct
201
1
Oct
201
2
Oct
201
3
Mercury Dissolved Upper Limit Lower Limit
Note: the AWQS may not be shown in order to allow greater visual detail of measured values for trend analysis
96

●
●
●
●
●
●
●
●
●●
●
●
●
●
●
●
●
●
●
●
●
●
●
●
●●
●●
●
●
●
●
●●
●
●
●
●
●
●●
●
●
●
●●●
●
●
●
●
●
●
●
●
●
●
●
●
●
6080
100
120
140
160
180
Site 6 vs. Site 54 − Conductiivty
Oct
200
8
Oct
200
9
Oct
201
0
Oct
201
1
Oct
201
2
● Upgradient Site 6 Downgradient Site 54
97

●●● ●●
●
●● ●
●
●●
●
●
●
●
●●
●
●
●●●
●
●
●
●
●
●
●●
●
●
●
●●
●
●
●
●
●
●
●
●
●
●
●● ●●
●
●●
●●
●
●
●
●●
6.0
6.5
7.0
7.5
8.0
8.5
Site 6 vs. Site 54 − pH
Oct
200
8
Oct
200
9
Oct
201
0
Oct
201
1
Oct
201
2
● Upgradient Site 6 Downgradient Site 54
98

●
●
●
●
●
●
●
●
●
● ●●
●●
●
●
●●
●
●
●
●
●
●
●
●
●
●
●
●
●
●●
●
●
●
●
●
●
●
●
●
●●
●●
●
●
●
●
●
●
●
●
●
●
●
●
●
●
2030
4050
60
Site 6 vs. Site 54 − Alkalinity
Oct
200
8
Oct
200
9
Oct
201
0
Oct
201
1
Oct
201
2
● Upgradient Site 6 Downgradient Site 54
99

●
●●
●
●
●●
●
●
●
●
●
●
●
●
●
●
●●
●
●●
●
●
●●
●
●
●
●
●
●
●●
●
●
●
●
●
●
●
●
●
●
●●
● ●
●
●
●
●
●
●
●
●
●
●
●
●
510
1520
25
Site 6 vs. Site 54 − Sulfate
Oct
200
8
Oct
200
9
Oct
201
0
Oct
201
1
Oct
201
2
● Upgradient Site 6 Downgradient Site 54
100

●
●
●
●
●
●
●
●
●●
●
●
●
●
●
●
●
●
●
●●
●●
●
●
●
●●
●
●
●
●
●●
●
●●
●
●
●
●
●
●
●
●●●
● ●
●
●
●
●
●●
●
●
●
●
●510
15
Site 6 vs. Site 54 − Zinc
Oct
200
8
Oct
200
9
Oct
201
0
Oct
201
1
Oct
201
2
● Upgradient Site 6 Downgradient Site 54
101

Variable:X Y
Site #6 #54Year WY2014 WY2014 D |D| Rank
Oct 110.0 112.0 -2.0 2.0 -5.5Nov 146.0 147.0 -1.0 1.0 -2Dec 150.0 154.0 -4.0 4.0 -9Jan 52.0 56.0 -4.0 4.0 -9Feb 157.0 160.0 -3.0 3.0 -7Mar 159.0 163.0 -4.0 4.0 -9Apr 189.0 191.0 -2.0 2.0 -5.5May 98.0 99.0 -1.0 1.0 -2Jun 97.0 97.0 0.0Jul 115.0 116.0 -1.0 1.0 -2Aug 121.0 121.0 0.0Sep 135.2 136.8 -1.6 1.6 -4
Median 128.1 128.9 -1.8 2.0
n m N= 1012 10 SR= -55
a W+=0.05 0
W'a,n p-test10 0.001
Wilcoxon-signed-ranks test
Exact Form
Differences
Specific Conductance, Field (µS/cm)
H0 median [D]=0 REJECT
H1 median [D]<0 ACCEPT
102

Variable:X Y
Site #6 #54Year WY2014 WY2014 D |D| Rank
Oct 7.84 7.79 0.05 0.05 8Nov 7.88 7.85 0.03 0.03 4.5Dec 7.88 7.80 0.08 0.08 9Jan 7.34 7.38 -0.04 0.04 -7Feb 7.68 7.66 0.02 0.02 3Mar 7.81 7.61 0.20 0.20 12Apr 7.85 7.66 0.19 0.19 11May 7.59 7.60 -0.01 0.01 -1.5Jun 7.77 7.66 0.11 0.11 10Jul 7.85 7.88 -0.03 0.03 -6Aug 7.87 7.84 0.03 0.03 4.5Sep 8.13 8.14 -0.01 0.01 -1.5
Median 7.85 7.73 0.03 0.04
n m N= 1212 12 SR= 46
a W+=0.05 16
W'a,n p-test17 0.039
Wilcoxon-signed-ranks test
Exact Form
Differences
pH, Field, Standard Units
H0 median [D]=0 REJECT
H1 median [D]>0 ACCEPT
103

Variable:X Y
Site #6 #54Year WY2014 WY2014 D |D| Rank
Oct 39.6 40.4 -0.8 0.8 -4Nov 50.1 51.5 -1.4 1.4 -7Dec 52.0 53.6 -1.6 1.6 -8Jan 18.5 21.7 -3.2 3.2 -12Feb 52.6 53.1 -0.5 0.5 -2Mar 51.6 53.7 -2.1 2.1 -10Apr 55.7 58.1 -2.4 2.4 -11.00May 34.7 36.5 -1.8 1.8 -9Jun 36.1 36.0 0.1 0.1 1Jul 40.4 41.6 -1.2 1.2 -5.5Aug 43.3 44.5 -1.2 1.2 -5.50Sep 50.2 50.9 -0.7 0.7 -3
Median 46.7 47.7 -1.3 1.3
n m N= 1212 12 SR= -76
a W+=0.05 1.00
W'a,n p-test17 0.000
Wilcoxon-signed-ranks test
Exact Form
Differences
Total Alk, (mg/l)
H0 median [D]=0 REJECT
H1 median [D]>0 ACCEPT
104

Variable:X Y
Site #6 #54Year WY2014 WY2014 D |D| Rank
Oct 10.7 10.7 0.0Nov 17.9 18.1 -0.2 0.2 -7Dec 20.2 20.2 0.0Jan 5.2 5.3 -0.2 0.2 -4Feb 21.7 21.7 0.0Mar 23.1 24.7 -1.6 1.6 -9Apr 25.6 25.8 -0.2 0.2 -5.5May 9.3 9.2 0.1 0.1 3Jun 9.5 9.5 0.0 0.0 1Jul 12.1 12.2 -0.1 0.1 -2Aug 12.3 11.5 0.8 0.8 8Sep 15.9 15.7 0.2 0.2 5.5
Median 14.1 14.0 0.0 0.2
n m N= 912 9 SR= -10
a W+=0.05 17.5
W'a,n p-test8 0.285
Wilcoxon-signed-ranks test
Exact Form
Differences
Sulfate, Total (mg/l)
H0 median [D]=0 ACCEPTH1 median [D]<0
105

Variable:X Y
Site #6 #54Year WY2014 WY2014 D |D| Rank
Oct 6.53 5.92 0.61 0.61 8Nov 7.05 7.12 -0.07 0.07 -2.5Dec 7.12 6.58 0.54 0.54 6Jan 11.40 10.20 1.20 1.20 12Feb 9.78 8.68 1.10 1.10 11Mar 9.69 8.77 0.92 0.92 10Apr 7.61 6.73 0.88 0.88 9May 4.77 4.62 0.15 0.15 4Jun 3.30 3.25 0.05 0.05 1Jul 3.38 3.45 -0.07 0.07 -2.5Aug 5.13 4.86 0.27 0.27 5Sep 5.54 4.99 0.55 0.55 7
Median 6.79 6.25 0.55 0.55
n m N= 1212 12 SR= 68
a W+=0.05 5
W'a,n p-test17 0.002
Wilcoxon-signed-ranks test
Exact Form
Differences
Zinc, Dissolved (ug/l)
H0 median [D]=0 REJECT
H1 median [D]<0 ACCEPT
106

INTERPRETIVE REPORT SITE 62
Sampling at this site was initiated during the spring of the Water Year 2013. Site 62 is located approximately 1,000 feet downstream from Site 54, and therefore is downstream of Site 23 and Inactive Site D. Sampling is on a monthly basis in conjunction with the other routine monthly sampling along Greens Creek. The data collected during the current water year are listed in the following “Table of Results for Water Year 2014” report. The table includes all the required FWMP analyte data (field and laboratory) collected for the current water year and a series of flags keyed to the summary report “Qualified Data by QA Reviewer”. The QA report lists any associated data limitations found during the monthly QA reviews of laboratory data for this site. Median values for all analytes have been calculated and are shown in the right-most column of the table of results. Any value reported as less than MDL has been replaced with a value of ½ MDL for the purpose of median calculation. All data collected at this site for the past year is included in the report. As shown in the table below, there were no data outliers.
Sample Date Parameter Value Qualifier Notes No outliers have been identified by HGCMC for the period of October 2012 through September 2014.
The data for Water Year 2014 have been compared to the strictest fresh water quality criterion for each applicable analyte. No results exceeding these criteria have been identified as listed in the table below.
X-Y plots have been generated to graphically present the data for each of the analytes requested in the Statistical Information Goals for this site. Because of the limited amount of data, visual trend analysis and statistical analysis of the data was not performed. A comparison of median values for total alkalinity, field pH, field conductivity, total sulfate, and dissolved zinc between Site 62 and Site 54 has been conducted. Additionally, X-Y plots have been generated for total alkalinity, field pH, specific conductance, total sulfate, and dissolved zinc that co-plot data from Site 62 and Site 54, the upstream control site, to aid in the comparison between those sites. Calculation details of the non-parametric signed-rank tests are presented in detail on the pages following this interpretive section. The table below summarizes the results of the signed-rank test as performed on the Water Year 2014 dataset.
Lower Upper
LimitsHardness
No exceedances have been identified by HGCMC for the period of October 2013 through September 2014.
Table of Exceedance for Water Year 2014
Sample Date Parameter Value
107

The median values for pH for Site 6 and Site 54 are 7.73 su and 7.48 su respectively and the median of differences, Site 54 minus Site 62, is 0.23 su. The median values for total alkalinity for Site 54 and Site 62 are 47.7 mg/L and 46.0 mg/L respectively, with a median difference of -2.2 mg/L total alkalinity. Field conductivity was also a statistically significant with a median difference of -9 µS/cm. Similar results to these were obtained when comparing other paired (48-6 and 6-54) sites along Greens Creek. HGCMC feels the current FWMP program is adequate to measure and quantify future changes that may occur between Site 54 and Site 62, given that this is the first year of comparison.
Site 54 Site 62 Medianmedian median Differences
Conductivity Field 128.9 130.00 -9.0pH Field 7.73 7.48 0.23Alkalinity, Total 47.7 46.0 -2.2Sulfate, Total 14 12.7 2.0Zinc, Dissolved 6.25 5.82 -0.2
Table of Summary Statistics for Median Analysis
Site 62 vs Site 54
Signed RanksParameter p-value
<0.01<0.010.016<0.010.087
108

Sample Date/Parameter Oct 2013 Nov 2013 Dec 2013 Jan 2014 Feb 2014 Mar 2014 Apr 2014 May 2014 Jun 2014 Jul 2014 Aug 2014 Sep 2014 MedianWater Temp (°C) 5.4 4 0.2 0.2 1 0.9 2.4 4.3 9 8.1 8.6 4.0Conductivity-Field(µmho) 116 347 63 174 173 210 106 100 122 130 146.7 130.0Conductivity-Lab (µmho) 103 122 65 166 157 186 105 98 121 124 148 122pH Lab (standard units) 7.73 7.78 7.49 7.56 7.75 7.7 7.4 7.34 7.72 7.68 7.71 7.70pH Field (standard units) 7.77 7.76 7.02 7.33 7.48 7.42 7.37 6.82 7.81 7.55 8.06 7.48Total Alkalinity (mg/L) 42 46 23.9 59.2 60.2 62.2 38.7 38 43.1 47.8 54.7 46.0Total Sulfate (mg/L) 11 18.4 6.7 22.6 24.3 27.6 10 9.5 12.7 12.2 16.8 12.7Hardness (mg/L) 54.2 73 27.7 78 78.7 88.4 47.5 45.2 55.4 59.8 72.8 59.8Dissolved As (ug/L) 0.21 0.189 0.257 0.207 0.188 0.176 0.185 0.195 0.183 0.231 0.241 0.195Dissolved Ba (ug/L) 30.6 32.3 31.5Dissolved Cd (ug/L) 0.0466 0.0517 0.0884 0.0587 0.0559 0.0502 0.0377 0.0314 0.0324 0.0457 0.0489 0.0489Dissolved Cr (ug/L) 0.377 1.21 0.794Dissolved Cu (ug/L) 0.594 0.339 1.73 1.99 0.483 0.293 0.513 0.278 0.357 0.497 0.384 0.483Dissolved Pb (ug/L) 0.0173 0.0105 0.593 0.0726 0.037 0.0078 0.0085 0.004 0.0078 0.0122 0.011 0.0110Dissolved Ni (ug/L) 0.669 0.73 0.700Dissolved Ag (ug/L) 0.002 0.002 0.002Dissolved Zn (ug/L) 5.82 6.75 11.1 9.85 8.97 7.11 4.47 3.16 3.46 5.22 5.32 5.82Dissolved Se (ug/L) 1.24 1.54 1.390Dissolved Hg (ug/L) 0.00111 0.000422 0.005 0.000543 0.000659 0.00048 0.000845 0.0004 0.000442 0.00134 0.000663 0.000659
For individual sample/analyte qualifier descriptions see "Qualified Data by QA Reviewer" table.Values reported as less than MDL are replaced by 1/2 MDL for median calculation purposes.Shaded data has been qualified as an outlier by HGCMC and removed from any further analysis and is not included into the calculation of the median
Table of Results for Water Year 2014
Site 062FMS - 'Greens Creek Below Site 54'
109

Date Range: 10/01/2013 to 09/30/2014
Site No. Sample Date Sample Time Parameter Value Qualifier Reason for Qualifier
Qualified Data by QA Reviewer
062FMS 11/11/2013 12:00 PM Diss. Hg-CVAF 0.000114 J Below Quantitative Range
pH 7.67 J Hold Time Violation
062FMS 1/14/2014 12:00 PM pH 7.49 J Hold Time Violation
062FMS 2/12/2014 12:00 PM Diss. Cu-ICP/MS 1.99 J LCS Recovery
Sulfate 22.6 J Sample Receipt Temperature
062FMS 4/2/2014 12:00 PM Diss. Pb-ICP/MS 0.00776 J Below Quantitative Range
pH 7.7 J Hold Time Violation
062FMS 5/5/2014 12:00 PM Diss. Pb-ICP/MS 0.0085 J Below Quantitative Range
062FMS 6/3/2014 12:00 PM Diss. Pb-ICP/MS 0.00398 J Below Quantitative Range
Diss. Zn-ICP/MS 3.16 U Field Blank Contamination
062FMS 7/7/2014 12:00 PM Diss. Pb-ICP/MS 0.00778 J Below Quantitative Range
Sulfate 12.7 J Sample Receipt Temperature
110

●
●●
●
●●
●
●
●
●●●●
●
●
●●●
04
8
Site 62 − Water Temperature°C
2009
2010
2011
2012
2013
●
●●
●
●●
●
●
●
●●
●●
●
●
●
●●
05
1015
20
°C
Oct
200
9
Oct
201
0
Oct
201
1
Oct
201
2
Oct
201
3
Water Temperature Upper Limit Lower Limit
Note: the AWQS may not be shown in order to allow greater visual detail of measured values for trend analysis
111

●●
●
●
●
●
●●
●
●
●●
●
●●
● ●
●
050
150
Site 62 − Conductivity LaboratoryµS
/cm
2009
2010
2011
2012
2013
●
●
●
●
●
●
●●
●
●
●●
●
●●
● ●
●
050
100
150
200
250
300
350
µS/c
m
Oct
200
9
Oct
201
0
Oct
201
1
Oct
201
2
Oct
201
3
Conductivity Laboratory Upper Limit Lower Limit
Note: the AWQS may not be shown in order to allow greater visual detail of measured values for trend analysis
112

●●
●●
●●
●●
●
●
●●●
●●● ●
●
015
030
0
Site 62 − Conductivity FieldµS
/cm
2009
2010
2011
2012
2013
●
●
●
●
●
●
●
●
●
●
●●
●
●●
●●
●
050
100
150
200
250
300
350
µS/c
m
Oct
200
9
Oct
201
0
Oct
201
1
Oct
201
2
Oct
201
3
Conductivity Field Upper Limit Lower Limit
Note: the AWQS may not be shown in order to allow greater visual detail of measured values for trend analysis
113

●●●
●●
●
●●●
●●●●
●●
● ●●
6.5
7.5
Site 62 − pH Laboratorysu
2009
2010
2011
2012
2013
●●●
●●
●
●●●
●●
●●
●●
● ●●
56
78
910
su
Oct
200
9
Oct
201
0
Oct
201
1
Oct
201
2
Oct
201
3
pH Laboratory Upper Limit Lower Limit
Note: the AWQS may not be shown in order to allow greater visual detail of measured values for trend analysis
114

●●
●●
●●●●●
●
●●●●
●
●●
●
6.5
7.5
8.5
Site 62 − pH Fieldsu
2009
2010
2011
2012
2013
●
●
●●
●●
●●●
●
●
●●●
●
●
●
●
56
78
910
su
Oct
200
9
Oct
201
0
Oct
201
1
Oct
201
2
Oct
201
3
pH Field Upper Limit Lower Limit
Note: the AWQS may not be shown in order to allow greater visual detail of measured values for trend analysis
115

●●
●
●
●
●
●
●●
●
●●●
●●●
●
●
2040
60
Site 62 − Alkalinitym
g/L
2009
2010
2011
2012
2013
●
●
●
●
●
●
●
●
●
●
●●●
●●
●
●
●
020
4060
8010
012
014
0
mg/
L
Oct
200
9
Oct
201
0
Oct
201
1
Oct
201
2
Oct
201
3
Alkalinity Upper Limit Lower Limit
Note: the AWQS may not be shown in order to allow greater visual detail of measured values for trend analysis
116

●●
●●
●●
●
●
●
●●●
●●● ●
●
020
40
Site 62 − Sulfate Totalm
g/L
2009
2010
2011
2012
2013
●
●
●
●
●
●
●
●
●
●
●
●
●●
● ●
●
010
2030
4050
mg/
L
Oct
200
9
Oct
201
0
Oct
201
1
Oct
201
2
Oct
201
3
Sulfate Total Upper Limit Lower Limit
Note: the AWQS may not be shown in order to allow greater visual detail of measured values for trend analysis
117

●●
●●
●
●
●●
●
●
●●●
●●●
●
●
040
80
Site 62 − Hardnessm
g/L
2009
2010
2011
2012
2013
●
●
●
●
●
●
●
●
●
●
●●
●
●●
●
●
●
020
4060
8010
012
014
0
mg/
L
Oct
200
9
Oct
201
0
Oct
201
1
Oct
201
2
Oct
201
3
Hardness Upper Limit Lower Limit
Note: the AWQS may not be shown in order to allow greater visual detail of measured values for trend analysis
118

●●● ●
●
●●●●
●
●●●●●●●●
0.0
0.2
0.4
Site 62 − Arsenic Dissolvedµg
/L
2009
2010
2011
2012
2013
●●● ●
●
●●●●●●●●●●● ●●
01
23
45
µg/L
Oct
200
9
Oct
201
0
Oct
201
1
Oct
201
2
Oct
201
3
Arsenic Dissolved Upper Limit Lower Limit
Note: the AWQS may not be shown in order to allow greater visual detail of measured values for trend analysis
119

●●
010
2030
Site 62 − Barium Dissolvedµg
/L
2009
2010
2011
2012
2013
●●
010
2030
4050
6070
µg/L
Oct
200
9
Oct
201
0
Oct
201
1
Oct
201
2
Oct
201
3
Barium Dissolved Upper Limit Lower Limit
Note: the AWQS may not be shown in order to allow greater visual detail of measured values for trend analysis
120

●●●
●
●
●●●
●
●
●●●
●●●
●●
0.00
0.04
0.08
Site 62 − Cadmium Dissolvedµg
/L
2009
2010
2011
2012
2013
●
●●
●
●
●●●
●
●
●●●
●●●
●●
0.00
0.05
0.10
0.15
0.20
0.25
µg/L
Oct
200
9
Oct
201
0
Oct
201
1
Oct
201
2
Oct
201
3
Cadmium Dissolved Upper Limit Lower Limit
Note: the AWQS may not be shown in order to allow greater visual detail of measured values for trend analysis
121

●
●0.
00.
61.
2
Site 62 − Chromium Dissolvedµg
/L
2009
2010
2011
2012
2013
●
●
01
23
45
µg/L
Oct
200
9
Oct
201
0
Oct
201
1
Oct
201
2
Oct
201
3
Chromium Dissolved Upper Limit Lower Limit
Note: the AWQS may not be shown in order to allow greater visual detail of measured values for trend analysis
122
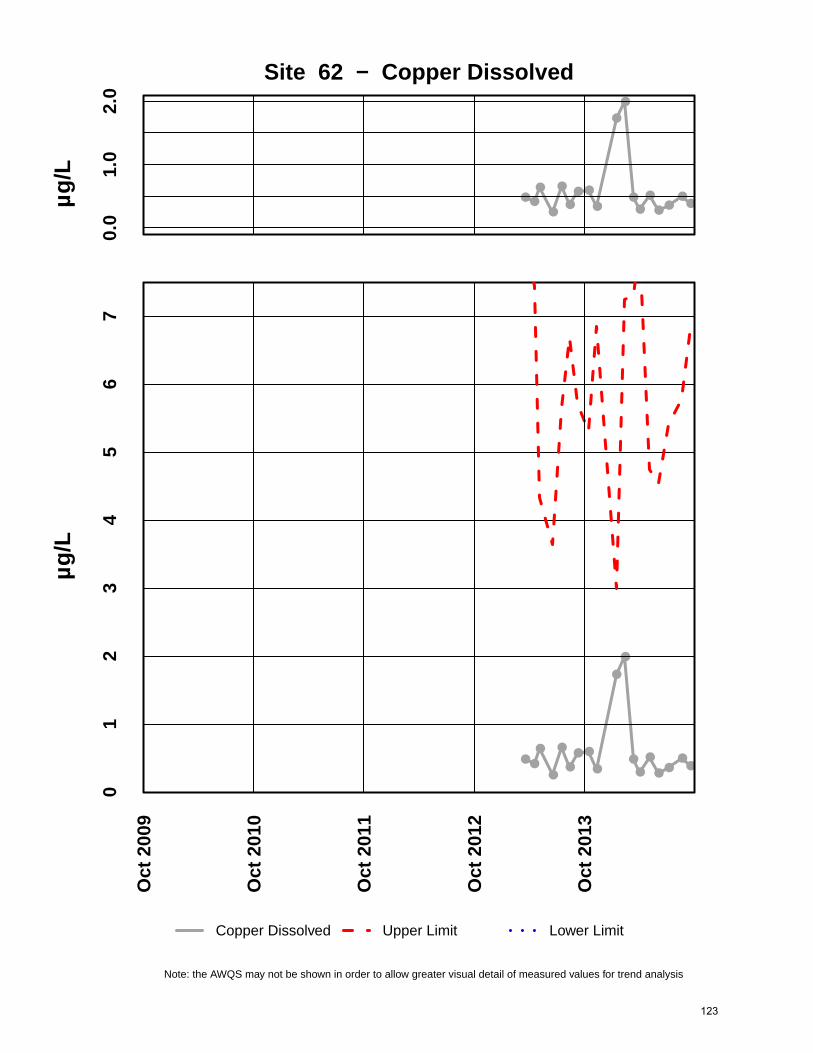
●●●
●
●
●●●
●
●
●
●●
●
●●●
●
0.0
1.0
2.0
Site 62 − Copper Dissolvedµg
/L
2009
2010
2011
2012
2013
●●
●
●
●
●●●
●
●
●
●●
●
●●●
●
01
23
45
67
µg/L
Oct
200
9
Oct
201
0
Oct
201
1
Oct
201
2
Oct
201
3
Copper Dissolved Upper Limit Lower Limit
Note: the AWQS may not be shown in order to allow greater visual detail of measured values for trend analysis
123
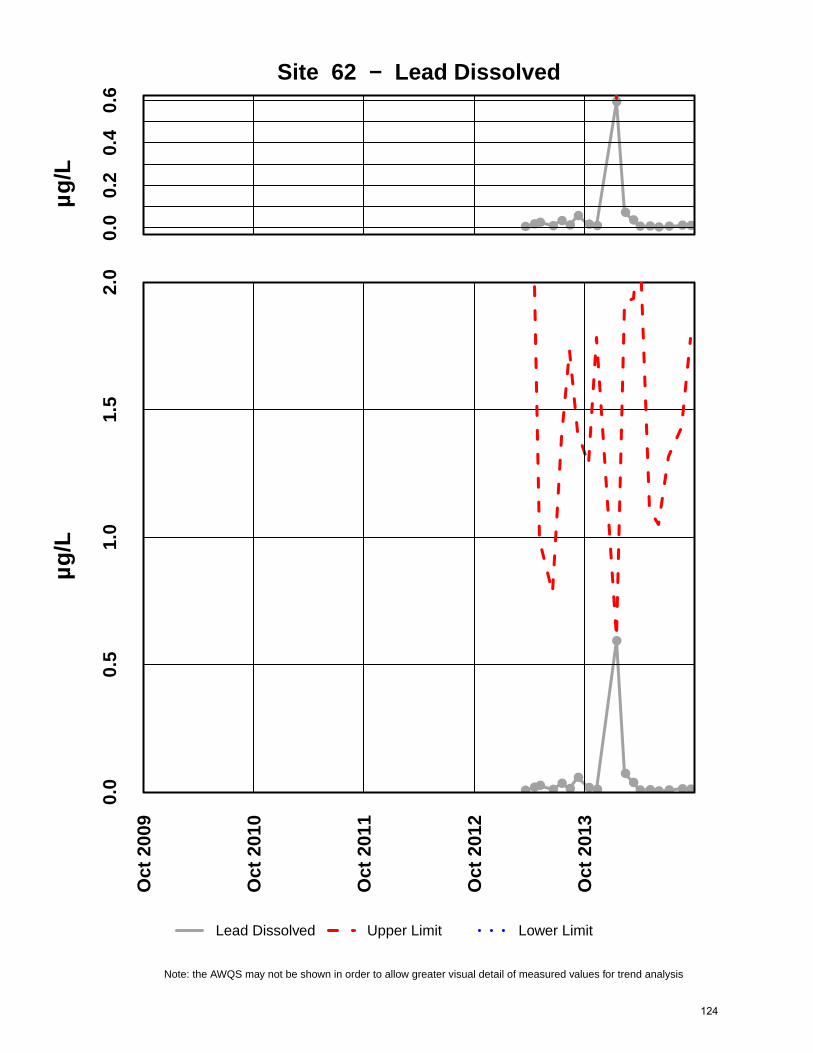
●●● ●●●●
●●
●
●●●●●● ●●
0.0
0.2
0.4
0.6
Site 62 − Lead Dissolvedµg
/L
2009
2010
2011
2012
2013
●●● ●●●
●●●
●
●●●●●● ●●
0.0
0.5
1.0
1.5
2.0
µg/L
Oct
200
9
Oct
201
0
Oct
201
1
Oct
201
2
Oct
201
3
Lead Dissolved Upper Limit Lower Limit
Note: the AWQS may not be shown in order to allow greater visual detail of measured values for trend analysis
124

●●
0.0
0.4
Site 62 − Nickel Dissolvedµg
/L
2009
2010
2011
2012
2013
● ●
02
46
810
1214
µg/L
Oct
200
9
Oct
201
0
Oct
201
1
Oct
201
2
Oct
201
3
Nickel Dissolved Upper Limit Lower Limit
Note: the AWQS may not be shown in order to allow greater visual detail of measured values for trend analysis
125

● ●
−1.0
0.0
1.0
Site 62 − Silver Dissolvedµg
/L
2009
2010
2011
2012
2013
● ●0.0
0.5
1.0
1.5
2.0
2.5
3.0
µg/L
Oct
200
9
Oct
201
0
Oct
201
1
Oct
201
2
Oct
201
3
Silver Dissolved Upper Limit Lower Limit
Note: the AWQS may not be shown in order to allow greater visual detail of measured values for trend analysis
126

●●●
●
●●
●●
●
●●
●
●
●
●●
●●
04
8
Site 62 − Zinc Dissolvedµg
/L
2009
2010
2011
2012
2013
●●●
●
●●
●●
●
●●●
●
●●●
●●
020
4060
80
µg/L
Oct
200
9
Oct
201
0
Oct
201
1
Oct
201
2
Oct
201
3
Zinc Dissolved Upper Limit Lower Limit
Note: the AWQS may not be shown in order to allow greater visual detail of measured values for trend analysis
127

●
●0.
01.
0
Site 62 − Selenium Dissolvedµg
/L
2009
2010
2011
2012
2013
●
●
01
23
45
µg/L
Oct
200
9
Oct
201
0
Oct
201
1
Oct
201
2
Oct
201
3
Selenium Dissolved Upper Limit Lower Limit
Note: the AWQS may not be shown in order to allow greater visual detail of measured values for trend analysis
128

●●
●
●
●
●●●
●
●
●●●●
●●
●
●
0.00
00.
003
Site 62 − Mercury Dissolvedµg
/L
2009
2010
2011
2012
2013
●●
●
●
●
●
●●
●
●
●●●
●
●●
●
●
0.00
00.
002
0.00
40.
006
0.00
80.
010
0.01
2
µg/L
Oct
200
9
Oct
201
0
Oct
201
1
Oct
201
2
Oct
201
3
Mercury Dissolved Upper Limit Lower Limit
Note: the AWQS may not be shown in order to allow greater visual detail of measured values for trend analysis
129

●
●
●
●
●
●●
●
●●
●
●
●
●
●
●
●
●
●
●
●
●
●
●
●●
● ●
●
●
●●
●●
●
●●
●
●
●●
●
●
●
●●
● ●
●
●
●
●
●
●
●
●
●
●
●
●
100
150
200
Site 54 vs. Site 62 − Conductiivty
Oct
200
8
Oct
200
9
Oct
201
0
Oct
201
1
Oct
201
2
● Upgradient Site 54 Downgradient Site 62
130

●
●●
●
●
●
●●
●
●●
●
●
●
●
●
●
●
●
●
●●●
●
●
●
●
●
●
●●
●
●
●
●
●
●
●
●
●
●
●
●
●
●●
●
●
●
●
● ●
●
●
●
●
●
●●
●
6.0
6.5
7.0
7.5
8.0
8.5
Site 54 vs. Site 62 − pH
Oct
200
8
Oct
200
9
Oct
201
0
Oct
201
1
Oct
201
2
● Upgradient Site 54 Downgradient Site 62
131
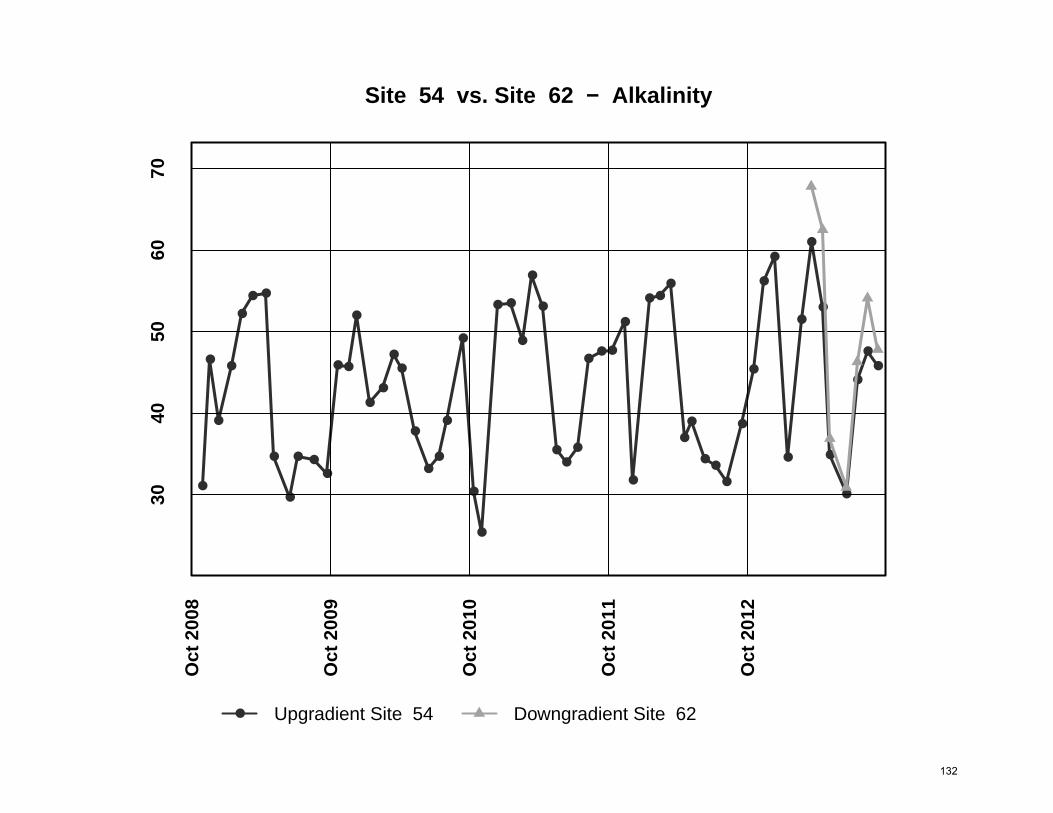
●
●
●
●
●
● ●
●
●
● ●●
●●
●
●
●
●●
●
●●
●
●
●
●
● ●
●
●
●
●●
●
●●●
●
●
●●●
●
●
●●
●
●
●
●
●
●
●
●
●
●
●
●
●
●
3040
5060
70
Site 54 vs. Site 62 − Alkalinity
Oct
200
8
Oct
200
9
Oct
201
0
Oct
201
1
Oct
201
2
● Upgradient Site 54 Downgradient Site 62
132

●
●
●
●
●
●●
●
●
●
●
●
●
●
●
●
●
●●
●
●●
●
●
●●
●
●
●
●
●
●
●●
●
●
●
●
●
●
●●
●
●
●●●
●
●
●
●
●
●
●
●
●
●
●
●
●
510
1520
25
Site 54 vs. Site 62 − Sulfate
Oct
200
8
Oct
200
9
Oct
201
0
Oct
201
1
Oct
201
2
● Upgradient Site 54 Downgradient Site 62
133

●
●
●
●●
●
●
●
●
●
●
●
●
●
●
●
●
●
●
●
●●
●
●
●
●
●●
●
●
●
●●●
●
●●
●
●
●
●
●
●
●
●●
●
● ●
●
●
●
●
●●
●
●
●
●
●
24
68
1012
14
Site 54 vs. Site 62 − Zinc
Oct
200
8
Oct
200
9
Oct
201
0
Oct
201
1
Oct
201
2
● Upgradient Site 54 Downgradient Site 62
134

Variable:X Y
Site #54 #62Year WY2014 WY2014 D |D| Rank
Oct 112.0 116.0 -4.0 4.0 -2Nov 147.0 156.0 -9.0 9.0 -6.5Dec 154.0Jan 56.0 63.0 -7.0 7.0 -4.5Feb 160.0 174.0 -14.0 14.0 -10Mar 163.0 173.0 -10.0 10.0 -9Apr 191.0 210.0 -19.0 19.0 -11May 99.0 106.0 -7.0 7.0 -4.5Jun 97.0 100.0 -3.0 3.0 -1Jul 116.0 122.0 -6.0 6.0 -3Aug 121.0 130.0 -9.0 9.0 -6.5Sep 136.8 146.7 -9.9 9.9 -8
Median 128.9 130.0 -9.0 9.0
n m N= 1111 11 SR= -66
a W+=0.05 0
W'a,n p-test13 0.000
Wilcoxon-signed-ranks test
Exact Form
Differences
Specific Conductance, Field (µS/cm)
H0 median [D]=0 REJECT
H1 median [D]<0 ACCEPT
135

Variable:X Y
Site #54 #62Year WY2014 WY2014 D |D| Rank
Oct 7.79 7.77 0.02 0.02 1Nov 7.85 7.76 0.09 0.09 4Dec 7.80Jan 7.38 7.02 0.36 0.36 10Feb 7.66 7.33 0.33 0.33 9Mar 7.61 7.48 0.13 0.13 5Apr 7.66 7.42 0.24 0.24 7May 7.60 7.37 0.23 0.23 6Jun 7.66 6.82 0.84 0.84 11Jul 7.88 7.81 0.07 0.07 2Aug 7.84 7.55 0.29 0.29 8Sep 8.14 8.06 0.08 0.08 3
Median 7.73 7.48 0.23 0.23
n m N= 1111 11 SR= 66
a W+=0.05 0
W'a,n p-test13 0.000
Wilcoxon-signed-ranks test
Exact Form
Differences
pH, Field, Standard Units
H0 median [D]=0 REJECT
H1 median [D]>0 ACCEPT
136

Variable:X Y
Site #54 #62Year WY2014 WY2014 D |D| Rank
Oct 40.4 42.0 -1.6 1.6 -2Nov 51.5 46.0 5.5 5.5 9Dec 53.6Jan 21.7 23.9 -2.2 2.2 -4.5Feb 53.1 59.2 -6.1 6.1 -10Mar 53.7 60.2 -6.5 6.5 -11Apr 58.1 62.2 -4.1 4.1 -8.00May 36.5 38.7 -2.2 2.2 -4.5Jun 36.0 38.0 -2.0 2.0 -3Jul 41.6 43.1 -1.5 1.5 -1Aug 44.5 47.8 -3.3 3.3 -6.00Sep 50.9 54.7 -3.8 3.8 -7
Median 47.7 46.0 -2.2 3.3
n m N= 1111 11 SR= -48
a W+=0.05 9.00
W'a,n p-test13 0.016
Wilcoxon-signed-ranks test
Exact Form
Differences
Total Alk, (mg/l)
H0 median [D]=0 REJECT
H1 median [D]>0 ACCEPT
137

Variable:X Y
Site #54 #62Year WY2014 WY2014 D |D| Rank
Oct 10.7 11.0 -0.3 0.3 -3Nov 18.1 18.4 -0.3 0.3 -2Dec 20.2Jan 5.3 6.7 -1.4 1.4 -10Feb 21.7 22.6 -0.9 0.9 -8Mar 24.7 24.3 0.4 0.4 4Apr 25.8 27.6 -1.8 1.8 -11May 9.2 10.0 -0.8 0.8 -7Jun 9.5 9.5 -0.1 0.1 -1Jul 12.2 12.7 -0.5 0.5 -5Aug 11.5 12.2 -0.7 0.7 -6Sep 15.7 16.8 -1.1 1.1 -9
Median 14.0 12.7 -0.7 0.7
n m N= 1111 11 SR= -58
a W+=0.05 4
W'a,n p-test13 0.003
Wilcoxon-signed-ranks test
Exact Form
Differences
Sulfate, Total (mg/l)
H0 median [D]=0 REJECT
H1 median [D]<0 ACCEPT
138

Variable:X Y
Site #54 #62Year WY2014 WY2014 D |D| Rank
Oct 5.92 5.82 0.10 0.10 3Nov 7.12 6.75 0.37 0.37 8Dec 6.58Jan 10.20 11.10 -0.90 0.90 -10Feb 8.68 9.85 -1.17 1.17 -11Mar 8.77 8.97 -0.20 0.20 -5Apr 6.73 7.11 -0.38 0.38 -9May 4.62 4.47 0.15 0.15 4Jun 3.25 3.16 0.09 0.09 2Jul 3.45 3.46 -0.01 0.01 -1Aug 4.86 5.22 -0.36 0.36 -7Sep 4.99 5.32 -0.33 0.33 -6
Median 6.25 5.82 -0.20 0.33
n m N= 1111 11 SR= -32
a W+=0.05 17
W'a,n p-test13 0.087
Wilcoxon-signed-ranks test
Exact Form
Differences
Zinc, Dissolved (ug/l)
H0 median [D]=0 ACCEPTH1 median [D]<0
139

INTERPRETIVE REPORT SITE 61
Sampling at this site was initiated during the spring of Water Year 2013. This site was added to the FWMP at the request of the state and federal regulators. Site 61 is located in a floodplain of Greens Creek, approximately 250 feet down gradient of D Pond. The sampling location is at just past the confluence of two drainages, one of which originates from the north and the other from the east. Sampling began in May 2013 and will occur on quarterly basis The data collected during the current water year are listed in the following “Table of Results for Water Year 2014” report. The table includes all the required FWMP analyte data (field and laboratory) collected for the current water year and a series of flags keyed to the summary report “Qualified Data by QA Reviewer”. The QA report lists any associated data limitations found during the monthly QA reviews of laboratory data for this site. Median values for all analytes have been calculated and are shown in the right-most column of the table of results. Any value reported as less than MDL has been replaced with a value of ½ MDL for the purpose of median calculation. All data collected at this site for the past year is included in the report. As shown in the table below, there were no data outliers.
Sample Date Parameter Value Qualifier Notes No outliers have been identified by HGCMC for the period of October 2012 through September 2014.
The data for Water Year 2014 have been compared to the strictest fresh water quality criterion for each applicable analyte. No results exceeding these criteria have been identified as listed in the table below.
As a result of the monitoring and reporting for Water Year 2013, HGCMC increased the sample frequency to monthly at for Site 62. The first sample collected at Site 62 (6 May 2013) was in exceedance for cadmium, mercury, selenium, and zinc. Since that sampling there have been no other water quality exceedances. HGCMC plans to return to sampling Site 62 on a quarterly basis after the May 2015 sampling event. X-Y plots have been generated to graphically present the data for each of the analytes requested in the Statistical Information Goals for this site. Because of the limited amount of data, visual trend analysis and statistical analysis of the data was not performed.
Lower Upper
LimitsHardness
No exceedances have been identified by HGCMC for the period of October 2013 through September 2014.
Table of Exceedance for Water Year 2014
Sample Date Parameter Value
140

Sample Date/Parameter Oct 2013 Nov 2013 Dec 2013 Jan 2014 Feb 2014 Mar 2014 Apr 2014 May 2014 Jun 2014 Jul 2014 Aug 2014 Sep 2014 MedianWater Temp (°C) 1.2 2.5 6.5 6.5 8.7 8.2 7.3 6.5Conductivity-Field(µmho) 156 386 516 452 511 524 516 511.0Conductivity-Lab (µmho) 267 370 506 448 515 502 478 478pH Lab (standard units) 7.67 7.44 7.38 7.59 7.55 7.44 7.41 7.44pH Field (standard units) 7.8 7.62 7.49 7.18 7.51 7.53 7.77 7.53Total Alkalinity (mg/L) 116 115 116 117 122 115 124 116.0Total Sulfate (mg/L) 49.7 64.6 118 89.9 110 120 102 102.0Hardness (mg/L) 171 178 251 218 248 258 246 246.0Dissolved As (ug/L) 0.212 0.255 0.191 0.225 0.249 0.23 0.254 0.230Dissolved Ba (ug/L) 40.9 49.2 52.2 54.7 49.9 49.9Dissolved Cd (ug/L) 0.304 0.286 0.294 0.221 0.258 0.369 0.298 0.2940Dissolved Cr (ug/L) 2.03 0.774 0.476 1.19 1.67 1.190Dissolved Cu (ug/L) 0.195 0.343 0.698 0.528 0.539 0.308 0.26 0.343Dissolved Pb (ug/L) 0.0486 0.0308 0.022 0.0113 0.0137 0.01 0.0119 0.0137Dissolved Ni (ug/L) 1.87 2.16 2.53 3.43 3.33 2.530Dissolved Ag (ug/L) 0.002 0.002 0.002 0.007 0.002 0.002Dissolved Zn (ug/L) 85.9 63.9 65.5 48.9 57.4 118 78.4 65.50Dissolved Se (ug/L) 1.51 1.77 1.25 1.52 1.27 1.510Dissolved Hg (ug/L) 0.000114 0.000203 0.000261 0.00029 0.000209 0.000188 0.000198 0.000203
For individual sample/analyte qualifier descriptions see "Qualified Data by QA Reviewer" table.Values reported as less than MDL are replaced by 1/2 MDL for median calculation purposes.Shaded data has been qualified as an outlier by HGCMC and removed from any further analysis and is not included into the calculation of the median
Table of Results for Water Year 2014
Site 061FMS - 'Greens Creek Floodplain'
141

Date Range: 10/01/2013 to 09/30/2014
Site No. Sample Date Sample Time Parameter Value Qualifier Reason for Qualifier
Qualified Data by QA Reviewer
061FMS 11/11/2013 12:00 PM pH 7.78 J Hold Time Violation
061FMS 2/12/2014 12:00 PM Diss. Cu-ICP/MS 0.34 J LCS Recovery
Diss. Hg-CVAF 0.000203 J Below Quantitative Range
Sulfate 64.6 J Sample Receipt Temperature
061FMS 5/5/2014 12:00 PM Diss. Hg-CVAF 0.000261 J Below Quantitative Range
061FMS 6/3/2014 12:00 PM Diss. Hg-CVAF 0.00029 J Below Quantitative Range
061FMS 7/7/2014 12:00 PM Diss. Hg-CVAF 0.000209 J Below Quantitative Range
Sulfate 110 J Sample Receipt Temperature
061FMS 8/20/2014 12:00 PM Diss. Ag-ICP/MS 0.00737 U Field Blank Contamination
Diss. Cu-ICP/MS 0.3 U Field Blank Contamination
Diss. Hg-CVAF 0.000188 J Below Quantitative Range
061FMS 9/17/2014 12:00 PM Diss. Hg-CVAF 0.000198 J Below Quantitative Range
142

●
●
●
●
●
●●
●●
●0
24
68
Site 61 − Water Temperature°C
2009
2010
2011
2012
2013
●
●
●
●
●
●●
●●
●
05
1015
20
°C
Oct
200
9
Oct
201
0
Oct
201
1
Oct
201
2
Oct
201
3
Water Temperature Upper Limit Lower Limit
Note: the AWQS may not be shown in order to allow greater visual detail of measured values for trend analysis
143

●
●●
●
●●●
● ●●
020
050
0
Site 61 − Conductivity LaboratoryµS
/cm
2009
2010
2011
2012
2013
●
●
●
●
●
●
●
●
●
050
100
150
200
250
300
350
µS/c
m
Oct
200
9
Oct
201
0
Oct
201
1
Oct
201
2
Oct
201
3
Conductivity Laboratory Upper Limit Lower Limit
Note: the AWQS may not be shown in order to allow greater visual detail of measured values for trend analysis
144

●
●
●
●
●●
●● ●●
020
050
0
Site 61 − Conductivity FieldµS
/cm
2009
2010
2011
2012
2013●
●
●
●
●
●
●●
050
100
150
200
250
300
350
µS/c
m
Oct
200
9
Oct
201
0
Oct
201
1
Oct
201
2
Oct
201
3
Conductivity Field Upper Limit Lower Limit
Note: the AWQS may not be shown in order to allow greater visual detail of measured values for trend analysis
145

●● ●
●●●
●●●●
6.5
7.5
Site 61 − pH Laboratorysu
2009
2010
2011
2012
2013
●
● ●
●
●●
●●●●
56
78
910
su
Oct
200
9
Oct
201
0
Oct
201
1
Oct
201
2
Oct
201
3
pH Laboratory Upper Limit Lower Limit
Note: the AWQS may not be shown in order to allow greater visual detail of measured values for trend analysis
146

●
● ●●
●●
●
● ●
●6.
57.
5
Site 61 − pH Fieldsu
2009
2010
2011
2012
2013
●
● ●
●
●●
●
● ●
●
56
78
910
su
Oct
200
9
Oct
201
0
Oct
201
1
Oct
201
2
Oct
201
3
pH Field Upper Limit Lower Limit
Note: the AWQS may not be shown in order to allow greater visual detail of measured values for trend analysis
147

●
●● ● ●
●●●
●●
2060
100
Site 61 − Alkalinitym
g/L
2009
2010
2011
2012
2013
●
●
● ●
●
●●
●
●
●
020
4060
8010
012
014
0
mg/
L
Oct
200
9
Oct
201
0
Oct
201
1
Oct
201
2
Oct
201
3
Alkalinity Upper Limit Lower Limit
Note: the AWQS may not be shown in order to allow greater visual detail of measured values for trend analysis
148

●
●
●
●
●●
●●
●●
010
020
0
Site 61 − Sulfate Totalm
g/L
2009
2010
2011
2012
2013
●
●
●
010
2030
4050
mg/
L
Oct
200
9
Oct
201
0
Oct
201
1
Oct
201
2
Oct
201
3
Sulfate Total Upper Limit Lower Limit
Note: the AWQS may not be shown in order to allow greater visual detail of measured values for trend analysis
149

●
● ● ●
●●●
● ●●0
100
250
Site 61 − Hardnessm
g/L
2009
2010
2011
2012
2013
●●
●
●
020
4060
8010
012
014
0
mg/
L
Oct
200
9
Oct
201
0
Oct
201
1
Oct
201
2
Oct
201
3
Hardness Upper Limit Lower Limit
Note: the AWQS may not be shown in order to allow greater visual detail of measured values for trend analysis
150

●
●●
●
●●
●●
●●
0.00
0.15
Site 61 − Arsenic Dissolvedµg
/L
2009
2010
2011
2012
2013
● ● ● ●●●●● ●●
01
23
45
µg/L
Oct
200
9
Oct
201
0
Oct
201
1
Oct
201
2
Oct
201
3
Arsenic Dissolved Upper Limit Lower Limit
Note: the AWQS may not be shown in order to allow greater visual detail of measured values for trend analysis
151

●
●
●●● ●
●0
2040
60
Site 61 − Barium Dissolvedµg
/L
2009
2010
2011
2012
2013
●
●
●●
●
●
●
010
2030
4050
6070
µg/L
Oct
200
9
Oct
201
0
Oct
201
1
Oct
201
2
Oct
201
3
Barium Dissolved Upper Limit Lower Limit
Note: the AWQS may not be shown in order to allow greater visual detail of measured values for trend analysis
152

●
● ● ● ●●●● ●●
0.0
1.0
2.0
Site 61 − Cadmium Dissolvedµg
/L
2009
2010
2011
2012
2013
●
●
●
●
●
●
●
●
●
0.00
0.05
0.10
0.15
0.20
0.25
µg/L
Oct
200
9
Oct
201
0
Oct
201
1
Oct
201
2
Oct
201
3
Cadmium Dissolved Upper Limit Lower Limit
Note: the AWQS may not be shown in order to allow greater visual detail of measured values for trend analysis
153

●
● ●
●
●
●
●0.
01.
02.
0
Site 61 − Chromium Dissolvedµg
/L
2009
2010
2011
2012
2013
●
●●
●
●
●
●
01
23
45
µg/L
Oct
200
9
Oct
201
0
Oct
201
1
Oct
201
2
Oct
201
3
Chromium Dissolved Upper Limit Lower Limit
Note: the AWQS may not be shown in order to allow greater visual detail of measured values for trend analysis
154

●
● ●● ●
●●●
●●
0.0
1.5
3.0
Site 61 − Copper Dissolvedµg
/L
2009
2010
2011
2012
2013
●
● ●● ●
●●●
●●
01
23
45
67
µg/L
Oct
200
9
Oct
201
0
Oct
201
1
Oct
201
2
Oct
201
3
Copper Dissolved Upper Limit Lower Limit
Note: the AWQS may not be shown in order to allow greater visual detail of measured values for trend analysis
155

●
● ● ● ●●●● ●●0.0
0.5
1.0
1.5
Site 61 − Lead Dissolvedµg
/L
2009
2010
2011
2012
2013
●
●● ● ●●●● ●●
0.0
0.5
1.0
1.5
2.0
µg/L
Oct
200
9
Oct
201
0
Oct
201
1
Oct
201
2
Oct
201
3
Lead Dissolved Upper Limit Lower Limit
Note: the AWQS may not be shown in order to allow greater visual detail of measured values for trend analysis
156

●
● ●● ●●●
04
8
Site 61 − Nickel Dissolvedµg
/L
2009
2010
2011
2012
2013
●
●●●
●
●●
02
46
810
1214
µg/L
Oct
200
9
Oct
201
0
Oct
201
1
Oct
201
2
Oct
201
3
Nickel Dissolved Upper Limit Lower Limit
Note: the AWQS may not be shown in order to allow greater visual detail of measured values for trend analysis
157

●
● ●● ● ●●02
46
8
Site 61 − Silver Dissolvedµg
/L
2009
2010
2011
2012
2013
● ●● ● ●●0.0
0.5
1.0
1.5
2.0
2.5
3.0
µg/L
Oct
200
9
Oct
201
0
Oct
201
1
Oct
201
2
Oct
201
3
Silver Dissolved Upper Limit Lower Limit
Note: the AWQS may not be shown in order to allow greater visual detail of measured values for trend analysis
158

●
●●
● ●●●●
●●
020
040
0
Site 61 − Zinc Dissolvedµg
/L
2009
2010
2011
2012
2013
●
●
● ●●
●
●
●
●
020
4060
80
µg/L
Oct
200
9
Oct
201
0
Oct
201
1
Oct
201
2
Oct
201
3
Zinc Dissolved Upper Limit Lower Limit
Note: the AWQS may not be shown in order to allow greater visual detail of measured values for trend analysis
159

●
● ●● ● ●●05
15
Site 61 − Selenium Dissolvedµg
/L
2009
2010
2011
2012
2013
●
●
●
●
●
●
01
23
45
µg/L
Oct
200
9
Oct
201
0
Oct
201
1
Oct
201
2
Oct
201
3
Selenium Dissolved Upper Limit Lower Limit
Note: the AWQS may not be shown in order to allow greater visual detail of measured values for trend analysis
160

●
● ● ● ●●●● ●●
0.00
0.10
0.20
Site 61 − Mercury Dissolvedµg
/L
2009
2010
2011
2012
2013
● ● ●●●●● ●●
0.00
00.
002
0.00
40.
006
0.00
80.
010
0.01
2
µg/L
Oct
200
9
Oct
201
0
Oct
201
1
Oct
201
2
Oct
201
3
Mercury Dissolved Upper Limit Lower Limit
Note: the AWQS may not be shown in order to allow greater visual detail of measured values for trend analysis
161
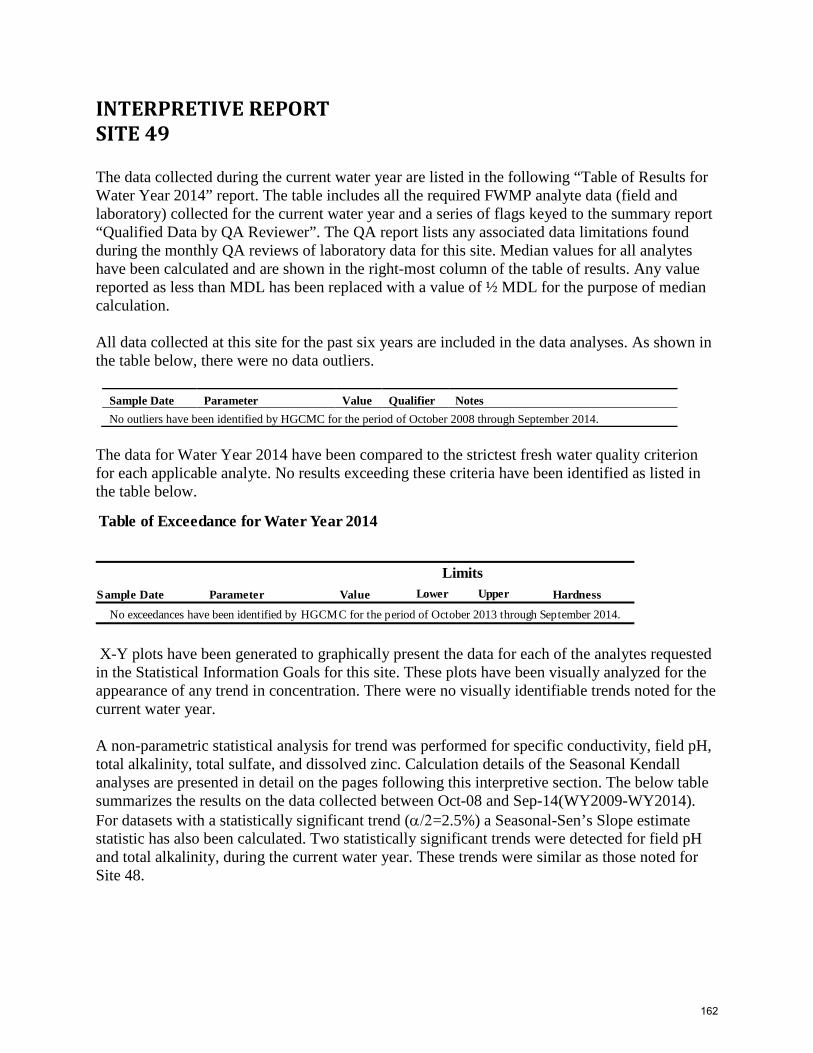
INTERPRETIVE REPORT SITE 49 The data collected during the current water year are listed in the following “Table of Results for Water Year 2014” report. The table includes all the required FWMP analyte data (field and laboratory) collected for the current water year and a series of flags keyed to the summary report “Qualified Data by QA Reviewer”. The QA report lists any associated data limitations found during the monthly QA reviews of laboratory data for this site. Median values for all analytes have been calculated and are shown in the right-most column of the table of results. Any value reported as less than MDL has been replaced with a value of ½ MDL for the purpose of median calculation. All data collected at this site for the past six years are included in the data analyses. As shown in the table below, there were no data outliers.
Sample Date Parameter Value Qualifier Notes No outliers have been identified by HGCMC for the period of October 2008 through September 2014.
The data for Water Year 2014 have been compared to the strictest fresh water quality criterion for each applicable analyte. No results exceeding these criteria have been identified as listed in the table below.
X-Y plots have been generated to graphically present the data for each of the analytes requested in the Statistical Information Goals for this site. These plots have been visually analyzed for the appearance of any trend in concentration. There were no visually identifiable trends noted for the current water year. A non-parametric statistical analysis for trend was performed for specific conductivity, field pH, total alkalinity, total sulfate, and dissolved zinc. Calculation details of the Seasonal Kendall analyses are presented in detail on the pages following this interpretive section. The below table summarizes the results on the data collected between Oct-08 and Sep-14(WY2009-WY2014). For datasets with a statistically significant trend (α/2=2.5%) a Seasonal-Sen’s Slope estimate statistic has also been calculated. Two statistically significant trends were detected for field pH and total alkalinity, during the current water year. These trends were similar as those noted for Site 48.
Lower Upper
No exceedances have been identified by HGCMC for the period of October 2013 through September 2014.
Table of Exceedance for Water Year 2014
Sample Date Parameter Value
LimitsHardness
162
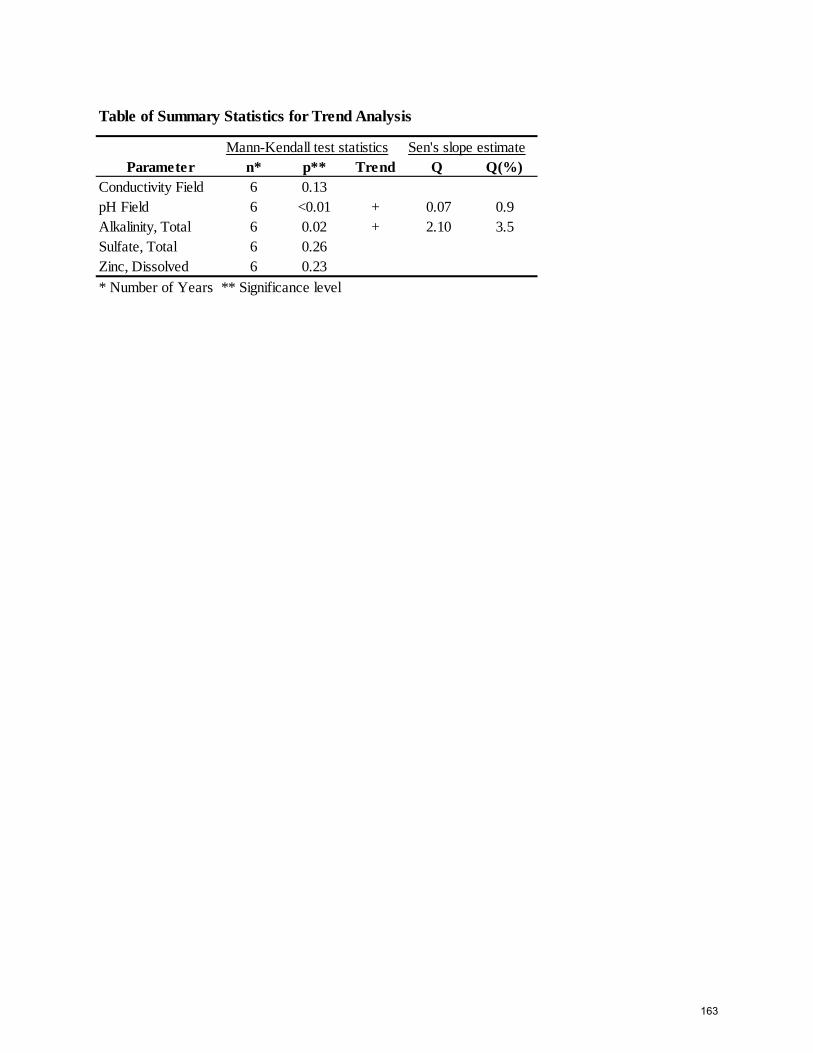
Mann-Kendall test statistics Sen's slope estimaten* p** Trend Q Q(%)
Conductivity Field 6 0.13pH Field 6 <0.01 + 0.07 0.9Alkalinity, Total 6 0.02 + 2.10 3.5Sulfate, Total 6 0.26Zinc, Dissolved 6 0.23* Number of Years ** Significance level
Table of Summary Statistics for Trend Analysis
Parameter
163

-10
-8
-6
-4
-2
0
2
4
6
8
10
0
20
40
60
80
100
120
140
160
180
200
CUSU
M
Spec
ific C
ondu
ctan
ce (µ
S/cm
)Figure 1. Observed Measurements for Specific Conductance, Dissolved Zinc, and Total Sulfate
from Site 49 Compared to the Shewhart-CUSUM Control Limits From Table 1
-6
-4
-2
0
2
4
6
0
1
2
3
4
5
6
7
8
9
10
Diss
olve
d Zi
nc (µ
g/L)
CUSU
M
-6
-3
0
3
6
0
6
12
18
24
Jan-
00
Jan-
01
Jan-
02
Jan-
03
Jan-
04
Jan-
05
Jan-
06
Jan-
07
Jan-
08
Jan-
09
Jan-
10
Jan-
11
Jan-
12
Jan-
13
Jan-
14
Tota
l Sul
fate
(µg/
L)
CUSU
M
Mean Analyte Baseline Limits CUSUM CUSUM
164

Sample Date/Parameter Oct 2013 Nov 2013 Dec 2013 Jan 2014 Feb 2014 Mar 2014 Apr 2014 May 2014 Jun 2014 Jul 2014 Aug 2014 Sep 2014 MedianWater Temp (°C) 1.4 0.0 4.6 9.9 3.0Conductivity-Field(µmho) 167 191 110 142 154.5Conductivity-Lab (µmho) 135 182 109 135 135pH Lab (standard units) 7.82 7.68 7.49 7.76 7.72pH Field (standard units) 8.03 7.92 7.72 8.02 7.97Total Alkalinity (mg/L) 67.5 77.5 43.9 58 62.8Total Sulfate (mg/L) 12.6 14.2 6.5 8.7 10.7Hardness (mg/L) 82.7 88.1 50.9 68 75.4Dissolved As (ug/L) 0.171 0.164 0.169 0.197 0.170Dissolved Ba (ug/L) 10.1 11.9 11.0Dissolved Cd (ug/L) 0.0292 0.0292 0.0221 0.0329 0.0292Dissolved Cr (ug/L) 0.692 1.17 0.931Dissolved Cu (ug/L) 0.371 0.334 0.46 0.598 0.416Dissolved Pb (ug/L) 0.0056 0.0096 0.0059 0.0032 0.0058Dissolved Ni (ug/L) 0.928 0.952 0.940Dissolved Ag (ug/L) 0.002 0.002 0.002Dissolved Zn (ug/L) 2.03 2.34 1.71 2.45 2.19Dissolved Se (ug/L) 0.772 0.783 0.778Dissolved Hg (ug/L) 0.000827 0.000695 0.00131 0.00177 0.001069
For individual sample/analyte qualifier descriptions see "Qualified Data by QA Reviewer" table.Values reported as less than MDL are replaced by 1/2 MDL for median calculation purposes.Shaded data has been qualified as an outlier by HGCMC and removed from any further analysis and is not included into the calculation of the median
Table of Results for Water Year 2014
Site 049FMS - 'Upper Bruin Creek'
165

Date Range: 10/01/2013 to 09/30/2014
Site No. Sample Date Sample Time Parameter Value Qualifier Reason for Qualifier
Qualified Data by QA Reviewer
049FMS 11/11/2013 12:00 PM Diss. Pb-ICP/MS 0.00559 J Below Quantitative Range
pH 7.82 J Hold Time Violation
049FMS 2/12/2014 12:00 PM Diss. Cu-ICP/MS 0.33 J LCS Recovery
Sulfate 14.2 J Sample Receipt Temperature
049FMS 5/5/2014 12:00 PM Diss. Pb-ICP/MS 0.00586 J Below Quantitative Range
049FMS 8/20/2014 12:00 PM Diss. Pb-ICP/MS 0.00317 J Below Quantitative Range
166

●
●●
●
●
●
●
●
●
●
● ●
●
●
● ●●
●
●
●
●
●0
48
12
Site 49 − Water Temperature°C
2009
2010
2011
2012
2013
●
●
●
●
●
●
●
●
●
●
● ●
●
●
● ●
●
●
●
●
●
●
05
1015
20
°C
Oct
200
9
Oct
201
0
Oct
201
1
Oct
201
2
Oct
201
3
Water Temperature Upper Limit Lower Limit
Note: the AWQS may not be shown in order to allow greater visual detail of measured values for trend analysis
167

●●● ●
●
●
●
●
●
● ●●
●
●
●●
●
●
●
●
●
●
050
150
Site 49 − Conductivity LaboratoryµS
/cm
2009
2010
2011
2012
2013
●●
● ●
●
●
●
●
●
●●
●
●
●
●
●
●
●
●
●
●
●
050
100
150
200
250
300
350
µS/c
m
Oct
200
9
Oct
201
0
Oct
201
1
Oct
201
2
Oct
201
3
Conductivity Laboratory Upper Limit Lower Limit
Note: the AWQS may not be shown in order to allow greater visual detail of measured values for trend analysis
168

●
●
● ●
●
●
●
●
●
●●
● ●●
● ●
●
●●
●
●
●
050
150
Site 49 − Conductivity FieldµS
/cm
2009
2010
2011
2012
2013
●
●
● ●
●
●
●
●
●
●
●●
●
●
● ●
●
●
●
●
●
●
050
100
150
200
250
300
350
µS/c
m
Oct
200
9
Oct
201
0
Oct
201
1
Oct
201
2
Oct
201
3
Conductivity Field Upper Limit Lower Limit
Note: the AWQS may not be shown in order to allow greater visual detail of measured values for trend analysis
169

●
●●
●
●●
●
●●
● ●
● ●
●
●●
● ●●
●●
●
6.0
7.0
8.0
Site 49 − pH Laboratorysu
2009
2010
2011
2012
2013
●
●
●
●
●
●
●
●●
●●
●●
●
●
●●
●●
●
●
●
56
78
910
su
Oct
200
9
Oct
201
0
Oct
201
1
Oct
201
2
Oct
201
3
pH Laboratory Upper Limit Lower Limit
Note: the AWQS may not be shown in order to allow greater visual detail of measured values for trend analysis
170

●
●● ●
●
●
●
●
●● ●
●● ● ●
● ●● ●
●●
●6.
57.
58.
5
Site 49 − pH Fieldsu
2009
2010
2011
2012
2013
●
●
● ●
●
●
●
●
●
●●
●
● ● ●● ●
●●
●
●
●
56
78
910
su
Oct
200
9
Oct
201
0
Oct
201
1
Oct
201
2
Oct
201
3
pH Field Upper Limit Lower Limit
Note: the AWQS may not be shown in order to allow greater visual detail of measured values for trend analysis
171

●●
●
●
●
●
●
●
●
● ● ● ●
●
●
●
●
●●
●
●
●
2040
6080
Site 49 − Alkalinitym
g/L
2009
2010
2011
2012
2013
●●
●
●
●
●
●
●
●
● ● ●●
●
●
●
●
●
●
●
●
●
020
4060
8010
012
014
0
mg/
L
Oct
200
9
Oct
201
0
Oct
201
1
Oct
201
2
Oct
201
3
Alkalinity Upper Limit Lower Limit
Note: the AWQS may not be shown in order to allow greater visual detail of measured values for trend analysis
172

●●●
●
●
●
●
●
●
● ●
●
●●
●
●
●
●
●●
●
●
05
1015
Site 49 − Sulfate Totalm
g/L
2009
2010
2011
2012
2013
●
●●
●
●
●
●
●
●
● ●
●
●
●
●
●
●
●
●
●
●
●
010
2030
4050
mg/
L
Oct
200
9
Oct
201
0
Oct
201
1
Oct
201
2
Oct
201
3
Sulfate Total Upper Limit Lower Limit
Note: the AWQS may not be shown in order to allow greater visual detail of measured values for trend analysis
173

●●●
●
●
●
●
●
●
● ●●
●●
● ●
●
● ●●
●
●
040
80
Site 49 − Hardnessm
g/L
2009
2010
2011
2012
2013
●●
●
●
●
●
●
●
●
●●
●
●
●
● ●
●
●●
●
●
●
020
4060
8010
012
014
0
mg/
L
Oct
200
9
Oct
201
0
Oct
201
1
Oct
201
2
Oct
201
3
Hardness Upper Limit Lower Limit
Note: the AWQS may not be shown in order to allow greater visual detail of measured values for trend analysis
174

●
●●
●●
●
●●
●
●
●●
●● ●
● ●
●
● ● ●
●0.
000.
100.
20
Site 49 − Arsenic Dissolvedµg
/L
2009
2010
2011
2012
2013
●●● ● ●● ● ● ● ● ● ● ● ● ● ● ●
● ● ● ● ●
01
23
45
µg/L
Oct
200
9
Oct
201
0
Oct
201
1
Oct
201
2
Oct
201
3
Arsenic Dissolved Upper Limit Lower Limit
Note: the AWQS may not be shown in order to allow greater visual detail of measured values for trend analysis
175

●●
●
●●
● ●●
●
●0
48
12
Site 49 − Barium Dissolvedµg
/L
2009
2010
2011
2012
2013
● ●
●
● ●● ●
● ●●
010
2030
4050
6070
µg/L
Oct
200
9
Oct
201
0
Oct
201
1
Oct
201
2
Oct
201
3
Barium Dissolved Upper Limit Lower Limit
Note: the AWQS may not be shown in order to allow greater visual detail of measured values for trend analysis
176

●●●
●●
●
●
●
●● ●
●
●● ●
●●
●● ●
●
●
0.00
0.02
0.04
Site 49 − Cadmium Dissolvedµg
/L
2009
2010
2011
2012
2013
●●●● ● ●
●
●● ● ●
●●
● ●●
●
● ● ●
●
●
0.00
0.05
0.10
0.15
0.20
0.25
µg/L
Oct
200
9
Oct
201
0
Oct
201
1
Oct
201
2
Oct
201
3
Cadmium Dissolved Upper Limit Lower Limit
Note: the AWQS may not be shown in order to allow greater visual detail of measured values for trend analysis
177

●
●
●
●
●● ●
●●
●
0.0
1.0
2.0
Site 49 − Chromium Dissolvedµg
/L
2009
2010
2011
2012
2013
●
●
●
●
●● ●
●●
●
01
23
45
µg/L
Oct
200
9
Oct
201
0
Oct
201
1
Oct
201
2
Oct
201
3
Chromium Dissolved Upper Limit Lower Limit
Note: the AWQS may not be shown in order to allow greater visual detail of measured values for trend analysis
178

●●●●
●
●
●
● ●
● ● ● ●
●
● ● ● ●
● ●●
●
0.0
0.6
1.2
Site 49 − Copper Dissolvedµg
/L
2009
2010
2011
2012
2013
●●●●
●●
●
● ●● ● ● ●
●
● ● ● ●● ●
●●
01
23
45
67
µg/L
Oct
200
9
Oct
201
0
Oct
201
1
Oct
201
2
Oct
201
3
Copper Dissolved Upper Limit Lower Limit
Note: the AWQS may not be shown in order to allow greater visual detail of measured values for trend analysis
179

●●●
●
● ●
●
●●
● ●● ● ●
●
●
● ● ●●
● ●
0.00
0.04
0.08
Site 49 − Lead Dissolvedµg
/L
2009
2010
2011
2012
2013
●●●
●
● ●●
● ● ● ● ● ● ● ● ● ● ● ● ● ● ●0.0
0.5
1.0
1.5
2.0
µg/L
Oct
200
9
Oct
201
0
Oct
201
1
Oct
201
2
Oct
201
3
Lead Dissolved Upper Limit Lower Limit
Note: the AWQS may not be shown in order to allow greater visual detail of measured values for trend analysis
180

●●
● ●
●● ● ●
● ●
0.0
1.0
Site 49 − Nickel Dissolvedµg
/L
2009
2010
2011
2012
2013
●●
● ●●
● ● ●● ●
02
46
810
1214
µg/L
Oct
200
9
Oct
201
0
Oct
201
1
Oct
201
2
Oct
201
3
Nickel Dissolved Upper Limit Lower Limit
Note: the AWQS may not be shown in order to allow greater visual detail of measured values for trend analysis
181

● ● ● ● ● ● ● ● ● ●
−1.0
0.0
1.0
Site 49 − Silver Dissolvedµg
/L
2009
2010
2011
2012
2013
● ● ● ● ● ● ● ● ● ●0.0
0.5
1.0
1.5
2.0
2.5
3.0
µg/L
Oct
200
9
Oct
201
0
Oct
201
1
Oct
201
2
Oct
201
3
Silver Dissolved Upper Limit Lower Limit
Note: the AWQS may not be shown in order to allow greater visual detail of measured values for trend analysis
182

●●● ●● ●
●
● ● ●
●
●
● ●
● ●●
●
● ●●
●
02
46
8
Site 49 − Zinc Dissolvedµg
/L
2009
2010
2011
2012
2013
●●● ● ● ●
●
● ● ●●
●● ●
● ● ●
●
● ● ● ●
020
4060
80
µg/L
Oct
200
9
Oct
201
0
Oct
201
1
Oct
201
2
Oct
201
3
Zinc Dissolved Upper Limit Lower Limit
Note: the AWQS may not be shown in order to allow greater visual detail of measured values for trend analysis
183

●
●
●
●●
●
●
●● ●
0.0
0.6
1.2
Site 49 − Selenium Dissolvedµg
/L
2009
2010
2011
2012
2013
●
●
●
●
●●
●
●● ●
01
23
45
µg/L
Oct
200
9
Oct
201
0
Oct
201
1
Oct
201
2
Oct
201
3
Selenium Dissolved Upper Limit Lower Limit
Note: the AWQS may not be shown in order to allow greater visual detail of measured values for trend analysis
184

●●●
● ●●
●
●● ●
● ● ●
●
●●
●
●● ●
●●
0.00
00.
003
Site 49 − Mercury Dissolvedµg
/L
2009
2010
2011
2012
2013
●●●
●●
●
●
●●
●
●●
●
●
●●
●
●● ●
●
●
0.00
00.
002
0.00
40.
006
0.00
80.
010
0.01
2
µg/L
Oct
200
9
Oct
201
0
Oct
201
1
Oct
201
2
Oct
201
3
Mercury Dissolved Upper Limit Lower Limit
Note: the AWQS may not be shown in order to allow greater visual detail of measured values for trend analysis
185

INTERPRETIVE REPORT SITE 46 The data collected during the current water year are listed in the following “Table of Results for Water Year 2014” report. The table includes all the required FWMP analyte data (field and laboratory) collected for the current water year and a series of flags keyed to the summary report “Qualified Data by QA Reviewer”. The QA report lists any associated data limitations found during the monthly QA reviews of laboratory data for this site. Median values for all analytes have been calculated and are shown in the right-most column of the table of results. Any value reported as less than MDL has been replaced with a value of ½ MDL for the purpose of median calculation. All data collected at this site for the past six years are included in the data analyses. As shown in the table below, there were no data outliers.
Sample Date Parameter Value Qualifier Notes No outliers have been identified by HGCMC for the period of October 2008 through September 2014.
The data for Water Year 2014 have been compared to the strictest fresh water quality criterion for each applicable analyte. No results exceeding these criteria have been identified as listed in the table below.
X-Y plots have been generated to graphically present the data for each of the analytes requested in the Statistical Information Goals for this site. These plots have been visually analyzed for the appearance of any trend in concentration. No visually obvious trends are apparent. A non-parametric statistical analysis for trend was performed for field conductivity, field pH, total alkalinity, total sulfate, and dissolved zinc. Calculation details of the Seasonal Kendall analyses are presented on the pages following this interpretive section. The following table summarizes the results on the data collected between Oct-08 and Sep-14(WY2009-WY2014). Datasets with a statistically significant trend (α/2=2.5%) a Seasonal-Sen’s Slope estimate statistic has also been calculated. There was one statistically significant trend detected for pH, during the current water year, which was similar in magnitude and direction as the trend noted for the upgradient background site.
Lower Upper
No exceedances have been identified by HGCMC for the period of October 2013 through September 2014.
Table of Exceedance for Water Year 2014
Sample Date Parameter Value
LimitsHardness
186
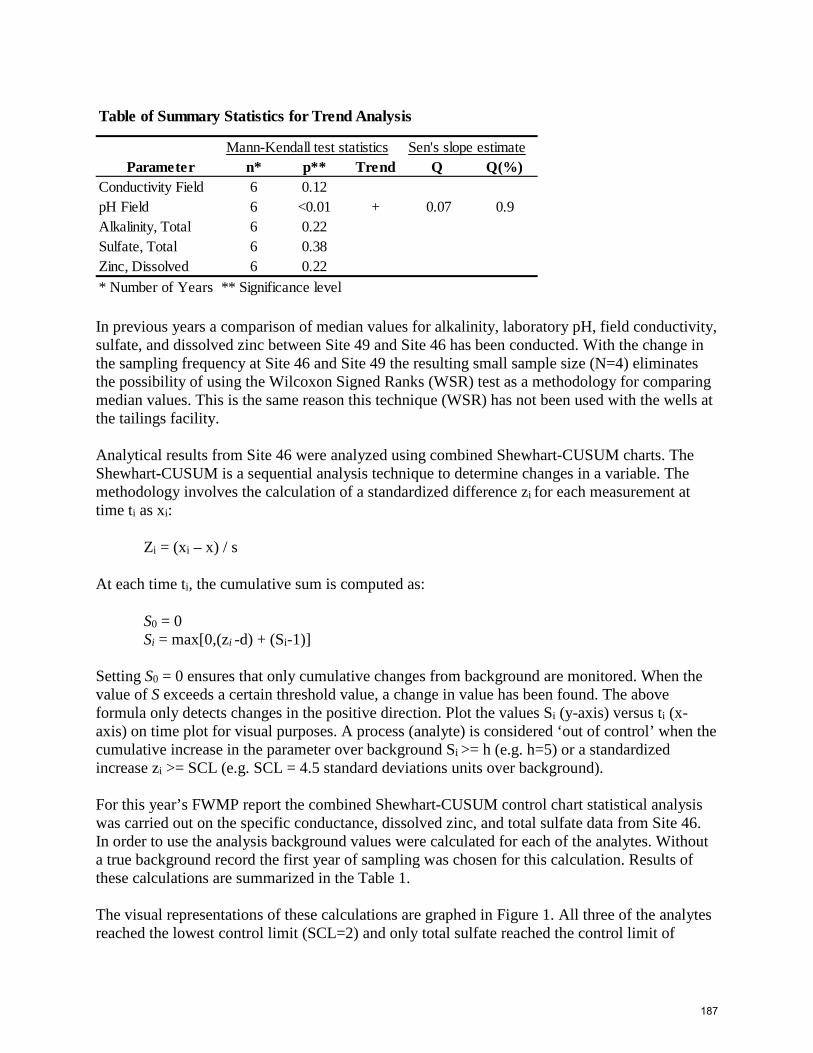
In previous years a comparison of median values for alkalinity, laboratory pH, field conductivity, sulfate, and dissolved zinc between Site 49 and Site 46 has been conducted. With the change in the sampling frequency at Site 46 and Site 49 the resulting small sample size (N=4) eliminates the possibility of using the Wilcoxon Signed Ranks (WSR) test as a methodology for comparing median values. This is the same reason this technique (WSR) has not been used with the wells at the tailings facility. Analytical results from Site 46 were analyzed using combined Shewhart-CUSUM charts. The Shewhart-CUSUM is a sequential analysis technique to determine changes in a variable. The methodology involves the calculation of a standardized difference zi for each measurement at time ti as xi:
Zi = (xi – x) / s
At each time ti, the cumulative sum is computed as:
S0 = 0 Si = max[0,(zi -d) + (Si-1)]
Setting S0 = 0 ensures that only cumulative changes from background are monitored. When the value of S exceeds a certain threshold value, a change in value has been found. The above formula only detects changes in the positive direction. Plot the values Si (y-axis) versus ti (x-axis) on time plot for visual purposes. A process (analyte) is considered ‘out of control’ when the cumulative increase in the parameter over background Si >= h (e.g. h=5) or a standardized increase zi >= SCL (e.g. SCL = 4.5 standard deviations units over background). For this year’s FWMP report the combined Shewhart-CUSUM control chart statistical analysis was carried out on the specific conductance, dissolved zinc, and total sulfate data from Site 46. In order to use the analysis background values were calculated for each of the analytes. Without a true background record the first year of sampling was chosen for this calculation. Results of these calculations are summarized in the Table 1. The visual representations of these calculations are graphed in Figure 1. All three of the analytes reached the lowest control limit (SCL=2) and only total sulfate reached the control limit of
Mann-Kendall test statistics Sen's slope estimaten* p** Trend Q Q(%)
Conductivity Field 6 0.12pH Field 6 <0.01 + 0.07 0.9Alkalinity, Total 6 0.22Sulfate, Total 6 0.38Zinc, Dissolved 6 0.22* Number of Years ** Significance level
Table of Summary Statistics for Trend Analysis
Parameter
187

SCL=4. Each of the sites were below the EPA recommend control limit of SCL=4.5. Values for the CUSUM statistic ranged from a low of 0, observed in each analysis to a high of 3.4 recorded for dissolved zinc. None of the analyses exceed the established limit of h=5. In order for a process to be considered ‘out of control’ both metrics (Shewhart & CUSUM) need to be ‘out of control’. With these analyses the only analyte that neared both these limits was total sulfate. Once a background value is established the proceeding years that are not ‘out of control’, can be used to recalculate the background values. It is suggested that these calculations be carried out every two years. In order to prevent the incorporation of a gradual trend into the background data, it is important to test for background trends on a routine basis. Currently, HGCMC is using the Mann-Kendall test for seasonal trends for trend analysis. Of the three analytes used, for the combined Shewhart-CUSUM control charts, none of them had a significant seasonal trend. Therefore, it should be possible to incorporate more of the measurements into the calculation of the baseline statistics. To use these charts an average value and standard deviation first needs to be calculated for the each analyte of interest. These could be calculated from the historical process data or the background data collected prior to disturbance. Tables 1 and 2 summarize the baseline statistics for Site 46, differing in the number of samples (N) used in the calculation. From previous FWMP reports it is known that Site 46 is similar in chemistry as the background Site 49. Furthermore, it then can be inferred that changes in chemistry at Site 46 are a result of natural variation and not from HGCMC activities in the area. Therefore Site 46 is an ideal dataset for testing the effects of incorporating a larger set of values into the baseline statistics. When comparing the baseline statistics for the two sample periods it is noted that the mean values are similar and the standard deviation increased for two of the three analytes. The increase in the standard deviation shows that with an increase in the number of samples the range also increased (greater variability). Also, the corollary decrease in standard deviation would mean a decreased range (less variability). The similarity in the mean values with a change in the standard deviation signifies that the additional values were equally distributed about the previous calculated mean. A longer baseline period would incorporate greater natural variation. Regardless of the length of the baseline period each analyte that goes out of control needs to be evaluated on an individual basis. Figures 1is the combined Shewhart-CUSUM charts for field conductivity, dissolved zinc, and total sulfate; using the baseline statistics from Tables 1.
188

Table 1. Specific Conductance, Dissolved Zinc, and Total Sulfate Baseline Periods, Summary Statistics and Various Control Limits
Site 46 Site 46 Site 46
Conductivity
(µS/cm) Diss. Zinc
(µg/L) Total Sulfate
(mg/L) Baseline Statistics Baseline Period 01/12/00-11/15/01 01/12/00-11/15/01 11/12/02-10/09/03 Number of Samples 19 19 9 Mean (x) 136.4 1.9 9.39 Standard Deviation 24.5 0.8 2.20 Shewhart-CUSUM Control Limits (SCL) Control Limit (mean x+ 2s) 185.3 3.5 13.8 Control Limit (mean x + 3s) 209.8 4.3 16.0 Control Limit (mean x + 4s) 234.3 5.2 18.2 Control Limit (mean x + 4.5s) 246.5 5.6 19.3 CUSUM Control Limits Cumulative increase – h 5 5 5
Table 1. Specific Conductance, Dissolved Zinc, and Total Sulfate Baseline Periods, Summary Statistics and Various Control Limits
Site 46 Site 46 Site 46
Conductivity
(µS/cm) Diss. Zinc
(µg/L) Total Sulfate (mg/L) Baseline Statistics
Baseline Period 12/1/00–12/14/05 12/1/00–12/14/05 11/12/02–12/14/05 Number of Samples 58 58 33 Mean (x) 135.5 2.3 10.0 Standard Deviation 22.9 1.6 2.86 Shewhart-CUSUM Control Limits (SCL) Control Limit (mean x+ 2s) 181.4 5.6 15.7 Control Limit (mean x + 3s) 204.4 7.3 18.6 Control Limit (mean x + 4s) 227.3 8.9 21.5 Control Limit (mean x + 4.5s) 238.8 9.7 22.9 CUSUM Control Limits Cumulative increase – h 5 5 5
189

From figure 1 it can be seen that specific conductance remained in control while dissolved zinc and total sulfate went of control multiple times and one time respectively. A value is out of control when it exceeds the CUSUM control limit (h) value of five. Also, based on the Shewhart-CUSUM control limit (SCL) for total sulfate the process was out of control twice when the total sulfate concentration exceeded 19.3 µg/L. It is important to remember that the corresponding up-gradient background site Site 49 exhibited the same variation in concentration, which is natural variation. If the CUSUM technique was being used during water year 2003 it would have been concluded that the dissolved zinc was going out of control and an evaluation of each out of control data point would have been undertaken. This evaluation would have involved an analysis of the background sites to establish whether this was occurring naturally. Furthermore, a larger suite of analytes would be analyzed to determine if the shift is in a single analyte or multiple analytes and whether the shift in analytes matches known signatures from the various mineralogies that HGCMC encounters. It is recommended that every couple years a revaluation of the baseline statistics is made. This will allow for the incorporation of data points that appeared out of control, but were a greater part of the variability. Figure 2 are the control charts after the data was recalculated using a greater baseline period. Notice that during the 2003 water year that dissolved zinc remained in control when the longer baseline dataset was used. With these charts it is noted that none of the analytes went out of control during the monitoring period. This supports the conclusion drawn in the previous FWMP reports that HGCMC activities in the Site23 / D Pile area are not having a measurable effect on Bruin Creek.
190

-10
-8
-6
-4
-2
0
2
4
6
8
10
0
20
40
60
80
100
120
140
160
180
200
CUSU
M
Spec
ific C
ondu
ctan
ce (µ
S/cm
)Figure 1. Observed Measurements for Specific Conductance, Dissolved Zinc, and Total Sulfate
from Site 46 Compared to the Shewhart-CUSUM Control Limits From Table 1
-6
-4
-2
0
2
4
6
0
2
4
6
8
10
12
Diss
olve
d Zi
nc (µ
g/L)
CUSU
M
-6
-3
0
3
6
0
6
12
18
24
Oct
-99
Oct
-00
Oct
-01
Oct
-02
Oct
-03
Oct
-04
Oct
-05
Oct
-06
Oct
-07
Oct
-08
Oct
-09
Oct
-10
Oct
-11
Oct
-12
Oct
-13
Tota
l Sul
fate
(µg/
L)
CUSU
M
Mean Analyte Baseline Limits CUSUM CUSUM
191

-10
-8
-6
-4
-2
0
2
4
6
8
10
0
20
40
60
80
100
120
140
160
180
200
CUSU
M
Spec
ific C
ondu
ctan
ce (µ
S/cm
)Figure 2. Observed Measurements for Specific Conductance, Dissolved Zinc, and Total Sulfate
from Site 46 Compared to the Shewhart-CUSUM Control Limits From Table 2
-6
-4
-2
0
2
4
6
0
2
4
6
8
10
12
Diss
olve
d Zi
nc (µ
g/L)
CUSU
M
-6
-3
0
3
6
0
6
12
18
24
Oct
-99
Oct
-00
Oct
-01
Oct
-02
Oct
-03
Oct
-04
Oct
-05
Oct
-06
Oct
-07
Oct
-08
Oct
-09
Oct
-10
Oct
-11
Oct
-12
Oct
-13
Tota
l Sul
fate
(µg/
L)
CUSU
M
Mean Analyte Baseline Limits CUSUM CUSUM
192

Sample Date/Parameter Oct 2013 Nov 2013 Dec 2013 Jan 2014 Feb 2014 Mar 2014 Apr 2014 May 2014 Jun 2014 Jul 2014 Aug 2014 Sep 2014 MedianWater Temp (°C) 1.1 3.8 9.3 3.8Conductivity-Field(µmho) 170 112 144 144.0Conductivity-Lab (µmho) 139 111 139 139pH Lab (standard units) 7.86 7.28 7.74 7.74pH Field (standard units) 8.05 7.89 8.06 8.05Total Alkalinity (mg/L) 67.9 44.4 58.4 58.4Total Sulfate (mg/L) 12.3 6.6 8.8 8.8Hardness (mg/L) 81.9 51.8 68.1 68.1Dissolved As (ug/L) 0.269 0.177 0.301 0.269Dissolved Ba (ug/L) 11.2 11.2Dissolved Cd (ug/L) 0.0237 0.0186 0.0304 0.0237Dissolved Cr (ug/L) 0.471 0.471Dissolved Cu (ug/L) 0.405 0.458 0.68 0.458Dissolved Pb (ug/L) 0.0091 0.0106 0.0127 0.0106Dissolved Ni (ug/L) 0.849 0.849Dissolved Ag (ug/L) 0.002 0.002Dissolved Zn (ug/L) 1.81 1.6 2.69 1.81Dissolved Se (ug/L) 0.729 0.729Dissolved Hg (ug/L) 0.00102 0.00132 0.00181 0.001320
For individual sample/analyte qualifier descriptions see "Qualified Data by QA Reviewer" table.Values reported as less than MDL are replaced by 1/2 MDL for median calculation purposes.Shaded data has been qualified as an outlier by HGCMC and removed from any further analysis and is not included into the calculation of the median
Table of Results for Water Year 2014
Site 046FMS - 'Lower Bruin Creek'
193

Date Range: 10/01/2013 to 09/30/2014
Site No. Sample Date Sample Time Parameter Value Qualifier Reason for Qualifier
Qualified Data by QA Reviewer
046FMS 11/11/2013 12:00 PM pH 7.86 J Hold Time Violation
194

●
●● ●
●
●
●
●
●
●
● ●
●
●
● ●●
●
●
●
●0
48
Site 46 − Water Temperature°C
2009
2010
2011
2012
2013
●
●●●
●
●
●
●
●
●
● ●
●
●
●●
●
●
●
●
●
05
1015
20
°C
Oct
200
9
Oct
201
0
Oct
201
1
Oct
201
2
Oct
201
3
Water Temperature Upper Limit Lower Limit
Note: the AWQS may not be shown in order to allow greater visual detail of measured values for trend analysis
195

●●● ●
●
●
●
●
●
● ●●
●●
●
●
●
●
●
●
●
050
150
Site 46 − Conductivity LaboratoryµS
/cm
2009
2010
2011
2012
2013
●●
●●
●
●
●
●
●
● ●
●
●
●
●
●
●
●
●
●
●
050
100
150
200
250
300
350
µS/c
m
Oct
200
9
Oct
201
0
Oct
201
1
Oct
201
2
Oct
201
3
Conductivity Laboratory Upper Limit Lower Limit
Note: the AWQS may not be shown in order to allow greater visual detail of measured values for trend analysis
196

●
●
● ●
●
●
●
●
●●
● ● ●●
● ●
●
●●
●
●
050
150
Site 46 − Conductivity FieldµS
/cm
2009
2010
2011
2012
2013
●
●
● ●
●
●
●
●
●
●
●● ●
●
● ●
●
●●
●
●
050
100
150
200
250
300
350
µS/c
m
Oct
200
9
Oct
201
0
Oct
201
1
Oct
201
2
Oct
201
3
Conductivity Field Upper Limit Lower Limit
Note: the AWQS may not be shown in order to allow greater visual detail of measured values for trend analysis
197

●●●
●
●
●●
●● ●
●
●
●
●
●
●●
●●
●
●
6.5
7.5
Site 46 − pH Laboratorysu
2009
2010
2011
2012
2013
●●
●
●
●
●●
●
● ●
●
●
●
●
●
●
●●
●
●
●
56
78
910
su
Oct
200
9
Oct
201
0
Oct
201
1
Oct
201
2
Oct
201
3
pH Laboratory Upper Limit Lower Limit
Note: the AWQS may not be shown in order to allow greater visual detail of measured values for trend analysis
198

●
●●
●
●
●
●
●
● ●●
●
● ● ●
●
●
●
●●
●6.
57.
5
Site 46 − pH Fieldsu
2009
2010
2011
2012
2013
●
●
●
●
●
●
●
●
● ●
●
●
● ●●
●
●
●
●
●
●
56
78
910
su
Oct
200
9
Oct
201
0
Oct
201
1
Oct
201
2
Oct
201
3
pH Field Upper Limit Lower Limit
Note: the AWQS may not be shown in order to allow greater visual detail of measured values for trend analysis
199

●●●
●
●
●
●
●
●
● ● ●●
●
●
●
●
● ●
●
●
2040
60
Site 46 − Alkalinitym
g/L
2009
2010
2011
2012
2013
●●
●
●
●
●
●
●
●
● ● ●
●
●
●
●
●
●●
●
●
020
4060
8010
012
014
0
mg/
L
Oct
200
9
Oct
201
0
Oct
201
1
Oct
201
2
Oct
201
3
Alkalinity Upper Limit Lower Limit
Note: the AWQS may not be shown in order to allow greater visual detail of measured values for trend analysis
200

●●●
●
●
●
●
●
●
● ●
●
●
●
●
●
●
●
●
●
●
05
1015
Site 46 − Sulfate Totalm
g/L
2009
2010
2011
2012
2013
●●●
●
●
●
●
●
●
● ●
●
●
●
●
●
●
●
●
●
●
010
2030
4050
mg/
L
Oct
200
9
Oct
201
0
Oct
201
1
Oct
201
2
Oct
201
3
Sulfate Total Upper Limit Lower Limit
Note: the AWQS may not be shown in order to allow greater visual detail of measured values for trend analysis
201

●●●
●
●
●
●
●
●
● ●●
●●
●●
●
● ●
●
●
040
80
Site 46 − Hardnessm
g/L
2009
2010
2011
2012
2013
●●
●
●
●
●
●
●
●
● ●
●
●
●
●
●
●
●●
●
●
020
4060
8010
012
014
0
mg/
L
Oct
200
9
Oct
201
0
Oct
201
1
Oct
201
2
Oct
201
3
Hardness Upper Limit Lower Limit
Note: the AWQS may not be shown in order to allow greater visual detail of measured values for trend analysis
202

●●
●●
● ●
●
●
●
●
●
●
● ●● ● ● ●
●
●
●0.
000.
150.
30
Site 46 − Arsenic Dissolvedµg
/L
2009
2010
2011
2012
2013
●●● ●
● ●●
● ●●
●
●● ● ● ● ● ● ●
●●
01
23
45
µg/L
Oct
200
9
Oct
201
0
Oct
201
1
Oct
201
2
Oct
201
3
Arsenic Dissolved Upper Limit Lower Limit
Note: the AWQS may not be shown in order to allow greater visual detail of measured values for trend analysis
203

●●
●
●●
● ●●
●0
48
12
Site 46 − Barium Dissolvedµg
/L
2009
2010
2011
2012
2013
●●
●● ●
● ●●
●
010
2030
4050
6070
µg/L
Oct
200
9
Oct
201
0
Oct
201
1
Oct
201
2
Oct
201
3
Barium Dissolved Upper Limit Lower Limit
Note: the AWQS may not be shown in order to allow greater visual detail of measured values for trend analysis
204

●●●
●
●
●
●
●
● ●
●
●
●
●
● ●●
●
●●
●
0.00
0.03
Site 46 − Cadmium Dissolvedµg
/L
2009
2010
2011
2012
2013
●●●
●
●
●
●
●● ●
●
●
●
●
● ●●
●
●●
●
0.00
0.05
0.10
0.15
0.20
0.25
µg/L
Oct
200
9
Oct
201
0
Oct
201
1
Oct
201
2
Oct
201
3
Cadmium Dissolved Upper Limit Lower Limit
Note: the AWQS may not be shown in order to allow greater visual detail of measured values for trend analysis
205

●
●
●
●
● ● ● ● ●
01
23
4
Site 46 − Chromium Dissolvedµg
/L
2009
2010
2011
2012
2013
●
●
●
●
●●
●
●●
01
23
45
µg/L
Oct
200
9
Oct
201
0
Oct
201
1
Oct
201
2
Oct
201
3
Chromium Dissolved Upper Limit Lower Limit
Note: the AWQS may not be shown in order to allow greater visual detail of measured values for trend analysis
206
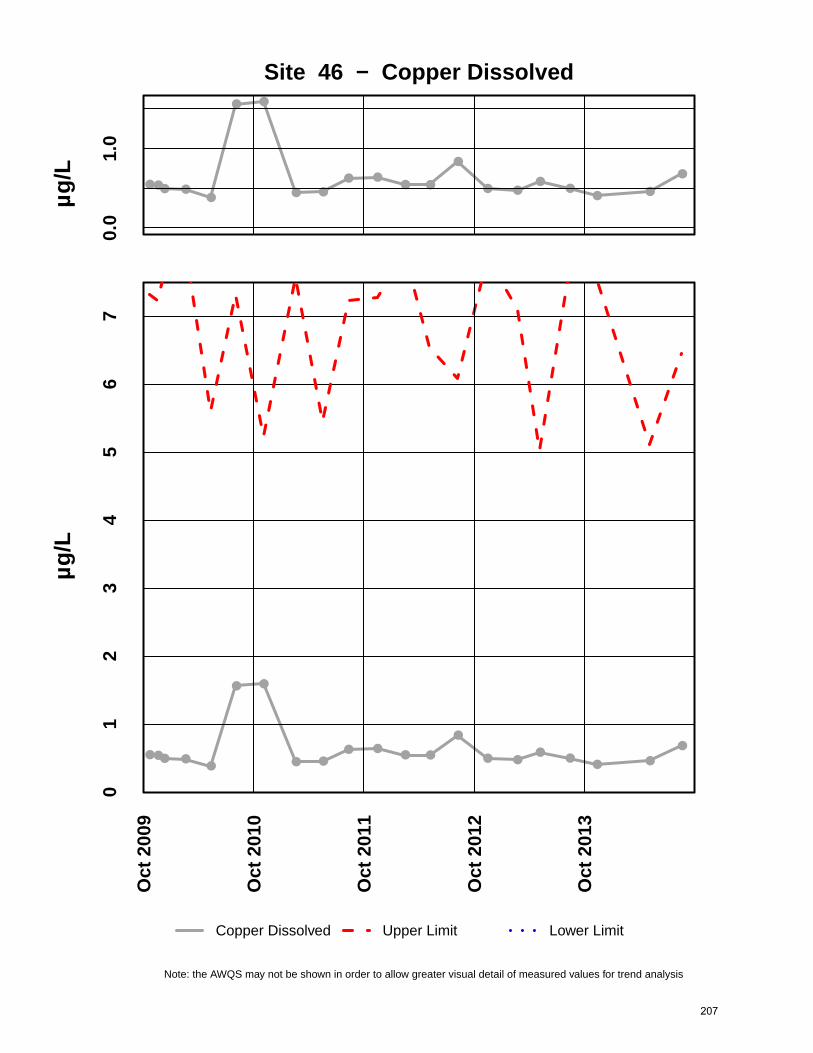
●●● ●●
● ●
● ●● ●
● ●
●
● ●●
●● ●
●
0.0
1.0
Site 46 − Copper Dissolvedµg
/L
2009
2010
2011
2012
2013
●●● ●●
● ●
● ●● ●
● ●
●
● ●●
●● ●
●
01
23
45
67
µg/L
Oct
200
9
Oct
201
0
Oct
201
1
Oct
201
2
Oct
201
3
Copper Dissolved Upper Limit Lower Limit
Note: the AWQS may not be shown in order to allow greater visual detail of measured values for trend analysis
207

●●
●●
●
●
●
●●
●●
●● ● ●
●●
● ● ● ●
0.00
0.15
Site 46 − Lead Dissolvedµg
/L
2009
2010
2011
2012
2013
●●●
● ●●
●
● ● ● ● ● ● ● ● ● ● ● ● ● ●
0.0
0.5
1.0
1.5
2.0
µg/L
Oct
200
9
Oct
201
0
Oct
201
1
Oct
201
2
Oct
201
3
Lead Dissolved Upper Limit Lower Limit
Note: the AWQS may not be shown in order to allow greater visual detail of measured values for trend analysis
208

● ●
● ●●
●● ●
●
0.0
1.0
Site 46 − Nickel Dissolvedµg
/L
2009
2010
2011
2012
2013
● ●
● ●●
● ● ● ●
02
46
810
1214
µg/L
Oct
200
9
Oct
201
0
Oct
201
1
Oct
201
2
Oct
201
3
Nickel Dissolved Upper Limit Lower Limit
Note: the AWQS may not be shown in order to allow greater visual detail of measured values for trend analysis
209

● ● ● ● ● ● ● ● ●
−1.0
0.0
1.0
Site 46 − Silver Dissolvedµg
/L
2009
2010
2011
2012
2013
● ● ● ● ● ● ● ● ●0.0
0.5
1.0
1.5
2.0
2.5
3.0
µg/L
Oct
200
9
Oct
201
0
Oct
201
1
Oct
201
2
Oct
201
3
Silver Dissolved Upper Limit Lower Limit
Note: the AWQS may not be shown in order to allow greater visual detail of measured values for trend analysis
210

●●● ●● ●
●
● ●●
●
●● ●
●●
●●
● ●
●
02
46
8
Site 46 − Zinc Dissolvedµg
/L
2009
2010
2011
2012
2013
●●● ● ● ●
●
● ● ●
●● ● ● ● ● ● ●
● ●●
020
4060
80
µg/L
Oct
200
9
Oct
201
0
Oct
201
1
Oct
201
2
Oct
201
3
Zinc Dissolved Upper Limit Lower Limit
Note: the AWQS may not be shown in order to allow greater visual detail of measured values for trend analysis
211

● ●
●
● ● ● ●
● ●
0.0
0.4
0.8
Site 46 − Selenium Dissolvedµg
/L
2009
2010
2011
2012
2013
● ●
●
● ● ● ●
● ●
01
23
45
µg/L
Oct
200
9
Oct
201
0
Oct
201
1
Oct
201
2
Oct
201
3
Selenium Dissolved Upper Limit Lower Limit
Note: the AWQS may not be shown in order to allow greater visual detail of measured values for trend analysis
212

●●● ● ●●
●
●● ●
● ●●
●
●●
●
●●
●●
0.00
00.
003
Site 46 − Mercury Dissolvedµg
/L
2009
2010
2011
2012
2013
●●● ● ●●
●
●●
●● ●
●
●
●●
●
●
●●
●
0.00
00.
002
0.00
40.
006
0.00
80.
010
0.01
2
µg/L
Oct
200
9
Oct
201
0
Oct
201
1
Oct
201
2
Oct
201
3
Mercury Dissolved Upper Limit Lower Limit
Note: the AWQS may not be shown in order to allow greater visual detail of measured values for trend analysis
213

INTERPRETIVE REPORT SITE 57 The data collected during the current water year are listed in the following “Table of Results for Water Year 2014” report. The table includes all the required FWMP analyte data (field and laboratory) collected for the current water year and a series of flags keyed to the summary report “Qualified Data by QA Reviewer”. The QA report lists any associated data limitations found during the monthly QA reviews of laboratory data for this site. Median values for all analytes have been calculated and are shown in the right-most column of the table of results. Any value reported as less than MDL has been replaced with a value of ½ MDL for the purpose of median calculation. All data collected at this site for the past six years are included in the data analyses. As shown in the table below, there were no data outliers.
Sample Date Parameter Value Qualifier Notes No outliers have been identified by HGCMC for the period of October 2008 through September 2014.
The data for Water Year 2014 have been compared to the strictest fresh water quality criterion for each applicable analyte. No results exceeding these criteria have been identified as listed in the table below.
X-Y plots have been generated to graphically present the data for each of the analytes requested in the Statistical Information Goals for this site. These plots have been visually analyzed for the appearance of any trend in concentration. Though values for dissolved cadmium, dissolved lead, and dissolved zinc had shown a large variation in the past, the current water year’s data continues the trend from water year 2009 of these analytes leveling out. Also, there appears to be a gradual increase in dissolved nickel over the past few years, however the values are within the historical range, A non-parametric statistical analysis for trend was performed for specific conductivity, field pH, total alkalinity, total sulfate, and dissolved zinc. Calculation details of the Seasonal Kendall analyses are presented on the pages following this interpretive section. The following table summarizes the results on the data collected between Oct-08 and Sep-14 (WY2009-WY2014). Datasets with a statistically significant trend (α/2=2.5%) a Seasonal-Sen’s Slope estimate statistic has also been calculated. There were three statistically significant trends calculated for these parameters this water year. Of note is the increasing trend in dissolved zinc, with a Sen’s
Lower Upper
No exceedances have been identified by HGCMC for the period of October 2013 through September 2014.
Table of Exceedance for Water Year 2014
Sample Date Parameter Value
LimitsHardness
214

slope estimate of 3.13 mg/L/yr. Site 57 is an upgradient background site and this trend is an example of the natural variability of the system.
Mann-Kendall test statistics Sen's slope estimaten* p** Trend Q Q(%)
Conductivity Field 6 <0.01 - -11.875 -2.932pH Field 6 <0.01 + 0.023 0.307Alkalinity, Total 6 0.41Sulfate, Total 6 0.08Zinc, Dissolved 6 0.02 + 3.127 22.339* Number of Years ** Significance level
Table of Summary Statistics for Trend Analysis
Parameter
215

-10
-8
-6
-4
-2
0
2
4
6
8
10
0
50
100
150
200
250
300
350
400
450
500
CUSU
M
Spec
ific C
ondu
ctan
ce (µ
S/cm
)Figure 1. Observed Measurements for Specific Conductance, Dissolved Zinc, and Total Sulfate
from Site 57 Compared to the Shewhart-CUSUM Control Limits From Table 1
-6
-4
-2
0
2
4
6
0
50
100
150
200
250
300
350
Diss
olve
d Zi
nc (µ
g/L)
CUSU
M
-10-8-6-4-20246810
0102030405060708090
100
Jan-
00
Jan-
01
Jan-
02
Jan-
03
Jan-
04
Jan-
05
Jan-
06
Jan-
07
Jan-
08
Jan-
09
Jan-
10
Jan-
11
Jan-
12
Jan-
13
Jan-
14
Tota
l Sul
fate
(µg/
L)
CUSU
M
Mean Analyte Baseline Limits CUSUM CUSUM
216

Sample Date/Parameter Oct 2013 Nov 2013 Dec 2013 Jan 2014 Feb 2014 Mar 2014 Apr 2014 May 2014 Jun 2014 Jul 2014 Aug 2014 Sep 2014 MedianWater Temp (°C) 5.3 4.0 11 9.7 7.5Conductivity-Field(µmho) 194 351 382 389 366.5Conductivity-Lab (µmho) 295 316 352 362 334pH Lab (standard units) 7.58 7.62 7.48 7.56 7.57pH Field (standard units) 7.73 7.76 7.68 7.7 7.72Total Alkalinity (mg/L) 136 129 124 129 129.0Total Sulfate (mg/L) 43.7 36 39.1 43.2 41.2Hardness (mg/L) 186 161 171 185 178.0Dissolved As (ug/L) 0.679 0.769 0.673 0.685 0.682Dissolved Ba (ug/L) 29.3 31 29.6 30.5 30.1Dissolved Cd (ug/L) 0.149 0.157 0.2 0.158 0.1575Dissolved Cr (ug/L) 1.67 2.65 1.37 1.19 1.520Dissolved Cu (ug/L) 0.682 1.92 1.99 1.47 1.695Dissolved Pb (ug/L) 0.688 0.251 0.574 0.363 0.4685Dissolved Ni (ug/L) 1.39 1.12 1.41 1.7 1.400Dissolved Ag (ug/L) 0.002 0.002 0.002 0.002 0.002Dissolved Zn (ug/L) 36 21.4 41.3 17.5 28.70Dissolved Se (ug/L) 0.847 0.719 0.856 0.985 0.852Dissolved Hg (ug/L) 0.000283 0.000247 0.00493 0.000833 0.000558
For individual sample/analyte qualifier descriptions see "Qualified Data by QA Reviewer" table.Values reported as less than MDL are replaced by 1/2 MDL for median calculation purposes.Shaded data has been qualified as an outlier by HGCMC and removed from any further analysis and is not included into the calculation of the median
Table of Results for Water Year 2014
Site 057FMG - 'Monitoring Well -23-00-03'
217

Date Range: 10/01/2013 to 09/30/2014
Site No. Sample Date Sample Time Parameter Value Qualifier Reason for Qualifier
Qualified Data by QA Reviewer
057FMS 2/12/2014 12:00 PM Diss. Cu-ICP/MS 1.92 J LCS Recovery
Diss. Hg-CVAF 0.000247 J Below Quantitative Range
Sulfate 36 J Sample Receipt Temperature
218
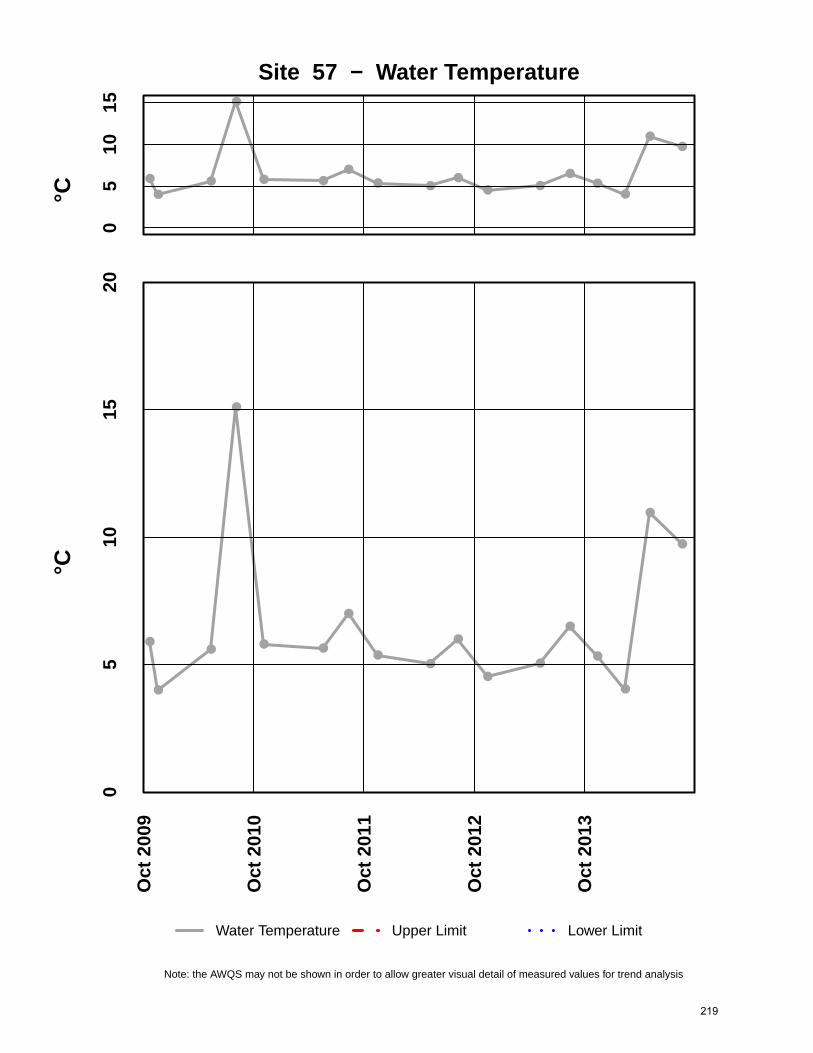
●
●●
●
● ●●
● ●●
● ●●
●●
●●
05
1015
Site 57 − Water Temperature°C
2009
2010
2011
2012
2013
●
●
●
●
● ●
●
●●
●
●●
●
●
●
●
●
05
1015
20
°C
Oct
200
9
Oct
201
0
Oct
201
1
Oct
201
2
Oct
201
3
Water Temperature Upper Limit Lower Limit
Note: the AWQS may not be shown in order to allow greater visual detail of measured values for trend analysis
219

●● ●●
●
●● ● ●
● ●●
●
●●
● ●0
200
400
Site 57 − Conductivity LaboratoryµS
/cm
2009
2010
2011
2012
2013
●●●
●
●
●
●●
●
●●
●
●
●
●
●●
010
020
030
040
050
0
µS/c
m
Oct
200
9
Oct
201
0
Oct
201
1
Oct
201
2
Oct
201
3
Conductivity Laboratory Upper Limit Lower Limit
Note: the AWQS may not be shown in order to allow greater visual detail of measured values for trend analysis
220

●● ●●
●● ●
●● ●
●●
●
●
●● ●
020
040
0
Site 57 − Conductivity FieldµS
/cm
2009
2010
2011
2012
2013
●
●●
●
●
●
●
●
●●
●
●
●
●
●
●●
010
020
030
040
050
0
µS/c
m
Oct
200
9
Oct
201
0
Oct
201
1
Oct
201
2
Oct
201
3
Conductivity Field Upper Limit Lower Limit
Note: the AWQS may not be shown in order to allow greater visual detail of measured values for trend analysis
221

●● ●
●
●
●●
●
●
●
● ●●
● ●● ●
6.5
7.5
Site 57 − pH Laboratorysu
2009
2010
2011
2012
2013
●● ●
●
●
●●
●
●
●
● ●
●● ●
●●
56
78
910
su
Oct
200
9
Oct
201
0
Oct
201
1
Oct
201
2
Oct
201
3
pH Laboratory Upper Limit Lower Limit
Note: the AWQS may not be shown in order to allow greater visual detail of measured values for trend analysis
222

●●
●
●
●●
● ●●
● ●●
● ● ● ● ●
6.5
7.5
Site 57 − pH Fieldsu
2009
2010
2011
2012
2013
●
●●
●
●●
● ●
●
● ●
●
● ● ●● ●
56
78
910
su
Oct
200
9
Oct
201
0
Oct
201
1
Oct
201
2
Oct
201
3
pH Field Upper Limit Lower Limit
Note: the AWQS may not be shown in order to allow greater visual detail of measured values for trend analysis
223

●●●
●●
●● ●
● ● ●●
● ●● ● ●
5010
0
Site 57 − Alkalinitym
g/L
2009
2010
2011
2012
2013
●●●
●●
●
● ●
● ● ●●
● ●● ● ●
010
020
030
040
050
0
mg/
L
Oct
200
9
Oct
201
0
Oct
201
1
Oct
201
2
Oct
201
3
Alkalinity Upper Limit Lower Limit
Note: the AWQS may not be shown in order to allow greater visual detail of measured values for trend analysis
224

●●
●
●
●
●
● ●●
● ●●
● ●
●●
●
020
4060
Site 57 − Sulfate Totalm
g/L
2009
2010
2011
2012
2013
●
●
●
●
●
●
●●
●
●●
●
● ●
●●
●
020
4060
8010
012
0
mg/
L
Oct
200
9
Oct
201
0
Oct
201
1
Oct
201
2
Oct
201
3
Sulfate Total Upper Limit Lower Limit
Note: the AWQS may not be shown in order to allow greater visual detail of measured values for trend analysis
225

●●●
●●
●● ● ● ● ● ●
● ●● ●
●0
100
200
Site 57 − Hardnessm
g/L
2009
2010
2011
2012
2013
●●
●
●
●
●
● ● ● ●●
●
● ●
●●
●
010
020
030
040
050
0
mg/
L
Oct
200
9
Oct
201
0
Oct
201
1
Oct
201
2
Oct
201
3
Hardness Upper Limit Lower Limit
Note: the AWQS may not be shown in order to allow greater visual detail of measured values for trend analysis
226

●
● ●● ● ● ● ●
●
●
●
●●
●
●
● ●0.
00.
40.
8
Site 57 − Arsenic Dissolvedµg
/L
2009
2010
2011
2012
2013
●● ● ● ● ● ● ● ● ●● ● ● ● ● ● ●
05
1015
20
µg/L
Oct
200
9
Oct
201
0
Oct
201
1
Oct
201
2
Oct
201
3
Arsenic Dissolved Upper Limit Lower Limit
Note: the AWQS may not be shown in order to allow greater visual detail of measured values for trend analysis
227

●● ●
●
●
● ● ●●
● ● ●● ●
● ● ●0
1020
30
Site 57 − Barium Dissolvedµg
/L
2009
2010
2011
2012
2013
●● ●
●
●
● ● ●
●●
● ●● ●
●● ●
020
4060
8010
0
µg/L
Oct
200
9
Oct
201
0
Oct
201
1
Oct
201
2
Oct
201
3
Barium Dissolved Upper Limit Lower Limit
Note: the AWQS may not be shown in order to allow greater visual detail of measured values for trend analysis
228

●●●
●●
●●
●
● ● ● ●
●● ●
●
●
0.00
0.10
0.20
Site 57 − Cadmium Dissolvedµg
/L
2009
2010
2011
2012
2013
●●●
●●
●●
●
● ● ● ●●
● ●
●
●
0.0
0.2
0.4
0.6
0.8
1.0
µg/L
Oct
200
9
Oct
201
0
Oct
201
1
Oct
201
2
Oct
201
3
Cadmium Dissolved Upper Limit Lower Limit
Note: the AWQS may not be shown in order to allow greater visual detail of measured values for trend analysis
229

●
●
●
●
●● ● ● ●
●
● ● ●
●
●
● ●
01
23
4
Site 57 − Chromium Dissolvedµg
/L
2009
2010
2011
2012
2013
●
●
●
●
●
● ● ●●
●
●● ●
●
●
●●
02
46
810
µg/L
Oct
200
9
Oct
201
0
Oct
201
1
Oct
201
2
Oct
201
3
Chromium Dissolved Upper Limit Lower Limit
Note: the AWQS may not be shown in order to allow greater visual detail of measured values for trend analysis
230

●●
●●
●
●●
●
●
● ●
●
●●
● ●
●
0.0
1.0
2.0
Site 57 − Copper Dissolvedµg
/L
2009
2010
2011
2012
2013
●●
●●
●
● ●
●
●
● ●
●
● ●
● ●
●
02
46
810
1214
µg/L
Oct
200
9
Oct
201
0
Oct
201
1
Oct
201
2
Oct
201
3
Copper Dissolved Upper Limit Lower Limit
Note: the AWQS may not be shown in order to allow greater visual detail of measured values for trend analysis
231

●●●
●
●
●
●
●●
●
●
●
●
●
●
●
●
0.0
0.4
0.8
Site 57 − Lead Dissolvedµg
/L
2009
2010
2011
2012
2013
●● ● ● ● ●●
● ● ● ●
●
●●
● ● ●05
1015
2025
30
µg/L
Oct
200
9
Oct
201
0
Oct
201
1
Oct
201
2
Oct
201
3
Lead Dissolved Upper Limit Lower Limit
Note: the AWQS may not be shown in order to allow greater visual detail of measured values for trend analysis
232
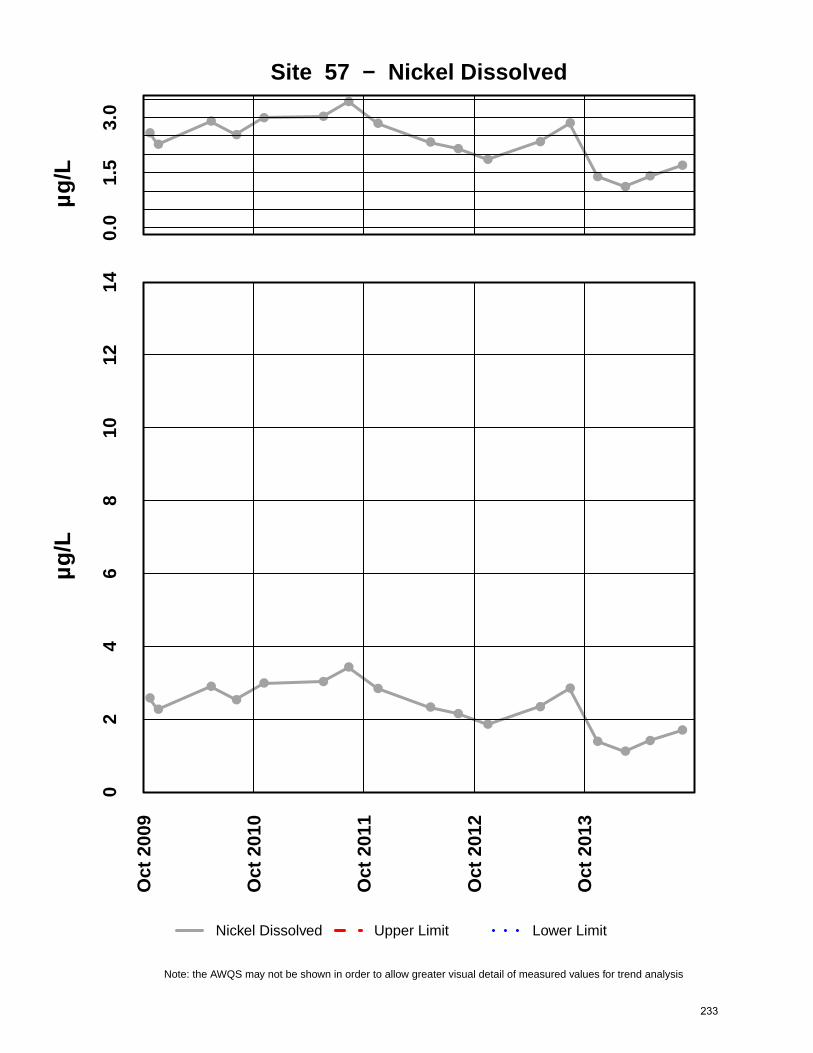
●●
●●
● ●
●
●
●●
●
●
●
●●
●●
0.0
1.5
3.0
Site 57 − Nickel Dissolvedµg
/L
2009
2010
2011
2012
2013
●●
●●
● ●
●
●
●●
●
●
●
●●
●●
02
46
810
1214
µg/L
Oct
200
9
Oct
201
0
Oct
201
1
Oct
201
2
Oct
201
3
Nickel Dissolved Upper Limit Lower Limit
Note: the AWQS may not be shown in order to allow greater visual detail of measured values for trend analysis
233
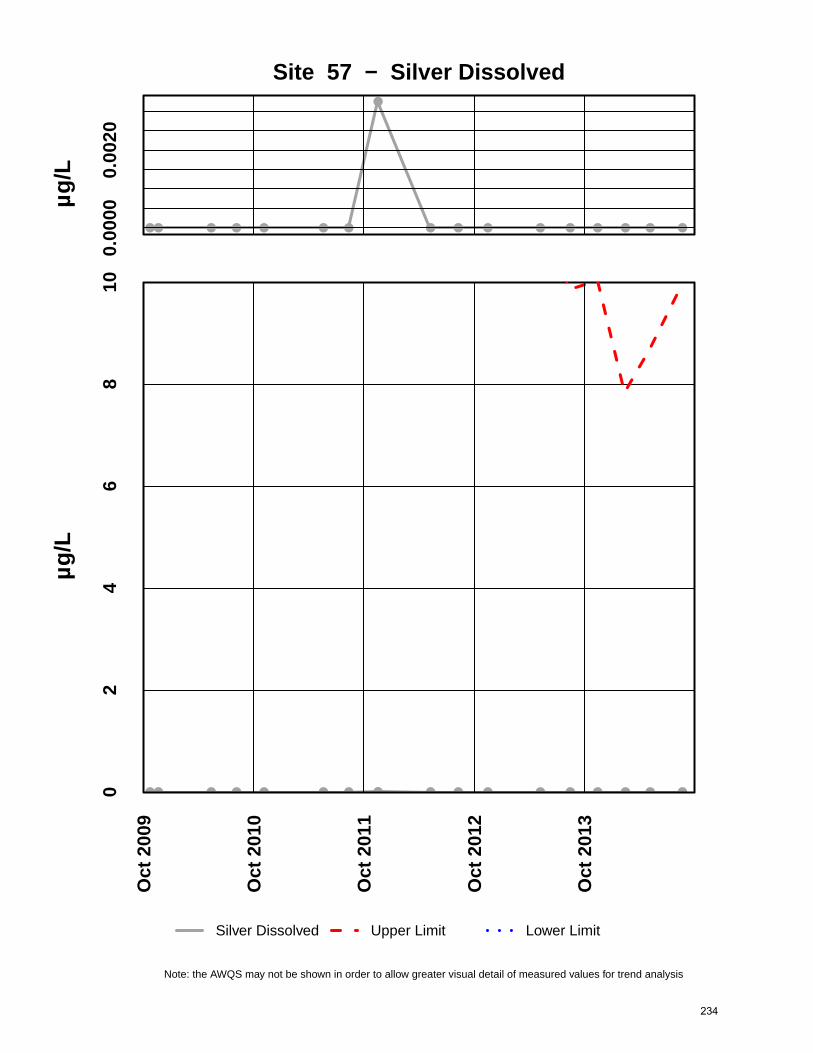
●● ● ● ● ● ●
●
● ● ● ● ● ● ● ● ●
0.00
000.
0020
Site 57 − Silver Dissolvedµg
/L
2009
2010
2011
2012
2013
●● ● ● ● ● ● ● ● ● ● ● ● ● ● ● ●02
46
810
µg/L
Oct
200
9
Oct
201
0
Oct
201
1
Oct
201
2
Oct
201
3
Silver Dissolved Upper Limit Lower Limit
Note: the AWQS may not be shown in order to allow greater visual detail of measured values for trend analysis
234

●●
●
●
● ●● ● ●
●●
● ●
●
●
●
●
020
40
Site 57 − Zinc Dissolvedµg
/L
2009
2010
2011
2012
2013
●●
●
●
● ●● ● ●
● ●
● ●
●
●
●
●
050
100
150
200
µg/L
Oct
200
9
Oct
201
0
Oct
201
1
Oct
201
2
Oct
201
3
Zinc Dissolved Upper Limit Lower Limit
Note: the AWQS may not be shown in order to allow greater visual detail of measured values for trend analysis
235

●
● ●
●
●●
●
● ●
●
●
●
●●
●●
●
0.0
0.6
1.2
Site 57 − Selenium Dissolvedµg
/L
2009
2010
2011
2012
2013
●
● ●
●
●●
●
● ●
●
●
●
●●
●●
●
01
23
45
µg/L
Oct
200
9
Oct
201
0
Oct
201
1
Oct
201
2
Oct
201
3
Selenium Dissolved Upper Limit Lower Limit
Note: the AWQS may not be shown in order to allow greater visual detail of measured values for trend analysis
236

●●
●
● ● ● ● ●● ● ● ● ● ● ●
●
●
0.00
00.
003
Site 57 − Mercury Dissolvedµg
/L
2009
2010
2011
2012
2013
●●
●
● ● ● ●●
●● ● ● ● ● ●
●
●
0.00
00.
002
0.00
40.
006
0.00
80.
010
0.01
2
µg/L
Oct
200
9
Oct
201
0
Oct
201
1
Oct
201
2
Oct
201
3
Mercury Dissolved Upper Limit Lower Limit
Note: the AWQS may not be shown in order to allow greater visual detail of measured values for trend analysis
237

INTERPRETIVE REPORT SITE 13 The data collected during the current water year are listed in the following “Table of Results for Water Year 2014” report. The table includes all the required FWMP analyte data (field and laboratory) collected for the current water year and a series of flags keyed to the summary report “Qualified Data by QA Reviewer”. The QA report lists any associated data limitations found during the monthly QA reviews of laboratory data for this site. Median values for all analytes have been calculated and are shown in the right-most column of the table of results. Any value reported as less than MDL has been replaced with a value of ½ MDL for the purpose of median calculation. All data collected at this site for the past six years are included in the data analyses. As shown in the table below, there were no data outliers.
Sample Date Parameter Value Qualifier Notes No outliers have been identified by HGCMC for the period of October 2008 through September 2014.
The data for Water Year 2014 have been compared to the strictest fresh water quality criterion for each applicable analyte. Six results exceeding these criteria have been identified as listed in the table below.
Over several years waste rock material has been removed from the 1350 Area. It was not until 2011 that any material was removed from the Eastern Lobe, the area that contributes to the Site 13 drainage; however the material removed was not in the direct drain path for Site 13. During 2012 no material was removed, a limited amount was removed in 2013, HGCMC removed most of the remaining material in 2014, only the material that is needed for road access was left. This material will be removed during final reclamation. X-Y plots have been generated to graphically present the data for each of the analytes requested in the Statistical Information Goals for this site. Cadmium, nickel, lead, and zinc all sharply increased at Site 13 after waste rock material was removed in 2014. As seen with other
Lower Upper
20-Aug-14 Cadmium Dissolved 5.68 µg/L 0 0.429 223 mg/L23-Sep-14 Cadmium Dissolved 10.9 µg/L 0 0.427 221 mg/L11-Nov-13 Sulfate Total 363 mg/L 0 25022-May-14 Sulfate Total 258 mg/L 0 25020-Aug-14 Zinc Dissolved 1460 µg/L 0 233 223 mg/L23-Sep-14 Zinc Dissolved 2660 µg/L 0 231 221 mg/L
Table of Exceedance for Water Year 2014
LimitsSample Date Parameter Value Hardness
238

reclamation projects (e.g. the 960) there is usually an initial increase in metals concentration. It is HGCMC expectation that these increased values are transient in nature and will be attenuate throughout Water Year 2015.
A non-parametric statistical analysis for trend was performed for specific conductivity, field pH, total alkalinity, total sulfate, and dissolved zinc. Calculation details of the Seasonal Kendall analyses are presented in detail on the pages following this interpretive section. The following table summarizes the results on the data collected between Oct-08 and Sep-14(WY2009-WY2014). For datasets with a statistically significant trend a Seasonal-Sen’s Slope estimate statistic has also been calculated. There was one statistically significant decreasing trend (α/2=2.5%) for conductivity at Site 13, this is potentially a result of the material removal. HGCMC feels the current FWMP program is sufficient to monitor current and future changes at Site 13 before water quality values are impaired long term.
Mann-Kendall test statistics Sen's slope estimaten* p** Trend Q Q(%)
Conductivity Field 6 0.02 - -41 -5.64pH Field 6 0.38Alkalinity, Total 6 0.38Sulfate, Total 6 0.38Zinc, Dissolved 6 0.27* Number of Years ** Significance level
Table of Summary Statistics for Trend Analysis
Parameter
239

Sample Date/Parameter Oct 2013 Nov 2013 Dec 2013 Jan 2014 Feb 2014 Mar 2014 Apr 2014 May 2014 Jun 2014 Jul 2014 Aug 2014 Sep 2014 MedianWater Temp (°C) 1.3 4.5 10.7 8.8 6.7Conductivity-Field(µmho) 959 721 453 463 592.0Conductivity-Lab (µmho) 768 612 441 424 527pH Lab (standard units) 7.82 7.72 7.33 7.29 7.53pH Field (standard units) 8.1 8.08 7.51 6.97 7.80Total Alkalinity (mg/L) 160 125 53.5 41.5 89.3Total Sulfate (mg/L) 363 258 158 164 211.0Hardness (mg/L) 573 404 223 221 313.5Dissolved As (ug/L) 0.111 0.116 0.243 0.203 0.160Dissolved Ba (ug/L) 19.2 15.9 19.9 20.1 19.6Dissolved Cd (ug/L) 0.0087 0.0083 5.68 10.9 2.8444Dissolved Cr (ug/L) 0.736 2.33 0.95 0.651 0.843Dissolved Cu (ug/L) 0.298 1.31 1.08 1.17 1.125Dissolved Pb (ug/L) 0.006 0.0057 2.87 5.63 1.4380Dissolved Ni (ug/L) 1.68 1.03 9.92 12.9 5.800Dissolved Ag (ug/L) 0.002 0.002 0.004 0.002 0.002Dissolved Zn (ug/L) 8.48 6.98 1460 2660 734.24Dissolved Se (ug/L) 0.205 0.395 0.147 0.447 0.300Dissolved Hg (ug/L) 0.000575 0.000664 0.00149 0.0017 0.001077
For individual sample/analyte qualifier descriptions see "Qualified Data by QA Reviewer" table.Values reported as less than MDL are replaced by 1/2 MDL for median calculation purposes.Shaded data has been qualified as an outlier by HGCMC and removed from any further analysis and is not included into the calculation of the median
Table of Results for Water Year 2014
Site 013FMS - '1350 East Drainage'
240

Date Range: 10/01/2013 to 09/30/2014
Site No. Sample Date Sample Time Parameter Value Qualifier Reason for Qualifier
Qualified Data by QA Reviewer
013FMS 11/11/2013 12:00 PM Diss. Cd-ICP/MS 0.0087 J Below Quantitative Range
Diss. Pb-ICP/MS 0.00597 J Below Quantitative Range
Diss. Se-ICP/MS 0.2 J Below Quantitative Range
pH 7.82 J Hold Time Violation
013FMS 5/22/2014 12:00 PM Diss. Cd-ICP/MS 0.00834 J Below Quantitative Range
Diss. Hg-CVAF 0.000664 J LCS Recovery
Diss. Pb-ICP/MS 0.00574 J Below Quantitative Range
Sulfate 258 J Sample Receipt Temperature
013FMS 8/20/2014 12:00 PM Diss. Ag-ICP/MS 0.00387 U Field Blank Contamination
Diss. Se-ICP/MS 0.14 J Below Quantitative Range
241

● ●
●
● ●
●
●
●●
●
●
●
●
04
8
Site 13 − Water Temperature°C
2009
2010
2011
2012
2013
●●
●
● ●
●
●
●
●
●
●
●
●
05
1015
20
°C
Oct
200
9
Oct
201
0
Oct
201
1
Oct
201
2
Oct
201
3
Water Temperature Upper Limit Lower Limit
Note: the AWQS may not be shown in order to allow greater visual detail of measured values for trend analysis
242

● ●●
●
●
●
●
● ●●
●
●●
040
080
0
Site 13 − Conductivity LaboratoryµS
/cm
2009
2010
2011
2012
2013
●●
●
●
●
●
●
● ●
●
●
●●
020
040
060
080
010
0012
0014
00
µS/c
m
Oct
200
9
Oct
201
0
Oct
201
1
Oct
201
2
Oct
201
3
Conductivity Laboratory Upper Limit Lower Limit
Note: the AWQS may not be shown in order to allow greater visual detail of measured values for trend analysis
243

● ●●
●
●
●
●
●
● ●
●
●
●●
040
080
0
Site 13 − Conductivity FieldµS
/cm
2009
2010
2011
2012
2013
●●
●
●
●
●
●
●
● ●
●
●
●●
020
040
060
080
010
0012
0014
00
µS/c
m
Oct
200
9
Oct
201
0
Oct
201
1
Oct
201
2
Oct
201
3
Conductivity Field Upper Limit Lower Limit
Note: the AWQS may not be shown in order to allow greater visual detail of measured values for trend analysis
244

● ● ●
●
● ●
●
●● ●
●
●●
6.5
7.5
Site 13 − pH Laboratorysu
2009
2010
2011
2012
2013
●●
●
●
● ●
●
●●
●●
●●
56
78
910
su
Oct
200
9
Oct
201
0
Oct
201
1
Oct
201
2
Oct
201
3
pH Laboratory Upper Limit Lower Limit
Note: the AWQS may not be shown in order to allow greater visual detail of measured values for trend analysis
245

● ●
●● ● ●
●
● ●
● ● ●
●
●
6.5
7.5
8.5
Site 13 − pH Fieldsu
2009
2010
2011
2012
2013
●●
●
● ●●
●
● ●
● ● ●
●
●
56
78
910
su
Oct
200
9
Oct
201
0
Oct
201
1
Oct
201
2
Oct
201
3
pH Field Upper Limit Lower Limit
Note: the AWQS may not be shown in order to allow greater visual detail of measured values for trend analysis
246

● ●
●
●
●
●
●●
●
●●
●
●●50
150
Site 13 − Alkalinitym
g/L
2009
2010
2011
2012
2013
● ●
●
●
●
●
●●
●● ●
●
●●
020
040
060
080
010
00
mg/
L
Oct
200
9
Oct
201
0
Oct
201
1
Oct
201
2
Oct
201
3
Alkalinity Upper Limit Lower Limit
Note: the AWQS may not be shown in order to allow greater visual detail of measured values for trend analysis
247

●●
●
●
●
●
●
●
● ●
●
●
●●
020
0
Site 13 − Sulfate Totalm
g/L
2009
2010
2011
2012
2013
●
●
●
●
●
●
●
●
●●
●
●
●●
010
020
030
040
050
060
0
mg/
L
Oct
200
9
Oct
201
0
Oct
201
1
Oct
201
2
Oct
201
3
Sulfate Total Upper Limit Lower Limit
Note: the AWQS may not be shown in order to allow greater visual detail of measured values for trend analysis
248

●●
●
●
●
●
●
●
● ●
●
●
●●
020
050
0
Site 13 − Hardnessm
g/L
2009
2010
2011
2012
2013
●
●
●
●
●
●
●
●
● ●
●
●
●●
020
040
060
080
010
00
mg/
L
Oct
200
9
Oct
201
0
Oct
201
1
Oct
201
2
Oct
201
3
Hardness Upper Limit Lower Limit
Note: the AWQS may not be shown in order to allow greater visual detail of measured values for trend analysis
249

●
●
●
●● ●
●
●●
●● ●
●
●0.
000.
15
Site 13 − Arsenic Dissolvedµg
/L
2009
2010
2011
2012
2013
● ● ● ● ● ●●
● ● ● ● ●●●
02
46
810
µg/L
Oct
200
9
Oct
201
0
Oct
201
1
Oct
201
2
Oct
201
3
Arsenic Dissolved Upper Limit Lower Limit
Note: the AWQS may not be shown in order to allow greater visual detail of measured values for trend analysis
250

●
●
●
●
●
●
●●
●
●●0
1020
Site 13 − Barium Dissolvedµg
/L
2009
2010
2011
2012
2013
●
●●
●
●●
● ●●
●●
050
100
150
200
µg/L
Oct
200
9
Oct
201
0
Oct
201
1
Oct
201
2
Oct
201
3
Barium Dissolved Upper Limit Lower Limit
Note: the AWQS may not be shown in order to allow greater visual detail of measured values for trend analysis
251

● ● ● ● ● ● ● ● ● ● ● ●
●
●0
48
Site 13 − Cadmium Dissolvedµg
/L
2009
2010
2011
2012
2013
●● ●
●
●
● ●
●● ● ● ●
0.0
0.1
0.2
0.3
0.4
0.5
µg/L
Oct
200
9
Oct
201
0
Oct
201
1
Oct
201
2
Oct
201
3
Cadmium Dissolved Upper Limit Lower Limit
Note: the AWQS may not be shown in order to allow greater visual detail of measured values for trend analysis
252

●
●
●
● ● ●●
●
●
●●02
46
8
Site 13 − Chromium Dissolvedµg
/L
2009
2010
2011
2012
2013
●
●
●
●●
●
●
●
●
●
●
02
46
810
µg/L
Oct
200
9
Oct
201
0
Oct
201
1
Oct
201
2
Oct
201
3
Chromium Dissolved Upper Limit Lower Limit
Note: the AWQS may not be shown in order to allow greater visual detail of measured values for trend analysis
253
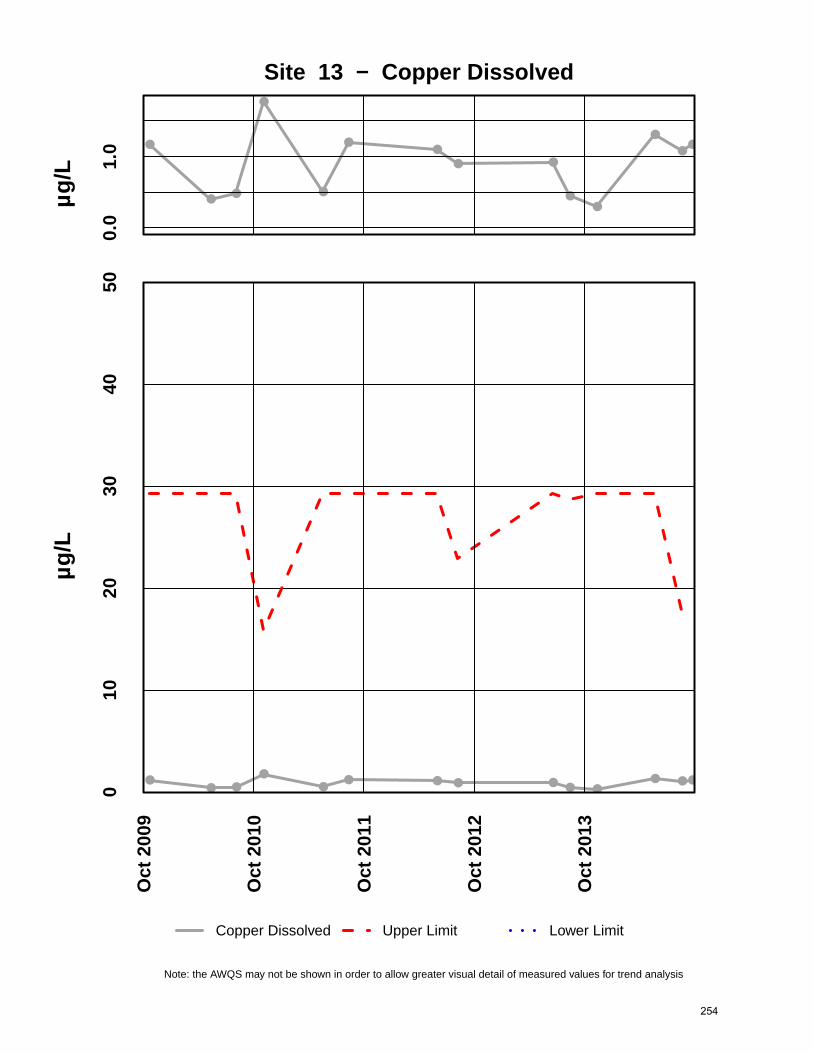
●
● ●
●
●
●●
● ●
●●
●
●●
0.0
1.0
Site 13 − Copper Dissolvedµg
/L
2009
2010
2011
2012
2013
●● ●
●●
● ● ● ● ● ●● ●●
010
2030
4050
µg/L
Oct
200
9
Oct
201
0
Oct
201
1
Oct
201
2
Oct
201
3
Copper Dissolved Upper Limit Lower Limit
Note: the AWQS may not be shown in order to allow greater visual detail of measured values for trend analysis
254

● ● ● ● ● ● ● ● ● ● ● ●
●
●0
24
Site 13 − Lead Dissolvedµg
/L
2009
2010
2011
2012
2013
● ● ● ● ● ● ● ● ● ● ● ●
●
●
02
46
810
µg/L
Oct
200
9
Oct
201
0
Oct
201
1
Oct
201
2
Oct
201
3
Lead Dissolved Upper Limit Lower Limit
Note: the AWQS may not be shown in order to allow greater visual detail of measured values for trend analysis
255

● ● ●●
●●
●
●●
●
●0
48
12
Site 13 − Nickel Dissolvedµg
/L
2009
2010
2011
2012
2013
● ●
●
●
●
●
●
●
●
●
●
02
46
810
1214
µg/L
Oct
200
9
Oct
201
0
Oct
201
1
Oct
201
2
Oct
201
3
Nickel Dissolved Upper Limit Lower Limit
Note: the AWQS may not be shown in order to allow greater visual detail of measured values for trend analysis
256

● ● ● ● ● ● ● ● ●
●
●
0.00
00.
002
0.00
4 Site 13 − Silver Dissolvedµg
/L
2009
2010
2011
2012
2013
● ● ● ● ● ● ● ● ● ●●05
1015
2025
30
µg/L
Oct
200
9
Oct
201
0
Oct
201
1
Oct
201
2
Oct
201
3
Silver Dissolved Upper Limit Lower Limit
Note: the AWQS may not be shown in order to allow greater visual detail of measured values for trend analysis
257

● ● ● ● ● ● ● ● ● ● ● ●
●
●0
1000
2500
Site 13 − Zinc Dissolvedµg
/L
2009
2010
2011
2012
2013
●
●
●
●
●
●
●
●
●
●
●●
020
4060
80
µg/L
Oct
200
9
Oct
201
0
Oct
201
1
Oct
201
2
Oct
201
3
Zinc Dissolved Upper Limit Lower Limit
Note: the AWQS may not be shown in order to allow greater visual detail of measured values for trend analysis
258

●● ●
●
●
●
●
●
●
●
●0.
00.
20.
4
Site 13 − Selenium Dissolvedµg
/L
2009
2010
2011
2012
2013
● ● ●
●
●●
●
●
●
●
●
01
23
45
µg/L
Oct
200
9
Oct
201
0
Oct
201
1
Oct
201
2
Oct
201
3
Selenium Dissolved Upper Limit Lower Limit
Note: the AWQS may not be shown in order to allow greater visual detail of measured values for trend analysis
259

● ● ●
●
● ●
●
●
● ●● ●
●●
0.00
000.
0020
Site 13 − Mercury Dissolvedµg
/L
2009
2010
2011
2012
2013
● ● ●
●
● ●
●
●
● ●● ●
●●
0.00
00.
002
0.00
40.
006
0.00
80.
010
0.01
2
µg/L
Oct
200
9
Oct
201
0
Oct
201
1
Oct
201
2
Oct
201
3
Mercury Dissolved Upper Limit Lower Limit
Note: the AWQS may not be shown in order to allow greater visual detail of measured values for trend analysis
260

INTERPRETIVE REPORT SITE 27 The data collected during the current water year are listed in the following “Table of Results for Water Year 2014” report. The table includes all the required FWMP analyte data (field and laboratory) collected for the current water year and a series of flags keyed to the summary report “Qualified Data by QA Reviewer”. The QA report lists any associated data limitations found during the monthly QA reviews of laboratory data for this site. Median values for all analytes have been calculated and are shown in the right-most column of the table of results. Any value reported as less than MDL has been replaced with a value of ½ MDL for the purpose of median calculation. All data collected at this site for the past six years are included in the data analyses. As shown in the table below, there were no data outliers.
Sample Date Parameter Value Qualifier Notes No outliers have been identified by HGCMC for the period of October 2008 through September 2014.
The data for Water Year 2014 have been compared to the strictest fresh water quality criterion for each applicable analyte. Three samples exceeding these criteria have been identified, as listed in the table below. The exceedances were for field pH values which are below the lower limit of 6.5 su listed in the AWQS. Values for field pH from other wells completed into organic rich peat sediments similar to Site 27 have historically resulted in pH values ranging from 5 to 6 su (e.g. Sites 58, 29, and 32). All of the other analytes were within AWQS for the current water year.
X-Y plots have been generated to graphically present the data for each of the analytes requested in the Statistical Information Goals for this site. These plots have been visually analyzed for the appearance of any trend in concentration. Visually the increasing trend in total sulfate values, which started in 2008, has since ‘leveled’ off. The maximum value recorded was 34.8mg/L in October 2009, during the current water year the mean value recorded was 9.2 µg/L which is slightly more than doubled from the 2006 through 2008 water years. Non-parametric statistical analyses were performed for specific conductivity, field pH, total alkalinity, total sulfate, and dissolved zinc. Calculation details of the Seasonal Kendall analyses
Lower Upper
12-May-14 pH Field 5.87 su 6.5 8.515-Jul-14 pH Field 6.1 su 6.5 8.5
17-Sep-14 pH Field 6.21 su 6.5 8.5
Table of Exceedance for Water Year 2014
Sample Date Parameter Value
LimitsHardness
261

are presented in detail on the pages following this interpretive section. The below table summarizes the results on the data collected between Oct-08 and Sep-14(WY2009-WY2014).
For datasets with a statistically significant trend (α/2=2.5%) a Seasonal-Sen’s Slope estimate statistic has also been calculated. The dataset for total alkalinity has a statistically significant (p <0.01) trend with a slope estimate of 3.07mg/L/yr or a 9.9% increase over the last 6 years. Over the same period dissolved the statistically significant trend with dissolved zinc was decreasing by 0.48 mg/L /yr. With the changes that were made to the FWMP monitoring schedule (i.e. increase sampling frequency), HGCMC feels that the FWMP program is sufficient to monitor further changes, before the AWQS are exceeded. An intra-well analysis was performed using combined Shewhart-CUSUM charts for conductivity, dissolved zinc, and total sulfate. Table 1 contains a summary of the baseline statistics along with the control limits used.
Table 1. Specific Conductance, Dissolved Zinc, and Total Sulfate Baseline Periods, Summary Statistics and Various Control Limits
Site 27 Site 27 Site 27
Conductivity
(µS/cm) Diss. Zinc
(µg/L) Total Sulfate
(mg/L) Baseline Statistics Baseline Period 09/18/01-05/18/04 09/18/01-05/18/04 09/17/02-09/21/04 Number of Samples 6 6 5 Mean (x) 95.88 2.78 1.56 Standard Deviation 6.43 1.42 0.43 Shewhart-CUSUM Control Limits (SCL) Control Limit (mean x+ 2s) 108.6 5.6 2.4 Control Limit (mean x + 3s) 115.5 7.0 2.8 Control Limit (mean x + 4s) 122.3 8.4 3.3 Control Limit (mean x + 4.5s) 125.7 9.2 3.5 CUSUM Control Limits Cumulative increase – h 5 5 5
Mann-Kendall test statistics Sen's slope estimaten* p** Trend Q Q(%)
Conductivity Field 6 0.50pH Field 6 0.16Alkalinity, Total 6 <0.01 + 3.067 9.9Sulfate, Total 6 0.08Zinc, Dissolved 6 0.01 - -0.477 -29.8* Number of Years ** Significance level
Table of Summary Statistics for Trend Analysis
Parameter
262

Figure 1 shows the three analytes examined eventually went out of control. Total sulfate went out of control during the water year 2008. This has been discussed in previous reports and is related to the material that was placed to the east of Pond 7 to form a pad. The fill material originated from the North End expansion of the tailings facility and from the figure it appears that there was some easily weathered sulfide mineralogy in the freshly blasted material. Total sulfate concentration initially continued to rise, but now are trending downward. This is captured in the decreasing slope of the CUSUM values; as the values return to pre-disturbance conditions the CUSUM value will flatten off. As discussed with other sites it can take a long time to bring the value back below the limit. Specific conductance also went out of control in water 2008 as would be expected with the increase in total sulfate driving the increase in conductivity. Dissolved zinc went out of control beginning in water year 2007. After the first increase in water year 2007 concentrations returned to near baseline levels resulting in the flattening of the CUSUM values. Then water years 2010 and 2011 each had dissolved zinc concentrations that further increased the CUSUM value. Since the fall of 2011 the CUSUM measurement has been trending downward indicating that the concentrations are around the baseline mean.
263

-20
-10
0
10
20
30
40
50
60
70
80
0
20
40
60
80
100
120
140
160
180
200
CUSU
M
Spec
ific C
ondu
ctan
ce (µ
S/cm
)Figure 1. Observed Measurements for Specific Conductance, Dissolved Zinc, and Total Sulfate
from Site 27 Compared to the Shewhart-CUSUM Control Limits From Table 1
-15
5
25
45
65
85
105
125
0
10
20
30
40
50
60
70
Diss
olve
d Zi
nc (µ
g/L)
CUSU
M
-100
0
100
200
300
400
500
600
0
5
10
15
20
25
30
35
40
Oct
-00
Oct
-01
Oct
-02
Oct
-03
Oct
-04
Oct
-05
Oct
-06
Oct
-07
Oct
-08
Oct
-09
Oct
-10
Oct
-11
Oct
-12
Oct
-13
Tota
l Sul
fate
(µg
/L)
CUSU
M
Mean Analyte Baseline Limits CUSUM CUSUM
264

Sample Date/Parameter Oct 2013 Nov 2013 Dec 2013 Jan 2014 Feb 2014 Mar 2014 Apr 2014 May 2014 Jun 2014 Jul 2014 Aug 2014 Sep 2014 MedianWater Temp (°C) 5.1 7.9 13.2 11.1 9.5Conductivity-Field(µmho) 114 117 120 107.1 115.5Conductivity-Lab (µmho) 105 112 101 94 103pH Lab (standard units) 5.98 5.74 5.87 6.01 5.93pH Field (standard units) 6.58 5.87 6.1 6.21 6.16Total Alkalinity (mg/L) 36.5 31.1 37.1 35.6 36.1Total Sulfate (mg/L) 8.8 14.7 7.1 6 8.0Hardness (mg/L) 29.6 29.9 29 28.2 29.3Dissolved As (ug/L) 3.16 4.1 4.3 3.88 3.990Dissolved Ba (ug/L) 32.7 40.1 34.1 38.2 36.2Dissolved Cd (ug/L) 0.0018 0.0018 0.0018 0.0018 0.0018Dissolved Cr (ug/L) 0.987 1.21 1.45 1.4 1.305Dissolved Cu (ug/L) 0.096 0.098 0.108 0.106 0.102Dissolved Pb (ug/L) 0.0545 0.115 0.207 0.124 0.1195Dissolved Ni (ug/L) 0.592 0.618 0.632 0.58 0.605Dissolved Ag (ug/L) 0.002 0.002 0.002 0.002 0.002Dissolved Zn (ug/L) 1.1 0.89 1.75 1.69 1.40Dissolved Se (ug/L) 0.227 0.083 0.223 0.133 0.178Dissolved Hg (ug/L) 0.000561 0.00034 0.000505 0.000648 0.000533
For individual sample/analyte qualifier descriptions see "Qualified Data by QA Reviewer" table.Values reported as less than MDL are replaced by 1/2 MDL for median calculation purposes.Shaded data has been qualified as an outlier by HGCMC and removed from any further analysis and is not included into the calculation of the median
Table of Results for Water Year 2014
Site 027FMG - 'Monitoring Well - 2S'
265

Date Range: 10/01/2013 to 09/30/2014
Site No. Sample Date Sample Time Parameter Value Qualifier Reason for Qualifier
Qualified Data by QA Reviewer
027FMG 11/11/2013 12:00 PM Diss. Hg-CVAF 0.000283 J Below Quantitative Range
pH 7.58 J Hold Time Violation
027FMG 11/18/2013 12:00 PM Diss. Se-ICP/MS 0.22 J Below Quantitative Range
027FMG 5/12/2014 12:00 PM Alkalinity 31.1 U Trip Blank Contamination
Conductivity 112 U Trip Blank Contamination
Diss. Se-ICP/MS 0.08 J Below Quantitative Range
Sulfate 14.7 J Sample Receipt Temperature
027FMG 7/15/2014 12:00 PM Diss. Se-ICP/MS 0.22 J Below Quantitative Range
027FMG 9/17/2014 12:00 PM Diss. Se-ICP/MS 0.13 J Below Quantitative Range
266

●
● ●
●●
●
●
●●
● ●
● ●
●●
●
●
●
●0
48
12
Site 27 − Water Temperature°C
2009
2010
2011
2012
2013
●
●●
●
●
●
●
●
●
●
●
●●
●
●
●
●
●
●
05
1015
20
°C
Oct
200
9
Oct
201
0
Oct
201
1
Oct
201
2
Oct
201
3
Water Temperature Upper Limit Lower Limit
Note: the AWQS may not be shown in order to allow greater visual detail of measured values for trend analysis
267

● ●●
●
●
●
●●
●
●● ●
●● ●
● ●●
●
050
150
Site 27 − Conductivity LaboratoryµS
/cm
2009
2010
2011
2012
2013
● ●
●
●
●
●
●●
●
●
● ●
●
●●
●●
●●
010
020
030
040
050
0
µS/c
m
Oct
200
9
Oct
201
0
Oct
201
1
Oct
201
2
Oct
201
3
Conductivity Laboratory Upper Limit Lower Limit
Note: the AWQS may not be shown in order to allow greater visual detail of measured values for trend analysis
268

● ●●
●
●
●
●●
●
●
●●
●
● ●● ● ●
●
050
150
Site 27 − Conductivity FieldµS
/cm
2009
2010
2011
2012
2013
● ●
●
●
●
●
●●
●
●
●
●●
● ●● ● ●
●
010
020
030
040
050
0
µS/c
m
Oct
200
9
Oct
201
0
Oct
201
1
Oct
201
2
Oct
201
3
Conductivity Field Upper Limit Lower Limit
Note: the AWQS may not be shown in order to allow greater visual detail of measured values for trend analysis
269

●
●
●●
●
● ●
● ●
●
●●
●● ● ●
●●
●
5.0
6.0
Site 27 − pH Laboratorysu
2009
2010
2011
2012
2013
●
●
●●
●
● ●
● ●
●
●
●
●● ● ●
●●
●
45
67
89
su
Oct
200
9
Oct
201
0
Oct
201
1
Oct
201
2
Oct
201
3
pH Laboratory Upper Limit Lower Limit
Note: the AWQS may not be shown in order to allow greater visual detail of measured values for trend analysis
270

● ●
● ● ●
●
●
●
●
●●
● ●
●●
●
●
●●
5.0
6.0
7.0
Site 27 − pH Fieldsu
2009
2010
2011
2012
2013
●●
● ● ●
●
●
●
●
●
●
●●
●
●
●
●
●●
45
67
89
su
Oct
200
9
Oct
201
0
Oct
201
1
Oct
201
2
Oct
201
3
pH Field Upper Limit Lower Limit
Note: the AWQS may not be shown in order to allow greater visual detail of measured values for trend analysis
271

● ●
●
● ●
●
●●
●
● ●●
●
●
●●
●
●●
2030
4050
Site 27 − Alkalinitym
g/L
2009
2010
2011
2012
2013
● ●
●
● ●
●
● ●●
● ●●
●
●
●●
●
● ●
020
4060
8010
012
014
0
mg/
L
Oct
200
9
Oct
201
0
Oct
201
1
Oct
201
2
Oct
201
3
Alkalinity Upper Limit Lower Limit
Note: the AWQS may not be shown in order to allow greater visual detail of measured values for trend analysis
272

●
●
●●
●
●
●
●
●
● ●
●●
●
●
●
●
●●
010
20
Site 27 − Sulfate Totalm
g/L
2009
2010
2011
2012
2013
●
●
●
●
●
●
●
●
●●
●
●
●
●
●
●
●
●
02
46
810
1214
mg/
L
Oct
200
9
Oct
201
0
Oct
201
1
Oct
201
2
Oct
201
3
Sulfate Total Upper Limit Lower Limit
Note: the AWQS may not be shown in order to allow greater visual detail of measured values for trend analysis
273

● ●●
●●
●
● ● ●●
●●
● ●● ● ● ● ●
020
40
Site 27 − Hardnessm
g/L
2009
2010
2011
2012
2013
● ●●
●●
●
● ● ●●
●●
● ●● ● ● ● ●
050
100
150
200
mg/
L
Oct
200
9
Oct
201
0
Oct
201
1
Oct
201
2
Oct
201
3
Hardness Upper Limit Lower Limit
Note: the AWQS may not be shown in order to allow greater visual detail of measured values for trend analysis
274

●
● ●●
●
●
●●
●●
●
●
●
●
●
●
● ●●
02
46
Site 27 − Arsenic Dissolvedµg
/L
2009
2010
2011
2012
2013
●● ●
● ●
●●
●● ●
●
●
●
●
●
●● ● ●
010
2030
40
µg/L
Oct
200
9
Oct
201
0
Oct
201
1
Oct
201
2
Oct
201
3
Arsenic Dissolved Upper Limit Lower Limit
Note: the AWQS may not be shown in order to allow greater visual detail of measured values for trend analysis
275

●●
●
●●
●● ●
●
● ● ●
●●
●
●
●
●●
020
40
Site 27 − Barium Dissolvedµg
/L
2009
2010
2011
2012
2013
●
●
●
●
●
●
●●
●
●● ●
●
●
●
●
●
●
●
020
4060
80
µg/L
Oct
200
9
Oct
201
0
Oct
201
1
Oct
201
2
Oct
201
3
Barium Dissolved Upper Limit Lower Limit
Note: the AWQS may not be shown in order to allow greater visual detail of measured values for trend analysis
276
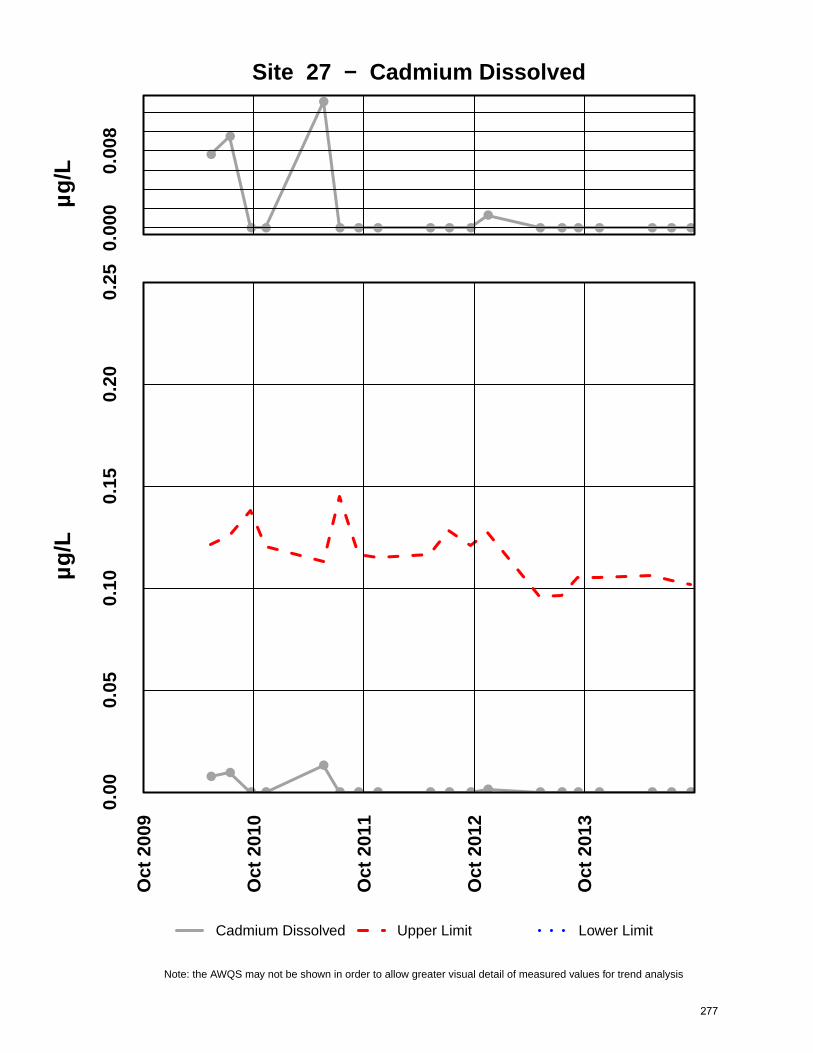
●
●
● ●
●
● ● ● ● ● ●●
● ● ● ● ● ● ●
0.00
00.
008
Site 27 − Cadmium Dissolvedµg
/L
2009
2010
2011
2012
2013
● ●
● ●
●
● ● ● ● ● ● ● ● ● ● ● ● ● ●
0.00
0.05
0.10
0.15
0.20
0.25
µg/L
Oct
200
9
Oct
201
0
Oct
201
1
Oct
201
2
Oct
201
3
Cadmium Dissolved Upper Limit Lower Limit
Note: the AWQS may not be shown in order to allow greater visual detail of measured values for trend analysis
277

●
● ● ●
●● ● ● ● ●
●
●● ●
●
●●
● ●
0.0
1.5
3.0
Site 27 − Chromium Dissolvedµg
/L
2009
2010
2011
2012
2013
●
● ● ●
●● ● ● ● ●
●
●● ●
●
●●
● ●
02
46
810
µg/L
Oct
200
9
Oct
201
0
Oct
201
1
Oct
201
2
Oct
201
3
Chromium Dissolved Upper Limit Lower Limit
Note: the AWQS may not be shown in order to allow greater visual detail of measured values for trend analysis
278
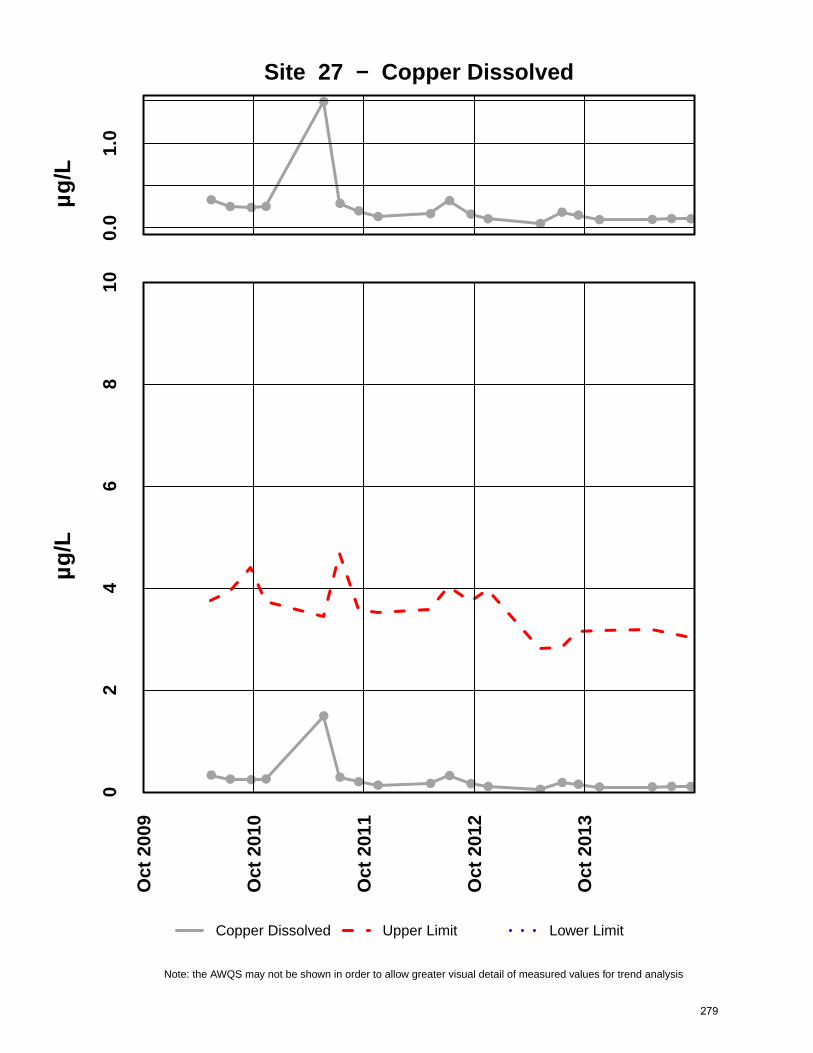
●● ● ●
●
●● ● ●
●● ● ●
● ● ● ● ● ●
0.0
1.0
Site 27 − Copper Dissolvedµg
/L
2009
2010
2011
2012
2013
● ● ● ●
●
● ● ● ●●
● ● ●● ● ● ● ● ●0
24
68
10
µg/L
Oct
200
9
Oct
201
0
Oct
201
1
Oct
201
2
Oct
201
3
Copper Dissolved Upper Limit Lower Limit
Note: the AWQS may not be shown in order to allow greater visual detail of measured values for trend analysis
279

●●
●
● ● ●● ●
● ●
●
● ●●
● ●●
●●
0.0
0.4
0.8
Site 27 − Lead Dissolvedµg
/L
2009
2010
2011
2012
2013
●●
●
● ● ●● ●
● ●●
● ●● ● ● ●
●●0
12
34
56
7
µg/L
Oct
200
9
Oct
201
0
Oct
201
1
Oct
201
2
Oct
201
3
Lead Dissolved Upper Limit Lower Limit
Note: the AWQS may not be shown in order to allow greater visual detail of measured values for trend analysis
280

●
●●
●● ●
●
●
● ●
●
●●
●
●
● ● ● ●
0.0
1.0
Site 27 − Nickel Dissolvedµg
/L
2009
2010
2011
2012
2013
●● ●
● ● ●
●
●● ●
●● ● ●
●● ● ● ●
02
46
810
1214
µg/L
Oct
200
9
Oct
201
0
Oct
201
1
Oct
201
2
Oct
201
3
Nickel Dissolved Upper Limit Lower Limit
Note: the AWQS may not be shown in order to allow greater visual detail of measured values for trend analysis
281

● ● ● ● ● ● ● ●
●
● ●
●
● ● ● ● ● ● ●
0.00
000.
0020
Site 27 − Silver Dissolvedµg
/L
2009
2010
2011
2012
2013
● ● ● ● ● ● ● ● ● ● ● ● ● ● ● ● ● ● ●01
23
45
6
µg/L
Oct
200
9
Oct
201
0
Oct
201
1
Oct
201
2
Oct
201
3
Silver Dissolved Upper Limit Lower Limit
Note: the AWQS may not be shown in order to allow greater visual detail of measured values for trend analysis
282

●
●
● ●
●
● ● ● ● ● ● ● ● ● ● ● ● ● ●020
40
Site 27 − Zinc Dissolvedµg
/L
2009
2010
2011
2012
2013
●
●
● ●
●
●● ● ● ● ● ● ● ● ● ● ● ● ●0
2040
6080
100
120
µg/L
Oct
200
9
Oct
201
0
Oct
201
1
Oct
201
2
Oct
201
3
Zinc Dissolved Upper Limit Lower Limit
Note: the AWQS may not be shown in order to allow greater visual detail of measured values for trend analysis
283

● ● ●
●
●●
●
●
●
●
●
●
●
● ●●
●
●
●
0.00
0.15
0.30
Site 27 − Selenium Dissolvedµg
/L
2009
2010
2011
2012
2013
● ● ●
●
● ●
●
●●
●● ●
● ● ● ●
●●
●
01
23
45
µg/L
Oct
200
9
Oct
201
0
Oct
201
1
Oct
201
2
Oct
201
3
Selenium Dissolved Upper Limit Lower Limit
Note: the AWQS may not be shown in order to allow greater visual detail of measured values for trend analysis
284

●●
● ●
●
●●
●●
●● ●
●
●
●● ● ● ●
0.00
00.
004
Site 27 − Mercury Dissolvedµg
/L
2009
2010
2011
2012
2013
●
●
● ●
●
●●
●●
●
● ●
●
●
●●
●● ●
0.00
00.
002
0.00
40.
006
0.00
80.
010
0.01
2
µg/L
Oct
200
9
Oct
201
0
Oct
201
1
Oct
201
2
Oct
201
3
Mercury Dissolved Upper Limit Lower Limit
Note: the AWQS may not be shown in order to allow greater visual detail of measured values for trend analysis
285

INTERPRETIVE REPORT SITE 29 The data collected during the current water year are listed in the following “Table of Results for Water Year 2014” report. The table includes all the required FWMP analyte data (field and laboratory) collected for the current water year and a series of flags keyed to the summary report “Qualified Data by QA Reviewer”. The QA report lists any associated data limitations found during the monthly QA reviews of laboratory data for this site. Median values for all analytes have been calculated and are shown in the right-most column of the table of results. Any value reported as less than MDL has been replaced with a value of ½ MDL for the purpose of median calculation. All data collected at this site for the past six years are included in the data analyses. As shown in the table below, there were no data outliers.
Sample Date Parameter Value Qualifier Notes No outliers have been identified by HGCMC for the period of October 2008 through September 2014.
The data for Water Year 2014 have been compared to the strictest fresh water quality criterion for each applicable analyte. Several results exceeding these criteria have been identified, as listed in the table below.
Four of these records are for field pH with values below the lower limit of 6.5 su listed in AWQS. Field pH from other wells completed in organic rich peat sediments similar to Site 29
Lower Upper
12-Nov-13 Alkalinity 16.2 mg/L 20 012-May-14 Alkalinity 17.7 mg/L 20 0
15-Jul-14 Alkalinity 16.8 mg/L 20 017-Sep-14 Alkalinity 15.8 mg/L 20 015-Jul-14 Arsenic Dissolved 18.1 µg/L 0 10.0
12-Nov-13 Lead Dissolved 0.798 µg/L 0 0.5 19.3 mg/L15-Jul-14 Lead Dissolved 0.787 µg/L 0 0.5 18.7 mg/L
17-Sep-14 Lead Dissolved 0.574 µg/L 0 0.5 19 mg/L12-Nov-13 pH Field 5.3 su 6.5 8.512-May-14 pH Field 5.18 su 6.5 8.5
15-Jul-14 pH Field 5.42 su 6.5 8.517-Sep-14 pH Field 5.37 su 6.5 8.5
Table of Exceedance for Water Year 2014
Sample Date Parameter Value
LimitsHardness
286

have historically resulted in pH values ranging from 5 to 6 su (e.g. Sites 58, 27, and 32). Four other exceedances were for total alkalinity below the lower limit of 20 mg/L. Though dissolved lead had dropped below the AWQS in Water Year 2013, three of the four samples this water year were in exceedance. Dissolved zinc also increased however it remained below the AWQS limit. The most probable mechanism for dispersal of the lead, zinc, and potentially other metals away from the tailings pile would be as fugitive tailings dust transported during cold, descanting winds during winter or due to dust induced by truck traffic during dry summer conditions.
The changes in these analytes may reflect the changing topography of the tails dry stack facility. After the northeast expansion was completed in 2008 HGCMC commenced to place the majority of the tailings in the northeast region. For a couple of years the northeast was mostly bowl shaped and below the tree line. During the last couple of years this area stopped being a bowl and has been brought up in elevation. With the increase in elevation this area is not as protected from the winds that predominantly prevail from the northeast. Dispersal of fugitive dust from this region would be to the southwest towards Site 29 and Site 32. In Water Year 2014 tailings were not only placed in the northwest, but also in central western portion of the facility. This area is more directly upwind from the monitoring site. In 2011 HGCMC implemented a biweekly dust monitoring program to support the snow monitoring program. This program has continued into 2013 and the results from this monitoring are summarized in the 2014 Tailings and Waste Rock Annual Report and will also be presented at the annual meeting in July 2015. The July sample for arsenic was also in exceedance. Arsenic values over the past five years have ranged from ~3 µg/L to ~10 µg/L. This exceedance for 18.1 µg/L appears anomalous and could be associated with underlining marine sediments. X-Y plots have been generated to graphically present the data for each of the analytes requested in the Statistical Information Goals for this site. These plots have been visually analyzed for the appearance of any trend in concentration. There appears to be no obvious visually trends. A non-parametric statistical analysis for trend was performed for specific conductivity, field pH, total alkalinity, total sulfate, and dissolved zinc. Calculation details of the Seasonal Kendall analyses are presented in detail on the pages following this interpretive section. The following table summarizes the results on the data collected between Oct-08 and Sep-14(WY2009-WY2014). No statistically significant trends were found with the trend analysis.
287

Trend analysis was not performed on the total sulfate dataset because of a change in the method detection limit used by the analytical laboratories. A primary assumption of the Mann-Kendall test is “… only one censoring threshold exists. When more than one detection limit exists, the Mann-Kendall test cannot be performed without further censoring the data.” In order to prevent this from occurring HGCMC has worked to establish a consistent MDL for sulfate from the laboratory. With the discontinuation of sampling at Site 58 during Water Year 2013, an inter-well comparison is no longer feasible. Instead an intra-well analysis was performed using combined Shewhart-CUSUM charts for conductivity, dissolved zinc, and alkalinity. Table 1 contains a summary of the baseline statistics along with the control limits used.
Table 1. Specific Conductance, Dissolved Zinc, and Total Sulfate Baseline Periods, Summary Statistics and Various Control Limits
Site 29 Site 29 Site 29
Conductivity
(µS/cm) Diss. Zinc
(µg/L) Alkalinity (mg/L)
Baseline Statistics Baseline Period 05/11/00-09/15/05 05/11/00-09/15/05 04/27/95-09/13/00 Number of Samples 12 12 5 Mean (x) 122.27 3.60 1.56 Standard Deviation 24.8 1.35 0.43 Shewhart-CUSUM Control Limits (SCL) Control Limit (mean x+ 2s) 171.9 6.3 2.4 Control Limit (mean x + 3s) 196.7 7.6 2.8 Control Limit (mean x + 4s) 221.4 9.0 3.3 Control Limit (mean x + 4.5s) 233.8 9.7 3.5 CUSUM Control Limits Cumulative increase – h 5 5 5
Mann-Kendall test statistics Sen's slope estimaten* p** Trend Q Q(%)
Conductivity Field 6 0.16pH Field 6 0.29Alkalinity, Total 6 0.46Sulfate, Total 6Zinc, Dissolved 6 0.05* Number of Years ** Significance level
Table of Summary Statistics for Trend Analysis
Parameter
Inconsistent detection limits
288

Site 29 was installed in 1988 and has an extensive sampling history, however establishing a baseline has been difficult. Since the installation of the well a number of the monitored parameters (i.e. alkalinity, specific conductance, total sulfate, and etc…) have been in constant flux. Because the CUSUM process compares the mean and standard deviation of the chosen baseline to the collected data it is possible to detect continual changes in the analytes without having a background data set. After reviewing the data for the three parameters, data periods were chosen based upon the data having a period of minimal flux. This period was then used for the calculation of the baseline statistics. All three of the parameters examined (Figure 1) eventually went out of control with respects to the chosen baseline data statistics. If the pore/contact water from inside the facility was not contained, the well water would have high conductivity, high dissolved zinc, and high alkalinity. Two of the three charts in figure 1 have long term decreasing trends; it is dissolved zinc that has periodically had higher values. As previously discussed it is hypothesized that the increase in dissolved zinc results from the accumulation of fugitive dust in the snow pack during the winter. In the spring when the snow pack melts this material is released as a pulse. Most years the deposited material is not present by the fall sampling. With the implementation of additional best management practices, HGCMC expects to decrease the amount of fugitive dust leaving the tailings disposal facility. The long term decreasing trends in specific conductance and alkalinity are potentially the result of the weathering of the rock originally used to build the tailings facility. In recent years HGCMC has reported on water chemistry changes in the FWMP directly related to construction activities in the tailings facility. As previously discussed in the report, with regards to Site 27, there was an increase in total sulfate and conductivity after the pad was built east of Pond 7. In the 5-6years after this pad was built the values for these parameters are still elevated though trending towards pre–disturbance conditions. A similar sort of change was also recorded at Site 60 after the construction of Pond 7. Until the pump back collection system was brought online there were substantial increases for specific conductivity and alkalinity at Site 60. These are two examples of where the construction of the improvement has resulted in changes to the water chemistry. Therefore, the decreasing trends in alkalinity and specific conductance seen at Site 29 are potentially the result of weathering of the initial improvements made in the area for tailings disposal.
289

-40
-35
-30
-25
-20
-15
-10
-5
0
5
10
0
20
40
60
80
100
120
140
160
180
200
CUSU
M
Spec
ific C
ondu
ctan
ce (µ
S/cm
)Figure 1. Observed Measurements for Specific Conductance, Dissolved Zinc, and Alkalinity
from Site 29 Compared to the Shewhart-CUSUM Control Limits From Table 1
-100
-80
-60
-40
-20
0
20
40
60
80
100
0
10
20
30
40
50
60
Diss
olve
d Zi
nc (µ
g/L)
CUSU
M
-80
-70
-60
-50
-40
-30
-20
-10
0
10
0
20
40
60
80
100
120
Oct
-94
Oct
-95
Oct
-96
Oct
-97
Oct
-98
Oct
-99
Oct
-00
Oct
-01
Oct
-02
Oct
-03
Oct
-04
Oct
-05
Oct
-06
Oct
-07
Oct
-08
Oct
-09
Oct
-10
Oct
-11
Oct
-12
Oct
-13
Alka
linity
(m
g/L)
CUSU
M
Mean Analyte Baseline Limits CUSUM CUSUM
290
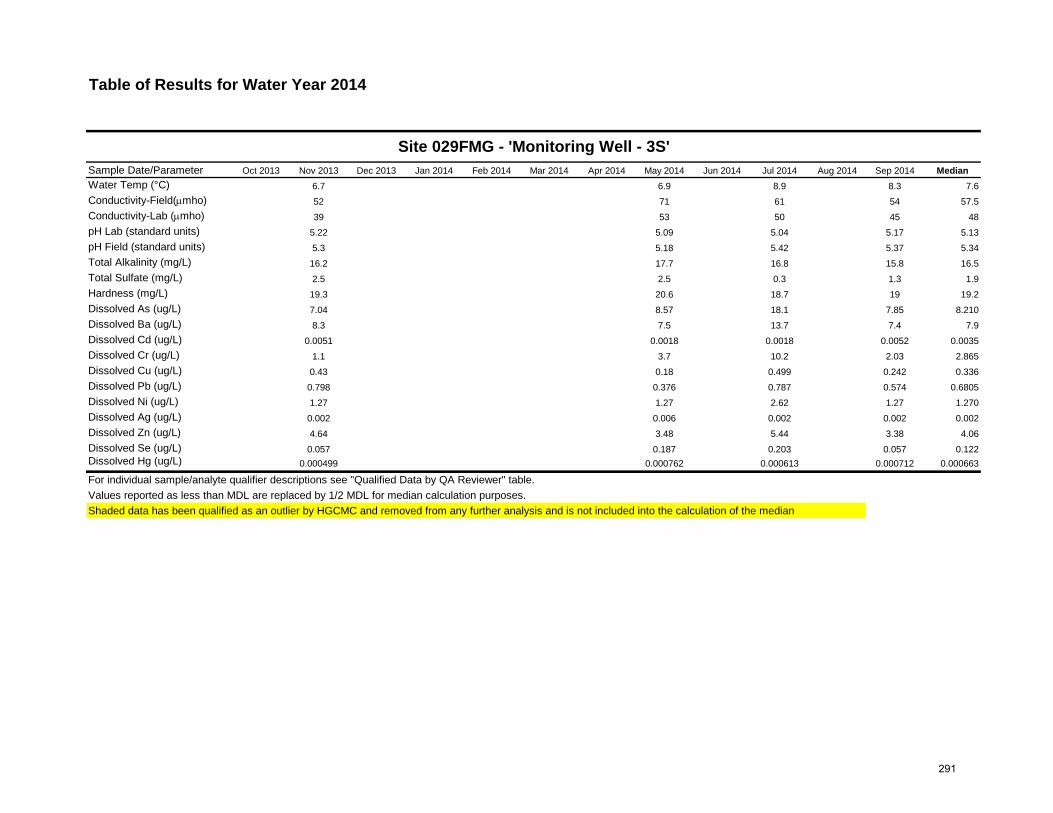
Sample Date/Parameter Oct 2013 Nov 2013 Dec 2013 Jan 2014 Feb 2014 Mar 2014 Apr 2014 May 2014 Jun 2014 Jul 2014 Aug 2014 Sep 2014 MedianWater Temp (°C) 6.7 6.9 8.9 8.3 7.6Conductivity-Field(µmho) 52 71 61 54 57.5Conductivity-Lab (µmho) 39 53 50 45 48pH Lab (standard units) 5.22 5.09 5.04 5.17 5.13pH Field (standard units) 5.3 5.18 5.42 5.37 5.34Total Alkalinity (mg/L) 16.2 17.7 16.8 15.8 16.5Total Sulfate (mg/L) 2.5 2.5 0.3 1.3 1.9Hardness (mg/L) 19.3 20.6 18.7 19 19.2Dissolved As (ug/L) 7.04 8.57 18.1 7.85 8.210Dissolved Ba (ug/L) 8.3 7.5 13.7 7.4 7.9Dissolved Cd (ug/L) 0.0051 0.0018 0.0018 0.0052 0.0035Dissolved Cr (ug/L) 1.1 3.7 10.2 2.03 2.865Dissolved Cu (ug/L) 0.43 0.18 0.499 0.242 0.336Dissolved Pb (ug/L) 0.798 0.376 0.787 0.574 0.6805Dissolved Ni (ug/L) 1.27 1.27 2.62 1.27 1.270Dissolved Ag (ug/L) 0.002 0.006 0.002 0.002 0.002Dissolved Zn (ug/L) 4.64 3.48 5.44 3.38 4.06Dissolved Se (ug/L) 0.057 0.187 0.203 0.057 0.122Dissolved Hg (ug/L) 0.000499 0.000762 0.000613 0.000712 0.000663
For individual sample/analyte qualifier descriptions see "Qualified Data by QA Reviewer" table.Values reported as less than MDL are replaced by 1/2 MDL for median calculation purposes.Shaded data has been qualified as an outlier by HGCMC and removed from any further analysis and is not included into the calculation of the median
Table of Results for Water Year 2014
Site 029FMG - 'Monitoring Well - 3S'
291

Date Range: 10/01/2013 to 09/30/2014
Site No. Sample Date Sample Time Parameter Value Qualifier Reason for Qualifier
Qualified Data by QA Reviewer
029FMG 11/12/2013 12:00 PM Diss. Cd-ICP/MS 0.0051 J Below Quantitative Range
029FMG 5/12/2014 12:00 PM Alkalinity 17.7 U Trip Blank Contamination
Conductivity 52.7 U Trip Blank Contamination
Diss. Ag-ICP/MS 0.00576 J Below Quantitative Range
Diss. Se-ICP/MS 0.18 J Below Quantitative Range
Sulfate -5 UJ Sample Receipt Temperature
029FMG 7/15/2014 12:00 PM Diss. Se-ICP/MS 0.2 J Below Quantitative Range
029FMG 9/17/2014 12:00 PM Diss. Cd-ICP/MS 0.00517 J Below Quantitative Range
292

●
● ● ●
●
● ●
●
●●
● ●●
●● ● ●
●●
02
46
8
Site 29 − Water Temperature°C
2009
2010
2011
2012
2013
●
●● ●
●
● ●
●
●●
●●
●
●
●● ●
●
●
05
1015
20
°C
Oct
200
9
Oct
201
0
Oct
201
1
Oct
201
2
Oct
201
3
Water Temperature Upper Limit Lower Limit
Note: the AWQS may not be shown in order to allow greater visual detail of measured values for trend analysis
293

● ●
●●
●
●
●
●●
●
●
● ● ● ●●
● ●●
020
60
Site 29 − Conductivity LaboratoryµS
/cm
2009
2010
2011
2012
2013
● ●
● ●
●
●
●
●●
●
●
● ● ● ●●
● ●●
010
020
030
040
050
0
µS/c
m
Oct
200
9
Oct
201
0
Oct
201
1
Oct
201
2
Oct
201
3
Conductivity Laboratory Upper Limit Lower Limit
Note: the AWQS may not be shown in order to allow greater visual detail of measured values for trend analysis
294

● ●
● ●
●
●●
● ●
●
●
●
●
●
●
●
●
●●
020
60
Site 29 − Conductivity FieldµS
/cm
2009
2010
2011
2012
2013
● ●● ●
●● ●
● ●●
●●
●●
●●
●●
●
010
020
030
040
050
0
µS/c
m
Oct
200
9
Oct
201
0
Oct
201
1
Oct
201
2
Oct
201
3
Conductivity Field Upper Limit Lower Limit
Note: the AWQS may not be shown in order to allow greater visual detail of measured values for trend analysis
295

●
●● ●
●
●
●●
● ●
●● ●
●●
●● ●
●
4.0
5.0
6.0
Site 29 − pH Laboratorysu
2009
2010
2011
2012
2013
●
●
● ●
●
●
●
●
● ●
●
● ●
●●
●● ●
●
45
67
89
su
Oct
200
9
Oct
201
0
Oct
201
1
Oct
201
2
Oct
201
3
pH Laboratory Upper Limit Lower Limit
Note: the AWQS may not be shown in order to allow greater visual detail of measured values for trend analysis
296

●●
● ●●
●
●
●
●
● ●
●
●●
●
● ●● ●
4.0
5.0
6.0
Site 29 − pH Fieldsu
2009
2010
2011
2012
2013
●
●
●●
●
●
●
●
●
● ●
●
●●
●
●●
● ●
45
67
89
su
Oct
200
9
Oct
201
0
Oct
201
1
Oct
201
2
Oct
201
3
pH Field Upper Limit Lower Limit
Note: the AWQS may not be shown in order to allow greater visual detail of measured values for trend analysis
297

●●
● ●
●
●
●
●
●
●
●
● ● ●
●
●● ● ●
010
2030
Site 29 − Alkalinitym
g/L
2009
2010
2011
2012
2013
●●
● ●
●
●
●
●
●
●
●
● ● ●
●● ● ● ●
020
4060
8010
012
014
0
mg/
L
Oct
200
9
Oct
201
0
Oct
201
1
Oct
201
2
Oct
201
3
Alkalinity Upper Limit Lower Limit
Note: the AWQS may not be shown in order to allow greater visual detail of measured values for trend analysis
298

● ● ● ● ● ● ● ● ● ● ● ● ● ● ● ● ● ● ●
−1.0
0.0
1.0
Site 29 − Sulfate Totalm
g/L
2009
2010
2011
2012
2013
● ● ● ● ● ● ● ● ● ● ● ● ● ● ● ● ● ● ●02
46
810
1214
mg/
L
Oct
200
9
Oct
201
0
Oct
201
1
Oct
201
2
Oct
201
3
Sulfate Total Upper Limit Lower Limit
Note: the AWQS may not be shown in order to allow greater visual detail of measured values for trend analysis
299

●●
●●
●
●
● ●●
●
●
●●
●
●
●●
● ●0
515
Site 29 − Hardnessm
g/L
2009
2010
2011
2012
2013
● ●
● ●
●
●
● ● ●●
●
● ● ●
●● ● ● ●
050
100
150
200
mg/
L
Oct
200
9
Oct
201
0
Oct
201
1
Oct
201
2
Oct
201
3
Hardness Upper Limit Lower Limit
Note: the AWQS may not be shown in order to allow greater visual detail of measured values for trend analysis
300

●●
● ●
●
●
●●
●●
●● ● ●
●●
●
●
●
05
10
Site 29 − Arsenic Dissolvedµg
/L
2009
2010
2011
2012
2013
●●
● ●
●
●
●●
●
●
●
●● ●
●
●
●
●
●
010
2030
40
µg/L
Oct
200
9
Oct
201
0
Oct
201
1
Oct
201
2
Oct
201
3
Arsenic Dissolved Upper Limit Lower Limit
Note: the AWQS may not be shown in order to allow greater visual detail of measured values for trend analysis
301

●●
●●
●
●
●
●
●●
●● ● ●
●●
●
●
●
04
812
Site 29 − Barium Dissolvedµg
/L
2009
2010
2011
2012
2013
● ●
●●
●●
●
●
●●
●● ● ●
● ● ●
●
●
020
4060
80
µg/L
Oct
200
9
Oct
201
0
Oct
201
1
Oct
201
2
Oct
201
3
Barium Dissolved Upper Limit Lower Limit
Note: the AWQS may not be shown in order to allow greater visual detail of measured values for trend analysis
302

● ●● ●
●
●
●
●
● ● ●●
● ● ●●
● ●●
0.00
0.03
Site 29 − Cadmium Dissolvedµg
/L
2009
2010
2011
2012
2013
● ●● ●
●
●
●
●
● ● ●●
● ● ●●
● ●●
0.00
0.05
0.10
0.15
0.20
0.25
µg/L
Oct
200
9
Oct
201
0
Oct
201
1
Oct
201
2
Oct
201
3
Cadmium Dissolved Upper Limit Lower Limit
Note: the AWQS may not be shown in order to allow greater visual detail of measured values for trend analysis
303

●
●● ● ● ● ● ● ● ●
●
● ● ●●
●
●
●
●
04
8
Site 29 − Chromium Dissolvedµg
/L
2009
2010
2011
2012
2013
●
●
●
●
● ●
●
● ●●
●
●● ●
●
●
●
●
●
02
46
810
µg/L
Oct
200
9
Oct
201
0
Oct
201
1
Oct
201
2
Oct
201
3
Chromium Dissolved Upper Limit Lower Limit
Note: the AWQS may not be shown in order to allow greater visual detail of measured values for trend analysis
304
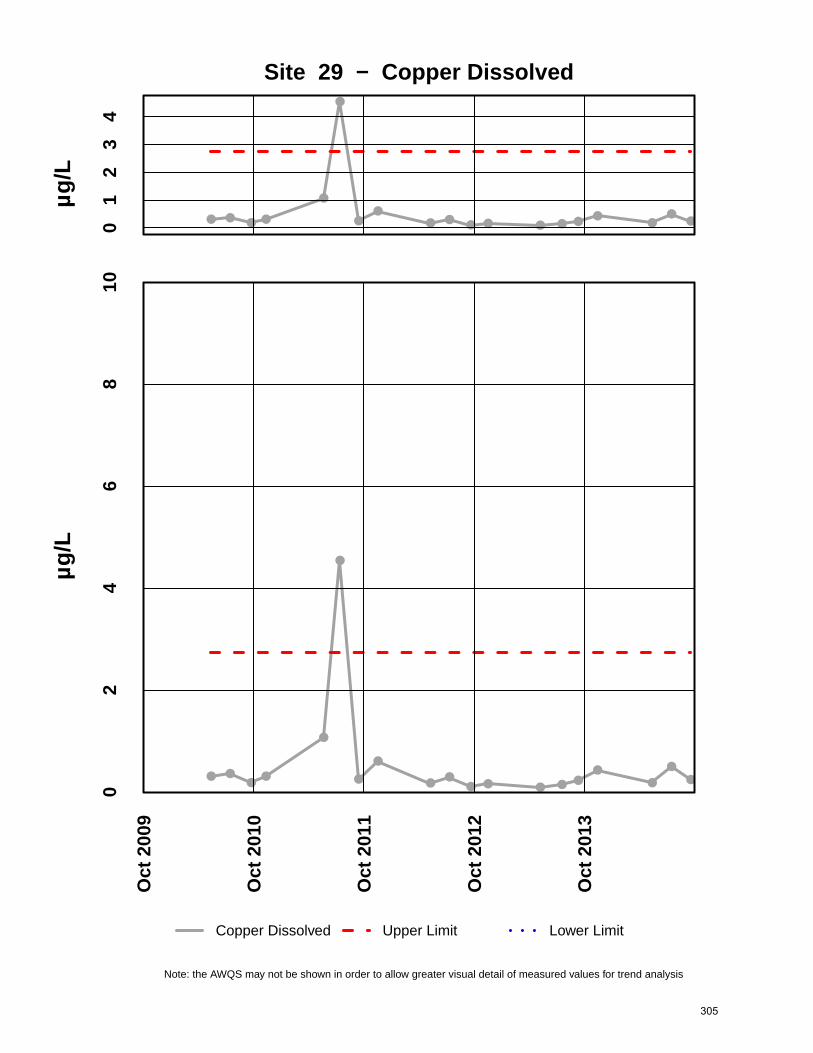
● ● ● ●
●
●
●●
● ● ● ● ● ● ● ●●
●●0
12
34
Site 29 − Copper Dissolvedµg
/L
2009
2010
2011
2012
2013
● ●●
●
●
●
●
●
●●
● ● ● ● ●●
●
●●
02
46
810
µg/L
Oct
200
9
Oct
201
0
Oct
201
1
Oct
201
2
Oct
201
3
Copper Dissolved Upper Limit Lower Limit
Note: the AWQS may not be shown in order to allow greater visual detail of measured values for trend analysis
305

● ● ● ●
●
●
●
●
● ● ● ● ● ● ●●
●● ●
02
46
Site 29 − Lead Dissolvedµg
/L
2009
2010
2011
2012
2013
●
●
●●
●
●
●
●
● ●●
● ● ● ●
●
●
●
●
01
23
45
67
µg/L
Oct
200
9
Oct
201
0
Oct
201
1
Oct
201
2
Oct
201
3
Lead Dissolved Upper Limit Lower Limit
Note: the AWQS may not be shown in order to allow greater visual detail of measured values for trend analysis
306

● ●●
●
●●
● ●● ●
●
●●
●● ● ●
●
●
0.0
1.0
2.0
Site 29 − Nickel Dissolvedµg
/L
2009
2010
2011
2012
2013
● ●●
●
●●
● ●● ●
●
●● ● ● ● ●
●
●
02
46
810
1214
µg/L
Oct
200
9
Oct
201
0
Oct
201
1
Oct
201
2
Oct
201
3
Nickel Dissolved Upper Limit Lower Limit
Note: the AWQS may not be shown in order to allow greater visual detail of measured values for trend analysis
307

● ● ● ● ●
●
●
●
● ● ●
●
●
●
● ●
●
● ●
0.00
00.
006
Site 29 − Silver Dissolvedµg
/L
2009
2010
2011
2012
2013
● ● ● ● ● ● ● ● ● ● ● ● ● ● ● ● ● ● ●01
23
45
6
µg/L
Oct
200
9
Oct
201
0
Oct
201
1
Oct
201
2
Oct
201
3
Silver Dissolved Upper Limit Lower Limit
Note: the AWQS may not be shown in order to allow greater visual detail of measured values for trend analysis
308

● ● ●●
●
●
●
●
● ● ● ● ● ● ●● ● ● ●0
2040
Site 29 − Zinc Dissolvedµg
/L
2009
2010
2011
2012
2013
● ● ●●
●
●
●
●
● ● ● ● ● ● ●● ●
●●
020
4060
8010
012
0
µg/L
Oct
200
9
Oct
201
0
Oct
201
1
Oct
201
2
Oct
201
3
Zinc Dissolved Upper Limit Lower Limit
Note: the AWQS may not be shown in order to allow greater visual detail of measured values for trend analysis
309

●
● ● ●
●
●
●
● ●
●
●
●
●
●●
●
● ●
●0.0
0.2
0.4
Site 29 − Selenium Dissolvedµg
/L
2009
2010
2011
2012
2013
●
● ● ●
●
●
●
● ●
●
●
●
●
● ●
●
● ●
●01
23
45
µg/L
Oct
200
9
Oct
201
0
Oct
201
1
Oct
201
2
Oct
201
3
Selenium Dissolved Upper Limit Lower Limit
Note: the AWQS may not be shown in order to allow greater visual detail of measured values for trend analysis
310

●
●● ● ● ●
● ● ●●
●● ●
●
●● ● ● ●
0.00
00.
004
Site 29 − Mercury Dissolvedµg
/L
2009
2010
2011
2012
2013
●
●
●●
● ●
●●
●
●
●
● ●
●
●
●●
● ●
0.00
00.
002
0.00
40.
006
0.00
80.
010
0.01
2
µg/L
Oct
200
9
Oct
201
0
Oct
201
1
Oct
201
2
Oct
201
3
Mercury Dissolved Upper Limit Lower Limit
Note: the AWQS may not be shown in order to allow greater visual detail of measured values for trend analysis
311

INTERPRETIVE REPORT SITE 32 The data collected during the current water year are listed in the following “Table of Results for Water Year 2014” report. The table includes all the required FWMP analyte data (field and laboratory) collected for the current water year and a series of flags keyed to the summary report “Qualified Data by QA Reviewer”. The QA report lists any associated data limitations found during the monthly QA reviews of laboratory data for this site. Median values for all analytes have been calculated and are shown in the right-most column of the table of results. Any value reported as less than MDL has been replaced with a value of ½ MDL for the purpose of median calculation. All data collected at this site for the past six years are included in the data analyses. As shown in the table below, there were no data outliers.
Sample Date Parameter Value Qualifier Notes No outliers have been identified by HGCMC for the period of October 2008 through September 2014.
The data for Water Year 2014 have been compared to the strictest fresh water quality criterion for each applicable analyte. Twelve results exceeding these criteria have been identified as listed in the table below.
All four of the annual sampling events were in exceedance for total alkalinity, dissolved lead, and field pH. Due to the low hardness for this site, 46 of the past 47 samples have returned lead
Lower Upper
12-Nov-13 Alkalinity 19.2 mg/L 20 012-May-14 Alkalinity 17.2 mg/L 20 0
15-Jul-14 Alkalinity 15.8 mg/L 20 017-Sep-14 Alkalinity 16.9 mg/L 20 012-Nov-13 Lead Dissolved 1.42 µg/L 0 0.541 9.53 mg/L12-May-14 Lead Dissolved 1.26 µg/L 0 0.541 8.35 mg/L
15-Jul-14 Lead Dissolved 1.48 µg/L 0 0.541 8.12 mg/L17-Sep-14 Lead Dissolved 1.38 µg/L 0 0.541 8.42 mg/L12-Nov-13 pH Field 5.19 su 6.5 8.512-May-14 pH Field 5.23 su 6.5 8.5
15-Jul-14 pH Field 5.28 su 6.5 8.517-Sep-14 pH Field 5.31 su 6.5 8.5
Table of Exceedance for Water Year 2014
Sample Date Parameter Value
LimitsHardness
312

values higher than the AWQS. As noted in the interpretive section for Site 29 fugitive tailings dust may be contributing to the elevated lead levels monitored at Site 32. Dissolved chromium concentrations for the current water year, which were in exceedance during the May 2009 and May 2010 sampling, were well below the AWQS limit. A mechanism has yet to be established to explain the two elevated chromium results in those years. X-Y plots have been generated to graphically present the data for each of the analytes requested in the Statistical Information Goals for this site. These plots have been visually analyzed for the appearance of any trend in concentration. No obvious trends are apparent except for dissolved lead which has generally decreased the last several water years from a peak in water year 2006. A non-parametric statistical analysis for trend was performed for specific conductivity, field pH, total alkalinity, total sulfate, and dissolved zinc. Calculation details of the Seasonal Kendall analyses are presented in detail on the pages following this interpretive section. The adjacent table summarizes the results on the data collected between Oct-08 and Sep-14(WY2009-WY2014).
There was a significant negative (p=0.01) trend in dissolved zinc (slope of -1.14 su/yr) and a significant positive trend with total alkalinity (slope of 1.82 mg/L/yr). Trend analysis was not performed on the total sulfate dataset because of a change in the method detection limit used by Analytica Laboratories. A primary assumption of the Mann-Kendall test is “… only one censoring threshold exists. When more than one detection limit exists, the Mann-Kendall test cannot be performed without further censoring the data.” In order to prevent this from occurring HGCMC has worked to establish a consistent MDL for sulfate from the laboratory. With the discontinuation of sampling at Site 58 during Water Year 2013, an inter-well comparison is no longer feasible. Instead an intra-well analysis was performed using combined Shewhart-CUSUM charts for conductivity, dissolved zinc, and alkalinity. Table 1 contains a summary of the baseline statistics along with the control limits used. Site 32 was installed in 1988 and has an extensive sampling history, however establishing a baseline has been difficult. Since the installation of the well a number of the monitored parameters (i.e. alkalinity, specific conductance, total sulfate, and etc…) have been in constant flux. Because the CUSUM process compares the mean and standard deviation of the chosen
Mann-Kendall test statistics Sen's slope estimaten* p** Trend Q Q(%)
Conductivity Field 6 0.16pH Field 6 0.29Alkalinity, Total 6 <0.01 + 1.825 11.774Sulfate, Total 6Zinc, Dissolved 6 0.01 - -1.143 -13.451* Number of Years ** Significance level
Table of Summary Statistics for Trend Analysis
Parameter
Inconsistent detection limits
313

baseline to the collected data it is possible to detect continual changes in the analytes without having a background data set. After reviewing the data for the three parameters, data periods were chosen based upon the data having a period of minimal flux. This period was then used for the calculation of the baseline statistics.
Table 1. Specific Conductance, Dissolved Zinc, and Total Sulfate Baseline Periods, Summary Statistics and Various Control Limits
Site 32 Site 32 Site 32
Conductivity
(µS/cm) Diss. Zinc
(µg/L) Alkalinity (mg/L)
Baseline Statistics Baseline Period 09/18/95-09/10/03 05/11/00-09/15/05 04/27/95-09/13/00 Number of Samples 12 12 12 Mean (x) 57.5 9.17 18.7 Standard Deviation 2.86 3.72 2.02 Shewhart-CUSUM Control Limits (SCL) Control Limit (mean x+ 2s) 63.3 16.6 22.1 Control Limit (mean x + 3s) 66.1 20.3 24.1 Control Limit (mean x + 4s) 69.0 24.0 26.1 Control Limit (mean x + 4.5s) 70.4 25.9 27.1 CUSUM Control Limits Cumulative increase – h 5 5 5
Site 32 was installed in 1988 and has an extensive sampling history; though this well has similar completion as Site 29, there has not been an analogous long term flux in these parameters. This makes establishing the baseline less difficult. Because the CUSUM process compares the mean and standard deviation of the chosen baseline to the collected data it possible to detect continual changes in the analytes without having a background data set. After reviewing the data for the three parameters, data periods were chosen based upon the data having a period of stability. This period was then used for the calculation of the baseline statistics. Two of the three parameters examined (Figure 1) eventually went out of control with respects to the chosen baseline data statistics. If the pore/contact water from inside the facility was not contained, the well water would have high conductivity, high dissolved zinc, and high alkalinity. Specific conductance has shown the least amount of variability, never going out of control. Total alkalinity went out of control because there has been a minor decrease in the parameter concentration. Because alkalinity and specific conductance do not have a similar pattern to going out of control as compared to dissolved zinc, it is not thought that these changes are a result of contact water leaching from containment. Dissolved zinc has periodically had higher values than the mean. As previous discussed it is hypothesized that the increase in dissolved zinc results from the accumulation of fugitive dust in the snow pack during the winter. In the spring when the snow pack melts this material is released as a pulse. Most years the deposited material is not present by the fall sampling. With the implementation of additional best management practices, HGCMC expects to decrease the amount of fugitive dust leaving the tailings disposal facility.
314

-6
-4
-2
0
2
4
6
0
10
20
30
40
50
60
70
80
90
CUSU
M
Spec
ific C
ondu
ctan
ce (µ
S/cm
)Figure 1. Observed Measurements for Specific Conductance, Dissolved Zinc, and Alkalinity
from Site 32 Compared to the Shewhart-CUSUM Control Limits From Table 1
-50
-40
-30
-20
-10
0
10
20
30
40
50
0
5
10
15
20
25
30
35
40
45
50
Diss
olve
d Zi
nc (µ
g/L)
CUSU
M
-50
-40
-30
-20
-10
0
10
20
05
101520253035404550
Oct
-99
Oct
-00
Oct
-01
Oct
-02
Oct
-03
Oct
-04
Oct
-05
Oct
-06
Oct
-07
Oct
-08
Oct
-09
Oct
-10
Oct
-11
Oct
-12
Oct
-13
Alka
linity
(m
g/L)
CUSU
M
Mean Analyte Baseline Limits CUSUM CUSUM
315

Sample Date/Parameter Oct 2013 Nov 2013 Dec 2013 Jan 2014 Feb 2014 Mar 2014 Apr 2014 May 2014 Jun 2014 Jul 2014 Aug 2014 Sep 2014 MedianWater Temp (°C) 7.3 10.2 10.3 8.8 9.5Conductivity-Field(µmho) 64 67 69 62.3 65.5Conductivity-Lab (µmho) 53 59 59 55 57pH Lab (standard units) 5.15 5.11 5.05 5.17 5.13pH Field (standard units) 5.19 5.23 5.28 5.31 5.26Total Alkalinity (mg/L) 19.2 17.2 15.8 16.9 17.1Total Sulfate (mg/L) 5 2.5 0.3 1.3 1.9Hardness (mg/L) 9.5 8.4 8.1 8.4 8.4Dissolved As (ug/L) 4.33 5.18 4.46 4.86 4.660Dissolved Ba (ug/L) 17.5 17.7 14.3 13.5 15.9Dissolved Cd (ug/L) 0.0068 0.0121 0.0086 0.0105 0.0096Dissolved Cr (ug/L) 1.78 3.56 2.99 4.7 3.275Dissolved Cu (ug/L) 0.727 0.435 0.875 0.563 0.645Dissolved Pb (ug/L) 1.42 1.26 1.48 1.38 1.4000Dissolved Ni (ug/L) 3.65 3.23 3.25 2.94 3.240Dissolved Ag (ug/L) 0.002 0.007 0.002 0.002 0.002Dissolved Zn (ug/L) 8.26 8.1 6.14 6.53 7.32Dissolved Se (ug/L) 0.287 0.198 0.581 0.287 0.287Dissolved Hg (ug/L) 0.00119 0.000816 0.00104 0.00094 0.000990
For individual sample/analyte qualifier descriptions see "Qualified Data by QA Reviewer" table.Values reported as less than MDL are replaced by 1/2 MDL for median calculation purposes.Shaded data has been qualified as an outlier by HGCMC and removed from any further analysis and is not included into the calculation of the median
Table of Results for Water Year 2014
Site 032FMG - 'Monitoring Well - 5S'
316

Date Range: 10/01/2013 to 09/30/2014
Site No. Sample Date Sample Time Parameter Value Qualifier Reason for Qualifier
Qualified Data by QA Reviewer
032FMG 11/12/2013 12:00 PM Diss. Cd-ICP/MS 0.00681 J Below Quantitative Range
032FMG 11/12/2013 12:00 PM Diss. Se-ICP/MS 0.28 J Below Quantitative Range
032FMG 5/12/2014 12:00 PM Alkalinity 17.2 U Trip Blank Contamination
Conductivity 59.1 U Trip Blank Contamination
Diss. Ag-ICP/MS 0.00691 J Below Quantitative Range
Diss. Se-ICP/MS 0.19 J Below Quantitative Range
Sulfate -5 UJ Sample Receipt Temperature
032FMG 7/15/2014 12:00 PM Diss. Cd-ICP/MS 0.0086 J Below Quantitative Range
032FMG 9/17/2014 12:00 PM Diss. Cd-ICP/MS 0.01 J Below Quantitative Range
Diss. Se-ICP/MS 0.28 J Below Quantitative Range
317

●
● ●
●
● ●●
●
● ● ●●
●●
● ●
● ●
●0
48
Site 32 − Water Temperature°C
2009
2010
2011
2012
2013
●
● ●
●
● ●
●
●
●● ●
●
●
●●
●
● ●
●
05
1015
20
°C
Oct
200
9
Oct
201
0
Oct
201
1
Oct
201
2
Oct
201
3
Water Temperature Upper Limit Lower Limit
Note: the AWQS may not be shown in order to allow greater visual detail of measured values for trend analysis
318

● ●●
●● ● ● ●
● ●●
● ● ●
●
●● ●
●0
2040
60
Site 32 − Conductivity LaboratoryµS
/cm
2009
2010
2011
2012
2013
● ● ● ●● ● ● ● ● ● ●
● ● ●
●
●● ● ●
010
020
030
040
050
0
µS/c
m
Oct
200
9
Oct
201
0
Oct
201
1
Oct
201
2
Oct
201
3
Conductivity Laboratory Upper Limit Lower Limit
Note: the AWQS may not be shown in order to allow greater visual detail of measured values for trend analysis
319

● ● ●● ● ●
● ●
●
● ●●
● ● ● ● ● ●●
040
80
Site 32 − Conductivity FieldµS
/cm
2009
2010
2011
2012
2013
● ● ●● ● ●
● ●
●
● ●●
● ● ● ● ● ●●
010
020
030
040
050
0
µS/c
m
Oct
200
9
Oct
201
0
Oct
201
1
Oct
201
2
Oct
201
3
Conductivity Field Upper Limit Lower Limit
Note: the AWQS may not be shown in order to allow greater visual detail of measured values for trend analysis
320

●
● ● ●
●
●
● ●● ●
●
●●
●
●● ● ●
●
4.5
5.5
6.5
Site 32 − pH Laboratorysu
2009
2010
2011
2012
2013
●
● ● ●
●
●
●●
●●
●
●●
●
●
● ●●
●
45
67
89
su
Oct
200
9
Oct
201
0
Oct
201
1
Oct
201
2
Oct
201
3
pH Laboratory Upper Limit Lower Limit
Note: the AWQS may not be shown in order to allow greater visual detail of measured values for trend analysis
321

●●
● ● ●
●
●
●
●
●●
●
●●
●● ● ● ●
4.5
5.5
6.5
Site 32 − pH Fieldsu
2009
2010
2011
2012
2013
●●
●●
●
●
●
●
●
●
●
●
●
●●
● ● ● ●
45
67
89
su
Oct
200
9
Oct
201
0
Oct
201
1
Oct
201
2
Oct
201
3
pH Field Upper Limit Lower Limit
Note: the AWQS may not be shown in order to allow greater visual detail of measured values for trend analysis
322

●
● ●●
●●
● ●
●●
●●
● ●
●
● ● ● ●
020
40
Site 32 − Alkalinitym
g/L
2009
2010
2011
2012
2013
●
● ●●
●
●
● ●
●●
●●
● ●
●
●● ● ●
020
4060
8010
012
014
0
mg/
L
Oct
200
9
Oct
201
0
Oct
201
1
Oct
201
2
Oct
201
3
Alkalinity Upper Limit Lower Limit
Note: the AWQS may not be shown in order to allow greater visual detail of measured values for trend analysis
323

● ● ● ● ● ● ● ● ● ● ● ● ● ● ● ● ● ● ●
−1.0
0.0
1.0
Site 32 − Sulfate Totalm
g/L
2009
2010
2011
2012
2013
● ● ● ● ● ● ● ● ● ● ● ● ● ● ● ● ● ● ●02
46
810
1214
mg/
L
Oct
200
9
Oct
201
0
Oct
201
1
Oct
201
2
Oct
201
3
Sulfate Total Upper Limit Lower Limit
Note: the AWQS may not be shown in order to allow greater visual detail of measured values for trend analysis
324

●●
●●
●● ● ● ● ●
●●
●● ●
●
● ● ●0
48
Site 32 − Hardnessm
g/L
2009
2010
2011
2012
2013
● ● ● ● ● ● ● ● ● ● ● ● ● ● ● ● ● ● ●
050
100
150
200
mg/
L
Oct
200
9
Oct
201
0
Oct
201
1
Oct
201
2
Oct
201
3
Hardness Upper Limit Lower Limit
Note: the AWQS may not be shown in order to allow greater visual detail of measured values for trend analysis
325

●●
●
●
● ●●
●
●
●
●
●● ● ●
●
●
●●
02
46
Site 32 − Arsenic Dissolvedµg
/L
2009
2010
2011
2012
2013
● ●
●●
● ● ● ●
●
●●
● ● ● ●●
●● ●
010
2030
40
µg/L
Oct
200
9
Oct
201
0
Oct
201
1
Oct
201
2
Oct
201
3
Arsenic Dissolved Upper Limit Lower Limit
Note: the AWQS may not be shown in order to allow greater visual detail of measured values for trend analysis
326

● ●●
●
●
●● ●
● ●●
● ●●
●
● ●
● ●
05
15
Site 32 − Barium Dissolvedµg
/L
2009
2010
2011
2012
2013
● ●●
●
●
●● ●
● ●●
● ●●
●
● ●
● ●
020
4060
80
µg/L
Oct
200
9
Oct
201
0
Oct
201
1
Oct
201
2
Oct
201
3
Barium Dissolved Upper Limit Lower Limit
Note: the AWQS may not be shown in order to allow greater visual detail of measured values for trend analysis
327

●●
●●
●
●● ●
● ●
●
● ● ●●
●●
● ●
0.00
0.03
0.06
Site 32 − Cadmium Dissolvedµg
/L
2009
2010
2011
2012
2013
●●
●●
●
●● ●
● ●
●
● ● ●●
●●
● ●
0.00
0.05
0.10
0.15
0.20
0.25
µg/L
Oct
200
9
Oct
201
0
Oct
201
1
Oct
201
2
Oct
201
3
Cadmium Dissolved Upper Limit Lower Limit
Note: the AWQS may not be shown in order to allow greater visual detail of measured values for trend analysis
328

●
●●
● ● ● ● ●● ●
●
●● ● ● ●
●●
●
04
812
Site 32 − Chromium Dissolvedµg
/L
2009
2010
2011
2012
2013
●
●
●
●
●●
●
●
●
●
●
●
●
●● ●
●
●
●
02
46
810
µg/L
Oct
200
9
Oct
201
0
Oct
201
1
Oct
201
2
Oct
201
3
Chromium Dissolved Upper Limit Lower Limit
Note: the AWQS may not be shown in order to allow greater visual detail of measured values for trend analysis
329

● ●● ●
●
●
●●
● ● ● ●
●● ● ●
●
●
●
0.0
1.0
2.0
Site 32 − Copper Dissolvedµg
/L
2009
2010
2011
2012
2013
● ●● ●
●
●
●●
● ● ● ●
●● ● ●
●
●
●
02
46
810
µg/L
Oct
200
9
Oct
201
0
Oct
201
1
Oct
201
2
Oct
201
3
Copper Dissolved Upper Limit Lower Limit
Note: the AWQS may not be shown in order to allow greater visual detail of measured values for trend analysis
330

●
●
●
●
●
●
●
●
● ●
●
● ● ●●
● ●● ●
01
23
Site 32 − Lead Dissolvedµg
/L
2009
2010
2011
2012
2013
●
●
●
●
●
●
●
●
●●
●
●●
●
●
●●
●●
01
23
45
67
µg/L
Oct
200
9
Oct
201
0
Oct
201
1
Oct
201
2
Oct
201
3
Lead Dissolved Upper Limit Lower Limit
Note: the AWQS may not be shown in order to allow greater visual detail of measured values for trend analysis
331

● ●
●
●
●●
● ●
● ●●
●● ● ●
●● ●
●
01
23
4
Site 32 − Nickel Dissolvedµg
/L
2009
2010
2011
2012
2013
● ●
●
●
●●
● ●
● ●●
●● ● ●
●
● ●●
02
46
810
1214
µg/L
Oct
200
9
Oct
201
0
Oct
201
1
Oct
201
2
Oct
201
3
Nickel Dissolved Upper Limit Lower Limit
Note: the AWQS may not be shown in order to allow greater visual detail of measured values for trend analysis
332

●
● ● ●
●
●
●
●
●
● ●
●
●
●
● ●
●
● ●
0.00
00.
006
Site 32 − Silver Dissolvedµg
/L
2009
2010
2011
2012
2013
● ● ● ● ● ● ● ● ● ● ● ● ● ●● ● ● ● ●0.
00.
20.
40.
60.
81.
0
µg/L
Oct
200
9
Oct
201
0
Oct
201
1
Oct
201
2
Oct
201
3
Silver Dissolved Upper Limit Lower Limit
Note: the AWQS may not be shown in order to allow greater visual detail of measured values for trend analysis
333

●● ●
●
●
●●
●
● ●●
● ● ●● ● ●
● ●
020
40
Site 32 − Zinc Dissolvedµg
/L
2009
2010
2011
2012
2013
●● ●
●
●
●●
●
● ●
●
● ● ●● ● ●
● ●
020
4060
8010
012
0
µg/L
Oct
200
9
Oct
201
0
Oct
201
1
Oct
201
2
Oct
201
3
Zinc Dissolved Upper Limit Lower Limit
Note: the AWQS may not be shown in order to allow greater visual detail of measured values for trend analysis
334

●
●
●
●
●
●
●
●
●
●
●
●
●
●
●
●
●
●
●
0.0
0.4
0.8
Site 32 − Selenium Dissolvedµg
/L
2009
2010
2011
2012
2013
●
●
●
●
●
●
●
●●
●
●
●
●
●
●
●●
●
●
01
23
45
µg/L
Oct
200
9
Oct
201
0
Oct
201
1
Oct
201
2
Oct
201
3
Selenium Dissolved Upper Limit Lower Limit
Note: the AWQS may not be shown in order to allow greater visual detail of measured values for trend analysis
335

●●
●
● ● ●●
●● ● ● ● ●
●
● ●● ● ●
0.00
00.
004
Site 32 − Mercury Dissolvedµg
/L
2009
2010
2011
2012
2013
●
●
●
●● ●
●
●
● ●● ● ●
●
●●
●● ●
0.00
00.
002
0.00
40.
006
0.00
80.
010
0.01
2
µg/L
Oct
200
9
Oct
201
0
Oct
201
1
Oct
201
2
Oct
201
3
Mercury Dissolved Upper Limit Lower Limit
Note: the AWQS may not be shown in order to allow greater visual detail of measured values for trend analysis
336

INTERPRETIVE REPORT SITE 9 The Tributary Creek site was initially chosen to monitor the effects on water quality caused by the originally planned, larger slurry tailings impoundment. It is approximately one mile downstream from the present dry stack tailings site. The site was monitored from 1981 – 1993 when it was temporarily suspended by administrative agreement with the USFS. The site was re-activated in 2001 as a biological monitoring site for the Tailings Pile. HGCMC recommenced collection of water chemistry samples after receiving a suggestion to do so from ADNR personnel. It was noted that should the required annual biomonitoring show significant changes, an understanding of any related water chemistry variations would enhance the interpretation of those results. During the 2013 water year, samples were collected in conjunction with the normal monthly FWMP sampling run during the months of November, May, July, and September and analyzed for Suite Q analytes. The data collected during the current water year are listed in the following “Table of Results for Water Year 2014” report. The table includes all the FWMP analyte data (field and laboratory) collected for the current water year and a series of flags keyed to the summary report “Qualified Data by QA Reviewer”. The QA report lists any associated data limitations found during the monthly QA reviews of laboratory data for this site. Median values for all analytes have been calculated and are shown in the right-most column of the table of results. Any value reported as less than MDL has been replaced with a value of ½ MDL for the purpose of median calculation. Routine water chemistry data collection was reinstated May 2006. All data collected at the site since then are included in the data analyses. As shown in the table below, there were no data outliers.
Sample Date Parameter Value Qualifier Notes No outliers have been identified by HGCMC for the period of October 2008 through September 2014.
The data for Water Year 2014 have been compared to the strictest fresh water quality criterion for each applicable analyte. Two results exceeding these criteria have been identified, and listed in the table below. The results were for total alkalinity values of 17.6 mg/L, and 12.6 mg/L for the May 2014 and July 2014 sampling events respectively, which exceed the AWQS lower limit of 20 mg/L.
Lower Upper
12-May-14 Alkalinity 17.6 mg/L 20 015-Jul-14 Alkalinity 12.6 mg/L 20 0
Table of Exceedance for Water Year 2014
Sample Date Parameter Value
LimitsHardness
337
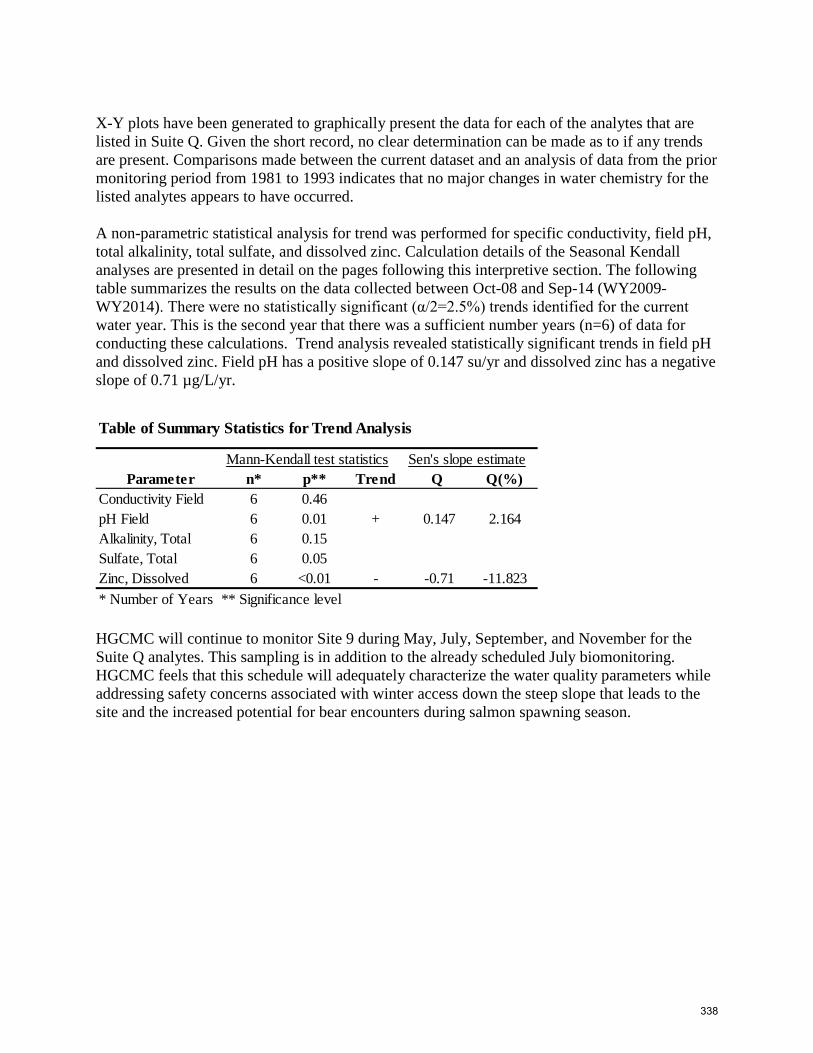
X-Y plots have been generated to graphically present the data for each of the analytes that are listed in Suite Q. Given the short record, no clear determination can be made as to if any trends are present. Comparisons made between the current dataset and an analysis of data from the prior monitoring period from 1981 to 1993 indicates that no major changes in water chemistry for the listed analytes appears to have occurred. A non-parametric statistical analysis for trend was performed for specific conductivity, field pH, total alkalinity, total sulfate, and dissolved zinc. Calculation details of the Seasonal Kendall analyses are presented in detail on the pages following this interpretive section. The following table summarizes the results on the data collected between Oct-08 and Sep-14 (WY2009-WY2014). There were no statistically significant (α/2=2.5%) trends identified for the current water year. This is the second year that there was a sufficient number years (n=6) of data for conducting these calculations. Trend analysis revealed statistically significant trends in field pH and dissolved zinc. Field pH has a positive slope of 0.147 su/yr and dissolved zinc has a negative slope of 0.71 µg/L/yr.
HGCMC will continue to monitor Site 9 during May, July, September, and November for the Suite Q analytes. This sampling is in addition to the already scheduled July biomonitoring. HGCMC feels that this schedule will adequately characterize the water quality parameters while addressing safety concerns associated with winter access down the steep slope that leads to the site and the increased potential for bear encounters during salmon spawning season.
Mann-Kendall test statistics Sen's slope estimaten* p** Trend Q Q(%)
Conductivity Field 6 0.46pH Field 6 0.01 + 0.147 2.164Alkalinity, Total 6 0.15Sulfate, Total 6 0.05Zinc, Dissolved 6 <0.01 - -0.71 -11.823* Number of Years ** Significance level
Table of Summary Statistics for Trend Analysis
Parameter
338

Sample Date/Parameter Oct 2013 Nov 2013 Dec 2013 Jan 2014 Feb 2014 Mar 2014 Apr 2014 May 2014 Jun 2014 Jul 2014 Aug 2014 Sep 2014 MedianWater Temp (°C) 2.3 8.9 11.5 10.8 9.9Conductivity-Field(µmho) 103 77 77 87.8 82.4Conductivity-Lab (µmho) 82 76 76 85 79pH Lab (standard units) 6.88 7.16 7.12 7.08 7.10pH Field (standard units) 7.16 6.79 6.9 7.45 7.03Total Alkalinity (mg/L) 23.6 17.6 12.6 23.9 20.6Total Sulfate (mg/L) 12.5 12.5 11.8 11 12.2Hardness (mg/L) 42.7 29.4 32.3 38.8 35.6Dissolved As (ug/L) 0.855 0.666 0.979 1.28 0.917Dissolved Ba (ug/L) 37.8 32.3 40.7 45.2 39.3Dissolved Cd (ug/L) 0.0265 0.0177 0.0317 0.0318 0.0291Dissolved Cr (ug/L) 0.779 0.704 0.902 0.768 0.774Dissolved Cu (ug/L) 1.23 1.7 2.36 1.67 1.685Dissolved Pb (ug/L) 0.428 0.232 0.521 0.417 0.4225Dissolved Ni (ug/L) 2.35 1.73 2.53 2.74 2.440Dissolved Ag (ug/L) 0.006 0.008 0.011 0.011 0.010Dissolved Zn (ug/L) 4.22 3.13 5.59 4.27 4.25Dissolved Se (ug/L) 0.337 0.116 0.158 0.22 0.189Dissolved Hg (ug/L) 0.00282 0.00308 0.00532 0.00422 0.003650
For individual sample/analyte qualifier descriptions see "Qualified Data by QA Reviewer" table.Values reported as less than MDL are replaced by 1/2 MDL for median calculation purposes.Shaded data has been qualified as an outlier by HGCMC and removed from any further analysis and is not included into the calculation of the median
Table of Results for Water Year 2014
Site 009FMS - 'Lower Tributary Creek'
339

Date Range: 10/01/2013 to 09/30/2014
Site No. Sample Date Sample Time Parameter Value Qualifier Reason for Qualifier
Qualified Data by QA Reviewer
009FMS 11/12/2013 12:00 PM Diss. Ag-ICP/MS 0.00634 J Below Quantitative Range
Diss. Se-ICP/MS 0.33 J Below Quantitative Range
Sulfate 12.5 J Below Quantitative Range
009FMS 5/12/2014 12:00 PM Alkalinity 17.6 U Trip Blank Contamination
Conductivity 75.7 U Trip Blank Contamination
Diss. Ag-ICP/MS 0.00804 J Below Quantitative Range
Diss. Se-ICP/MS 0.11 J Below Quantitative Range
Sulfate 12.5 J Sample Receipt Temperature
009FMS 7/15/2014 12:00 PM Diss. Se-ICP/MS 0.15 J Below Quantitative Range
009FMS 9/15/2014 12:00 PM Diss. Ag-ICP/MS 0.01 J Matrix Spike Recovery
Diss. Se-ICP/MS 0.22 J Below Quantitative Range
340

●
●
●
●
●
●
●
●
●
●
●
●
●
●
●
●
● ●
05
1015
Site 9 − Water Temperature°C
2009
2010
2011
2012
2013
●
●
●
●
●
●
●
●
●
●
●
●
●
●
●
●
●
●
05
1015
20
°C
Oct
200
9
Oct
201
0
Oct
201
1
Oct
201
2
Oct
201
3
Water Temperature Upper Limit Lower Limit
Note: the AWQS may not be shown in order to allow greater visual detail of measured values for trend analysis
341

● ●●
●●
●●
●
●●
●
●
●
●
●●
● ●●
040
80
Site 9 − Conductivity LaboratoryµS
/cm
2009
2010
2011
2012
2013
● ●●
●●
●●
●
●●
●
●
●
●
●●
● ●●
050
100
150
200
250
300
350
µS/c
m
Oct
200
9
Oct
201
0
Oct
201
1
Oct
201
2
Oct
201
3
Conductivity Laboratory Upper Limit Lower Limit
Note: the AWQS may not be shown in order to allow greater visual detail of measured values for trend analysis
342

● ● ● ● ●
●
● ●● ●
●
●●
●●
●
● ●●
040
80
Site 9 − Conductivity FieldµS
/cm
2009
2010
2011
2012
2013
● ● ●● ●
●
● ●
●●
●
●
●
●
●
●
● ●
●
050
100
150
200
250
300
350
µS/c
m
Oct
200
9
Oct
201
0
Oct
201
1
Oct
201
2
Oct
201
3
Conductivity Field Upper Limit Lower Limit
Note: the AWQS may not be shown in order to allow greater visual detail of measured values for trend analysis
343

●
●●
●
●●
● ●
●
●
●
●
●
●●
●
● ● ●
6.0
7.0
Site 9 − pH Laboratorysu
2009
2010
2011
2012
2013
●
●
●
●
●
●
● ●
●
●
●
●
●
●●
●
● ● ●
45
67
89
su
Oct
200
9
Oct
201
0
Oct
201
1
Oct
201
2
Oct
201
3
pH Laboratory Upper Limit Lower Limit
Note: the AWQS may not be shown in order to allow greater visual detail of measured values for trend analysis
344
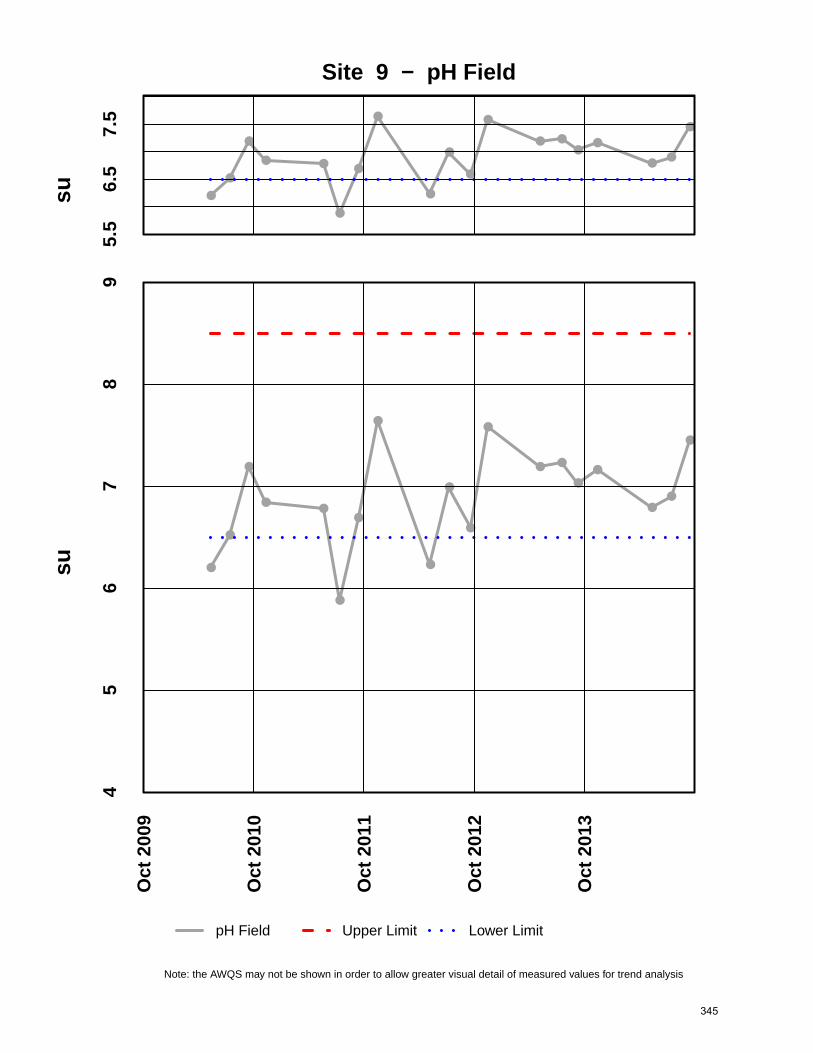
●
●
●
● ●
●
●
●
●
●
●
●
● ●●
●
●●
●
5.5
6.5
7.5
Site 9 − pH Fieldsu
2009
2010
2011
2012
2013
●
●
●
●●
●
●
●
●
●
●
●
● ●
●●
●●
●
45
67
89
su
Oct
200
9
Oct
201
0
Oct
201
1
Oct
201
2
Oct
201
3
pH Field Upper Limit Lower Limit
Note: the AWQS may not be shown in order to allow greater visual detail of measured values for trend analysis
345

● ●
●
●●
●
●
●●
●
●
●
●
●
●
●
●
●
●
1525
Site 9 − Alkalinitym
g/L
2009
2010
2011
2012
2013
● ● ●
● ●
● ●● ● ●
●●
●
●
●●
●●
●
050
100
150
200
250
mg/
L
Oct
200
9
Oct
201
0
Oct
201
1
Oct
201
2
Oct
201
3
Alkalinity Upper Limit Lower Limit
Note: the AWQS may not be shown in order to allow greater visual detail of measured values for trend analysis
346

●
●
●●
●● ●
●
●
● ●
●
● ●●
● ● ● ●
05
1020
Site 9 − Sulfate Totalm
g/L
2009
2010
2011
2012
2013
●
●
●●
●
● ●
●
●
●●
●
● ●
●● ●
●●
010
2030
4050
mg/
L
Oct
200
9
Oct
201
0
Oct
201
1
Oct
201
2
Oct
201
3
Sulfate Total Upper Limit Lower Limit
Note: the AWQS may not be shown in order to allow greater visual detail of measured values for trend analysis
347

●●
●●
●
●●
●
● ●
●
●
●
●●
●
●●
●0
2040
Site 9 − Hardnessm
g/L
2009
2010
2011
2012
2013
●●
●●
●
●●
●
● ●
●
●
●
●●
●
●●
●
050
100
150
200
mg/
L
Oct
200
9
Oct
201
0
Oct
201
1
Oct
201
2
Oct
201
3
Hardness Upper Limit Lower Limit
Note: the AWQS may not be shown in order to allow greater visual detail of measured values for trend analysis
348

●
●●
●
●
● ●● ●
●●
●
●
●●
●
●
●
●0.
00.
61.
2
Site 9 − Arsenic Dissolvedµg
/L
2009
2010
2011
2012
2013
● ● ● ● ● ● ● ● ● ● ● ● ●● ● ● ● ● ●
010
2030
40
µg/L
Oct
200
9
Oct
201
0
Oct
201
1
Oct
201
2
Oct
201
3
Arsenic Dissolved Upper Limit Lower Limit
Note: the AWQS may not be shown in order to allow greater visual detail of measured values for trend analysis
349

● ● ●
● ●
●●
●● ●
●
●●
●
●
●●
020
40
Site 9 − Barium Dissolvedµg
/L
2009
2010
2011
2012
2013
● ●●
●●
●
●
●
● ●
●
●
●
●
●
●
●
020
4060
80
µg/L
Oct
200
9
Oct
201
0
Oct
201
1
Oct
201
2
Oct
201
3
Barium Dissolved Upper Limit Lower Limit
Note: the AWQS may not be shown in order to allow greater visual detail of measured values for trend analysis
350

●
●
●● ●
●●
●
●
●
●
● ●●
●
●
●
● ●
0.00
0.03
Site 9 − Cadmium Dissolvedµg
/L
2009
2010
2011
2012
2013
●
●
●● ●
●●
●
●
●
●
● ●●
●
●
●
● ●
0.00
0.05
0.10
0.15
0.20
0.25
µg/L
Oct
200
9
Oct
201
0
Oct
201
1
Oct
201
2
Oct
201
3
Cadmium Dissolved Upper Limit Lower Limit
Note: the AWQS may not be shown in order to allow greater visual detail of measured values for trend analysis
351

●
●
●●
● ●
●
●
●
●●
●
●
●●
●●
0.0
0.6
1.2
Site 9 − Chromium Dissolvedµg
/L
2009
2010
2011
2012
2013
●
●● ●
● ●●
●●
● ● ●
●● ●
●●
02
46
810
µg/L
Oct
200
9
Oct
201
0
Oct
201
1
Oct
201
2
Oct
201
3
Chromium Dissolved Upper Limit Lower Limit
Note: the AWQS may not be shown in order to allow greater visual detail of measured values for trend analysis
352

●● ● ● ●
●
●
● ●
●●
● ●●
●
●
●
●
●
0.0
1.5
3.0
Site 9 − Copper Dissolvedµg
/L
2009
2010
2011
2012
2013
●
● ● ● ●
●
●
●●
●●
●●
●
●
●
●
●
●
02
46
810
µg/L
Oct
200
9
Oct
201
0
Oct
201
1
Oct
201
2
Oct
201
3
Copper Dissolved Upper Limit Lower Limit
Note: the AWQS may not be shown in order to allow greater visual detail of measured values for trend analysis
353

●●
● ●
● ●● ●
●
●
●
●●
●●
●
●
●●
0.0
1.0
Site 9 − Lead Dissolvedµg
/L
2009
2010
2011
2012
2013
●● ● ●
● ●● ●
●
●
●
●●
●●
●●
●●
01
23
45
67
µg/L
Oct
200
9
Oct
201
0
Oct
201
1
Oct
201
2
Oct
201
3
Lead Dissolved Upper Limit Lower Limit
Note: the AWQS may not be shown in order to allow greater visual detail of measured values for trend analysis
354

●●
●
● ●
●
●
●●
●
●
●
●
●
●
●●
0.0
1.5
3.0
Site 9 − Nickel Dissolvedµg
/L
2009
2010
2011
2012
2013
●●
●
● ●
●
●
●●
●
●
●
●
●
●
●●
02
46
810
1214
µg/L
Oct
200
9
Oct
201
0
Oct
201
1
Oct
201
2
Oct
201
3
Nickel Dissolved Upper Limit Lower Limit
Note: the AWQS may not be shown in order to allow greater visual detail of measured values for trend analysis
355

●
●
● ●●
● ●
●
●
●●
●
●
●●
● ●
0.00
00.
010
Site 9 − Silver Dissolvedµg
/L
2009
2010
2011
2012
2013
● ● ● ● ● ● ● ● ● ● ● ● ● ● ● ● ●01
23
45
6
µg/L
Oct
200
9
Oct
201
0
Oct
201
1
Oct
201
2
Oct
201
3
Silver Dissolved Upper Limit Lower Limit
Note: the AWQS may not be shown in order to allow greater visual detail of measured values for trend analysis
356

●
●●
●● ●
● ●●
●●
●●
●
●
●
●
●
●
02
46
8
Site 9 − Zinc Dissolvedµg
/L
2009
2010
2011
2012
2013
●● ● ● ● ● ● ● ● ● ●
● ●●
● ● ●● ●
020
4060
8010
012
0
µg/L
Oct
200
9
Oct
201
0
Oct
201
1
Oct
201
2
Oct
201
3
Zinc Dissolved Upper Limit Lower Limit
Note: the AWQS may not be shown in order to allow greater visual detail of measured values for trend analysis
357

● ●
●
●
●
● ●
●
●
●
●
●
●
●
●●
●
0.0
0.2
0.4
Site 9 − Selenium Dissolvedµg
/L
2009
2010
2011
2012
2013
● ●●
●
●
● ●
●
●
●
●
●●
●
● ●●
01
23
45
µg/L
Oct
200
9
Oct
201
0
Oct
201
1
Oct
201
2
Oct
201
3
Selenium Dissolved Upper Limit Lower Limit
Note: the AWQS may not be shown in order to allow greater visual detail of measured values for trend analysis
358

●
● ● ●● ●
● ● ●
●
●
●● ●
●
● ●
●●
0.00
00.
006
Site 9 − Mercury Dissolvedµg
/L
2009
2010
2011
2012
2013
●
●●
●
●●
●●
●
●
●
●
●●
●
●●
●
●
0.00
00.
005
0.01
00.
015
µg/L
Oct
200
9
Oct
201
0
Oct
201
1
Oct
201
2
Oct
201
3
Mercury Dissolved Upper Limit Lower Limit
Note: the AWQS may not be shown in order to allow greater visual detail of measured values for trend analysis
359

INTERPRETIVE REPORT SITE 60 Sampling at this site was initiated during background investigations conducted by HGCMC for the Stage II Tailings EIS. The two sampling events that occurred in 2003 were submitted to Analytica Alaska Laboratories for analysis and subject to standard QAQC procedures. The detection limits achieved during this analysis were slightly higher for some analytes than are currently achieved under FWMP sampling protocols. The two sample events that occurred in the 2006 water year were analyzed in parallel with standard FWMP samples and thus subject to the same analytical procedures. The data collected during the current water year are listed in the following “Table of Results for Water Year 2014” report. The table includes all the required FWMP analyte data (field and laboratory) collected for the current water year and a series of flags keyed to the summary report “Qualified Data by QA Reviewer”. The QA report lists any associated data limitations found during the monthly QA reviews of laboratory data for this site. Median values for all analytes have been calculated and are shown in the right-most column of the table of results. Any value reported as less than MDL has been replaced with a value of ½ MDL for the purpose of median calculation. Both ADEC and the USFS requested during the WY2006 annual meeting that an additional monitoring point be added to monitor potential impacts from Pond 7 on the western, downgradient drainage. Greens Creek proposed the current site on lower Althea, and after review by ADEC and USFS during a site visit (June 2, 2007 – USFS Inspection #259) the new site was added to the routine monitoring schedule. As shown in the table below, there were no data outliers.
Sample Date Parameter Value Qualifier Notes No outliers have been identified by HGCMC for the period of October 2008 through September 2014.
The data for Water Year 2014 have been compared to the strictest fresh water quality criterion for each applicable analyte. Seven results exceeding these criteria have been identified, as listed in the table below. One of the exceedances is for field pH with value of 6.48 su (September 2013), this was below the AWQS limit of 6.50 su. Historical sampling for this site in 2003, prior to any disturbance that would directly impact Althea Creek, indicates that the natural background pH ranged from 4.1 su to 4.8 su. Also, for all four sampling events total alkalinity was in exceedance at Site 60, however these values are similar to those recorded for prior to disturbance values. The two exceedances were for dissolved mercury, see discussion below.
360
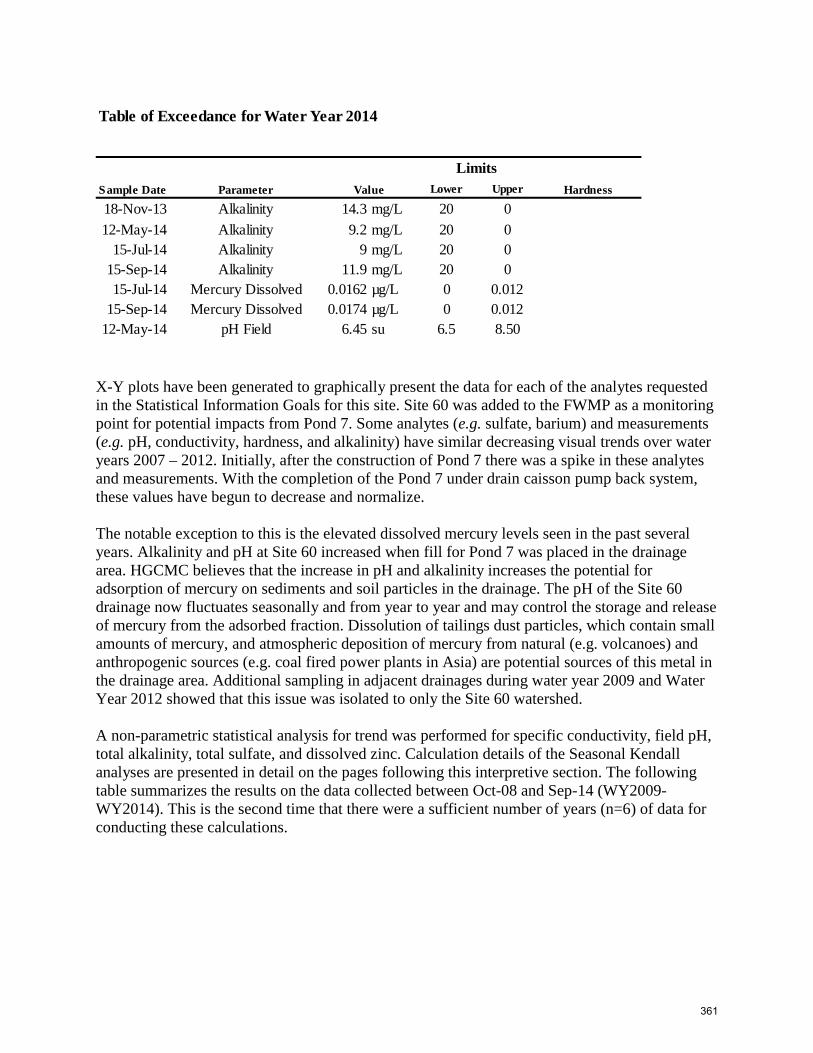
X-Y plots have been generated to graphically present the data for each of the analytes requested in the Statistical Information Goals for this site. Site 60 was added to the FWMP as a monitoring point for potential impacts from Pond 7. Some analytes (e.g. sulfate, barium) and measurements (e.g. pH, conductivity, hardness, and alkalinity) have similar decreasing visual trends over water years 2007 – 2012. Initially, after the construction of Pond 7 there was a spike in these analytes and measurements. With the completion of the Pond 7 under drain caisson pump back system, these values have begun to decrease and normalize. The notable exception to this is the elevated dissolved mercury levels seen in the past several years. Alkalinity and pH at Site 60 increased when fill for Pond 7 was placed in the drainage area. HGCMC believes that the increase in pH and alkalinity increases the potential for adsorption of mercury on sediments and soil particles in the drainage. The pH of the Site 60 drainage now fluctuates seasonally and from year to year and may control the storage and release of mercury from the adsorbed fraction. Dissolution of tailings dust particles, which contain small amounts of mercury, and atmospheric deposition of mercury from natural (e.g. volcanoes) and anthropogenic sources (e.g. coal fired power plants in Asia) are potential sources of this metal in the drainage area. Additional sampling in adjacent drainages during water year 2009 and Water Year 2012 showed that this issue was isolated to only the Site 60 watershed. A non-parametric statistical analysis for trend was performed for specific conductivity, field pH, total alkalinity, total sulfate, and dissolved zinc. Calculation details of the Seasonal Kendall analyses are presented in detail on the pages following this interpretive section. The following table summarizes the results on the data collected between Oct-08 and Sep-14 (WY2009-WY2014). This is the second time that there were a sufficient number of years (n=6) of data for conducting these calculations.
Lower Upper
18-Nov-13 Alkalinity 14.3 mg/L 20 012-May-14 Alkalinity 9.2 mg/L 20 0
15-Jul-14 Alkalinity 9 mg/L 20 015-Sep-14 Alkalinity 11.9 mg/L 20 015-Jul-14 Mercury Dissolved 0.0162 µg/L 0 0.012
15-Sep-14 Mercury Dissolved 0.0174 µg/L 0 0.01212-May-14 pH Field 6.45 su 6.5 8.50
Table of Exceedance for Water Year 2014
Sample Date Parameter Value
LimitsHardness
361

There was one statistically significant (α/2=2.5%) trend identified for the current water year, associated with an increasing trend in dissolved zinc with a Sen’s slope estimate of 0.25 µg/L/yr. The current zinc values are approximately 15% of the AWQS. HGCMC feels that the current sampling schedule adequately characterizes the water quality parameters at this site.
Mann-Kendall test statistics Sen's slope estimaten* p** Trend Q Q(%)
Conductivity Field 6 0.24pH Field 6 0.24Alkalinity, Total 6 0.14Sulfate, Total 6 0.39Zinc, Dissolved 6 0.02 + 0.25 4.5* Number of Years ** Significance level
Table of Summary Statistics for Trend Analysis
Parameter
362

Sample Date/Parameter Oct 2013 Nov 2013 Dec 2013 Jan 2014 Feb 2014 Mar 2014 Apr 2014 May 2014 Jun 2014 Jul 2014 Aug 2014 Sep 2014 MedianWater Temp (°C) 0 10.3 10.8 10.5 10.4Conductivity-Field(µmho) 61 56 51 47.6 53.5Conductivity-Lab (µmho) 57 51 49 46 50pH Lab (standard units) 6.47 6.29 6.2 6.46 6.38pH Field (standard units) 6.73 6.45 6.72 6.79 6.73Total Alkalinity (mg/L) 14.3 9.2 9 11.9 10.6Total Sulfate (mg/L) 2.5 5.5 4.7 2.1 3.6Hardness (mg/L) 26.4 19.8 22.6 24.4 23.5Dissolved As (ug/L) 2.09 1.51 3.19 3.14 2.615Dissolved Ba (ug/L) 20.7 17.3 25.6 26.6 23.2Dissolved Cd (ug/L) 0.0174 0.0122 0.011 0.0237 0.0148Dissolved Cr (ug/L) 1.72 1.57 1.54 2.05 1.645Dissolved Cu (ug/L) 0.851 1.08 1.59 1.32 1.200Dissolved Pb (ug/L) 0.291 0.168 0.401 0.336 0.3135Dissolved Ni (ug/L) 1.27 1.01 1.51 1.67 1.390Dissolved Ag (ug/L) 0.005 0.005 0.007 0.014 0.006Dissolved Zn (ug/L) 5.13 5.18 7.06 7.13 6.12Dissolved Se (ug/L) 0.253 0.176 0.216 0.176 0.196Dissolved Hg (ug/L) 0.00704 0.0116 0.0162 0.0174 0.013900
For individual sample/analyte qualifier descriptions see "Qualified Data by QA Reviewer" table.Values reported as less than MDL are replaced by 1/2 MDL for median calculation purposes.Shaded data has been qualified as an outlier by HGCMC and removed from any further analysis and is not included into the calculation of the median
Table of Results for Water Year 2014
Site 060FMS - 'Lower Althea creek'
363

Date Range: 10/01/2013 to 09/30/2014
Site No. Sample Date Sample Time Parameter Value Qualifier Reason for Qualifier
Qualified Data by QA Reviewer
060FMS 11/18/2013 12:00 PM Diss. Ag-ICP/MS 0.0049 J Below Quantitative Range
Diss. Se-ICP/MS 0.25 J Below Quantitative Range
060FMS 5/12/2014 12:00 PM Alkalinity 9.2 U Trip Blank Contamination
Conductivity 51 U Trip Blank Contamination
Diss. Ag-ICP/MS 0.00533 J Below Quantitative Range, Duplicate RPD
Diss. Se-ICP/MS 0.17 J Below Quantitative Range
Sulfate 5.47 J Below Quantitative Range, Sample Receipt T
060FMS 7/15/2014 12:00 PM Diss. Ag-ICP/MS 0.00712 J Below Quantitative Range
Diss. Se-ICP/MS 0.21 J Below Quantitative Range
060FMS 9/15/2014 12:00 PM Diss. Se-ICP/MS 0.17 J Below Quantitative Range
364

●
●●
●
●
●
●
● ●
●
●
●●
●
● ● ●0
48
Site 60 − Water Temperature°C
2009
2010
2011
2012
2013
●
●
●
●
●
●
●
●●
●
●
●●
●
●●
●
05
1015
20
°C
Oct
200
9
Oct
201
0
Oct
201
1
Oct
201
2
Oct
201
3
Water Temperature Upper Limit Lower Limit
Note: the AWQS may not be shown in order to allow greater visual detail of measured values for trend analysis
365

●●
●
●
●
● ●●
●● ●
●●
●
●● ● ●
040
80
Site 60 − Conductivity LaboratoryµS
/cm
2009
2010
2011
2012
2013
● ● ●
●●
● ● ● ● ● ●● ● ●
● ● ● ●
020
040
060
080
0
µS/c
m
Oct
200
9
Oct
201
0
Oct
201
1
Oct
201
2
Oct
201
3
Conductivity Laboratory Upper Limit Lower Limit
Note: the AWQS may not be shown in order to allow greater visual detail of measured values for trend analysis
366

● ● ●
●
●
●
●●
● ● ●
●● ● ●
●● ●
040
80
Site 60 − Conductivity FieldµS
/cm
2009
2010
2011
2012
2013
● ● ●
●●
●● ● ● ● ●
● ● ● ● ● ● ●
020
040
060
080
0
µS/c
m
Oct
200
9
Oct
201
0
Oct
201
1
Oct
201
2
Oct
201
3
Conductivity Field Upper Limit Lower Limit
Note: the AWQS may not be shown in order to allow greater visual detail of measured values for trend analysis
367

●
●
●
●
●
●
●
● ●●
●●
●
● ●● ●
●
5.5
6.5
Site 60 − pH Laboratorysu
2009
2010
2011
2012
2013
●
●
●
●
●
●
●
●●
●
●
●
●
● ●
●●
●
45
67
89
su
Oct
200
9
Oct
201
0
Oct
201
1
Oct
201
2
Oct
201
3
pH Laboratory Upper Limit Lower Limit
Note: the AWQS may not be shown in order to allow greater visual detail of measured values for trend analysis
368

●
● ●●
●
●
●
●
●
●
●
●● ●
●●
● ●
56
78
Site 60 − pH Fieldsu
2009
2010
2011
2012
2013
●
● ●
●
●
●
●
●
●
●
●
●
●●
●
●
●●
45
67
89
su
Oct
200
9
Oct
201
0
Oct
201
1
Oct
201
2
Oct
201
3
pH Field Upper Limit Lower Limit
Note: the AWQS may not be shown in order to allow greater visual detail of measured values for trend analysis
369

● ●
●
●
● ● ●
●
● ●
● ●
●
●
●
● ●
●
510
1520
Site 60 − Alkalinitym
g/L
2009
2010
2011
2012
2013
● ●● ● ● ● ● ● ● ● ● ●
● ● ●● ●
●
050
100
150
200
250
mg/
L
Oct
200
9
Oct
201
0
Oct
201
1
Oct
201
2
Oct
201
3
Alkalinity Upper Limit Lower Limit
Note: the AWQS may not be shown in order to allow greater visual detail of measured values for trend analysis
370

● ● ●
●
● ● ● ● ●
●
● ● ●
●
●
●
●
●
02
46
Site 60 − Sulfate Totalm
g/L
2009
2010
2011
2012
2013
● ● ●●
● ● ● ● ●●
● ● ●●
●● ● ●0
5010
015
020
025
030
0
mg/
L
Oct
200
9
Oct
201
0
Oct
201
1
Oct
201
2
Oct
201
3
Sulfate Total Upper Limit Lower Limit
Note: the AWQS may not be shown in order to allow greater visual detail of measured values for trend analysis
371

● ●
●
● ●●
●●
●●
● ●
●●
●
●●
●0
1020
30
Site 60 − Hardnessm
g/L
2009
2010
2011
2012
2013
● ● ● ● ● ● ● ● ● ● ● ● ● ● ●● ● ●
010
020
030
040
050
0
mg/
L
Oct
200
9
Oct
201
0
Oct
201
1
Oct
201
2
Oct
201
3
Hardness Upper Limit Lower Limit
Note: the AWQS may not be shown in order to allow greater visual detail of measured values for trend analysis
372

●
●●
●
●
●●
●
●●
●
●
●
●
●
●
● ●0.
01.
53.
0
Site 60 − Arsenic Dissolvedµg
/L
2009
2010
2011
2012
2013
●● ●
●●
● ● ●● ●
● ●●
●
●●
● ●
010
2030
40
µg/L
Oct
200
9
Oct
201
0
Oct
201
1
Oct
201
2
Oct
201
3
Arsenic Dissolved Upper Limit Lower Limit
Note: the AWQS may not be shown in order to allow greater visual detail of measured values for trend analysis
373

● ●● ●
●●
● ●
●●
●
●
●●
● ●0
1020
30
Site 60 − Barium Dissolvedµg
/L
2009
2010
2011
2012
2013
● ●
● ●●
●
●●
●●
●
●
●
●
●●
020
4060
80
µg/L
Oct
200
9
Oct
201
0
Oct
201
1
Oct
201
2
Oct
201
3
Barium Dissolved Upper Limit Lower Limit
Note: the AWQS may not be shown in order to allow greater visual detail of measured values for trend analysis
374

●
●
● ●●
●
●
●
●●
●●
●●
●
● ●
●0.
000
0.01
5
Site 60 − Cadmium Dissolvedµg
/L
2009
2010
2011
2012
2013
●●
● ● ●
●●
●● ●
● ●
● ●
●● ●
●
0.00
0.05
0.10
0.15
0.20
0.25
µg/L
Oct
200
9
Oct
201
0
Oct
201
1
Oct
201
2
Oct
201
3
Cadmium Dissolved Upper Limit Lower Limit
Note: the AWQS may not be shown in order to allow greater visual detail of measured values for trend analysis
375

●●
●●
●
●
●●
●
●
●
● ●● ●
●0.
01.
02.
0
Site 60 − Chromium Dissolvedµg
/L
2009
2010
2011
2012
2013
●●
●●
●●
●●
●
●
●
● ●● ●
●
02
46
810
µg/L
Oct
200
9
Oct
201
0
Oct
201
1
Oct
201
2
Oct
201
3
Chromium Dissolved Upper Limit Lower Limit
Note: the AWQS may not be shown in order to allow greater visual detail of measured values for trend analysis
376

●●
●
●
●●
●●
●●
● ●
●●
●
●
●
●
0.0
1.0
Site 60 − Copper Dissolvedµg
/L
2009
2010
2011
2012
2013
● ●●
●
●●
● ●
●●
● ●● ●
●●
●●
02
46
810
µg/L
Oct
200
9
Oct
201
0
Oct
201
1
Oct
201
2
Oct
201
3
Copper Dissolved Upper Limit Lower Limit
Note: the AWQS may not be shown in order to allow greater visual detail of measured values for trend analysis
377

●
●
●
●
●● ●
●
●
●
●
●
●
●
●
●
●●
0.0
0.3
0.6
Site 60 − Lead Dissolvedµg
/L
2009
2010
2011
2012
2013
● ●●
●● ● ● ●
●
●
●●
●●
●●
● ●
01
23
45
67
µg/L
Oct
200
9
Oct
201
0
Oct
201
1
Oct
201
2
Oct
201
3
Lead Dissolved Upper Limit Lower Limit
Note: the AWQS may not be shown in order to allow greater visual detail of measured values for trend analysis
378

●
●
●●
●●
● ●
●●
●●
●
●
●●
0.0
1.0
2.0
Site 60 − Nickel Dissolvedµg
/L
2009
2010
2011
2012
2013
●●
●●
● ●● ●
● ●
● ●
●●
●●
02
46
810
1214
µg/L
Oct
200
9
Oct
201
0
Oct
201
1
Oct
201
2
Oct
201
3
Nickel Dissolved Upper Limit Lower Limit
Note: the AWQS may not be shown in order to allow greater visual detail of measured values for trend analysis
379

●
●
●●
●●
●
●●
●
●
●
● ●●
●0.
000
0.01
0
Site 60 − Silver Dissolvedµg
/L
2009
2010
2011
2012
2013
● ● ● ● ● ● ● ● ● ● ● ● ● ● ● ●01
23
45
6
µg/L
Oct
200
9
Oct
201
0
Oct
201
1
Oct
201
2
Oct
201
3
Silver Dissolved Upper Limit Lower Limit
Note: the AWQS may not be shown in order to allow greater visual detail of measured values for trend analysis
380

● ● ● ● ●
●
●
●
●
●
● ●
●
●
● ●
● ●0
24
68
Site 60 − Zinc Dissolvedµg
/L
2009
2010
2011
2012
2013
● ● ● ● ●● ● ●
●●
● ● ●●
● ●● ●
020
4060
8010
012
0
µg/L
Oct
200
9
Oct
201
0
Oct
201
1
Oct
201
2
Oct
201
3
Zinc Dissolved Upper Limit Lower Limit
Note: the AWQS may not be shown in order to allow greater visual detail of measured values for trend analysis
381

●
●●
●
●
●
●
●
●
●
●
● ●
●
●
●
0.00
0.15
0.30
Site 60 − Selenium Dissolvedµg
/L
2009
2010
2011
2012
2013
●
● ●●
●
●●
●
●
●
●● ●
● ● ●
01
23
45
µg/L
Oct
200
9
Oct
201
0
Oct
201
1
Oct
201
2
Oct
201
3
Selenium Dissolved Upper Limit Lower Limit
Note: the AWQS may not be shown in order to allow greater visual detail of measured values for trend analysis
382

●
●
●
●
●
●
● ●
●
●
● ●
● ●
●
●
●●
0.00
00.
015
Site 60 − Mercury Dissolvedµg
/L
2009
2010
2011
2012
2013
●
●
●
●
●
●
●
●
●
●
●
●
● ●
●
●
●
●
0.00
00.
005
0.01
00.
015
µg/L
Oct
200
9
Oct
201
0
Oct
201
1
Oct
201
2
Oct
201
3
Mercury Dissolved Upper Limit Lower Limit
Note: the AWQS may not be shown in order to allow greater visual detail of measured values for trend analysis
383

INTERPRETIVE REPORT SITE 609 Sampling at this site was initiated during the spring of Water Year 2013. This site was added to the FWMP at the request of the state and federal regulators. Site 609 is located west of the tailings disposal facility on a small surface drainage. The sampling location is near the bottom of the drainage, therefore monitoring a larger expanse upgradient from the site. The data collected during the current water year are listed in the following “Table of Results for Water Year 2014” report. The table includes all the required FWMP analyte data (field and laboratory) collected for the current water year and a series of flags keyed to the summary report “Qualified Data by QA Reviewer”. The QA report lists any associated data limitations found during the monthly QA reviews of laboratory data for this site. Median values for all analytes have been calculated and are shown in the right-most column of the table of results. Any value reported as less than MDL has been replaced with a value of ½ MDL for the purpose of median calculation. All data collected at this site for the past year is included in the data analyses. As shown in the table below, there were no data outliers.
Sample Date Parameter Value Qualifier Notes No outliers have been identified by HGCMC for the period of October 2012 through September 2014.
The data for Water Year 2014 have been compared to the strictest fresh water quality criterion for each applicable analyte. Two results exceeding these criteria were identified as listed in the table below.
Though two of the four samples were below the minimal limit for alkalinity, the other two samples were above the lower limit. Low alkalinity/pH values are expected, because a portion of the drainage through the site consists of waters originating in the low alkalinity/pH muskeg areas, such as those being monitored at Site 29. Total sulfate was slightly above the AWQS in July and by the September sample was below the AWQS. The other four sulfate samples taken at the site have all been below the AWQS. HGCMC will continue to monitor the site to determine if this increase was transient in nature.
Lower Upper
18-Nov-13 Alkalinity 17.5 mg/L 20 012-May-14 Alkalinity 16 mg/L 20 012-May-14 pH Field 6.32 su 6.5 8.5
15-Jul-14 Sulfate Total 252 mg/L 0 250
Table of Exceedance for Water Year 2014
Sample Date Parameter Value
LimitsHardness
384

Sample Date/Parameter Oct 2013 Nov 2013 Dec 2013 Jan 2014 Feb 2014 Mar 2014 Apr 2014 May 2014 Jun 2014 Jul 2014 Aug 2014 Sep 2014 MedianWater Temp (°C) 0.1 6.9 10.4 10.5 8.7Conductivity-Field(µmho) 430 276 614 556 493.0Conductivity-Lab (µmho) 416 277 562 528 472pH Lab (standard units) 6.76 6.44 7 6.95 6.86pH Field (standard units) 6.77 6.32 6.6 7.05 6.69Total Alkalinity (mg/L) 17.5 16 22.5 22.5 20.0Total Sulfate (mg/L) 172 103 252 246 209.0Hardness (mg/L) 203 119 293 268 235.5Dissolved As (ug/L) 1.1 0.782 1.36 1.46 1.230Dissolved Ba (ug/L) 35.8 33 70.5 55.9 45.9Dissolved Cd (ug/L) 0.121 0.119 0.241 0.155 0.1380Dissolved Cr (ug/L) 1.39 1.41 1.22 1.62 1.400Dissolved Cu (ug/L) 0.578 1.09 1.42 0.708 0.899Dissolved Pb (ug/L) 0.363 0.346 0.435 0.388 0.3755Dissolved Ni (ug/L) 4.12 2.7 6.65 6.15 5.135Dissolved Ag (ug/L) 0.002 0.005 0.002 0.002 0.002Dissolved Zn (ug/L) 78.7 51.9 110 83.5 81.10Dissolved Se (ug/L) 0.64 0.164 1.46 0.686 0.663Dissolved Hg (ug/L) 0.00299 0.00273 0.003 0.00453 0.002995
For individual sample/analyte qualifier descriptions see "Qualified Data by QA Reviewer" table.Values reported as less than MDL are replaced by 1/2 MDL for median calculation purposes.Shaded data has been qualified as an outlier by HGCMC and removed from any further analysis and is not included into the calculation of the median
Table of Results for Water Year 2014
Site 609FMS - 'Further Creek Lower'
385

Date Range: 10/01/2013 to 09/30/2014
Site No. Sample Date Sample Time Parameter Value Qualifier Reason for Qualifier
Qualified Data by QA Reviewer
609FMS 5/12/2014 12:00 PM Alkalinity 16 U Trip Blank Contamination
Diss. Ag-ICP/MS 0.0045 J Below Quantitative Range
Diss. Se-ICP/MS 0.16 J Below Quantitative Range
Sulfate 103 J Sample Receipt Temperature
386

●
● ●
●
●
● ●0
48
Site 609 − Water Temperature°C
2009
2010
2011
2012
2013
●
● ●
●
●
● ●
05
1015
20
°C
Oct
200
9
Oct
201
0
Oct
201
1
Oct
201
2
Oct
201
3
Water Temperature Upper Limit Lower Limit
Note: the AWQS may not be shown in order to allow greater visual detail of measured values for trend analysis
387

●●
● ●
●
●●
020
050
0
Site 609 − Conductivity LaboratoryµS
/cm
2009
2010
2011
2012
2013
●
●
●●
●
●
●
010
020
030
040
050
0
µS/c
m
Oct
200
9
Oct
201
0
Oct
201
1
Oct
201
2
Oct
201
3
Conductivity Laboratory Upper Limit Lower Limit
Note: the AWQS may not be shown in order to allow greater visual detail of measured values for trend analysis
388

●●
●
●
●
●●
020
050
0
Site 609 − Conductivity FieldµS
/cm
2009
2010
2011
2012
2013
●
●
●
●
●
●
●
010
020
030
040
050
0
µS/c
m
Oct
200
9
Oct
201
0
Oct
201
1
Oct
201
2
Oct
201
3
Conductivity Field Upper Limit Lower Limit
Note: the AWQS may not be shown in order to allow greater visual detail of measured values for trend analysis
389

●
●
●
●
●
● ●
6.2
6.8
7.4
Site 609 − pH Laboratorysu
2009
2010
2011
2012
2013
●
●
●
●
●
● ●
45
67
89
su
Oct
200
9
Oct
201
0
Oct
201
1
Oct
201
2
Oct
201
3
pH Laboratory Upper Limit Lower Limit
Note: the AWQS may not be shown in order to allow greater visual detail of measured values for trend analysis
390

●
●●
●
●
●
●
6.0
6.6
7.2
Site 609 − pH Fieldsu
2009
2010
2011
2012
2013
●
●●
●
●
●
●
45
67
89
su
Oct
200
9
Oct
201
0
Oct
201
1
Oct
201
2
Oct
201
3
pH Field Upper Limit Lower Limit
Note: the AWQS may not be shown in order to allow greater visual detail of measured values for trend analysis
391

●
●
●
●
●
● ●16
20
Site 609 − Alkalinitym
g/L
2009
2010
2011
2012
2013
●● ● ● ●
● ●
020
4060
8010
012
014
0
mg/
L
Oct
200
9
Oct
201
0
Oct
201
1
Oct
201
2
Oct
201
3
Alkalinity Upper Limit Lower Limit
Note: the AWQS may not be shown in order to allow greater visual detail of measured values for trend analysis
392

●● ●
●
● ●0
100
200
Site 609 − Sulfate Totalm
g/L
2009
2010
2011
2012
2013
02
46
810
1214
mg/
L
Oct
200
9
Oct
201
0
Oct
201
1
Oct
201
2
Oct
201
3
Sulfate Total Upper Limit Lower Limit
Note: the AWQS may not be shown in order to allow greater visual detail of measured values for trend analysis
393

●●
●
●
●
●●
010
025
0
Site 609 − Hardnessm
g/L
2009
2010
2011
2012
2013
●
●
●
●
●
●
●0
5010
015
020
0
mg/
L
Oct
200
9
Oct
201
0
Oct
201
1
Oct
201
2
Oct
201
3
Hardness Upper Limit Lower Limit
Note: the AWQS may not be shown in order to allow greater visual detail of measured values for trend analysis
394

● ●
●
●
●
●●
0.0
1.0
Site 609 − Arsenic Dissolvedµg
/L
2009
2010
2011
2012
2013
● ●●
● ●● ●
010
2030
40
µg/L
Oct
200
9
Oct
201
0
Oct
201
1
Oct
201
2
Oct
201
3
Arsenic Dissolved Upper Limit Lower Limit
Note: the AWQS may not be shown in order to allow greater visual detail of measured values for trend analysis
395

●
●●
● ●
●
●
020
50
Site 609 − Barium Dissolvedµg
/L
2009
2010
2011
2012
2013
●
●
●
●
●
●
●
020
4060
80
µg/L
Oct
200
9
Oct
201
0
Oct
201
1
Oct
201
2
Oct
201
3
Barium Dissolved Upper Limit Lower Limit
Note: the AWQS may not be shown in order to allow greater visual detail of measured values for trend analysis
396

●
●
●
● ●
●
●
0.00
0.15
Site 609 − Cadmium Dissolvedµg
/L
2009
2010
2011
2012
2013
●
●
●
● ●
●
●
0.00
0.05
0.10
0.15
0.20
0.25
µg/L
Oct
200
9
Oct
201
0
Oct
201
1
Oct
201
2
Oct
201
3
Cadmium Dissolved Upper Limit Lower Limit
Note: the AWQS may not be shown in order to allow greater visual detail of measured values for trend analysis
397

●
●
●
● ●
●
●0.
01.
0
Site 609 − Chromium Dissolvedµg
/L
2009
2010
2011
2012
2013
●
●
●● ●
●
●
02
46
810
µg/L
Oct
200
9
Oct
201
0
Oct
201
1
Oct
201
2
Oct
201
3
Chromium Dissolved Upper Limit Lower Limit
Note: the AWQS may not be shown in order to allow greater visual detail of measured values for trend analysis
398

●●
●
●
●
●
●
0.0
0.5
1.0
Site 609 − Copper Dissolvedµg
/L
2009
2010
2011
2012
2013
●●
●
●
●
●
●
02
46
810
µg/L
Oct
200
9
Oct
201
0
Oct
201
1
Oct
201
2
Oct
201
3
Copper Dissolved Upper Limit Lower Limit
Note: the AWQS may not be shown in order to allow greater visual detail of measured values for trend analysis
399

●
●
●
● ●
●●
0.0
0.2
0.4
Site 609 − Lead Dissolvedµg
/L
2009
2010
2011
2012
2013
●●
●
● ●● ●
01
23
45
67
µg/L
Oct
200
9
Oct
201
0
Oct
201
1
Oct
201
2
Oct
201
3
Lead Dissolved Upper Limit Lower Limit
Note: the AWQS may not be shown in order to allow greater visual detail of measured values for trend analysis
400

●●
●
●
●
●●
02
46
8
Site 609 − Nickel Dissolvedµg
/L
2009
2010
2011
2012
2013
●
●
●
●
●
●
●
02
46
810
1214
µg/L
Oct
200
9
Oct
201
0
Oct
201
1
Oct
201
2
Oct
201
3
Nickel Dissolved Upper Limit Lower Limit
Note: the AWQS may not be shown in order to allow greater visual detail of measured values for trend analysis
401

●
●
● ●
●
● ●
0.00
00.
006
Site 609 − Silver Dissolvedµg
/L
2009
2010
2011
2012
2013
● ● ● ● ● ● ●0.0
0.2
0.4
0.6
0.8
1.0
µg/L
Oct
200
9
Oct
201
0
Oct
201
1
Oct
201
2
Oct
201
3
Silver Dissolved Upper Limit Lower Limit
Note: the AWQS may not be shown in order to allow greater visual detail of measured values for trend analysis
402

●
●
●
●
●
●
●
040
80
Site 609 − Zinc Dissolvedµg
/L
2009
2010
2011
2012
2013
●
●
●
●
●
●
●
020
4060
8010
012
0
µg/L
Oct
200
9
Oct
201
0
Oct
201
1
Oct
201
2
Oct
201
3
Zinc Dissolved Upper Limit Lower Limit
Note: the AWQS may not be shown in order to allow greater visual detail of measured values for trend analysis
403

●
●
●
●
●
●
●
0.0
0.5
1.0
1.5
Site 609 − Selenium Dissolvedµg
/L
2009
2010
2011
2012
2013
●
●
●
●
●
●
●
01
23
45
µg/L
Oct
200
9
Oct
201
0
Oct
201
1
Oct
201
2
Oct
201
3
Selenium Dissolved Upper Limit Lower Limit
Note: the AWQS may not be shown in order to allow greater visual detail of measured values for trend analysis
404

●
●
●
●●
●
●0.
000
0.00
3
Site 609 − Mercury Dissolvedµg
/L
2009
2010
2011
2012
2013
●
●
●
●●
●
●
0.00
00.
002
0.00
40.
006
0.00
80.
010
0.01
2
µg/L
Oct
200
9
Oct
201
0
Oct
201
1
Oct
201
2
Oct
201
3
Mercury Dissolved Upper Limit Lower Limit
Note: the AWQS may not be shown in order to allow greater visual detail of measured values for trend analysis
405

INTERPRETIVE REPORT SITE 711 Sampling at this site was initiated during the spring of Water Year 2014. This site was added to the FWMP at the request of the Forest Service. Site 711is located on Greens Creek upgradient to any drainage from Site E, a waste rock disposal area. The data collected during the current water year are listed in the following “Table of Results for Water Year 2014” report. The table includes all the required FWMP analyte data (field and laboratory) collected for the current water year and a series of flags keyed to the summary report “Qualified Data by QA Reviewer”. The QA report lists any associated data limitations found during the monthly QA reviews of laboratory data for this site. Median values for all analytes have been calculated and are shown in the right-most column of the table of results. Any value reported as less than MDL has been replaced with a value of ½ MDL for the purpose of median calculation. All data collected at this site for the past year is included in the data analyses. As shown in the table below, there were no data outliers.
Sample Date Parameter Value Qualifier Notes No outliers have been identified by HGCMC for the period of October 2013 through September 2014.
The data for Water Year 2014 have been compared to the strictest fresh water quality criterion for each applicable analyte. No results exceeding these criteria were identified as listed in the table below.
X-Y plots have been generated to graphically present the data for each of the analytes requested in the Statistical Information Goals for this site. Because of the limited amount of data, visual trend analysis and statistical analysis of the data was not performed
Lower Upper
LimitsHardness
No exceedances have been identified by HGCMC for the period of October 2013 through September 2014.
Table of Exceedance for Water Year 2014
Sample Date Parameter Value
406

Sample Date/Parameter Oct 2013 Nov 2013 Dec 2013 Jan 2014 Feb 2014 Mar 2014 Apr 2014 May 2014 Jun 2014 Jul 2014 Aug 2014 Sep 2014 MedianWater Temp (°C) 5.5 8.8 7.2Conductivity-Field(µmho) 98 157.6 127.8Conductivity-Lab (µmho) 97 153 125pH Lab (standard units) 7.63 7.72 7.68pH Field (standard units) 7.83 8.28 8.06Total Alkalinity (mg/L) 36.3 58.9 47.6Total Sulfate (mg/L) 8.3 15.7 12.0Hardness (mg/L) 44.9 74.9 59.9Dissolved As (ug/L) 0.186 0.284 0.235Dissolved Ba (ug/L) 23.6 23.6Dissolved Cd (ug/L) 0.0232 0.0341 0.0287Dissolved Cr (ug/L) 0.466 0.466Dissolved Cu (ug/L) 0.466 0.525 0.496Dissolved Pb (ug/L) 0.0093 0.0143 0.0118Dissolved Ni (ug/L) 0.479 0.479Dissolved Ag (ug/L) 0.002 0.002Dissolved Zn (ug/L) 1.88 2.94 2.41Dissolved Se (ug/L) 0.688 0.688Dissolved Hg (ug/L) 0.000843 0.000737 0.000790
For individual sample/analyte qualifier descriptions see "Qualified Data by QA Reviewer" table.Values reported as less than MDL are replaced by 1/2 MDL for median calculation purposes.Shaded data has been qualified as an outlier by HGCMC and removed from any further analysis and is not included into the calculation of the median
Table of Results for Water Year 2014
Site 711FMS - 'Greens Creek Above Site E'
407

●
●0
24
68
Site 711 − Water Temperature°C
2009
2010
2011
2012
2013
●
●
05
1015
20
°C
Oct
200
9
Oct
201
0
Oct
201
1
Oct
201
2
Oct
201
3
Water Temperature Upper Limit Lower Limit
Note: the AWQS may not be shown in order to allow greater visual detail of measured values for trend analysis
408

●
●0
5015
0
Site 711 − Conductivity LaboratoryµS
/cm
2009
2010
2011
2012
2013
●
●
050
100
150
200
250
300
350
µS/c
m
Oct
200
9
Oct
201
0
Oct
201
1
Oct
201
2
Oct
201
3
Conductivity Laboratory Upper Limit Lower Limit
Note: the AWQS may not be shown in order to allow greater visual detail of measured values for trend analysis
409

●
●0
5015
0
Site 711 − Conductivity FieldµS
/cm
2009
2010
2011
2012
2013
●
●
050
100
150
200
250
300
350
µS/c
m
Oct
200
9
Oct
201
0
Oct
201
1
Oct
201
2
Oct
201
3
Conductivity Field Upper Limit Lower Limit
Note: the AWQS may not be shown in order to allow greater visual detail of measured values for trend analysis
410

●●
6.5
7.5
Site 711 − pH Laboratorysu
2009
2010
2011
2012
2013
●●
56
78
910
su
Oct
200
9
Oct
201
0
Oct
201
1
Oct
201
2
Oct
201
3
pH Laboratory Upper Limit Lower Limit
Note: the AWQS may not be shown in order to allow greater visual detail of measured values for trend analysis
411

●
●6.
57.
58.
5
Site 711 − pH Fieldsu
2009
2010
2011
2012
2013
●
●
56
78
910
su
Oct
200
9
Oct
201
0
Oct
201
1
Oct
201
2
Oct
201
3
pH Field Upper Limit Lower Limit
Note: the AWQS may not be shown in order to allow greater visual detail of measured values for trend analysis
412

●
●20
4060
Site 711 − Alkalinitym
g/L
2009
2010
2011
2012
2013
●
●
020
4060
8010
012
014
0
mg/
L
Oct
200
9
Oct
201
0
Oct
201
1
Oct
201
2
Oct
201
3
Alkalinity Upper Limit Lower Limit
Note: the AWQS may not be shown in order to allow greater visual detail of measured values for trend analysis
413

●
●0
510
15
Site 711 − Sulfate Totalm
g/L
2009
2010
2011
2012
2013
●
●
010
2030
4050
mg/
L
Oct
200
9
Oct
201
0
Oct
201
1
Oct
201
2
Oct
201
3
Sulfate Total Upper Limit Lower Limit
Note: the AWQS may not be shown in order to allow greater visual detail of measured values for trend analysis
414

●
●0
2060
Site 711 − Hardnessm
g/L
2009
2010
2011
2012
2013
●
●
020
4060
8010
012
014
0
mg/
L
Oct
200
9
Oct
201
0
Oct
201
1
Oct
201
2
Oct
201
3
Hardness Upper Limit Lower Limit
Note: the AWQS may not be shown in order to allow greater visual detail of measured values for trend analysis
415

●
●0.
000.
15
Site 711 − Arsenic Dissolvedµg
/L
2009
2010
2011
2012
2013
●●
01
23
45
µg/L
Oct
200
9
Oct
201
0
Oct
201
1
Oct
201
2
Oct
201
3
Arsenic Dissolved Upper Limit Lower Limit
Note: the AWQS may not be shown in order to allow greater visual detail of measured values for trend analysis
416

●0
1020
Site 711 − Barium Dissolvedµg
/L
2009
2010
2011
2012
2013
●
010
2030
4050
6070
µg/L
Oct
200
9
Oct
201
0
Oct
201
1
Oct
201
2
Oct
201
3
Barium Dissolved Upper Limit Lower Limit
Note: the AWQS may not be shown in order to allow greater visual detail of measured values for trend analysis
417

●
●0.
000
0.02
0
Site 711 − Cadmium Dissolvedµg
/L
2009
2010
2011
2012
2013
●
●
0.00
0.05
0.10
0.15
0.20
0.25
µg/L
Oct
200
9
Oct
201
0
Oct
201
1
Oct
201
2
Oct
201
3
Cadmium Dissolved Upper Limit Lower Limit
Note: the AWQS may not be shown in order to allow greater visual detail of measured values for trend analysis
418

●0.
00.
20.
4
Site 711 − Chromium Dissolvedµg
/L
2009
2010
2011
2012
2013
●
01
23
45
µg/L
Oct
200
9
Oct
201
0
Oct
201
1
Oct
201
2
Oct
201
3
Chromium Dissolved Upper Limit Lower Limit
Note: the AWQS may not be shown in order to allow greater visual detail of measured values for trend analysis
419

●●
0.0
0.2
0.4
Site 711 − Copper Dissolvedµg
/L
2009
2010
2011
2012
2013
● ●
01
23
45
67
µg/L
Oct
200
9
Oct
201
0
Oct
201
1
Oct
201
2
Oct
201
3
Copper Dissolved Upper Limit Lower Limit
Note: the AWQS may not be shown in order to allow greater visual detail of measured values for trend analysis
420

●
●0.
000
0.01
0
Site 711 − Lead Dissolvedµg
/L
2009
2010
2011
2012
2013
● ●
0.0
0.5
1.0
1.5
2.0
µg/L
Oct
200
9
Oct
201
0
Oct
201
1
Oct
201
2
Oct
201
3
Lead Dissolved Upper Limit Lower Limit
Note: the AWQS may not be shown in order to allow greater visual detail of measured values for trend analysis
421

●0.
00.
20.
4
Site 711 − Nickel Dissolvedµg
/L
2009
2010
2011
2012
2013
●
02
46
810
1214
µg/L
Oct
200
9
Oct
201
0
Oct
201
1
Oct
201
2
Oct
201
3
Nickel Dissolved Upper Limit Lower Limit
Note: the AWQS may not be shown in order to allow greater visual detail of measured values for trend analysis
422

●
−1.0
0.0
1.0
Site 711 − Silver Dissolvedµg
/L
2009
2010
2011
2012
2013
●0.0
0.5
1.0
1.5
2.0
2.5
3.0
µg/L
Oct
200
9
Oct
201
0
Oct
201
1
Oct
201
2
Oct
201
3
Silver Dissolved Upper Limit Lower Limit
Note: the AWQS may not be shown in order to allow greater visual detail of measured values for trend analysis
423

●
●0.
01.
02.
03.
0
Site 711 − Zinc Dissolvedµg
/L
2009
2010
2011
2012
2013
●●
020
4060
80
µg/L
Oct
200
9
Oct
201
0
Oct
201
1
Oct
201
2
Oct
201
3
Zinc Dissolved Upper Limit Lower Limit
Note: the AWQS may not be shown in order to allow greater visual detail of measured values for trend analysis
424

●0.
00.
30.
6
Site 711 − Selenium Dissolvedµg
/L
2009
2010
2011
2012
2013
●
01
23
45
µg/L
Oct
200
9
Oct
201
0
Oct
201
1
Oct
201
2
Oct
201
3
Selenium Dissolved Upper Limit Lower Limit
Note: the AWQS may not be shown in order to allow greater visual detail of measured values for trend analysis
425

●
●0e
+00
6e−0
4
Site 711 − Mercury Dissolvedµg
/L
2009
2010
2011
2012
2013
● ●
0.00
00.
002
0.00
40.
006
0.00
80.
010
0.01
2
µg/L
Oct
200
9
Oct
201
0
Oct
201
1
Oct
201
2
Oct
201
3
Mercury Dissolved Upper Limit Lower Limit
Note: the AWQS may not be shown in order to allow greater visual detail of measured values for trend analysis
426

INTERPRETIVE REPORT SITE 712 Sampling at this site was initiated during the spring of Water Year 2014. This site was added to the FWMP at the request of the Forest Service. Site 712 is located on Greens Creek down gradient to any drainage from Site E, a waste rock disposal area. The data collected during the current water year are listed in the following “Table of Results for Water Year 2014” report. The table includes all the required FWMP analyte data (field and laboratory) collected for the current water year and a series of flags keyed to the summary report “Qualified Data by QA Reviewer”. The QA report lists any associated data limitations found during the monthly QA reviews of laboratory data for this site. Median values for all analytes have been calculated and are shown in the right-most column of the table of results. Any value reported as less than MDL has been replaced with a value of ½ MDL for the purpose of median calculation. All data collected at this site for the past year is included in the data analyses. As shown in the table below, there were no data outliers.
Sample Date Parameter Value Qualifier Notes No outliers have been identified by HGCMC for the period of October 2013 through September 2014.
The data for Water Year 2014 have been compared to the strictest fresh water quality criterion for each applicable analyte. No results exceeding these criteria were identified as listed in the table below.
X-Y plots have been generated to graphically present the data for each of the analytes requested in the Statistical Information Goals for this site. Because of the limited amount of data, visual trend analysis and statistical analysis of the data was not performed
Lower Upper
LimitsHardness
No exceedances have been identified by HGCMC for the period of October 2013 through September 2014.
Table of Exceedance for Water Year 2014
Sample Date Parameter Value
427

Sample Date/Parameter Oct 2013 Nov 2013 Dec 2013 Jan 2014 Feb 2014 Mar 2014 Apr 2014 May 2014 Jun 2014 Jul 2014 Aug 2014 Sep 2014 MedianWater Temp (°C) 5.3 8.6 7.0Conductivity-Field(µmho) 98 159.1 128.6Conductivity-Lab (µmho) 98 157 128pH Lab (standard units) 7.65 7.71 7.68pH Field (standard units) 7.8 8.15 7.98Total Alkalinity (mg/L) 36.9 59.7 48.3Total Sulfate (mg/L) 8.7 16.3 12.5Hardness (mg/L) 45.5 75.8 60.7Dissolved As (ug/L) 0.185 0.277 0.231Dissolved Ba (ug/L) 23.7 23.7Dissolved Cd (ug/L) 0.0225 0.0367 0.0296Dissolved Cr (ug/L) 0.519 0.519Dissolved Cu (ug/L) 0.482 0.515 0.499Dissolved Pb (ug/L) 0.0098 0.0109 0.0104Dissolved Ni (ug/L) 0.487 0.487Dissolved Ag (ug/L) 0.006 0.006Dissolved Zn (ug/L) 2.09 3.69 2.89Dissolved Se (ug/L) 0.633 0.633Dissolved Hg (ug/L) 0.000779 0.000745 0.000762
For individual sample/analyte qualifier descriptions see "Qualified Data by QA Reviewer" table.Values reported as less than MDL are replaced by 1/2 MDL for median calculation purposes.Shaded data has been qualified as an outlier by HGCMC and removed from any further analysis and is not included into the calculation of the median
Table of Results for Water Year 2014
Site 712FMS - 'Greens Creek Below Site E'
428

●
●0
24
68
Site 712 − Water Temperature°C
2009
2010
2011
2012
2013
●
●
05
1015
20
°C
Oct
200
9
Oct
201
0
Oct
201
1
Oct
201
2
Oct
201
3
Water Temperature Upper Limit Lower Limit
Note: the AWQS may not be shown in order to allow greater visual detail of measured values for trend analysis
429
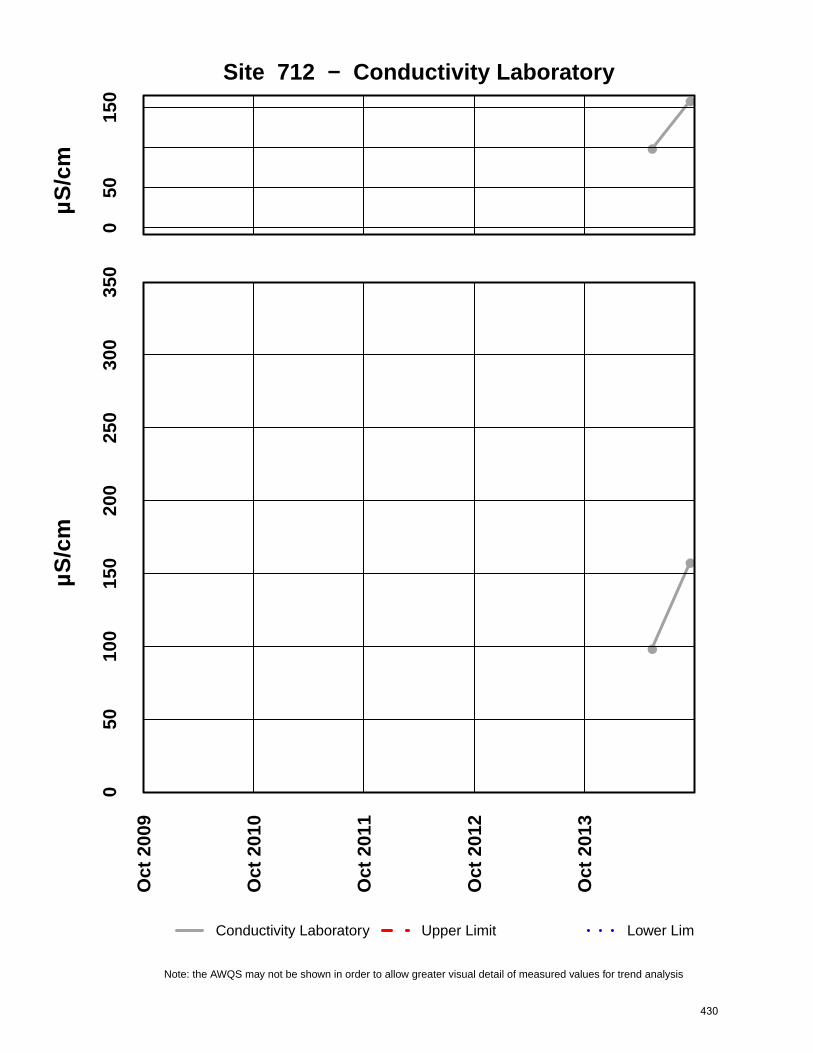
●
●0
5015
0
Site 712 − Conductivity LaboratoryµS
/cm
2009
2010
2011
2012
2013
●
●
050
100
150
200
250
300
350
µS/c
m
Oct
200
9
Oct
201
0
Oct
201
1
Oct
201
2
Oct
201
3
Conductivity Laboratory Upper Limit Lower Limit
Note: the AWQS may not be shown in order to allow greater visual detail of measured values for trend analysis
430

●
●0
5015
0
Site 712 − Conductivity FieldµS
/cm
2009
2010
2011
2012
2013
●
●
050
100
150
200
250
300
350
µS/c
m
Oct
200
9
Oct
201
0
Oct
201
1
Oct
201
2
Oct
201
3
Conductivity Field Upper Limit Lower Limit
Note: the AWQS may not be shown in order to allow greater visual detail of measured values for trend analysis
431

● ●6.
57.
5
Site 712 − pH Laboratorysu
2009
2010
2011
2012
2013
●●
56
78
910
su
Oct
200
9
Oct
201
0
Oct
201
1
Oct
201
2
Oct
201
3
pH Laboratory Upper Limit Lower Limit
Note: the AWQS may not be shown in order to allow greater visual detail of measured values for trend analysis
432

●
●6.
57.
58.
5
Site 712 − pH Fieldsu
2009
2010
2011
2012
2013
●
●
56
78
910
su
Oct
200
9
Oct
201
0
Oct
201
1
Oct
201
2
Oct
201
3
pH Field Upper Limit Lower Limit
Note: the AWQS may not be shown in order to allow greater visual detail of measured values for trend analysis
433

●
●20
4060
Site 712 − Alkalinitym
g/L
2009
2010
2011
2012
2013
●
●
020
4060
8010
012
014
0
mg/
L
Oct
200
9
Oct
201
0
Oct
201
1
Oct
201
2
Oct
201
3
Alkalinity Upper Limit Lower Limit
Note: the AWQS may not be shown in order to allow greater visual detail of measured values for trend analysis
434

●
●0
510
15
Site 712 − Sulfate Totalm
g/L
2009
2010
2011
2012
2013
●
●
010
2030
4050
mg/
L
Oct
200
9
Oct
201
0
Oct
201
1
Oct
201
2
Oct
201
3
Sulfate Total Upper Limit Lower Limit
Note: the AWQS may not be shown in order to allow greater visual detail of measured values for trend analysis
435

●
●0
2060
Site 712 − Hardnessm
g/L
2009
2010
2011
2012
2013
●
●
020
4060
8010
012
014
0
mg/
L
Oct
200
9
Oct
201
0
Oct
201
1
Oct
201
2
Oct
201
3
Hardness Upper Limit Lower Limit
Note: the AWQS may not be shown in order to allow greater visual detail of measured values for trend analysis
436

●
●0.
000.
15
Site 712 − Arsenic Dissolvedµg
/L
2009
2010
2011
2012
2013
●●
01
23
45
µg/L
Oct
200
9
Oct
201
0
Oct
201
1
Oct
201
2
Oct
201
3
Arsenic Dissolved Upper Limit Lower Limit
Note: the AWQS may not be shown in order to allow greater visual detail of measured values for trend analysis
437

●0
1020
Site 712 − Barium Dissolvedµg
/L
2009
2010
2011
2012
2013
●
010
2030
4050
6070
µg/L
Oct
200
9
Oct
201
0
Oct
201
1
Oct
201
2
Oct
201
3
Barium Dissolved Upper Limit Lower Limit
Note: the AWQS may not be shown in order to allow greater visual detail of measured values for trend analysis
438
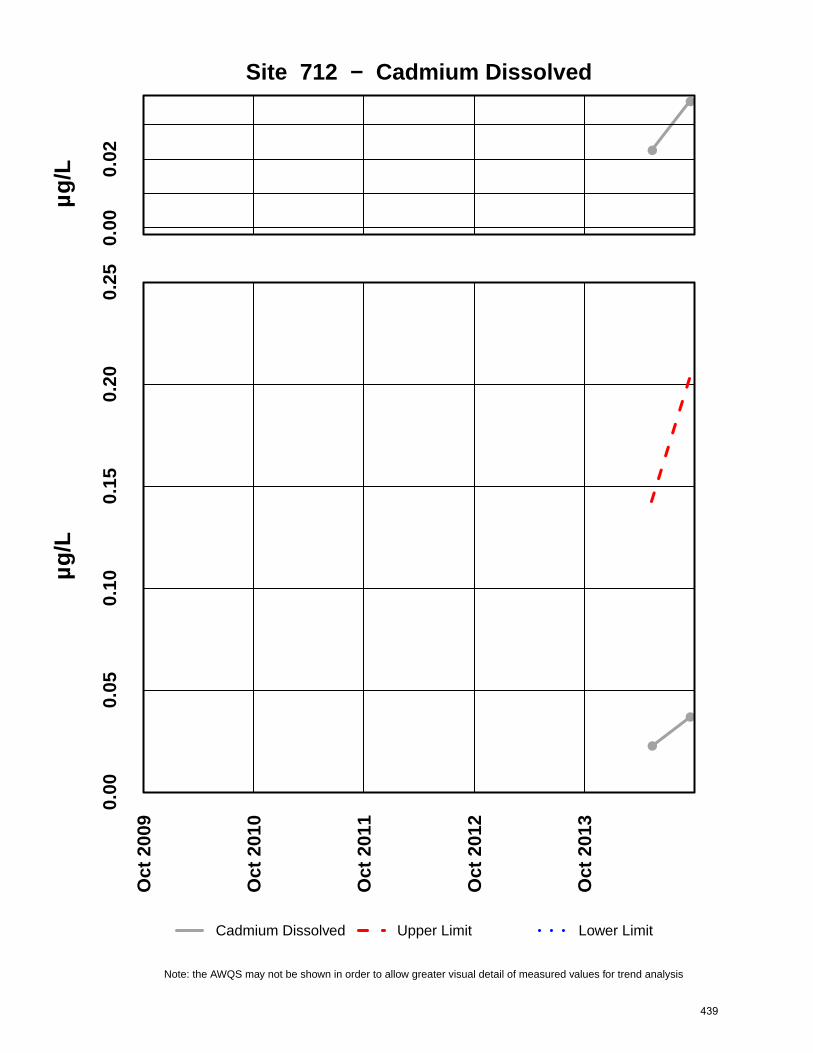
●
●0.
000.
02
Site 712 − Cadmium Dissolvedµg
/L
2009
2010
2011
2012
2013
●
●
0.00
0.05
0.10
0.15
0.20
0.25
µg/L
Oct
200
9
Oct
201
0
Oct
201
1
Oct
201
2
Oct
201
3
Cadmium Dissolved Upper Limit Lower Limit
Note: the AWQS may not be shown in order to allow greater visual detail of measured values for trend analysis
439

●0.
00.
20.
4
Site 712 − Chromium Dissolvedµg
/L
2009
2010
2011
2012
2013
●
01
23
45
µg/L
Oct
200
9
Oct
201
0
Oct
201
1
Oct
201
2
Oct
201
3
Chromium Dissolved Upper Limit Lower Limit
Note: the AWQS may not be shown in order to allow greater visual detail of measured values for trend analysis
440

●●
0.0
0.2
0.4
Site 712 − Copper Dissolvedµg
/L
2009
2010
2011
2012
2013
● ●
01
23
45
67
µg/L
Oct
200
9
Oct
201
0
Oct
201
1
Oct
201
2
Oct
201
3
Copper Dissolved Upper Limit Lower Limit
Note: the AWQS may not be shown in order to allow greater visual detail of measured values for trend analysis
441

●●
0.00
00.
006
Site 712 − Lead Dissolvedµg
/L
2009
2010
2011
2012
2013
● ●
0.0
0.5
1.0
1.5
2.0
µg/L
Oct
200
9
Oct
201
0
Oct
201
1
Oct
201
2
Oct
201
3
Lead Dissolved Upper Limit Lower Limit
Note: the AWQS may not be shown in order to allow greater visual detail of measured values for trend analysis
442

●0.
00.
20.
4
Site 712 − Nickel Dissolvedµg
/L
2009
2010
2011
2012
2013
●
02
46
810
1214
µg/L
Oct
200
9
Oct
201
0
Oct
201
1
Oct
201
2
Oct
201
3
Nickel Dissolved Upper Limit Lower Limit
Note: the AWQS may not be shown in order to allow greater visual detail of measured values for trend analysis
443

●0.
000
0.00
4
Site 712 − Silver Dissolvedµg
/L
2009
2010
2011
2012
2013
●0.0
0.5
1.0
1.5
2.0
2.5
3.0
µg/L
Oct
200
9
Oct
201
0
Oct
201
1
Oct
201
2
Oct
201
3
Silver Dissolved Upper Limit Lower Limit
Note: the AWQS may not be shown in order to allow greater visual detail of measured values for trend analysis
444

●
●0
12
3
Site 712 − Zinc Dissolvedµg
/L
2009
2010
2011
2012
2013
●●
020
4060
80
µg/L
Oct
200
9
Oct
201
0
Oct
201
1
Oct
201
2
Oct
201
3
Zinc Dissolved Upper Limit Lower Limit
Note: the AWQS may not be shown in order to allow greater visual detail of measured values for trend analysis
445

●0.
00.
30.
6
Site 712 − Selenium Dissolvedµg
/L
2009
2010
2011
2012
2013
●
01
23
45
µg/L
Oct
200
9
Oct
201
0
Oct
201
1
Oct
201
2
Oct
201
3
Selenium Dissolved Upper Limit Lower Limit
Note: the AWQS may not be shown in order to allow greater visual detail of measured values for trend analysis
446

● ●0e
+00
6e−0
4
Site 712 − Mercury Dissolvedµg
/L
2009
2010
2011
2012
2013
● ●
0.00
00.
002
0.00
40.
006
0.00
80.
010
0.01
2
µg/L
Oct
200
9
Oct
201
0
Oct
201
1
Oct
201
2
Oct
201
3
Mercury Dissolved Upper Limit Lower Limit
Note: the AWQS may not be shown in order to allow greater visual detail of measured values for trend analysis
447

APPENDIX B
Map Sheets
Map 1-920 Area FWMP Sites
Map 2-Tailings Area FWMP Sites
Map 3-Site 9, Tributary Creek
448

criteria as multilply by conversion factor to convert to criteria as multiply by conversion factor to convert
to
alkalinity 20,000 minimum
As 10 50 100 340 TR 1 D 150 TR 1 D
Ba 2,000
Cd 5 10 10 e^1.0166(ln hardness)-3.924 TR 1.136672-[(ln hardness)(0.041838)] D e^0.7409(ln hardness)-4.719 TR 1.101672-[(ln hardness)(0.041838)] D
Cr 100
Cr(total) 100
Cr(III) e^0.819(ln hardness)+3.7256 TR 0.316 D e^0.819(ln hardness)+0.6848 TR 0.860 D
Cr(VI) 50 16 D 11 D
Cu 200 e^0.9422(ln hardness)-1.700 TR 0.960 D e^0.8545(ln hardness)-1.702 TR 0.960 D 1,300
Pb 50 5,000 e^1.273(ln hardness)-1.460 TR 1.46203-[(ln hardness)(0.145712)] D e^1.273(ln hardness)-4.705 TR 1.46203-[(ln hardness)(0.145712)] D
Hg 2 1.4 D 0.012 TR 0.05 0.051
Ni 100 200 e^0.846(ln hardness)+2.255 TR 0.998 D e^0.846(ln hardness)+0.0584 TR 0.997 D 610 4,600
Se 50 10 20 1/[([selenite]/185.9)+([selenate]/12.83] TR 0.922 D 5 TR 0.922 D 170 11,000
Ag e^1.72(ln hardness)-6.52 TR 0.850 D
Zn 2,000 e^0.8473(ln hardness)+0.884 TR 0.978 D e^0.8473(ln hardness)+0.884 TR 0.986 D 9,100 69,000
all units in micrograms per liter (ug/L) TR total recoverableD dissolvedH some of the criteria for this parameter are hardness dependant
FWA Fresh Water AcuteFWC Fresh Water Chronic
Source: http://www.dec.state.ak.us/water/wqsar/wqs/toxicsbook.xls
Table formatting was modified by HGCMC to include only parameters include in Suite P and Q and to highlight the strictest standard.
Aquatic Life-Fresh Water
Drinkin
g Wate
r
Stockw
ater
APPENDIX A
Irriga
tion W
ater
Acute Chronic
DENOTES STRICTEST CRITERIA
Human Health Criteria for NonCarcinogens
Water + Aquatic
Organisms
Aquatic Organisms
Only
Param
eter
449

#7
#7
#7
#7#7
#7
#7
#7
h
SITE 6
SITE 13SITE 46
SITE 48SITE 49
SITE 54SITE 61
SITE 57920 Area
Site 23
Brui n
Cree
k
Greens Creek
Gal lagher Cree
k
CubC
reek
1350
D raina
ge
B Road
1350
SITE 62
960 Drainage
0 500 1,000 1,500 2,000
Feet IMap 1
FWMP Sample Sites in the 920 Area
Legendh Monitoring Well
#7 Surface Water
Lidar Topo 20' Contour
450

#7
#7
hh
hSITE 27
SITE 29
SITE 32
SITE 60Pond 7
Hawk Inlet
BR
oad
Tailing Dry StackFacility
WaterTreatment
Plant
TruckWash
SITE 609
Fra nklinsC k
Tributary Creek
Further Ck
0 400 800 1,200 1,600
Feet IMap 2
FWMP Sample Sites in the Tailings Area
Legendh Monitoring Well
#7 Surface Water
Lidar Topo 20' Contour
451

#7
#7
#7
hh
h
SITE 9
Hawk Inlet
TributaryCreek
Pond 7
Tailing Dry Stack
Facility
BR
oad
WaterTreatment
Plant
SITE 27SITE 60
SITE 32
SITE 29Truck Wash
SITE 609
FranklinsC
k
0 375 750 1,125 1,500
Feet IMap 3FWMP Site 9
Legendh Monitoring Well
#7 Surface Water
Lidar Topo 20' Contour
452