freshwater gastropods of equatorial africa: correlations
TRANSCRIPT

University of Rhode Island University of Rhode Island
DigitalCommons@URI DigitalCommons@URI
Open Access Master's Theses
1988
Freshwater Gastropods of Equatorial Africa: Correlations Between Freshwater Gastropods of Equatorial Africa: Correlations Between
Shell Isotope Ratios and Environment Shell Isotope Ratios and Environment
Leo Lawoe Amegashitsi University of Rhode Island
Follow this and additional works at: https://digitalcommons.uri.edu/theses
Recommended Citation Recommended Citation Amegashitsi, Leo Lawoe, "Freshwater Gastropods of Equatorial Africa: Correlations Between Shell Isotope Ratios and Environment" (1988). Open Access Master's Theses. Paper 1155. https://digitalcommons.uri.edu/theses/1155
This Thesis is brought to you for free and open access by DigitalCommons@URI. It has been accepted for inclusion in Open Access Master's Theses by an authorized administrator of DigitalCommons@URI. For more information, please contact [email protected].

FRESHWATER GASTROPODS OF EQUATORIAL AFRICA : CORRELATIONS
BE'IWEEN SHELL ISOTOPE RATIOS AND ENVIRONMENT
BY
LEO LAWOE AMEGASHITSI
A THESIS SUBMITTED IN PARTIAL FULFILLMENT OF
THE REQUIREMENTS FOR THE DEGREE OF
MASTER OF SCIENCE
IN
CHEMISTRY
UNIVERSITY OF RHODE ISLAND 1988

MASTER OF SCIENCE THESIS
OF
LEO LAWOE AMEGASHITSI
APPROVED :
THESIS COMMITTEE
Major Professor
DEAN OF THE GRADUATE SCHOOL
UNIVERSITY OF RHODE ISLAND
1988

ABSTRACT
A stable oxygen isotopic study of modern African freshwater
gastropod shells was carried out to ascertain the feasibility of the
use of the stable oxygen isotope ratios of freshwater gastropods as
paleoclimatic indicators.
rn this study, the oxygen isotope ratios of the freshwater
gastropod shell samples taken from the apertures of the individual
shells collected at monthly intervals from one site were examined to
ascertain their correlatability with weather, temperature, rainfall,
water isotope ratios and other ambient conditions. The gastropod
shell analysis was by the procedure of Abell (1985) and the water
sample analysis by the method of Epstein and Mayeda (1953).
The monthly analyses of both water and gastropod shells from the
tributary of the River Pra at Krobo, in the Western region of Ghana,
approximately 700km from the Sahel, have shown amount effect,
temperature effect
temperature plots
and evaporative effect·. Good parallelism between ' 18
and the S o plots of the shells and the water was
observed. The s18o value~ were also in agreement with vegetative
cover map of Ghana and Africa in addition to their correspondence with
seasonality information.
Application of these results to fossil gastropod shells, however,
requires additional geological and geographical data.
ii

ACKNcmLEDGEMENTS
upon completion of this thesis I find myself indebted to many
whose earthly paths have crossed mine in special ways while
undertaking this research work. My sincere gratitude goes to my major
professor, Dr. Paul Abell, who initiated this study and gave me the
necessary assistance and encouragement to complete it.
r owe much to the faculty and staff of the Department of Chemistry
who were supportive and shared their expertise whenever the need
arose. I would like to mention Dr. Jim Fasching, the chairman of the
Department of Chemistry and a member of my thesis committee, for his
support and imput. The support of Dr. Leon Thiem of the Civil
Engineering department and Dr. Saran Trombley of Zoology department,
both members of my thesis committee is hereby acknowledged. The
assistance of the Isotope Geochemistry group at the Graduate School of
Oceanography is very much appreciated especially those of Joseph
Orchardo, Jim Burdett, Dr. Mike Arthur and Dr. Mike Bender.
I greatly appreciate the ~upport, concern and encouragement of the
members of Dr. Abell's research group who have become an integral part
of my life, Joseph Mcclory, Miguel Muzzio, Joseph Yong and Yi Lin. To -
my close associates who have made my stay in Rhode Island a pleasant
and a fulfilling experience, especially, Gabriel Fosu, Hsiu-Ling Liu,
Kwabena Anyane-Yeboa and family, a special note of gratitude is
registered.
iii
The faithfulness and the relentless efforts of the sample
collectors, Leonard Amegashitsi and Richard Oscar Fynn has been a
source of inspiration, not forgetting those who came to my aid when
inter-governmental bureaucratic machinations almost brought this
research to a halt. I owe Mr. C. K. Dewornu (IGP), Mr. S. Y. Apedoe,
peter Adodo, Ben K. Amegashitsi, William Park and Rev. Tettey Bleboo
a heartfelt gratitude for their assistance and support .
The National Science Foundation grant for this project is also
acknowledged.
iv

TABLE OF CONTENTS
INTRODUCTION ... · · . · · · · · · · · · · · · · · · · · . · · ........................... 1
BACKGROUND . . . . . . . . . . . . . . . . . . . . . . . . . . . . . . . . . . . . . . . . . . . . . • . . . . . . . .. 2
STABLE ISOTOPES IN PRECIPITATION AND CAUSES OF FRACTIONATION .... 10
EXPERI~ . ... · .............................................. . 14
CLIMATIC AND WEATHER PATTERNS OF SITE •.•....................... 21
FACTORS THAT INFLUENCE OXYGEN ISOTOPE RATIO IN PRECIPITATION
AND SHELL INCORPORATION ..•••..••.•..•••....•.....•.•..•••..•.•.. 23
FACTORS THAT INFLUENCE OXYGEN ISOTOPE RATIOS IN SURFACE WATER ... 31
RESULTS • ••••.••••••••••••••••••••••••••••••••••••••••••••••••••• 39
DISCUSSION . ......•..........•••.•............................... 54
~CLUSIONS . •. : ...................•••.............•....••....... 6 5
BIBLIOGRAPHY .....•••••.•.....•..••.••....•...•.............•.•.• 6 7
v

LIST OF TABLES
TABLE 1 ... TEMPERA'IURES AND OTHER PREVAILING CONDITIONS
DURING SAMPLING .................................. 1 7
TABLE 2 ... RESULTS OF MULTIPLE LINEAR REGRESSION ANALYSES
(ADAPTED FROM YURTSEVER, 1975) ................... 25
TABLE 3 •.. OXYGEN ISOI'OPE RATIO VALUES OF FRESHWATER
GASTROPOD SHELLS . . . . . . . . . . . . . . . . . • . . . . . . . . . . . . . . . 4 0
TABLE 4 ... 0XYGEN ISOI'OPE RATIO VALUES OF WATER SAMPLES ..... 41
TABLE 5 ... MAXIMA, MINIMA AND AVERAGE TEMPERA'IURES .......... 47
TABLE 6 ... SUMMARY OF CORRELATION VALUES .................... 48
TABLE 7 ... MEAN MONTHLY AND ANNUAL RAINFALL( mm) ••••••••••••• 58
18 TABLE 8 ... SEASONALITY AND S 0 VALUES •..•....•..••........ 59
TABLE 9 ... METEOROGICAL DATA FROM AIRFORCE BASE, TAKORADI. .• 60
vi

LIST OF FIGURES
FIGURE ! .. RELIEF MAP OF GHANA ............................. 15
FIGURE 2 .. 0XYGEN ISOTOPE RATIOS OF COHORT OF SHELLS FROM
KAWOKUDI STREAM IN ACCRA, GHANA ................. 20
FIGURE 3 .. VEGETATION MAP OF GHANA ..•.....•................ 22
FIGURE 4 •• RELATION BE'IWEEN AVERAGE MONTHLY TEMPERA'IURE AND
MEAN OXYGEN ISOTOPE RATIOS IN CONTINENTAL
STATIONS ..•...•..•.••.....•..•.......•••••..... 27
FIGURE 5 •• RELATION BE'IWEEN AVERAGE MONTHLY TEMPERA'IURE AND
MEAN OXYGEN ISOTOPE RATIOS FOR COASTAL STATIONS.28
FIGURE 6 .. AMOUNT EFFECT IN ISLAND STATIONS. PLOT OF MEAN
OXYGEN ISOTOPE RATIOS VERSUS AVERAGE MONTHLY
RAINFALL ••...........•......•.•................. 30
FIGURE 7 .. EXPECTED LATITUDINAL EFFECTS ON OXYGEN ISOTOPE
RATIOS, IGNORING LAND MASS INFLUENCES •.••.•....• 33
FIGURE 8 •. OBSERVED OXYGEN ISOTOPE RATIOS IN FRESHWATER
GASTROPOD SHELLS •.•••••••••••••••.•.......••••.• 36
FIGURE 9 •• VEGETATION MAP OF AFRICA REDRAWN FROM NASA IMAGERY
(.ABELL, 1985) ................................... 38
FIGURE 10 •• PLOT OF OXYGEN ISOTOPE RATIOS OF WATER AND SHELLS
VERSUS MONTH • • . . . • • • • . • • . . . . . . . . . . . . . . • . . . . . . • • . 4 2
FIGURE 11 .. PLOT OF OXYGEN ISOTOPE RATIOS OF WATER AND SHELLS
18 WITHS 0 OF WATER SHIFTED BY ONE MONTH ....•••.• 44
vii
FIGURE 12 •• MEAN MONTHLY TEMPERATURE PLOT OF RIVER PRA •••••• 46
FIGURE 13 .. CORRELATION PLOT OF WATER TEMPERATURE AND OXYGEN
ISOTOPE RATIOS OF THE WATER ••••••••••••••••••••• 50
FIGURE 14 •• CORRELATION PLOT OF WATER TEMPERATURE AND OXYGEN
ISOTOPE RATIOS OF THE SHELLS •••••••••••••••••••• 51
FIGURE 15 •• CORRELATION PLOT OF RAINFALL AND OXYGEN ISOTOPE
RATIOS OF THE WATER ••••••••••••••••••••••••••••• 52
FIGURE 16 •• CORRELATION PLOT OF AIR TEMPERATURE AND OXYGEN
ISOTOPE RATIOS OF THE SHELLS •••••••••••••••••••• 53
FIGURE 17 •• PLOT OF MEAN MONTHLY RAINFALL NEAR THE RIVER
PRA AT KROBO •••••••••••••••••••••••••••••••••••• 55
FIGURE 18 •• ANNUAL MEAN RAINFALL MAP OF GHANA ••••••••••••••• 56
viii

FRESHWATER GASTROPODS OF EQUATORIAL AFRICA
SHELL ISOTOPE RATIOS AND ENVIRONMENT.
CORRELATIONS BE'IWEEN
INTRODUCTION
stable oxygen isotope ratio information from modern African
freshwater gastropods and water samples was examined to ascertain the
reliability of such information as a proxy in the study of
paleoclimates.
The geographical patterns of the stable oxygen isotope ratios
obtained from whole shell analysis of individual African freshwater
shells have already been established by Abell (1985). In this study
reported here, the oxygen isotope ratios of freshwater gastropod shell
samples, taken from the apertures of the individual shells collected
at monthly intervals from one individual site were examined to
ascertain their correlation with weather, temperature, rainfall, water
isotope ratios and other ambient conditions. The gastropods and water
samples studied were collected at monthl.Y intervals from a tributary
of the River Pra at ·Krobo in the Western region of Ghana,
approximately 700km south of the Sahel in the tropical rainforest
region of that country.
How this information on modern African freshwater gastropods can
be applied to interpret the oxygen isotope ratios of some fossil
shells is also examined. If clear correlations exist, then we may
achieve our ultimate goal of interpreting paleoclimates from shell
isotope data.
1

BACKGROUND
In pursuance of the study of paleoclimates many techniques and
substrates have been examined for their utility and reliability, many
of which have been reviewed by Schneider (1984). For example, among
these tools are studies of the identification of pollen grains in
sediments, with the attendant problems of differential production,
distribution and preservation. A second example is the use in
paleontology, of the assumption that modern species of animals
inhabit environments similar to
the distribution of Coleoptera
indication of maxinrum winter
their ancestors. A third example is
beetles in sediments to give a rough
temperatures. Also the deposition of
layers of windblown, yellowish-brown dust called loess can serve as a
paleoclimatic proxy, while the oceans with their accumulation of sand,
mud, gravel, plant and animal fossils also provide geological
paleoclimatic indicators (Schneider 1984). None of the afore
mentioned proxies focusses on short term climatic changes because of
the inability of the substrates examined to provide clear evidence of
short term climatic events. Other problems are the reworking of the
proxy material within the sediments and lack of information on the
longevity of the animal species. Thus, on the time scale of hundreds
or thousands of years, many proxies can give us information about
major climatic changes. However, such important activities as human
habitability of an area depends as much or more on the annual range of
temperatures and the length and severity of annual dry seasons as on
average conditions. It is clear that seasonality will be recorded
2

only in short term climatic conditions such as intra-annual rainfall
and temperatures. Seasonal information will be useful in the
establishment of seasonality in human activity. Since the proxies
mentioned above do not have the capability of recording seasonality,
alternatives need to be sought. One of the major tools that might be
used to overcome this limitation could be the sequential measurements
of the stable oxygen isotope ratios as preserved in the growth spiral s
of the shells of freshwater gastropods. Many freshwater gastropods
have life spans of about a year, (L~veque, 1968) and might be expected
to preserve useful environmental records of that span of time. This
technique involves the comparison of the relative amounts of the
stable isotopes of oxygen using the two most common oxygen isotopes,
16 18 0 with natural abundances of O, 99.76%; and O, 0.20~. Stable oxygen
isotope measurements give the relative differences between the sample
and the laboratory standard ratios of 180;160 from the following
formula
= { (180;160) . ~ 18 16 sample - 1 1000 %
( O/- O)standard
A negative s18o value means there is less 180 in the sample than in
the standard against which it is compared and the reverse if 6180 is
positive. It has also been found out that an increase in 6180 of only
1 per mil in calcite shells corresponds to a change in water
temperature of about 4.o0 c to s.o0 c (Craig, 1953). The short life
spans of most species of freshwater gastropods and their isotopic
3

ratio sensitivity to their environment makes them unique proxies to
the range of annual climatic conditions. This does not imply that
much is known about the life cycle or reproductive strategies of the
freshwater gastropods (Brown, 1980; L~veque, 1968; Brown, personal
communication, 1984). While the gastropods which we have examined
(mainly Melanoides tuberculata, Bellamya unicolor and Cleopatra
ferruginea) are believed to live for one to two years, these estimates
are based on aquarium-grown specimens, and need to be verified for
gastropods growing in natural habitats.
Since the application of stable isotope ratio measurements in
paleoclimatology, the volume of work done on freshwater mollusks with
this technique has not approached that done on marine mollusks
apparently due to complexity of data interpretation on freshwater
systems. Despite these complexities, we would like to see if it is
possible to apply this technique to the study of paleoclimates using
freshwater gastropods shells. We already know that some correlations
have been found to exist between isotopic ratios of modern shells and
the environment in which they grow (.Abell,1985).
Obviously, an understanding of how the oxygen isotope ratios of
freshwater gastropod shells .vary with . the environment in which they
grew could open wide the doors leading to the application of the
isotopic ratio measurements to continental paleoclimatology. This was
first suggested forty years ago when Harold Urey (1947) recognized
that naturally occurring carbonates might be employed in calculating
paleotemperatures, with subsequent verification by McCrea (1950).
Since then, various workers (Epstein et al., 1951, 1953; Mook, 1971,
4

1977 ; aurchardt,1977; Keith et al., 1960, 1964, 1965) have used the
technique with moderate success using mollusks as carbonate source
material. A major drawback to this technique is that the use of
mollusks in this way is not likely to provide the precise,
quantitative information that is being furnished by foraminifera in
the marine environment (Shackleton et al. - - 1984) . This lack of
complete success can be attributed to lack of background information
on how environmental conditions translate into the oxygen isotope
ratios of the mollusk shell. The fractionation of rainfall and post-
precipitation evaporation combine to yield isotope ratios which are
difficult to interpret quantitatively, although some qualitative
interpretations are possible. This drawback, notwithstanding, some
recent advances have been made in elucidating the potential of this
technique. It might be noted here that despite quantitative
assessment of ocean temperatures by stable oxygen isotope measurements
in foraminifera, there is still controversy as to what portion of the
oxygen isotope signal should be apportioned to temperature changes and
what portion to ice volume changes. (Mix and Pisias, 1988)
The successes thus far have been in the marine environment. By
carrying out oxygen isotoP7 study on Pismo Clam (Tivela stultorem) off
the coast of California, it has been demonstrated by Lee (1979) that
seasonal temperatures are recorded in the growth bands of both modern
and fossil clams. Micro-sampling technique along a section cut from
the Pismo clam (Tivela stultorem) was effective in this study.
Similarly, Jones et al. (1983) and Arthur et al. (1983) have
employed the oxygen isotope technique in the study of Atlantic surf
5

clam (Spisula solidissima) and observed a record of environmental
change in the shell growth increments.
schifano and Censi(1983) have demonstrated
Monodonta turbinata along the west
positively with sea water temperature.
Similarly Schifano (1983) and
that the growth habit of
coast of Sicily correlated
In yet another recent marine
experiment, Grossman (1987) employed stable isotopes in modern benthic
foraminifera to study the so called "vital effect" (different
organisms taking up isotope ratios in differing proportions). In his
work, the carbon and oxygen isotopic equilibrium in foraminiferal
calcite and aragonite, the characteristics and causes of
disequilibrium are examined.
Thus most of the stable isotope studies on mollusks as
environmental indicators have employed marine species. This is
because, apart from sporadic contributions from melting ice from the
polar regions, the oxygen isotope ratio of the water in the ocean is
almost constant (Mix and Pisias, 1988). Thus, analyses of the shells
of marine mollusks may be
temperatures with minimal
expected
effects
to give information on marine
from ice volume changes or
evaporative alterations in the oxygen isotope ratios of the ocean.
The latter effects can of ten be ignored in marine studies over short
time spans when it is assumed that the ocean is a constant, unchanging
reservoir of oxygen isotopes.
The disparity in the amount of work done on freshwater mollusks
compared to that of marine mollusks since the work of Epstein et al.
(1951) is attributable to the complexity of data interpretation on
freshwater systems. The two major effects that hinder quantitative
6

interpretation of oxygen isotope ratios in freshwater mollusks are (1)
variation in the s18o values of the rainfall, which supplies the
water bodies in question, with time, topography, and latitude (Mook,
1970) and (2) Alterations of the s18o values of the original
precipitation with time because of evaporative losses, which may be
associated with temperature, humidity and residence time (Craig,
1961). Despite these complexities we believe it is possible to
correlate oxygen isotope ratios of modern African freshwater
gastropods with their environment at least semi-quantitatively and to
use this information can be utilized in studying past African
climates.
Why African climates ? The geographical limitations of this study
were dictated by both practical and theoretical reasons:
(1) The African continent provides a wide range of modern
climates for comparisons with past climates.
(2) The latitudinal range of the continental land mass, from
approximately 30°N to 30°s gives a useful range of climatic
conditions, without encountering extremely low temperatures where
molluscs may be dormant over large portions of the year.
(3) Initial surveys (Abell, 1985) were made possible by the
availability of good museum collections of gastropod shells collected,
at least in part, because of public health problems associated with
freshwater gastropods.
(4) Finally, it was hoped that one consequence of this study
would be application to paleoclimatic influences on the development of
early man, whose original home was Africa.
7

past African climates are of interest because we would like to
know if the expansion of the Sahara desert in Africa is a cyclical
process or not. Such knowledge would help in the formulation of Land
use policies on expectations of probable changes rather than merely
hoping for the best.
Knowledge of ancient African climatic variations could provide
some answers to some questions raised in the evolutionary process and
in geology. The geographical conditions of past water basins could be
deciphered, and the validity of the assumption linking environmental
change to the process of evolutionary change could be confirmed. This
assumption was engendered by the fact that the ancient environment had
been profoundly different from that of the present at various times,
not only in its physiography but also in its ephemeral aspects such as
climate and vegetation, a view recognized by early natural scientists
like oa Vinci, Lyell and Darwin. As an outgrowth of the recognition
of the process of transformation from past to present environment,
this assumption is held by many scientists in this field, e.g.
Dobzhansky, (1962); Levins, (1953); Lewin, (1984); Matthew, (1915,
1939); Pearson, (1978); Simpson, (1953); and Vrba, (1980, 1984).
Of particular concern to anthropologists are the environmental
changes that occurred in Africa during the latter half of the
Cenozoic, and the role of this environmental change in the evolution
of the higher primates including the hominids (Brain, 1981a, 1981b;
Butzer, 1977, 1978; Livingston, 1971 ). Laporte and Zihlrnan (1983)
observe that " ...•• the environmental setting is a major driving force
in hominoid evolution," and Brain (cited in Lewin (1984)) argues that
8
" had it not been for temperature-based environmental changes in .... habitats of early hominids, we would still be secure in some
hospitable forest, and would still be in the trees." However, while
major trends in worldwide Cenozoic climate are well understood,
details are scarce and the chronology, particularly in the first half
of the Tertiary, is discontinuous, permitting anthropologists to
invoke environmental change at nearly any juncture in a particular
evolutionary scenario. As Butzer and Cooke, (1982) have observed, it
would be useful to supplement essentially deductive approaches with
"critical regional studies emphasizing empirical data that can be set
into tightly controlled radiometric or stratigraphic frameworks."
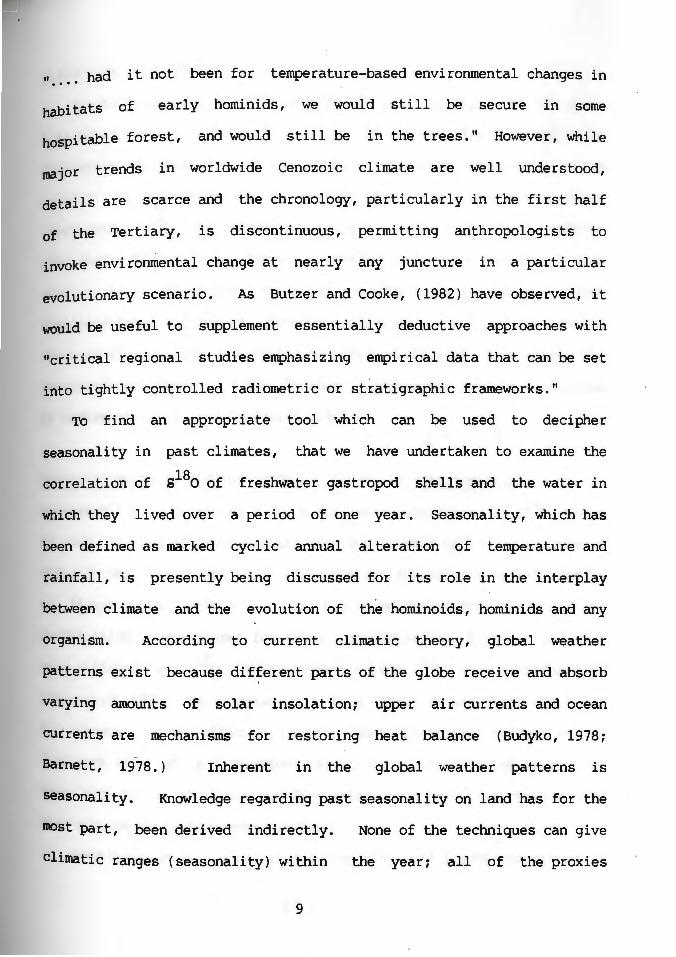
To find an appropriate tool which can be used to decipher
seasonality in past climates, that we have undertaken to examine the
correlation of s18o of freshwater gastropod shells and the water in
which they lived over a period of one year. Seasonality, which has
been defined as marked cyclic annual alteration of temperature and
rainfall, is presently being discussed for its role in the interplay
between climate and the evolution of the hominoids, hominids and any
organism. According to current climatic theory, global weather
patterns exist because dif~erent parts of the globe receive and absorb
varying amounts of solar insolation; upper air currents and ocean
currents are mechanisms for restoring heat balance (Budyko, 1978; ~
Barnett, 1978.) Inherent in the global weather patterns is
seasonality. Knowledge regarding past seasonality on land has for the
most part, been derived indirectly.
climatic ranges (seasonality) within
9
None of the techniques can give
the year; all of the proxies

yield long term trends.
The influence of climatic factors and their interplay at one given
time have greatly inhibited the use of oxygen isotope ratios in
freshwater carbonates as continental climatic indicators. For
example, in hot weather it is evident that the temperature effect
(decreasing s18o as temperature rises) and evaporative effects
18 t' . ) (increasing S 0 as evapora ion increases will tend to cancel each
other. As it turns out, there is a good correlation between oxygen
isotope ratios and general climatic conditions and some of the factors
which influence the precipitation that eventually determines the
inmiediate environment of the freshwater gastropods have been examined
by Yurtsever (1975) and Dansgaard (1964).
STABLE ISO'IDPES IN PRECIPITATION AND CAUSES OF FRACTIONATION
oansgaard (1964) observed that the seasonal variations of s18o values
in rain falling at low latitudes were due to what he called an "amount
effect", while those at high latitudes are due to what he referred to
as "temperature effect". It has aiso been observed that as
condensation temperature
llK>re depleted in s18o.
increases, precipitation becomes more and
This depletion of s18o has been observed
(Dansgaard, 1954) to increase with high latitude and (Epstein,1956)
to increase with altitude, giving what Dansgaard refers to as
"latitude effects" and "altitude effects". I will utilize these four
named effects in the following discussion, although it is obvious that
they are not truly independent effects.
Fractionation may occur in the evaporation of liquid precipitation
10

or in the condensation of water vapor. During any of these processes,
it is the more volatile H2o16 which is readily exchanged as opposed
to the heavy isotope counterpart. The fractionation of liquid
precipitation in nature may be induced by biological processes or be
engendered by mere exchange with other environmental materials.
Irrespective of how the fractionation is brought about, it is
ultimately dependent upon temperature and the rate of exchange.
rn this work only simple equilibrium processes are considered.
This is because the equilibrium and kinetic effects of the
fractionation process of liquid precipitation are not fully understood
yet. The environment in which this process occurs must be considered
in any plausible explanation offered. Full consideration is therefore
given to the environment in which there is an isotopic exchange
between an evaporated water molecule and at the surrounding vapor.
(Dansgaard, 1953; Friedman and Machta, 1962; Craig et al. 1963;
Erickson, 1964). For example the s18o of liquid water in exchange with
the atmosphere would be affected by a dry and cool environment
differently than it would in a wet and humid environment.
The condensation process also plays an important role in the
determination of the s18o of the liquid precipitate. This is
demonstrated by water vapor in equilibrium with liquid water. The
initial - condensation of the initial vapor in equilibrium with the
liquid water · would have the same s18o as the original water by
cancellation of the fractionation factors in going from liquid to
vapor and then vapor to liquid. However, subsequent condensations
deplete the heavy isotope of oxygen in the water leaving the
11

isotopically lighter H2o in the vapor. The 6180 of the condensation
from the residual vapor then gives more negative values with greater
rain-out producing increasingly isotopically lighter rain water.
condensation temperature cannot be determined generally from the
amount of precipitation because the composition of any precipitation
is a function of several parameters.
"Amount effect" correlation between monthly precipitation and 6180
is demonstrated by low 6180 values in rainy months and high s18o
values in semi-arid months. This trend is observed in the surmner
months at mid-latitudes and all year round in the tropics. This
pattern does not hold in the polar · zones because the temperature
effect is predominant. Thus, ascribing a rationale to this observed
pattern has been complicated by the high isotopic turnover in the
convective rain formation process. In this process, the vertically
rising air could exchange with water droplets either in the clouds or
just as the water droplets fall to the ground. In the tropics where
high humidity exists, and the rainy seasons are long and heavy rains
are recorded, low 6180 values are attributed to deep cooling of the
air followed by little enrichment by other processes. In areas with
low humidity and light rains, the 6180 is enriched by exchange and
evaporation.
At higher latitudes where evaporation from falling raindrops is
minimal, the amount effect becomes less pronounced. Direct evidence
for the enrichment of falling drops through evaporation have been
reported by Dansgaard (1953, 1961) and by Ehhalt et al.(1963).
The gross mean 6180 over a year can be represented by a simple
12

mean over 12 months:
1 12
12 ~
i=l
s. 1
or by a weighted mean value which is given by:
1 12
I p . 1 l=
( p. . s . ) 1 1
with Pi and P being monthly and annual amount of precipitation
respectively as determined by prevailing conditions during the rainy
season. The weighted mean can be utilized for comparative purposes
if the climate of the pertinent site has a dry season. Weighted mean
isotope ratio values provide information on major air mass movement
while monthly isotope ratio values provide local isotope effect
information. Since we are interested in local environmental
information and record of seasonality in the isotope ratios of the
shell and water, we would utilize the monthly s18o values in our
analysis.
By considering the monthly s18o in the tropics, the amount effect
can be observed to run antiphase to the monthly recorded amount of
rain.
tropics
values.
The separation of amount effect from temperature effect in the
can be achieved by applying the seasonal variation of s18o
This is accomplished by taking the difference between Ss' the
unweighted mean s value for summer and Sw, the unweighted mean 6 value
13

for winter. Sununer in the Northern hemisphere is taken to be the
period between May-October while November-April is taken as the winter
and the vice versa in the Southern hemisphere. Less seasonal
temperature variation, rainy sununers and relatively dry winters have
been observed to characterize the tropics. A negative - s w
therefore indicates the predominance of amount effect in the tropics.
In mid-latitudes a positive oxygen isotope ratio value indicates the
contribution of both temperature and amount effects. In high latitude
samples where seasonal variation of temperature is very high, high Ss
-S are mainly influenced w
s18o values is observed
determined.
EXPERIMENTAL
by temperature. If seasonal variation of
in Southern Ghana, then amount effect can be
Modern freshwater gastropods from a tributary of the River Pra
(Figure 1) at Krobo, 5.2°N,1.6°w in the Western Region of Ghana in
Africa, were collected at monthly intervals and analyzed together with
water samples collected at the same time and location from the host
body of water in which the gastropods lived. Various species of
Melanoides, Cleopatra and Bellamya genera were collected from the
tributary of River Pra, but for the purposes of uniformity and
comparison in this work most of the analyses were done on Melanoides
tuberculata.- The ubiquity of M. tuberculata in Africa and the sturdy,
robust character of the shells make it the ideal species for our study.
When M. tuberculata shells were unavailable, Bellamya unicolor was our
second choice, although identification at the species level was
14

801<,,,
FIGURE 1
~ ~
ISl-5 :os 610
RELIEF MAP OF GHANA
(ADAPTED .FROM BOATENG, 1967)
15

sometimes more difficult. The third genus, Cleopatra, is widely
distributed, usually as C. ferruginea, but is less common than the
other two. See Brown, (1980) for distributions of these species
throughout Africa.
The procedure involved collection on a monthly basis of water
samples, freshwater gastropods and data on prevailing climatic
conditions during the 12 month collection period from December 1985 to
November 1986 (Table 1). The gastropods were collected at shallow (1
to 2 meters) depths, and were thus growing in water that was well-
mixed, not deep or stagnant. Approximately 10 gastropods were
collected at the bottom of the river (usually in a cluster), allowed
to die and then dried before shipping to the laboratory. The water
sample was collected in a 25rnl septum capped vial, which was lowered
down into the river at the proximity of the gastropods and then opened
to fill up. It was recapped, labeled and kept sealed for analysis in
the laboratory. Water temperatures were also measured monthly over
the same period at the collection site.
The processing of the freshwater gastropod shells for the purpose
of evolving their co2 content into ampoules for stable oxygen isotope
ratio determination was 1?Y the procedure of Abell (1985). This
involved longitudinal sectioning of a whole shell with a low speed
diamond wafering saw in such a way that if a shell has 6 to 8
complete turns in the growth spiral, sampling from opposite edges of
each turn (180°) in the sectioned shell would give 12 to 16 samples.
Since adult Melanoides individuals generally have robust shells, long
sequences of samples can be obtained along the growth spiral. The
16

TABLE 1
TEMPERATURES AND OTHER PREVAILING CONDITIONS DURING SAMPLING
SITE The River Pra at Krobo, Western Region, Ghana.
COLLECTION PERIOD December 1985 - November 1986.
MONTH WATER TEMP. 0 c AIR TEMP. 0 c REMARKS -DEC. 25.0 27.5 Cool, dry Harrnattan
JAN. 24.8 27.0 Cool, dry, River drying up
FEB. 25.0 27.2 Extremely dry, Harrnattan winds
River almost dried up.
MAR. 25.0 28.0 Light rainy season, River
level rising.
APR. 25.5 27.5 Light rains, River level
still rising.
MAY 25.0 31.0 River level normal but flowing
faster due to heavy rains
JUN. 24.0 26.0 Heavy rains, River flooding.
JUL. 25.0 26.5 River completely flooded.
AUG. 23.5 27.5 Rainy season, River flooded.
SEP. 23.0 26.5 Major rainy season over,
Weather is cool.
OCT. 24.0 27.0 Started raining, River
flooding.
NOV. 24.0 28.0 Raining, River flooded.
17
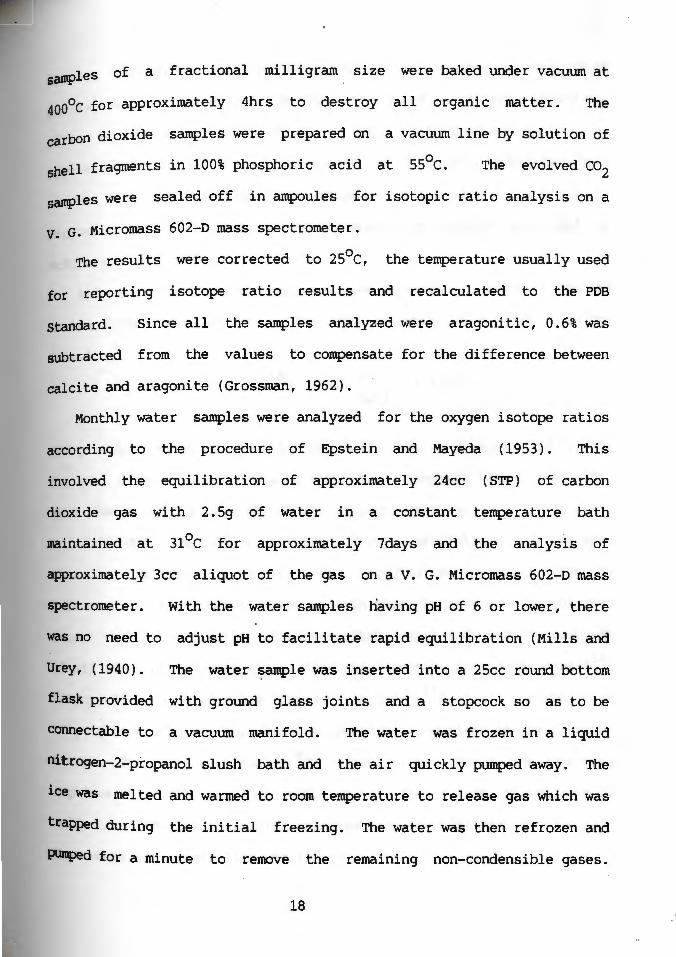
samples of a fractional milligram size were baked under vacuum at
400oc for approximately 4hrs to destroy all organic matter. The
carbon dioxide samples were prepared on a vacuum line by solution of
shell fragments in 100% phosphoric acid at 55°c. The evolved co2
samples were sealed off in ampoules for isotopic ratio analysis on a
v. G. Micromass 602-D mass spectrometer.
The results were corrected to 25°c, the temperature usually used
for reporting isotope ratio results and recalculated to the PDB
standard. Since all the samples analyzed were aragonitic, 0.6% was
subtracted from the values to compensate for the difference between
calcite and aragonite (Grossman, 1962).
Monthly water samples were analyzed for the oxygen isotope ratios
according to the procedure of Epstein and Mayeda (1953). This
involved the equilibration of approximately 24cc (STP) of carbon
dioxide gas with 2.Sg of water in a constant temperature bath
maintained at 31°c for approximately 7days and the analysis of
approximately 3cc aliquot of the gas on a V. G. Micromass 602-D mass
spectrometer. With the water samples having pH of 6 or lower, there
was no need to adjust pH to facilitate rapid equilibration (Mills and
Urey, (1940). The water ~ample was inserted into a 25cc round bottom
flask provided with ground glass joints and a stopcock so as to be
connectable to a vacuum manifold. The water was frozen in a liquid
nitrogen-2-propanol slush bath and the air quickly pumped away. The
ice was melted and warmed to room temperature to release gas which was
trapped during the initial freezing. The water was then refrozen and
Plllllped for a minute to remove the remaining non-condensible gases.
18

The ice was melted again and conunercial cylinder carbon dioxide, 99.8%
purity, was introduced into the flask to a pressure of about 73.5cm Hg.
After equilibration at 31°c for 7 days with frequent shaking, an
approximately 3cc aliquot of the carbon dioxide was withdrawn on a
vacuum line by freezing into ampoules and analyzed on the v. G.
Micromass 602-D mass spectrometer using the method described by
McKinney et al (1950).
All mass spectrometric analyses are reported relative to the PDB
carbon dioxide standard gas.
formula:
The results were calculated from the
Rx
Rstd 1 ] 1000
The probable error is ± 0.1%. Replicate samples measured on the same
day are usually reproducible to± 0.05%0. Standards (usually NBS-20),
were always run the same day as any unknowns were run.
Individual gastropods analyzed from a set collected at the same
time at the Krobo tributary were accepted as representative by
reference to experiments, conducted in this laboratory ( unpublished
data ) by L. Buffington, which established that individual gastropods
of all sizes of M. tuberculata from the same site record the same 6180
(Figure 2). A noticeable increase in the 6180 of all the shells as
they grew reflects the known evaporative conditions at the Kawokudi
stream. The drop in the 6180 values also reflect the temporary
reprieve from the drying condition of the stream at the time of
collection. Replicate samples measured were reproducible to + 0.1%0.
Instrument reproducibility was± 0.05%0.
19

OXYGEN ISO'IOPE RATIOS, CCHCRT OF SiELLS (ME[,J\NOJIBS 'IUBfRQJLATA) Q)LLECTED IN ocr.
1985 ffiOM KJWOI<UDI S'IREAM IN AC<J.{A, GB.ANA. -1
IF -1 r -2
E -2
-1 r -3
D -2
6180 -1 N
0 (PDB) IC -2
-3
-1
-1 r ,. -11.
A -2L -3
-3
I ~ I I I I
25 20 15 10 5 0
Shell Length, mm FIGURE 2

I ... J\TIC AND WEATHER PATTERNS OF SITE CL 1·in . -since the isotopic ratios in the shells are dependent on
climatic and environmental conditions, a brief description of those
conditions is necessary. Ghana lies between latitudes 4°45,N and
11011'N, longitudes 3°w and 1°14,E and has two vegetational zones, the
savannah grassland of the north and the rainforest of the south
(Figure 3, Vegetation map of Ghana). The two vegetational zones
experience significantly different climatic regimes. The northern
savannah region has a single annual seasonal cycle consisting of a
cool, rainy and windy period in August to October. For the rest of
the year conditions are warm, dry and relatively calm. The climatic
conditions prevailing in the southern forest zone consists of two
rainy periods in March-July and September-October. The September-
October rains in Ghana are followed by the north-east trade winds also
called Harmattan winds, which are characterized by high daytime
temperatures with low humidity, and dry cool nights. The Harmattan is
intense during December and January and consists of dry winds from
the Sahara desert, blowing toward the tropical rainforest across the
savannah region (Beadle, 1974). Dry weather and clear skies during
this period produce very, elevated temperatures during the day, but
with substantial radiational cooling at night. In the annual seasonal
cycle of Ghana, the maximum temperature differential is experienced
during the Harmattan because of the extreme daytime maximum and
nighttime minimum temperatures (Boateng 1967).
The Harmattan certainly has a marked effect on the climate of the
humid forest regions inland of the Guinea coast of West Africa due to
21
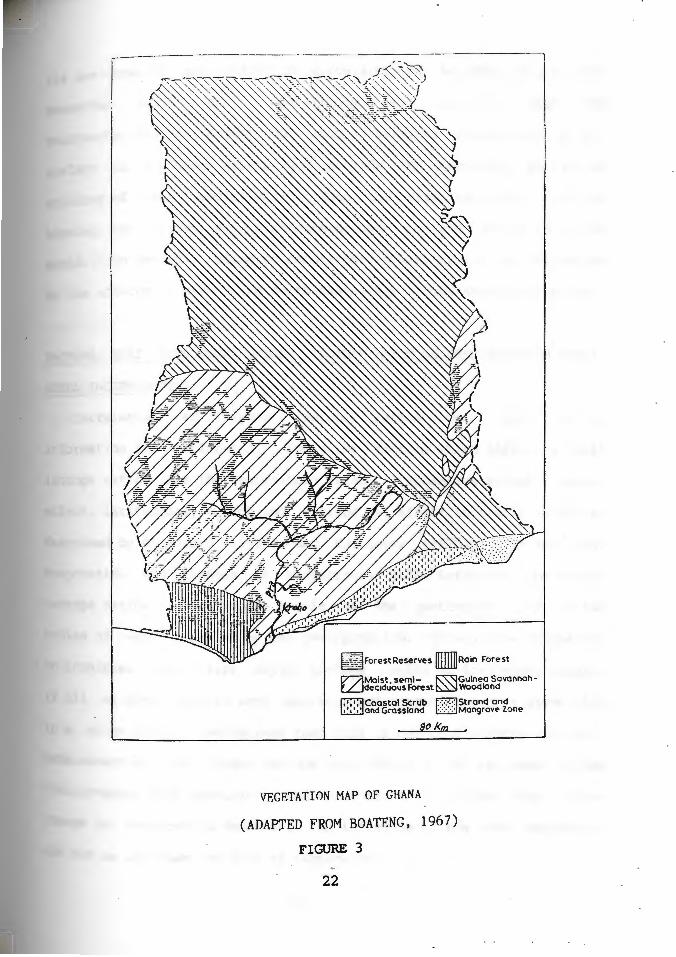
17'"'/lMoist. semi- R"01Guln-eo Sovonnahf.Ljdec1duous Fore~t ~ Woodlond
~Coostol Scrub r :·:.:1Strond ond ~and Grassland .;.:-:·:· Mongrove Zone
SOl<m
VEGETATION MAP OF GHANA
(ADAP'.fED FROM BOATENG, 1967)
FIGURE 3
22

its low humidity and effect on circulation of standing waters.
aarroattan winds are comparatively less powerful than
The
the
southeasterlies in August but
surface of standing waters and
stirring of lakes (Beadle,1974).
they accelerate evaporation at the
provide the necessary energy for
When the Harmattan winds are not
blowing, the climate may alternate between hot and dry or rainy and
humid. In general, climatic conditions in West Africa are determined
by the effects of either the north-east winds or the south-west winds.
FACWRS THAT INFLUENCE OXYGEN ISOTOPE RATIO IN PRECIPITATION AND IN
SHELL INCORPORATION
isotope ratios wi .. ,,.._ environmental correlation of oxygen
information is complicated. Among the factors which influence shell
isotope ratios are the temperature effect, evaporative effect, amount
effect, latitudinal effect and altitudinal effect in precipitation as
described by Dansgaard (1964) and Yurtsever (1975). In addition,
evaporation and changes in temperature will influence the oxygen
isotope ratios of gastropod shells as ·the gastropods grow in the
bodies of water supplied by the precipitation. It would be impossible
to interpret and utilize ?xygen isotope ratios of freshwater samples
if all of these factors were important and operational at a given site
in a given period. We believe that this is not true and that the main
determinant of the oxygen isotope ratio value of natural water is the
fractionation from evaporation and condensation. Since this phase
change is temperature dependent the influence of the other parameters
are not as important as that of temperature.
23

seasonal variations in oxygen isotope ratios are found to
correlate well with monthly mean temperatures. By regression
analyses, Yurtsever (1975) has shown that spacial variations observed
in the mean oxygen isotopic composition of precipitation will be
influenced mainly by temperature. This correlation is not
considerably improved by the other parameters. Yurtsever (1975)
performed a multiple linear regression analysis in an attempt to
derive a relationship between the mean s18o of precipitation and basic
geographical and climatological parameters. In the multiple linear
regression analysis, the mean s18o values were taken as the dependent
variable and were related to several selected independent variables
with a linear equation of the following type:
+ +
where T the average monthly temperature (°C)
P the average monthly precipitation amount (nun)
L = Latitude (Degrees)
A = Altitude (meters)
and an~ a4 are the regression coefficients.
By using data collected from the 91 network stations Yurtsever
computed the regression equations by starting with the four
independent -variables, and then eliminating 3 of them progressively.
The results of the multiple regression analyses derived from data
collected from the 91 network stations have been adapted in Table 2 as
follows:
24

TABLE 2
RESULTS OF MULTIPLE LINEAR REGRESSION ANALYSES (ADAPTED FROM
yURTSEVER, 1975)
oependent Independent Regression Equation
variable variables
used
Multiple
Correlation
Coefficient
Mean T, P, L, A (s18o) = -18.723 + (0.597 ± 0.088)T
6180 -(0.0035 ± 0.0052)P + (0.106 ± 0.048)L
(% ) + (0.00102 ± 0.0008)A
T, P, L (8180) = -16.279 + (0.545 ± 0.082)T
-(0.0067 ± 0.0048)P + (0.074 ± 0.044)L
T, p (8180) = -11.781 + (0.418 ± 0.033)T
- (0.0084 + 0.0048)P
T (s1~0) = -12.180 + (0.390 ± 0.029)T
where T = average monthly temperature (0 c)
P = average monthly precipitation (nun)
L = latitude (degrees)
A= altitude (meters)
25
0.833
0.828
0.821
0.815

That the
m...nsition of co .. 't'-
spatial variations observed in the mean isotope
precipitation of the network stations are due
essentially to temperature variations with somewhat reduced importance
attached to latitude is evident from the values of multiple
correlation coefficient. It may also be observed from the table that
the improvement of the correlation is not significant with the other
two parameters.
The partial correlation coefficient between the mean s18o and the
average monthly temperature is 0.815, whereas it is 0.303 for average
monthly precipitation, -0.722 for latitude and 0.007 for the altitude.
By virtue of being linearly correlated among themselves by a
correlation coefficient of 0.938, the use of latitude as an additional
parameter to temperature in the regression analyses does not improve
the correlation. Also, the fact that the great majority of the
network stations are located at low altitudes and consequently exhibit
very small variations in altitude accounts for the poor correlation
observed between s18o and altitude. Yurtsever, therefore observed
that the spacial variations in the mean isotope composition of
precipitation in the network stations taken as a group are due mainly
to the temperature effect. In Figures 4 and 5, adapted from Yurtsever
(1975), the temperature effect is illustrated by plotting the mean
6180 . against the mean temperature. Figure 4 illustrates data from
continental stations while Figure 5 illustrates data from island and
coastal stations.
This general conclusion is applicable on global scale using data
from all network stations. However, other competitive parameters such
26

()
-5
-10
-15
- 20
-4
c H b <
"" cc ~
I c
•
I
I I
I I
•/ I
•
. / /m . /.
I I
I
)I
•
/
• • • .. . ~ -----___ ,.,..... . ..,.,.....,.,... . ......... .
/,,... /
I I
/,. •
0
•
4 8 12 lo 20 24 28
AVERA\,E MONTHLY TEMP . ( ° C)
RF:l...ITrON rwrw~:F.N AVERAr.~: MONTlll.Y TF.MPF.RATllRF: AND Ml·:AN oxn;~:N r s rrr<ll'I·:
RHlOS [N r:oNTINF:NTAI. STATIONS (ADAPTr:ll FROM YllRTSl·:Vr·:R JQ7 5)
FIGURE 4
27

tv Ql
c
~ cc
2 >-
~ ~ ~
~
0 ·-
-5
-10 ~-
-15
-.~O -
-2 5 ·-
I I
I
I I
I
,..I ...
I I
I l.
. .... / /
• v
/• / .
/ ... /
I
" • • ,.._ ... • .~. J.-----... -f. • __ ..... ~
.....-;- a.• A
....• • >-4/ /U 4 I / ~ ...
4/ ••
•
• 4 ...
.... SfATICN3 wrn! APPARENT ,, AMJJNI' mrr:I''' 1HE ~y IBECIPITATICN VARIES BEIWEr.N 1HE !Wl;E, l 4Chm-3H1nn
KEY
ISLAND SfATim • MFAN ~y 0-18
mASTAL SfAITCll a. MF.AN ~rt.ffiiLY (HS
'----''----'~_._~-+~-+-~~~->-~-+---l~~-~~~~-
-20 -16 -12 -8 -4 0 4 8 12 16 20 24 2B 32 A~ M:NillLY TEMP. (°C)
RELATION JJF:TWEF:N AVF:RAGE MONTHLY TF.MPERATURE AND MEAN OXYGEN ISOTOPE RATIOS FOR ISLAND AND COASTAL STAT[ONS (ADAPTED FROM YURTSEVER, 1975)
FIGURE 5

as amount effect or evaporative effect may become important in
determining the spatial isotope variations when considering regional
For example, in Figure 5, the more negative mean 8180 values in data.
one group of stations which is apparently due to the amount effect
deviate from the general 8180-temperature relation, having signifi
cantly higher mean precipitation values. Figure 6 clearly illustrates
the amount effect where the mean 8180 values are plotted versus
average monthly precipitation for all equatorial island stations
having comparable average temperatures.
data shown in Figure 6 is
The least square fit to the
= (-0.015 + 0.0024)P (0.047 + 0.419)
With a correlation coefficient of r = 0.874 and standard error of
estimate of +0.783%. It is therefore, found that 76% ( r 2 = 0.76 ) of
variations in mean 8180 values in the island stations is due to amount
effect which results in an average depletion rate in 8180 of -1.5% per
lOOmm of rainfall. Thus a high probability of improving the
parametric relations given in Table 2 exists if similar regression
analyses are performed on regional bases by employing some additional
climatological and geographical parameters. For example, altitude is
obviously not important as a variable when dealing with sea level
sites. In locations where altitude should be a factor, it should
still be influenced by temperature. This is because air temperatures
generally drop with increasing altitude and temperatures influence the
oxygen isotope ratios of precipitation as rain falls from the
29

+l
0
~ c ~ -1
~ -2
w 0
-3
-4
-5
~ 0
(b110) = - (0.015 t O. OO lfP - (0.470t0.4\ q)
/ As::eocion
• '26.1
Canton
n=l4 r=0.874
er =±0. 783 ;;,. •
I' r Barlados
// 28._;;<.t.3 r Johnston
Average Rate of repletion: -1. 5±0.2 "/.,, per ICOrrn
25.~-~ ·;;;, 7 ..... , / Rar ........_ , , · otonga
22.a:--..... '~A:~ £?- GB1l ' ... ~.8
' 21.3 ', -' - . . 9
'
\./ake
L.25.4',' '', /: Diego ('_arcia
' . ' 26v -Apia
' .2(i._Q .....
llernuda ' " L - s.o T~ ' ' ' -""·'' ' Mi .... y ' ' '-,
....
' ' ', ' , L' - ,..-, I ...................
11))
' " Yap __,,,-•27. 2·,
:;m
'
ro AWRAr;F. Mlffi!LY RAINFill N"fJNr (nrn)
'
A~OIJNT EFFECT IN ISLAND STATIONS. PLOT OF MEAN OXYGEN ISOTOPE RATIOS VERSUS AVERAGE MONTHLY RAINFALL. ( ADAPTF.O FROM YlJRTSF.VER, 1975)
FIGURE 6
Truk
(A VF.llAGE MlIDiL Y TIMP . c•c) IS BY FAG! FDTh'f)
lffJ

atillOsphere as well as when being incorporated into gastropod shells,
h ld influence the s18o of shells. Yurtsever (1975) has altitudes s ou
observed that precipitation at higher altitudes is more depleted in
heavy isotopes than that at lower altitudes.
In effect, it can be observed that the four major parameters
considered by Yurtsever (1975) and Dansgaard (1964) may be important
but are not truly independent as three of the parameters are to a
large degree controlled by temperature. It is also known that the
final composition of liquid precipitation on the ground would be
different from the initial composition of a liquid precipitation in
the clouds.
FAC'IORS THAT INFLUENCE OXYGEN ISOTOPE RATIO IN SURFACE WATER
Surface water is believed to be influenced by factors which are
similar but are over and above those that influence precipitation in
the cloud. Prominent among the factors that alter the oxygen isotope
ratio in the post-precipitation phase are temperature and evaporation.
The alteration of the oxygen isotope ratio may be caused by
evaporation and exchange with environmental vapor. In dry air,
relatively high evaporatio~ causes the preferential escape of H2o16
(light water) creating a non-equilibrium conditions (Ephalt et al.,
1963) resulting in heavy water being left behind. Dynamic equilibrium
exchange between the precipitation and the environment which occurs in
humid environment has been observed by Friedman and Machta (1962).
Should amount effect become important in the oxygen isotope ratios
of a given precipitation, it would be expected that the environment
31

with a greater amount of precipitation in a given month, would be more
depleted in oxygen-18 which would also be incorporated into the shell
of gastropods that lived in that environment. Despite the different
effects that can influence the oxygen isotope ratios in precipitation
and in shell incorporation, it is still possible to correlate oxygen
isotope ratios of a given body of water with the oxygen isotope ratios
of the freshwater gastropods that inhabit it and even calculate the
temperature at which the gastropod shells were formed (Epstein and
Mayeda, 1953). The isotope temperature scale formulated for this
calculation is :
T 16.5 - 4.3 ( S - A) + 0.14 ( S - A) 2
where T is the temperature in °c, A is the S value for the H2o in
which the caco3 was precipitated and S is the oxygen isotope ratio in
the gastropod shell. Any considerable deviation from the above
temperature formula would mean considerable fractionation or
influence of the precipitation by other factors other than
temperature.
The inability of freshwater gastropods shells to record the
original s18o of the rainfall as predicted by latitudinal influence,
(as shown in Figure 7) is due to other effects over and above those
discussed by Yurtsever (1975) and Dansgaard (1964) on post-
precipitation isotope ratios. The main parameters that affect post-
precipitaion isotope ratio are amount, temperature and evaporation
which Abell (1985) has rightly linked up with vegetation cover. As a
32

FIGURE 7
EXPECTED LATITUDINAL EFFECTS ON OXYGEN ISOTOPE RATIOS, IGNORING LAND MASS
-INFLUENCES
(ADAPTED FROM ABELL, 1985)
33

result of regional patterns in s1ao of gastropods it is possible to
sort out the major effects on post-precipitation isotope ratio. This
is possible because some of the influential parameters on post-
precipitation isotope ratio may be emphasized or discarded. This
does not necessarily mean the same pattern of emphasis or discarding
would apply for every site, but that some rules apparently apply.
over much of Africa, the primary influence determining the isotope
ratios in gastropod shells is the latitude. Rainfall is fractionated
as air masses move and this is clearly manifested in the latitudinal
effect on oxygen isotope ratios in precipitation as noted by Dansgaard
(1964) and Yurtsever (1975). Gastropods, sampling the oxygen isotope
ratios in that rainwater in their host body of water, will generally
provide a faithful record of that isotope ratio, particulary if the
gastropods lived in large deep bodies of water, resistant to
evaporative changes or in areas where rainfall is persistent through
much of the year and humidity is high enough to discourage evaporative
fractionation. The deep lakes, Tanganyika and Malawi, are the obvious
examples of these bodies of water large ·enough to resist evaporative
change, while the rivers and lakes in the tropical forest of Central
and West Africa are going to be characterized by low evaporation. On
the other hand, there are a number of areas where control of s18o will
be largely by evaporation. The shallower East Africa and Southern
Saharan lakes will be maintained by seasonal rainfall in their source
areas, but will be subject to continuous high evaporation rates. Lake
Turkana, for example, fed largely (80%) by seasonal rainfall in the
highlands of Ethiopia, has a climate of relatively unchanging
34

mnPrature, but te"'t'-the lake 18 level, and the 6 O of the gastropod shells
oscillates with this seasonal imput. In all these arid locations, the
average value of
evaporative conditions.
be positive, reflecting the prevailing
Yet another scenario is to be found in the Transvaal region of
south Africa and extreme southern Mozambique, where a cool and dry
winter combine to produce major fluctuations in s18o. The combination
of temperature and evaporation are enough to offset the latitudinal
effects of several permil. These general climatic trends and their
manifestation in the oxygen isotope ratios of gastropod shells are
clearly visible in Figure 8 (Abell 1985). Thus latitudinal effects
produce s18o values near -4 to -5%o at the equator, and extending to
-8 to -9% at the northern and southern extremes of Africa. Evaporative
situations in East Africa are clearly delineated with s18o values near
+1 to +2%0 . The regional anomaly in the Transvaal area of South
Africa is also obvious. This map supplies the norms for isotope
ratios and climatic patterns of modern Africa, but it also supplies
examples of regional effects which can be used for the interpretation
of paleo-isotope ratios.
the recent studies of
envirorunental conditions.
Some general observations have emerged from
s18o values and their correlation with
One of such observations is that in cool,
high and regular rainfall areas, where s18o of shell is -3 to -5%o, in
~ evaporation is probably much less important than temperature in
controlling s18o. But where rainfall is light, and conditions are
arid and hot, in most circumstances temperature variation is small,
and the s18o values are predominantly governed by evaporation. For
35

FIGURE 8
OBSERVED OXYGEN ISOTOPE RATIOS IN FRESHWATER GASTROPOD SHELLS . (ADAPTED FROM ARP.LL, 1985)
36

l e at both Lake Malawi and Lake Victoria (Winam Gulf) there is exa111P ' ·
t ure change with the seasons, but 6180 of the shells nU.nimal tempera
varies considerably (Abell, unpublished data). There will be
exceptions to these generalities, but they make a starting point.
In an attempt to apply these interpretations to paleoclimates we
lllllSt not lose sight of the importance of the correlation between
amount effect or rainfall and vegetation. The amount effect which
according to Dansgaard (1964) is engendered by the deep cooling of air
in heavy frequent rainfall, with minimum possible post-precipitation
enrichments through evaporation, has been found to correlate well with
vegetation cover (Tucker et al., 1985, Abell, 1985). With respect to
the African climate, it has been found that areas with enough
rainfall, and rainfall sufficiently well distributed throughout the
year to ensure permanent vegetation cover (Figure 9), show 6180 values
ranging from -3.5 to -0.9%0 or lower. West African and Central
African gastropods fall in this category of depleted 6180, an
indication of amount effect overwhelming latitudinal effect. Similar
effect may be applicable in the coastal regions of East Africa,
Malagasy and South Africa where latitudinal effect is masked by amount
effect. By these observa~ions, vegetational cover maps could be used
to correlate 6180 values of shells and environments because they
integrate over time the effects of rainfall and provide
topographically continuous information. In applying 6180 values of
gastropod shells to estimate paleoclimate, negative values of 6180
Will indicate environments of substantial rainfall while very positive 18
6 O values will give an indication of areas of evaporative control of
37

n CJ .
. .
Permanent
f Af rica r ed raW'Tl from NASA ima gery Vege t a tion map o •
FIGURE 9
38

the oxygen isotope ratios taking into consideration predicted
latitudinal isotope ratio values.
RESULTS ;;;:;.:;;------
Tables 3 and 4 summarize the oxygen isotope ratio information on
the freshwater gastropod shells and the water samples respectively.
In Table 1 the raw oxygen isotope ratio values were corrected to PDB
by adding 0.84%0 to correct to the PDB standard from the Graduate
school of Oceanography substandard and then subtracting 0.60%o as an
aragonitic correction factor. Since 8180 values with reference to the
PDB is reported at 25°c, the PDB values were corrected to 2s0 c by
adding or subtracting 0.18%0 for each 1°c of temperature change. The
application of the 0.18%0 to bring the shell and water samples to
2s0c is to make the values comparable and also to correct for ambient
temperature deviations in Ghana. The last column gives the 8180
values after the PDB and temperature corrections which are plotted in
Figure 10. In addition to the above corrections carried out on the
18 raw 6 O values for the water samples, the bath temperature which was
equilibrated at 31°c was also corrected to 2s0 c to determine the final
s18o values in the last column of Table 4 which is also plotted in
Figure 10.
Plotted in Figure 10 are 8180 values for both shells (aperture
samples) and water corrected to PDB and temperature corrected. There
. 18 is a good correlation between the 8 O values of the gastropod shells
and those of the water. It can be observed that the shell isotope
ratios lag behind water isotope ratios by about 1 to 2 months.
39

Table 3
QXYGEN ISOTOPE RATIO VALUES OF FRESHWATER GASTROPOD SHELLS
SITE : The River Pra at Krobo, Western Region, Ghana.
COLLECTION PERIOD : December 1985 - November 1986.
SPECIES : Melanoides Tuberculata
MONTH s18o(raw) s18o(PDB) TEMP. CORRECTION s18o(Aragonite) -DEC. -3.49 -3.25 0.00 -3.25
JAN. -3.87 -3.63 -0.04 -3.67
FEB. -3.20 -2.96 0.00 -2.96
MAR. -4.39 -4.15 0.00 -4 .15
APR. -4.06 -3.82 +0.09 -3.73
MAY -2.44 -2.20 0.00 -2.20
JUN. -3.36 -3.12 -0.18 -3.30
JUL. -3.22 -2.98 0.00 -2.98
AUG. -3.46 -3.22 -0.30 -3.52
SEP. -4.61 -4.37 -0.36 -4.73
OCT. -4.47 -4.23 -0.18 -4.41
oov. -4.39 -4.15 -0.18 -4.33
40

TABLE 4
OXYGEN ISOI'OPE RATIO VALUES OF WATER SAMPLES
SITE : The River Pra at Krobo, Western Region, Ghana.
COLLECTION PERIOD : December 1985 - November 1986.
MONTH s18o(raw) s18o(PDB) BATH CORR. TEMP. CORR. s18o(final) -DEC. -5.82 -4.98 -3.98 0.00 -3.98
JAN. -5.04 -4.20 -2.20 -0.04 -3.24
FEB. -5.13 -4.29 -3.29 0.00 -3.29
MAR. -4.20 -3.36 -2.36 0.00 -2.36
APR. -5.30 -4.46 -3.46 +0.09 -3.35
MAY -5.14 -4.30 -3.30 0.00 -3.30
JUN. -5.09 -4.25 -3.25 -0.18 -3.43
JUL. -5.31 -4.47 -3.47 0.00 -3.47
AUG. -6.09 -5.25 -4.25 -0.30 -4.55
SEP. -5.33 -4.49 -3.49 -0.36 -3.85
OCT. -5.49 -4.65 -3.65 -0.18 -3.83 '
NOV. -5.14 -4.30 -3.30 -0.18 -3.48
41

OXYGEN-18 (PDB)
I I I I I O> U1 -&>. w 1"
I . J, . I . I . I 'l U1 <.n U1 U1 -&>. U1 w <.n
c rn ("") . c.... I ~ . 0
(f) I "T1 ;:r ~ ~ II) cc ...... ......
..... 0 ..... 0 ..... I
~ ..... ..... ..... CD .,.,
E ,,. ,,. ,,. E ,,.,,.--
~ ,,.,,. >
:c ~ . m ::c "") ~ > 1-1 3: -<
~ 0 :z :z 0 ~ E !i1 :J:: 'Z I Cf) .... . I
0 I I :r: I
E I C!J m I r I .l!J . / .: r /
/ 0 Cf) / ("P
/ ~ > / c: ct < CJ 0
' I Cf) ..... ..... ..... ~
U') ..... ~ ca ' 1J . I 0
I :z 0 I ~ n ~ :r: .-i . \
\ \
:z: \ 0 < .
42

18 Shifting the S O plot of
complete correspondence
the
of the
water by one month gives an almost
s18o plots of both water and shells as
shown in Figure 11. Both water values and shell values give a fairly
good picture of changing conditions, allowing for the lag. The s18o
values of the water samples are almost constant within -3%o to -4%o
range throughout the period of collection except for March and August
18 when S O values of -2.36 and -4.55 were recorded respectively. The
18 high s 0 value recorded for March coincides with the period of
maxinrurn drought brought about by high temperatures and Harmattan winds
from the Sahara. The low August 18 S O value, on the contrary,
corresponds well with the period of low temperature, highest rainfall
and the flooding of the River Pra. Similar correspondence is observed
for the shell s18o values in Table 3 except for the 1 to 2 month's
slippage of the maximum s18o from March to May and the minimum s18o
slipping from August to September. In general, the s18o results are
nearly constant except for a rise of 0.5%o in October for the shell
and in December for the water samples. We attribute this general
constancy to normal constancy of rainfall and temperature, and the one
excursion as a consequence of the yearly arrival of the Harmattan.
43

............_
CD Cl 0... '--"'
00 .........
I :z: w (.:>
>-x 0
0-18 OF WATER ANO SHELLS VS.MONTll ~ Shell 0-18 1r---1i. Water 07'"18.
-2.5
-3
-3.5 I y / / \ ~ k-- ~, /,,,. ..... _ ...-"""""'
_/ ~ -""If
-4
-4.5
-s
-5.5
-6
-6.S
-7
I I I
OEC. I FEB. APR. I JUN. I Aub. I I OCT.
Ji\N. MAR. MAY. JUL. SEP .• NOV. MONTH
FIGURE 11
~

Table 1 shows the temperature profile of the tributary of the
River Pra at Krobo during the sampling period of December 9, 1985 to
October 15, 1986. The water temperatures and the ambient temperatures
tabUlated in Table 1 are also shown on the bar graph plotted in Figure
12 . The maximum, minimum, temperature range and average temperatures
extracted from Table 1 are sununarized in Table 5. The average
temperature recorded in Table 5 was determined by the simple mean
over 12 months period. Average sUimner and winter temperatures were
obtained over 6 months period with sUimner in the Northern hemisphere
defind by the months between May and October and winter months from
November to April. Ambient temperature difference over the period of
collection is twice that of the water temperature difference over the
same period. The average sunnner temperature is lower than the average
winter temperature.
By performing regression analysis on data collected from the
tributary of the River Pra at Krobo, the regression equations were
obtained with the correlation coefficients. Table 6 sununarizes the
correlation between water temperature, air temperature, precipitation
and the oxygen isotope ratio values of both the water and the shell.
The correlation factors for the water temperature values and the
oxygen isotope ratios of the shell and water are 0.75 and 0.74
respectively. This correlation is further improved from 0.75 to 0.81
by shifting the oxygen isotope ratios of the shell one month to adjust
for the lag in the s18o incorporation into the gastropods. The
correlation plot for the water s18o and water temperature is shown in
45

31.5 31
30.5 30
29.5 29
~ 28.5 w 28 !5 27 .• 5 ~ 27 a: ~ 26.5 :::E 26 ~ 25.5
25 24.5
24 23.5
~ MClfTLY TEM1. -RIVER PRA. KROOO • WATER IDPERAME § MIJIOO IDf>.
23 I DEC .MN FEB MAR APR MAY .ruN M Mfr; SEP OCT ~
MONllf (1985 - 1986)
FIGURE 12
~

TABLE 5
MAXIMA, MINIMA AND AVERAGE TEMPERA'IURES 0 c
SITE The River Pra at Krobo, Western Region, Ghana.
COLLECTION PERIOD December 1985 - November 1986.
WATER AMBIENT
MaXimum Temperature 25.5 31.0
Minimum Temperature 23.0 26.0
Average Temperature 24.5 27 . 5
Average Summer Temperature 23.9 26.9
Average Winter Temperature 25.1 28.0
Temperature Fluctuation 2.5 5.0
47

TABLE 6
SUMMARY OF CORRELATION VALUES
SHELL 6180
* R R
Water Temperature 0.74 (0.81) 0.55 (0.65) 0.75 0.56
Air Temperature 0.67 (0.33) 0.45 (0.11) 0.44 0.20
Precipitation 0.66 (0 . 62) 0 . 44 (0.39) 0.42 0.18
Shell 6180 0.68 0.47
* R = Coefficient of correlation
** R2 = Coefficient of determination
Correlation coefficients of one month slippage are in brackets.
48

Figure 13 while that of the shell 8180 and water temperature with the
one month slippage is shown in Figure 14.
The correlation of precipitation with shell oxygen isotope
ratios, 0.66, and with water oxygen isotope ratios, 0.42, are good
however the shell s18o values correlate better with precipitation than
the water 8180 values. Figure 15 shows the correlation plot of
precipitation and water 8180. Air temperature correlations with shell
6180 and water 8180 are as good as the precipitation correlation with
shell 8180 and water s18o. The correlation plot of the air
temperature and shell oxygen isotope ratios is shown in Figure 16.
The correlation between the shell oxygen isotope ratio values and the
water oxygen isotope ratios, 0.68, is also listed in Table 6.
49

WATER 'IEMPERA'IURE VS. WATER ISO'IOPFS
y = 27 .33 + 0.81X R = 0.75
25
24
23 a
-5 -4 -3 -2
WATER OXYGEN ISO'lOfE Rl«'IO
FIGURE 13
50

EHELL ISO'IOPE RATIOS VS. WATER 'IEMPERA'IURE
y = 26 .99 + 0 .68x R = 0 .81
25
24
CJ
23 c
-5 -4 -3 -2
SHELL ISOIOFE RATIO - EL IPFED ONE IDN'lli
FIGURE 14
51

RAINFALL vs. WATER ISOIOFES
300
0
0
~ y = 196.75 + n .98x R = 0 .42 200
~ .......
~ ~ ._,
~ 100
~ ~
D oD
fJ 0
0 -5 . -4 -3 -2
OXYGEN ISOIOFE RATIO
FIGURE 15
52

AIR 'IEMPERA'IURE VS. OXYGEN ISO'IOPF.s
32
31 y = 30.33 + 0.79x R = 0.67 a
~ 30
~ 29 ~ ~ 28 ~ .ct:
'}]
26 D
25 -5 -4 -3 -2
OXYGEN I9)'10PE Rl«'IO
FIGURE 16
53

~ A cursory look at the plot of the 18 S O values of the gastropod
shells and that of the water in Figure 10 may not be enough to observe
the convincing correlation between the shells and the water
environment in which they lived. This is expected because the
tributary of the River Pra at Krobo is not stagnant. The micro
environment of the gastropods is constantly changing due to mixing,
water movement and the replenishing of the water in the immediate
environment of the gastropods by precipitation from the northern
tributaries which may have different oxygen isotope ratios and fresh
local rains. Not
incorporation of
only these but other factors such as the rate of
the 180 into the shells of the gastropods might be a
factor as well as the chosen time interval of sampling. This
parallelism between the s18o plots of the water and the shells, which
is a good indicator as to the possibility of applying oxygen isotope
ratios in paleoclimatology, is in accordance with an earlier
observation by Epstein et al . (1953) that the oxygen isotope constant
f 1 . . d d both th 18 . d f amb' o ca cite is epen ent on e S O an temperature o ient
water.
The Collector's monthly remarks on water level of the River Pra
which were requested as part of this research project, and the
prevailing climatic conditions during the period of water and
gastropod collection corresponds very well with the mean monthly
rainfall values tabulated in Table 7 and also plotted in Figure 17
(Griffiths, 1972). The data given are from stations very close to
Krobo (refer to Figure 18 which gives the annual mean rainfall adapted
54

U1 U1
650 600 550 500.
- 450 ~ 400 ...... ...J 350-i·
LEAN MCJffiLY RAINFALL-NEAR R.PRA lllJl AXIM • TN<OIWlI § tu:ril.A
~ 300]1
~ 250
~~ IJ L . :~ll __ i.,_~~-- --~-L __ ~_t_1 DEC JAN FEB MAR APR W. Y JUN JUL AUG SEP OCT NOV
MONffi
FIGURE 17
(ADAPTED FROM GRIFFITHS, 1972)

FIGURE 18
ANNUAL MEAN RAINFALL MAP OF GHANA
(ADAPTED FROM BOATENG, 1967)
56

from Boateng (1967)). In areas of Africa especially West and Central
Africa where rainfall is high and well spread out over a period of one
year, such that there is permanent vegetative cover, 8180 values in
gastropod shells have been observed to be between -3.5 to -0.9 per mil
(Abell, 1985). our values fall close to this range with the average
monthly 8180 for the one year period being -3.51 for the water samples
and -3.60 for the gastropod shells, giving a 0.11 per mil average
difference between the shells and the water samples. Without any land
mass fractionation, the expected values of the 8180 at this latitude
should have been approximately -1.0 or -2.0 (Figure 7). The isotope
ratio values in this region are more
ratios for this latitude. Even then, the
depleted in oxygen isotope
8180 values of the shells
are more depleted than that of the water samples. Here, this is
attributable to amount effect, which is substantiated by the 8 - 8 s w
values of -0.52 from the water and -0.54 from the shell. This is in
consonance with the observation of Tucker et al., (1985) and Abell
(1985) where latitudinal effect is overwhelmed by amount effect which
in turn correlates well with vegetation cover map of Ghana. (Figure 3)
The seasonality information sununarized in Table 8 is to assist in the
separation of amount effect from temperature effect in the tropics.
By taking the difference between Ss, the unweighted mean 8 value for
sununer and Sw, the unweighted mean 8 value for winter. Summer in the
Northern hemisphere is taken to be the period between May-October
while November-April is taken as the winter and the vice versa in the
Southern hemisphere. A negative 8s - Sw indicates the predominance of
amount effect in the tropics.
57

TABLE 7
MEAN MONTHLY AND ANNUAL RAINFALL (nun)
(Adapted from Griffiths (1972))
Collection site, Krobo, is approximately 30Km from Takoradi
MONTH AXIM TAKORADI ACCRA -JAN. 41 33 16
FEB. 54 25 37
MAR. 122 78 73
APR. 157 110 82
MAY 426 278 145
JUN. 613 249 193
JUL. 147 ·04 49
AUG. 56 41 16
SEP. 90 49 40
OCT. 205 127 80
NOV. 130 63 38
DEC. 74 45 18
2115 1182 787
58

TABLE 8
SEASONALITY AND s18o VALUES
SITE : The River Pra at Krobo, Western Region, Ghana .
COLLECTION PERIOD : December 1985 - November 1986
Sw -3.25
Ss - 3. 77
Ss - Sw -0.52
Sw = Winter oxygen isoto~ ratio
Ss = Surmner oxygen isotope ratio
Northern Hemisphere Surmner Months
Northern Hemisphere Winter Months
59
s18o OF SHELLS
-3.33
-3.87
-0.54
May - October.
November - April.

TABLE 9
METEOROLOGICAL DATA FROM THE AIRFORCE BASE AT TAKORADI
PERIOD OCTOBER 1985 - NOVEMBER 1986.
MONTH RAINFALL (mm) NO. OF DAYS MEAN TEMP. oc -OCT. 64.8 3 29.7
NOV. 111.8 6 31.5
DEC. 0.0 31.3
JAN. 0.0 31.5
FEB. 62.3 7 31.6
MAR. 20.0 4 31.6
APR. 50.4 6 32.3
MAY. 99.4 16 31.6
JUN. 185.2 17 29.5
JUL. 163.6 12 28.2
AUG. 21.3 4 27.7
SEP. 18.5 8 28.3
OCT. 51.9 8 29.0
NOV. 61.4 6 28.2
60

The climatic conditions prevailing in the Southern rainforest
region of Ghana consists of two rainy periods in March-July and
September-October. The September-October rains in Ghana are followed
by the Harmattan winds from the Sahara desert, which are characterized
by high daytime temperatures with low humidity and dry cool nights.
The Harmattan is usually intense during December and January (Beadle,
1974) however, during the sampling period, the intensity of the
Harmattan winds was recorded in January and February. The Harmattan
winds coupled with high daytime temperatures between December and May,
as recorded by our collaborator shown under remarks in Table 1,
brought about maxinrum evaporative effect which is recorded in both
water and shell isotope ratios in March and April respectively. The
highest s18o value of -2.36 for the water was recorded in March, the
period of maxinrum drought, which was reflected in the shell value as
-2.20 in May, a lag of approximately 2 months. The Harmattan winds
are comparatively less powerful than the Southeasterlies in August but
they accelerate evaporation at the surface of standing waters and
provide the necessary energy for stirring . (Beadle, 1974) A lag of
1 month is observed between the s18o values of the shells and that of
the water. A low s18o value of -4.55 is recorded in the H20 in
August, while a low of -4.55 is recorded in the shell in September.
The difference between the maxinrum and mininrum s18o for the water is
-2.19 per mil while that of the shell is -2.53 per mil. In general
s18o results are nearly constant except for a rise of about 0.5% in
61

October for the shells and in December for the water samples. We
attribute this general constancy to normal constancy of rainfall and
temperature, and the one excursion as the consequence of the yearly
arrival of the Harmattan.
The temperature effect is clearly demonstrated by the parallelism
that exists between 18 the S O plot of the water, the shell and the
monthly temperature plot. The maxinrum ambient temperature, 31°c, and
the maxinrum water temperature, 0 25.5 C, were both recorded in April
while the mininrum ambient temperature, 26.0°c, and the mininrum water
0 temperature, 23.0 C, were recorded for the month of August. Average
monthly water temperature of 24.5°c was calculated for the collection
period. The maxinrum and mininrum s18o values recorded by both shell
and water correspond very well with the months for which maxinrum and
minimum temperatures were recorded. The average ambient temperature
was 3.o0 c higher. The water temperature fluctuation was 2.5°c while
the air temperature fluctuated by 5.0°c during the collection period.
The average summer temperature is lower than the average winter
temperature. A negative difference is obtained when the average
winter temperture is subtracted from the average summer temperature.
The conversion of this te~rature difference to 5180 gives a negative
s18o value which substantiates the amount effect obtained by the
difference between 5s - Sw.
Amount effect is further substantiated by the correlation between
precipitation and 5180 of both the water (0.42) and the shells (0.66).
By these correlation values it is observed that approximately 18% of
the variations in the water s18o values at the River Pra is due to
62

amount effect while approximately 44% of the variations in the shell
6180 values is attributable to amount effect (Table 6). Significant
18 18 . correlations exist between shell S O and water S O air temperature
and precipitation, however, the correlation between shell 8180 and
water temperature is even better (0.74). This is understandable
because the microenvironment of the gastropod is greatly influenced by
the water temperature.
18 between water 8 O, shell
For all practical purposes, the correlation
8180 and water temperature are the same
o.75. Since it does not rain heavily all year round, the precipitation
influences the 8180 variation by approximately 44% leaving the major
influence, 55%, of the s18o values to water temperature variation
which improves considerably with the slippage (65%).
Application of these results to fossil samples must be carried out
with caution as several other factors come into play and must be taken
into consideration in the interpretation of 8180 ratios of fossil
gastropod shells. Some of the factors that must be considered include
altitude, latitude, reliability of dating, longevity of gastropods and
knowledge of the hydrolog~cal regime from which the gastropod shell
was collected. For example, the ancient site from where the shell is
collected should be well 9ocumented and knowledge of the longevity of
the individual species of gastropods must be known. It is essential
to know the age of the shell in order to correlate it with other
historical environmental information. Some fossil shells undergo
diagenesis or recrystallization from aragonite to calcite, a process
engendered by local weathering conditions. Whether a shell is
aragonitic or calcitic can be detected by X-ray diffraction (XRD). In
63

order to extract seasonality information from a fossil shell, a
sequential sampling along the growth spirals of the individual shells
is necessary, while the average oxygen isotope ratios of whole shells
will be useful in the characterization of major regional climatic
trends ..
Apart from gastropod shell information, some environmental
information which can be acquired by other geological techniques has
to be provided before
interpretation of
applying oxygen
paleoclimates.
isotope ratio values to the
Among these
altitudinal, and hydrological information. For
are latitudinal,
example, the s18o
values of shells collected from a location where an ancient transient
stream existed would be very difficult to interpret as compared with a
location where a permanent body of water existed. Gastropods in areas
with low rainfall and transient streams risk undergoing estivation
which in turn will give only fragmentary seasonal information.
Gastropod shells collected from areas where there was permanent
vegetative cover, permanent lakes or tropical rainforest area with
rainfall all year round will give interpretable results. Latitudinal
and altitudinal information would also be useful in data
interpretation. The geogr~phical conditions of past water basins may
be deciphered from remote sensing by the Shuttle Imaging Radar (SIR),
Landsat images and Satellite navigation systems. For example,
McCauley and his colleagues (1986) have applied SIR, Landsat images
and Satellite navigation systems in their study of Miocene-Pliocene
drainage system in Saharan Africa. Freshwater bivalves and gastropods
were recovered at several points along the ancient waterways which
64

crossed the Sahara during the late Miocene and early Pliocene period,
and could prove useful in characterizing that climatic episode.
rn summary, the monthly analyses of both water and gastropod
shells from a tributary of River Pra at Krobo, in the Western region
of Ghana, approximately 700km from the Sahel, have shown amount
effect, temperature effect and evaporative effect. Good parallel i sm
18 between the S O plots of the shells, water and temperature was
observed. The s18o values were in agreement with vegetative cover
maps of Ghana and Africa. Seasonality was also recorded by the shells
of the gastropods. These results seem to pave the way for the
application of s18o of shells in deciphering past climatic conditions,
which is a boon to paleoclimatology. The application of this kind of
study to samples collected from sites of different vegetation cover in
the region would contribute to the data base upon which the application
of s18o values in the study of past climate could be based.
CONCLUSIONS
Upon completion of this '
study, the following observation were
made:
1. Freshwater gastropod shells are useful proxies of the prevailing
climatic conditions during the life span of the gastropods.
2. Evaporative effect, temperature effect, and amount effect can be
determined using the s18o of shells and water.
3. Time lag was observed between s18o of shell and the s18o of the
65

water.
4. s18o values of the shell and the water correlate well with
vegetation cover maps of Ghana and Africa.
5. seasonality was recorded in the s18o values of the shell and the
water.
6. Information on the general character of the body of water is
needed to apply shell oxygen isotope ratios as proxies in
paleoclimatology.
66

BIBLIOGRAPHY
Abell, P. I., (1982) Paleoclimates at Lake Turkana, Kenya, from
oxygen isotope ratios of gastropod shells. Nature, 297, 321-323
Abell, p. I., ( 1985) . Oxygen Isotope Ratios in Modern African
Gastropod Shells A data base for Paleoclimatology. Chemical
Geology, 58, 183-193
Arthur, M.A., Williams, D. F. and Jones, D. S. (1983). Seasonal
temperature-salinity changes and thermocline development in the mid
Atlantic Bight as recorded by the isotopic composition of bivalves.
Geology, 11, 655-659
Beadle, L. C., (1974). The Inland Waters Of Tropical Africa- An
introduction to Tropical Limnology. Longman Group Limited, p.32
Barnett, T. P., (1978). The role of the oceans in the global climate
system, in Climatic Change, ed. J. Gribben, University of Cambridge
Press, Cambridge, England, pp157-177
Boateng, E. A., (1967). A Geography Of Ghana, Cambridge University
Press, Second edition.
Brain, c. K., (1981a). The evolution of man in Africa: Was it a
consequence of Cainezoic cooling ? Geol. Soc. of Southern Africa, 84,
1-19
67

Brain, C. K., (1981b). Hominid evolution and climatic change. South
African J. of Science, 77, 104-5
Brown, D. S., (1980). Freshwater Snails of Africa and Their Medical
Importance. Taylor and Francis, London, pp 487
Budyko, M. I., (1978).
change, ed. J. Gribben,
England. pp85-113.
The heat balance of the earth. In Climatic
University of Cambridge Press, Cambridge,
Burchardt, B., (1977). Oxygen isotope ratios from shell material from
the Danish Middle Pleistocene (Selandian) deposits and their
interpretation as paleotemperatures. Paleogeog. Paleocli. Paleoecol.,
22 (3), 209-230
Butzer, K., (1977).
Sci., 65, 572-582
Environment, culture and human evolution. Amer.
Butzer, K.,
evolution, in
London.
(1978). Geo-economical perspectives on early hominid
Jolly, Duckworth, Early Hominids of Africa, ed. C.
Butzer, K. and Cooke, H. B. S., (1982). The paleo-ecology of the
African continent: the physical environment of Africa from the
earliest geological to Later Stone Age times, in the Cambridge History
68

of Africa, Vol. 1, ed. J. D. Clark. University of Cambridge Press,
cambridge, England. pp 1-69
Chervin, R. M., (1978). The limitations of climatic modelling: the
question of statistical significance, in Climatic Change, ed. J.
Gribben, University of Cambridge Press, Cambridge, England. pp85-113
Craig, H., (1961). Standard for reporting concentrations of deuterium
and oxygen-18 in natural waters. Science, 133, 1833-1834
oansgaard, W. , ( 1964) .
16,436-468
Dobzhansky, T., (1962).
Haven, Conn.
Stable isotopes in precipitation. Tellus,
Mankind evolving. Yale University Press, New
Ehhalt, D., Knot, K., Nagel, J. F., and Vogel, J. c., (1963).
Deuterium and oxygen-18 in rain water. J'ourn. Geophys. Research, 68,
pp 3775-80
Epstein, S., Buchsbaum, R., Lowenstam, H. A. and Urey, H. C. (1951).
Carbonate-water isotopic temperature scale. Geol. Soc. Amer. Bull.,
62, 417-426
Epstein, s., Buchsbaum, R., Lowemstam, H. A. and Urey, H. c., (1953).
Revised carbonate water isotopic temperature scale. Geol. Soc. Amer.
69

Bull., 64, 1315-1326
Epstein, S. and Lowenstam, H. A., (1953). Ternperatue-shell growth
relations of recent and interglacial Pleistocene shoal-water biota
from Bermuda. J. Geol., 61, (5), 424-438
Epstein, S., (1956). Variations of 18 16 . the 0/ 0 ratios of freshwater
and ice. Nat. Acad. Sci., Nucl. Sci. Ser., Rep. No.19, pp20-25
Eriksson, E., ( 1964). The history of the major pulses of tritium in
the stratosphere. Tellus, 16, No.5
Friedman, I., Machta, L., and Soller, R., (1962). Water vapor
exchange between a water droplet and its environment. Journ. Geophys.
Res., 67, pp 2761-70.
Friedman, I. and O'Niel, J. R., (1977). Compilation of stable isotope
fractionation factors of geochemical interest. Geol. Sur. Prof. Paper
440-kk. u. S. Gov. Printing.Office, Washington, D. C.
Griffiths, J. F., ed. (1972). World Survey of climatology, Vol. 10,
Climates of Africa. Elsevier Pub!. Co., Amsterdam, pp 604
Grossman, E., (1982). Stable isotopes in live benthic foraminifera
from the southern California Borderland. Ph. D. Dissertation,
University of Southern California, Los Angeles, Calif.
70

Grossman, E.
foraminifera:
L., ( 1987). Stable isotopes in modern benthic
A Study of Vital Effect. Journal of Foraminiferal
Research, 17, 48-61
Jones, D. S., Williams, D. F. and Arthur, M.A., (1983). Growth
history and ecology of the Atlantic surf clam, Spisula solidissirna
(Dillwyn), as revealed by stable isotopes and annual shell increments.
J. Exp. Mar. Biol. Ecol., 73, 225-242
Keith, M. L., Eichler, R. and Parker, R. H., (1960). Carbon and
oxygen isotope ratios in marine and freshwater mollusk shells
(abstract). Geol. Soc. Arner. Bull., 71, 1901
Keith, M. L., and Anderson, G. M., (1964). Carbon and oxygen isotopic
composition of mollusk shell from marine and freshwater environments.
Geochim. Cosmochim. Acta, 28 1757-1786
Keith, M. L., and Parker, R.H., (1965). Local variation of carbon-13
and oxygen-18 of mollusk shells and the relatively minor temperature
effect in marginal marine environments. Mar. Geol., 11 115-129
Laporte, L. and Zihlrnan, A., (1983). Plates, climate and human
evolution. South African Journal of Science, 79, 96-110
Ll!veque, c. , (1973). Dynarnique des peuplements biologie, et
71
estimation de la production des rnollusques benthique du Lac Chad. Cah.
off. Rech. Sci. Tech. OUtre-Mer, ser. Hydrobiol. ], 117-147.
Lee, C. A., (1979). Oxygen isotopes in the seasonal growth bands of
the Pismo clam. M. S. thesis, Dept of Geology, UCLA.
Levins, R., (1968). Evolution in Changing Environments. Princeton
University Press. Princeton, N. J.
Lewin, R., ( 1984).
New York.
Human evolution: an Introduction, w. H. Freeman,
Livingstone, D. A., (1971).
mankind. Arn. Sci, 59, 332-337
Speculations on the climatic history of
Matthew, w. D., (1915).
Sci., 24, 171-318
Climate and Evolution. Ann. New York Acad.
Matthew, w. D., (1939). Climate and Evolution. N. Y. Acad. Sci. Spec.
Publ. Vol.l
Mccauley, J., et al. (1986). Paleodrainages of eastern Sahara - The
radar rivers revisited, IEEE Trans. Geoscience GE-24 624.
McCrea, J. M., (1950). On the isotopic chemistry of carbonates and a
paleoternperature scale. J. Chern. Phys., 18, 849-857
72

Mix, C. A., and Pisias, N. G., (1988). Oxygen isotope analyses and
deap-sea temperature changes: implications for rates of oceanic
mixing. Nature, 331, 249-251
Mook, W. C., (1970). Stable carbon and oxygen isotopes of natural
waters in the Netherlands. Isotope Hydrology IAEA, Vienna pp 163-188
Mook, W. G., (1971). Paleotemperatures and chlorinities from stable
carbon and oxygen isotopes in shell carbonates. Paleogeog.,
Paleoclimat., Paleoecol., 2, 245-263
Mook, W. G., (1977). Stable carbon and oxygen isotopes of natural
waters in the Netherlands. International Atomic Energy Agency Conf.
Proc. Use of Isotopes in Hydrology, Vienna, pp 163-190
North, G. R. and Crowley, T. J., (1985). Application of a seasonal
climate model to Cenozoic glaciation. J. Geol. Soc. London, 142, 475-
482
Pearson, R. (1978). Climate and Evolution, Academic Press, London
Schifano, G. and Censi, P., (1983). Oxygen isotope composition and
rate of growth of Patella coerulea, Monodonta turbinata and M.
articulata shells from the western coast of Sicily. Paleogeog.
Paleoclimat. Paleoecol., 42, 305-311
73

Schifano, G.' (1983). Allometric growth as influenced by
environmental temperature in Monodonta turbinata shells. Paleogeog.
Paleoclimat. Paleoecol., 44, 215-222
Schneider S. H. and Lender R., (1984). The Coevolution of Climate and
Life. Sierra-Club Books. San Francisco. p45.
Shackleton, N. J., and Kennett, J. P., (1975). Paleotemperature
history of the Cenozoic and the initiation of Antartic glaciation:
oxygen and carbon isotope analysis in DSDP sites 277, 279 and 281.
Initial reports of the DSDP, 29, 743-755
Shackleton, N. J., and Opdyke, N. D., (1973). Oxygen isotope and
paleomagnetic stratigraphy of equatorial Pacific core V28-238: oxygen
isotope temperatures and ice-volumes on a 105 and 106 year scale. J.
Quarternary Res.,~, 39-55
Simpson, G. G., (1953). The major features of evolution. Columbia
University Press, New York.
Tucker, C. J., Townshend, J. R. G. and Goff, T. E., (1985). African
land-cover classification using satellite data. Science, 227, 369-375
Urey, H. C., (1947). The thermodynamic properties of isotopic
substances. J. Chem. Soc., pt. 1. p562-581
74

Vrba, E., (1980). Evolution, species and fossils: how does life evolve?
south African Journ. of Science,79, 59-83
Vrba, E., (1984). Evolutionary pattern and process in the sister
group Alcelaphini-Aepycerotini (Mammalia: Bovidae) in Living Fossils,
ed. N. Eldredge and S. M. Stanley. Springer-Verlag , New York . pp 62-79
Yurtsever, Y., ( 1975). Worldwide survery of stable isotopes in
precipitation. I. A. E. A. (Int. At. Energy. Agency), Vienna , Rep.,
report, Sect. !sot. Hydrol., pp 53.
75