fresno area regional groundwater management group · fresno area regional groundwater management...
TRANSCRIPT

FRESNO AREA REGIONAL
GROUNDWATER MANAGEMENT GROUP
2010 ANNUAL GROUNDWATER REPORT
• Fresno Irrigation District • City of Clovis • Fresno Metropolitan Flood Control District • • County of Fresno • City of Fresno • City of Kerman • Bakman Water Company •
• Garfield Water District • Malaga County Water District • Pinedale County Water District
1
Table of Contents
1 - INTRODUCTION ........................................................................................................ 3
1.1 - Plan Area ............................................................................................................. 3 1.2 - Report Objectives ................................................................................................ 3
2 - STAKEHOLDER INVOLVEMENT ............................................................................. 5 2.1 - Advisory Committee of Stakeholders ................................................................... 5 2.2 - Relationships with Other Agencies ...................................................................... 5 2.3 - Plan to Involve the Public and Non-Participating Agencies .................................. 6
3 - MONITORING PROGRAM ........................................................................................ 6 3.1 - Groundwater Level Monitoring ............................................................................. 7 3.2 - Groundwater Quality Monitoring .......................................................................... 9 3.3 - Monitoring Protocols .......................................................................................... 10 3.4 - Land Surface Subsidence Monitoring ................................................................ 10 3.5 - Surface Water Monitoring .................................................................................. 10
4 - GROUNDWATER RESOURCES PROTECTION .................................................... 12 4.1 - Well Destruction ................................................................................................. 12 4.2 - Well Construction Policies ................................................................................. 12 4.3 - Wellhead Protection ........................................................................................... 12 4.4 - Saline Water Intrusion ........................................................................................ 12 4.5 - Migration of Contaminated Groundwater ........................................................... 13 4.6 - Groundwater Quality Protection ......................................................................... 13
5 - GROUNDWATER SUSTAINABILITY ..................................................................... 14 5.1 - Groundwater Recharge ...................................................................................... 14 5.2 - Water Conservation and Education ................................................................... 15 5.3 - Groundwater Use Limitations ............................................................................. 15 5.4 - Conjunctive Use of Water Resources ................................................................ 15 5.5 - Wastewater Reclamation and Recycling ............................................................ 16 5.6 - Operation of Facilities ........................................................................................ 17
6 - GROUNDWATER PLANNING AND MANAGEMENT ............................................. 18 6.1 - Groundwater Reports ......................................................................................... 18 6.2 - Plan Re-evaluation ............................................................................................ 18 6.3 - Land Use Planning............................................................................................. 18 6.4 - Dispute Resolution ............................................................................................. 19 6.5 - Program Funding and Fees ............................................................................... 19

Fresno Area Regional Groundwater Management Group Annual Groundwater Report – 2010
2
Tables 1 – Groundwater Pumping 2 – 10-year Surface Water, Storage Change and Average Depth to Water 3 – January 2011 Underground Storage Capacity and Change 4 – Surface Water Usage Figures 1 – Map of Participating Agencies 2 – Well Location Map 3 – 2010 Elevation of Water in Wells 4 – 2010 Depth to Water in Wells 5 – 1-year Change in Water Elevation 6 – 10-year Surface Water, Storage Change and Average Depth to Water 7 – Map of Known Contaminant Plumes Appendices A – Groundwater Level Data B – Selected Well Hydrographs

Fresno Area Regional Groundwater Management Group Annual Groundwater Report – 2010
3
1 - INTRODUCTION In 2006, a group of nine public agencies and one private water company in the Fresno-Clovis Metropolitan Area adopted a regional Groundwater Management Plan (GMP or Plan). The Plan documents a regional approach toward groundwater management, while still addressing individual goals and issues for each of the participants. The Plan satisfies the new requirements for Groundwater Management Plans created by the September 2002 California State Senate Bill No. 1938, which amended Sections 10753 and 10795 of the California Water Code. The Plan also addresses recommended components for a Groundwater Management Plan described in Appendix C of Department of Water Resources Bulletin 118 (2003 Update). This report is the fourth Annual Groundwater Report prepared by the regional group and covers the 2010 calendar year. 1.1 - Plan Area The Plan Area lies within the Kings Groundwater Sub-basin, which is located within the San Joaquin Basin Hydrologic Study Area (HSA). The Plan boundary generally follows the boundary of the Fresno Irrigation District (FID), extending north and east beyond the FID boundary to the Friant-Kern Canal. The participants to this Plan include: Fresno Irrigation District County of Fresno City of Fresno City of Clovis City of Kerman Malaga County Water District Pinedale County Water District Fresno Metropolitan Flood Control District Bakman Water Company Garfield Water District
Refer to Figure 1 for a map showing the Plan Area and the location of each participant. The Plan Area covers approximately 455 square miles and is located entirely within Fresno County. In 2000, the total Plan Area population was approximately 600,000, according to US census data. 1.2 - Report Objectives The purpose of this annual report is to:
1. Document any changes in ongoing activities
2. Document progress on planned activities identified in the GMP or previous annual reports
3. Identify any new activities that are being planned or implemented

Fresno Area Regional Groundwater Management Group Annual Groundwater Report – 2010
4
4. Increase awareness of groundwater management efforts being performed by other local parties
5. Recommend changes to the Groundwater Management Plan
6. Document water supply statistics
7. Develop regional groundwater contour maps and evaluate trends in groundwater levels
8. Document all relevant groundwater management information to facilitate discussions among Plan participants
The following sections outline work completed by the plan participants for each of the GMP components. Specifically, the following sections describe changes in existing activities, progress on planned actions, and new activities. Existing activities described in the 2006 GMP are still being maintained, unless stated otherwise. Therefore, only changes in the existing activities are described in this report. Progress on planned actions includes progress on planned activities that were mentioned in the GMP or past annual groundwater reports. New activities include groundwater management projects that have not been mentioned in the GMP or any previous annual reports.

Fresno Area Regional Groundwater Management Group Annual Groundwater Report – 2010
5
2 - STAKEHOLDER INVOLVEMENT (SECTION 5 of the Plan)
2.1 - Advisory Committee of Stakeholders Changes in Existing Activities Al Steele of the Department of Water Resources was added to the Advisory Committee in 2006. Mr. Steel will provide input on DWR programs and third party comments on the group’s efforts. Some agency representatives on the Committee have changed. The members of the committee now include:
Laurence Kimura, Assistant General Manager, Fresno Irrigation District Bill Stretch, District Engineer, Fresno Irrigation District Brock Buche, Water Division, City of Fresno Lisa Koehn, Assistant Public Utilities Director, City of Clovis Alan Weaver, Public Works Director, County of Fresno Jerry Lakeman, Fresno Metropolitan Flood Control District Ken Moore, Public Works Director, City of Kerman Tim Bakman, Bakman Water Company Russ Holcomb, General Manager, Malaga County Water District Larry DeSantos, General Manager, Pinedale County Water District Dennis Keller, Engineer, Garfield Water District
Progress on Planned Actions None New Activities None 2.2 - Relationships with Other Agencies Changes in Existing Activities None Progress on Planned Actions The Upper Kings Basin Integrated Regional Water Management Plan has been completed and is in the process of being adopted. The Upper Kings Basin Integrated Regional Water Management Plan was adopted during 2007. The Forum applied for and received approval of funding under Proposition 50 for two groundwater banking projects during 2009.

Fresno Area Regional Groundwater Management Group Annual Groundwater Report – 2010
6
New Activities The Cities of Clovis, Fresno, County of Fresno, FID and FMFCD staff developed a group during 2007, which meets bi-monthly to discuss operational issues related to water treatment, surface water deliveries, groundwater monitoring and recharge. 2.3 - Plan to Involve the Public and Non-Participating Agencies Changes in Existing Activities None Progress on Planned Actions Press releases are regularly issued regarding UKBWF activities. MCWD has prepared their 2010 Bi-Annual Water Supply Report. New Activities None

Fresno Area Regional Groundwater Management Group Annual Groundwater Report – 2010
7
3 - MONITORING PROGRAM (SECTION 6 OF THE PLAN)
3.1 - Groundwater Level Monitoring
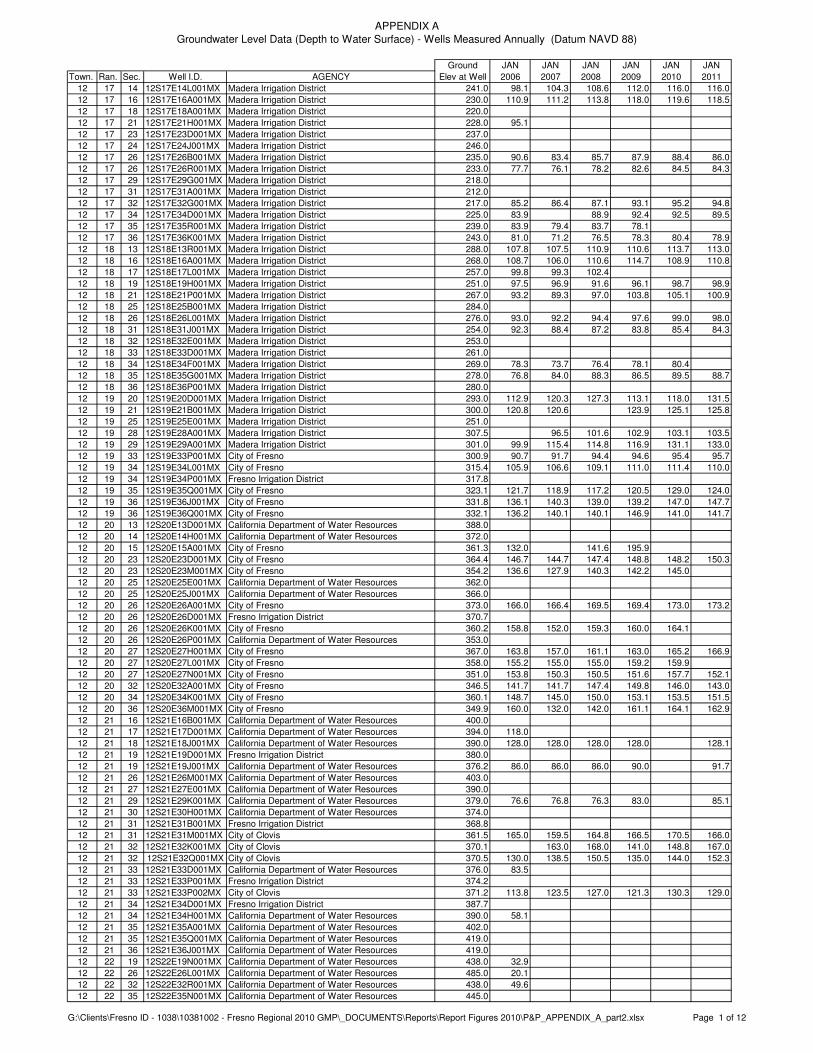
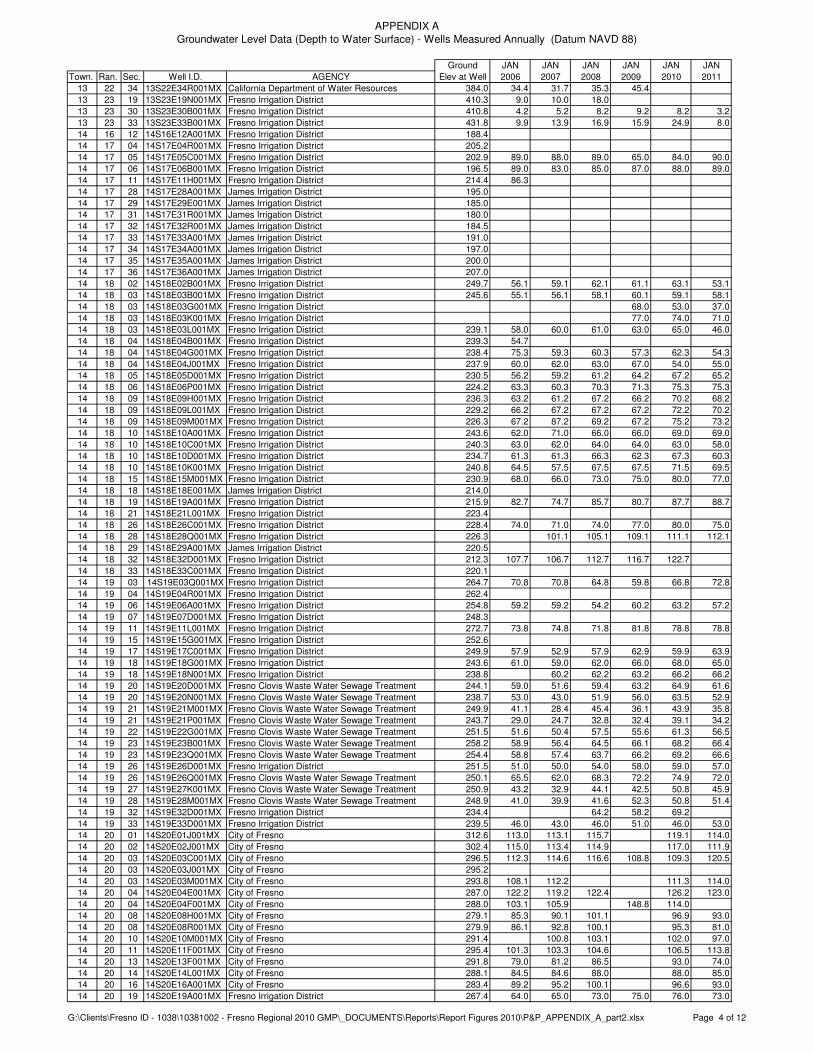
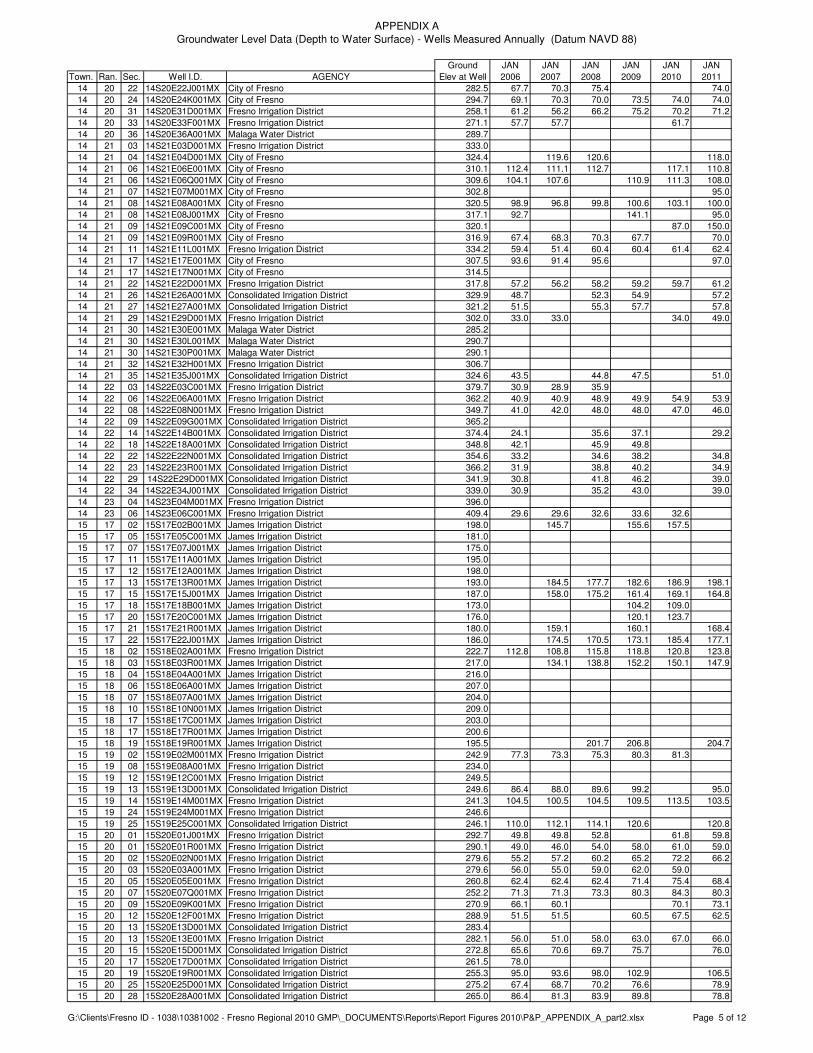
Water level measurements were collected from more than 240 wells to prepare a groundwater contour map of water levels measured from January through April 2011. Data was collected and included in the groundwater database developed for FID. Some monitored wells had no records for Spring 2010 but did have readings for Spring 2011, or vice versa. This can be problematic when calculating change between datasets and calculating average water levels for Township/Range regions. The problem is highlighted when shallow and deep wells exist within the same region. Future analysis of changing water levels will benefit from the same wells being consistently measured at the same time each year by all of the participating agencies.
Figure 2 shows the locations of the wells used to generate the contours. Refer to Figures 3 and 4 for groundwater elevation and groundwater depth for the Plan Area, respectively. As indicated in Figures 3 and 4, a large cone of depression exists beneath the urban areas of Fresno and Clovis. Figure 4 shows depth to water in wells to be deepest in the northeastern portion of the City of Fresno area, as well as the central portion of the City of Clovis. Within the urban area, the deepest depth to water measurement recorded was 173.2 ft.
Figure 5 is a contour map showing the change in water surface elevation over the previous year. Areas of increased water levels (0-10ft) appear throughout the Plan area in both urban and agricultural regions. Some areas of decreased water levels were evident in the urban areas and the southern east central portion of the Plan Area (see Appendix A 12S21E32K, 13S21E28G, 14S21E29D). The eastern most well in the Plan Area showed an increase of 16 ft. (13S23E33B). In general the western portion of the Plan Area showed increased water levels from 2-17ft with a few pockets having slightly decreased water levels (13S19E29A, 14S19E03Q). A review of the change in water level measurements from Appendix A shows: approximately 16% of the wells were relatively unchanged (increase or decrease less than 1 ft.), 66% showed an increase in water levels (majority show 1-6 ft increase), and 18% showed a decrease in water levels.
Appendix A includes tables with groundwater level data collected by the Plan participants, and Appendix B includes a few selected hydrographs with historical groundwater level data. Table 1 summarizes the groundwater pumping performed by the participants. The reporting Participants pumped more than 157,755 AF of water during the 2010 calendar year. Values in the table do not include pumping from private wells in the Plan Area.

Fresno Area Regional Groundwater Management Group Annual Groundwater Report – 2010
8
Table 2 provides a summary of the changes that have occurred within the Plan area over the last 10 years, including the change in average depth to groundwater, and the estimated groundwater storage change per year. The average depth to groundwater within the Plan Area was calculated to be 87.0 feet below ground surface, up 3.0 feet from the previous year. To calculate the average depth to water, the method that FID historically used was calculated with some minor modifications. FID’s historically used method includes:
1. FID was divided into three divisions; Southwest, Northwest and East, as shown in Figure 2. The reasoning behind the boundaries of each of these divisions is not known, but it is assumed to be based on hydrogeologic conditions within FID, and is roughly consistent with recent findings as part of the Upper Kings Forum groundwater investigations for the area. Although the reasoning could not be verified, it was determined to maintain these divisions, and the method used in order to keep continuity with historic data.
2. After the average depth to water for each division was calculated, the average depth for each division was then multiplied by a weighted factor for that division based on the total acreage within that division as compared to the smallest division. Because land outside of FID’s boundary was added to the Plan, these acreages and weighting factors were modified. The acreages and weighting factors for each division are shown below.
Division Acreage Factor East 71,848 1.00 Northwest 115,253 1.60 Southwest 104,400 1.45 Totals 291,501 4.05
3. Then to determine the overall Plan area average, the total of each division
average depth to groundwater multiplied by its weighting factor was then divided by the total of all weighting factors. For example, where AD = average depth:
[(East Division AD * 1.00) + (NW AD * 1.60) + (SW AD * 1.45)] Plan Area Average = -----------------------------------------------------------------------------------
4.05 The storage change calculation was also performed in the same manner that FID has historically calculated. The calculation of storage change assumes a base depth of 200 feet below ground surface and calculates the change in groundwater that occurs above that baseline. FID has included specific yields for each Township within FID for depths of 0-50ft, 50-100ft, and 100-200ft below the ground surface. The source of those specific yields has not been identified in FID reports. A review of available data found specific yields for each Township for the same depth ranges in USGS Water Supply Paper No. 1469 dated 1959, however these specific yields did not match the same numbers indicated in FID’s historic data. Because the origin of the data could not be

Fresno Area Regional Groundwater Management Group Annual Groundwater Report – 2010
9
verified, the specific yields indicated in the USGS paper were used for each Township. The specific yields for each Township are shown in Table 3. The process for calculating storage capacity includes the following steps:
1. Calculate average depth to groundwater for each Township based on the well data collected.
2. Multiply the height of water within each depth zone by the specific yield for that depth zone and by the area of that Township within the Plan area.
3. Sum the total storage capacity for all Townships. 4. Then compare the storage capacity from one year to the next. These values are
shown in Table 3. Since the specific yield values changed, as well as the total acreage because of the increase to the Plan area, values for 2006 indicate a change in calculations. To more accurately represent the change from 2005 to 2006, values for 2005 were calculated using the revised specific yields and modified acreage.
A lack of well data exists for Township 12S, Range 22E, so this area was not included in the storage change calculations. Additional wells in this township, and generally in the area between the Enterprise Canal and the Friant Kern Canal need to be identified and included in the water level monitoring network. Figure 6 graphs some of the data from Table 2, including average depth to groundwater, estimated storage change, and total surface water delivered. Changes in Existing Activities None Progress on Planned Actions Some participants will begin sounding water levels in different months to be consistent with other participants. New Activities Clovis will begin documenting the reference point for depth to groundwater measurements to come up with groundwater elevations. Clovis has decided that this year we will also collect static water levels around April 1 as a comparison to the February levels. Bakman Water Company will alter its schedule for well sounding and try to gather the data twice per year in January and April to correspond with other agencies. 3.2 - Groundwater Quality Monitoring Changes in Existing Activities

Fresno Area Regional Groundwater Management Group Annual Groundwater Report – 2010
10
None Progress on Planned Actions None New Activities None 3.3 - Monitoring Protocols Changes in Existing Activities None Progress on Planned Actions None New Activities None 3.4 - Land Surface Subsidence Monitoring Changes in Existing Activities In the City of Clovis staff has become aware of potential subsidence in the Herndon Avenue corridor from Peach Avenue to Minnewawa Avenue. Progress on Planned Actions None New Activities None 3.5 - Surface Water Monitoring Table 4 summarizes surface water deliveries made by the Plan participants during the 2010 calendar year. FID and GWD deliver surface water to the plan area. FID and GWD combined to deliver nearly 553,191 AF of water during 2010 into the Plan area. Although International WD is not a Plan participant, they delivered 1,185 into the Plan area. Not included in the delivery totals for FID is 11,091 AF of reclaimed groundwater. Water was delivered to growers for agricultural irrigation, the cities of Fresno and Clovis for treatment for domestic uses, and to numerous basins and ponds for groundwater recharge. Changes in Existing Activities

Fresno Area Regional Groundwater Management Group Annual Groundwater Report – 2010
11
None Progress on Planned Actions None New Activities None

Fresno Area Regional Groundwater Management Group Annual Groundwater Report – 2010
12
4 - GROUNDWATER RESOURCES PROTECTION (SECTION 7 OF THE PLAN)
4.1 - Well Destruction Changes in Existing Activities None Progress on Planned Actions None New Activities None 4.2 - Well Construction Policies Changes in Existing Activities None Progress on Planned Actions None New Activities None 4.3 - Wellhead Protection Changes in Existing Activities None Progress on Planned Actions None New Activities None 4.4 - Saline Water Intrusion Changes in Existing Activities None Progress on Planned Actions
Fresno Area Regional Groundwater Management Group Annual Groundwater Report – 2010
13
None New Activities None 4.5 - Migration of Contaminated Groundwater Changes in Existing Activities None Progress on Planned Actions Refer to Figure 7 for a map of contaminant plumes in the Plan Area. This map does not include all of the known plumes in the Plan Area, but represents the City of Fresno’s efforts during 2006 to document the location of most of the known plumes as part of an update to the City’s Water Resources Management Plan. Primary concerns include EDB, TCP, DBCP, and areas of higher nitrate levels. A brief description of each plume is also included. New Activities None 4.6 - Groundwater Quality Protection Changes in Existing Activities None Progress on Planned Actions Clovis has upgraded security at some of its water facilities within the past year by replacing and upgrading fencing and adding surveillance cameras. New Activities None
Fresno Area Regional Groundwater Management Group Annual Groundwater Report – 2010
14
5 - GROUNDWATER SUSTAINABILITY 5.1 - Groundwater Recharge Included in Table 4 are the total deliveries made for groundwater recharge to City of Fresno, City of Clovis and FMFCD facilities. These deliveries totaled more than 87,380 AF in 2010, including delivery to more than 60 different FMFCD basins. Not all FID-owned recharge ponds have measurement devices, so the amount of recharge at FID ponds has not been separately quantified in this report. Recharge deliveries to FID-owned facilities is included in the total deliveries shown in Table 2. Changes in Existing Activities None Progress on Planned Actions Bakman Water Company and Fresno Metropolitan Flood Control District have completed the joint effort of establishing a pipeline from Basin W to Basin X and the installation of a meter for recharge water. Bakman and Fresno Irrigation District are working out the details for the recharge water. Improvements to several FMFCD basins for use as part of the Groundwater Recharge program were completed, including:
FMFCD completed excavation in Basin “CS” and amended agreements with FID and the City of Fresno to add this 22 acre basin to the groundwater recharge program.
FMFCD constructed pump stations to improve the maintenance of Basins “AB” and “1G”, basins used for groundwater recharge purposes during the FID irrigation season.
The excavation of Basins “J”, “GG” and “BE” was completed and expanded the capacity of the basins for groundwater recharge purposes during the FID irrigation season.
The excavation of Basin “BM” was completed, expanding the capacity of the basin for groundwater recharge purposes. FMFCD began working on the facilities necessary to deliver water to the basin.
FMFCD completed the connection of Basin “BH” to Fancher Creek pursuant to previously amended agreements with FID and the City of Fresno to add this 16.6 acre basin to the groundwater recharge program.
Clovis requested and FMFCD agreed to design the landscape irrigation for Basin S utilizing surface water. (2008).
New Activities None

Fresno Area Regional Groundwater Management Group Annual Groundwater Report – 2010
15
5.2 - Water Conservation and Education Changes in Existing Activities None Progress on Planned Actions None New Activities In March 2006, the City of Fresno initiated a rebate program for the installation of ultra-low flush toilets. In June 2007, the City of Clovis began offering rebates to customers for purchase of water efficient washing machines. 5.3 - Groundwater Use Limitations Changes in Existing Activities None Progress on Planned Actions The Cities of Clovis and Fresno and FID have been working with the County of Fresno to provide a surface water supply and treatment for the Dry Creek area of Fresno County. (2008) New Activities None 5.4 - Conjunctive Use of Water Resources Changes in Existing Activities None Progress on Planned Actions The Cities of Fresno and Clovis require land with surface water rights to retain those rights in order to be considered for annexation. Clovis is considering additional water banking opportunities with other agencies for lands that do not have surface water rights. Fresno Irrigation District investigated the feasibility of groundwater banking sites in the Fancher Creek System of their service area.

Fresno Area Regional Groundwater Management Group Annual Groundwater Report – 2010
16
The City of Kerman desires to enter into an agreement similar to the ‘Conveyance Agreement’ that FID has with both the Cities of Fresno and Clovis. The Conveyance Agreement allows cities to receive surface water entitlements on annexed lands that were originally delivered to crops on those lands, as long as the cities continue to pay the water user fees. Fresno Irrigation District completed construction of most of the Waldron Pond Groundwater Banking Project and part of the facilities was used in 2006. Construction was completed in 2007. New Activities None 5.5 - Wastewater Reclamation and Recycling Changes in Existing Activities None Progress on Planned Actions The City of Clovis has developed its recycled water rules, regulations, and ordinance for use once the new Water Reuse Facility near Ashlan and McCall is completed in 2008. Landscape areas within the City of Clovis’ proposed recycled water use area are being plumbed to accept recycled water from the new Water Reuse Facility. Malaga CWD submitted an application to FID and the RWQCB to increase the discharge of tertiary treated effluent into FID canals. FID has allowed MCWD to increase to 0.45 mgd per day, however, the MCWD is pursuing disposal alternatives that will allow MCWD to limit discharges to the water run. Malaga CWD held discussions with Caltrans in 2007 on the use of tertiary treated effluent on Highway 99 landscaping. Caltrans did not wish to use the treated effluent on their landscaping. The City of Kerman is looking into developing an untreated surface water delivery system that would convey surface water from FID’s canal system to non-potable demands within the City, such as landscaping. New Activities None
Fresno Area Regional Groundwater Management Group Annual Groundwater Report – 2010
17
5.6 - Operation of Facilities Changes in Existing Activities FID initiated a 3-year improvement plan for their extensive canal system. The improvements will aid in the delivery of surface water to recharge basins. Progress on Planned Actions None New Activities None

Fresno Area Regional Groundwater Management Group Annual Groundwater Report – 2010
18
6 - GROUNDWATER PLANNING AND MANAGEMENT 6.1 - Groundwater Reports Changes in Existing Activities None Progress on Planned Actions This annual report was prepared as a collective effort by all of the GMP participants. New Activities None 6.2 - Plan Re-evaluation Changes in Existing Activities None Progress on Planned Actions The California Department of Water Resources provided comments on the Draft GMP in January 2006. Most of their comments were incorporated into the Final GMP. However some were not incorporated due to lack of data or time constraints and will be considered during the next GMP update. Below is a summary of possible updates to the GMP based on the DWR comments:
1. Map of areas with groundwater quality degradation 2. Development of detailed, standardized monitoring protocols 3. More detailed discussions on historic land-surface subsidence based on published
literature 4. Discuss availability of well construction records from Fresno County 5. Discuss base of fresh water in aquifer based on published literature 6. On-going and Changes in Existing Activities for contaminant plume management 7. Banning of recreational lakes that are maintained by groundwater pumping
New Activities None 6.3 - Land Use Planning Changes in Existing Activities None

Fresno Area Regional Groundwater Management Group Annual Groundwater Report – 2010
19
Progress on Planned Actions The Upper Kings Basin Water Forum has developed an Integrated Regional Water Management Plan. One of the components of that plan is a discussion of land use planning and its relationship with water supply. Regional planning activities that include the blueprint process are now reaching out to the Forum for information on water supply. The Forum will designate members to participate in regional planning activities. (2008). New Activities None 6.4 - Dispute Resolution Changes in Existing Activities None Progress on Planned Actions None New Activities None 6.5 - Program Funding and Fees Changes in Existing Activities None Progress on Planned Actions None New Activities None

FRESNO AREA REGIONAL GROUNDWATER MANAGEMENT GROUP
2010 ANNUAL REPORT
TABLES

Fresno Area Regional Groundwater Management Group2010 Annual Groundwater Report
Groundwater Pumping
Participant Jan Feb Mar Apr May Jun Jul Aug Sept Oct Nov Dec Total
Fresno Irrigation District 0
County of Fresno 0
City of Fresno 6,909 5,119 6,920 7,248 11,431 15,286 17,508 16,693 14,242 11,044 9,117 7,052 128,569
City of Clovis 956 497 849 955 1770 2460 2602 2666 1852 1431 1348 815 18,200
City of Kerman 138 122 173 219 321 421 472 431 386 294 191 144 3,311
Malaga County Water District 0
Pinedale County Water District 104 105 178 142 222 196 239 325 239 125 96 39 2,010
Fresno Metropolitan Flood Control District 0
Bakman Water Company 169 170 243 243 349 502 604 553 416 369 252 182 4,052
Garfield Water District (3)
0
Total 8,276 6,012 8,363 8,807 14,093 18,865 21,424 20,667 17,134 13,263 11,004 8,233 156,142
Notes:
1) Values in the table do not include pumping from private wells in the participant's service area.
3) No data available at the time of this report.
(all values in acre-feet)
Table 1
2) The City of Fresno pumps reclaimed groundwater near the Fresno wastewater treatment plant and delivers it to the FID Canal system. These volumes are not included in
the values in the table.
G:\Clients\Fresno ID - 1038\10381002 - Fresno Regional 2010 GMP\_DOCUMENTS\Reports\Report Figures 2010\Water Supply Data 2009_Table 1 and 4.xls

TABLE 2
GROUNDWATER DEPTH, STORAGE, & DELIVERIES
REPORT AVERAGE FID & CITY DIVISIONAL DEPTHS (2) STORAGE STORAGE TOTAL RECHARGE
YEAR DEPTH (1) NW SW EAST CHANGE (AF) VOLUME (AF) DEL (AF) (8) DEL. (AF)
2000 68.1 90.7 71.7 33.2 -22,935 3,718,248 389,895 59,046
2001 70.4 93.3 71.3 39.2 -29,564 3,688,684 470,394 56,509
2002 74.5 96.4 76.1 43.1 -83,673 3,605,011 486,975 62,066
2003 75.8 94.5 80.1 44.9 -86,721 3,518,290 438,747 (5) 55,576 [66,345]
2004 76.1 96.9 79.5 43.8 7,358 3,525,648 477,460 (5) 51,971 [77,738]
2005 74.9 99.5 71.6 47.7 69,386 3,561,277 518,203 (5) 50,158 [80,061]
2006 81.2 (4) 105.9 77.7 46.7 -7,106 (6) 4,020,245 (6) 616,227 (7) 49,280 [77,112]
2007 85.5 111.3 81.0 50.5 -125,494 3,836,247 414272 42,409 [67,695]
2008 86.6 109.6 83.7 53.8 -34,439 3,801,808 564,899 58,406 [86,505]
2009 91.0 113.2 85.5 63.5 -72,389 3,705,296 560,897 62,474 [90,438]
2010 87.0 109.2 85.1 54.4 100,850 3,776,825 641,758 60,361 [87,382]
Notes: (1) Depths are weighted by division area.
(2) See Figure 2, Quarterly Wells & Divisional Map for NW, SW & East Divisions
(3) See Appendix A, Quarterly Groundwater Report Database for well data
(4) Average depth to groundwater calculated with modified weighting factors in 2006 and following years.
(5) Deliveries after October 1 are included in total deliveries for the following calendar year
(6) Specific yield for several Townships modified in 2006 to be consistent with USGS Paper 1469. 2005 storage volume was
recalculated using the new specific yields to determine the storage change from 2005 to 2006.
(7) 2006 and following years include FID, Garfield WD and International WD deliveries. Previous years only included FID deliveries.
(8) 2000 and following years do not have reclaimed groundwater in delivery totals.
[ ] Includes deliveries to Surface Water Treatment Plants in both City of Fresno & City of Clovis

Annual Groundwater ReportUnderground Storage Capacity and Change
Specific Yield Depth of Water 0-200' Storage Storage Change
0-50' %Yield 50-100' %Yield 100-200' %Yield Average
Depth(ft)
Yearly
Change(AF)
Capacity
(AC-FT)
Existing
(AC-FT)
Yearly
Change(ft)
Township Range FID
Acres
January2011
Fresno Irrigation District
12 19 3,600 15.6% 15.1% 10.3% 124 92,340 28,309-1.3 -486
12 20 12,300 13.5% 11.7% 15.3% 157 343,170 80,6800.5 1,017
12 21 19,300 11.2% 13.1% 13.9% 131 502,765 184,282-3.4 -9,255
13 17 12,900 10.3% 6.9% 8.8% 57 224,460 151,6764.1 3,617
13 18 20,100 11.8% 10.2% 12.6% 55 474,360 344,8876.1 12,412
13 19 22,900 14.5% 13.5% 14.3% 96 648,070 340,0670.9 2,735
13 20 23,000 10.6% 12.2% 10.9% 129 512,900 177,1716.3 15,870
13 21 23,000 10.6% 12.2% 10.9% 126 512,900 185,1133.9 9,827
13 22 22,500 7.4% 7.5% 4.4% 27 266,625 220,9496.5 10,838
13 23 6,100 16.4% 7.2% 7.4% 6 117,120 111,5184.2 4,202
14 17 5,800 9.6% 15.7% 16.0% 90 166,170 102,361-4.5 -4,098
14 18 23,000 9.6% 15.7% 16.0% 63 658,950 502,37010.4 37,656
14 19 23,000 14.5% 13.5% 14.3% 59 650,900 457,0743.0 9,290
14 20 23,000 10.6% 12.2% 10.9% 95 512,900 266,0633.1 8,604
14 21 18,500 15.9% 12.7% 8.5% 85 421,800 191,349-3.6 -8,494
14 22 7,100 17.8% 15.8% 10.4% 40 193,120 143,15512.4 15,412
15 19 6,400 13.0% 10.9% 13.9% 106 165,440 83,252-6.5 -5,795
15 20 9,400 13.8% 13.4% 13.4% 73 253,800 160,032-4.7 -5,927
15 21 2,400 13.8% 13.4% 13.4% 55 64,800 46,51910.7 3,425
TOTALS: 100,8503,776,8256,782,590

Fresno Area Regional Groundwater Management Group2010 Annual Groundwater Report
Surface Water Usage (direct deliveries and groundwater recharge)
Fresno Irrigation District Surface Water
Participant Jan Feb Mar Apr May Jun Jul Aug Sept Oct Nov Dec Total
Fresno SWTP 173 1,180 1,338 1,906 2,131 2,512 2,745 2,753 2,483 2,117 0 244 19,582
Fresno Recharge 248 1,218 2,772 2,895 7,240 7,620 9,031 9,816 6,845 4,855 0 57 52,597
Clovis SWTP 46 408 424 555 693 828 1,040 1,188 1,154 946 0 157 7,439
Clovis Recharge 153 321 699 619 982 1,179 1,193 997 712 703 0 206 7,764
FID Growers and Recharge Basins 14 3,867 30,834 53,134 70,226 78,573 83,660 57,034 36,691 49,798 69 0 463,900
Total Fresno Irrigation District 634 6,994 36,067 59,109 81,272 90,712 97,669 71,788 47,885 58,419 69 664 551,282
Other Agencies
County of Fresno 0
City of Kerman 0
Malaga County Water District 0 0 0 0 0 0 0 0 0 0 0 0 0
Pinedale County Water District 0 0 0 0 0 0 0 0 0 0 0 0 0
Fresno Metropolitan Flood Control District 0 0 0 0 0 0 0 0 0 0 0 0 0
Bakman Water Company 0 0 0 0 0 0 0 0 0 0 0 0 0
Garfield Water District 1,909
International Water District (3)
1,185
Total 0 0 0 0 0 0 0 0 0 0 0 0 3,094
Notes:
1) Bakman Water Company does not currently perform direct groundwater recharge but provides an annual payment to FID to fund groundwater recharge projects in the area.
Table 4
(all values in acre-feet)
2) Delivery of surface water to FMFCD is included under recharge for the cities of Fresno and Clovis. Incidental recharge of stormwater also occurs in FMFCD
but is not quantified herein.
3) Not a participant to the Plan.
G:\Clients\Fresno ID - 1038\10381002 - Fresno Regional 2010 GMP\_DOCUMENTS\Reports\Report Figures 2010\Water Supply Data 2010_Table 1 and 4.xls

FRESNO AREA REGIONAL GROUNDWATER MANAGEMENT GROUP
2010 ANNUAL REPORT
FIGURES

Ak
Aw
AÎ
?÷
?c
FMFCD
BIOLA
C.S.D.*
INTERNATIONAL
W.D.*
GARFIELD
W.D.
EASTON*Madera Co
Fresno Co
SAN J
OAQUIN RIVER
CSUF*
?c
AÎ
Madera Co.
Madera Co.
CITY OF
KERMAN
CITY OF
CLOVIS
CITY OF
FRESNO BAKMAN W.C.
PINEDALE C.W.D.
MALAGA C.W.D.
FRIANT-KERN CANAL
The Plan area lies entirely within the County of Fresno,and the County is a participant to the Plan.
The Plan area lies within the Kings River Conservation District.
0 1 2 3 4Miles
286 W. Cromwell Ave.Fresno, CA 93711-6162(559) 449-2700
Figure 1
Fresno-Area RegionalGroundwater Management Plan
Participating Agencies
LEGENDCOUNTY OF FRESNO
!
! ! !
! ! !
CITY OF FRESNO
CITY OF KERMAN
PINEDALE W.D.
CITY OF CLOVIS
BAKMAN W.D.
GARFIELD W.D.
MALAGA C.W.D.
FRESNO I.D.
FMFCD Boundary
*Agencies within planboundary, not participating
GWMP BOUNDARY
FRIANT-KERN CANAL
I

!(!(
!(
!(
!(!(
!(
!(
!(
!.
!!!!
!.
$
$
$$
$$
$
�)!. ##0
�)
�)
�) ##0!.
$
$$
!.
XXYXXYXXY!.
�)
!.
!.!.!.!.!.XXYXXYXXYXXY
XXYXXY##0!.
!.
!.
!.
!.
!.!.
XXY
XXYXXY !.XXYXXY
!.!.
!.
!.
!.
XXY
XXYXXY
XXYXXY
##0##0##0!.##0##0##0##0
!.
XXY
XXYXXY
XXY
XXY
##0
##0!.
XXY
XXYXXY
XXY
##0##0##0##0##0
##
# #
#!!
##!!
!!
## # # #
##
#
!.
!!
!!
!!!!
!!!!(!!(
##
#!! ��
!.
#
#
����
!.#
!.��
#
!!
!!
!!
!!
!!!.
!!!!
!!(!!(
#
#
#
# #��
��
��
��!!!!!!
!!
!! !!!!
!!
!!
!.!!(!!(!!(
����
!!!!
!!!!
!!
!!
!!!.
#!.
!. #��
�� ��
��
����
��
��!.!!
!!
!!!!!!
!!!.
!.
!.!.!.
!!(
#
#!.
#
!.
��
��
����
��
������
����!!
!!!!
!!
!! !!
!!!!
!!!.
!.!.
#
#
# !.
!.#
!.
!.
#
#
!!
������
!.
!.
!.!.
!.
#
#
# !.
!.
!.
#!!
!!
!! ��
!!
!!
!!
!!
!!
!!
!!
!!!.
!.!.
!.!.
!.
!.!.!.
!.!.
#
!.!.
!.
##
#
!!!!
!!
!!
!!
!!
!.!.
!.
!.!.
!.
!.
!.!! !.!!
!!
!.
!!
!.
!!!!
!!
!!!! !!
!.
!.
!.
!.
!.
!.
!.!.!. !.
!.!.
!.!. !.
!.
!!
!!
##0
!.
!! !!
!!
!!!!
!!
!!
!.
!.!. !.
!.
!.
!.!. !.
!.!.
!!
!!##0
!!!!##0
!!!.
!.
!.
!.!.XXY
##0##0
!.
!.
##0
##0
##0
##0
##0
##0##0##0
##0 ##0 ##0
!!(
!!( !!(
!!(!!(
!!(
!!(!!(!!( !!(
!!( !!(
!!(
!!(!!(
!!(
!!(
!!(
!!(
!!(
!!(!!(
!!(!!(!!(
!!(!!(
!!(
!!(
!!( !!(
!!( !!
!!
!!
!.
!.
!.
!.
!.!.!.
!.
!.!.
!.!.
!.!.!.!.!.
!.!.
!.!.
!.
!.!.
!.!.
EAST REGION
NORTHWEST REGION
SOUTHWEST REGION
Legend
Well Location (FID Database)
Agency Measuring Well Depth
# California Department of Water Resources
�� City of Clovis
!! City of Fresno
##0 Consolidated Irrigation District
$ Fresno Clovis Waste Water Sewage Treatment
!. Fresno Irrigation District
XXY James Irrigation District
!!( Madera Irrigation District
�) Malaga County Water District
GWMP Boundary
Sections
Major Streets
!(Hydrograph Providedin Appendix
Groundwater Regions
Waste Water Treatment Plant
Leaky Acres
FID Pond / Basin
FMFCD Basin
Surface Water Treatment Plant
Facilities
Canal
Creek
Culvert
Flume
Pipeline
River
Fresno Area-Regional Groundwater Management Plan
Annual Report
Well Location Map, By Agency0 1 2 3 4 5Miles
I
Approximate Scale
Figure 2

!
!!
!
!
!
!!
!!
!
! !!
!
!
!!
!
!
!!
!!
!
!
!
!
!
!
!!
!
!!!
!
!!
!!
!
!
!!
!!
!!!!!
!
!
!
!
!
!
!!
! !!!
!!
!
!
!
!
!!
!
!
!
!
!!
!
!
!!!
!!
!!
!!
!
!
!!
!
!
!!
!!
!
!!!
!!
!
!!
!
!!!
!
!!!
!!
!
!
!!
!
!
! !
!
!
!
!!
!
!!
!
!!!!
!
!
!
!!
!
!!!
!
!!
!!
!
!
!!
!
!
!
!
!!!! !
!!
!
!
!!
!
!
!
!
!
!
!
!! !
!
!! !
!
! !
! !
!
!!
!
!
!
! !
!
!
!! !
!!
!!
!!
!
!!
!!
!
!
!!
!
!!!
! !
!
!
!
!
!!!
!
!
!
!
!
!!
!
!
!
! !
110
180
170
200
230
220
210
120
0
120
190
430
170
60
70
50
130
80
10
40
42
0
90
200
30 20
140
100
410
400
110
390
20
0
150
380
370
120
360
21
0
350
340
330320
180
300
310
130
140
280
290
150
270
240
25
0
260
230
220
200
200
170
19
0
210
160
180
19
0
Legend
! Well Location
Lines of Equal Elevation(Feet Above Sea Level, NAVD88)
10 foot interval
50 foot interval
GWMP Boundary
Major Streets
Sections
Waste Water Treatment Plant
Leaky Acres
FID Pond / Basin
FMFCD Basin
Surface Water Treatment Plant
Facilities
Canal
Creek
Culvert
Flume
Pipeline
River
Fresno Area-Regional Groundwater Management Plan
Annual Report
2010 Elevation of Water In Wells(Spring 2011)
0 1 2 3 4 5Miles
I
Approximate Scale
Figure 3

!
!!
!
!
!
!!
!!
!
! !!
!
!
!!
!
!
!!
!!
!
!
!
!
!
!
!!
!
!!!
!
!!
!!
!
!
!!
!!
!!!!!
!
!
!
!
!
!
!!
! !!!
!!
!
!
!
!
!!
!
!
!
!
!!
!
!
!!!
!!
!!
!!
!
!
!!
!
!
!!
!!
!
!!!
!!
!
!!
!
!!!
!
!!!
!!
!
!
!!
!
!
! !
!
!
!
!!
!
!!
!
!!!!
!
!
!
!!
!
!!!
!
!!
!!
!
!
!!
!
!
!
!
!!!! !
!!
!
!
!!
!
!
!
!
!
!
!
!! !
!
!! !
!
! !
! !
!
!!
!
!
!
! !
!
!
!! !
!!
!!
!!
!
!!
!!
!
!
!!
!
!!!
! !
!
!
!
!
!!!
!
!
!
!
!
!!
!
!
!
! !
50
80
90
100
70
30
10
140
110
190
160
50
130
20
40
60
170
110
80
170
20
130
50
70
110
60
70
50
50
90
60
60
100
120
120
12014
0
140
150
150
180
160
20
0
130
40
60
130
110
40
30
Legend
! Well Location
Lines of Equal Depth(Depth Below Ground Surface)
10 foot interval
50 foot interval
GWMP Boundary
Major Streets
Sections
Waste Water Treatment Plant
Leaky Acres
FID Pond / Basin
FMFCD Basin
Surface Water Treatment Plant
Facilities
Canal
Creek
Culvert
Flume
Pipeline
River
Fresno Area-Regional Groundwater Management Plan
Annual Report
2010 Depth To Water In Wells(Spring 2011)
0 1 2 3 4 5Miles
I
Approximate Scale
Figure 4

0
20
10
-10
-10
100
0
10
0 10
0
0
0
0
10
0
10
0
0
0
0
0
0
0 0
0
0
0
0 10
10
-10 -10
-10
- 20
-10
-10
20
10
10
10
Legend
Lines of Equal Change
10 foot interval
No Change
GWMP Boundary
Major Streets
Sections
Waste Water Treatment Plant
Leaky Acres
FID Pond / Basin
FMFCD Basin
Surface Water Treatment Plant
Facilities
Canal
Creek
Culvert
Flume
Pipeline
River
10 foot interval
Fresno Area-Regional Groundwater Management Plan
Annual Report
Elevation of Water In Wells2010-2011 Change
0 1 2 3 4 5Miles
I
Approximate Scale
Figure 5
*Contours of equal change are based on current year and previous year modeled groundwater elevation surfaces. Inconsistancies in data collection locations ( ie. a well is measured one year and not the next) may lead to modeled change discrepencies.

-22.935
-29.564
-83.673
-86.721
7.358
69.386
-65.611
-125.494
-34.439
-72.389
100.850
38.9895
47.0394 48.697543.8747
47.74651.8203
61.6227
41.4272
56.4819 56.0897
64.1758
-135
-85
-35
15
65
-135
-85
-35
15
65
2000 2001 2002 2003 2004 2005 2006 2007 2008 2009 2010
YEAR
FIGURE 6
GROUNDWATER DEPTH & STORAGE, 2000- 2010
Groundwater Storage Change (1,000AF)
Surface Water Delivered (10,000AF)
Average Depth to Groundwater (ft)


FRESNO AREA REGIONAL GROUNDWATER MANAGEMENT GROUP
2010 ANNUAL REPORT
APPENDICES

FRESNO AREA REGIONAL GROUNDWATER MANAGEMENT GROUP
2010 ANNUAL REPORT
APPENDIX A – GROUNDWATER LEVEL DATA
APPENDIX A
Groundwater Level Data (Depth to Water Surface) - Wells Measured Annually (Datum NAVD 88)
Ground JAN JAN JAN JAN JAN JAN
Town. Ran. Sec. Well I.D. AGENCY Elev at Well 2006 2007 2008 2009 2010 2011
12 17 14 12S17E14L001MX Madera Irrigation District 241.0 98.1 104.3 108.6 112.0 116.0 116.0
12 17 16 12S17E16A001MX Madera Irrigation District 230.0 110.9 111.2 113.8 118.0 119.6 118.5
12 17 18 12S17E18A001MX Madera Irrigation District 220.0
12 17 21 12S17E21H001MX Madera Irrigation District 228.0 95.1
12 17 23 12S17E23D001MX Madera Irrigation District 237.0
12 17 24 12S17E24J001MX Madera Irrigation District 246.0
12 17 26 12S17E26B001MX Madera Irrigation District 235.0 90.6 83.4 85.7 87.9 88.4 86.0
12 17 26 12S17E26R001MX Madera Irrigation District 233.0 77.7 76.1 78.2 82.6 84.5 84.3
12 17 29 12S17E29G001MX Madera Irrigation District 218.0
12 17 31 12S17E31A001MX Madera Irrigation District 212.0
12 17 32 12S17E32G001MX Madera Irrigation District 217.0 85.2 86.4 87.1 93.1 95.2 94.8
12 17 34 12S17E34D001MX Madera Irrigation District 225.0 83.9 88.9 92.4 92.5 89.5
12 17 35 12S17E35R001MX Madera Irrigation District 239.0 83.9 79.4 83.7 78.1
12 17 36 12S17E36K001MX Madera Irrigation District 243.0 81.0 71.2 76.5 78.3 80.4 78.9
12 18 13 12S18E13R001MX Madera Irrigation District 288.0 107.8 107.5 110.9 110.6 113.7 113.0
12 18 16 12S18E16A001MX Madera Irrigation District 268.0 108.7 106.0 110.6 114.7 108.9 110.8
12 18 17 12S18E17L001MX Madera Irrigation District 257.0 99.8 99.3 102.4
12 18 19 12S18E19H001MX Madera Irrigation District 251.0 97.5 96.9 91.6 96.1 98.7 98.9
12 18 21 12S18E21P001MX Madera Irrigation District 267.0 93.2 89.3 97.0 103.8 105.1 100.9
12 18 25 12S18E25B001MX Madera Irrigation District 284.0
12 18 26 12S18E26L001MX Madera Irrigation District 276.0 93.0 92.2 94.4 97.6 99.0 98.0
12 18 31 12S18E31J001MX Madera Irrigation District 254.0 92.3 88.4 87.2 83.8 85.4 84.3
12 18 32 12S18E32E001MX Madera Irrigation District 253.0
12 18 33 12S18E33D001MX Madera Irrigation District 261.0
12 18 34 12S18E34F001MX Madera Irrigation District 269.0 78.3 73.7 76.4 78.1 80.4
12 18 35 12S18E35G001MX Madera Irrigation District 278.0 76.8 84.0 88.3 86.5 89.5 88.7
12 18 36 12S18E36P001MX Madera Irrigation District 280.0
12 19 20 12S19E20D001MX Madera Irrigation District 293.0 112.9 120.3 127.3 113.1 118.0 131.5
12 19 21 12S19E21B001MX Madera Irrigation District 300.0 120.8 120.6 123.9 125.1 125.8
12 19 25 12S19E25E001MX Madera Irrigation District 251.0
12 19 28 12S19E28A001MX Madera Irrigation District 307.5 96.5 101.6 102.9 103.1 103.5
12 19 29 12S19E29A001MX Madera Irrigation District 301.0 99.9 115.4 114.8 116.9 131.1 133.0
12 19 33 12S19E33P001MX City of Fresno 300.9 90.7 91.7 94.4 94.6 95.4 95.7
12 19 34 12S19E34L001MX City of Fresno 315.4 105.9 106.6 109.1 111.0 111.4 110.0
12 19 34 12S19E34P001MX Fresno Irrigation District 317.8
12 19 35 12S19E35Q001MX City of Fresno 323.1 121.7 118.9 117.2 120.5 129.0 124.0
12 19 36 12S19E36J001MX City of Fresno 331.8 136.1 140.3 139.0 139.2 147.0 147.7
12 19 36 12S19E36Q001MX City of Fresno 332.1 136.2 140.1 140.1 146.9 141.0 141.7
12 20 13 12S20E13D001MX California Department of Water Resources 388.0
12 20 14 12S20E14H001MX California Department of Water Resources 372.0
12 20 15 12S20E15A001MX City of Fresno 361.3 132.0 141.6 195.9
12 20 23 12S20E23D001MX City of Fresno 364.4 146.7 144.7 147.4 148.8 148.2 150.3
12 20 23 12S20E23M001MX City of Fresno 354.2 136.6 127.9 140.3 142.2 145.0
12 20 25 12S20E25E001MX California Department of Water Resources 362.0
12 20 25 12S20E25J001MX California Department of Water Resources 366.0
12 20 26 12S20E26A001MX City of Fresno 373.0 166.0 166.4 169.5 169.4 173.0 173.2
12 20 26 12S20E26D001MX Fresno Irrigation District 370.7
12 20 26 12S20E26K001MX City of Fresno 360.2 158.8 152.0 159.3 160.0 164.1
12 20 26 12S20E26P001MX California Department of Water Resources 353.0
12 20 27 12S20E27H001MX City of Fresno 367.0 163.8 157.0 161.1 163.0 165.2 166.9
12 20 27 12S20E27L001MX City of Fresno 358.0 155.2 155.0 155.0 159.2 159.9
12 20 27 12S20E27N001MX City of Fresno 351.0 153.8 150.3 150.5 151.6 157.7 152.1
12 20 32 12S20E32A001MX City of Fresno 346.5 141.7 141.7 147.4 149.8 146.0 143.0
12 20 34 12S20E34K001MX City of Fresno 360.1 148.7 145.0 150.0 153.1 153.5 151.5
12 20 36 12S20E36M001MX City of Fresno 349.9 160.0 132.0 142.0 161.1 164.1 162.9
12 21 16 12S21E16B001MX California Department of Water Resources 400.0
12 21 17 12S21E17D001MX California Department of Water Resources 394.0 118.0
12 21 18 12S21E18J001MX California Department of Water Resources 390.0 128.0 128.0 128.0 128.0 128.1
12 21 19 12S21E19D001MX Fresno Irrigation District 380.0
12 21 19 12S21E19J001MX California Department of Water Resources 376.2 86.0 86.0 86.0 90.0 91.7
12 21 26 12S21E26M001MX California Department of Water Resources 403.0
12 21 27 12S21E27E001MX California Department of Water Resources 390.0
12 21 29 12S21E29K001MX California Department of Water Resources 379.0 76.6 76.8 76.3 83.0 85.1
12 21 30 12S21E30H001MX California Department of Water Resources 374.0
12 21 31 12S21E31B001MX Fresno Irrigation District 368.8
12 21 31 12S21E31M001MX City of Clovis 361.5 165.0 159.5 164.8 166.5 170.5 166.0
12 21 32 12S21E32K001MX City of Clovis 370.1 163.0 168.0 141.0 148.8 167.0
12 21 32 12S21E32Q001MX City of Clovis 370.5 130.0 138.5 150.5 135.0 144.0 152.3
12 21 33 12S21E33D001MX California Department of Water Resources 376.0 83.5
12 21 33 12S21E33P001MX Fresno Irrigation District 374.2
12 21 33 12S21E33P002MX City of Clovis 371.2 113.8 123.5 127.0 121.3 130.3 129.0
12 21 34 12S21E34D001MX Fresno Irrigation District 387.7
12 21 34 12S21E34H001MX California Department of Water Resources 390.0 58.1
12 21 35 12S21E35A001MX California Department of Water Resources 402.0
12 21 35 12S21E35Q001MX California Department of Water Resources 419.0
12 21 36 12S21E36J001MX California Department of Water Resources 419.0
12 22 19 12S22E19N001MX California Department of Water Resources 438.0 32.9
12 22 26 12S22E26L001MX California Department of Water Resources 485.0 20.1
12 22 32 12S22E32R001MX California Department of Water Resources 438.0 49.6
12 22 35 12S22E35N001MX California Department of Water Resources 445.0
G:\Clients\Fresno ID - 1038\10381002 - Fresno Regional 2010 GMP\_DOCUMENTS\Reports\Report Figures 2010\P&P_APPENDIX_A_part2.xlsx Page 1 of 12

APPENDIX A
Groundwater Level Data (Depth to Water Surface) - Wells Measured Annually (Datum NAVD 88)
Ground JAN JAN JAN JAN JAN JAN
Town. Ran. Sec. Well I.D. AGENCY Elev at Well 2006 2007 2008 2009 2010 2011
13 16 36 13S16E36R001MX Fresno Irrigation District 195.0
13 17 03 13S17E03J001MX Madera Irrigation District 232.0 72.8 66.0 68.0 75.8 76.0 71.1
13 17 04 13S17E04R001MX Madera Irrigation District 222.0 65.0 72.1 74.3 72.3 65.0 61.0
13 17 07 13S17E07J001MX Madera Irrigation District 206.0
13 17 09 13S17E09A001MX Madera Irrigation District 220.0 62.0 64.6 69.8 66.7 66.0
13 17 12 13S17E12J001MX Fresno Irrigation District 244.2 40.1 46.1 48.1 49.1 48.1 45.1
13 17 13 13S17E13H001MX Fresno Irrigation District 48.0 50.0 36.0
13 17 19 13S17E19H001MX Fresno Irrigation District 205.3 49.0 55.0
13 17 20 13S17E20A001MX Fresno Irrigation District 209.9 40.7 37.7 45.7 46.7 43.7
13 17 22 13S17E22B001MX Fresno Irrigation District 221.9 43.5 52.5 54.5 51.5
13 17 25 13S17E25C001MX Fresno Irrigation District 231.8 53.1 53.1 56.1 56.1 54.1 44.1
13 17 27 13S17E27L001MX Fresno Irrigation District 215.6 59.6 52.6 61.6 51.6 62.6 62.6
13 17 30 13S17E30J001MX Fresno Irrigation District 203.2 65.2 77.2 65.2 55.2 65.2 62.2
13 17 33 13S17E33M001MX Fresno Irrigation District 210.1 71.4 85.4 76.4 85.4 81.4 80.4
13 17 34 13S17E34L001MX Fresno Irrigation District 214.7 76.8 60.8 67.8 70.8 71.8 69.8
13 17 36 13S17E36N001MX Fresno Irrigation District 220.6
13 18 03 13S18E03F001MX Madera Irrigation District 265.0
13 18 04 13S18E04H001MX Madera Irrigation District 261.0 65.9 69.7 71.1 72.0 71.4
13 18 05 13S18E05J001MX Madera Irrigation District 259.0 68.0 80.1 79.8 79.1 79.7
13 18 06 13S18E06F001MX Madera Irrigation District 246.0 61.5 61.5 67.6 69.2 70.0 63.6
13 18 10 13S18E10L001MX Fresno Irrigation District 261.4 54.8 53.8 58.8 52.8 51.8 49.8
13 18 11 13S18E11J001MX Fresno Irrigation District 271.5
13 18 12 13S18E12P001MX Fresno Irrigation District 270.8 54.4 60.4 66.4 62.4 64.4 59.4
13 18 17 13S18E17A001MX Fresno Irrigation District 253.2 51.8 53.0 57.0 44.0 51.0 45.0
13 18 18 13S18E18A001MX Fresno Irrigation District 57.0 60.0 46.0
13 18 18 13S18E18M001MX Fresno Irrigation District 49.0 50.0 46.0
13 18 22 13S18E22P002MX Fresno Irrigation District 64.0 67.0 70.0
13 18 22 13S18E22R001MX Fresno Irrigation District 67.0 69.0 64.5
13 18 23 13S18E23N001MX Fresno Irrigation District 255.1 49.0 54.0 55.0 54.0 55.0 51.0
13 18 25 13S18E25B001MX Fresno Irrigation District 265.9
13 18 25 13S18E25K001MX Fresno Irrigation District 261.0 50.0 63.0 64.0 63.0 63.0 59.0
13 18 27 13S18E27B001MX Fresno Irrigation District 55.0 60.0 55.0
13 18 28 13S18E28F001MX Fresno Irrigation District 243.1 49.7 47.7 52.7 52.7 53.7 48.7
13 18 29 13S18E29C001MX Fresno Irrigation District 238.5 44.0 50.0 53.0 52.0 55.0 38.0
13 18 33 13S18E33M001MX Fresno Irrigation District 237.3 57.5 56.5 59.5 56.5 60.5 57.5
13 18 34 13S18E34K001MX Fresno Irrigation District 242.7 54.1 52.1 51.1 48.1 45.1 42.1
13 18 35 13S18E35G001MX Fresno Irrigation District 253.2 59.0 60.0 63.0 64.0 66.0 62.0
13 19 01 13S19E01C001MX City of Fresno 329.3 127.5 119.9 128.4 131.1 134.0 132.3
13 19 01 13S19E01L001MX City of Fresno 312.8 120.6 101.2 126.7 122.2 123.8 121.0
13 19 02 13S19E02M001MX City of Fresno 314.4 117.0 117.9 115.1 123.3 122.6
13 19 06 13S19E06A001MX Fresno Irrigation District 291.2 77.5 71.5 82.5 83.5 80.5 85.5
13 19 07 13S19E07R001MX Fresno Irrigation District 279.4 68.2 69.2 68.2 57.2 71.2 64.2
13 19 10 13S19E10F001MX City of Fresno 304.4 106.1 107.3 110.4 107.6 111.6 111.0
13 19 10 13S19E10Q001MX City of Fresno 298.0 99.9 97.3 103.5 102.0 102.0 104.0
13 19 11 13S19E11L001MX City of Fresno 304.7 112.5 107.7 115.0 115.7 118.0
13 19 12 13S19E12K001MX City of Fresno 307.9
13 19 14 13S19E14B001MX City of Fresno 300.5
13 19 18 13S19E18E001MX Fresno Irrigation District 273.4 67.1
13 19 18 13S19E18E002MX Fresno Irrigation District 274.2 66.4 70.4 72.4 72.4 70.4
13 19 21 13S19E21D001MX Fresno Irrigation District 282.9
13 19 23 13S19E23E001MX Fresno Irrigation District 284.6 85.0 88.0 86.0 90.0 85.0
13 19 26 13S19E26L001MX City of Fresno 279.3 84.2 82.6 87.7 86.1 90.0 87.0
13 19 27 13S19E27R001MX Fresno Irrigation District 390.0
13 19 29 13S19E29A001MX Fresno Irrigation District 266.9 61.7 76.7 68.7 71.7 72.7 73.7
13 19 29 13S19E29D001MX Fresno Irrigation District 268.2 66.3 69.3 69.3 72.3 73.3 72.3
13 19 29 13S19E29E001MX Fresno Irrigation District 268.0
13 20 01 13S20E01G001MX City of Fresno 348.4 163.4 161.2 163.0
13 20 02 13S20E02G001MX City of Fresno 345.2 104.2
13 20 03 13S20E03H001MX City of Fresno 333.4 139.0
13 20 05 13S20E05B001MX City of Fresno 338.7 143.2 142.8 146.2 145.2 148.3 145.0
13 20 06 13S20E06H001MX City of Fresno 329.3 141.8 142.5 147.6 148.3 148.0 148.0
13 20 06 13S20E06M001MX City of Fresno 326.5 131.3 171.4 137.4 137.9 138.3
13 20 09 13S20E09L001MX City of Fresno 321.6 136.8 135.7 139.8 136.1 139.0 138.2
13 20 10 13S20E10Q001MX City of Fresno 327.5 145.6 144.6 147.0 147.4 147.0 146.5
13 20 11 13S20E11L001MX City of Fresno 329.2 149.6 149.1 152.8 153.7 152.0 148.7
13 20 12 13S20E12H001MX Fresno Irrigation District 343.4
13 20 13 13S20E13C001MX City of Fresno 335.2 121.5 125.8 128.1 151.8 153.4 153.0
13 20 13 13S20E13H001MX City of Fresno 335.6 135.1 137.1 138.0 149.8 150.1 106.0
13 20 14 13S20E14L001MX City of Fresno 312.9 140.2 138.9 143.0 145.2 140.3 144.0
13 20 16 13S20E16Q001MX City of Fresno 312.4 130.5 138.9 139.6 139.7 135.0
13 20 17 13S20E17A001MX City of Fresno 319.9 135.7 142.5
13 20 17 13S20E17J001MX City of Fresno 317.0 131.5 132.0 136.1 136.6 136.0
13 20 17 13S20E17L001MX City of Fresno 319.0 130.1 134.9 136.1 135.4
13 20 18 13S20E18E001MX City of Fresno 304.0 117.2 116.0 116.8 118.0 118.1 119.5
13 20 19 13S20E19C001MX City of Fresno 307.6 138.9 117.0 118.5 121.2 124.0
13 20 20 13S20E20J001MX City of Fresno 304.4 126.2 137.0 128.0 128.5 126.0
13 20 20 13S20E20R001MX City of Fresno 300.2 122.0 115.5 121.0 122.4 119.0
13 20 22 13S20E22H001MX City of Fresno 320.6 141.3 143.1 143.8 146.1 141.5
13 20 23 13S20E23B001MX City of Fresno 324.7 145.2 143.3 141.0 151.1 144.8
13 20 23 13S20E23J001MX City of Fresno 322.2 130.5 133.2 133.3 142.5 143.0 133.0
G:\Clients\Fresno ID - 1038\10381002 - Fresno Regional 2010 GMP\_DOCUMENTS\Reports\Report Figures 2010\P&P_APPENDIX_A_part2.xlsx Page 2 of 12

APPENDIX A
Groundwater Level Data (Depth to Water Surface) - Wells Measured Annually (Datum NAVD 88)
Ground JAN JAN JAN JAN JAN JAN
Town. Ran. Sec. Well I.D. AGENCY Elev at Well 2006 2007 2008 2009 2010 2011
13 20 25 13S20E25G001MX City of Fresno 321.9 129.0 130.1 134.9 137.1 135.0 131.0
13 20 26 13S20E26P001MX City of Fresno 307.9 126.4 124.5 127.9 130.2 128.2
13 20 27 13S20E27C001MX City of Fresno 310.1 134.9 135.6 134.5 134.0 136.7 131.5
13 20 28 13S20E28C001MX City of Fresno 307.0 127.4 122.0 130.5 132.1 128.0
13 20 28 13S20E28N001MX City of Fresno 299.5 106.9 107.1 109.9 115.8 113.0
13 20 28 13S20E28R001MX City of Fresno 300.8
13 20 30 13S20E30B001MX City of Fresno 304.0 116.6 114.1 117.1 121.9 122.1 119.0
13 20 31 13S20E31D001MX City of Fresno 292.4 98.5 98.8 102.2 108.0 104.0
13 20 32 13S20E32D001MX City of Fresno 293.3 106.7 103.4 103.4 107.4 111.1 107.0
13 20 32 13S20E32K001MX City of Fresno 292.1 103.2 103.8 106.1 136.3 109.0
13 20 36 13S20E36P001MX City of Fresno 306.5 114.5 115.3 117.6 121.0 113.0
13 21 02 13S21E02E001MX California Department of Water Resources 382.0
13 21 05 13S21E05E001MX City of Clovis 364.6 160.5 165.5 164.0 159.0 167.0 166.5
13 21 05 13S21E05J001MX City of Clovis 361.3
13 21 06 13S21E06H001MX City of Clovis 358.0 155.8 165.0 164.0
13 21 06 13S21E06P001MX City of Clovis 354.8 146.5 148.0 155.0 155.8 159.0 154.0
13 21 07 13S21E07G001MX City of Clovis 345.8
13 21 07 13S21E07P001MX City of Clovis 345.0 136.5 140.0 144.0 148.5 150.3 148.0
13 21 08 13S21E08F001MX City of Clovis 349.0
13 21 08 13S21E08J001MX City of Clovis 355.0 129.0 128.3 142.0 149.0 140.0
13 21 09 13S21E09C001MX City of Clovis 360.7 123.0 123.8 133.8 130.0 139.0
13 21 09 13S21E09D001MX City of Clovis 359.9
13 21 09 13S21E09R001MX City of Clovis 365.0 131.3 133.0 140.3 152.5 143.8 130.3
13 21 10 13S21E10G001MX City of Clovis 373.1 98.5 100.0 105.3 103.5 107.0 105.8
13 21 11 13S21E11A001MX California Department of Water Resources 386.0 52.0 60.0 61.6
13 21 11 13S21E11D001MX Fresno Irrigation District 379.0
13 21 14 13S21E14D001MX Fresno Irrigation District 378.0
13 21 14 13S21E14R001MX California Department of Water Resources 370.0 40.2 45.3
13 21 15 13S21E15H001MX City of Clovis 377.4
13 21 15 13S21E15L001MX City of Clovis 357.0 128.8 131.5 134.3 154.0 158.5 129.8
13 21 16 13S21E16M001MX City of Clovis 354.8 141.3 140.0 148.0 143.0 157.8 146.3
13 21 16 13S21E16N001MX City of Clovis 347.6 112.5 117.5 124.0 123.8 128.0 127.0
13 21 16 13S21E16N002MX City of Clovis 347.0 113.5 119.0 123.3 125.5 131.0 128.0
13 21 16 13S21E16P001MX City of Clovis 354.7 117.5 119.5 122.5 130.5 133.3 127.0
13 21 17 13S21E17J001MX City of Clovis 355.0
13 21 17 13S21E17Q001MX City of Clovis 345.5 117.0 122.0 127.0 130.0 134.0 133.5
13 21 17 13S21E17Q002MX City of Clovis 349.4 120.5 125.5 130.5 133.5 138.0 137.3
13 21 18 13S21E18H001MX City of Clovis 343.0 125.5 129.5 134.0 139.0 141.8 141.0
13 21 19 13S21E19E001MX City of Fresno 334.8 131.7 130.2 133.0 139.0 139.9 137.0
13 21 20 13S21E20A001MX City of Clovis 347.0 115.3 121.5 126.3 126.3 131.5 130.0
13 21 20 13S21E20A002MX City of Clovis 347.0 116.0 123.0 128.3 128.0 134.0 133.3
13 21 20 13S21E20F001MX City of Clovis 338.0 124.5 128.0 133.5 136.5 145.5 140.5
13 21 21 13S21E21E001MX City of Clovis 347.0 112.8 117.8 121.5 124.8 131.0 127.8
13 21 21 13S21E21E002MX City of Clovis 347.0 114.5 118.5
13 21 21 13S21E21P001MX City of Fresno 340.0 102.1 100.9 102.3 101.9 102.5 108.1
13 21 22 13S21E22C001MX California Department of Water Resources 369.0
13 21 23 13S21E23D001MX Fresno Irrigation District 362.0
13 21 23 13S21E23R001MX California Department of Water Resources 357.0 40.6 38.6 44.7
13 21 24 13S21E24J001MX Fresno Irrigation District 370.8 36.6 33.6 41.6 42.6 44.6 41.6
13 21 25 13S21E25N001MX California Department of Water Resources 354.0 48.9 47.5 52.7 57.9
13 21 26 13S21E26M001MX Fresno Irrigation District 348.1 51.3 50.3 55.3 57.3 58.3 57.3
13 21 27 13S21E27N001MX California Department of Water Resources 339.0
13 21 28 13S21E28G001MX City of Fresno 338.7 112.8 114.2 113.0 115.2 124.3 142.2
13 21 29 13S21E29H001MX City of Fresno 335.3 108.4 120.3 127.3
13 21 30 13S21E30P001MX City of Fresno 318.9 116.9 117.0
13 21 30 13S21E30Q001MX City of Clovis 370.0 150.8 156.5 160.3 162.8
13 21 31 13S21E31E001MX City of Fresno 312.2 118.7 121.1 117.1 123.0 124.7 119.0
13 21 32 13S21E32G001MX City of Fresno 327.7 111.2 113.6 114.1 117.8 117.4 102.0
13 21 33 13S21E33N001MX California Department of Water Resources 328.0
13 21 34 13S21E34H001MX California Department of Water Resources 342.0
13 21 36 13S21E36H001MX California Department of Water Resources 351.0
13 22 02 13S22E02Q001MX California Department of Water Resources 444.9
13 22 03 13S22E03B001MX California Department of Water Resources 434.0 22.4
13 22 05 13S22E05A001MX California Department of Water Resources 420.0
13 22 06 13S22E06H001MX California Department of Water Resources 415.0 72.9
13 22 07 13S22E07R001MX Fresno Irrigation District 391.6 43.5 42.5 46.5 47.5 49.5 50.5
13 22 09 13S22E09N001MX California Department of Water Resources 403.0
13 22 13 13S22E13A001MX Fresno Irrigation District 436.6 8.3 9.3 10.3 11.3 16.3 5.3
13 22 14 13S22E14B001MX California Department of Water Resources 434.0 32.1 31.2 32.0
13 22 15 13S22E15R001MX California Department of Water Resources 414.0 39.7
13 22 20 13S22E20A001MX California Department of Water Resources 380.0 14.8 14.1 20.0 20.6 15.2
13 22 21 13S22E21D001MX Fresno Irrigation District 400.8
13 22 22 13S22E22R001MX California Department of Water Resources 393.0 26.8 24.1 30.2 33.7 34.1
13 22 23 13S22E23F001MX California Department of Water Resources 405.0 25.0
13 22 23 13S22E23R001MX California Department of Water Resources 405.0 16.2 16.0 23.4 23.7 12.1
13 22 27 13S22E27R001MX Fresno Irrigation District 390.0
13 22 28 13S22E28B001MX California Department of Water Resources 385.3
13 22 29 13S22E29M001MX California Department of Water Resources 374.0 35.0
13 22 31 13S22E31N001MX Fresno Irrigation District 356.5 41.5 43.5 51.5 48.5 52.5 47.5
13 22 32 13S22E32A001MX Fresno Irrigation District 370.8 30.7 29.7 40.7 40.7 43.7
G:\Clients\Fresno ID - 1038\10381002 - Fresno Regional 2010 GMP\_DOCUMENTS\Reports\Report Figures 2010\P&P_APPENDIX_A_part2.xlsx Page 3 of 12
APPENDIX A
Groundwater Level Data (Depth to Water Surface) - Wells Measured Annually (Datum NAVD 88)
Ground JAN JAN JAN JAN JAN JAN
Town. Ran. Sec. Well I.D. AGENCY Elev at Well 2006 2007 2008 2009 2010 2011
13 22 34 13S22E34R001MX California Department of Water Resources 384.0 34.4 31.7 35.3 45.4
13 23 19 13S23E19N001MX Fresno Irrigation District 410.3 9.0 10.0 18.0
13 23 30 13S23E30B001MX Fresno Irrigation District 410.8 4.2 5.2 8.2 9.2 8.2 3.2
13 23 33 13S23E33B001MX Fresno Irrigation District 431.8 9.9 13.9 16.9 15.9 24.9 8.0
14 16 12 14S16E12A001MX Fresno Irrigation District 188.4
14 17 04 14S17E04R001MX Fresno Irrigation District 205.2
14 17 05 14S17E05C001MX Fresno Irrigation District 202.9 89.0 88.0 89.0 65.0 84.0 90.0
14 17 06 14S17E06B001MX Fresno Irrigation District 196.5 89.0 83.0 85.0 87.0 88.0 89.0
14 17 11 14S17E11H001MX Fresno Irrigation District 214.4 86.3
14 17 28 14S17E28A001MX James Irrigation District 195.0
14 17 29 14S17E29E001MX James Irrigation District 185.0
14 17 31 14S17E31R001MX James Irrigation District 180.0
14 17 32 14S17E32R001MX James Irrigation District 184.5
14 17 33 14S17E33A001MX James Irrigation District 191.0
14 17 34 14S17E34A001MX James Irrigation District 197.0
14 17 35 14S17E35A001MX James Irrigation District 200.0
14 17 36 14S17E36A001MX James Irrigation District 207.0
14 18 02 14S18E02B001MX Fresno Irrigation District 249.7 56.1 59.1 62.1 61.1 63.1 53.1
14 18 03 14S18E03B001MX Fresno Irrigation District 245.6 55.1 56.1 58.1 60.1 59.1 58.1
14 18 03 14S18E03G001MX Fresno Irrigation District 68.0 53.0 37.0
14 18 03 14S18E03K001MX Fresno Irrigation District 77.0 74.0 71.0
14 18 03 14S18E03L001MX Fresno Irrigation District 239.1 58.0 60.0 61.0 63.0 65.0 46.0
14 18 04 14S18E04B001MX Fresno Irrigation District 239.3 54.7
14 18 04 14S18E04G001MX Fresno Irrigation District 238.4 75.3 59.3 60.3 57.3 62.3 54.3
14 18 04 14S18E04J001MX Fresno Irrigation District 237.9 60.0 62.0 63.0 67.0 54.0 55.0
14 18 05 14S18E05D001MX Fresno Irrigation District 230.5 56.2 59.2 61.2 64.2 67.2 65.2
14 18 06 14S18E06P001MX Fresno Irrigation District 224.2 63.3 60.3 70.3 71.3 75.3 75.3
14 18 09 14S18E09H001MX Fresno Irrigation District 236.3 63.2 61.2 67.2 66.2 70.2 68.2
14 18 09 14S18E09L001MX Fresno Irrigation District 229.2 66.2 67.2 67.2 67.2 72.2 70.2
14 18 09 14S18E09M001MX Fresno Irrigation District 226.3 67.2 87.2 69.2 67.2 75.2 73.2
14 18 10 14S18E10A001MX Fresno Irrigation District 243.6 62.0 71.0 66.0 66.0 69.0 69.0
14 18 10 14S18E10C001MX Fresno Irrigation District 240.3 63.0 62.0 64.0 64.0 63.0 58.0
14 18 10 14S18E10D001MX Fresno Irrigation District 234.7 61.3 61.3 66.3 62.3 67.3 60.3
14 18 10 14S18E10K001MX Fresno Irrigation District 240.8 64.5 57.5 67.5 67.5 71.5 69.5
14 18 15 14S18E15M001MX Fresno Irrigation District 230.9 68.0 66.0 73.0 75.0 80.0 77.0
14 18 18 14S18E18E001MX James Irrigation District 214.0
14 18 19 14S18E19A001MX Fresno Irrigation District 215.9 82.7 74.7 85.7 80.7 87.7 88.7
14 18 21 14S18E21L001MX Fresno Irrigation District 223.4
14 18 26 14S18E26C001MX Fresno Irrigation District 228.4 74.0 71.0 74.0 77.0 80.0 75.0
14 18 28 14S18E28Q001MX Fresno Irrigation District 226.3 101.1 105.1 109.1 111.1 112.1
14 18 29 14S18E29A001MX James Irrigation District 220.5
14 18 32 14S18E32D001MX Fresno Irrigation District 212.3 107.7 106.7 112.7 116.7 122.7
14 18 33 14S18E33C001MX Fresno Irrigation District 220.1
14 19 03 14S19E03Q001MX Fresno Irrigation District 264.7 70.8 70.8 64.8 59.8 66.8 72.8
14 19 04 14S19E04R001MX Fresno Irrigation District 262.4
14 19 06 14S19E06A001MX Fresno Irrigation District 254.8 59.2 59.2 54.2 60.2 63.2 57.2
14 19 07 14S19E07D001MX Fresno Irrigation District 248.3
14 19 11 14S19E11L001MX Fresno Irrigation District 272.7 73.8 74.8 71.8 81.8 78.8 78.8
14 19 15 14S19E15G001MX Fresno Irrigation District 252.6
14 19 17 14S19E17C001MX Fresno Irrigation District 249.9 57.9 52.9 57.9 62.9 59.9 63.9
14 19 18 14S19E18G001MX Fresno Irrigation District 243.6 61.0 59.0 62.0 66.0 68.0 65.0
14 19 18 14S19E18N001MX Fresno Irrigation District 238.8 60.2 62.2 63.2 66.2 66.2
14 19 20 14S19E20D001MX Fresno Clovis Waste Water Sewage Treatment 244.1 59.0 51.6 59.4 63.2 64.9 61.6
14 19 20 14S19E20N001MX Fresno Clovis Waste Water Sewage Treatment 238.7 53.0 43.0 51.9 56.0 63.5 52.9
14 19 21 14S19E21M001MX Fresno Clovis Waste Water Sewage Treatment 249.9 41.1 28.4 45.4 36.1 43.9 35.8
14 19 21 14S19E21P001MX Fresno Clovis Waste Water Sewage Treatment 243.7 29.0 24.7 32.8 32.4 39.1 34.2
14 19 22 14S19E22G001MX Fresno Clovis Waste Water Sewage Treatment 251.5 51.6 50.4 57.5 55.6 61.3 56.5
14 19 23 14S19E23B001MX Fresno Clovis Waste Water Sewage Treatment 258.2 58.9 56.4 64.5 66.1 68.2 66.4
14 19 23 14S19E23Q001MX Fresno Clovis Waste Water Sewage Treatment 254.4 58.8 57.4 63.7 66.2 69.2 66.6
14 19 26 14S19E26D001MX Fresno Irrigation District 251.5 51.0 50.0 54.0 58.0 59.0 57.0
14 19 26 14S19E26Q001MX Fresno Clovis Waste Water Sewage Treatment 250.1 65.5 62.0 68.3 72.2 74.9 72.0
14 19 27 14S19E27K001MX Fresno Clovis Waste Water Sewage Treatment 250.9 43.2 32.9 44.1 42.5 50.8 45.9
14 19 28 14S19E28M001MX Fresno Clovis Waste Water Sewage Treatment 248.9 41.0 39.9 41.6 52.3 50.8 51.4
14 19 32 14S19E32D001MX Fresno Irrigation District 234.4 64.2 58.2 69.2
14 19 33 14S19E33D001MX Fresno Irrigation District 239.5 46.0 43.0 46.0 51.0 46.0 53.0
14 20 01 14S20E01J001MX City of Fresno 312.6 113.0 113.1 115.7 119.1 114.0
14 20 02 14S20E02J001MX City of Fresno 302.4 115.0 113.4 114.9 117.0 111.9
14 20 03 14S20E03C001MX City of Fresno 296.5 112.3 114.6 116.6 108.8 109.3 120.5
14 20 03 14S20E03J001MX City of Fresno 295.2
14 20 03 14S20E03M001MX City of Fresno 293.8 108.1 112.2 111.3 114.0
14 20 04 14S20E04E001MX City of Fresno 287.0 122.2 119.2 122.4 126.2 123.0
14 20 04 14S20E04F001MX City of Fresno 288.0 103.1 105.9 148.8 114.0
14 20 08 14S20E08H001MX City of Fresno 279.1 85.3 90.1 101.1 96.9 93.0
14 20 08 14S20E08R001MX City of Fresno 279.9 86.1 92.8 100.1 95.3 81.0
14 20 10 14S20E10M001MX City of Fresno 291.4 100.8 103.1 102.0 97.0
14 20 11 14S20E11F001MX City of Fresno 295.4 101.3 103.3 104.6 106.5 113.8
14 20 13 14S20E13F001MX City of Fresno 291.8 79.0 81.2 86.5 93.0 74.0
14 20 14 14S20E14L001MX City of Fresno 288.1 84.5 84.6 88.0 88.0 85.0
14 20 16 14S20E16A001MX City of Fresno 283.4 89.2 95.2 100.1 96.6 93.0
14 20 19 14S20E19A001MX Fresno Irrigation District 267.4 64.0 65.0 73.0 75.0 76.0 73.0
G:\Clients\Fresno ID - 1038\10381002 - Fresno Regional 2010 GMP\_DOCUMENTS\Reports\Report Figures 2010\P&P_APPENDIX_A_part2.xlsx Page 4 of 12
APPENDIX A
Groundwater Level Data (Depth to Water Surface) - Wells Measured Annually (Datum NAVD 88)
Ground JAN JAN JAN JAN JAN JAN
Town. Ran. Sec. Well I.D. AGENCY Elev at Well 2006 2007 2008 2009 2010 2011
14 20 22 14S20E22J001MX City of Fresno 282.5 67.7 70.3 75.4 74.0
14 20 24 14S20E24K001MX City of Fresno 294.7 69.1 70.3 70.0 73.5 74.0 74.0
14 20 31 14S20E31D001MX Fresno Irrigation District 258.1 61.2 56.2 66.2 75.2 70.2 71.2
14 20 33 14S20E33F001MX Fresno Irrigation District 271.1 57.7 57.7 61.7
14 20 36 14S20E36A001MX Malaga Water District 289.7
14 21 03 14S21E03D001MX Fresno Irrigation District 333.0
14 21 04 14S21E04D001MX City of Fresno 324.4 119.6 120.6 118.0
14 21 06 14S21E06E001MX City of Fresno 310.1 112.4 111.1 112.7 117.1 110.8
14 21 06 14S21E06Q001MX City of Fresno 309.6 104.1 107.6 110.9 111.3 108.0
14 21 07 14S21E07M001MX City of Fresno 302.8 95.0
14 21 08 14S21E08A001MX City of Fresno 320.5 98.9 96.8 99.8 100.6 103.1 100.0
14 21 08 14S21E08J001MX City of Fresno 317.1 92.7 141.1 95.0
14 21 09 14S21E09C001MX City of Fresno 320.1 87.0 150.0
14 21 09 14S21E09R001MX City of Fresno 316.9 67.4 68.3 70.3 67.7 70.0
14 21 11 14S21E11L001MX Fresno Irrigation District 334.2 59.4 51.4 60.4 60.4 61.4 62.4
14 21 17 14S21E17E001MX City of Fresno 307.5 93.6 91.4 95.6 97.0
14 21 17 14S21E17N001MX City of Fresno 314.5
14 21 22 14S21E22D001MX Fresno Irrigation District 317.8 57.2 56.2 58.2 59.2 59.7 61.2
14 21 26 14S21E26A001MX Consolidated Irrigation District 329.9 48.7 52.3 54.9 57.2
14 21 27 14S21E27A001MX Consolidated Irrigation District 321.2 51.5 55.3 57.7 57.8
14 21 29 14S21E29D001MX Fresno Irrigation District 302.0 33.0 33.0 34.0 49.0
14 21 30 14S21E30E001MX Malaga Water District 285.2
14 21 30 14S21E30L001MX Malaga Water District 290.7
14 21 30 14S21E30P001MX Malaga Water District 290.1
14 21 32 14S21E32H001MX Fresno Irrigation District 306.7
14 21 35 14S21E35J001MX Consolidated Irrigation District 324.6 43.5 44.8 47.5 51.0
14 22 03 14S22E03C001MX Fresno Irrigation District 379.7 30.9 28.9 35.9
14 22 06 14S22E06A001MX Fresno Irrigation District 362.2 40.9 40.9 48.9 49.9 54.9 53.9
14 22 08 14S22E08N001MX Fresno Irrigation District 349.7 41.0 42.0 48.0 48.0 47.0 46.0
14 22 09 14S22E09G001MX Consolidated Irrigation District 365.2
14 22 14 14S22E14B001MX Consolidated Irrigation District 374.4 24.1 35.6 37.1 29.2
14 22 18 14S22E18A001MX Consolidated Irrigation District 348.8 42.1 45.9 49.8
14 22 22 14S22E22N001MX Consolidated Irrigation District 354.6 33.2 34.6 38.2 34.8
14 22 23 14S22E23R001MX Consolidated Irrigation District 366.2 31.9 38.8 40.2 34.9
14 22 29 14S22E29D001MX Consolidated Irrigation District 341.9 30.8 41.8 46.2 39.0
14 22 34 14S22E34J001MX Consolidated Irrigation District 339.0 30.9 35.2 43.0 39.0
14 23 04 14S23E04M001MX Fresno Irrigation District 396.0
14 23 06 14S23E06C001MX Fresno Irrigation District 409.4 29.6 29.6 32.6 33.6 32.6
15 17 02 15S17E02B001MX James Irrigation District 198.0 145.7 155.6 157.5
15 17 05 15S17E05C001MX James Irrigation District 181.0
15 17 07 15S17E07J001MX James Irrigation District 175.0
15 17 11 15S17E11A001MX James Irrigation District 195.0
15 17 12 15S17E12A001MX James Irrigation District 198.0
15 17 13 15S17E13R001MX James Irrigation District 193.0 184.5 177.7 182.6 186.9 198.1
15 17 15 15S17E15J001MX James Irrigation District 187.0 158.0 175.2 161.4 169.1 164.8
15 17 18 15S17E18B001MX James Irrigation District 173.0 104.2 109.0
15 17 20 15S17E20C001MX James Irrigation District 176.0 120.1 123.7
15 17 21 15S17E21R001MX James Irrigation District 180.0 159.1 160.1 168.4
15 17 22 15S17E22J001MX James Irrigation District 186.0 174.5 170.5 173.1 185.4 177.1
15 18 02 15S18E02A001MX Fresno Irrigation District 222.7 112.8 108.8 115.8 118.8 120.8 123.8
15 18 03 15S18E03R001MX James Irrigation District 217.0 134.1 138.8 152.2 150.1 147.9
15 18 04 15S18E04A001MX James Irrigation District 216.0
15 18 06 15S18E06A001MX James Irrigation District 207.0
15 18 07 15S18E07A001MX James Irrigation District 204.0
15 18 10 15S18E10N001MX James Irrigation District 209.0
15 18 17 15S18E17C001MX James Irrigation District 203.0
15 18 17 15S18E17R001MX James Irrigation District 200.6
15 18 19 15S18E19R001MX James Irrigation District 195.5 201.7 206.8 204.7
15 19 02 15S19E02M001MX Fresno Irrigation District 242.9 77.3 73.3 75.3 80.3 81.3
15 19 08 15S19E08A001MX Fresno Irrigation District 234.0
15 19 12 15S19E12C001MX Fresno Irrigation District 249.5
15 19 13 15S19E13D001MX Consolidated Irrigation District 249.6 86.4 88.0 89.6 99.2 95.0
15 19 14 15S19E14M001MX Fresno Irrigation District 241.3 104.5 100.5 104.5 109.5 113.5 103.5
15 19 24 15S19E24M001MX Fresno Irrigation District 246.6
15 19 25 15S19E25C001MX Consolidated Irrigation District 246.1 110.0 112.1 114.1 120.6 120.8
15 20 01 15S20E01J001MX Fresno Irrigation District 292.7 49.8 49.8 52.8 61.8 59.8
15 20 01 15S20E01R001MX Fresno Irrigation District 290.1 49.0 46.0 54.0 58.0 61.0 59.0
15 20 02 15S20E02N001MX Fresno Irrigation District 279.6 55.2 57.2 60.2 65.2 72.2 66.2
15 20 03 15S20E03A001MX Fresno Irrigation District 279.6 56.0 55.0 59.0 62.0 59.0
15 20 05 15S20E05E001MX Fresno Irrigation District 260.8 62.4 62.4 62.4 71.4 75.4 68.4
15 20 07 15S20E07Q001MX Fresno Irrigation District 252.2 71.3 71.3 73.3 80.3 84.3 80.3
15 20 09 15S20E09K001MX Fresno Irrigation District 270.9 66.1 60.1 70.1 73.1
15 20 12 15S20E12F001MX Fresno Irrigation District 288.9 51.5 51.5 60.5 67.5 62.5
15 20 13 15S20E13D001MX Consolidated Irrigation District 283.4
15 20 13 15S20E13E001MX Fresno Irrigation District 282.1 56.0 51.0 58.0 63.0 67.0 66.0
15 20 15 15S20E15D001MX Consolidated Irrigation District 272.8 65.6 70.6 69.7 75.7 76.0
15 20 17 15S20E17D001MX Consolidated Irrigation District 261.5 78.0
15 20 19 15S20E19R001MX Consolidated Irrigation District 255.3 95.0 93.6 98.0 102.9 106.5
15 20 25 15S20E25D001MX Consolidated Irrigation District 275.2 67.4 68.7 70.2 76.6 78.9
15 20 28 15S20E28A001MX Consolidated Irrigation District 265.0 86.4 81.3 83.9 89.8 78.8
G:\Clients\Fresno ID - 1038\10381002 - Fresno Regional 2010 GMP\_DOCUMENTS\Reports\Report Figures 2010\P&P_APPENDIX_A_part2.xlsx Page 5 of 12

APPENDIX A
Groundwater Level Data (Depth to Water Surface) - Wells Measured Annually (Datum NAVD 88)
Ground JAN JAN JAN JAN JAN JAN
Town. Ran. Sec. Well I.D. AGENCY Elev at Well 2006 2007 2008 2009 2010 2011
15 21 03 15S21E03D001MX Consolidated Irrigation District 313.4 43.8
15 21 06 15S21E06B001MX Fresno Irrigation District 297.1 49.0 48.0 77.0 77.0 76.0
15 21 10 15S21E10M001MX Fresno Irrigation District 305.7 44.0 42.0 47.0 51.0 55.5 50.0
15 21 14 15S21E14A001MX Consolidated Irrigation District 318.8 45.8 47.2 49.4 51.1
15 21 15 15S21E15D001MX Consolidated Irrigation District 300.5 44.4 46.4 48.4 54.7 53.7
15 21 17 15S21E17D001MX Consolidated Irrigation District 292.2 45.2 46.5 47.9 49.8
15 21 22 15S21E22E001MX Consolidated Irrigation District 302.8 51.0 52.1 53.2 58.8 61.6
15 21 28 15S21E28A001MX Consolidated Irrigation District 304.5 34.5 35.0 35.7 41.8 41.6
15 21 30 15S21E30A001MX Consolidated Irrigation District 286.4 54.8 57.0 59.0 63.8 65.0
15 22 01 15S22E01A001MX Consolidated Irrigation District 352.4 27.0 35.3 37.5
15 22 06 15S22E06A001MX Consolidated Irrigation District 334.0 35.2 39.2 46.4 44.0
15 22 11 15S22E11R001MX Consolidated Irrigation District 347.3 32.8 31.1 30.9 28.6
15 22 15 15S22E15D001MX Consolidated Irrigation District 338.3 36.2 40.1 46.3 42.6
15 22 17 15S22E17D001MX Consolidated Irrigation District 325.1 37.8 38.9 41.4 45.2
15 22 26 15S22E26A001MX Consolidated Irrigation District 338.7
15 22 27 15S22E27D001MX Consolidated Irrigation District 327.8 44.5 50.3 47.2
15 22 29 15S22E29D001MX Consolidated Irrigation District 326.8 35.9 36.5 38.9 43.0
G:\Clients\Fresno ID - 1038\10381002 - Fresno Regional 2010 GMP\_DOCUMENTS\Reports\Report Figures 2010\P&P_APPENDIX_A_part2.xlsx Page 6 of 12

FRESNO AREA REGIONAL GROUNDWATER MANAGEMENT GROUP
2010 ANNUAL REPORT
APPENDIX B – SELECTED WELL HYDROGRAPHS

San Joaquin Valley (Kings Basin), Source: CA DWR Groundwater Level Data
NOTE: red circles denote questionable measurements.
San Joaquin Valley (Kings Basin), Source: CA DWR Groundwater Level Data
Groundwater Levels in Well 13S17E22B001MGroundwater Levels in Well 13S17E22B001M

San Joaquin Valley (Kings Basin), Source: CA DWR Groundwater Level Data
NOTE: red circles denote questionable measurements.
San Joaquin Valley (Kings Basin), Source: CA DWR Groundwater Level Data
Groundwater Levels in Well 13S20E20H001MGroundwater Levels in Well 13S20E20H001M

San Joaquin Valley (Kings Basin), Source: CA DWR Groundwater Level Data
NOTE: red circles denote questionable measurements.
San Joaquin Valley (Kings Basin), Source: CA DWR Groundwater Level Data
Groundwater Levels in Well 13S21E02M001MGroundwater Levels in Well 13S21E02M001M
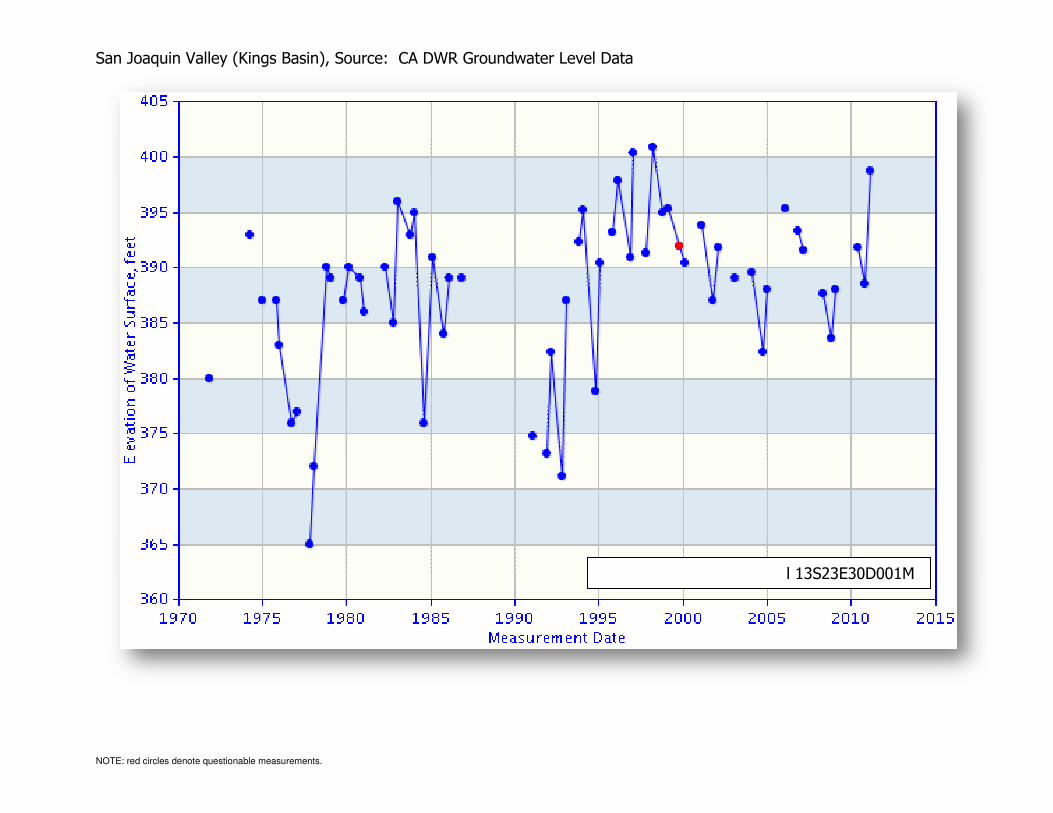
San Joaquin Valley (Kings Basin), Source: CA DWR Groundwater Level Data
NOTE: red circles denote questionable measurements.
San Joaquin Valley (Kings Basin), Source: CA DWR Groundwater Level Data
Groundwater Levels in Well 13S23E30Groundwater Levels in Well 13S23E30D001M
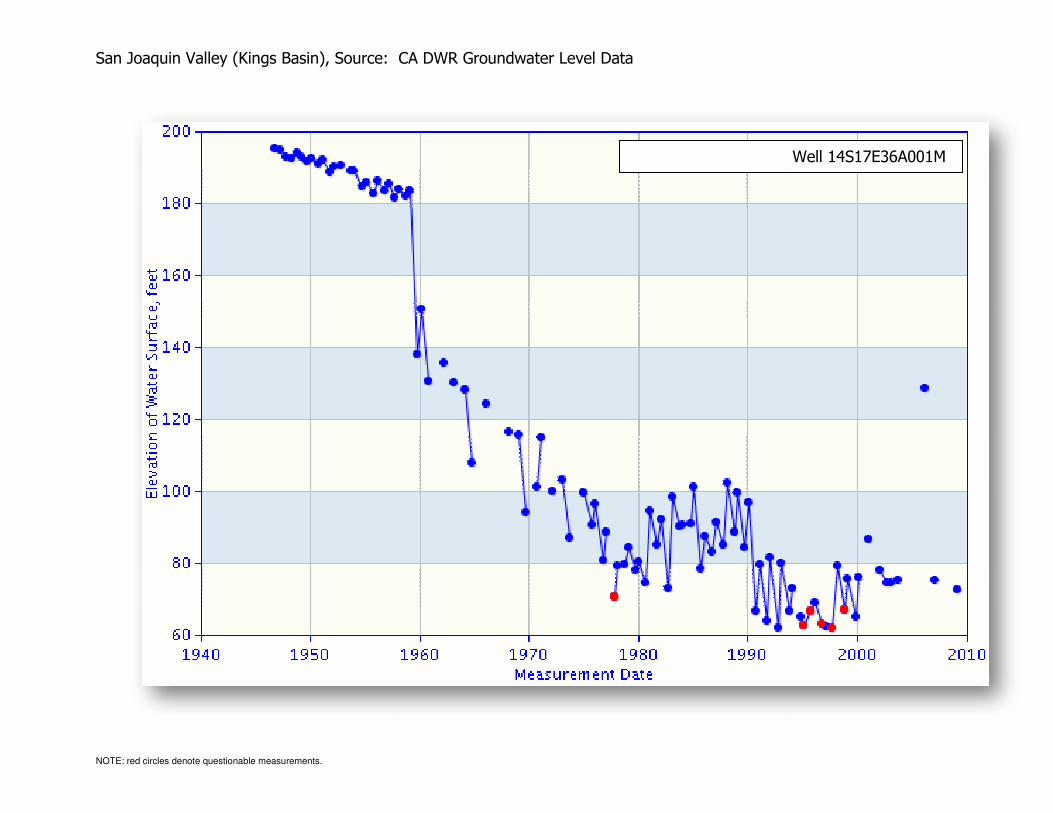
San Joaquin Valley (Kings Basin), Source: CA DWR Groundwater Level Data
NOTE: red circles denote questionable measurements.
San Joaquin Valley (Kings Basin), Source: CA DWR Groundwater Level Data
Groundwater Levels in Well 1Groundwater Levels in Well 14S17E36A001M

San Joaquin Valley (Kings Basin), Source: CA DWR Groundwater Level Data
NOTE: red circles denote questionable measurements.
San Joaquin Valley (Kings Basin), Source: CA DWR Groundwater Level Data
Groundwater Levels in Well 14S18E0Groundwater Levels in Well 14S18E02B001M

San Joaquin Valley (Kings Basin), Source: CA DWR Groundwater Level Data
NOTE: red circles denote questionable measurements.
San Joaquin Valley (Kings Basin), Source: CA DWR Groundwater Level Data
Groundwater Levels in Well 14S19E36A001MGroundwater Levels in Well 14S19E36A001M
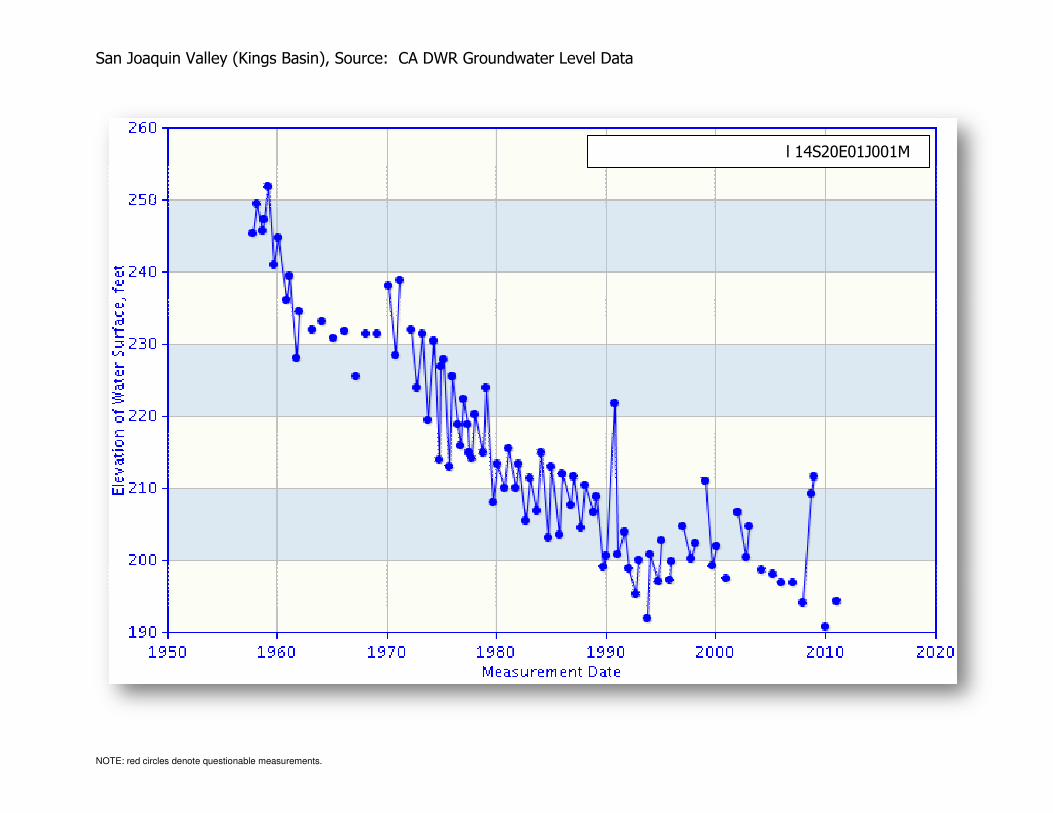
San Joaquin Valley (Kings Basin), Source: CA DWR Groundwater Level Data
NOTE: red circles denote questionable measurements.
San Joaquin Valley (Kings Basin), Source: CA DWR Groundwater Level Data
Groundwater Levels in Well 14S20E01J001MGroundwater Levels in Well 14S20E01J001M

San Joaquin Valley (Kings Basin), Source: CA DWR Groundwater Level Data
NOTE: red circles denote questionable measurements.
San Joaquin Valley (Kings Basin), Source: CA DWR Groundwater Level Data
Groundwater Levels in Well 15S20E12F001MGroundwater Levels in Well 15S20E12F001M