fresno county congestion management process update · fresno county congestion management process...
TRANSCRIPT

Fresno County
Congestion Management Process
Update
Council of Fresno County Governments
September 2017
This report was funded in part through grant[s] from the Federal
Highway Administration [and Federal Transit Administration], U.S.
Department of Transportation. The views and opinions of the authors
[or agency] expressed herein do not necessarily state or reflect those
of the U. S. Department of Transportation.

Council of Fresno County Governments
Policy Board
CLOVIS May Pro Tem Bob Whalen
COALINGA Mayor Nathan Vonsburg
FIREBAUGH Mayor Brady Jenkins
FOWLER Mayor David Cardenas
FRESNO Mayor Lee Brand
HURON Mayor Rey Leon
KERMAN Mayor Rhonda Armstrong
KINGSBURG Mayor Michelle Roman
MENDOTA Mayor Rolando Castro
ORANGE COVE Mayor Victor Lopez
PARLIER Mayor Alma Beltran
REEDLEY Mayor Anita Betancourt
SANGER Mayor Frank Gonzalez
SAN JOAQUIN Mayor Pro Tem Amarpreet Dhaliwal, Chair
SELMA Mayor Michael Derr
County OF FRESNO Supervisor Sal Quintero

Table of Content
Chapter 1 Introduction ……………………………………………………..... 1
Chapter 2 CMP Steering Committee………………………………………… 5
Chapter 3 CMP Objectives………………………………………………....... 7
Chapter 4 CMP Application Area and CMP Network ……………………… 8
Chapter 5 Performance Measures………………………………………….... 11
Chapter 6 Transportation System Monitoring Programs……………………… 15
Chapter 7 CMP Strategies…………………………………………………… 20
Chapter 8 SOV Projects Analysis……………………………………………. 37
Appendix I Final Technical Report: Congestion Monitoring Tool for Fresno COG
Appendix II Fresno COG Bicycle and Pedestrian Count Technology Deployment
Pilot Project Final Report

1
Chapter 1 Introduction
In June 1990, California voters approved legislation that required Congestion
Management Plans (CA CMP) be developed in urbanized counties to address congestion
on California’s highways and roads. At the federal level, Congestion Management
System (CMS) was first introduced in the Intermodal Surface Transportation Efficiency
Act (ISTEA) in 1991. In 1996, CMS became the Congestion Management Process
(CMP) with the Safe, Accountable, Flexible, Efficient Transportation Equity Act – A
Legacy for Users (SAFETEA-LU). Fresno COG developed its first Congestion
Management Program in November 1991, and it has been updated based on legislative
requirements. Assembly Bill 2419 (Bowler) in 1996 allowed counties to “opt out” of the
California Congestion Management Program if a majority of local governments elected
to exempt themselves from the California CMP. The Fresno COG Policy Board
rescinded the Congestion Management Program on September 25, 1997 at the request of
the local member agencies. The 2009 Fresno County Congestion Management Process
(CMP) was designed to meet the federal requirement under 23 CFR 500.109 and
450.320. The 2017 CMP is an update to the 2009 CMP based on emerging transportation
planning practices such as the transportation performance measurement required under
the Moving Ahead for Progress in the 21st Century Act (MAP-21) and the Fixing
America’s Surface Transportation Act (FAST ACT)
SAFETEA-LU, and the subsequent MAP-21 and FAST Act require that Transportation
Management Areas (TMAs) – urban areas with population over 200,000 – “shall address
congestion management through a process that provides for safe and effective
management and operation, based on a cooperatively developed and implemented
metropolitan wide strategy, of new and existing transportation facilities … through the
use of travel demand reduction and operation management strategies.” It further states
that federal funds cannot be programmed in a carbon monoxide and/or ozone non-
attainment TMA for any highway project that will result in a significant increase in single
occupant vehicle (SOV) capacity, unless the project is vetted through an approved CMP.

2
Fresno County is designated as a non-attainment TMA for ozone, and was so designated
for carbon monoxide, but the Fresno Urbanized Area was reclassified as attainment for
carbon monoxide effective on June 1, 1998. However, because of the ozone non-
attainment status, Fresno COG is required to comply with such requirements.
The language in 23 CFR 450.320 and 500.109 defines an effective CMP as a systematic
and regionally accepted approach for managing congestion. It provides information on
transportation system performance and assesses alternative strategies for alleviating
congestion and improving mobility for people and goods to levels that meet State and
local needs. The congestion management process should include the six elements as
specified in 450.320:
methods to monitor and evaluate the performance of the multimodal transportation
system, identify the causes of congestion, identify and evaluate alternative actions,
provide information supporting the implementation of actions, and evaluate the
efficiency and effectiveness of implemented actions;
a definition of parameters for measuring the extent of congestion and for supporting
the evaluation of the effectiveness of congestion reduction and mobility enhancement
strategies;
the establishment of a program for data collection and system performance
monitoring to define the extent and duration of congestion, to help determine the
causes of congestion, and to evaluate the efficiency and effectiveness of implemented
actions;
identification and evaluation of the anticipated performance and expected benefits of
appropriate congestion management strategies, such as: transportation demand
management (TDM) measures, traffic operational improvements, public
transportation improvements, Intelligent Transportation Systems (ITS) technologies,
and additional system capacity;

3
identification of an implementation schedule, implementation responsibilities, and
possible funding sources for each strategy proposed for implementation; and,
implementation of a process for periodic assessment of the efficiency and
effectiveness of implemented strategies, in terms of the area’s established
performance measures.
The Fresno County Congestion Management Process should be an integrated part of a
Metropolitan Planning Organization (MPO)’s planning process. Based on the guidebook
titled “The Congestion Management Process, A Guidebook”, which was issued by the
Federal Highway Administration (FHWA) and the Federal Transit Administration (FTA),
the Fresno County CMP is a systematic process developed with regional approaches,
with strategies reflected in and throughout the Regional Transportation Plan (RTP) and
the Transportation Improvement Program (TIP) process. The following diagram
summarizes the major components of the Fresno County CMP and illustrates how the
CMP is integrated in Fresno COG’s planning process:

4

5
Chapter 2 CMP Steering Committee
The Fresno County CMP Steering Committee was formed in January 2009 and was
reconvened in March 2015 for the current update. The CMP Steering Committee
provided guidance for the development of the congestion management process and
served as a technical advisory body for the process. The Committee comprised a broad
membership that included engineers and planners from the local governments,
representatives from the transit operators, State DOT, bike/pedestrian advocates and other
stakeholders. Detailed CMP Steering Committee membership is as follows:
County of Fresno
City of Fresno
City of Clovis
Caltrans District 6 representatives
Fresno Cycling Club
City of Selma
Fresno County Rural Transit Agency
Fresno Area Express
Clovis Transit
City of Reedley
City of Coalinga
California State University, Fresno
COG’s programming staff has been involved throughout the entire CMP process to
ensure successful integration into the TIP/RTP process.
The CMP Steering Committee is instrumental in establishing CMP objectives and
performance measures, selecting alternative strategies, single-occupant vehicle (SOV)
alternative analysis and other CMP tasks. In addition, the Congestion Management
Process also provided a forum for the members to discuss regional issues, such as

6
sustainable development, congestion, transportation and land use planning integration,
urban sprawl, active transportation, etc.

7
Chapter 3 CMP Objectives
The CMP Steering Committee reviewed the 2009 CMP goals and incorporated safety and
other emerging technology elements in the update. Economic recovery from the Great
Recession in the late 2000s has brought more jobs to the Fresno region, and the region is
starting to experience some moderate delays on the urban freeways during peak hours. If
not sustainably managed, the congestion would be more widespread, with greater delays
expected. The updated objectives focus on operational improvements and management
of the transportation facilities, emphasize sustainable land use development role in
congestion management and promote the development of an integrated multi-modal
transportation system. Four general objectives were established by the CMP Steering
Committee:
1. Optimize the transportation facilities through efficient system management
2. Invest in strategies that reduce travel demand, improve system performance,
increase safety, and provide effective incident management
3. Reduce vehicle miles traveled (VMT) by encouraging alternative modes of
transportation and promotion of sustainable land use development
4. Improve public transit, expand bicycle and pedestrian system, and promote car
sharing and bike sharing programs to facilitate the development of an integrated
multi-modal transportation system in the Fresno region

8
Chapter 4 CMP Application Area and CMP Network
Fresno is the most populous county in the San Joaquin Valley, with 979,915 residents as
of July 2016. The City of Fresno is the fifth largest city in California with over half a
million population. There are over 600,000 people living in the Fresno-Clovis
Metropolitan Area. Fresno County is also the second largest county in the San Joaquin
Valley, encompassing approximately 6,000 square miles. It is home to 1.88 million acres
of the world’s most productive farmland, with agricultural operations covering half of the
County. Agricultural commodities in Fresno were valued at $7.03 billion in 2014 and the
top 10 crops were: almonds, grapes, poultry, milk, cattle & calves, tomatoes, pistachios,
garlic, peaches and cotton. Fresno County is a rural county with a large metropolitan
urban center. More than 60% of the population lives in the Fresno-Clovis Metropolitan
areas, with about 17% in the rural unincorporated areas and the rest residing in the 13
small incorporated cities.
Congestion and its causes are of different magnitudes in the metropolitan areas relative to
the rest of the more rural county. The transportation system in the urban area is designed
to take people to destinations such as jobs, schools, shopping, doctors’ appointments, etc.
The rural roads mainly serve to transport agricultural goods. The urban areas experience
more recurring congestion during the commute hours on the commute corridors, whereas
in the rural areas, non-recurring congestion could take place due to foggy weather, truck
traffic or other isolated accidents. The CMP Steering Committee agreed that the
congestion management process should be applied countywide and selected different
CMP strategies will be implemented where appropriate.
Due to the limitation of resources, the CMP Steering Committee identified and approved
a refined CMP network, for which a more focused evaluation is conducted in the current
update. Because of the recurring nature of the congestion on the urban freeways during
the peak commute hours, the Committee decided that the urban freeways in the Fresno-
Clovis Metropolitan Area will be the CMP network where the resources are directed.
9
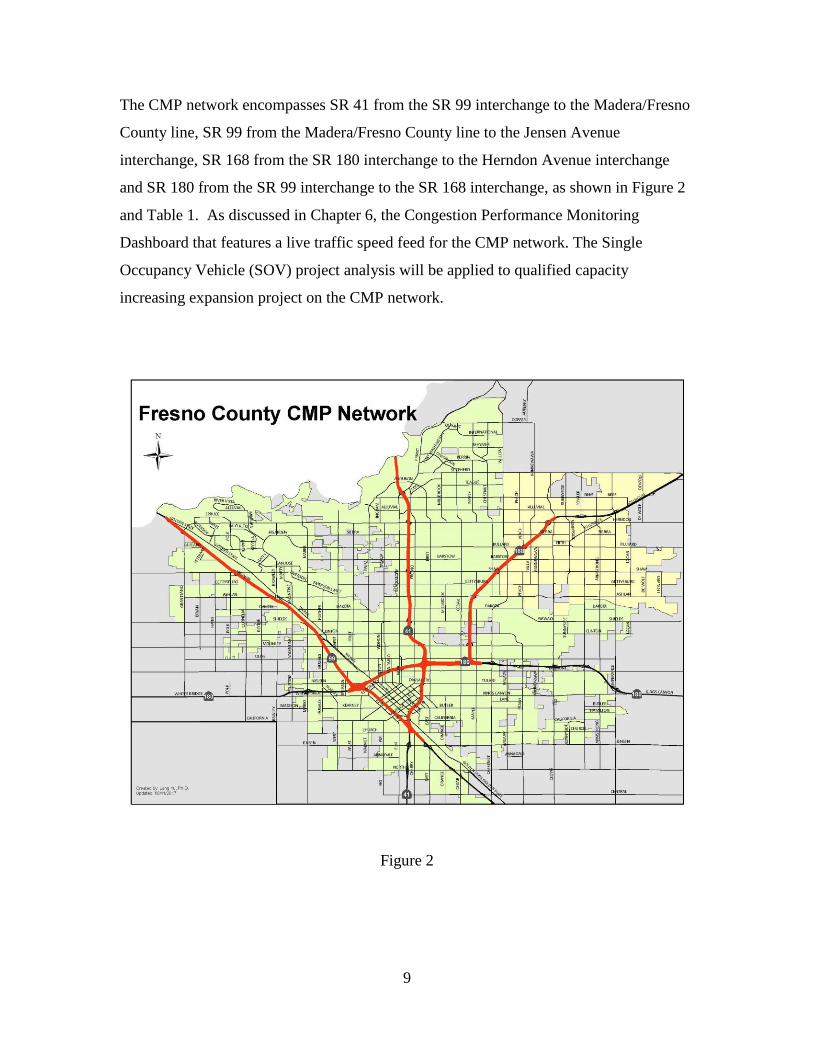
The CMP network encompasses SR 41 from the SR 99 interchange to the Madera/Fresno
County line, SR 99 from the Madera/Fresno County line to the Jensen Avenue
interchange, SR 168 from the SR 180 interchange to the Herndon Avenue interchange
and SR 180 from the SR 99 interchange to the SR 168 interchange, as shown in Figure 2
and Table 1. As discussed in Chapter 6, the Congestion Performance Monitoring
Dashboard that features a live traffic speed feed for the CMP network. The Single
Occupancy Vehicle (SOV) project analysis will be applied to qualified capacity
increasing expansion project on the CMP network.
Figure 2

10
Route From To Length
SR 99 Madera/Fresno County Line Jensen Avenue Interchange 13 miles
SR 41 SR 99 Interchange Madera/Fresno County Line 11 miles
SR 168 SR 168/SR 180 Interchange Herndon Avenue Interchange 7 miles
SR 180 SR 99/SR 180 Interchange SR 168/SR 180 Interchange 4 miles
Total 35 miles
Table 1

11
Chapter 5 Performance Measures
Performance measures are used to evaluate and communicate about the system
performance issues. The most commonly used measures are speed, travel time, Level of
Service (LOS), volume-to-capacity ratio (V/C ratio) and travel delay. Proxies such as
LOS and V/C were applied in Fresno COG’s 2009 CMP because data for more direct
measures such as travel time and speed were not available. Since then, advances in probe
data and system detection technologies have significantly reduced data collection costs.
The Federal Highway Administration (FHWA) has contracted with HERE North
America/Inrix and acquired national travel time dataset for use in the analysis of system
performance. The probe data acquired by the FHWA, the National Performance Research
Data Set (NPMRDS), has been made available to state Department of Transportations
(DOTs) and Metropolitan Planning Organizations (MPOs). The NPMRDS provides a
consistent historical profile on the performance of the National Highway System (NHS)
for both passenger cars and truck traffic. In addition, cost for the probe data has become
much less prohibitive and real-time speed and travel time data are more realistic for
purchase for priority corridors.
Furthermore, MAP 21 and the subsequent FAST Act set goals to transition transportation
planning into performance and outcome-based programs. One of the goals for the federal
aid program is system reliability, that is, to improve the efficiency of the surface
transportation system. Transportation Management Areas (TMAs) are encouraged to
incorporate reliability measures into the CMP process because travel-time reliability
considers both recurring and non-recurring events on delay over time. Traditionally,
congestion has been referred to as recurring delays at the commute hours when too many
people are trying to get through certain corridors. Non-recurring congestion was typically
left out of the analysis.

12
Given the reduced probe data costs, and the federal system reliability goal, Fresno COG
decided to move into travel time-based performance measurement that includes:
Travel Time (min): Travel time to traverse a defined road segment
Average Speed (mph): The length of a segment divided by travel time
Travel Time Index (TTI): Ratio of average speed to the travel time at the
reference speed
Planning Time Index (PTI): Ratio of 95th
percentile of the travel time to the
reference travel time
Delay (Total Hours): Delay experienced by all vehicles (measured in hours)
measured relative to a nominated reference speed
The CMP Steering Committee approved travel time index and planning time index as the
reliability measures in September 2015. The FHWA finalized the system performance
measures in January 2017, and here are the final FHWA measures (Freight and
Congestion Mitigation Air Quality not included):
Interstate Travel Time Reliability Measure: Percent of person-miles traveled on
the interstate that are reliable, measured by Level of Travel Time Reliability
(LOTTR): 80th
/50th
percentile of all vehicle travel times
Non-Interstate Travel Time Reliability Measure: Percent of the person-miles
traveled on the non-interstate NHS that are reliable
Peak Hour Excessive Delay (PHED) Measure: Annual Hours of Peak Hour
Excessive Delay per capita
In defining performance measures, the Committee also endorsed congestion thresholds in
the traffic congestion measures. A travel time segment is considered to have excessive
delay if the travel speed is equal to or slower than:
35 miles per hour for interstates, freeways, or expressways

13
15 miles per hour for principal arterials and all other NHS roads
Due to the timing of the publishing of the federal system performance measures and the
approval of the performance measures by the CMP Steering Committee, both sets of the
performance measures are applied in the analysis of system conditions within the
Congestion Monitoring Dashboard, which is documented in Appendix A and in Chapter
6.
Figure 3 & 4 shows the segments in Fresno County that have excessive delays.
Figure 3

14
Figure 4

15
Chapter 6 Transportation System Monitoring Programs
I. Traffic Monitoring Program
Fresno COG has operated a Regional Traffic Monitoring Program since 1981. Through
this program, the City of Fresno, City of Clovis and County of Fresno receive annual
funding from Fresno COG to take traffic counts at COG designated count locations.
Hourly counts for 24 hours are taken during typical work days from Tuesday through
Thursday. Truck counts are also taken by the Fresno County on county roads. The traffic
count data collected through the Monitoring Program is used by private developers,
government agencies, and other entities that need traffic counts for different traffic
studies. As part of the CMP update, the traffic counts are also being used to calculate
total hours of delays. As an input to COG’s traffic model, the traffic data is also used to
interpret the region’s current mobility conditions and to forecast future infrastructure
needs. The Fresno COG Regional Traffic Monitoring Program provides a traffic count
database that serves COG’s traffic model validation and calibration needs.
As part of the current CMP update, Fresno COG underwent a review process for the
count location system. The count system was originally developed in the 1980s, and the
Fresno region has since grown significantly. More count locations were added in new
growth areas and in the small cities. Traffic is counted at 750 locations biannually under
the Fresno COG Traffic Monitoring Program. Figure 5 and 6 shows the coverage of the
count locations in the region.

16
Figure 5

17
Figure 6

18
As discussed in Chapter 5, Fresno COG is moving into travel-time and reliability based
performance measures for system congestion monitoring. A congestion monitoring
dashboard has been developed to monitor the system performance. Probe data from
HERE North America has been purchased to provide real time traffic performance
information for the identified CMP network. The NPMRDS is used to perform historical
system-wide analysis for the NHS network using performance measures developed by the
CMP Steering Committee. A third application is being developed on the Dashboard to
report the system-wide performance based on the final system performance measures
established by the FHWA. Appendix A provides detailed information on the background,
dataset, performance measures, methodology and functionality of the congestion
monitoring dashboard. The dashboard can be found at: fresnocog.iteris-pems.com. Usage
of the dashboard needs to be pre-authorized by Fresno COG.
II. Bike/Pedestrian Count Monitoring
Active transportation projects provide air quality and health benefits and have had an
increasing role in providing transportation options for the general public, in addition to
being used for recreational purposes. Assembly Bill 1358 requires cities and counties to
include complete streets policies as part of their general plans so that roadways are
designed to safely accommodate all users. The Active Transportation Program (ATP)
provides exclusive funding sources for active transportation projects and requires
before/after bike/pedestrian counts to support funding applications. In 2015, Fresno
COG was selected as one of the 10 MPOs nation-wide to participate in the FHWA
Bicycle & Pedestrian Count Technology Pilot Program. Fresno COG received a grant
from the Pilot Program to purchase bike and pedestrian counters. Bike and pedestrian
counts were taken on trails, bike lanes, sidewalk and pedestrian malls for project funding
applications, usage monitoring or bike/pedestrian facility planning. Appendix B is a
detailed report on the results of the Bike/Pedestrian Count Technology Pilot Program in
the Fresno region.
19
Although the Pilot Program was completed in 2016, Fresno COG retains the
bike/pedestrian counters which are loaned to the local governments and other entities on
an as-needed basis. In 2017, additional bike/pedestrian counts were taken at 40 locations
close to downtown Fresno, selected high schools and colleges. The bike/pedestrian counts
taken in 2016/17 are used in the development of the first bike/pedestrian forecasting
system in Fresno COG’s Activity-Based Model (ABM). Fresno COG is evaluating a
potential regional count system to monitor bike and pedestrian activities and having such
counts taken regularly.

20
Chapter 7 CMP Strategies
SAFETEA-LU and the subsequent MAP 21 & FAST Act mandate that a CMP should
identify alternative strategies such as travel demand management (TDM), traffic
operational improvements, public transit, Intelligent Transportation System (ITS), and
land use strategies, etc. as congestion management strategies. Although such programs
have long been in place in Fresno County, the CMP process evaluated and selected
alternative strategies considered appropriate and feasible for the Fresno region. This
chapter provides an overview of existing CMP programs in Fresno County and
summarizes the CMP strategies identified and adopted by the CMP Steering Committee
for implementation.
I. Overview of Existing CMP Related Programs
Travel Demand Management
Travel demand management (TDM) programs are designed to reduce automobile usage
by changing traveler behavior and encouraging alternative transportation modes besides
single occupant vehicle trips. TDMs reduce demand on the system and postpone the
need for capacity improvement.
Fresno COG’s TDM has been predominately focused on ridesharing. TDM program
staff has maintained the Valleyrides Program, which provides ride matching service
within Fresno, Kings, Madera and Tulare Counties. In the last 11 years, program staff
has worked with more than 1,200 worksites, and provided service/information in the
four regions. Valleyrides partnered with California State University Fresno’s Parking &
Transportation Department and developed an online ride-matching database which has
been in operation since 2003.
21
In 2006, Fresno County voters passed the Measure “C” Extension, a half-cent sales tax
measure that programs 0.6% of its revenues to fund carpool and vanpool subsidy
programs originating within Fresno County. Launched in 2009, today there are 38
regular vans and 99 farmworker vans sponsored by Measure “C”. Annually through
2027, $2 million will be available from Measure “C” to expand farm labor and commuter
vanpools
CalVans provides vanpool services to farmworkers and commuters in rural counties,
including: Fresno, Kern, Kings, Madera, Merced, Monterey, San Benito, Santa Barbara,
Santa Cruz, Tulare, Imperial and Ventura. In 2014/15, vans out of Fresno County
traveled 29 million passenger miles; in 2015/16, vans (out of Fresno County) traveled 2.6
million miles with 528,510 passengers and passenger miles reached 28.8 million, which
is equivalent to 13,459 metric tons of greenhouse gas emission reduction. Nearly 500
commuter and farm labor vehicles are in service.
Public Transit
Fresno Area Express (FAX) is the transit service provider in the City of Fresno. FAX
provides two types of public transportation service: the fixed-route service for the general
public and Handy Ride, a demand-responsive service for those who are unable to use the
regular fixed-route service because of physical or mental disabilities. With an annual
operating budget of $37 million, FAX operates 17 fixed routes in the City of Fresno. The
annual boarding was 17.6 million in 2016.
The City of Clovis also operates two types of public transportation service in the FCMA
area: Stageline, a general public fixed-route service, and Round-up, a demand-responsive
paratransit service for senior and disabled residents. Clovis Transit ridership in 2016 was
154,451 with an annual operating cost at $1.95 million.

22
Rural Fresno County is served by a combination of public transit providers: common
carrier, general public and social service agencies. The Fresno County Rural Transit
Agency (FCRTA) and the Fresno County Economic Opportunities Commission
(FCEOC) are designated as the Rural Consolidated Transportation Service Agency
(CTSA).
About 24% of the Measure “C” extension money, estimated to be about $412 million
over 20 years, will be spent on public transit, of which 19.66% ($337 million) will be
spent on expanding public transit programs, improving transit service and consolidating
services among different transit providers. The remaining 4.34% ($75 million) is
intended to enhance alternative transportation services through programs such as the
Public Transportation Infrastructure Study (PTIS), carpool/vanpool, and farm worker
vanpool programs.
Operational Improvements & ITS
Operational improvements are an effective strategy to reduce traffic delays. Such
improvement projects are less costly and can be implemented in a relatively short
timeframe. Projects such as signal synchronization significantly reduce wait time at
intersections, which also decreases vehicle idling time, bringing considerable air quality
benefits to the region. Caltrans and the cities of Fresno and Clovis have been deploying
enhanced signal and traffic management strategies to manage congestion. The Fresno
County Intelligent Transportation System (ITS) Strategic Deployment Plan has identified
traffic operational/management projects as one of its priority strategies to address the
transportation problems in the Fresno area. Some of the identified projects are as
follows:
ITS Freeway Crossings
Traffic Signal Synchronization of Arterials and Freeway Crossings

23
ITS Signal Coordination and Improvements/Upgrades
Installation of ITS equipment (communications, upgraded controllers; cameras,
detection, poles, cabinets, and vaults) and signal synchronization
Ramp metering & communication gap closure
Deploy additional ramp-metering capabilities along the freeway system within the
Fresno County Region to improve freeway throughput and efficiency
The City of Fresno and Caltrans District 6 reached a mutually beneficial shared fiber
network agreement to provide fiber connectivity to the SR 41 ramps through the
Blackstone corridor segment of the fiber network. Meanwhile, the cities of Fresno and
Clovis have been working together on the Fresno/Clovis Metropolitan Area Signal
Coordination and Fresno/Clovis Regional ATMS Completion Project. Such ITS projects
have been mapped in the cities’ plans, with funding aggressively pursued at the federal,
state and local levels.
Land use/Growth Management
Segregated land uses and low-density suburban development have contributed to
automobile dependency among American families. Both land use planners and
transportation planners have realized that congestion needs to be addressed where travel
is generated. Mixed-use, compact and transit-oriented development are the neo-
traditional land use patterns that encourage transit use, walking and biking. These
alternative transportation modes reduce driving, helping relieve congestion. Such land
use/growth management strategies have been enacted in the Fresno area as part of
ongoing efforts to build sustainable communities.
Fresno COG was a key partner in the San Joaquin Valley Blueprint planning efforts. The
Fresno COG Policy Board adopted a preferred scenario with features such as transit

24
oriented development, urban centers, high intensity transit corridors, mixed uses, etc.
Fresno’s preferred scenario had a density of eight housing units per acre compared to the
existing 3.8 units per acre. The Valley wide preferred scenario, which was stitched
together among the eight Valley counties’ locally selected scenarios, had an average
density of 6.8 units/acre. Under California’s SB 375, the Blueprint preferred scenario
served as a starting point for developing the 2014 RTP’s Sustainable Communities
Strategy (SCS).
As mandated by Senate Bill 375, Fresno COG developed its first SCS in the 2014 RTP
aimed at reducing greenhouse gas emissions through integrated transportation and land
use planning. The SCS contained land use strategies such as higher density, mixed use
development, infill, and allocation of growth along transportation corridors. Such land
use strategies reduce the growth footprint and encourage alternative modes such as
transit, biking and walking. Several cities adopted new general plans with more compact
land use and other sustainable transportation strategies. Here are a few examples of the
growth management efforts in the new general plans:
The 2014 Fresno General Plan was adopted in adopted in December 2014. It
envisions a balanced city with an appropriate proportion of growth and
reinvestment focused in the central core, downtown, established neighborhoods
and along BRT corridors. The City set a goal of directing approximately 50% of
new growth towards infill areas within existing city limits, and the other half
within the existing sphere of influence area by 2035. Around 20% of entire
region’s housing growth and 36% of new employment by 2035 is planned to take
place within ½ mile of BRT corridors inside the City of Fresno. In December
2015, the City of Fresno approved a new Development code/Zoning Ordinance,
which is an essential tool to implement the 2014 General Plan.

25
The City of Clovis also adopted a new general plan in 2014 right after the
adoption of the first SCS. Clovis’ new general plan also set “goals and policies to
seek to foster more compact development patterns that can reduce the number,
length, and duration of auto trips.” The Clovis General Plan introduced the
concept of urban centers that require higher density and more mixed use around
the community centers. Such density requirements gradually decrease further
away from the center. The master-planned urban centers are also required to
provide bike/trail connections within the communities.
The Fresno County Public Transportation Infrastructure Study (PTIS) took an integrated
approach in long-range transit planning. The PTIS study identified potential high
capacity transit corridors for Bus Rapid Transit (BRT) with the assumption that the land
use in those corridors would be intensified. The Study identified transit-supportive land
use typology along the BRT corridors and recommended land use strategies and policies
for implementation. Such land use recommendations have been incorporated into the
City of Fresno’s 2035 General Plan; the BRT is under construction at the recommended
corridors and will be operating by spring 2018.
26
II. Adopted CMP Alternative Strategies
Based on the adopted CMP objectives, the Steering Committee endorsed a list of
alternative strategies that the jurisdictions in Fresno County are encouraged to implement
before roadways are widened. Those strategies are categorized as follows:
Transportation System Management Strategies
Travel Demand Management Strategies
ITS Strategies
Land Use Strategies
Public Transit Strategies
Bicycle and Pedestrian Strategies
A Toolbox for Alleviating Traffic Congestion published by the Institute of Transportation
Engineers was referenced in developing the list. The ITS strategies were incorporated
from the Fresno County Intelligent Transportation System Strategic Deployment Plan.

27
Table 5. Fresno County CMP Strategies-Transportation System Management
Strategies
Intersection Operational
Improvement
Existing Traffic Signals
Equipment update & maintenance
Timing Plan Improvement
Interconnected & synchronized
signals
Transit Signal Priority
Other Traffic Control Roundabouts
Traffic Signal Removal
Geometric changes and
bottleneck alleviation
Restriping
Installation of turning lanes
Adding lanes (bottleneck
removal only)
Realignment of
intersecting streets
Arterial Access
management
Left turn restrictions; curb
cut and driveway
restrictions
Reduce conflict points
Eliminate parking
Consolidate access points

28
Table 6. Intelligent Transportation System Strategies
Traffic/Freeway Management
Systems
Ramp metering and communication Gap
Closure
Multi-jurisdictional interconnects
Integrated Smart Corridors (SR41/168/180)
Railroad/highway interface technology for
railroad crossing
Communications interties
Integrated Surveillance stations/callbox
deployment
Regional Intersection Safety and enhancement
program
Incident Management/Emergency
Services
Weather Sensing/ATMS integration
Variable speed system/smart or intelligent
roadway studs
Remote surveillance and incident scene
management
Computer Aided Dispatch Integration
Integration of Communications channels
Incident Management/Response Coordination
Task force
Transit System
Form a Regional Transit District
Transit Operations/Dispatch centers integration
Transit Information System
Transit Management System
Completion/Expansion
Implement Regional Farebox System

29
Table 6. Intelligent Transportation System Strategies –continued
Transportation User Information
Systems
Regional transportation user information
system
Regional transit user information system
Coordination with Valleywide/statewide
information system
Regional ITS Configuration
Management /Coordination/Planning
Valleywide/statewide communications
linkages
Regional Configuration Management
Common/Standard regional/county map
Table 7. Public Transit Strategies
Modify bus routes & service
modification
Add new routes
Extend bus and feeder bus routes
Increase bus frequency
Limit stop or express bus routes
Provide exclusive bus lanes
Construct bus shelters & improve
passenger amenities
Improve bicycle routes to transit
facilities
Park & Ride lots for transit & rideshare
Provide information service for all
transits
Build information center for all buses

30
Table 8. Travel Demand Management Strategies
Ridesharing
Carpool
Vanpool
Telecommuting
Alternative Work Hours
Car sharing
Table 9. Bicycle & Pedestrian Strategies
Provide walking infrastructure
Improve bicycle facilities at transit stations and other trip destinations
Improve safety of existing bicycle and pedestrian facilities
Provide biking infrastructure to eliminate existing gaps and expand and enhance
the existing bicycle network
Link bicycle and pedestrian improvements to schools and retail developments
Road diet program
Bike share programs
31
Land Use Strategies
The following strategies, individually or in combination, reflect emerging and
contemporary planning practices. These practices support sustainable developments that
are appropriately-scaled for their environs and can provide transit-compatible densities or
mixed land uses. These developments can lower traditional per capita energy demand
and reduce distances traveled to work, goods and services and reduce the necessity and
attractiveness of private automobile use. Further, when implemented by multiple
agencies, these strategies can foster cooperative and sustainable regional policies.
The following strategies are independent of each other. A project that meets all the
criteria of a strategy shall be considered supportive of the objectives of the Congestion
Management Process.
1. Mixed-Use Development
- Projects that provide a mix of land uses -- defined as the practice of allowing
more than one type of use in a building or set of buildings -- or that complement
existing land uses, and with residential uses within ¼ mile of other land uses.
- Projects that provide pedestrian linkage among different land uses in the mixed
use development.
- Projects that provide a range of housing choices, 70% and above of which are
planned for attached residential units.
Mixed-use development in this case does not include detached single-family development
with stand-alone shopping centers, stand-alone hotels with residential space or stand-
alone
parking structures with ground floor retail.

32
2. Infill and Redevelopment
- Projects that are located in an existing urban area, defined here as served by urban
services and within an existing incorporated boundary.
- Projects that are located on abandoned, passed-over or underutilized land within
an existing urban area as defined above.
- Projects adjacent to and between currently developed areas.
3. Transit-Oriented Development
- Projects within a half mile of a transit stop or other COG-defined transit corridors.
- Projects that contain a mix of uses such as housing, jobs, shops, restaurants and
entertainment.
- Projects that provide a range of housing choices.
- Projects that provide a strong sense of community and of place.
- Projects that increase “location efficiency” so people can walk, bike and take
transit.
- Projects that encourage transit use and minimize traffic impacts.

33
III. Strategy Implementation
As shown in the Fresno County CMP components flowchart in Figure 1, adopted CMP
strategies will be integrated and implemented through the Transportation Improvement
Program (TIP) process.
In order to encourage jurisdictions to employ alternative strategies for managing
congestion/mobility issues, a point system has been established in the competitive
funding program in the TIP process to incentivize CMP projects that will address
congestion issues. CMP projects are eligible for up to five points in the TIP scoring
system. The point system takes into consideration reoccurring and non-reoccurring delays
throughout the region. Recurring delays were analyzed on the National Highway System
(NHS) using 2015 NPMRDS data provided by the FHWA. For roadways segments with
excessive delays --which are defined as having average travel speed at the peak hour of
less than 35 miles per hour (mph) on freeways or less than 15 (mph) on arterials -- the
CMP projects will be awarded two points; for segments with moderate delays, -- defined
as having average travel speed at peak hour at 35-50 mph on freeways or 15-25 mph on
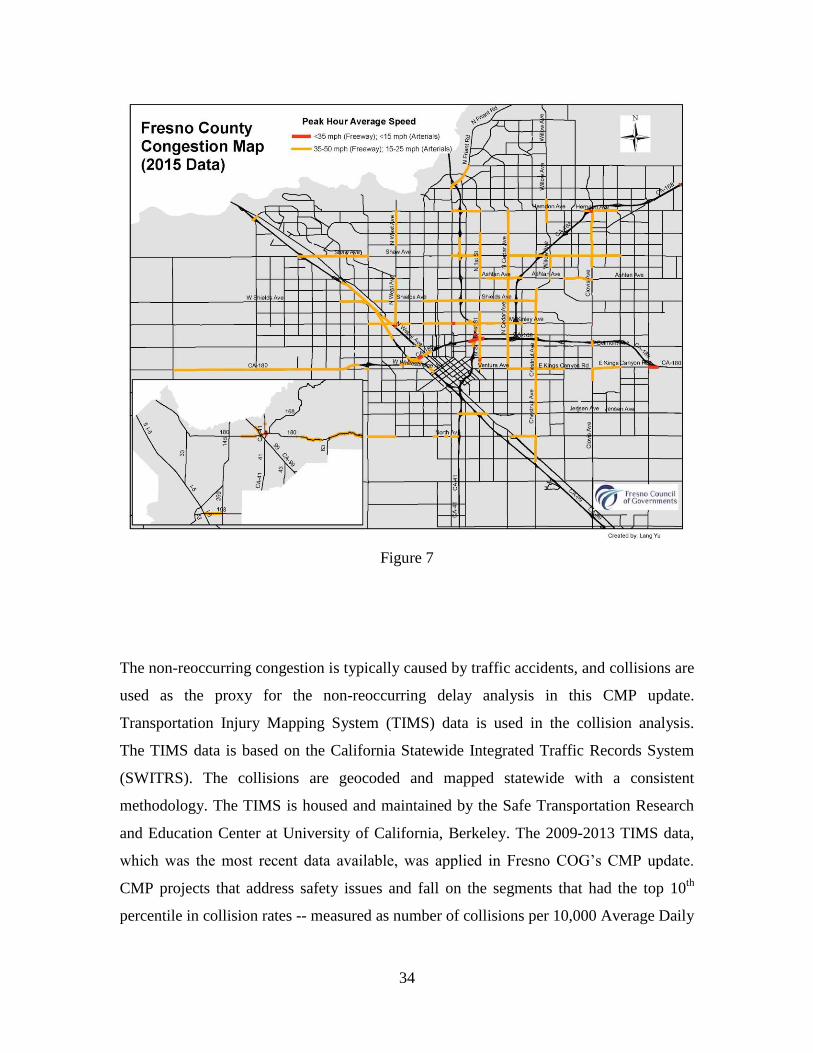
arterials -- the CMP projects will receive one point. Figure 7 shows roadways with
excessive and moderate delays.
34
Figure 7
The non-reoccurring congestion is typically caused by traffic accidents, and collisions are
used as the proxy for the non-reoccurring delay analysis in this CMP update.
Transportation Injury Mapping System (TIMS) data is used in the collision analysis.
The TIMS data is based on the California Statewide Integrated Traffic Records System
(SWITRS). The collisions are geocoded and mapped statewide with a consistent
methodology. The TIMS is housed and maintained by the Safe Transportation Research
and Education Center at University of California, Berkeley. The 2009-2013 TIMS data,
which was the most recent data available, was applied in Fresno COG’s CMP update.
CMP projects that address safety issues and fall on the segments that had the top 10th
percentile in collision rates -- measured as number of collisions per 10,000 Average Daily

35
Traffic (ADT) -- will be awarded two points; CMP projects with safety components on
locations that ranked among the top 25th
percentile in total number of collisions over the
analysis timeframe will receive one point. Projects that meet both of the criteria will
receive the maximum two points. Figure 8 illustrates the distribution of locations that will
receive safety-based points.
Figure 8
The delay/collision data and mapping analysis will be updated every other year so that
the most up-to-date data will be provided to the project scoring process when a TIP call
for projects is issued every other year. To encourage submittal of CMP project, the

36
Steering Committee also decided to grant one point to any CMP project regardless of the
location.
CMP strategy implementation system details are documented with the TIP scoring
process.
IV. Strategy Assessment
SAFETEA-LU and the subsequent MAP-21 and FAST Act require strategies to be
periodically assessed to ensure their effectiveness, efficiency and consistency with the
adopted performance measures. FHWA is expected to continue providing the historical
NPMRDS data to the MPOs and it will be updated on the Congestion Monitoring
Dashboard when it is available. Year-over-year comparisons of system performance can
be analyzed on the Dashboard, which provides instant analysis results based on the
performance measures.
An application will be developed in the Dashboard to analyze system performance using
the final national performance measures. As discussed in the previous session, TIMS data
will be updated every other year so that the most up-to-date information can be provided
to the TIP process. In the meantime, collision data will be analyzed annually as part of
the safety target update process. In addition, as required by the Transportation
Performance Management process, system performance will be reported every four years
by MPOs in the RTP updates for all the transportation performance measures, including
system performance and congestion measures. Furthermore, the effectiveness of the
CMP project funding mechanism can be evaluated by the number of CMP projects
submitted and funded through the FTIP process. The continuous and consistent nature of
this program has provided the region with a great tool to monitor changes of traffic
conditions and system performance over time.

37
Chapter 8 Single Occupancy Vehicle (SOV) Projects Analysis
I. Legislative Requirements
SAFETEA-LU and its subsequent legislation, MAP-21 and the FAST Act, require that
“in a TMA designated as a non-attainment area for ozone or carbon monoxide, federal
funds may not be programmed for any project that will result in a significant increase in
the carrying capacity for single occupancy vehicles (SOVs), (i.e., a new general purpose
highway on a new location or adding general purpose lanes, with the exception of safety
improvements or the elimination of bottlenecks), unless the project is addressed through a
congestion management process.”
The legislation further requires that the congestion management process shall provide an
appropriate analysis of all reasonable travel demand reduction and operational
improvement strategies for the corridor in which a capacity increasing project is
proposed. If the analysis demonstrates that travel demand reduction and operational
improvement strategies are not able to meet the demand for additional capacity, then the
SOV project is warranted. In the meantime, the CMP should identify feasible alternative
strategies to manage the corridors efficiently.
Fresno County is designated as a non-attainment area for ozone and is required to
develop an SOV project analysis process to ensure that capacity increasing SOV projects
are vetted through the CMP before they are accepted into the planning process. Since the
CMP Steering Committee decided to limit the CMP network to urban freeways, the SOV
analysis will be applied to the SOV projects on the CMP network.

38
II. Methodology
Figure 9

39
The SOV analysis starts with the RTP process as illustrated in Figure 9, when project
funding request is initiated. If the project is not in the RTP (step 2), then it is put on hold
until it is amended into the RTP. If the project is in the RTP, the project proceeds to the
step 3, which determines whether the proposed project is on the CMP network. Any
projects outside the CMP network are not subject to the analysis.
If the project falls on the CMP network, then it moves to step 4. At step 4, the project is
tested whether it is capacity increasing, i.e. a single occupancy vehicle (SOV) project that
will result in a significant increase in the carrying capacities for drive-alone auto trips. A
SOV/capacity increasing project is “a new general purpose highway on a new location or
adding general purpose lanes, with the exception of safety improvements or the
elimination of bottlenecks” 23 CFR 450.322 (e). Auxiliary lanes are not considered
capacity increasing considering they are built between interchanges to facilitate speed
change, turning, weaving, truck climbing, maneuvering of entering and exiting traffic and
other purposes supplemental to through-traffic movement.
Once determined to be a capacity increasing SOV project, it proceeds to step 5 to decide
whether it is classified as safety or bottleneck removal. According to the CMP regulation,
safety or bottleneck removal projects are exempt from the SOV analysis. A safety project
is designed to address a hazardous roadway conditions or to reduce/prevent fatalities and
serious injuries on the roadway system. Bottleneck removal projects address recurring
localized congestion points where the number of lanes decreases at ramps and
interchanges and where there are roadway alignment changes. Typical bottleneck
removal projects include: restriping, adding travel lanes for a short section by reducing
lane widths and converting shoulders, adding lanes to accommodate entering and exiting
traffic, modifying ramps, etc. If the capacity project is not considered as safety or
bottleneck removal project, then the sponsoring agency is required to provide analysis to
prove that other operational improvements or travel demand reduction strategies can’t
meet the demand for more capacity.

40
The capacity justification process begins with a density analysis of the freeway/roadway
segment where the capacity project is proposed. Highway Capacity Manual (HCM)
methodology is applied through which factors such as volume, ramp, auxiliary lanes,
truck volume, enter/exiting volume and types of drivers are included. If the density
analysis demonstrates that the roadway is congested and needs extra capacity, alternative
strategies such as a parallel route study, ramp metering, carpooling (increased vehicle
occupancy rates) are first studied. If such operational improvements or travel demand
reduction strategies can meet the demand for extra capacity, then the project is rejected;
however, if the analysis shows that the alternative strategies could not solve the
congestion problem, the capacity project is justified and accepted into the RTP process.
The sponsoring agency then identifies all the reasonable travel demand reduction and
operational improvement strategies to manage the SOV facility.

41
Please contact Kristine Cai at [email protected] or Kai
Han at [email protected] if you have any questions
regarding the Fresno County Congestion Management
Process.