fresno reservoir - bureau of reclamation reservoir 1978 sedimentation survey hydrology branch...
TRANSCRIPT

FRESNO RESERVOIR
1978 SEDIMENTATION SURVEY
--
:---- -- -:z;- .
- ___- - - -. --- - •4 ..- -- I ___ ----- -
-- _,._.g
-
____
Department of the InteriorC'tri %
Bureau of Reclamation
FRESNO RESERVOIR1978 Sedimentation Survey
Hydrology BranchDivision of Planning
Upper Missouri Regional Office
U.S. Department of the InteriorBureau of ReclamationBillings, Montana
May 1984


Table of Contents
..........................
.................................................
......................
.........................................
.....
.......................................
...................................
................................
..................................
..........
..........
..........
..........
..........
..........
..........
...................
.................................................................................................................................................
Introduction i
Survey Methods 3Aerial Survey 3Underwater Survey 3
Reservoir Area and Capacity 5Data Preparation 5Elevation-Area-Capacity Computations from Cross Section Data 5Computation of Final Elevation-Area--Capacity Tables 6
Sedimentation Analyses 7Sedimentation Accumulation 7Sediment Distribution 7Reservoir Sedimentation Summary 8
Figures
Page
1 Milk River Project Map 92 Fresno Dam - Plan and Sections 103 Index Map 114 Layout o f Reservoir Sediment Range System 125 Sediment Range Profile - Range 1 (1978) 166 Sediment Range Profile - Range 2 (1978) 177 Sediment Range Profile - Range 3 (1978) 188 Sediment Range Profile - Range 4 (1978) 199 Sediment Range Profile - Range 5 (1978) 20
10 Sediment Range Profile - Range 6 (1978) 2111 Sediment Range Profile - Range 7 (1978) 2212 Sediment Range Profile - Range 8 (1978) 2313 Sediment Range Profile - Range 8a (1978) 2414 Sediment Range Profile - Range 9 (1978) 2515 Sediment Range Profile - Range 10 (1978) 2616 Sediment Range Profile - Range 11 (1978) 2717 Sediment Range Profile - Range 12 (1978) 2818 Sediment Range Profile - Range 13 (1978) 2919 Sediment Range Profile - Range 14 (1978) 3020 Sediment Range Profile - Range 15 (1978) 3121 Sediment Range Profile - Range 16 (1978) 3222 Sediment Range Profile - Range 17 (1978) 3323 Sediment Range Profile - Range 18 (1978) 3424 Sediment Range Profile - Range 19 (1978) 3525 Sediment Range Profile - Range 20 (1978) 3626 Sediment Range Profile - Range 21 (1978) 3727 Sediment Range Profile - Range 22 (1978) 3828 Sediment Range Profile - Range 23 (1978) 3929 Sediment Range Profile - Range 24 (1978) 40

(continued)
.........
.........
.........
.........
.........
.........
.........
.........
.........
.........
.........
.........
.........
.........
.........
.........
.........
.........
.........
.........
.........
.........
............................
...................
...................................
.................................
...........
.........................................
No. Page
30 Sediment Range Profile - Range 25 (1978) 41
31 Sediment Range Profile - Range 26 (1978) 42
32 Sediment Range Profile - Range 27 (1978) 43
33 Sediment Range Profile - Range 28 (1978) 44
34 Sediment Range Profile - Range 29 (1978) 45
35 Sediment Range Profile - Range 30 (1978) 46
36 Sediment Range Profile - Range 31 (1978) 47
37 Sediment Range Profile - Range 32 (1978) 48
38 Sediment Range Profile - Range 33 (1978) 49
39 Sediment Range Profile - Range 40 (1978) 50
40 Sediment Range Profile - Range 41 (1978) 51
41 Sediment Range Profile - Range 42 (1978) 52
42 Sediment Range Profile - Range 50 (1978) 53
43 Sediment Range Profile - Range 51 (1978) 54
44 Sediment Range Profile - Range 52 (1978) 55
45 Sediment Range Profile - Range 60 (1978) 56
46 Sediment Range Profile - Range 61 (1978) 57
47 Sediment Range Profile - Range 62 (1978) 58
48 Sediment Range Profile - Range 70 (1978) 59
49 Sediment Range Profile - Range 71 (1978) 60
50 Sediment Range Profile - Range 80 (1978) 61
51 Sediment Range Profile - Range 90 (1978) 62
52 Sediment Range Profile - Range 100 (1978) 63
53 Area Capacity Curves 64
54 Original and 1978 Area and Capacity Curves 65
55 Reservoir Depth-Capacity Relations hip 66
56 Longitudinal Profile 67
57 Sediment Disposition Curve 68
m_1-1
No. Page
691 Horizontal and Vertical Control722 Area Table in Acres - 1-Foot Increment733 Area Table in Acres - 0.10-foot Increment764 Capacity Table in Acre-Feet - 1-Foot Increment775 Capacity Table in Acre-Feet - 0.10-Foot Increment
6 Summary of 1978 Survey Results and Sediment Distribution80Computations (Inch-Pound Units)817 Reservoir Sediment Data Summary848 Reservoir Capacity Allocations

INTRODUCTION
Fresno Dam and Reservoir is located on the Milk River about 13 milesupstream or west of Havre in north-central Montana. Construction by theBureau of Reclamation was completed in 1939. The original surface areaof Fresno Reservoir in 1939 was 5,760 acres and the capacity was 129,062 acre-feet at the water surface elevation of 2575.0 feet. The 1978 surveyresulted in a surface area of 4,878 acres and a capacity of 103,397 acre-feet at the same water surface elevation. Fresno reservoir is theprincipal storage component of the 124,200-acre Milk River Project.Location of the project features is shown on the project map (Figure 1).Figure 2 shows plan and section views of Fresno Dam.
The drainage area above Fresno Dam is 3,766 square miles, of which3,096 square miles is the net sediment contributing area. Elevationsrange from slightly more than 2,500 feet near the dam to about 10,000 feeton the western fringe, but only a very small part of the area is higherthan 5,000 feet.
The Milk River rises in the mountains of Glacier National Park and flowsnortheasterly into Canada. It then flows easterly more than 200 milesthrough the Province of Alberta and recrosses the International Boundaryin northwestern Hill County, Montana, where it travels a southeasterlycourse to Fresno Reservoir. Below Fresno, the Milk River flows easterlyand empties into the Missouri River below Fort Peck Reservoir in north-eastern Montana. The western fringe of the drainage is mountainous, butthe major part of the area ranges from steeply to gently rolling topo-graphy. Through the irrigation season, the flow of the Milk River aboveFresno is augmented by water from the St. Mary River which flows intothe Milk River via the St. Mary Canal. The St. Mary River water isdiverted at a point below Lake Sherburne, near the boundary of GlacierNational Park, and flows through the St. Mary Canal to the headwaters ofthe North Fork of the Milk River.
Sedimentation has long been recognized as a serious problem in the MilkRiver. Indeed, the river was named for the opaque appearance of itswater. Bank sloughing and channel alteration have been observed alongthe entire length. The specific amount of sediment accumulation inFresno Reservoir had not been determined prior to this resurvey, but itwas known to be significant.
In the years immediately preceding the resurvey two events occurred tobring attention to the sedimentation problem. One was the claim initiatedby the Canadian government that the additional flow of St. Mary Riverwater in the Milk River had caused widespread bank erosion and accompanyingloss of valuable farm land and improvements. The other was complaintsof boaters at Fresno Reservoir running aground on sand bars or islands,even in the lower or deeper parts of the reservoir. It therefore becameapparent that a reservoir resurvey was needed at Fresno Reservoir.
Both 1976 and 1977 were low runoff years and Fresno Reservoir was drawndown to nearly empty in mid-July 1977. The extreme drawdown presentedan excellent opportunity for aerial photography for a resurvey. Acontract was issued and aerial photography was performed in October
1977. The underwater measurements were made in the spring of 1978.Both parts of the fieldwork are discussed elsewhere in this report.Because the survey was completed in 1978, it is henceforth referred to
as the 1978 resurvey.
The 1978 sediment resurvey was the first since Fresno Dam was completed
in 1939. This report has been written to document the field surveymethods and computational procedures used to obtain the elevation-area-capacity curves and tables presented in this report. Comparison ofthese curves with the original elevation-area-capacity curves is made toshow the effects of over 38 years of sedimentation in Fresno Reservoir.Because sediment ranges were not established when the dam and reservoirwere completed and the topography used for the original area-capacitytables could not be located, the extent of analysis that could be
performed was limited.
2

SURVEY METHODS
Aerial Survey
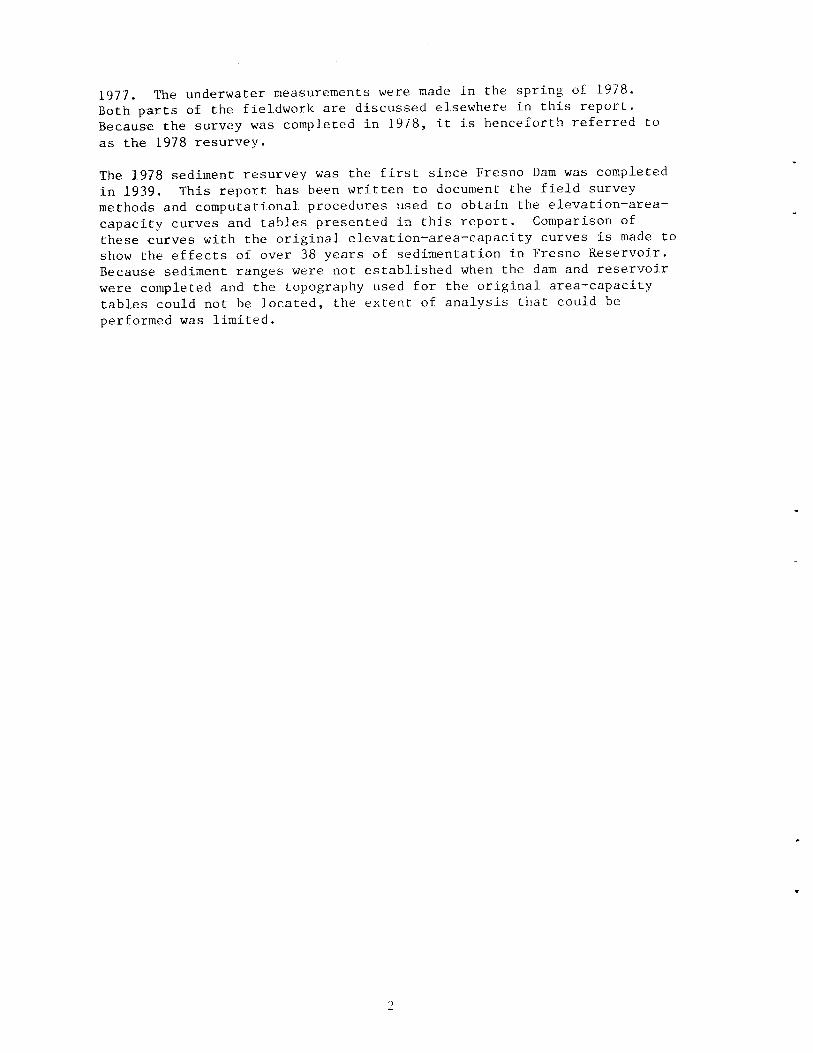
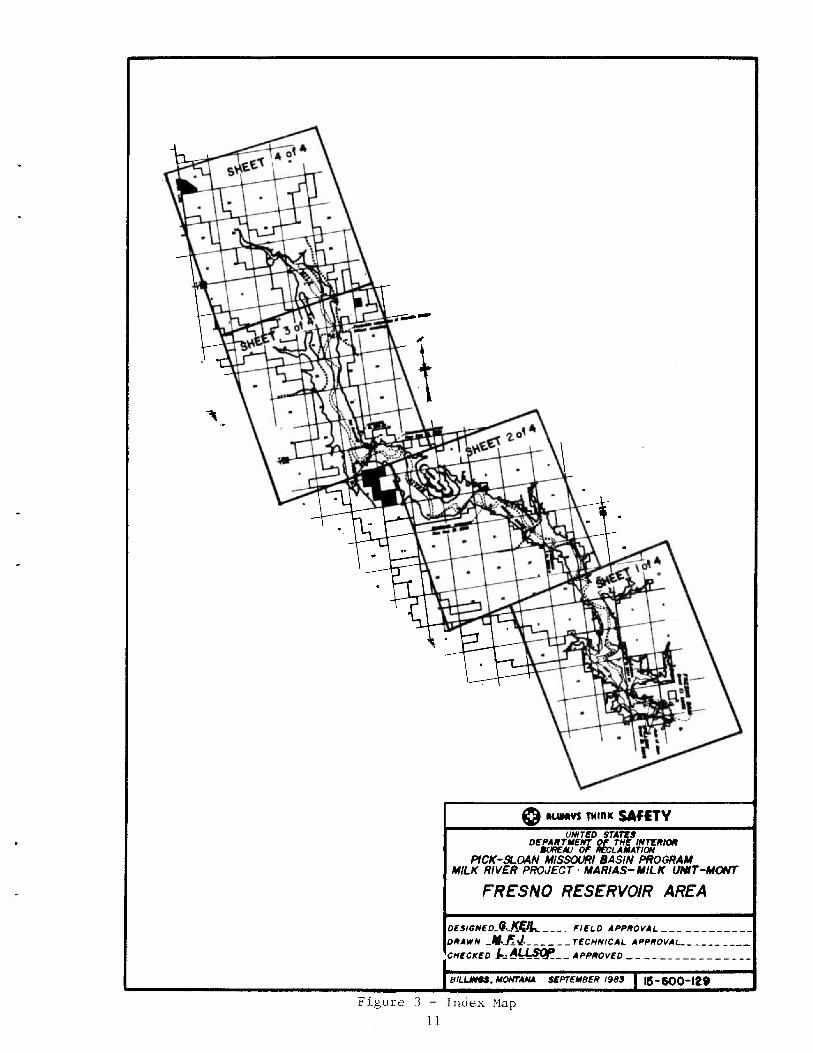
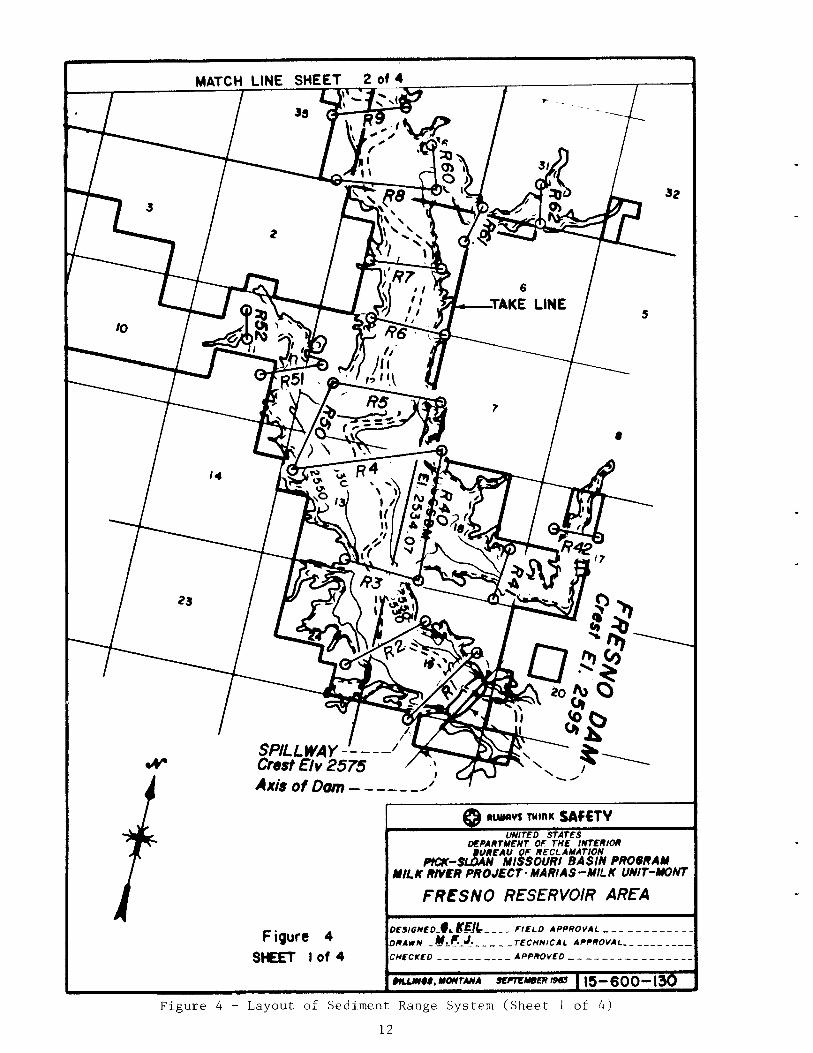
When the decision to conduct a reservoir resurvey was made during theirrigation season of 1977, a number of actions were initiated. Thesediment ranges were located on 1:24,000 (7½-minute) quadrangle sheetsby Regional and E&R Center personnel. Figure 3 is an index map forFigure 4 (sheets 1-4) that show the location of these sediment ranges.The sediment ranges were field located and control panels for aerialphotography placed by surveyors from the Upper Missouri Projects Office.Horizontal and vertical control used for the sediment resurvey is shownin Table 1. A contract to conduct the aerial survey was awarded toDelta Aerial Surveys, Denver, Colorado.
The aerial photographs were taken in October 1977. Fieldwork to establishthe horizontal and vertical coordinates of the control panels was continuedin the winter and spring of 1978. After receiving the ground controldata, the contractor measured the cross sections from the aerial photography.The data furnished by the contractor was in the form of punched cardswhich were ready for computation by automatic data processing.
Underwater Surve
The underwater portion of the reservoir resurvey was done by Bureaupersonnel in May and June 1978. Measurements of depth were made atRanges 1 through 10, 40, 50, and 51. The remainder of the sedimentranges were either dry at the time of the aerial survey or were surveyedusing conventional land surveying techniques.
The fieldwork for the underwater survey was performed in two sessions.In general, the first session was used to prepare for a smooth, efficientoperation when the actual underwater measurements were made. Thissession was used to assemble and check out the equipment for the underwatermeasurements. The boat and Electronic Distrance Measuring Device (EDMD)were operated for familiarization. The sediment range lines had beenlocated and marked by field personnel prior to the aerial photography.Since these markers were located on the top of bluffs overlooking thereservoir, it was necessary to establish a point on line near the edgeof the water for use as an instrument station when the underwater measurementswere made.
The second session consisted of profiling the underwater portion of thesediment range lines. The water depths were measured with a boat-mounted depth sounding device that operates on the sonar principle. Thisinstrument, supplied by the sedimentation section of the E&R Center,prints a continuous trace of depth as the boat travels across the watersurface along the range line. A vertical line is drawn on the chart oncommand to mark distances, scales, etc. and handwritten notes may beentered on the chart to aid interpretation. Distances along the rangeline (offsets) were measured using an Electronic Distrance MeasuringDevice (EDMD). The instrument used for the Fresno Reservoir resurveywas chosen because it could be operated in a dynamic or tracing mode
3

and also because it provided for voice communication between the stationaryand mobile units, or, in this case, the shore station and the boat.
The procedure used in profiling the underwater portion of each line wasas follows:
The stationary unit of the EDMD and a transit were located on therange line on the right bank and as close to the edge of water aspractical. The flags set during the preliminary session were usedfor references. The distance along the range line (offset) to theedge of water was measured with a tape. The first few shallowunderwater measurements were made by sounding with a level rod andthe offset distances measured by tape from the reference flag. Theboat containing the sounding gear and dynamic part of the EDMD waslocated on-line by transit and the EDMD and depth sounder turnedon. With the electronic instruments functioning, the boat was setin motion and proceeded across the reservoir at a moderate rate.The boat was kept on-line by the transit operator communicatingwith the boat operator by voice through the EDMD. The EDMD operatoron board the boat monitored the distance the boat traveled andinformed the sounding operator to mark the chart at the appropriatepoints. When the boat reached the left bank, any needed shallowmeasurements were made by sounding with a rod and the distance tothe left range marker measured by tape. This last distance measurementwas made to check the distances read by the EDMD.
4

RESERVOIR AREA AND CAPACITY COMPUTATIONS
Data Preparation
As discussed previously, cross section data were obtained from twodifferent sources, aerial photography and sonar readings, which weretaken at different times. These data had to be combined to obtaincomplete cross sections. This combination of data was accomplished inthe following manner.
At the time the aerial photography was done, October 1977, the watersurface in Fresno Reservoir was at approximately 2547.0 feet. Thefollowing spring when the sonar readings were taken the water surfacehad risen to approximately 2570 feet. Because of this difference inwater surface, offset and elevation data were obtained by both methodsfor approximately 23 vertical feet. This overlap of data offered ameans to compare the data and insure that the data sets were indeedcompatible. The cross section data taken by both methods were plottedto the same scale on separate sheets. Separate sheets were used becausethe field data were measured from different datums, or zero, for offsetsand from opposite sides of the reservoir. The two plots for each rangewere superimposed or overlaid for comparison. In all cases, the slopeson both sides compared quite closely with only small variations inindividual segments. The distances across the reservoir, as indicatedby the two sets of data, varied slightly, generally 1 to 2 percent.These minor differences can be explained by the fact that the measurementsmay not have been taken on exactly the same line. It is also possiblethat the elevations determined from photographs taken when the soilswere dry may differ slightly, due to shrink-swell factors, from thosedetermined by sounding when the material was saturated. Since thedifferences were minor, the data were accepted. The data from theunderwater survey were used to complete the cross sections at eachsediment range.
Cross section data were provided between the sediment range lines ateven 500-foot stations by the aerial survey contractor. The underwaterportion of each intermediate cross section was completed graphicallyusing the upstream and downstream ranges as a guide.
Plots of the complete sediment range cross sections are shown in Figures 5through 52.
Elevation-Area-Capacity Computations from Cross Section Data
Cross section data were used to compute areas and volumes at 1-footelevation increments. The computations were performed on a digitalcomputer using Program 268, Elevation-Area-Capacity Tables, written bypersonnel of the Division of Data Processing, Mid-Pacific Region, Bureauof Reclamation, Sacramento, California. This program uses the double-end area method to compute the volume between two planes, the end areasbeing the horizontal areas of segmental water surfaces derived forparticular increments of elevation. The area of the water surfacebetween two cross sections at a given elevation is computed by calculating
5

the width of the water surface at the two stations (obtained from thecross section data) and multiplying the average of these widths by thedistance between the two stations. Incremental volume is obtained byaveraging the area at consecutive elevations and multiplying by theelevation increment (1 foot in this case). The areas and volumes betweeneach set of cross sections along the centerline are accumulated toprovide the complete table.
The cross section data for Fresno Reservoir included several sets ofcross sections taken normal to the centerlines of several tributaries aswell as the main reservoir and river.
Computation of Final Elevation-Area-Capacity Tables
The final elevation-area-capacity tables in 1-, 0.1-, and 0.01-footelevation increments for Fresno Reservoir were generated using theBureau of Reclamation computer program ACAP. The elevation-area datagenerated by Program 268 at 1-foot elevation increments were used asinput to program ACAP. In ACAP, respective capacities and capacityequations are obtained by integration of the area equations defined bythe input data. The initial capacity equation is tested over successiveintervals to check whether it fits within an allowable error term. Thisone equation is used over the whole range that fits within this errorterm. At the next Interval, a new capacity equation (integrated fromthe basic area equation over that interval) begins testing the fit untilit too exceeds the error term. The capacity curve thus becomes a seriesof curves, or splines, each fitting a certain region of data. The finalarea equations are obtained by differentiation of the capacity equations.Capacity equations are of the form y a1 + a2x + a3x2 where y is thecapacity and x is the elevation above an elevation base. A sufficientl.ysmall error term was selected for this application such that the generatedarea and capacity values differed from the input calculated by Program 268by less than 1 percent.
The final elevation-area values are shown in Tables 2 and 3 for 1- and0.1-foot elevation increments, respectively. The elevation-capacityvalues are shown in Tables 4, and 5 for 1-, and 0.1-foot elevationincrements, respectively. Areas and capacities were also computed atthe 0.01-foot increments but are not included in this report. The area-capacity curves are shown on Figure 53.
6

SEDIMENTATION ANALYSES
Sedimentation Accumulation
Sediments have accumulated in Fresno25,665 acre-feet at elevation 2575.0the dam was built over 38 years ago.rate of 663.2 acre-feet was computedSediments from the drainage area werfoot per square mile per year.
Reservoir to a total volume offeet, top of spiliway crest, sinceAn average annual accumulationfor the period since closure (38.7 yrs).deposited at a rate of 0.214 acre-
The original elevation-area-capacity tables for Fresno Reservoir, dated1953, are based on preconstructiori (1934) data. The 1978 resurvey isthe first evaluation of sediment accumulation in Fresno Reservoir. Inseveral of the figures and tables that follow, useful comparison betweenthe resurveyed and original reservoir is precluded by the lack of originalsurvey data. In Figure 54 the original area-capacity curves are plottedagainst the 1978 resurvey curves. This plot is useful in visualizingthe total loss in capacity at various elevations.
It should be noted that these sediment accumulation values are obtainedfrom comparison with the original capacity tables. These originaltables were based on areas planimetered from 5-foot interval contours.However, the original topographic maps could not be located and theiraccuracy or detail is unknown. Sediment samples were not taken at thetime of the 1978 sediment resurvey. The absence of this data limits theconclusions that may be drawn from the available data.
There are only scattered sediment load data for the Milk River aboveFresno Reservoir and accurate prediction of sediment yield is not possible.However, a memorandum from the Chief, Sedimentation Section to the Chiefof the Hydrology Branch, E&R Center, dated February 21, 1968, Subject"Safety of Dams - Fresno Dam Tailwater - Milk River Project, Montana,Examination of Existing Structures" contains an estimate of 0.20 to0.35 acre-feet per square mile annually, or approximatley 550 to 1,000 acre-feet per year inflow to Fresno. The total sediment accumulation indicatedin this study at elevation 2575.0 feet, spillway crest, is 25,665 acre-feet or about 663 acre-feet per year. At elevation 2580.0 feet, 0.65 feetabove the maximum observed water surface, the rate is about 760 acre-feet per year. Both of these values are well within expected limits andgive credence to the results.
Sediment Distribution
In Table 6, the results of the sediment distribution computations aresurmuarized. These values show a significant sediment accumulation inthe reservoir over the years, and show that a large part of the sedimentis deposited in the active conservation pool (below elevation 2567.0 feet).
Figures 55 through 57 aid in describing the distribution of sedimentwithin Fresno Reservoir. Figure 55 shows the depth-capacity relationshipfor Fresno Reservoir. Calculations indicate that a portion of thepoints fit the Type I (lake) range, a portion fit the Type II (floodplain-foothill) range, and a portion fit the Type III (hill) range. A plot of
7

the thaiweg profile is shown on Figure 56. Without original profiledata, no useful comparisons can be made. However, it appears from thedata present in Table 6 that over 25 percent of the sediment has beendeposited between elevations 2568.0 and 2574.0 feet (miles 10 and 12).Figure 57 shows a plot of percent depth versus percent sediment deposited.Data for the plot was taken from Table 6. The total depth was taken asthe depth from the maximum observed water surface (approximately 2580.0 feet)to the streambed at the face of the dam, determined from the 1978 resurvey.As may be seen from Table 6, the sediment distribution is fairly uniform,with the greatest accumulation in the active conservation pool. Theaccumulation in the upper, or active, part of the reservoir is explainedby observing the cross sections in this portion of the reservoir.Although the reservoir is narrow in relation to its length, the increasein cross sectional area in this region is sufficient to reduce inflowvelocity and allow sediment deposition. The lower portion of the reservoirmay be less impaired because of the high accumulation rate in the upperportion of the reservoir and may benefit from a slight flushing actionnear the outlet works.
Reservoir Sedimentation Summar
A summary of the reservoir sediment data for the 1978 survey is containedin Table 7. The data include a tabulation of incremental sedimentinflow volume and sediment accumulation computed for the periods between -1939 (original) and the 1978 resurvey. These data and other informationin the table are valuable for future surveys and other reservoir sedimentinvestigations. The capacity of Fresno Reservoir at elevation 2575.0,the top of the joint use space, is 103,397 acre-feet. This is approximately20 percent less (25,665 acre-feet) than the original capacity. The areaat this elevation is 4,878 acres, a reduction of about 15 percent(897 acres) from the original area. Table 8, Reservoir Capacity Allocations,shows the allocations of the storage space in Fresno Reservoir as aresult of the 1978 resurvey.
8

GADS$1
I SSKATCE*A
______ ____________ ______
-
G LACIER I OOLE i LLOCDSO
/ /
- L
P OPDERA [ LP
TEIO .
Figure 1 - Milk River Project Map
su*ys TW(flK SAFETY
---- ____________------
_______________
PCK-O.4N MISSOURI 8ASIN PROGRAMMILK RIVER PROJECT MARIAS-MILK UMT-MQVT
FRESNO RESERVOIR AREA
3IGNED_GJ(Ik FIELD APPNOVALAWN TECHNICAL APPOVAL -
ECKED I__APPOVED_.
8/LLNS, MONTAN4 $EPTEM8ER /983 15-600-129
Figure 3 - Index Map11
MATCH LINE SHEET 2 of 4
35R-2
zs
0)3i
'8 32/.3 ,
2/R7
1 ,,sV l g ____'1 Ii
6TAKE LINE
5I,SO
I,'a,,
jIi5I .
- 7
'\ '.
'4 'ZR' i:"9I,\). -,
'IIu.4 (
( ' ?'8,
-15,32.3 - fr o/\
__,.
/
SPILL WAY-----'Crest E7v2575
/-- ---Axis of
-
suavs Tilink SAfETYUNITED STATES
DEPARTMENT OP THE INTERIO.?IUREAU OF ECLANATION
P'-SLOAN MISSOURI BASIN PROGRAMMILK EVER PROJECT MARIAS-MILK UNIT-MONT
FRESNO RESERVOIR AREA
DE5IGN(OtKIlr___ - FIELD APPROVALFigure 4 APPRO ADRAWN V LTECHNICAL.
SlEET lot 4 CHECKED ------ ---- APPROVED___
DSLLU,*IONThNA SEPTEAEWI963 115-600-130Figure 4 - Layout of Sediment Range System (Sheet 1 of 4)
12

MATCH UNE SHEET 3 of 4
20 1',tP
% TA
'I j \l119
• ''
_________9
40R8O?0
- / - \
,/o:rPz:r1Pe;.s.,. 3' S
259'' I/ 14p7t
20
21 '
," \•'
30 " '
2-
1C) I2€ I
I'3 I
RIO,33 4
I
34 I.---
MATCH LINE SHEET I of 4 _________________________________
atavs NIflK SAFiTYUNITED STATES
DEPARTMENT O INTERIORBUREAU OF RECLAMATION
PICK-SLOAN MISSOURI BASIN PROGRAMMILK RIVER PROECT NARIAS-MILK UNIT-MONT
FRESNO RESERVOIR AREA
Figure 4 DE$IGNEO__ FIELD APPROVALDRAWN _M.Pib----- TECHNICAL APPROVAL--------- -
SHEET 2of 4 CHECKED ---------- APPROVED__. __________
9LUNSS **Y4TANA SEPTEMBER I 15-600-131Figure 4 - Layout of Sediment Range System (Sheet 2 of 4)
13

MATCH LiNE SHEET 4of4
---------
ii '
:R32V 1 I/Sf ______
Li i P17l - 1 R3I H
I'6
S - // 4:-
'S.' I
S..5
.5
/COJ2/
'3
•1 I'- R28 j%i .1
11 il
/x1;,
________
I
____ u 1 23_ II,__
R27 24-- #1
-' ELINE
26 '
SI
-I
33II 5
, I34 I
/ ig!
3.
, . ---
\
--
MATCH LINE SHEET 2of 4 ____________________________NIAk SAf(TY
TkruD P ThE 1TQR
POIRAWi. NIR PoiCT HARIAS-MIL.K 1fT-MT
FRESNO RESERVOIR AREA
riro AOvALFigureOAAWN TECHIdICAL APOVAL -
SHEET 3 of 4 AFaVED_
8L,I*S,NONrANA PTI&EP 15-eOO- 132
Figure 4 - Layout of Sediment Range System (Sheet 3 of 4)
14

IC'
i$5
--------
19
2,
22
30
21i
___••••..u...I.uI.IJ /3,
I'' Il -36
3N.II
- H--- I 356
I,II-. II
S
4 'I
c' '' "'I
II 2I I1 I -
, )iA \ / H
MATCH LINE SHEET 3 of 4
0 iin SAFETYTE
PKK-SLOiIIS°IOMI i/PROIRAM
OPA
R'J?j Tf,NTtICW
MILK RIVER PRO€CT MAR/AS-MILK U1IIT-MO.YT
FRESNO RESERVOIR AREA
Figure 4 Of5,GNEOG APPPOVAL__--Q4wk fi(.td. - - - TECHNICAL hPPftOAL
SHEET 4 of 4 CECKED iPPOvFO_ - -
B,LLJNs.HrmA SEFTEMEP!915 5-600-133Figure 4 - Layout or Sediment Ranee Svtni (Sht L nf Li
15

PRESNO RESERVOIR SEDIMENT RESURVEYEflE I
l'4'L I
DnflpT r' Eflfl eErTTflJ\U i LL U\ UL.k I I U U
(0(N
CD(N(C(N
C)r
LiLL
-;- CD(- CU
LU--- (N
CE
LL]
CDLi] cc
C'J
CD
LU(N
C)(NLU(N
I t r q a
)50 2C0 1100 1600 1800 2000 220tU OUu U UUU
DISTANCE -
Figure 5 - Sediment Range Profile - Range 1 (1978)

4
PPESNO RESERVOIR SEDIMENT PESURVEYRANGE C
GROUND PEOPILE POP SECTION 3206
CD
(0(N
CD(N.(0(N
C)F c,.
Z CDco.
'-- (N
CE
C): c.o -
Lfl
(N
CD
U)(N
CD(NLfl(N
n
I_ _ _ _ __/
I /
-_j*_ _ _ _ _
__ 2 TT IH ± 1 __200 00 600 600 1000 1200 1100 1600 1800 2000 2200 200 2600 2600 3000 3200
DISTANCE - PEEl
Figure 6 - Sediment Range Profile - Range 2 (1978)

PRE5NO RESERVOIR SEDIMENT RESURVEYRANGE 3
GROUND PROrILE POP SECTION S67
cJ
CD
(0
LJHcLi CD.
U-)
-7
CD
>(0LLi
CD
LI)(N
CD(NLI)
2T t7
9 •)('4fl 61'fl O0 1 I )flC 1 4(111 1cu juj jj ruu 1600 1800 2000 2200 iu 600 2800DISTANCE PEET
Figure 7 - Sediment Range Profile - Range 3 (1978)
1 4 4 4

S
RESNO RESERVOIR SEDIMENT RESURVEYRANGE 4
GROUND PROPILE FTOR SECTION 10874
C)
CD(N
C)(N(0(N
C)
LLJLi
I-
-z C)OD
L.JU\J
CE>Li
C)
CD(N
C)
CD(N
C)(NCD _______ _______ _______ _______ _______ _______ _______ _______ _______ _______
(Nr00 1000 1500 0G 3000 3500 4000 4500 5000 5500
DISTANCE - PEET
Figure 8 - Sediment Range Profile - Range 4 (1978)
I i: ± __.- L

TRE5NO PSSEPVCIP SEDJMENT R55UPV5YP\HNGE 5
(fl Ifl fl'r L E\UbHU :u Ib U\ UL1 IU N i IUi
-fi
NJ
NJ
NJ CD0
H- cCL
CD
LU
CD
NJ
CC
CCUi
Niflfl -:-
jU ) UU) I JJU
n C m fi fl'U U I L L I
Figure 9 - Sediment Range Profile - Range 5 (1978)
J CCJ
• T

r ('Ifl (rrrr-\pE rmrr ErEu : v u b JE Li I
r:Th2:, cr' m (- r T r Em. C CE C I CC C'
JLLJmJ r u iE.Li U L
N)
cj
(N
C)
(-'3
C)
(N
Lj,j
Cl)
E c(Cl (;)
C2
(N
LrC')
CUCli
-
- /
-
±
__ __
3 l fl 'C )flC C 'CC C
D5TPNCL - PELTLi
Figure 10 - Sediment Range Profile - Range 6 (1978)

rF5NU PSSRVOR SD[MENT R5URVE1RANGE 7
GPOUND PFOP[LE FO SECT[ON 19973
---------------------- ---- ---- ----------- - ------------ ------ ----
_ - __ _
3,a *-. ,*
- - 1-----t-----
L_
U______
- /\ /C) /
/H-'UT
c.o_ -_______
j L' - ______
/- --- ---- - ----------- ----------- - ------ ---- ----------- - ----
(N
----.----------- __
C)
_______I_______ _______ _______ _______ _______ _______ _______ _______ _______ _______ _______ _______ ______-
- r ------- W-a__4.. ,__ ..a.. .___4w, !nlwfl. . _ _4m frng.aan.a.1 . _.__ .. A.._-.
0 200 400 600 800 1000 1200 1400 1600 1800 2000 2200 2O0 2600 2800D1'3TANC - FEET -
Figure 11 - Sediment Range Profile - Range 7 (1978)
4 4 4 4 4

I I $
F'RESNO PESERVOfR 5LDMSNT RE5URVSIRflNGE 8
)r'(- r nrr c'r'Thr r(m ''7r <u L r u JUL i Lu
_CDCo.(0
CD
0
C
(C
Li
C
(C(NJ
CD,_ -4
E- CD
Li
U)
C.
CD(0
(NJ
C)
r.'J
fl_a ___- - - - -__ -
______ L-
:coo 2DO 3000 3000 4000DJ5TAN[TE - PElT
Figure 12 - Sediment Range Profile - Range 8 (1978)

PRESNO RESERVOIR SEDIMENT RESURVEYRANGE 8A
GROUND PROPILE P0k SECTION 23719
D(0(0
0(0(0
0
cc,
LiLi
0(N(0(N
cEO>Li
Li
co
(N
0(0
(N
(Nn 500 1000 1500 2000 2500 3000
DISTANCE - PEET
Figure 13 - Sediment Range Profile - Range 8A (1978)
3500 4000
F 4 4 3 4

ft I 4 I *
PRESNO RESERVOIR SEDIMENT RESURVEY.RANGE 9
GROUND PROPILE POR SECTION 25918
(0(0
C(C(C(N
C
(C
LiLL
(N(0(N
2:
I,
Ec
> c\Li-JLi
CDcoLt)(N
CD(0
(N
CD
U)(N
7
ii - 1i ±i 1i>I__U 2flfl 4nn nn nn innn inn iinn inn ono nnn
__DISTANCE - PEET
2U00
Figure 14 - Sediment Range Profile - Range 9 (1978)

PRESNO RESERVOIR SEDIMENT RESURVEYRANGE 10
GROUND PROPILE POP SECTION 29188
_
C)C)
(N
C)CoCD(N
C)CDCD(N
LLJ
t.- (NLJ(D
C")
>C)LJC)JCD
Li
C)Co(N
CDCDU')(N
C)
C")
__ 1± l1 iii: I IIII__
=__ _ _
- I - - ---- r- -
r i r ruu uuu uu 2000 2500
DISTANCE - PEETFigure 15 - Sediment Range Profile - Range 10 (1978)
3000 300

I I *
PRESNO RESERVOIR SEDIMENT RESURVEYRANGE I I
GROUND PROPILE POR SECTION 32079
D
LiJ(DLJa-
CD
(C
CD(N
(N
CDCD
(N
CDco(C(N
CD
cECO>CN
Lii
LJcD(0(N
CD(0
(N
CD(0(0(N
CD
(0(N
U 5UU 1000 1500 2000 2500 3000 3500
DISTANCE - PEET
Figure 16 - Sediment Range Profile - Range 11 (1978)

PRESNO RESERVOIR SEDIMENT RESURVEYRANGE 12
GROUND PROPILE POR SECTION 36063
Q
Cco(0
LiLi
(0Ic'J
CC')
C')
ciCD
C')
D (0
cEcD>C'J
LiciC(0C')
ci(0
C')
ci
U)C')
CCuJC')
0 500 1000 1500 2000 2500 3000 3500 4000
DISTANCE - PEETFigure 17 - Sediment Range Profile - Range 12 (1978)
V * I I *

PRESNO RESERVOIR SEDIMENT RESURVEYRANGE 13
GROUND PROPILE POP SECTION 39936
CCN.
C
(0(\J
C
LJ(D
a-C
(0
D
cro>"Li-Jo
(0
C
o(U
C
(\)
0 500 1090 1500 2000 2500 3000 3500
DISTANCE - PEET
Figure 18 - Sediment Range Profile - Range 13 (1978)

PRESNO RESERVOIR SEDIMENT RESURVEYRANGE 14
GROUND PROPILE POR SECTION 43152
0
CD
(N
c
(N
CDCD-
(N
Cco(0
LiLJQ
(0(N
cEc>(N
LiCD-(0(N
CD
LID(N
CD(0U•)(N
CD
U
11
(N -- I
0 200 IOO 600 800 1300 1200 1'lOO 1600 1800 2000 2200 2'lOO 2600 2800 3000 3200
DISTANCE - PEETFigure 19 - Sediment Range Profile - Range 14 (1978)
1 ( 4

PRESNO RESERVOIR SEDIMENT RESURVEYRANGE 15
GROUND PROPILE POP SECTION 47447
(-j
IIii :izii. 4
Li :ii I II I II_
:i1 11J114 1ii iii
____r: i : r r ____
CD
(N
(N-
(N
CDCD-N-
CDcoCD
LiLJQL o
(0
cJ -(0
>c'J.
LiCDCD.(0(N
CDco.LID
CD(D-UD(N
CDUD ______ ______ ______ ______ ______ ______ ______(N -
0 500 1000 1500 2000 2500 3000 3500DISTANCE - PEET
4000 4500 5000
Figure 20 - Sediment Range Profile - Range 15 (1978)
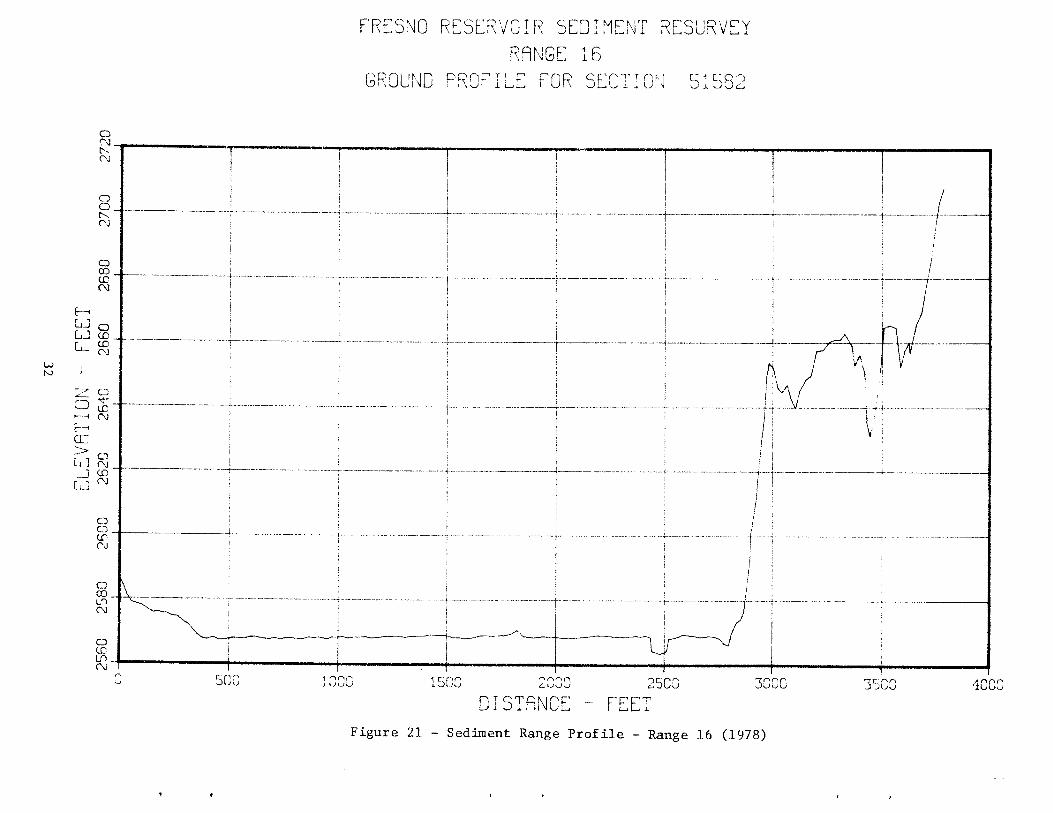
PFRESNO RESERVOIR SEDIMENT RESURVEYRANGE 16
GROUND ' POP SECTION 51552\J i_
C(N -
(N
(N
C
(U(N
Lic.(U
- C)
cD(0
> C)Lii
Lii
CC)-CC(N
C(0If)(N
C)(C
(N
J 1000 15r '500 3000L'JU
DISTANCE - FEETFigure 21 - Sediinent Range Profile - Range 16 (1978)
3500 l uuu
I I

S
PFRESNO RESERVOIR SEDIMENT RE5URVEYRANGE 17
Inn flflL T C'flp flT flI L[3' \3UHLJ U I u
1--'_-,_j___ - ___
i it TI I: II4 H ---
•IUU flLiu DUU juj 11JJ i'jijU IbUJ 1JUU 2OJ 2200 2400 2600 2600 3000 3200
DISTANCE - FEETFigure 22 - Sediment Range Profile Range 17 (1978)
CD(N
(N
c(-N
CD(IDcc(N
Ui CDLiceLice(N
CD
(N
ci:- CDLi
C)CDcc
C)Co
(3ccCo(N

PRESNO RESERVOIR SEDIMENT RESURVEYRANGE 18
'flPGROUND PRUPL r U\ 3L1 uN 57827
C)
C)Co(C(N
C)(Cc-C(N
LiLi
C)
(C(N
CD
> (NLi
rLU
C)C)(C(N
C)Cx)(C(N
C)(C(C(N
2000 2500 3000 3500 40000 0O UU)
DISTANCE PEETFigure 23 - Sediment Range Profile - Range 18 (1978)
4500
S

S S S I
PRESNO RESERVOIR SEDIMENT RESURVEYRANGE 19
GROUND PROPIUE POP SECTION 61O2
t 1T ZILIII IJI I 1111I 1I11 1,
DCo.CO(N
(0.(C(N
LLJ(D
Co
>Lii
LL]cJ.(0(N
Co-in(N
DCoin-(N
'-I 200 400 600 800 1090 1200 1400 1600 1800 2000 2200 2400 2600 2500 3000 3200DISTANCE - PEET
Figure 24 - Sediment Range Profile - Range 19 (1978)

PFRESNO PESERVOIR SEDIMENT RESUFRVEYRFINGE 20
GROUND PROPIbE POP SECTION 64545
----- --------------------------
D
0co(0r\J
0(0c0C\J
F-iLiLi
0
(C(N
d
F-i D
>(NLi
Li00(0(N
CDCo
(N
C)(C
c'J
- --..-- ---.
• __
/--.---,--±--.-
0 500 1005 1500 2000 2500 3000 3500 4000
DISTANCE - PEET
Figure 25 - Sediment Range Profile - Range 20 (1978)
S *
4500 5000

PRESNO RESERVOIR SEDIMENT RESURVEYRANGE 21
L)
(0'-C
D(C'-C
LiLi
(N-Fc
>c\Jc-il
LICD
(0(N
C)(0u)(N
C)(0
c'i
GROUND PROPILE POP SECTiON 69438
T I
i:ii II: :iiii T• _
•-__ _
500 1000 1500 2000 2500 3000 4OU
DISTANCE - PEET
Figure 26 - Sediment Range Profile - Range 21 (1978)
15CC

PRESNO RESERVOIR SEDIMENT RESURVY
RANGE 22
GROUND PRO1LE POP SECTION 71290
C)C) _____________________________ _________ _________ ___________________
C)(0(0(N
C)(0 _____ _____ _____ _________(0
LULi
C)
F- C)
>LU
[UC)C)(0CU
C)(0LflCU
C)(C(0c'J
5Cr rr 1500 2000 2500 3000
DISTANCE - PEET
Figure 27 - Sediment Range Profile - Range 22 (1978)
3500 4000

FRESNO ESERV0IR SEDIMENT RESURVEY
RANGE 23
GROUND PROFILE POP SECTION 75304
D
CD
C
CD(N
cD
CD(N
L4JC
LL
.---3 (N
>CL1 c
LJ
Lf)C')
C
U)(N
U). _____________________________
0 500 1000 1500 2000 2500 3000 3500
DISTANCE - FEET
Figure 28 - Sediment Range Profile - Range 23 (1978)
________--
*-
L _ _
j

PRSN0 R5ERV0IR SEDIMENT RESURVEYRANG24
GROUND PROrILE roR SECTION 78950
CD(0.(0
CD
(0
0
(0
0
LL)-0
(.0
rn(0C")
Lii-JO
C')
C')
CDCD.L1)C')
C)
LI).
-*------- --- -- -
I I
I___
Ii _____
II Ii II1 tIT1I 11 111 IiI J7z I__
500 1000 1500 2000 2500 3000 3500 4000
DISTANCE - FEET
Figure 29 - Sediment Range Profile - Range 24 (1978)
4500 5000 5500

PRESNO RESERVOIR SEDIMENT RESURVEYRANGE 25
GROUND PROPILE POP SECTION 82051
D
QCU,(0('3
CD(U.(U
LiLi
CD
(0(N
zD'4
ci: .
>Li-jLi
CDCD.(0('3
CD
Lfl('3
CD(UL1)(N
0
I I
___ ___ ___ ___ ___ ___ ___ ___ ___ ___ . 1. ___
500 1000 1500 2000 2500 3000 3500 4000 4500 5000 5500 6000 6500
DISTANCE - PEET
Figure 30 - Sediment Range Profile - Range 25 (1978)

PRESNO RESERVOIR SEDIMENT RESURVEYRANGE 26
GROUND PROP ILE FOR SECTION 85796
C)(C(C(N
CLr(r
C
c
LJcU
C'(N
(C
ci
>c\Li
LJc(C(N
C)O)U)(N
C)co(N
C)
U)(N
IIIIITIIiI liii I IT11±_0 500 1000 1500 2000 2500 3000 3500 4000 4Sf
DISTANCE FEET
Figure 31 - Sediment Range Profile - Range 26 (1978)
0

FRESNO RESERVOIR SEDIMENT RESURVEYRANGE 27
GROUND PRorILE POR SECTION 88962
• - --- --
I:EE:I Io 500 1000 1500 2000 2500 3000 3500 4000 4500 501
U)(U(N
0
(C(N
0
(U(N
LJcDLLJc'
ZD
>0LJ
LU
0a)U)(N
0(CU)(N
0
(N
DISTANCE - PEET
Figure 32 - Sediment Range Profile - Range 27 (1978)

PRESNO RESERVOIR SEDIMENT RESURVEYRANGE 28
GROUND PROPIbE POR SECTION 92052
L!)-4
(0
C0
If)C)-(0
LiLiLi
C)0(U('a
zD
E--4Ln
>c'U
Lii
C)C)-Lfl
if)
U)(N
C)Cr)
Cu0 500 1000 1500 2000 2500 3000 3500
DISTANCE - FEET
Figure 33 - Sediment Range Profile - Range 28 (1978)
__ _______
t tiI_ _ ____ _ _______ i
_ __ -__ __ .1
4000 4500

PRESNO RESERVOIR SEDIMENT RESURVEYRANGE 29
GROUND PROPILE POP SECTION 9S45
U,
CD
(0
Co(\1(0r'J
CD(N(0(N
Co
(0
Lii
z Co
CD0)U)(N
Co(0Co(N
CDcoCo.
I I
__ 111111 _1
*_/
H -
HE-!__
I-
_I I - - - 1
0 200 400 6CC 600 1000 1200 1400 1600DISTANCE - PEET
Figure 34 - Sediment Range Profile - Range 29 (1978)
1800 2000 2200

PRESNO RESERVOIR SEDIMENT RESURVEYRANGE 30
GROUND PROPILE POR 'Tfl 98904
cD(U.(U(N
Lfl.(0(N
cD
(C(N
LicU v.
-I
LU
C)
c-C(N
cJO.L)(N
C)
C)C J I I
dr'r100 200 300 500 600 700
DISTANCE -
Figure 35 - Sediment Range Profile - Range 30 (1978)
iiIi ii 11111iii II iII i± __
I T111 1_1111111 1II II 11111
II _ __ ___ __
s6o a 1000
4 4

PRESNO RESERVOIR SEDIMENT RESURVEYRANGE 31
GROUND PROPILE POP SECJION 102135
'-CO)L()(N
O)if)(N
(NO).
(N
LJc3LjJO).
::: ccc- L)
(N
a:>i:cLI o
(N
if)(N
(NCC-if-)(N
cDCoIf) -
(N
'a
TI_._k- _
r
:.-t
-L _____
---.----
______ __
C0 300 400 5CC 600 700 800 900 1000 1100 1200
DISTANCE - PEET
Figure 36 - Sediment Range Profile - Range 31 (1978)
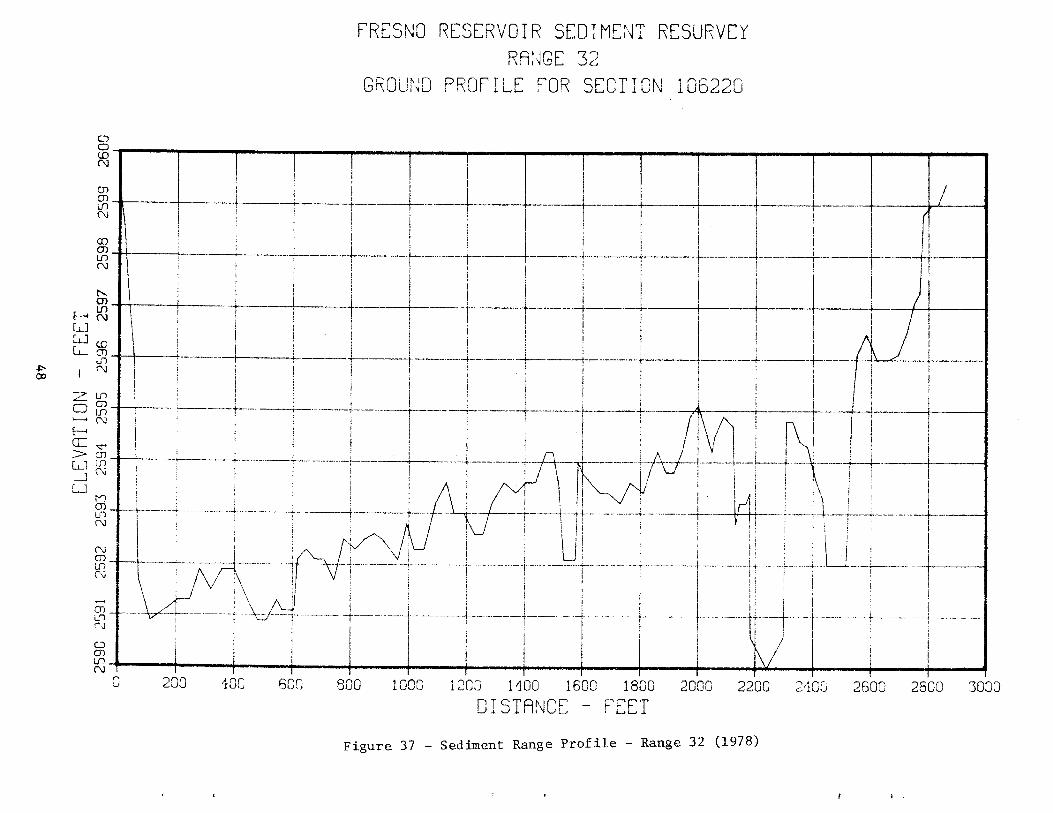
F'RESNO RESERVOIR SEDIMENT RESURVEYRANGE 32
GROUND PROrILE POR SECTION 106220
C,0.(0
0)0)U)(N
a,-LiD(N
LiD
(0
U-,
c ,->0-).Lii 'U-'(N
C')C).
(N
(NC).
(N
U-)(N
C,0)
_____ ______________ -i- F I____ _____ ________ _________ ______ ______
i iii: t7 __r
lTf________ LH_
__
0 200 400 609 800 1000 1200 1400 1600 1800 2000 2200 2i00 2600
DISTANCE - PEET
Figure 37 - Sediment Range Profile - Range 32 (1978)
2800 3000

I 4 p
F1RESNO RESERVOIR SEDIMENT RESURVEYRANGE 33
GROUND PROPILE POR SECTION 111070
cJ(0
U.)O)U.)("3
LiLi
(Th0)L/ U.)
>LiLiLi
U-)aDU-)("3
CD(0
("3
0
Figure 38 - Sediment Range Profile - Range 33 (1978)
500 1000 1500 2000 2500 3000 3500 4000 4500
DISTANCE - PEET

PRESNO RESERVOIR SEDIMENT PESURVEYNE Afl
\ I3L IU
n 'r-r T rTh rnSuUNLJ IL r UP JE iuN U
c'J
C)(NJ
(N
LJ
0
c-,
Li
Li(N
(N
CT)(NJ
(NJ
I__ _
-
///
5 fln I 555 1 flfl 2555 rflfl fl flfl 35 flfl 4000 4500 50 00
DISTANCE PEET
Figure 39 - Sediment Range Profile - Range 40 (1978)
I I I

PRENO RE5EPVOI 5[DMNT RELJVEYL:; t
flfl fl 'r'T 'j' CCflTTflbLHU I L r U i I U'
Ui
_ _ _
/_ _ _ _ 7- /
__ _- _
4flfl flfl Rflfl lflflfl l7flfl l4flfl lR flfl ii
C)
Cc)
CD
Cc(N
CD(NCc
C)-4
CC
LULJcLi CD
CCrj
C)
C)
CDCDC)(N
U)
CD
DISTANCE - PELT
Figure 40 - Sediment Range Profile - Range 41 (1978)

PPESNC RESEFIVOIP SEDIMENT RESUPVEIA )
Ii 42_
5ROUND PROPILE POP SECTION C
(NLU(N
CD
(Uc'J
F-i CDLi (c
Ui
ZCD(
E-HCE
Li
uJ CUCU(N
CD
LU(N
CD(UU'.-(N
100 20u ,UJ 400 500 500 700 500 900 1000
DISTANCE - F'ET
Figure 41 - Sediraent Range Profile - Range 42 (1978)
1100
F

PRE5NO PESERVOIP SEDTNIENT PE$UPVEYLi ILL u
- -' - fl-, r-' '-flGRULNU PRO ILL r uP
C)Ccc(N
c0L
CccLIN
LiLiU-
U.NU-N
zC)
>LiLiLi
CU)C(N
C
LI)flU
C
CU
I I ]I-__
_J
_I
O 500 1000 1500 2000 25__
00_
DISTANCE - PELT0O0
Figure 42 Sediment Range Profile - Range 50 (1978)

PREONO REOEPVOIR SEDTMNT PESURVEYCT1
, I
- rm ' r- n ' fl T ' r-' (' 1' TuuLll Jr iL TOP Li 249
C)(N
(N
C)
(C
CT)C)
(N
- C)
LLJU
CT)COC)
CE /
0 00 200 300 400 500 700 800 000 1002 1100 1200 1300 1402
DOTANOE - PLET
Figure 43 - Sediment Range Profile - Range 51 (1978)

I t
PRESNO RESERVOIR SEDIMENT RESURVEYflflflfl
nfl' ' N fl n n n T fl ç- - n r-' - N :- n - -uUHU rur ILL L DLJJ
LJ
cJ
HRLiLIU-
CD
HR
U-
(0
iuu 300 400 000 000 700 000 000 1000 100 1200 1300fl T ('mn 'C' ErmU3IfliLL - I [U-U-
Figure 44 - Sediment Range Profile - Range 52 (1978)
LI-
1
CCLi
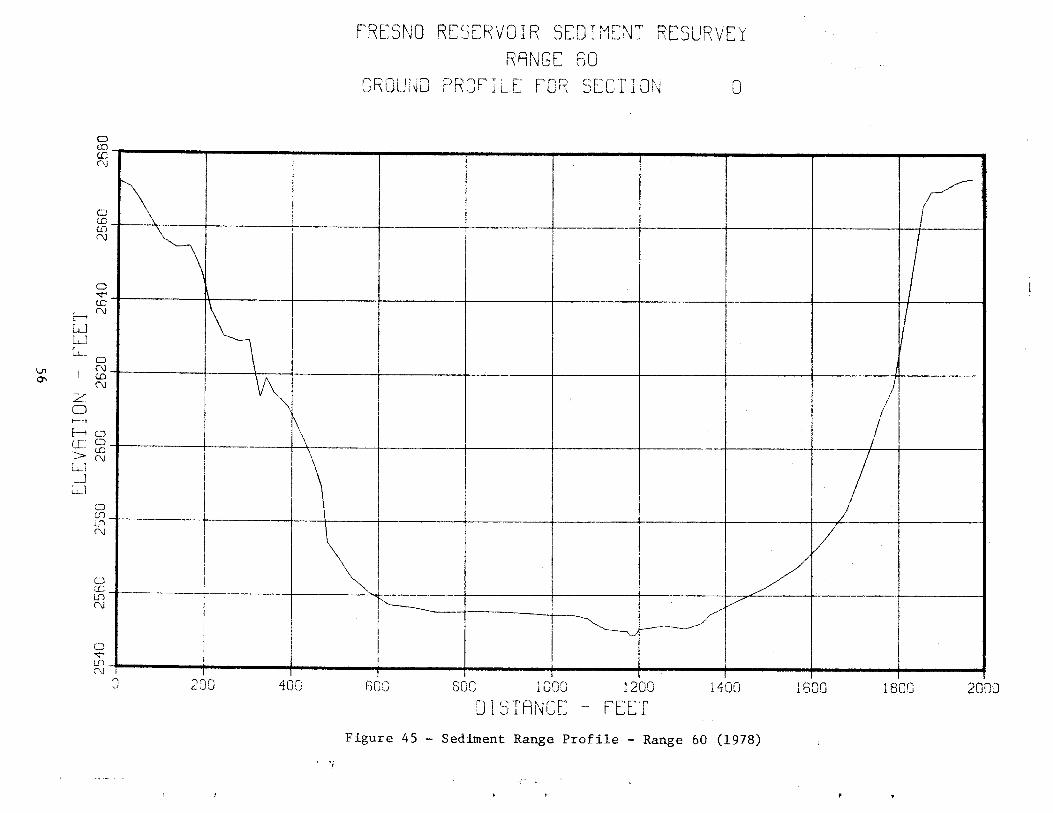
PRESNO RESERVOIR SEDIMENT RESURVEYRANGE GO
GROUND PRDEILE POP SECTION 0
CDaD'U(N
CCocccN
Co
'-C
LULU
CD(N(-C(N
zD
>\JLU
LiCo(0(0(N
CoCoCo(N
CO
(0(N
_
/1
_ _ _
0 200 400 S0 0 800 1000 1200 1400 1500 1500 201
DISTANCE - PELTFigure 45 - Sediment Range Profile - Range 60 (1978)

I S I I
PRE5NO PE5EFRVOIR SEDIMENT RESURVEYRANGE 61
CflflT fl 'flr3UUU I \JI I b i I U
(1:)
(-Si
ccccc
U.-
LULJ
z
Ui
000
0CoU)
0
CoC\j
_1__ _ _
9 100 200 4fl0 9nn flfl Th(- lflI
D5TANCE - PEST
Figure 46 - Sediment Range Profile - Range 61 (1978)

PRESNO RESERVOIR 5EDTMENT RESURVEYRANSE 62
GROUND PEOrILE POE 5ECTIC 5355
C)C)
(N
CDCoC)(N
Co'0CD
H-i (N
LLC)
In
C)
(NU
C)CDinIN
C)(0tf)(N
C)IfLi) -I-')
flU 100 200 009 400 500 800 700 800 300 1090 1100 1202 1300 1400
DISTANCE - FEET
Figure 47 - Sediment Range Profile - Range 62 (1978)
t ft p

* 1 1
PRESNO RESERVOIR SEDIMENT RESURVEYThThpIflflr\hNE.. /U
OFROUND PROF ILl POP SECT iON 0
CD
C)c'J
C)C)
(\J
- C)I:- (
LiC)
C)
DC)
(LUD
LL
Li c
CDLiD(N
C)CD)C)(N
CDCCCD)(N
7 :_ ____ _0 200 400 000 800 1000 1200 14 00 1800 1800 2000 2200 2400 2800 2800 301
DISTANCE FEET
Fi2ure 48 - m-f- P,zrnc •lfl I1c7O\

PRESNO PESERVOIP SEDJMENT PESURVEYPPNGE 'i
fl Im (Th r' fl Th ( ' T' T fl __J IL u L uN
0'0
cD
(N
CD
(N
CDCDN.
CDco
C(C(C
k--I
Li- CD
(N
CCD(C(N
CDCC(N
pCC
/1
0 10 0 200 400 000 nn 700 flfl 000 0nn inn 12
DISTANCE PEElFigure 49 - Sediment Range Profile - Range 71 (1978)
I I

PRESNU RESERVOIR SEDIMENT RESURVEYRANGE 80
GROUND PROFILE TOP SECTION 0
CDCD
(N
CDCOCD
CDCD(C
LiLiLi
CD
CDCC
zCD
H C)
Li
LCD
CDCD
CC
CDCO
(N
CD(CCD
0 000 Rnn Rflfl iflflfl i4 flfl S flfl 1B fl 2O
DISTANCE - PELT
Ficmr 90 - S-Hmrnf- Prnf11 - 1,or SI) (1Q7S'

PRESNO RESERVOIR SE1IMENT RESURVEYRANGE 90
GROUND PROFILE PR SECTION 0
CD(N
CF
'-C
0(C
LJLnLJcy,
a)
>
fl
LJ
CD0)
(N
CFN-.CF(N
CD
(N
- -H ___ _ _______± __
- i _ _ _ _
__ ______
O 200 40 0 600 000 10_
00 1200 14_
00 16_ _ _
00 1600 2000 22_
00 24_ _
00 20fl 2A_
00 Of
DISTANCE - FEETFigure 51 - Sedent Range Profile - Range 90 (1978)

--- i
PRESNO RESERVOIR SED I MENT RE5UFRVEYRENSE 100
GROUND PPGILE POP SECTION 0
C-:)
LU
C(-CLUU.
LUU.
0
ftCD
cD0
f-i
>0
Li
CD
LUU.
C)CD(C)U.
CD0iLUU.
CDCoLUU.
_ _ _ ________ ______ /
____
- ______ _____ ______ ___ _____ ___ ______'-I - ____ --____ -__ ____ -___ -___ ____ ____ ____
O 200 400 000 800 1000 1200 1400 1800 flflD 77flfl )41- PPT
U I i I
Figure 52 - Sediment Range Profile - Range 100 (1978)

AREA-bOO ACRES0 I 2 3 4 5 6 7
2600 .
- _Mgmu Water Surface EL 2592.93 -
2590
Surcharge, /25,83/ acre feet
2580 -
cILELZQ- - _-
2570 - F-32,&02 acre feet
• - gp_pLa.cJiy.e_osvoikri, FJ-237()
2560,_ Active storage
70, 05! acre feet
tIdLi.
I 2550 .K)
2>Id-jId 2540
8 9 0 Ii 2
04U 04
C
NOTESArea and capacity data from 978 survey.This drawing supersedes Drawing N X-D-769.Crest of dam, El. 2596.1
2530 7Top of dead storage, El. 2530.0, and trarack structure sillStorage, 544 acre feet
/ Area, 275 acres
- bead storage 544 acre feet
2520 . - I I I I I I I I I0 20 40 60 80 00 20 40 60 80 200 220
CAPACITY- 000 ACRE FEET FRESNO 1978 DATA
240 260
Figure 53 - Area and Capacity Curvec
I , I

N S V
____________________
________________
2600AREA-I000 ACRES - 2600
9 8 7 6 5 4I I I I
3 2 II
2590 2590
2580 2580
2570 2570
qp
'\_
U2560 2560
UU- U
z I0 Z
2550 02550
U_J UU
U
2540 25-40
2530 2530
2520_ I I I I I 25200 20 40 60 80 00 20 40 160 80 200 220 240 TED CrATES
PAS flMENT or flit INTERIORBURIAII OP RECLAMATION
CAPACITY-bOO ACRE FEET PICK-SLOAN MISSOURI BASIN PROGRAMM/LKRIYERFOJECT MAR/AS-MILK UNIT-MONT
FRESNO RERVOiRORIGINAL 8 /978 AREA ICAPACITY
DESIGNED 4 FIELD APPROVAL
DRAWN MfJ___ TECHNICAL PflOVALCHECREO_LL$LO_P__ APPROVED
8ILLINGSMONTANA JUC483 5-600-125
Flgare 54 - Original and 1978 Area and Capacity Curves

100 -
Type(I-li/i)- m- 2.1891
----------------------------I.-
-Type(Flood Plain- Foothill)
io - m2473/- I
0w - I
-
- '-TypeI- (Lake)
- m3.O9I7
-
I I I 111111 I I I 111111 I I tiiitl I I I 111111 I 1111111
0 02 o ________________________________
UØVS TIIIflK SAfETYCAPACITY (ACRE FEET) UNTED SlATES
DEPARTMENT OP THE INTERIOR
PIC-SLOIYSOU1%SIN PROGRAMMILK RIVER PROJECT MARIAS-MILK UNIT-MONT
FRESNO RESERVOIR'
OE$1ND R.EiI. - TItLE APPROVAL __________DRAWN MEJ----- TECHNICAL APPROVAL.__
CHECKED --------- APPROVED________________WILL/NOD MONTANA JUNE 15-60Q- 45
Figure 55 - Reservoir Depth - Capocity Relotfonship

t e
2580 -Max. W. S. El. 2579.35 ft (April 3, /952)
2575
2570Topofoct,ve conservation El. 2567 0 -
2565
wCl) 2560
555
I..-2550
2545 /978 SedIment Survey Data
2540w-J
2535
2530
I 2 3 4 5 6 7 8 9 10 II 12 13 4 15DISTANCE IN MILES
Figure 56 - Longitudinal Profiles

---------
100
Actual
80
Type I
60
NOTES/978 Sediment Survey Data
pe.Iff Hr Total Depth = 54 FeetI- (El. 2580)
40 - - Max ObservedWS. El. 2579.35(April 3, /952)
20 -
- I
20I I I J
40 60 80i I
100PERCENT SEDIMENT DEPOSITED
ADD Typ.I11pfl, lyp. III
UNITED STATESDEPARTMENT OF THE INTERIORBUREAU OF RECLAMATION
PICK-SLOAN MISSOURI BASIN PROGRAMMILK RIVEft PROJECT MARIAS-MILK UNIT-MONT
FRESNO RESERVOIR
DE$I$NEO 1E1_ -- FIELD APPROVAL. -
DRAWN - TECHNICAL APPROVAL_APPROVEDC EC D 4 4-4-LQ?H KE . -. __
BILLINGS MONTANA JUNE 241983 15-600-12e
Figure 57 - Sediment Disposition Curve

Table 1
HORIZONTAL AND VERTICAL CONTROL FORFRESNO RESERVOIR RESURVEY CONTRACT
Range PointNumber Marker Elevation Northing Easting
R1RR1LR2RR2LR3RR3LR4RR4LR5RR5LR6RR6LR7RR7LR8RR8LR9RR9LR1ORR1OLR11RR11LR12RR12LR13RR13LR14RR14LR15RR15LR16RRl 6LRi 7RRi 7LRi 8RR18LRi 9RRi 9LR2 ORR2 OLR2 1RR21LR22RR2 2L
(R4OL)(R5OR)(R4OR)(R5OL)
(R6 OL)
(R7 OL)
(R7OR)
(R8OL)
Alum. CapAlum. Cap3/41t Rebar
3/4" Rebar
Alum. Cap
Alum. Cap
Alum. Cap
Alum. Cap
Alum. Cap
Alum. Cap
Brass Cap
Brass3/4,'3/4,,Alum.Alum.3/4"3/4,,3/4"3/4',BrassBrassAlum.Alum.Alum.Alum.3/4,,3/4,'BrassBrassAlum.Alum.3/4,'3 / 4"Alum.Alum.3/4,,3 / 4"Alum.Alum.BrassBrass3/4,,3/4',
CapRebarRebarCapCap
RebarRebarRebarRebarCapCapCapCapCapCap
RebarRebarCapCapCapCap
RebarRebarCapCap
RebarRebarCapCapCapCap
RebarRebar
2588.02631.52633.62609.62619.52614.72598.82627.82594.42642.32649.92633.92638.82669.62647.72672.32676.32678.12682.62688.92678.32704.42679.22722.92697.92713.42712.12721.12708.02737.62707.92586.72700.72694.42696.82675.62645.02674.72667.72684.82681.02680.52688.92673.5
582,938.6585,204.8584,240.0586,184.8588,425.0588,054.0591,679.6593,214.9595,374.7595,940.6598,435.1598,428.2600,999.1601,995.8603,644.7604,175.9606,191.3607,400.1609,603.0610,405.4611,678.3614,029.4613,939.3617,423.9617,212.0618,884.3619,277.0621,295.2621,197.2624,506.6622,622.0626,401.1621,707.6624,290.2621 ,623.1625,671.7625,242.9626,779.2628,556.4629,330.4632,006.6635,066.8632,655.5635,431.5
1,890,911.41,891,913.31,887,173.21,889,466.01,886,039.41,888,711.71,883,592.01,888,540.71,884,398.81,888,034.11,884,828.71,887,459.81,884,385.51,886,857.81,882,340.51,886,222.31,881,755.31,884,114.11,880,713.01,883,920.11,879,837.31,882,387.61,877,675.21,879,521.31,874,047.81,877,016.61,872,029.31,874,416.01,868,232.11,871,324.11,866,096.91,865,884.91,863,700.91,862,130.71,859,865.71,860,481.71,856,708.71,859,335.01,853,738.01,858,404.41,852,849.41,855,924.11,851,521.01,853,688.7
69

Table 1(continued)
HORIZONTAL AND VERTICAL CONTROL FORFRESNO RESERVOIR RESURVEY CONTRACT
Range PointNumber Marker Elevation Northing Easting
R23R (R9OR) Alum. Cap 2605.5 633,572.0 1,847,783.0R23L Alum. Cap 2645.8 636,344.2 1,849,610.7R24R 3/4" Rebar 2644.0 637,818.4 1,844,056.9R24L 3/4" Rebar 2654.8 638,071.7 1,849,155.9R25R Brass Cap 2692.6 641,051.5 1,843,039.7R25L Brass Cap 2677.2 .640,989.1 1,849,371.6R26R 3/4" Rebar 2652.9 644,778.9 1,843,312.9R26L 3/4" Rebar 2623.6 644,627.5 1,847,740.4R27R Alum. Cap 2638.7 647,487.0 1,842,459.4R27L Alum. Cap 2640.8 648,090.2 1,847,176.9R28R 3/4" Rebar 2614.1 650,154.1 1,842,852.8R28L Alum. Cap 2591.6 651,599.3 1,847,015.9R29R Alum. Cap 2627.6 654,177.8 1,844,431.2R29L Alum. Cap 2593.8 654,274.6 1,846,615.3R3OR Alum. Cap 2592.9 656,966.5 1,846,885.9R3OL Alum. Cap 2652.6 657,379.1 1,847,753.2R31R Alum. Cap 2595.0 659,952.6 1,845,191.2R31L Alum. Cap 2592.6 660,048.4 1,846,319.4R32R Alum. Cap 2599.4 663,606.3 1,843,303.9R32L Alum. Cap 2599.3 664,283.4 1,846,083.3R4OR (R4L) Alum. Cap 2627.8 593,214.9 1,888,540.7R4OL (R3L) Alum. Cap 2614.7 588,054.0 1,888,711.7R41R 3/4" Rebar 2632.0 590,222.0 1,892,301.6R41L 3/4" Rebar 2607.8 588,594.4 1,892,084.3R42R 314" Rebar 2612.2 590,078.8 1,894,256.8R42L 3/4" Rebar 2612.7 590,084.0 1,895,345.6R5OR (R4R) Alum. Cap 2598.8 591,679.6 1,883,592.0R5OL (R5R) Alum. Cap 2594.4 595,374.7 1,884,398.8R51R 3/4" Rebar 2618.6 594,978.3 1,881,633.4R51L 3/4" Rebar 2599.7 595,615.7 1,882,843.8R52R 3/4" Rebar 2631.1 596,238.5 1,880,355.1R52L 3/4" Rebar 2630.1 597,522.5 1,880,185.3R6OR Alum. Cap 2673.4 605,992.6 1,885,454.7R6OL (R8L) Alum. Cap 2672.3 604,175.9 1,886,222.3R61R 3/4" Rebar 2674.1 603,970.6 1,888,034.4R61L 3/4" Rebar 2675.3 603,412.5 1,887,216.5R62R 3/4" Rebar 2683.5 605,092.0 1,890,410.7R62L 3/4" Rebar 2683.5 603,799.2 1,890,612.6R7OR (R13L) Alum. Cap 2713.4 618,884.3 1,877,016.6R7OL (R12L) Alum. Cap 2722.9 617,423.9 1,879,521.3R71R 3/4" Rebar 2727.6 621,305.8 1,876,426.0R71L 3/4" Rebar 2731.0 622,001.9 1,877,392.3R8OR Alum. Cap 2689.5 626,367.5 1,864,063.7R8OL (R16L) Alum. Cap 2586.7 626,401.1 1,865,884.9
70

Table 1(continued)
HORIZONTAL AND VERTICAL CONTROL FORFRESNO RESERVOIR RESURVEY CONTRACT
Range PointNumber Marker Elevation Northing Easting
R9OR (R23R) Alum. Cap 2605.5 633,572.0 1,847,783.0R9OL Alum. Cap 2598.7 635,655.4 1,845,741.1R100R Alum. Cap 2664.7 652,626.3 1,841,317.6R100L Alum. Cap 2643.7 653,969.4 1,843,301.0
AERIAL PICTURE POINT ELEVATIONS
AerialPhoto No. Location
2338 Approx. 2000 feet south of 24 19 T. 33 N.,R. 13-14 E. 25 30
2341 Approx. 900 feet SW of R14R
Approx. 3200 feet West of R31R
Approx. 700 feet West of R11L
Elevation
2657.792X2 Hub
2707.982X2 Hub
2617.67
2714.292X2 Hub
71

TABLE 2 - AREA IN ACRES - 1-FOOT INCREMENTS
FRESNO RESERVOIR (ACM') COMPUtED03/21/84
1978 RESURVEY 1I.1L24.
AREA TABLE IN ACRES ELEVATION INCREMENT IS ONE FOOT
ELEVFEET 0 1 2 3 4 5 6 7 8 9
2520 1 8 48 132 2182530 275 371 461 548 643 784 978 1074 1146 12002540 1254 1358 1432 1467 1714 1753 1787 1821 1872 1961
2550 2040 2083 2128 2173 2224 2357 2485 2542 2603 26632560 2752 2842 2932 3022 3131 3237 3343 3448 3592 37482570 3904 4059 4241 4434 4627 4878 5102 5325 5548 58552580 6130 6296 6509 6721 7115 7397 7679 7825 8006 81872590 8369 8550 8825 9059 9293 9527
I t 1
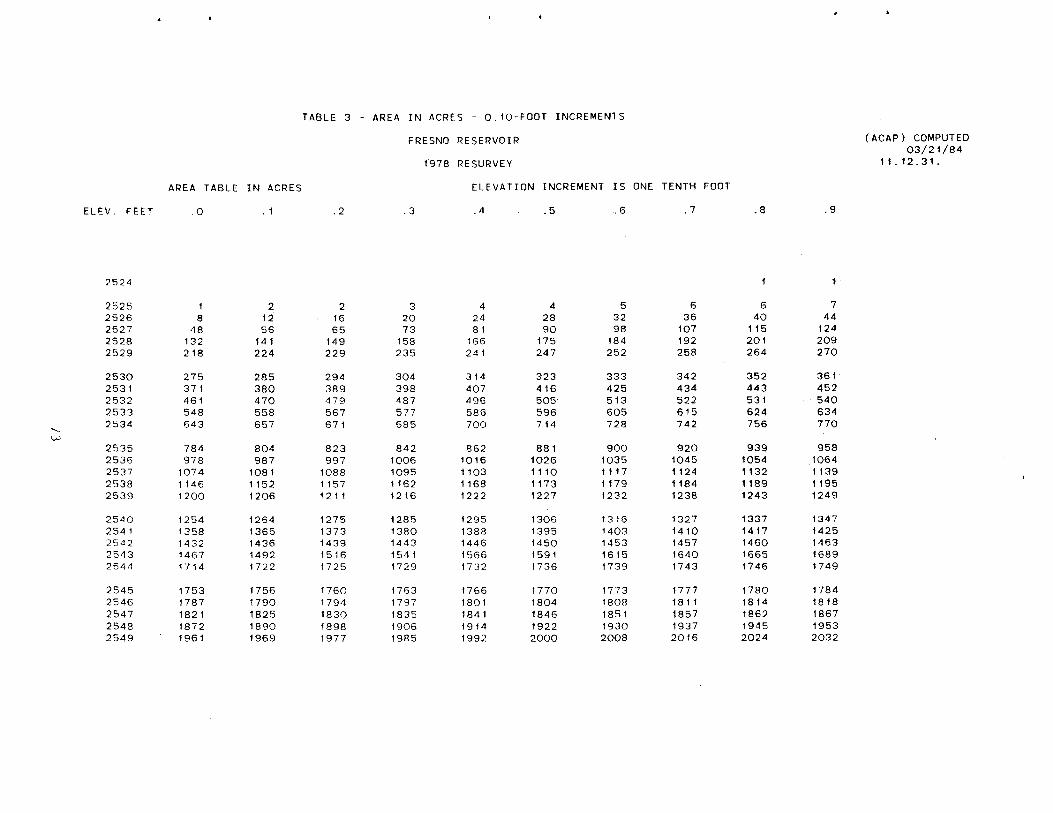
TABLE 3 - AREA IN ACRES - 0.10-FOOT INCREMENTS
FRESNO RESERVOIR
1978 RESURVEY
AREA TABLE IN ACRES ELEVATION INCREMENT IS ONE TENTH FOOT
ELEV. FEET .0 .1 .2 .3 .4 .5 .6 .7 8 .9
2524 1
2525 I 2 2 3 4 4 5 6 6 72526 8 12 16 20 24 28 32 36 40 442527 48 56 65 73 81 90 98 107 115 1242528 132 141 149 158 166 175 184 192 201 2092529 218 224 229 235 241 247 252 258 264 270
2530 275 285 294 304 314 323 333 342 352 3612531 371 380 389 398 407 416 425 434 443 4522532 461 470 479 487 496 505 513 522 531 5402533 548 558 567 577 586 596 605 615 624 6342534 643 657 671 685 700 714 728 742 756 770
2535 784 804 823 842 862 881 900 920 939 9582536 978 987 997 1006 1016 1026 1035 1045 1054 10642537 1074 1081 1088 1095 1103 1110 1117 1124 1132 11392538 1146 1152 1157 1162 1168 1173 1179 1184 1189 11952539 1200 1206 1211 1216 1222 1227 1232 1238 1243 1249
2540 1254 1264 1275 1285 1295 1306 1316 1327 1337 13472541 1358 1365 1373 1380 1388 1395 1403 1410 1417 14252542 1432 1436 1439 1443 1446 1450 1453 1457 1460 14632543 1467 1492 1516 1541 1566 1591 1615 1640 1665 16892544 1714 1722 1725 1729 1732 1736 1739 1743 1746 1749
2545 1753 1756 1760 1763 1766 1770 1773 1777 1780 17842546 1787 1790 1794 1797 1801 1804 1808 1811 1814 18182547 1821 1825 1830 1835 1841 1846 1851 1857 1862 18672548 1872 1890 1898 1906 1914 1922 1930 1937 1945 19532549 1961 1969 1977 1985 1992 2000 2008 2016 2024 2032
(ACAP) COMPUTED03/21/84
11.12.31.

TABLE 3 - CONTINUED
FRESNO RESERVOIR (ACAP) COMPUTED03/21/84
1978 RESURVEY l.12.31.
AREA TABLE IN ACRES ELEVATION INCREMENT IS ONE TENTH FOOT
ELEV. FEET .0 .1 .2 .3 .4 .5 .6 .7 .8 .9
2550 2040 2043 2047 2052 2056 2061 2065 2070 2074 20792551 2083 2088 2092 2097 2101 2106 2110 2115 2119 21242552 2128 2133 2137 2142 2146 2151 2155 2160 2164 21692553 2173 2173 2177 2183 2189 2195 2201 2206 2212 22182554 2224 2241 2254 2267 2280 2293 2305 2318 2331 2344
2555 2357 2369 2382 2395 2408 2421 2433 2446 2459 24722556 2485 2488 2494 2500 2506 2512 2518 2524 2530 25362557 2542 2548 2554 2561 2567 2573 2579 2585 2591 25972558 2603 2609 2615 2621 2627 2633 2639 2645 2651 26572559 2663 2671 2680 2689 2698 2707 2716 2725 2734 2743
2560 2752 2761 2770 2779 2788 2797 2806 2815 2824 28332561 2842 2851 2860 2869 2878 2887 2896 2905 2914 29232562 2932 2941 2950 2959 2968 2977 2986 2995 3004 30132563 3022 3036 3046 3057 3067 3078 3089 3099 3110 31202564 3131 3141 3152 3163 3173 3184 3194 3205 3216 3226
2565 3237 3247 3258 3268 3279 3290 3300 3311 3321 33322566 3343 3353 3364 3374 3385 3395 3406 3417 3427 34382567 3448 3452 3467 3483 3498 3514 3530 3545 3561 35762568 3592 3607 3623 3639 3654 3670 3685 3701 3717 37322569 3748 3763 3779 3795 3810 3826 3841 3857 3872 3888
2570 3904 3919 3935 3950 3966 3982 3997 4013 4028 40442571 4059 4068 4087 4107 4126 4145 4164 4184 4203 42222572 4241 4261 4280 4299 4319 4338 4357 4376 4396 44152573 4434 4453 4473 4492 4511 4531 4550 4569 4588 46082574 4627 4677 4700 4722 4744 4767 4789 4811 4834 4856
2575 4878 4901 4923 4945 4968 4990 5012 5035 5057 50792576 5102 5124 5146 5169 5191 5213 5236 5258 5280 53032577 5325 5347 5370 5392 5414 5437 5459 5481 5504 55262578 5548 5608 5636 5663 5691 5718 5745 5773 5800 58282579 5855 5883 5910 5938 5965 5992 6020 6047 6075 6102

U-i
TABLE 3 - CONTINUED
FRESNO RESERVOIR
1978 RESURVEY
AREA TABLE IN ACRES ELEVATION INCREMENT IS ONE TENTH FOOT
ELEV. FEET .0 .1 .2 .3 .4 .5 .6 .7 .8 .9
2580 6130 6130 6130 6148 6169 6190 6211 6233 6254 62752581 6296 6318 6339 6360 6381 6403 6424 6445 6466 64882582 6509 6530 6551 6573 6594 6615 6636 6658 6679 67002583 6721 6862 6890 6918 6946 6975 7003 7031 7059 70872584 7115 7144 7172 7200 7228 7256 7284 7313 7341 7369
2585 7397 7425 7453 7482 7510 7538 7566 7594 7622 76512586 7679 7679 7680 7698 7716 7734 7752 7770 7789 78072587 7825 7843 7861 7879 7897 7915 7934 7952 7970 79882588 8006 8024 8042 8061 8079 8097 8115 8133 8151 81692589 8187 8206 8224 8242 8260 8278 8296 8314 8332 8351
2590 8369 8387 8405 8423 8441 8459 8478 8496 8514 85322591 8550 8615 8638 8662 8685 8708 8732 8755 8779 88022592 8825 8849 8872 8895 8919 8942 8966 8989 9012 90362593 9059 9082 9106 9129 9153 9176 9199 9223 9246 92692594 9293 9316 9340 9363 9386 9410 9433 9456 9480 9503
(ACAP) COMPUTED03/21/84
11. 12.31.
2595 9527

TABLE 4 - CAPACITY IN ACRE-FEET - I-FOOT INCREMENTS
FRESNO RESERVOI R
1978 RESURVEY
CAPACITY TABLE IN ACRE FEET ELEVATION INCREMENT IS ONE FOOT
ELEV.FEET 0 I 2 3 4 5 6 7 8 9
2520 0 4 32 122 2972530 544 867 1283 1788 2383 3097 3978 5004 6114 72872540 8514 9820 11215 12664 14255 15990 17760 19564 21409 23329
2550 25329 27386 29492 31643 33835 36127 38548 41059 43632 462652560 48976 51773 54660 57637 60726 63910 67199 70595 74116 777862570 81612 85593 89752 94090 98620 103397 108387 113600 119037 1247572580 130750 136945 143345 149963 156936 164193 171731 179460 187375 1954722590 203750 212209 220919 229861 239037 248447
K *
(ACAP) COMPUTED03/21/84
II. 1L24.

TABLE 5 - CAPACITY TABLE IN ACRE-FEET - 0.10-FOOT INCREMENTS
FRESNO RESERVOIR (ACAP) COMPUTED03/21/84
1978 RESURVEY 11.12.31.
CAPACITY TABLE IN ACRE FEET ELEVATION INCREMENT IS ONE TENTH FOOT
ELEV. FEET .0 .1 .2 .3 .4 5 .6 .7 .8 .9
2524 0 0
2525 0 0 0 1 I 1 2 2 3 4
2526 4 5 7 9 II 13 16 20 23 28
2527 32 37 43 50 58 67 76 86 97 tog
2528 122 136 150 166 182 199 217 236 255 276
2529 297 319 342 365 389 413 438 464 490 517
2530 544 572 601 631 662 693 726 760 795 830
2531 867 904 943 982 1022 1064 1106 1149 1192 1237
2532 1283 1329 1377 1425 1474 1524 1575 1627 1680 1733
2533 1788 1843 1899 1956 2015 2074 2134 2195 2257 23202534 2383 2448 2515 2583 2652 2723 2795 2868 2943 3019
2535 3097 3176 3258 3341 3426 3513 3602 3693 3786 3881
2536 3978 4076 4175 4276 4377 4479 4582 4686 4791 48972537 5004 5111 5220 5329 5439 5550 5661 5773 5886 59992538 6114 6228 6344 6460 6576 6693 6811 6929 7048 7167
2539 7287 7407 7528 7649 7771 7894 8017 8140 8264 8389
2540 8514 8640 8767 8895 9024 9154 9285 9417 9550 9684
2541 9820 9956 10093 10230 10369 10508 10648 10788 10930 11072
2542 11215 11358 11502 11646 11791 11935 12080 12226 12372 12518
2543 12664 12812 12963 13116 13271 13429 13589 13752 13917 140852544 14255 14426 14598 14771 14944 15118 15291 15465 15640 15815
2545 15990 16165 16341 16517 16694 16870 17048 17225 17403 115812546 17760 17938 18118 18297 18477 18657 18838 19019 19200 193822547 19564 19745 19928 20111 20295 20480 20664 20850 21036 212222548 21409 21596 21785 21976 22167 22358 22551 22744 22938 231332549 23329 23526 23723 23921 24120 24319 2d520 24721 24923 25126

TABLE 5 - CONTINUED
FRESNO RESERVOIR (ACAP) COMPUTED03/21/84
1978 RESURVEY 11.12.31.
CAPACITY TABLE IN ACRE FEET ELEVAT ION INCREMENT IS ONE TENTH FOOT
ELEV. FEET .0 .1 .2 .3 .4 .5 .6 .7 .8 .9
2550 25329 25529 25734 25939 26144 26350 26557 26763 26970 271782551 27386 27595 27804 28013 28223 28434 28644 28856 29067 292792552 29492 29705 29919 30133 30347 30562 30777 30993 31209 314262553 31643 31857 32075 32293 32511 32731 32950 33171 33392 336132554 33835 34058 34283 34509 34736 34965 35195 35426 35658 35892
2555 36127 36363 36601 36840 37080 37321 37564 37808 38053 383002556 38548 38795 39044 39294 39544 39795 40047 40299 40552 408052557 41059 41313 41569 41824 42081 42338 42595 42853 43112 433722558 43632 43892 44153 44415 44678 44941 45204 45468 45733 459992559 46265 46536 46804 47072 47342 47612 47883 48155 48428 48702
2560 48976 49252 49528 49806 50084 50363 50644 50925 51207 514892561 51773 52058 52343 52630 52917 53205 53494 53784 54075 543672562 54660 54954 55248 55544 55840 56137 56435 56734 57034 573352563 57637 57951 58255 58560 58866 59173 59482 59791 60102 604132564 60726 61039 61354 61670 61987 62304 62623 62943 63264 63586
2565 63910 64234 64559 64885 65213 65541 65871 66201 66533 668652566 67199 67534 67870 68207 68545 68884 69224 69565 69907 702502567 70595 70947 71293 71640 71989 72340 72692 73046 73401 737582568 74116 74476 74838 75201 75566 75932 76300 76669 77040 774122569 77786 78162 78539 78918 79298 79680 80063 80448 80834 81222
2570 81612 82003 82396 82790 83186 83583 83982 84383 84785 851882571 85593 86012 86420 86830 87241 87655 88070 88488 88907 893282572 89752 90177 90604 91033 91464 91896 92331 92768 93207 936472573 94090 94534 94980 95428 95879 96331 96785 97241 97699 981582574 98620 99097 99566 100037 100510 100986 101464 101944 102426 102910
2575 103397 103886 104377 104871 105366 105864 106364 106867 107371 1078782576 108387 108898 109412 109928 110446 110966 111488 112013 112540 1130692577 113600 114134 114670 115208 115748 116291 116836 117383 117932 1184832578 119037 119599 120161 120726 121294 121864 122437 123013 123592 1241732579 124757
4
125344 125934 126526 127121
I
127719
9
128320 128923 129529 130138

S-i
TABLE 5 - CONTINUED
FRESNO RESERVOIR
1978 RESURVEY
CAPACITY TABLE IN ACRE FEET ELEVATION INCREMENT IS ONE TENTH FOOT
ELEV. FEET .0 .1 .2 3 .4 .5 .6 .7 .8 .9
2580 130750 131364 131976 132590 133205 133823 134443 135066 135690 136316
2581 136945 137576 138209 138843 139481 140120 140761 141405 142050 142698
2582 143348 144000 144654 145310 145968 146629 147291 147956 148623 149292
2583 149963 150647 151334 152025 152718 153414 154113 154814 155519 156226
2584 156936 157649 158365 159084 159805 160529 161256 161986 162719 163454
2585 164193 164934 165678 166424 167174 167926 £68682 169440 170200 170964
2586 171731 172491 173258 174027 174797 175570 £76344 177120 177898 £78678
2587 179460 180243 181028 £81815 182604 183395 184187 184981 185777 186575
2588 187375 188177 188980 189785 190592 191401 192211 193024 193838 194654
2589 195472 196291 197113 197936 198761 199588 200417 201247 202080 202914
2590 203750 204588 205427 206269 207112 207957 208804 209652 210503 211355
2591 212209 213071 213934 214799 215666 216536 217408 218282 219159 220038
2592 220919 221803 222689 223577 224468 225361 226257 227154 228054 228957
2593 229861 230769 231678 232590 233504 234420 235339 236260 237183 238109
2594 239037 239968 240901 241836 242773 243713 244655 245600 246546 247496
2595 248447
(ACAP) COMPUTED
03/2 1/84II. 12.31.
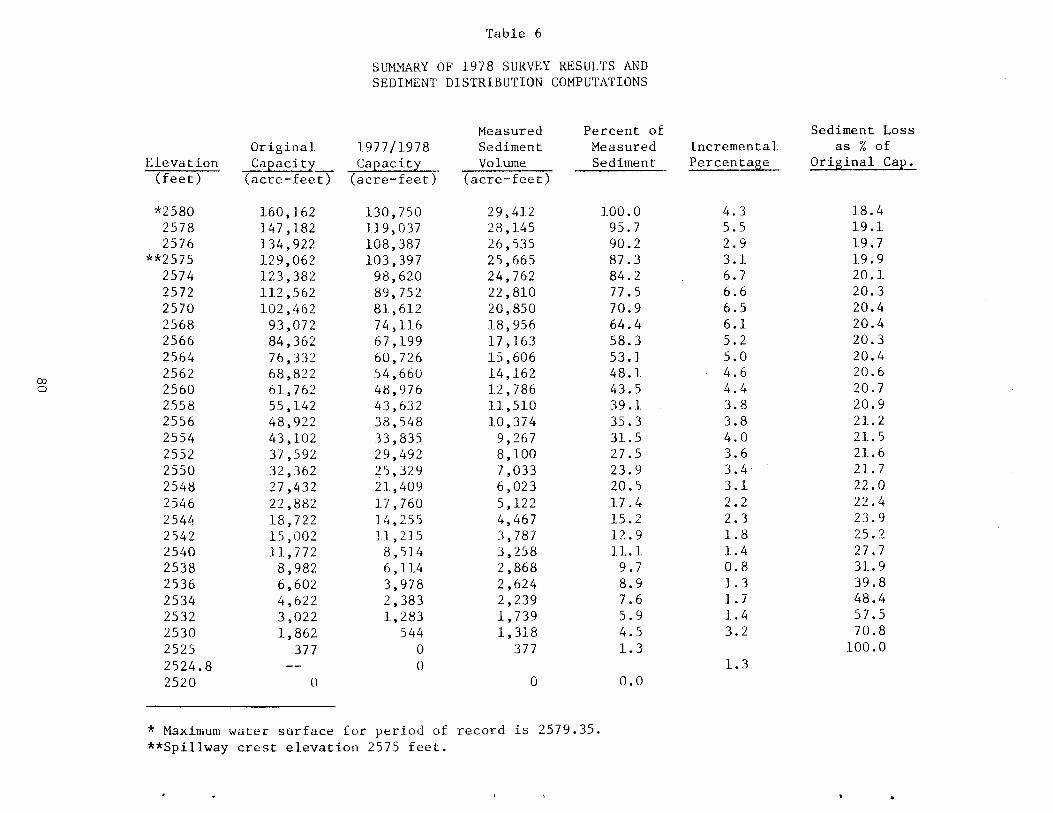
Table 6
OD
SUMMARY OF 1978 SURVEY RESULTS ANDSEDIMENT DISTRIBUTION COMPUTATIONS
Measured Percent of Sediment LossOriginal 1977/1978 Sediment Measured Incremental as % of
Elevation Capacity Capacity Volume Sediment Percentage Original Cap.(feet) (acre-feet) (acre-feet) (acre-feet)
*2580 160,162 130,750 29,412 100.0 4.3 38.42578 147,182 319,037 28,145 95.7 5.5 19.12576 134,922 108,387 26,535 90.2 2.9 19.7
**2575 129,062 103,397 25,665 87.3 3.1 19.92574 123,382 98,620 24,762 84.2 6.7 20.12572 112,562 89,752 22,810 77.5 6.6 20.32570 102,462 81,612 20,850 70.9 6.5 20.42568 93,072 74,116 18,956 64.4 6.1 20.42566 84,362 67,199 17,163 58.3 5.2 20.3
2564 76,332 60,726 15,606 53.1 5.0 20.4
2562 68,822 54,660 14,162 48.1. 4.6 20.6
2560 61,762 48,976 12,786 43.5 4.4 20.72558 55,142 43,632 11,510 39.1 3.8 20.92556 48,922 38,548 10,374 35.3 3.8 21.2
2554 43,102 33,835 9,267 31.5 4.0 21.5
2552 37,592 29,492 8,100 27.5 3.6 21.6
2550 32,362 25,329 7,033 23.9 3.4 21.7
2548 27,432 21,409 6,023 20.5 3.1 22.0
2546 22,882 17,760 5,122 17.4 2.2 22.4
2544 18,722 14,255 4,467 15.2 2.3 23.9
2542 15,002 11,215 3,787 12.9 1.8 25.2
2540 11,772 8,514 3,258 11.1 1.4 27.7
2538 8,982 6,114 2,868 9.7 0.8 31.9
2536 6,602 3,978 2,624 8.9 1.3 39.8
2534 4,622 2,383 2,239 7.6 1.7 48.4
2532 3,022 1,283 1,739 5.9 1.4 57.5
2530 1,862 544 1,318 4.5 3.2 70.8
2525 377 0 377 1.3 100.0
2524.8 -- o 1.3
2520 0 0 0.0
* Maximum water surface for period of record is 2579.35.**Spjllway crest elevation 2575 feet.
4

Table 7 Reservoir Sediment Data Summary
Fresno Reservoir
NAME OF RESERVOIR
1. OWNER Department of Tnt USBR 2. STREAM Milk River 3 STATE Montana. .
4. SEC. 19 TWP. 33 N RANGE 14 E 5, NEAREST P 0. Havre MT 6 COUNTY Hill, .
-
7. LAT48 36 ' 30" LONG.109° 56 50" 8. TOP OF DAM ELEVATION 2596.1 9. SPILLWAY CREST ELEV. 2575 * 010. STORAGE 11. ELEVATION 12. ORIGINAL 13. ORIGINAL 14. GROSS STORAGE, 15. DATE
ALLOCATION TOP OF POOL SURFACE AREA. ACRES CAPACITY ACRE-FEE ACRE-FEET STORAGE BEGAN
a. FLOOD CONTROL
b. MULTIPLE USE 2515.0 5757 4043fl 17Qflf7 Noy 1939> a. POWER
.____________
d.WATER SUPPLY______________ ______________ MAL OPER BEGAN
e. IRRIGATION_____________ _______________ .
f. CONSERVATION 2567.0 4374 R6770 RR fZ37g. INACTIVE 2530.0 505 1.862 1:862
Apr. 1943
17. LENGTH OF RESERVOIR 15 MILES1 AV. WIDTH OF RESERVOIR 0.5 MILES
18. TOTAL DRAINAGE AREA 3,766 SQ. MI. 22. MEAN ANNUAL PRECIPITATION 13 INCHES
19. NET SEDIMENT CONTRIBUTING AREA 3 ,096 SQ. MI. 23. MEAN ANNUAL RUNOFF 0. 74 INCHES
20. LENGTH 269 MILES 'AV. WIDTH 15.5 MILES 24. MEAN ANNUAL RUNOFF 149 000 11 AC..FT.
21. MAX. ELEV. 6,000 ft. MIN. ELEV, 2500 ft. .ANNUAL TEMP. MEAN 42 RANGE 56 to 10926 DATE OF 27. 28. { 29. TYPE OF 30. NO. OF RANGES 31. SURFACE 32. CAPACITY, 33. C/I. RATIO,
SURVEYD ACCL. SURVEY OR CONTOUR INT. AREA, ACRES ACRE-FEET AC..FT. PER AC..FT.
Nov. 1939 0 0 Contour 5 ft. 5757 129,062 0.87
June 1978 38.7 38.7 Range 223 4878 103,397 0.69
26 DATE OF 35. PERIOD WATER INFLOW ACRE-FEET WATER NFL36 TO DATE AC FT. , . . , - .SURVEY PRECIPITATION a. MEAN ANNUAL b. MAX. ANNUAL a. PERIOD TOTAL a. MEAN ANNUAL b. TOTAL TO DATE
June 1978 11.7 271,160 389,100 10,575,256 271,160 10,575,256
I.-
0>.
26. DATE OF 37. PERIO D CAPACI_LOSS,_ACRE-FEET 38. TOTAL SED. DEPOSITS TO DATE, ACRE-FEETSURVEY a. PERIOD TOTAL b. AV. ANNUAL c.PER SQ. MI.-YEAR aTOTAL TO DATE b. AV. ANNUAL a. PER SQ. MI,.YEAR
June 1978 25,665 663.2 0.214 25,665 663.2 0.2142/(32,912) (850.4) (0.275) (32,912) (850.4) (0.275)
26. DATE OF 39. AV. DRY WGT., 40.SED. DEP..TONSPERSQ. MI-YR. 41.STORAGE LOSS. PCT. 42. SED. INFLOW. PPMSURVEY 5, PER CU, a. PERIOD b. TOTAL TO DATE a.AV. ANN. b. TOT.TODATE a. PERIOD b. TOT. TO DATE
June 1978 unknown unknown unknown .51 19.89 unknown unknown
81

Table 7 - Continued
DATE OF2643. DEPTH DESIGNATION RANGE IN FEET BELOW, AND ABOVE, CREST ELEVATION
. SURVEY I I I I I I IPERCENT OF TOTAL SEDIMENT LOCATED WITHIN DEPTH DESiGNATION
June 1978 12.7 16.4 15.2 12.2 10.1 9.5 7.6 5.2 2.9 3.8 3.2 1.3
44. REACH DESI GNATION PERCE NT OF TOTAL ORIGINAL LE NGTH OF RESERVOIR26. DATE OFSURVEY 0-10 10-20 20-30 30-40 40-50 50-60 60-70 70-80 80-90 90-100 -1051 110j _115 _120j -125
PERCENT_OF TOTAL_SEDIMENT LOCATED WITHIN REACH DESIGNATION____
45. RANGE IN RESERVOIR OPERATION
WATER YEAR MAX, ELEV. MIN. ELEV. INFLOW. AC-FT. WATER YEAR MAX, ELEV. MIN. ELEV. INFLOW. AC-FT.
1940 2548.82 2531.23 175,183 1953 2576.35 2563.40 379,9781941 2549.45 2540.15 151,268 ' 1954 2576.25 2564.35 256,8491942 2567.60 2541.95 265,057 1955 2576.35 2564.00 268,3251943 2573.50 2554.80 246,592 1956 2575.30 2561.90 249,2231944 2564.80 2554.30 128,876 1957 2575.75 2560.55 258,8831945 2564.05 2553.45 217,566 1958 2574.70 2549.70 296,0201946 2560.70 2554.95 229,973 1959 2576.35 2548.35 349,2731947 2576.60 2558.15 310,160 1960 2576.25 2553.85 308,2561948 2576.10 2563.10 297,150 1961 2558.20 2533.25 216,3541949 2564.10 2540.30 241,312 1962 2564.25 2542.20 252,9961950 2560.95 2538.30 263,032 1963 2562.15 2551.00 248,6971951 2575.90 2561.70 275,965 1964 2571.45 2552.25 272,8611952 2579.35 2557.00 320,657 1965 2577.90 2560.85 344.200
46. ELEVATION-AR EA-CAPACITY DATA
ELEVATION AREA CAPACITY ELEVATION AREA CAPACITY ELEVATION AREA CAPACITY
2595 9527 248447 2550 2040 253292590 8369 2 03750 2545 1753 159902585 7397 1 64193 2540 1254 85142580 6130 130750 2535 784 30972575 4878 103397 2530 275 5442570 3904 81612 2525 1 02565 3237 63910 2520 0 02560 2752 489762555 2357 36127
47. REMARKS AND REFERENCE S
1/ 137 ,000 AF additional from St. Narys Canal
2/ To elevation 25 90.0
48. AGENCY M AKING SURVEY
49. AGENCY SUPPLYING DATA 50 . DATE April 1984
Ar 966

Table 7 - Continued
DATE OF2643. DEPTH DESIGNATION RANGE IN FEET BELOW, AND ABOVE, CREST ELEVATION
.SURVEY I I I I I
PERCENT OF TOTAL SEDIMENT LOCATED WITHIN DEPTH DESIGNATION
26. DATE OF REACH DESIGNATION PERCENT OF TOTAL ORIGINAL LENGTH OF RESERVOIR
SURVEY 0-10 J 10-20 20-301 30-40 40-50 50-60! 60-70 70-80 180-90 90-100 -105! _110I -115! -1201 -125
_____________ _____PERCENT OF TOTAL_SEDIMENT LOCATE D WITHIN REACH DESIGNATION_
45. RANGE IN RESERVOIR OPERATIONWATER YEAR MAX. ELEV. MIN. ELEV. INFLOW. AC.FT. WATER YEAR MAX. ELEV. MIN. ELEV. INFLOW, AC..FT.
1966 2575.80 2569.25 272,0001967 2576.80 2560.50 389,1001968 2571.40 2561.95 285,7001969 2576.30 2565.00 331,5001970 2575.22 2561.38 221,3001971 2574.55 2543.21 248,0001972 2575.20 2552.15 361,6001973 2568.40 2543.35 177,3001974 2575.75 2540.10 274,0401975 2577.45 2564.75 319,4001976 2575.60 2559.50 286,50019771978
2565.202577.25
2540.55254'L75
115,600318,600 __________
46.___________ __________ ___________
ELEVATION-AREA-CAPACITY DATA
ELEVATION AREA CAPACITY ELEVATION AREA CAPACITY ELEVATION AREA CAPACITY
47. REMARKS AND REFERENCES
45. AGENCY MAKING SURVEY
L..CENCY SUPPLYING DATA 50. DATE April 1984
0') AorI 966

PRELIMINARY Table 8 PRELIMINARY
---
---------- ------------ ------- -------
_______________________________
RESERVOIR CAPACITY ALLOCATIONS
ITYPE OF DAM Homogeneous Earthf ill JREGION UN ISTATE Montana173?ATED BY Bureau of Reclamation Fresno RESERVOIRCREST LENGTH2,O7OFT; CREST WIDTH 22 FT Fresno DAMVOLUME OF DAM 2,105,000 CUYD Milk River PROJECTCONSTRUCTION PERIOD 1937-1939 DIVISIONSTREAM Milk River
-
UNITRESAREA 4,878 ACRESATEL 2575 Operational STATUSOFDAMORIGINATED BY: APPROVED BY:
(Initials) (Code) (bate) (Inttials) (Code) (Date)
CREST OF DAM (without camber) EL_
FREEBOARDI - .. 3.2 j-
', t i MAXIMUM WATERSURFACE2
EL99-___________
I I
c r-l cI cI SURCHARGEN-
"H CO125,560 A.F._______________
I TOP OF EXCLUSIVE FLOOD CONTROL ELI ° 1I -r rIQI
II
EXCLUSIVEFLOODCONTROL
-4II -1I -III II I A.F.
I I I TOPOFJOINTUSE 2575.0ELI I
_- - - -
IJOINT USE
>.
' i iUSES: F.C.--
32,802 A.F.a TOPOFACTIVECONSERVATION
- 0- - -' -
_______________________________
ACTIVEr iU) U CONSERVATION2 00 USES:
/I.J 1</jTOPOFINACTIVE()
70,051 A.F._____________
II INACTIVEI
- Z I - AF.5 TOPOFDEAD 2530.0ELE I I
DEAD544 AF.
STREAMBED AT DAM AXIS 2518.0EL__
2436.0LOWEST POINT OF FOUNDATION EXCAVATION EL
() Includes... a.f. allowance for year sediment deposition betweenstreambedandEL ,ofwhich_ a.f. isaboveEl
() Established byREFERENCES AND COMMENTS:
1/ Crest profile survey, 1968
2/ Modpuls routing of revised 1967 IDF
Data from 1978 sediment resurveySpecifications No. 692Drawing No. 16-604-1 (Rev.)
84