from a network of calculators to collaborative knowledge ... education technology research... ·...
TRANSCRIPT

1
From a network of calculators to collaborative knowledge construction in the class
Laurent HIVON, Manuel PEAN and Luc TROUCHE1
Abstract The secondary school experiment with a network of calculators by the IREM Orléans group in partnership with INRP was intended to design new mathematical situations and instrumental orchestrations involving collective class intelligence. This article describes the stages of this work and shows how the theoretical concepts of collaborative work instrumental genesis and reflective practice led to better understanding of what was involved in the experiment. Key words Calculators, network, function, graphical representation, instrumental orchestration, didactic management of artifacts, mutual working, collaborative working, co-operative working, reflectivity. Introduction
In Strasbourg on 21st May 2006, Manuel Péan and Laurent Hivon from the Orléans-Tours
IREM group – a group associated with INRP under the name CROME2 - attended the closing discussion of the inter-IREM mathematics-informatics workshop dedicated to the DWS (Digital Workspace3). After facilitating a workshop presenting their initial activities with a network of calculators they struggled to find their place in the deliberations about the subject of DWS. The workshops and conferences which these study days facilitated were interesting and provided more detail on their research questions, but what was the merit of presenting a workshop on networked calculators in a seminar dedicated to DWS ? Their group had certainly laboured for several months to establish this network which was technologically not readily compatible with the French environment, and the antivirus, anti-worm and other firewall software did not readily accept it. Despite everything the classes’ first activities began. It was at this time when it gradually emerged during these study days that there were still few mathematical activities linked to DWS (mostly linked to administrative activities within the educational institutions), that their views changed. They have access to situations where the collective class intelligence contributed within the class space (should this be called DWS?) and was profoundly changed by the networking process. This article presents this experiment, firstly by describing its context and then presenting a situation proposed to a second grade class and finally describing the parts of the theoretical framework which formed the background to it.
1. The research project
Calculators are still used individually in class both by pupil and teacher. The idea that working in small groups however may be beneficial in teaching mathematics is increasing, although it is still difficult to successfully make pupils work in the same workspace without sending several pupils to the blackboard at the same time, with all the incumbent perceived or actual difficulties. Some collective used (for example statistics) can undoubtedly develop in classes through the use of a simple data sharing tool or by using a network syllogisms in modelling, sending programmes to 1 Laurent Hivon and Manuel Péan, CROME group (Orléans-Tours IREM and INRP), Luc Trouche, EducTice (INRP) and LEPS (University of Lyon) 2 CROME: Calculators in Network, Orchestrations and Mutual working in the new Environment (http – CROME) 3 DWS: according to the Wikipedia, “a DWS describes a global device providing the user with a networked access point to all digital resources and services associated with its activity. (...)”

2
all of the class calculators or collectively visualising our pupils’ individual work. Until now, however, this type of mutual sharing practice remained impossible in standard calculator environments. It is in this context that the new device, TI-Navigator4, enabling up to 32 calculators to operate in a network, considerably changes the possibilities for mutual working in mathematics work in a class. 1.1 Group
The CROME group (Calculators in Network: Orchestrations and mutual working in a new Environment, http – CROME) which groups together 6 secondary school teachers5, was formed to experiment on this new environment. The experiment was conducted in three classes (second, S terminal and ES) in four Secondary Schools of the Orléans-Tours Academy. It relies on a partnership between the Orléans-Tours IREM and INRP, Luc Trouche following the group’s work, and supported for equipment provision by Texas Instruments. The experiment was also supported by Yves Olivier from the Regional Mathematics Educational Inspectorate. With long experience in the use of technology in class, the members of the CROME group have already designed many resources, in particular an interactive animation CD rom, available on the Orléans IREAM website (http – e-cureuil), with the support of SDTICE (Sub-Directorate of Technologies of the Ministry for National Education). The group leader, Laurent Hivon, underwent training on the TI-Navigator device in August 2005 in the United States and contacts were established with a member of the T3 group (http - Teachers Teaching with Technology) in Germany, responsible for training.
1.2 Objectives of the research
The CROME research had two hypotheses: - introduction of the TI-Navigator into the class assumes a fundamental updating of mathematic situations and instrumental orchestrations (Trouche, in Guin and Trouche 2002) enabling didactic management of the calculators and their network; - the reasoned application of the device could promote a change in the relationship between the pupil and the class group, facilitating the development of a scientific discussion (Legrand 1993) and the development of collaborative work (Dillenbourg 1999) in the class.
The group set itself objectives of constructing group and research activities to be used in this new class space and to analyse their effects retrospectively. In order to achieve this, it endeavoured to isolate different possible didactic configurations (collaborative working on the same graphical space, running collective work by a pupil group, etc.), to design situations and scenarios using these various didactic configurations, to trial them in several classes, to enrich them through an iterative process, to search for invariants across the wide range of uses.
4 This device, designed by Texas Instruments, is available in the United States and Canada and is in the experimental phase in several European countries, including France and Italy. Initial results have been presented in international meetings (Robutti et al, in press; Trouche and Hivon, in press). 5 Alain Rousset and Robert Domain (Pierre and Marie Curie Lycée - Chateauroux); Claude Perraud and Manuel Péan (Lycée Camille Claudel - Blois); Odile Maupu (Jacques Monod Lycée - Saint Jean de Braye); Laurent Hivon (Silvia Monfort Lycée - Luisant).

3
1.3 The TI-Navigator device
The TI-Navigator is a device enabling certain types of calculators to operate in a network. The calculators are linked in groups of no more than 4 (Figure 1), by cable to “hubs”, i.e. network nodes (Figure 2): the hubs communicate via wireless with a router box (“Access point”) which is linked by cable to a computer on which the software applications are loaded. the computer is connected to a video projector. Teacher Computer Video projector Hub Hub Hub
Figure 1. TI-Navigator in the class Figure 2. Equipment arrangement
Data flow (curve equations, matrices, lists of values, programmes, variables, etc.) pass through the access point. The teacher and pupil do not occupy symmetrical places in the device: - the teacher can send data to (or receive from) all of the other calculators (Figure 3); - it is not possible for a pupil to send data to another pupil.
The connection method for a pupil is simple: he/she connects his/her calculator to the hub, starts the navigation application in the network and then records the user name given to him/her by the professor and a password chosen by him/herself. The pupil can then work either in network mode or leave the network to access his/her own calculator’s functionalities or compare the results from the calculator and results from members of his/her group’s calculators directly (Figure 4).
Figure 3. Data flow in TI-Navigator Figure 4. Pupils working on TI-Navigator
The device incorporates many new technical developments including: - the ability to display all of the pupils’ calculators screens in quasi-real time (screen mosaic configuration); - the ability to display all of the pupils’ data, for example, points or curves, in a single identifier

4
(common identifier configuration, Figure 5); - a rapid consultation configuration enabling a class vote between two contradictory proposals, results to be prepared and the percentage results to appear immediately on the screen (illustration in Trouche and Hivon, in press).
These three configurations have the common property of establishing a common workspace on the class screen. The teacher can choose between several ways of using these configurations such as: - for the screen mosaic configuration, he/she can choose whether or not to display the name of the corresponding pupil on each screen; - for the common identifier configuration the teacher can decide whether or not to give the pupils the option to change their answer, make one or more uploads and whether or not to perform these uploads simultaneously. The name, equation and/or co-Y axis points of objects sent by the pupils can also be displayed (Figure 5).
Figure 5. Example of common screen configuration TI-Navigator can therefore in principle base a class practice on a common production and
more uniquely, on a collection of individual productions.
2. Description of class activity in the TI-Navigator environment
In this section we will describe the use of a mathematical situation in the TI-Navigator environment in a second grade class (29 pupils), whose teacher is one of the authors of this article, Manuel Péan. The pupils do not have the calculators all of the time: they are only loaned to them for the sessions using the TI-Navigator device. These sessions were observed by two members of the CROME group and were then analysed in an internal group question/discussion session.
2.1 Context and objectives of the session
The mathematical situation is as follows: “Where ABC is an isosceles triangle for A, such
that AB=AC= 10 cm, what is the area of the triangle”. In problem-structured mathematics training (Cazzaro et al 2001), the aim is to enable the
pupils to understand the fact that the area of the triangle varies and that is a function of the base BC.

5
It is therefore the concept of function, already encountered in third grade which is to be instilled using several registers which mutually feed each other: direct manipulation of objects, tables and values, an algebraic equation and primarily, the curve representing a function as a set of points, the co-Y axis points of which are linked by a common relationship. This therefore involves establishing a graphical medium (Bloch 2002) to introduce the functions.
The technological aim is to organise an initial work meeting (the equipment had already been presented in a previous session, although not used by the pupils), both with the graphical calculators and with networking. The experience gained by the group (Hivon 2006) allows the potentials to be achieved beneficially: - calculators to automate repeated calculations, construct a larger number of points in the identified plane and construct the curve of the function in question; - the network to examine the relevance of choices (such as window range) and results in a scientific discussion in order to allow the concept of the curve to be constructed collaboratively.
Didactic choices to manage the environment were made a priori: - using the calculator as a response to a problem posed … by the pupils. Initially the pupils were asked to perform the calculations manually, either using their rulers on the figures or by repeated use of Pythagoras theorem. This was done in such a way that because of the repeated laborious calculations the pupils would ask for a tool to allow the calculations to be done automatically. The calculator is one such tool which, to meet this need, requires knowledge of the formal relationship between the length BC and the area of the triangle; - using the table of values as bridges from pencil to the function. The use of tables of values allows the link between the work performed manually and the automated calculation to be made and introduces a functional relationship between two columns of numbers; - prioritising graphical representation of the function (instead of using a step reduction allowing increasingly close points to be constructed and therefore “tending” towards a “continuous” graphical curve). It appeared that the strategy of step reduction could lead the pupils to fixating on an increasing number of calculations and lose sight of the problem itself; - preparing conditions for discussion about the relevance of fenestration. The choice of fenestration is always difficult and remains a hard obstacle to overcome. It was decided here to set the window parameters of the different calculators before the session to different values from each other with the aim of creating conditions for a discussion about the choice of a “good” representation window.
In order to allow the development of a discussion and co-construction of solutions by the pupils, the question was left relatively open. Problem solving was spread over three sessions: an initial session lasting around twenty minutes, a second (one hour) session the next day and a third session (15 min) three days after the previous session.
2.2 Devolution of the problem and personal work (20 min)
In an initial phase the pupils’ research was purely individual and pencil and paper based. Following a request from a pupil, the equation to calculate the area of a triangle, and base and height data, were reviewed. After 10 minutes research the teacher asked the class to review their
6
working progress. One pupil commented that “you can’t draw the figure as information is missing”, another answered that, “that’s because it depends on BC”. The fact that the area of the triangle was a function of length BC was accepted by the class.
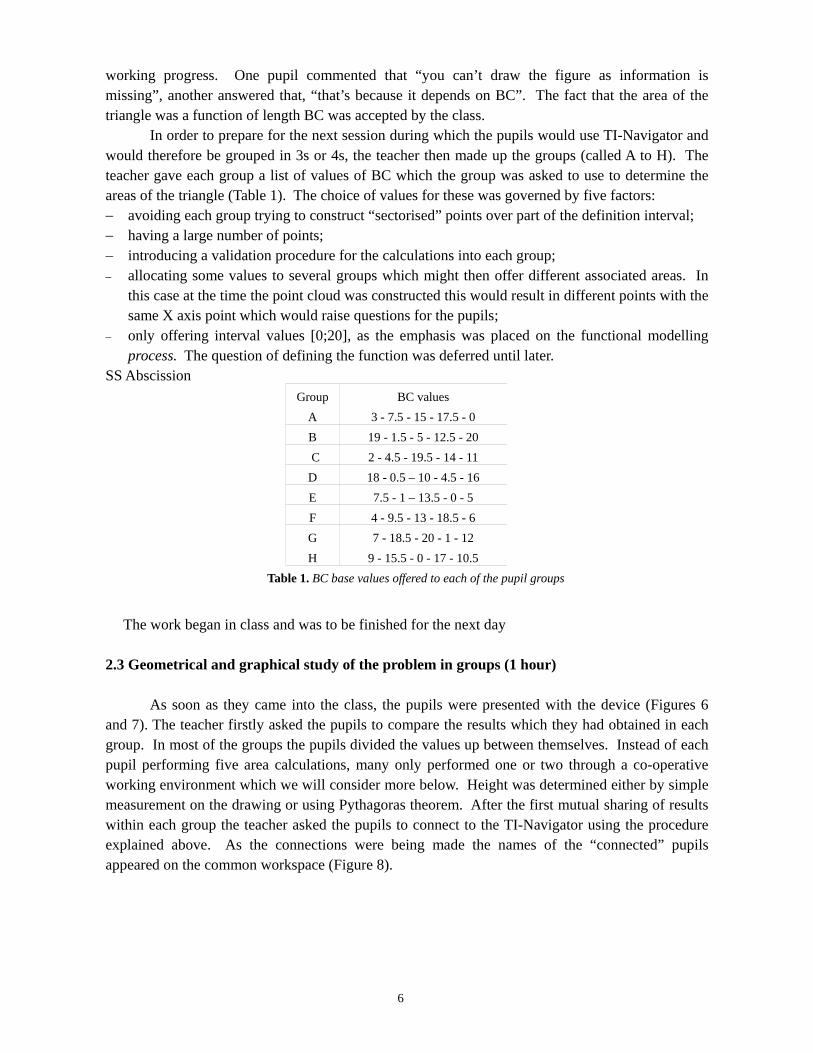
In order to prepare for the next session during which the pupils would use TI-Navigator and would therefore be grouped in 3s or 4s, the teacher then made up the groups (called A to H). The teacher gave each group a list of values of BC which the group was asked to use to determine the areas of the triangle (Table 1). The choice of values for these was governed by five factors: − avoiding each group trying to construct “sectorised” points over part of the definition interval; − having a large number of points; − introducing a validation procedure for the calculations into each group; − allocating some values to several groups which might then offer different associated areas. In
this case at the time the point cloud was constructed this would result in different points with the same X axis point which would raise questions for the pupils;
− only offering interval values [0;20], as the emphasis was placed on the functional modelling process. The question of defining the function was deferred until later.
SS Abscission Group BC values
A 3 - 7.5 - 15 - 17.5 - 0 B 19 - 1.5 - 5 - 12.5 - 20 C 2 - 4.5 - 19.5 - 14 - 11 D 18 - 0.5 – 10 - 4.5 - 16 E 7.5 - 1 – 13.5 - 0 - 5 F 4 - 9.5 - 13 - 18.5 - 6 G 7 - 18.5 - 20 - 1 - 12 H 9 - 15.5 - 0 - 17 - 10.5
Table 1. BC base values offered to each of the pupil groups
The work began in class and was to be finished for the next day
2.3 Geometrical and graphical study of the problem in groups (1 hour)
As soon as they came into the class, the pupils were presented with the device (Figures 6 and 7). The teacher firstly asked the pupils to compare the results which they had obtained in each group. In most of the groups the pupils divided the values up between themselves. Instead of each pupil performing five area calculations, many only performed one or two through a co-operative working environment which we will consider more below. Height was determined either by simple measurement on the drawing or using Pythagoras theorem. After the first mutual sharing of results within each group the teacher asked the pupils to connect to the TI-Navigator using the procedure explained above. As the connections were being made the names of the “connected” pupils appeared on the common workspace (Figure 8).

7
Figure 6. Arrangement of class: calculators and hubs Figure 7. Partial view of the system
Figure 8. Common workspace showing that seven of the sixteen calculators are connected to the network
The teacher then shows the common identifier configuration (§ 1.2), which displayed a plan
with a Cartesian map in which the pupils could position the co-Y axis point points – base of triangle, area of triangle– simultaneously, in real time Each group uploaded its 5 points to be displayed in the common workspace. This then produced a point cloud (Figure 9) which clearly raises problems (should it be a curve and if so, what shape should it be? Can different points of the same X axis point, which would mean that two triangles with the same sides could have different areas?).
Figure 9. Cloud point (first version) in the common identifier.
The teacher asked whether the result was as would have been expected. One pupil said no,
arguing that the results should be proportional: most of the pupils had come from the third grade class in which proportionality situations are most often studied, which may explain why many expected to see aligned points. A discussion began in the class: was the area proportional or not proportional to length of BC? Several arguments were put forward about non-proportionality, mobilising a set of (SS semiotic) semiotic resources (Robutti et al, in press): - analysis of the initial situation: pupils described the original figure and influence of BC on the area

8
of the triangle. They attempted to explain that the area was “at the beginning” very small and then that it increased in size and then “became smaller again”. The results could not be proportional; - physical involvement: the pupils pressed on a gestuelle SS. They positioned both of their hands in order to form a type of “roof” representing the two sides of the triangle of the same length. They then varied the “angle of the apex” which their hands formed in order to try to explain variations in area: one of them pressed on the gestuelle SS to confirm that a value of BC existed at which the area was “maximum”: the area is initially very small and then increases, it gets bigger and increases up to a certain point and then gets smaller again”. - graphical register: the points appear to form a curve which indicated non-proportionality according to the pupils; - numerical register: some pupils said that if BC was 0 or 20, the area of the triangle was zero, which invalidated the hypothesis of proportionality.
The shape of the cloud point also led the pupils to question the “outlying” points. It should be noted that the class did not notice the points with the same X axis point and different Y axis point. The group had anticipated this situation and had decided not to intervene at this time (the class was still a long way from “function” modelling: the fact that the same value cannot produce several results from a function is not yet part of the pupil’s function identification processes).
On the suggestion of one pupil – which was accepted by the class- the figures were traced more accurately, improving the quality of height measurement obtained from A and therefore the accuracy of the triangle area calculation. The teacher started a new common screen session and the pupils uploaded their new points. The class then obtained a new cloud (Figure 10).
Figure 10. Cloud point (second version) in the common identifier
The point construction process therefore resulted in a concrete object constructed
collaboratively and identified by the class, a feature which Sfard (1991) called reification, a necessary stage in mathematical learning. In the TI-Navigator environment, the reification was also accompanied by detachment from the personal experience. The object constructed is the result of a set of class pupil inputs. The idea that this object is a relatively smooth or regular curve emerges and the teacher then asked the class the value of BC at which the area of the triangle was maximum. The concept that “far more points” were needed in order to draw a conclusion immediately emerged. It is important to recall there that this was the pupils’ first encounter with graphical calculators and functions and the idea of changing context and defining a function allowing the curve tracer to be used does not therefore emerge naturally. The size of this task was clear to pupils who had already constructed many triangles. They therefore asked the teacher whether there was a method allowing them to construct a large number of points. The teacher then told them that the calculator could construct many points. The only condition was that “a formula” had to be found enabling the area to be calculated from the value BC. The motivation for finding the equation was

9
therefore driven by a wish to obtain the largest number of possible points with the least effort. For the next session, the pupils had to define an equation allowing the area to be expressed as a function of BC. 2.4 Algebraic and graphical group study of the problem (15 min)
The start of the session was dedicated to writing the expression of area as a function of BC expression. After asking the pupils what they had found the teacher decided to offer an official correction based on a set of questions and answers from the pupils’ results, guiding the pupils
towards the expression 12
BX × 100 − BX2
4. Once a class consensus was reached for this equation
the teacher proposed that the “Table of numerical values” mode be used in the calculator in order to obtain a large number of results easily and to come closer to the value of BC at which the area was greatest. The teacher explained that the expression in which BC was replaced by “X” (the teacher explained at this time that this was a limitation of the calculator) must be recorded in the functions directory and then offered a way of creating a list of the point X axis point values. The screen mosaic configuration (§ 1.2) was then used to display the pupils’ results in the common workspace (Figure 11).
Figure 11: Mosaic of tables of values from the eight calculators
The pupils then realised that their tables of values were not identical. At their request, the equations recorded were displayed, triggering a discussion about the role of parentheses in the equation. A scientific discussion then followed (Legrand 1993). With the help of the teacher, the class reached a consensus about an acceptable syntax. The exact equations were agreed as these generated values close to those obtained previously which were then used as reference values. It should be noted (Figure 9) that the teacher chose to display the names of the author groups on each table. As seen further on, this point does not appear to have been a key factor in the pupils’ involvement at the time when their production was questioned publicly. The teacher asked the pupils how they would obtain more points. All of the group changed the step, mostly to 0.1.
The teacher then explained that the calculator could display one point per pixel column by
10
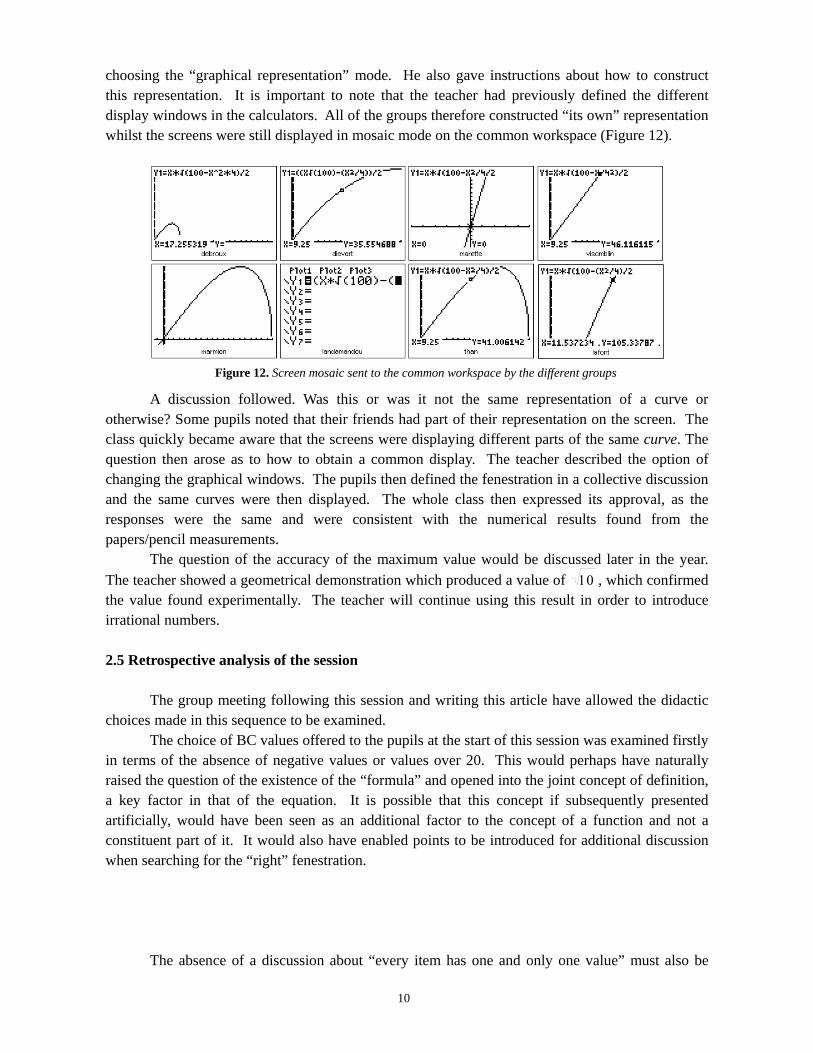
choosing the “graphical representation” mode. He also gave instructions about how to construct this representation. It is important to note that the teacher had previously defined the different display windows in the calculators. All of the groups therefore constructed “its own” representation whilst the screens were still displayed in mosaic mode on the common workspace (Figure 12).
Figure 12. Screen mosaic sent to the common workspace by the different groups
A discussion followed. Was this or was it not the same representation of a curve or otherwise? Some pupils noted that their friends had part of their representation on the screen. The class quickly became aware that the screens were displaying different parts of the same curve. The question then arose as to how to obtain a common display. The teacher described the option of changing the graphical windows. The pupils then defined the fenestration in a collective discussion and the same curves were then displayed. The whole class then expressed its approval, as the responses were the same and were consistent with the numerical results found from the papers/pencil measurements.
The question of the accuracy of the maximum value would be discussed later in the year. The teacher showed a geometrical demonstration which produced a value of 10 , which confirmed the value found experimentally. The teacher will continue using this result in order to introduce irrational numbers. 2.5 Retrospective analysis of the session
The group meeting following this session and writing this article have allowed the didactic choices made in this sequence to be examined.
The choice of BC values offered to the pupils at the start of this session was examined firstly in terms of the absence of negative values or values over 20. This would perhaps have naturally raised the question of the existence of the “formula” and opened into the joint concept of definition, a key factor in that of the equation. It is possible that this concept if subsequently presented artificially, would have been seen as an additional factor to the concept of a function and not a constituent part of it. It would also have enabled points to be introduced for additional discussion when searching for the “right” fenestration.
The absence of a discussion about “every item has one and only one value” must also be
11
questioned. This additional fundamental factor in the concept of a function was not discussed or established rationally in the class. It is clearly difficult for the teacher to carry on several discussions at once. The discussion mostly involved the existence of a proportionality relationship. The pupils were clearly carried along by the overall perception of a cloud point and therefore towards a discussion about the general shape of the object. One retrospective thought of the teacher involved in managing this situation was that it would clearly be useful for the points displayed by the different pupils to be in different colours, which would possibly focus their attention on different colour points with the same X axis point.
The point cloud probably moved to the representative curve too quickly. Other strategies could have been considered. It was technically possible to construct an increasingly dense cloud point from the area equation. In fact TI Navigator allows the lists of pupil calculator values to be condensed into a single couple of lists which is then easy to show.
Finally it would have been possible to consider superimposing the cloud point or points obtained with the curve which would have led to new discussions on the following questions: are the deviations reasonable? Do these indicate measurement inaccuracies or calculation errors? Do they cast doubt on the idea of a curve?
QuickTime™ et undécompresseur TIFF (non compressé)
sont requis pour visionner cette image.
Figure 13. Superimposing the curve and the last cloud point obtained
Looking at the superimposed result (Figure 13), for example, led to new thinking in the group: points with large x values are relatively far from the curve, possibly due to the fact that the triangle is very flat and the height is therefore more difficult to measure accurately?
We see here the richness of the environment and its wide possible range of use resulting in increased complexity for the teacher and the need to carefully think about how to use the situation in class in advance.
3. Theoretical revelations of the environment and pupil’s activity
After this example we would like now to take some time to return to the evolution of the
group, questioning its theoretical and its applied research. 3.1 Starting from the technique or the pupil’s mathematical activity?
The first three months of the experiment were dedicated to setting it up. The group then examined the different potentials of TI-Navigator. This analysis resulted in:

12
− the production of technical sheets (Annex 1) designed to facilitate understanding of the system by pupils and teachers;
− the design of activities making best use of this environment; − experimenting on these activities, group members mutually observing each other in their classes
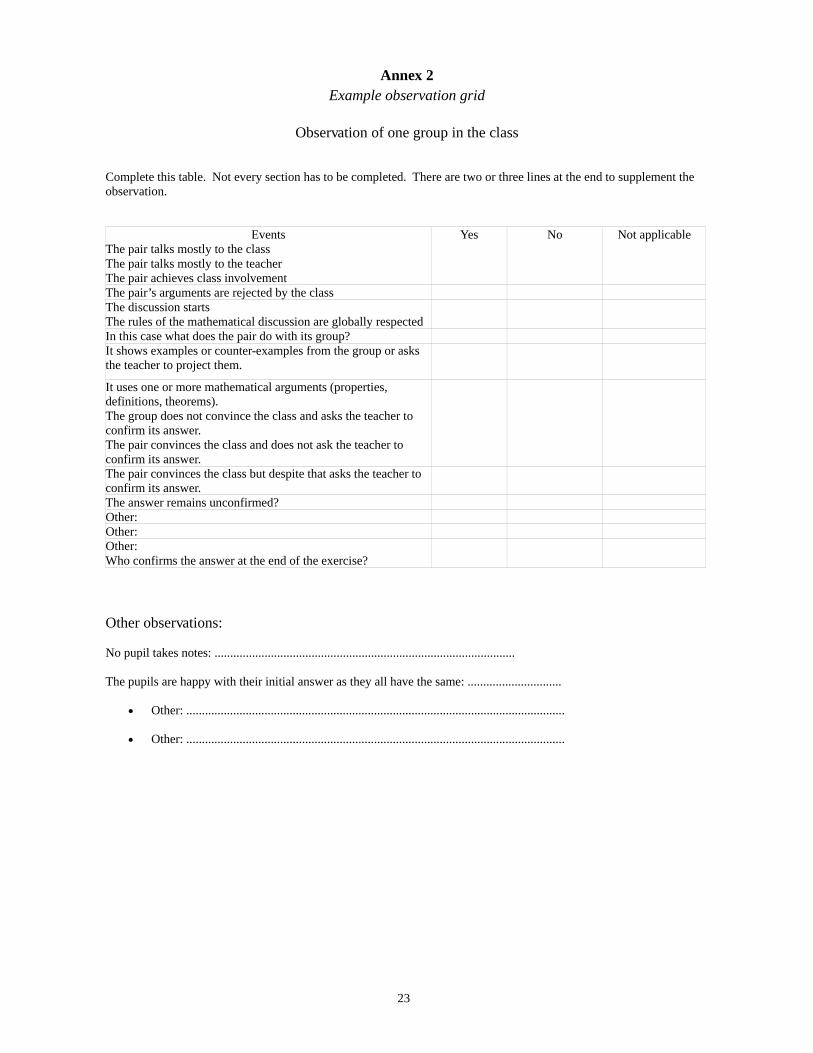
using data collection grids (Annex 2), and then revising those activities after group discussion based on these grids (§ 2.5). These discussions were difficult: it emerged from the very first observations that the TI-Navigator device produced a very large number of relationships at several levels: teacher, pupil, group to which the pupil belonged, and the class.
After six months the group felt a need to reconsider its work: its emphasis had been centred too much on technology starting only from the potentials of the system in order to infer the activities and operating methods or observe their effects. Immediately the instrumental orchestrations tended to reproduce identically. The emerging discussion in the class was closely controlled in order that the activity to proceed as intended; the class observations tending to be directed towards expected effects and ignore the unexpected (§ 2.5). As Rabardel (1995) highlights, “the pessimistic vision of human intervention is one of technological choices defining and delineating activity”. The group felt it would be better to create an improved balance between the perspective centred on the technique and one centred on the pupil’s activities: “neither of these two perspectives is alone, of course, sufficient. The technocentric approach alone tends to place the human being in a peripheral position and does not really allow the human beings’ activity to be thought about whereas a unilaterally anthropocentric option is unable to think about technical systems in their specific technological position” (Rabardel ibidem)
The Strasbourg Inter-IREM conference came at the right time to help the group reconsider its research work in light of new theoretical approaches, particularly the instrumental approach and collaborative work. 3.2 TI-Navigator and the instrumental genesis process
Rabardel (1995, also see Guin and Trouche in this edition of Repères) distinguishes artefact (“technical system with its specific features considered independently of human beings”) and instrument, produced by a subject from an artefact which he/she appropriates in the very course of his/her activities (performing a task, problem solving, etc.). He called this instrument construction process instrumental genesis and distinguished two interrelated processes (Figure 14): instrumentation and instrumentalisation processes:
Artefact user
Figure 14. The dual processes in instrumental geneses
13
- instrumentation is a process though which an artefact (its restrictions and potentials) relatively conditions or pre-structures the user’s activity. The way in which menus are organised in a given model of calculator will influence the pupil’s activity and therefore also the construction of the mathematical concepts involved;
- instrumentalisation is a process through which the user places the artefact in his/her hand and personalises it. Often seen as a misuse of the functions for which it is designed it can also, and this is very important in the context of teaching, be seen as enrichment of artefacts by their users.
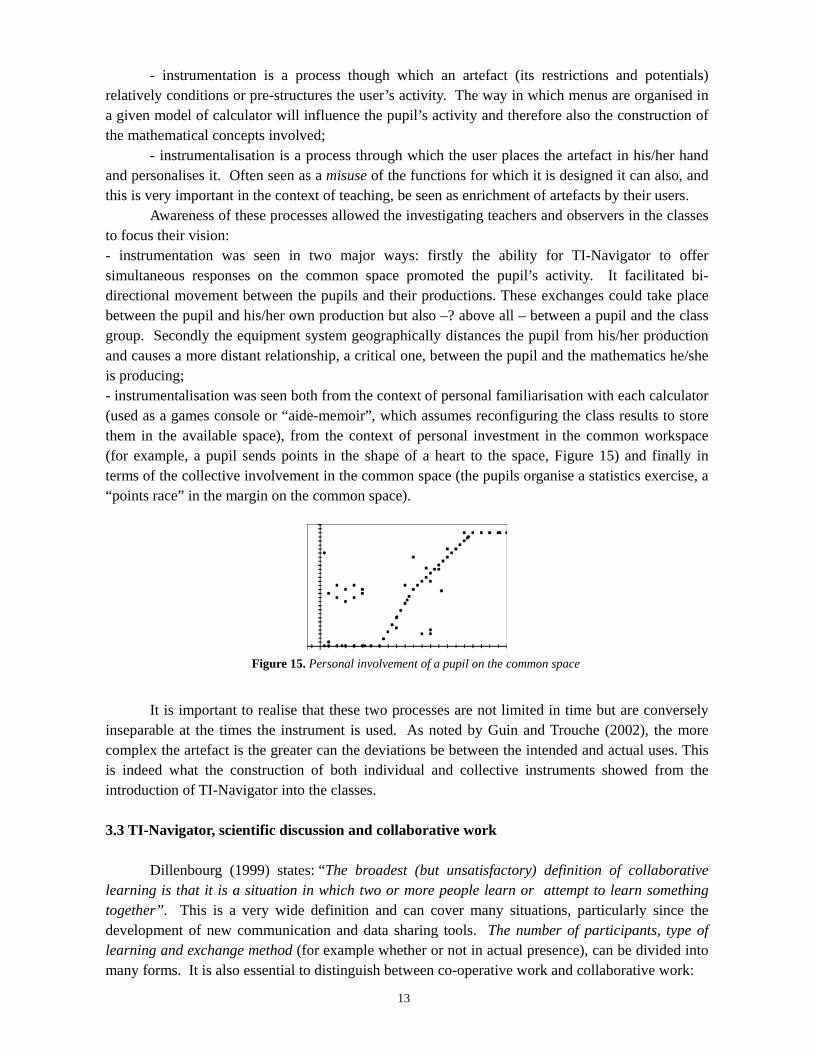
Awareness of these processes allowed the investigating teachers and observers in the classes to focus their vision: - instrumentation was seen in two major ways: firstly the ability for TI-Navigator to offer simultaneous responses on the common space promoted the pupil’s activity. It facilitated bi-directional movement between the pupils and their productions. These exchanges could take place between the pupil and his/her own production but also –? above all – between a pupil and the class group. Secondly the equipment system geographically distances the pupil from his/her production and causes a more distant relationship, a critical one, between the pupil and the mathematics he/she is producing; - instrumentalisation was seen both from the context of personal familiarisation with each calculator (used as a games console or “aide-memoir”, which assumes reconfiguring the class results to store them in the available space), from the context of personal investment in the common workspace (for example, a pupil sends points in the shape of a heart to the space, Figure 15) and finally in terms of the collective involvement in the common space (the pupils organise a statistics exercise, a “points race” in the margin on the common space).
Figure 15. Personal involvement of a pupil on the common space
It is important to realise that these two processes are not limited in time but are conversely
inseparable at the times the instrument is used. As noted by Guin and Trouche (2002), the more complex the artefact is the greater can the deviations be between the intended and actual uses. This is indeed what the construction of both individual and collective instruments showed from the introduction of TI-Navigator into the classes. 3.3 TI-Navigator, scientific discussion and collaborative work
Dillenbourg (1999) states: “The broadest (but unsatisfactory) definition of collaborative learning is that it is a situation in which two or more people learn or attempt to learn something together”. This is a very wide definition and can cover many situations, particularly since the development of new communication and data sharing tools. The number of participants, type of learning and exchange method (for example whether or not in actual presence), can be divided into many forms. It is also essential to distinguish between co-operative work and collaborative work:

14
- co-operative work involves division and sharing of tasks. In a symphony orchestra, for example, each instrument plays its part; - collaborative work involves comparison and discussion to achieve a common task. To return to a musical example this is closer to the free jazz orchestra.
Collaborative work has come into common language to describe systems, work organisations which do not always involve collaboration in the precise sense of the term we have described. “Group working” is often described as collaborative work. Even within some continuing educational organisations, simple E-mail exchanges are described as collaborative work. Collaborative work however assumes true co-construction in a learning or work process. One of the strong points of the TI-Navigator system is that it can induce collaborative work provided that the situations and instrumental orchestrations lend themselves to this. The different configurations (common identifier, screen mosaic, rapid consultation, § 1.2) enable sharing exchanges and comparisons. Individual pupil work and collective class work can therefore mutually feed each other.
Qualifications of these comments in the context of the activity described (§ 2): - the first phase of the work can be described as cooperative. It is the teacher who disseminates the values between the groups and the calculations are performed individually outside of class time. The individual results are then brought together and the points proposed by each person are sent to the common identifier. The results are displayed simultaneously in real time and the discussion can be organised around the common workspace. Pupils have no difficulty sending their results when they have not yet been checked by the teacher. Durant the first phase of constructing a point cloud, many points are shown to everyone so that later, many syntax errors in the writing of the equation emerge. Displaying this “mistake” on the public space conflicts with the initial ideas and leads to questions, resulting in a scientific discussion (Legrand 1993); - the second phase of the work can be described as collaborative. Each pupil takes part in constructing the mathematical object of the class. Comparing productions leads to the formation of a common semantic space. From a simple lexical community arises a sense community. The aim has not been recalled as it is everyone’s challenge. 3.4 TI-Navigator and the development of new reflectiveness
According to Dillenbourg (ibidem), one condition for collaborative working is also reflectivity of the people involved in terms of their own practice, i.e., the ability to sit back and look at what they have done or what they are doing, to criticise it, assess what does appear to be relevant, and revise what appears not to be. This reflective practice appears to be promoted by the TI-Navigator environment, which can allow the pupils to distance themselves from their own production and include themselves more readily in an exchange between pairs. This was seen in the activity described (§ 2) and also on other occasions during the year of the experiment: - in contrast to what the group had thought, none of the pupils were worried about the fact that their names were displayed alongside their own production in the common workspace (for example Figure 15). This was confirmed in interviews including those with pupils who usually had difficulty, or were not very inclined to take part in class life in a conventional environment. Whilst the pupils means of expression in a “conventional” system is mostly voice and occasionally writing, in this case the pupil is separated from his/production, which is displayed in the public space by the system. The pupil instrumentalises the artefact making it the carrier of his/her own message; - the pupils are more involved in a critique and self-critique of the productions. In the activity

15
described, the points of the first cloud (Figure 9) were quickly rejected and led to spontaneous recalculations by the class, including– and perhaps above all – by the pupils who had produced them. This is an important factor in the pupils’ relationship in constructing mathematical objects.
Each takes part in constructing the common knowledge and therefore the knowledge of each of his or her friends. The common space becomes the area for discussion and exchange, which leads to the construction of a genuine social mathematical truth (Legrand 1993). This returns to the idea of being in a process “within mathematics” and in a construction “with others” (Robutti, in press). The teacher’s work here is to regulate the exchanges. He/she is no longer the orchestra soloist which everyone listens to when he plays, but is the conductor, paying attention to each persons’ role in the developing work.

16
4 TI-Navigator and instrumental orchestrations
What we have just described (the instrument construction process, development of collaborative work, development of reflective attitudes) specifically assumes particular instrumental orchestration of situations in the TI-Navigator environment to make use of its new potentials. Trouche (in Guin and Trouche 2002) called instrumental orchestration of a situation the didactic management of available artefacts which assumes a definition of didactic configurations and methods of exploiting these configurations. The design of didactic configurations in a TI-Navigator environment for use in a given situation is very complex and occurs at several levels. 4.1 Didactic configuration of the class space
Figure 16. From the intended configuration by the manufacturer to the configuration chosen by the teachers
The first level is that of the equipment configuration: the first uses of the device showed that
the relationships between pupil groups and the teacher were very sensitive to the arrangement of tables in relation to the blackboard and screen (Figure 16). The “radial” configuration more easily links together individual pupil work, group work and the common workspace provided by the screen than the “small squares” configuration.
4.2 Didactic configuration of the calculators themselves
The benefit of configuring the pupils’ calculators to some extent depending on the mathematical situation in question was seen in the activity described (§2). Individual configuration is possible as the teacher has all of the calculators before the session (to recall, the calculators remain at the secondary school and are only available to the pupils during the TI-Navigator sessions). This is obviously time-consuming although is didactically useful to encourage class discussion (for example, in the activity described by setting the graphical representation windows for the functions differently).
The group also commented that the pupils often asked for their own calculator. This then resulted in cohabitation of several calculators within the same group. This would certainly be an interesting situation to study: is the unconnected personal calculator used in the same way as the connected calculator attached to the class? How does this duality of artefacts work in the instrumentation or instrumentalisation processes? The instrumental genesis processes appear to be particularly complex here and would appear to need detailed analysis.

17
4.3 Didactic configuration of the network
We shall end by considering the network configurations used during these two years. Several key structures can be identified, divided into three areas: number of pupils, “players” and their roles.
TI-Navigator can connect up to 32 stations although the group only had 16 calculators. It had therefore only been intended to work with shared classes. The need for more regular use of this environment, however, led to its additional use in the whole class (as for the activity described § 2). This type of use had important effects: not all of the pupils had a calculator connected to the network and the groups needed to combine several types of calculators, pupils using connected calculators needed to explain their choice of use and present their results obtained. This variable. (whole class/shared class) then needed to be incorporated, to consider the instrumental orchestrations of the situations a priori.
The term players here refers to each class of the person involved clearly identified in the exchanges. Three types of players can be distinguished: pupils, groups of pupils organised around the same hub (called relay groups) and the class. The role of the relay groups which are undoubtedly key players in the TI-Navigator system will be examined in more detail. They act in several areas: - within themselves: each group acts as a research catalyst. The groups remain stable between sessions and they form a community of practice (Guin and Trouche in this journal). They organise a work system around the networked calculator which is an essential part of transmitting the group’s production. Exchanges within the relay groups are often intense and facilitate responsiveness in the class discussions. A pupil can express his/her feelings, strongly within the relay group without having to do so in front of the whole class. We also noticed that one of the pupils quickly took overall charge of the networked calculator although did not withdraw from the group exchanges. This pupil did so therefore not simply to remove him/herself from the research task but clearly to act in addition as the relayer of the collective message. - within the class: the existence of the relay groups was certainly one of the strong points of the system. They play a dual research catalytic role by placing the small research structures operating collaboratively within the class and links between its internal local research and the overall class research. The fact that each group was permanently in contact with the other groups and therefore with the rest of the community was a factor which facilitated integration of each group’s work into a research synergism at a class level: the class therefore acts rather like a network of small research structures in permanent contact with each other.
In terms of the specific role of the pupils, an initial typology was identified: facilitator, relayer, observer, reporter. The circulation of these roles and their influence, both in the instrumental genesis and in the learning process still needs to be studied. 4. 4 Complexity of the teacher’s work
The complexity of the instrumental orchestrations to be designed and applied in this type of
environment reflects of course the role of the teacher. For this we use the model proposed by Legrand (1993) based on the combination of three activities: epistemological activity, didactic activity and social activity.
18
Fundamentally, the rules of the epistemological activity (banning arguments of authority, sharing scientific responsibility) are unchanged but a new intervening factor, the relay group, changes the conventional balance of the class (on the one side individual pupils, on the other the teacher). When a pupil takes part in the discussion supported by the group’s previous research his/her arguments have more authority than if they were made by a single individual. The teacher must manage a complex discussion in which the arguments are of value both for their specific relevance and for the weight the relay groups attach to them.
To organise the teachers didactic activities, Legrand stresses the role of the blackboard as an “inert intermediary between the speaker and his/her adversary”. The common space plays a de facto role as an intermediary. It can partly take on the role of the class memory, preserving a record of some ideas produces by the pupils or relay groups. This intermediary however is far from being inert: in a video presented to the ICMI conference, for example, (Hivon and Trouche, in press), two points are seen, one behind and the other on this common space: two pupils benefit from the common identifier to organise a points race which they run in the margin of the teacher’s lesson! Apart from these examples of instrumentalisation of the system the teacher has to permanently manage an information flow which passes through this common space and requires fast and complex didactic choices.
The teacher’s social role relies on the same rules (a degree of neutrality during the discussion time, a degree of obligation to hold in reserve) as in the “traditional” mathematical discussion, but can use new potentials: the common space of productions enables the pupils to access a range of situations where they can draw on different representations of the same object examples or counter-examples on which they can base their participation in the discussion. The rules of the game are the same, but there are more game pieces and they are more mobile.
4.5 The need for group working
The arrival of the TI-Navigator system in the CROME group profoundly changed the
relationships between the teachers. Its members, who were used to working together for several years, needed to work on new challenges. Discussions sprang up again in new guises. The first discussion in the group about the role of the system in the pupils familiarising themselves with their calculators. At several moments during the research TI-Navigator was seen by some members of the group as an artefact which could change the length of the calculator familiarisation processes by pupils. These processes took place in two stages which we can examine retrospectively: - stage 1: the teacher instrumentalises the TI-Navigator so that the pupil sees a new dimension in the calculator: that of a social conveyer of his/her production; - stage 2: the teacher then takes a bet that if the calculator enables the pupil to find his/her place in the orchestra, this then will construct a less individual relationship between the pupil and the orchestra, including situations in which the TI-Navigator is absent. Instrumental geneses will then have been facilitated and the calculators become effective, ancillary tools for the mathematics work.
Our initial observations however did not show this type of process, which remains to be studied. Remarkably, however, we noted that this attempt at instrumentalisation of the TI-Navigator was only seen as a potential objective several months after the start of our work. It then raised a discussion within the group. Some of us had not predicted this aspect of the system and the direction it could have given to the research.
19
The second discussion within the group was how much independence to give to the pupils. A major place in the instrumental orchestrations designed by the group was left to discussion, either on the use of MCQ (multiple choice questions) or in the handling of more open questions. The very large place left to the pupil in constructing his/her knowledge returned to the centre of the discussion within the group. Specifically, how far should one go in the creative freedom, left to the class? We saw previously that the system gave the teacher certain tools enabling him/her to play his/her role within the class discussion. The complexity of the system (number of production supports and increased data flow) makes the teacher’s task however more difficult. This is nevertheless another question which formed a major part of the discussion: are the pupils able to manage all the instruments available to them? What is the responsibility of the teacher, what should he/she do to assist the pupils in constructing their knowledge in such a complex environment?
These questions brought out deep-seated beliefs from each of the group members about the role of the teacher in constructing the mathematical objects. In simplistic terms these beliefs ranged from one of guide to facilitator and are however essential in the thinking supporting the introduction of a system such as TI-Navigator. Many implicit assumptions were not addressed as the work was only performed by dividing up tasks. We feel it is therefore essential in a context of increasingly complex environments, to develop true collaborative work within the teams, which they will use to promote the emergence communities of practice.
5. Conclusion.
We have tried to show in this article that the introduction of the TI-Navigator device into the class requires a major updating of the mathematical situations and their instrumental orchestrations which makes the teacher’s work more complex, but may lead to richer scientific discussion, towards collaborative knowledge construction. We cannot of course say that the TI-Navigator necessarily naturally induces this type of discussion or collaboration: any technical device can be instrumentalised, and used from other than its possible, intended or prescribed uses! The device however makes the advances which are described possible, provided that one “pays the didactic price!”
The research work conducted by the CROME group has also totally changed the relationships between its members. It provoked many, occasionally impassioned, discussions particularly about the role left to the pupils in co-constructing their knowledge and the nature of the activities which the teacher was responsible for developing in the class. This research work has identified the different concepts that the teachers may use in the process of teaching mathematics which had never emerged explicitly despite several years of common work! These two years have also enabled the group members to develop reflective thinking about their own collective and individual practices.
It would be interesting to compare the results of this research on a class level network with research on far larger networks. The Digital Workspaces are arriving in institutions, incorporating a range of collaborative tools (forum, wiki, chat, etc.). The pupils have already been using collaborative activity devices: mutual aid forums and MSN software, for several years and also network games where each can (or cannot) count on other users to progress the task. Mathematical portfolios are already used in some countries (for example the United States, Sweden). How should teachers incorporate these devices which are no longer “simple” tools but new working systems?

20
These developments will clearly totally change not only class work but beyond that, the
relationships between pupils and mathematics, the relationships between teachers and pupils and very clearly the relationships between the pupils themselves. Facing up to this and preparing for these changes clearly assumes that the teachers will have the time to work together, to co-construct new resources and think about their own practice: the IREM teams’ model has never been so topical!

21
References Béguin P., Rabardel P. (2000). Concevoir pour les activités instrumentées, Interactions homme-système : perspectives et recherches psycho-ergonomiques, Revue d’intelligence Artificielle 14 (1/2), 35-54. Bloch I. (2002). Un milieu graphique pour l'apprentissage de la notion de fonction au lycée, Petit x 58, 25-46. Cazzaro J.-P., Noël G., Pourbaix F., Tilleul P. (2001). Structurer l'enseignement des mathématiques par des problèmes. Bruxelles : De Boeck Education. CROME, presentation de l’équipe dans la rubrique du site EducMath consacrée aux partenariats INRP de recherche : http://educmath.inrp.fr/Educmath/ressources Dillenbourg P. (1999). What do you mean by collaborative learning? Collaborative learning: cognitive and Computational Approaches. Oxford: Elsevier. e-cureuil, le site de l’équipe TICE-Lycée de l’IREM d’Orléans-Tours, soutenu par la SDTICE : http://piero.perso.cegetel.net/. Guin D., Joab M., Trouche L. (dir.) (2007). Conception collaborative de ressources pour l’enseignement des mathématiques, l’expérience du SFoDEM (2000-2006), CD-rom, INRP and IREM (Université Montpellier 2). Guin D., Trouche L. (dir.) (2002). Calculatrices symboliques, transformer un outil en un instrument du travail mathématique, un problème didactique. Grenoble : La Pensée sauvage. Hivon L. (2006). Vers une mutualisation de l'usage des calculatrices en classe, MathemaTICE 1, en ligne http://revue.sesamath.net/spip.php?article29 Legrand M. (1993). Débat scientifique en cours de mathématiques et spécificité de l'analyse, Repères-IREM 10, 123-158. Rabardel P. (1995). Les hommes et les technologies, une approche cognitive des instruments contemporains. Paris : Armand Colin. Robutti O., Ravera M. T., Ghirardi S., Manassero M. (in press). What students want: an environnement where learning to be in mathematics Sfard A. (1991). On the dual nature of mathematical conceptions: Reflections on processes and objects as different sides of the same coin, Educational Studies in Mathematics 22, 1-36. Teachers Teaching with Technology, le site pédagogique de Texas Instruments: http://education.ti.com/educationportal/sites/US/sectionHome/pd.html Trouche L., Hivon L. (in press). Connectivity: new challenges for the ideas of webbing and orchestrations, in J.-B. Lagrange, C. Hoyles (dir.), ICMI conference Mathematical Education and Digital Technologies: Rethinking the terrain, Hanoï. Wikipedia: http://fr.wikipedia.org/wiki/Espace_num%C3%A9rique_de_travail

22
Annex 1 Example of handout produced at the start of the experiment
Session preparation
• It may be wise to leave the black cables > routers > hubs, stored permanently in individual bags • Ensure that all of the necessary equipment is available
• PC equipped with TI Navigator • Video-projector + VGA cable + Power cable • Calculators and the necessary APPLICATIONS • Hubs + Routers • Access point + power cable + Ethernet connection cable • Black calculator > Hub connection cables • BELKIN Ethernet > USB converter • Extension cable + Multiple power socket for Laptop + Access point + Video-projector + hub charger
(allows the hubs to be re-charged at the end of the session)
Day before the
session
• Re-charge the hubs • Ensure that the activity description files and exercises are on the P.C: store them for
example on the desktop. • Ensure that the class is correctly registered in TI-Navigator • Ensure that the pupil icon arrangement is the same as the pupils’ positions in the room • Ensure that all of the equipment is present:
• calculators and their applications • replacement batteries • hubs • access point • video-projector
• Aide-memoir forms in briefcase. Immediately
before the
session
• Main connections • Video-projector • Laptop • Access point • Hub charger
• Connections: • Access point > Belkin > Laptop • Routers > Hubs • Black cables on routers • Start TI NetWork Manager to confirm network status
• Confirm that the Aide-memoirs are available for pupils. • Start the class • Display the class on the video-projector
End of session • Recover the calculators • Replace the hubs in their charger • Put everything away
23
Annex 2 Example observation grid
Observation of one group in the class
Complete this table. Not every section has to be completed. There are two or three lines at the end to supplement the observation.
Events Yes No Not applicable The pair talks mostly to the class The pair talks mostly to the teacher The pair achieves class involvement The pair’s arguments are rejected by the class The discussion starts The rules of the mathematical discussion are globally respected In this case what does the pair do with its group? It shows examples or counter-examples from the group or asks the teacher to project them.
It uses one or more mathematical arguments (properties, definitions, theorems).
The group does not convince the class and asks the teacher to confirm its answer.
The pair convinces the class and does not ask the teacher to confirm its answer.
The pair convinces the class but despite that asks the teacher to confirm its answer.
The answer remains unconfirmed? Other: Other: Other: Who confirms the answer at the end of the exercise? Other observations: No pupil takes notes: ................................................................................................ The pupils are happy with their initial answer as they all have the same: ..............................
• Other: .........................................................................................................................
• Other: .........................................................................................................................

24